Where does #GlobalWarming go during #LaNiña? — NOAA #ENSO

Click the link to read the post on the NOAA ENSO Blog (Richard Allan, Michael McPhaden, and Shang-Ping Xie:

Here at the ENSO blog, we’ve been talking about La Niña (the cool phase of the El Niño-Southern Oscillation climate pattern) for going on three years now. People have started to tell us they’re bored ask us whether all these La Niñas could offset global warming. The short answer is no, La Niña is no match for global warming.

The simplest evidence is that global average temperature during recent La Niña years is warmer than for El Niño years in earlier decades! In fact, the La Niña year of 2020 tied 2016—a year that started with a major El Niño—as the all-time-record-high global surface temperature.

In general, the warmest year of any decade will be an El Niño year, the coldest a La Niña one. This graph shows annual average surface temperatures (gray bars), grouped by decade, from 1950 to 2021. The warmest and coldest years of each decade are topped with circles: red for El Niño-influenced years and blue for La Niña years. We considered a year El Niño or La Niña “influenced” if the December-February was labelled as part of a historical episode by NOAA’s Climate Prediction Center or if more than half of the months in that year were. By our definition, 1979 did not qualify as El Niño year because El Niño conditions were present for only 3 months late in the year. 1992 was the coldest year of the 1990s despite being an El Niño year because of the cooling influence of the eruption of Mount Pinatubo in 1991. NOAA Climate.gov graph based on data from NOAA National Centers for Environmental Information.

But if global warming continues year after year regardless of La Niña, then how does the surface temperature manage to cool off at all during La Niña? Where does that excess heat go? We last covered this topic back in 2014 (Can you believe the ENSO Blog is that old?!), so we thought we’d ask a group of experts to revisit it with us in this week’s blog.

We posed these questions to previous ENSO blog contributors Mike McPhaden and Richard Allan, and Shang-Ping Xie. Mike is an oceanographer and ENSO expert at NOAA Pacific Marine Environmental Laboratory. Richard is a climate scientist at the University of ReadingShang-Ping is a climate dynamicist at Scripps Institution of Oceanography, UC San Diego. Climate.gov’s Rebecca Lindsey and Tom Di Liberto wrote the introduction and lightly edited their responses.

When we look back over the historical temperature record, we see that the warmest years in any decade are usually El Niño years and the coldest years are usually La Niña years. Why is that?

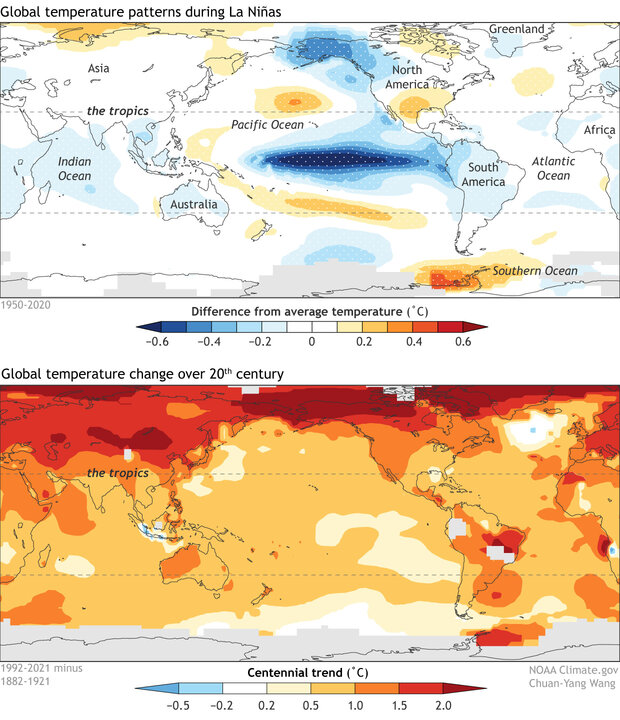
Mike: This graphic provides a clue.

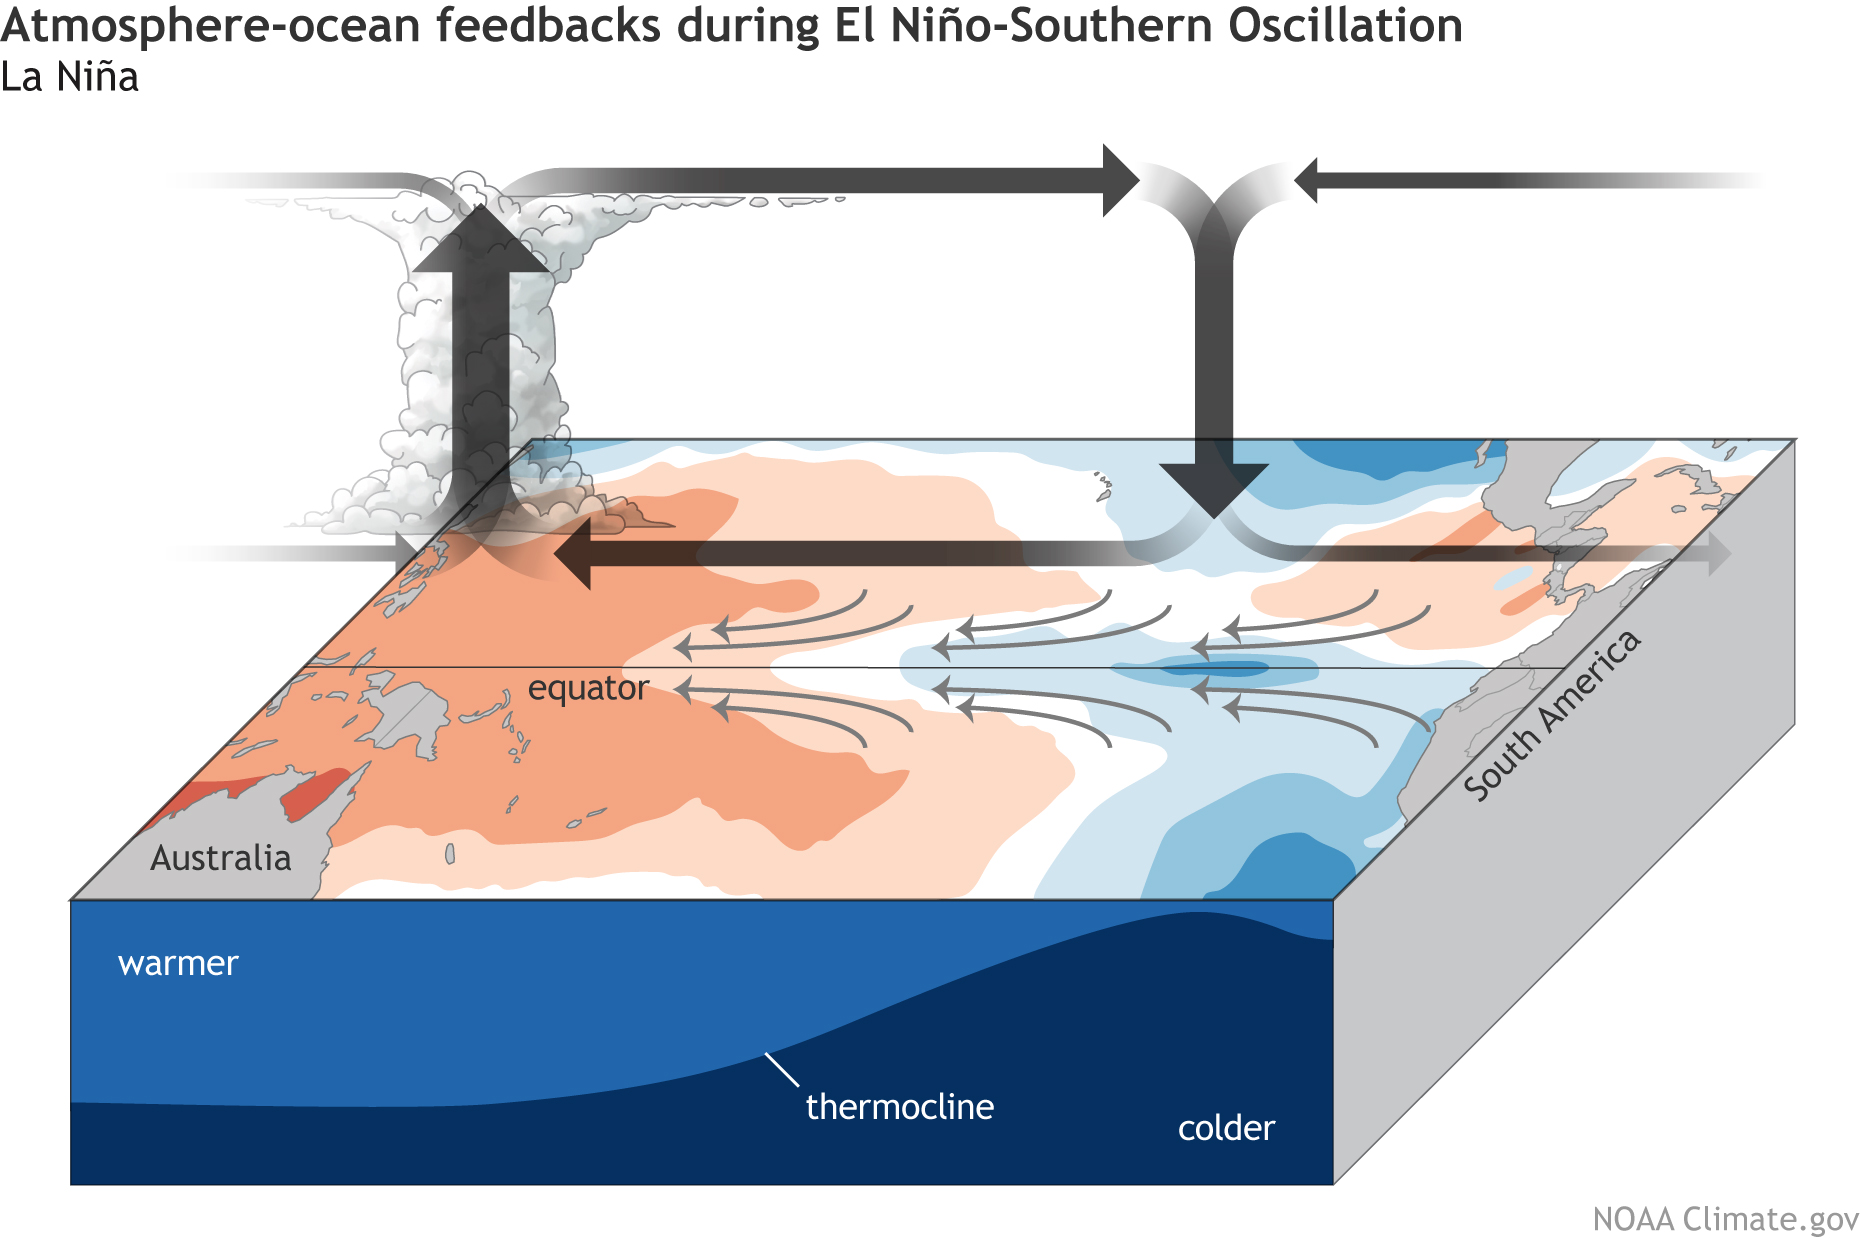
During El Niño, unusually warm sea surface temperatures in the central/eastern tropical Pacific lead to increased evaporation and cooling of the ocean. At the same time, the increased cloudiness blocks more sunlight from entering the ocean. When water vapor condenses and forms clouds, heat is released into the atmosphere. So, during El Niño, there is less heating of the ocean and more heating of the atmosphere than normal. During La Niña, the opposite happens. With colder La Niña sea surface temperatures, there is less evaporative cooling of the ocean, less convective cloudiness blocking the sun from heating the ocean, and less convective heating of the atmosphere.

So, the atmosphere warms more during El Niño and less during La Niña, and that affects global average temperature. We have found that for every degree Celsius of El Niño warming in the central equatorial Pacific (or the Niño 3.4 region, to be precise), the global average surface temperature rises by 0.07°C (0.13 ˚F), with a delay of 2-3 months. Similarly, for 1°C cooling during La Niña, global average surface temperatures drop by about 0.07°C.  It may not sound like much, but it involves huge transfers of heat between the ocean and atmosphere that affect the entire globe.

(top) Monthly average global surface temperature compared to the 20th-century average. (bottom) Monthly sea surface temperature in the Niño3.4 region of the tropical Pacific—the key ENSO-monitoring region—compared to the 20th-century average, with El Niño periods colored red and La Niña periods colored blue. The peaks and valleys of each line tend to line up, showing how global temperature tends to rise with El Niño and fall with La Niña following a short lag. NOAA Climate.gov image, adapted from original by Mike McPhaden.

Shang-Ping: During La Niña, the surface cooling of the equatorial Pacific is due to the intensified trade winds that upwell cold water from beneath. This causes major shifts in atmospheric convection (heavy tropical showers and thunderstorms) and circulation. These changes in tropical convection also induce large atmospheric waves with horizontal scales of thousands of miles that communicate the La Niña effect to the rest of the tropics. As a result, La Niña causes the rest of the tropics to cool—both over the oceans and on land.

(top) Annual surface temperatures around the world compared to average during La Niña episodes between 1950-2020. White dots show where patterns are statistically significant at the 95 percent confidence level. Most of the cooling during La Niña is in the tropics (blue colors), and much of it is over the ocean. Elsewhere, warm and cool departures mostly cancel each other out. (bottom) Change in average annual surface temperature over the 20th century. The greatest amounts of warming (darkest reds) are in the Northern Hemisphere over land. NOAA Climate.gov image, adapted from original by Chuan-Yang Wang.

Outside the tropics, the atmospheric circulation change during La Niña causes warming over much of the North Pacific and cooling over Alaska and western Canada, but the surface temperature effect is small when averaged over the globe outside of the tropics. Thus, the La Niña contribution to global-average surface temperature is mostly from the tropics.

In the big-picture sense, Earth’s average global surface temperature is determined by the balance between incoming sunlight and outgoing heat energy. Are the temperature changes we see during La Niña and El Niño the result of a change in the planetary energy balance?

Richard: No. In El Niño years, the warmer oceans in the tropical Pacific heat the atmosphere above, mostly through evaporation and condensation of moisture in clouds, and this eventually causes more heat loss (infrared radiative energy loss) to space. [As Mike and Shang-Ping describe in Question 1, there are more clouds in the central tropical Pacific during El Niño, which block incoming sunlight and further reduce surface heating.]

This means there is temporarily less energy arriving than leaving the planet following El Niño. We’re talking about a few months lag between the temperature changes in the eastern tropical Pacific and the global responses in the planetary energy balance. The reverse takes place in La Niña. This gives us a heavy hint that ENSO drives a change in Earth’s energy budget, not the other way around, since warm events are generally associated with less planetary heating, and cool events are associated with more heating.

Shang-Ping: What Richard said is very important: La Niña drives, instead of being driven by, a planetary energy perturbation. The oscillation between El Niño and La Niña involves the redistribution of the warm water volume (the upper ocean above the thermocline) in the tropical Pacific Ocean. The surface cooling of the equatorial Pacific results from increased upwelling of the cold water from the thermocline; it’s not the result of the planet absorbing less energy.

In contrast, anthropogenic [human-caused] global warming results from extra heat that the increased greenhouse gases trap in the climate system. Since these gases are uniformly distributed in the atmosphere, they cause surface temperature to rise everywhere.

Satellite and ocean observations show an increase in energy building up every year as greenhouse gas concentrations continue to rise*, even through periods when the rate of surface temperature increase slows. That’s largely because the deeper layers of the ocean are storing much of the excess heat. What do we know about where/how the ocean stores this heat?

Mike: On the seasonal and year-to-year time scales that characterize ENSO variations, it is the upper few hundred meters of the ocean that matter most for the storage, transport, and exchange of heat with the atmosphere. The tropical Pacific is the main center of action on these time scales, though there is a partial compensation of tropical heat gain and loss from opposite tendencies at higher latitudes. For example, during El Niño the tropical Pacific experiences a large heat loss to the atmosphere as noted above, but some of that heat is reabsorbed into the ocean at higher latitudes because of El Niño teleconnections.

On longer decadal time scales, like that of the hiatus in global surface warming during the first decade of the 21st century, the tropical Pacific experienced a prolonged period of unusual heat gain because of the La Niña-like conditions that prevailed at this time.  Much of that heat gain was transported to the Indian Ocean through the Indonesia Seas—the porous boundary that separates the Pacific from the Indian Oceans.  Outside the tropics, sinking of water masses in the high latitudes of the North Atlantic can transport heat to abyssal depths on decadal and longer time scales as part of the Meridional Overturning Circulation. The Southern Ocean is also a key region for the uptake of anomalous heat associated with climate change.

Where the ocean exchanges heat with the atmosphere, and how the ocean stores and transports that heat, is really central to our understanding of how the climate system works across all time scales.  To riff on the expression “follow the money”, if you want to understand how the climate system works, you have to “follow the heat” in the ocean.

In his 2014 post, Richard wrote about changes in ocean circulation across the Pacific that were likely responsible for increased deep ocean heat uptake (and slower surface warming) during the first decade or so of the 20th century. Since then, we’ve had another, shorter, period since 2016 where global surface temperatures have not increased noticeably. Are the same processes at work?

Richard: Warming has continued apace since 2014: the recent 2011-2020 decade was about 1.1 ˚C warmer than 1850-1900 early industrial period based on the recent IPCC report. But the warming doesn’t progress smoothly, it comes in fits and starts. For example, rapid warming [since around 2011] peaked with the 2015/16 El Nino event, and this level of warmth has been maintained since, rather than continuing to rise, with further ups and downs balancing out. Since 2014, energy has continued to accumulate and heat the oceans. Surface temperature is closely related to heating of the uppermost layer of ocean, so how much of the planetary heating goes into this upper layer or layers beneath affects the surface warming rate.

(top) Global average surface temperature each year since 1900 compared to the 20th-century average (the zero line). A slowdown in surface warming in the first decade of the 21st century was associated with frequent La Niña conditions. (bottom) Satellite and ocean observations of energy increasing in the oceans, atmosphere, and land (planetary heat uptake) show that more heat is entering than leaving the planet (an energy imbalance) due to increasing greenhouse gas levels. NOAA Climate.gov image, based on data from NOAA National Centers for Environmental Information (top) and NASA/CERES data from Norman Loeb (bottom). **

In a simple sense, more overturning circulation in the Pacific (what goes down must come up) can draw down warm water in one region and this is replaced with cooler sub-surface water in another region. More heat can be used up in warming this newly emerged cool water, and the upshot is that accumulating energy is effectively moved downward into the ocean, and not concentrated in the upper layer, temporarily suppressing the rate of surface warming.

What has been learned since 2014 is that global warming is progressing with an unexpected pattern: more warming in the west Pacific and less in the east Pacific than simulated on average by global climate models. Whether this is a temporary effect or a longer-term discrepancy remains to be seen, but ultimately the long-term warming due to greenhouse gas increases will dominate.

Mike: Climate change skeptics latched onto the hiatus in global surface warming in the first decade of this century to argue that the science was flawed and that we didn’t need to be concerned after all.  We’ve learned a lot more since then about how natural variability, and in particular ENSO, affects the global energy balance and its signature in global mean surface temperatures. As a result, this most recent slowdown has stirred up much less controversy, which is a real measure of progress in effectively communicating scientific advances.

Shang-Ping: Following the major El Niño of 2015-16, the global surface temperature increase has slowed. Over the past summer, the anomalous cooling of the equatorial Pacific intensified and the current La Niña formally entered the third year (Emily Becker post), the first such long-haul event in the 21st century. The ongoing La Niña may prevent global average temperature from breaking the record in 2023, but greenhouse gas-induced global warming grows steadily in magnitude. In fact, it most likely helped 2020, a year of La Niña, to tie the all-time high of 2016, a year following a major El Niño.

*Correction (11/1/22). This question previously stated that “Earth’s energy imbalance continues to grow…” but energy imbalance usually refers to the rate of energy accumulation (which may remain constant), not the cumulative excess energy, which continues to grow. 

**Correction (11/1/22). The annotation in the shaded area of the bottom graph previously said “Earth’s energy imbalance continued to grow,” but energy imbalance usually refers to the rate of energy accumulation (which may remain constant), not the cumulative excess energy, which continues to grow. 

Footnotes

  1. Rebecca: Although the comparison is simplistic, we can also see that La Niña is no match for global warming simply by the relative sizes of their effects. Global warming due to human-produced greenhouse gases has raised Earth’s average surface temperature by around 1 degree Celsius (~2 degrees Fahrenheit) over the past 140 years. Even a strong La Niña only cools global average surface temperature by a tenth of a degree Celsius or so (a couple tenths of a degree Fahrenheit).
  2. Shang-Ping: Outside the tropics, La Niña excites an atmospheric wave train that propagates along a great circle path from Hawaii to Florida, weakening the Aleutian low-pressure center on the way. Anomalous north-to-south winds bring colder air that causes surface air temperature to decrease over northwestern North America while the Gulf of Alaska is anomalously cold as a result of the strengthened prevailing winds. In the Russian far east, positive temperature anomalies develop due to the weakened outbreaks of polar air.
  3. Richard: A leading explanation for how this “pattern effect” becomes established is that the uneven warming across the tropical Pacific is being reinforced by changes in low-altitude clouds. More warming in the west Pacific than the east Pacific increases atmospheric stability in the east, which favors more subtropical, low-altitude stratocumulus clouds. These clouds are effective at reflecting sunlight back to space, adding to (or amplifying) ocean cooling there.However, the opposite occurred during the strong 2015/16 El Niño, with strong warming in the subtropical east Pacific that broke up the stratocumulus cloud and allowed more sunlight to warm the ocean even more (e.g. https://doi.org/10.1029/2019GL086705). Only time will tell whether this reversal was temporary or spells the end of this uneven warming pattern.

Thompson Divide protections are just as significant as Camp Hale designation: New oil and gas leases would be blocked in a region that constitutes one of the largest expanses of roadless forests in #Colorado — Colorado Newsline #ActOnClimate #KeepItInTheGround

An aerial view of Assignation Ridge in the Thompson Divide area of Colorado. (Courtesy of EcoFlight)

Click the link to read the article on the Colorado Newsline website (Sammy Herdman):

On Oct. 12, Coloradans were given a reason to celebrate: President Joe Biden designated the Camp Hale-Continental Divide National Monument in Colorado. That same morning, before Air Force One touched down in Colorado’s Rocky Mountains, the Department of the Interior received a proposal for a 20-year administrative mineral withdrawal for the Thompson Divide area. If approved, the withdrawal would conserve nearly 225,000 acres in Western Colorado for 20 years by prohibiting new mining and oil and gas drilling projects.

The Thompson Divide is a mid-elevation landscape of old growth spruce-fir forests, massive aspen groves and pristine habitat. Combined with the surrounding public lands, the Thompson Divide constitutes one of the largest expanses of unfragmented, roadless forests in Colorado. The area is a reservoir for large mammals, such as black bears, mule deer and elk, which thrive in expansive habitats. The streams and rivers of the Thompson Divide sustain world-class trout fisheries.

Named a “crown jewel” by U.S. Sen. John Hickenlooper of Colorado and “great, wild country” by former President Theodore Roosevelt, the Thompson Divide is more than just wildlife habitat. Anglers come to fish and outdoor enthusiasts come to bike, hike and cross country ski. Each year, Colorado Parks and Wilderness sells 20,000 regional big game licenses to hunters. These visitors stay in hotels and patronize bait shops, grocery stores and restaurants in the nearby towns of Carbondale and Glenwood Springs. Ranchers, some of whom descended from the area’s namesake, Myron Thompson, graze their cattle in the Thompson Divide’s abundant grasses and shrubs, then sell high quality, grass-fed beef throughout the Western Slope and Front Range.

The Thompson Divide is the economic, recreational and ecological soul of the region. Yet, in the 2000s, the Thompson Divide was riddled with new leases for oil and gas extraction. Locals feared a future in which short-term extraction would strip the landscape of large forests, big game and clean streams. One study found that a community near an oil and gas development north of the Thompson Divide had elevated levels of toxic chemicals in the air and benzene (a known carcinogen) leaks in residential water wells.

An enormous amount of effort and infrastructure is required to develop land leased for oil and gas extraction: tearing down forests to build roads, importing heavy machinery and initiating a steady stream of trucks to carry in millions of gallons of water and fracking fluid. All of these activities present an existential threat to the natural characteristics that make the Thompson Divide special.

To protect the Thompson Divide from oil and gas, ranchers, farmers, hunters, anglers, outdoor recreationists, businesspeople and community leaders banded together. This grassroots coalition succeeded in drawing attention to the threats oil and gas extraction posed to the area. Lease after lease was revoked after the Bureau of Land Management revealed that it hadn’t done the requisite environmental impact analyses.

By 2017, the Thompson Divide was no longer in imminent peril. However, because the Thompson Divide sits atop pockets of natural gas it has retained the attention of oil and gas proponents — including the Colorado Oil and Gas Association — who are resistant to prohibiting drilling there. That’s one of the reasons this region hasn’t received permanent protection.

State leaders, such as Democrats U.S. Sen. Michael Bennet and U.S. Rep. Joe Neguse, have attempted to permanently protect the area by passing the Thompson Divide Withdrawal and Protection Act, which was later incorporated into the Colorado Outdoor Recreation and Economy — or CORE — Act. Unfortunately, the CORE Act has not yet passed, leaving the Thompson Divide vulnerable to future oil and gas extraction.

That is, until the CORE Act’s champions, including Bennet, Hickenlooper, Neguse and Gov. Jared Polis, urged the Biden administration to advance needed protections for some areas included in the bill. The designation of the Camp Hale-Continental Divide National Monument is monumental. The proposed 20-year mineral withdrawal from the Thompson Divide is no less significant.

The proposal doesn’t have the permanence that passing the CORE Act would, but it does offer a temporary solution. Through a public comment period and an upcoming environmental impact analysis, the Biden administration will determine whether the 20-year mineral withdrawal proposal should be accepted. At the end of the day, the future of the Thompson Divide should be determined by local communities that rely on it for their livelihoods — not the bottom line of oil and gas companies.

Navajo Dam operations update (November 1, 2022): Bumping releases down to 300 cfs #SanJuanRiver #ColoradoRiver #COriver #aridification

Aerial view of Navajo Dam and Reservoir. Photo credit: USBR

From email from Reclamation (Susan Novak Behery):

In response to sufficient flows in the critical habitat reach, the Bureau of Reclamation has scheduled a decrease in the release from Navajo Dam from 400 cubic feet per second (cfs) to 300 cfs for tomorrow, November 1st, at 4:00 AM.  

Releases are made for the authorized purposes of the Navajo Unit, and to attempt to maintain a target base flow through the endangered fish critical habitat reach of the San Juan River (Farmington to Lake Powell).  The San Juan River Basin Recovery Implementation Program recommends a target base flow of between 500 cfs and 1,000 cfs through the critical habitat area.  The target base flow is calculated as the weekly average of gaged flows throughout the critical habitat area from Farmington to Lake Powell.  

Above-normal precipitation has continued through October across the southern half of the #ColoradoRiver basin. Conditions have been well below normal further north — #Colorado Basin River Forecast Center @nwscbrfc #utwx #cowx #azwx #COriver #aridification

Month to date precipitation in the Colorado River Basin October 31, 2022.
USGS 28 day average streamflows October 31, 2022.

This year’s U.S. winter #wheat condition is worse than in the past 20 years, per USDA NASS: Thirty-five percent of the crop is rated very poor to poor — @DroughtDenise #drought

#Colorado winter moisture often depends on #LaNiña or #ElNiño forecast — Middle Colorado Watershed Council

Click the link to read the article on the Middle Colorado Watershed Council website (SGM):

Why do we care about the ENSO Forecast? Winter moisture in Colorado tends to depend on if it is a La Niña or El Niño event (although this is not always the case), and a healthy snowpack in Colorado is vital to next spring’s runoff. The image below shows that La Niña events tend to bring wetter, cooler conditions to the Northwest and drier conditions to the Southwest. In contrast, El Niño tends to bring wetter, cooler conditions to the Southwest with warmer conditions to the Northwest.

Here are the typical outcomes from both El Niño and La Niña for the US. Note each El Niño and La Niña can present differently, these are just the average impacts. Graphic credit: NWS Salt Lake City office

Colorado tends to be right on the edge of both events. A shift in the jet stream just a couple hundred miles north or south can significantly impact winter weather patterns for Colorado. If the La Niña forecast holds, this would be the third straight La Niña year in a row.

The current ENSO Alert System Status, as of October 13th, 2022 is a La Niña Advisory. Equatorial sea surface temperatures are below average across most of the Pacific Ocean, indicating the likelihood of a La Niña event. There is a 75% chance of La Niña during the Northern Hemisphere winter (December-February) 2022-2023, while there is a 54% chance for ENSO-neutral in February-April 2023, as shown in the graph below.

ENSO probabilities October 2022. Credit: Climate Prediction Center

The Three-Month Precipitation and Temperature Outlook was released on October 20th, 2022 by the Climate Prediction Center for the months of November 2022, December 2022, and January 2023. Both the precipitation and temperature outlooks also mimic a typical La Niña pattern in the Western United States.

Naturally Stronger: How Natural Water Infrastructure Can Save Money and Improve Lives — @AmericanRivers

The Amy Joslin Memorial Eco-Roof on the Multnomah Building in Portland, Oregon is a 12,000 square foot green roof designed to control runoff, reduce pollutant loads, and add green space to the local community | Emily Hauth, Portland Bureau of Environmental Services

Click the link to read the article on the American Rivers website:

Communities in the United States are being threatened by sewage overflows, flooding, polluted stormwater, leaky pipes, and at-risk water supplies. These threats are a result of our nation’s outdated water infrastructure and water management strategies, and their impacts fall disproportionately on low-wealth neighborhoods and communities of color that are already suffering from a lack of investment and opportunity. To solve this problem, we do not just need more investment in water infrastructure. We need a new kind of water infrastructure and management, and we need it in the right places. The solution is the equitable investment in and implementation of natural infrastructure. Naturally Stronger makes the case that if natural infrastructure is used in a more integrated water system, we can transform and restore our environment, invigorate the economy, and confront some of our country’s most persistent inequities.

Download Executive Summary »

VIEW REPORT

As climate change raises stakes on water management decisions, soil moisture monitor fills gap in the data: #Climate station installed near Stagecoach Reservoir is first of 25 planned for the Yampa Valley — Steamboat Pilot & Today

Stagecoach Reservoir. Photo credit Upper Yampa River Water Conservancy District.

Click the link to read the article on the Steamboat Pilot & Today website (Dylan Anderson). Here’s an excerpt:

Soil moisture is the measurement many researchers believe is missing, and a new climate measurement station perched on private land just southwest of Stagecoach Reservoir hopes to help fill the data gap.

“It is another variable that we’re understanding is more and more important,” said Madison Muxworthy, soil moisture, water and snow program coordinator for the Yampa Valley Sustainability Council…

The station — paid for by the Upper Yampa District and installed in partnership with the sustainability council and the Center for Western Weather and Water Extremes — includes a soil moisture monitor that takes measurements at six different depths down to 40 inches. It’s the first of a network of 25 similar stations planned for the Yampa Valley. Rossi said the station will be an important tool when making decisions that have shrinking margins for error amid climate change…The station was installed in the middle of September, and Muxworthy said it generally takes about three months for everything to settle. It will likely take another decade to have enough soil moisture data to have a good understanding of that soil-runoff relationship, she added. But the station is taking measurements every two minutes and updating data every hour. Soil moisture measurements are taken at 2, 4, 6, 8, 20 and 40 inches, which shows how deep moisture from precipitation is soaking into the ground.

Plant processes may be key to predicting #drought development, according to Stanford researchers

Cheesman Reservoir during the 2002 drought. Photo credit: Denver Water.

Click the link to read the release on the Stanford University website (Danielle Torrent Tucker):

Based on new analyses of satellite data, scientists have found that hydrologic conditions that increase flash drought risk occur more often than current models predict. The research also shows that incorporating how plants change soil structures can improve Earth system models.

As physical links between the ground and the sky, plants play an important role in shaping Earth’s weather and climate. Now, Stanford University researchers have revealed how a closer look at plants’ inner workings may be able to help improve model predictions of some devastating global disasters.

Flash droughts, which develop rapidly and deplete water availability in a matter of weeks, are associated with changes in evapotranspiration – the process of plants moving moisture from their roots to the air. Water undergoing evapotranspiration is sometimes considered “lost” to the atmosphere, so accurate calculations of this loss can be critical to understanding impacts on water resources and ecosystems.

By analyzing satellite data of both precipitation and moisture belowground, researchers calculated changes in evapotranspiration during droughts that occurred globally from 2003 to 2020. The research, published in Nature Climate Change Oct. 27, reveals more details about evapotranspiration’s role in these devastating events.

“When water is already limited, the evapotranspiration will continue to make the water loss happen even faster – and that will make the drought become more severe in a much shorter time period,” said lead study author Meng Zhao, a postdoctoral researcher in Earth system science in the Stanford Doerr School of Sustainability. “We have a very big challenge in predicting flash droughts and the underestimation of water loss could be a major obstacle in that prediction.”

Droughts with fast onset and intensification can impact vulnerable communities and ruin food production, as was seen in the 2012 Central Great Plains flash drought that resulted in more than $30 billion in damages. For models to be improved, the researchers say they need to incorporate a hidden element in the process of evapotranspiration: how plants change the structure and pathways in the soil surrounding their roots.

“We found that the model error seems to be explained by the way plants change how particles are arranged in the soil,” said senior study author Alexandra Konings, an assistant professor of Earth system science. “As a result of these changes to the soil, water flows through the soil differently, changing where and how much water is available for plants to take up and transpire.”

Balancing act

Similar to the way people can live with various diets, exercise habits, and hours of sleep based on available resources, plants respond to droughts with wide variability. The tiny pores in leaves called stomata that release water can close, but not all plants close their stomata equally or at the same rates. During drought, drier atmospheres have a greater ability to pull water out of the land through evapotranspiration, causing it to increase – but if the stomata close sufficiently, it will reduce evapotranspiration relative to non-drought times.

“There’s such a diversity of ways that plants operate that it can be really hard to fully understand, predict, and quantify in the models,” Konings said. “And unfortunately, if this increase in evapotranspiration is happening more often than we realize, it’s intensifying the effect of the drought; there’s even less water in the soil than we realize because more is being lost to the atmosphere.”

Current Earth system models show increases in evapotranspiration, in which stomata are more open, occurring about 25% of the time during droughts. Yet according to the researchers’ new estimate, it occurs about 45% of the time. “This underestimation is particularly large in relatively drier climate and lower biomass regions,” the study authors write.

Researchers combined observations of water storage from the Gravity Recovery and Climate Experiment (GRACE) satellites with precipitation data from the Global Precipitation Climatology Project to calculate evapotranspiration measurements across the globe. Whether a given drought in a particular location leads to high evapotranspiration – and has the potential to develop into a flash drought – depends on a range of factors. The authors found that dry soils are a key control. They further found that current models don’t account for roots’ effect on how water travels through soils. This caused errors in the model simulations of soil dryness and, as a result of that, evapotranspiration.

“We knew that there were problems with the models, but I was really surprised at how off they were,” Konings said. “My personal hope is that other folks in the community who are building different models use the lessons from our paper.”

A transferrable approach

The findings point to the need for improved model representations of soil moisture impacts on evapotranspiration, soil structure effects on water transfer, and plant traits to understand current and future water resources. While the researchers did not calculate how these new evapotranspiration measurements may affect future climate scenarios – which are expected to bring more frequent and severe droughts – they say the findings should be easily transferable to other models. And since it’s based on satellite data, the work doesn’t require on-the-ground resources.

“You can clearly see that the models underestimate the evapotranspiration increase during droughts for arid and semi-arid regions,” Zhao said. “That means our understanding of this phenomenon is especially poor in regions that are already suffering from environmental injustice issues – I think our work can help improve the knowledge of these regions that are already water-stressed.”