The May 1st forecast for the April – July unregulated inflow volume to Blue Mesa Reservoir is 830,000 acre-feet. This is 131% of the 30 year average. Snowpack in the Upper Gunnison Basin peaked at 138% of average. Blue Mesa Reservoir current content is 434,000 acre-feet which is 52% of full. Current elevation is 7470.4 ft. Maximum content at Blue Mesa Reservoir is 828,00 acre-feet at an elevation of 7519.4 ft.
Based on the May forecasts, the Black Canyon Water Right and Aspinall Unit ROD peak flow targets are listed below:
Black Canyon Water Right
The peak flow target is equal to 6,400 cfs for a duration of 24 hours.
The shoulder flow target is 810 cfs, for the period between May 1 and July 25.
Aspinall Unit Operations ROD
The year type is currently classified as Average Wet.
The peak flow target is currently 14,300 cfs and the duration target at this flow is currently 2 days.
The half bankfull target is currently 8,070 cfs and the duration target at this flow is currently 20 days.
Pursuant to the Aspinall Unit Operations ROD, releases from the Aspinall Unit will be made in an attempt to match the peak flow of the North Fork of the Gunnison River to maximize the potential of meeting the desired peak at the Whitewater gage, while simultaneously meeting the Black Canyon Water Right peak flow amount. The latest forecast for flows on the North Fork of the Gunnison River shows a high peak flow occurring near the middle of next week. Flows in the tributaries downstream of the North Fork confluence are also very high, which will help with meeting the flow targets on the lower Gunnison River at the Whitewater gage.
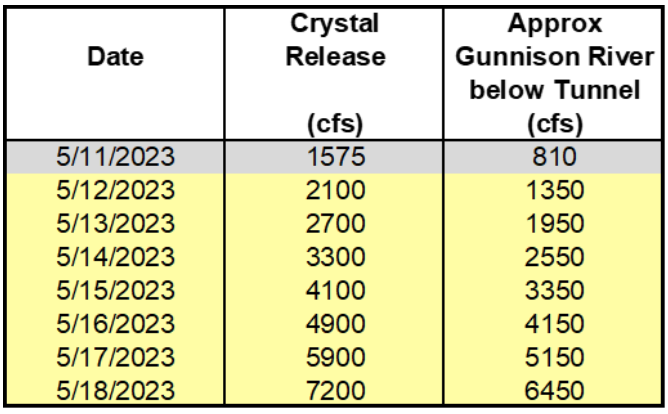
Therefore ramp up for the spring peak operation will begin on Friday, May 12th, with the intent of timing releases with this potential higher flow period on the North Fork of the Gunnison River. Releases from Crystal Dam will be ramped up according to the guidelines specified in the EIS, with 2 release changes per day, until Crystal begins to spill. The release schedule for Crystal Dam is:
Crystal Dam will be at full powerplant and bypass release on May 15th. Crystal Reservoir will begin spilling by May 16th and the peak release from Crystal Dam should be reached on May 18th. The flows in the Gunnison River after that date will be dependent on the timing of the spill and the level of tributary flow contribution. Estimates of those numbers will be determined in the upcoming days.
The current projection for spring peak operations shows flows in the Gunnison River through the Black Canyon peaking at 6400 cfs in order to achieve the desired peak flow and duration at Whitewater. Actual flows will be dependent on the downstream contribution of the North Fork of the Gunnison River and other tributaries. Higher tributary flows will lead to lower releases from the Aspinall Unit and vice versa.
Quiet beauty surrounds you So does the wind the whole year, too Your red rock canyons are a shelter From many storms that I’ve been through Canyons so deep You can see the stars at noon
It’s a paradise I’m thinking of Dreaming comes easy As I’m held within these walls And the river gently sings her lullaby
Sometimes the silence overwhelms me Perhaps it’s something in the air I wish that I could go more often For I find peace and comfort there Canyons so deep You can see the stars at noon
It’s a paradise I’m thinking of Dreaming comes easy As I’m held within these walls And the river gently sings her lullaby
Tiny flowers in the springtime Where cold water swirls around late frost This canyon serves as a reminder Of so much wilderness that’s lost Canyons so deep You can see the stars at noon
It’s a paradise I’m thinking of Dreaming comes easy As I’m held within these walls And the river gently sings her lullaby
Dreaming comes easy As I’m held within these walls And the river gently sings her lullaby
The cherry blossom trees, a gift from Japan to the United States in 1812, line the Tidal Basin and surround landmarks such as the Jefferson Memorial, Martin Luther King Jr. Memorial and the Franklin Delano Roosevelt Memorial. Photo credit: Capital Bikeshare
Click the link to read the article on the NOAA website:
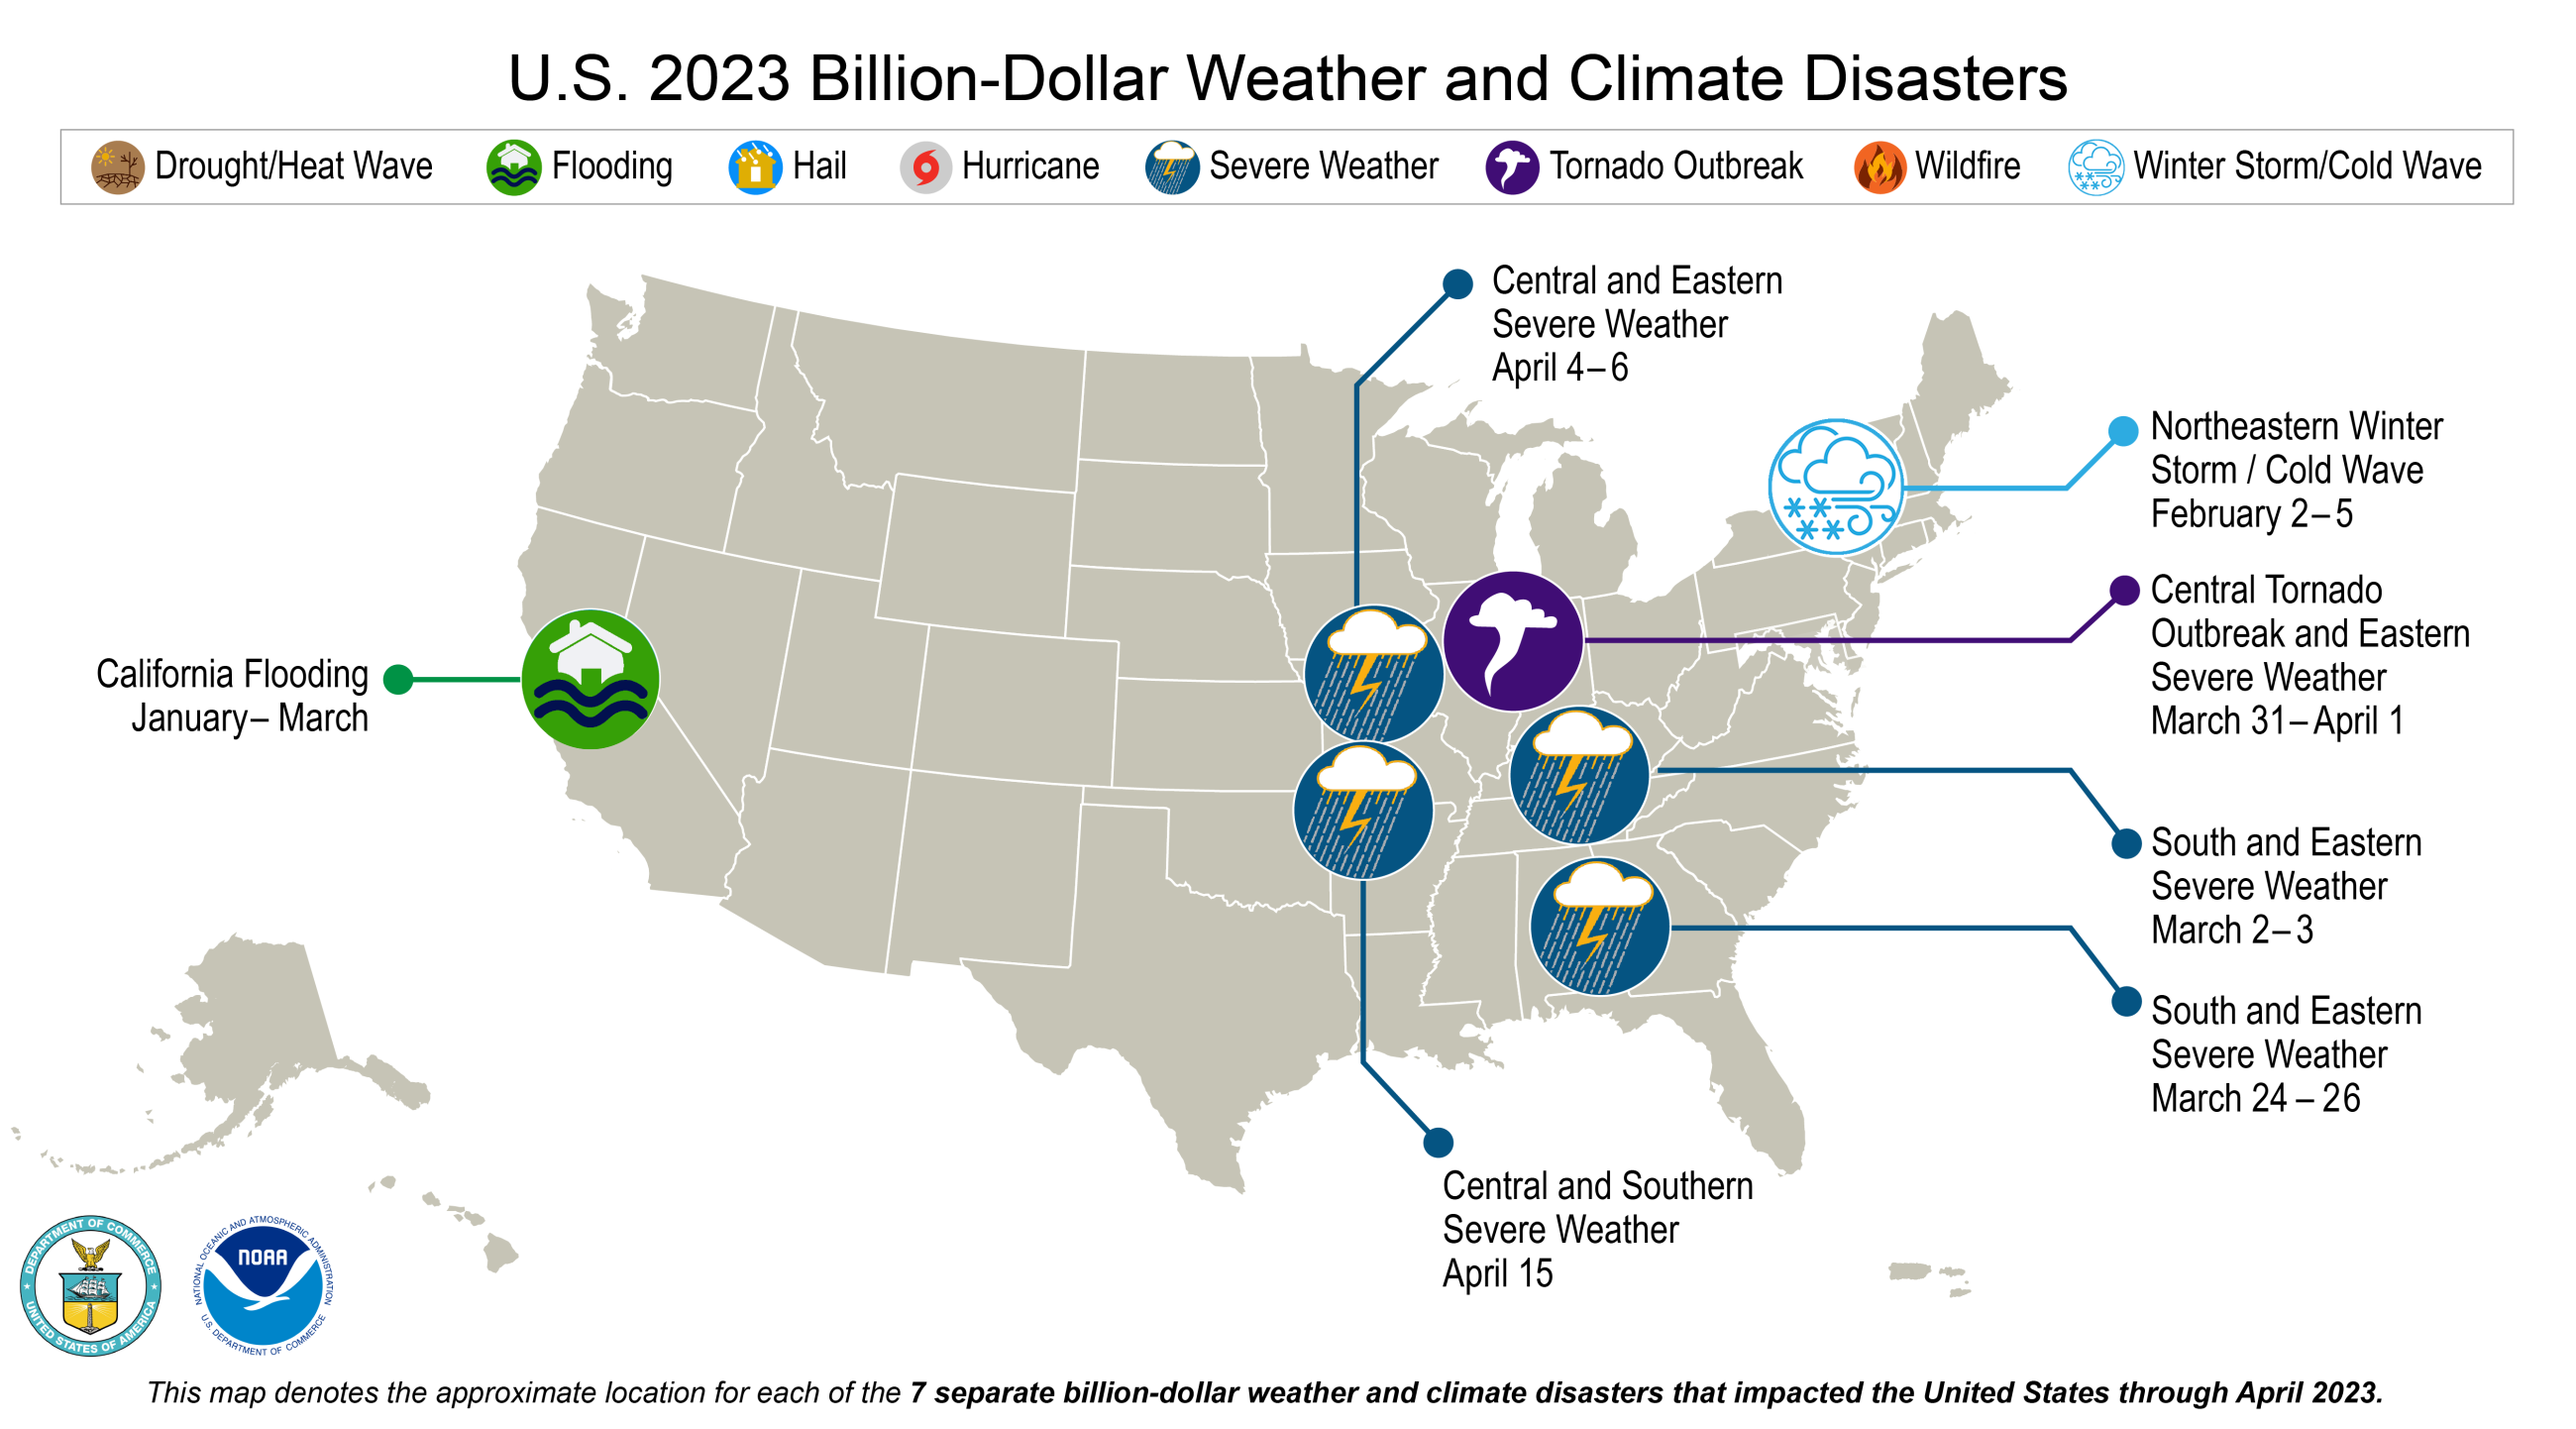
Extreme weather strikes: Seven billion-dollar disasters so far in 2023
Key Points:
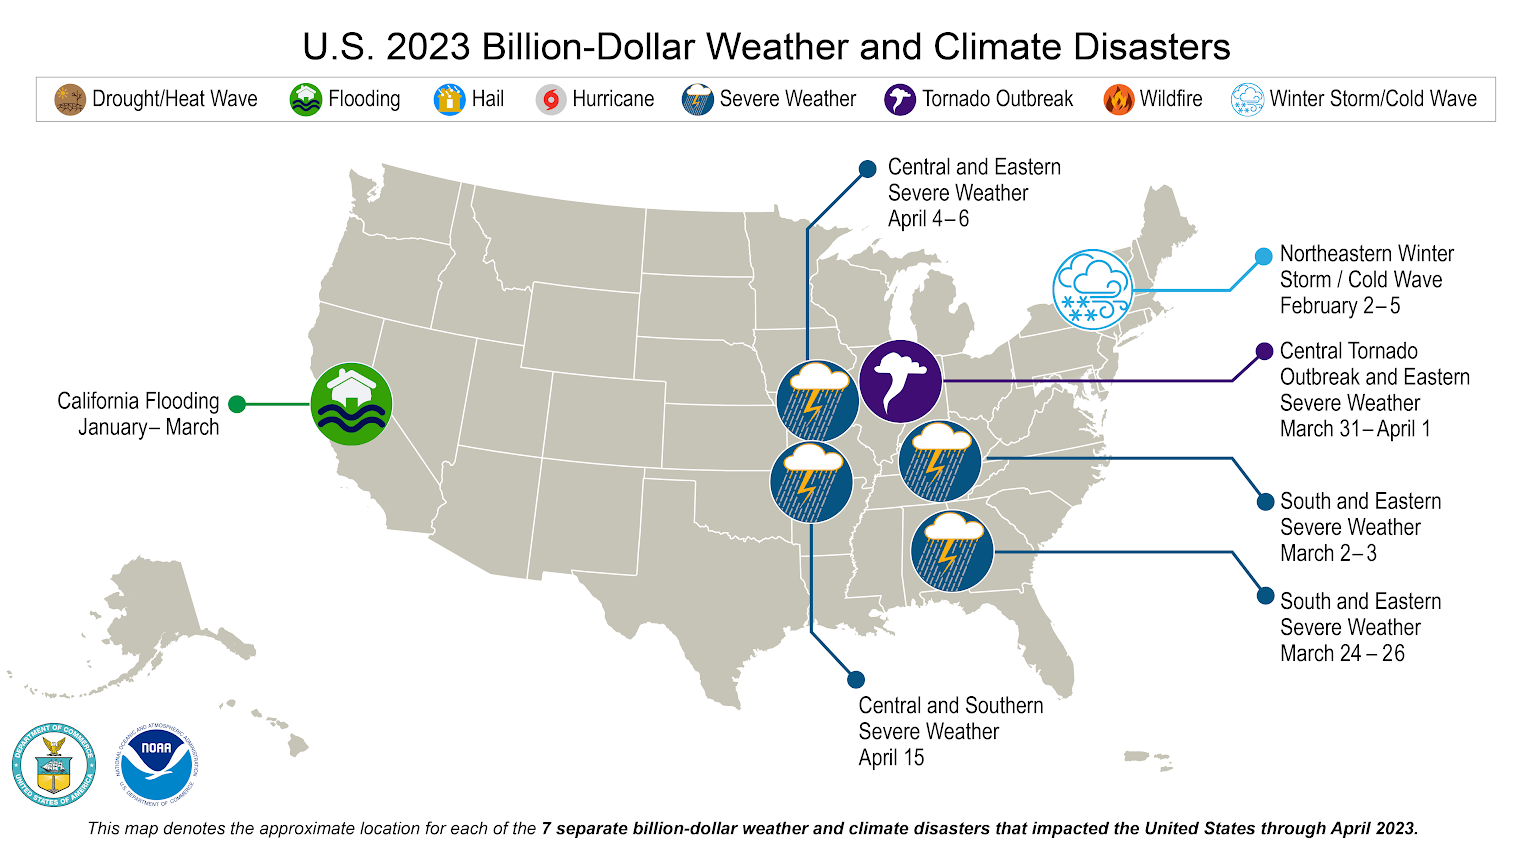
As of May 8, seven billion-dollar weather and climate disasters were confirmed this year. These disasters consisted of five severe storm events, one winter storm and one flooding event.
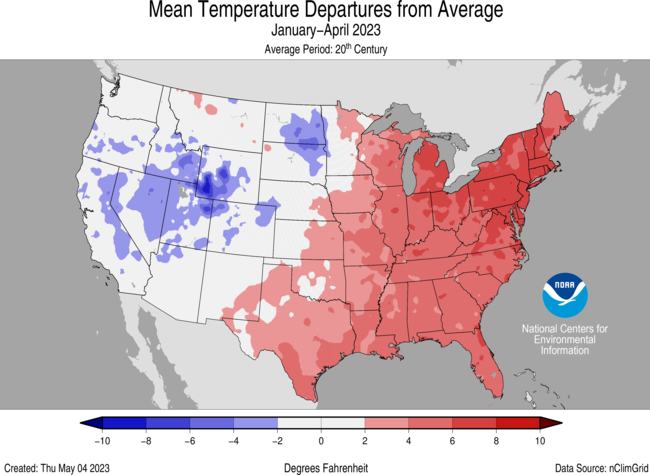
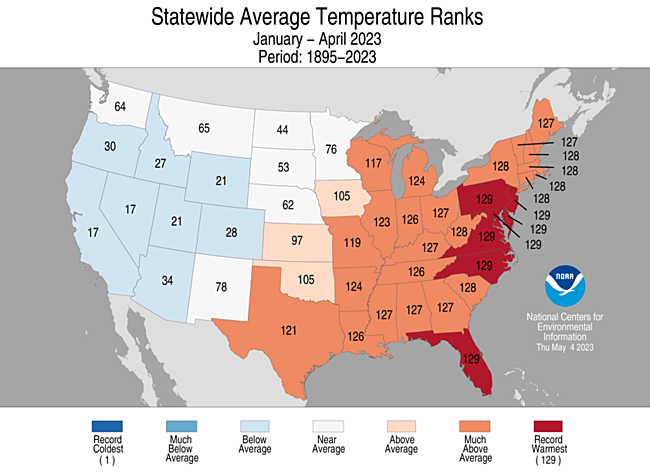
Much of the eastern U.S. had a warm start to 2023. For the January–April period, seven states were record warmest with 21 additional states experiencing a top-10 warmest event for this period.
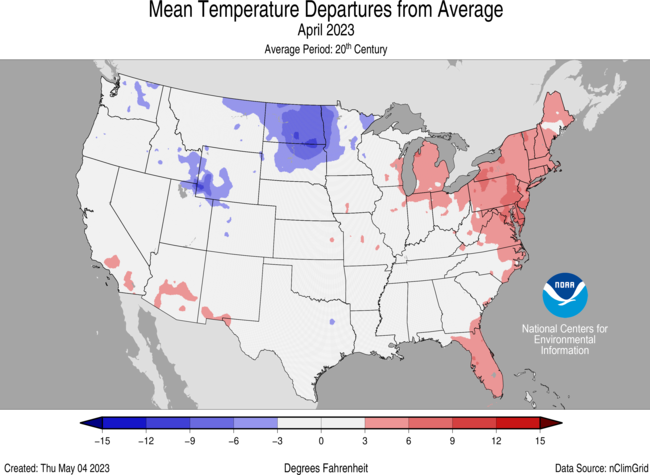
The average temperature of the contiguous U.S. in April was 51.4°F, which is 0.3°F above average, ranking in the middle third of the 129-year record.
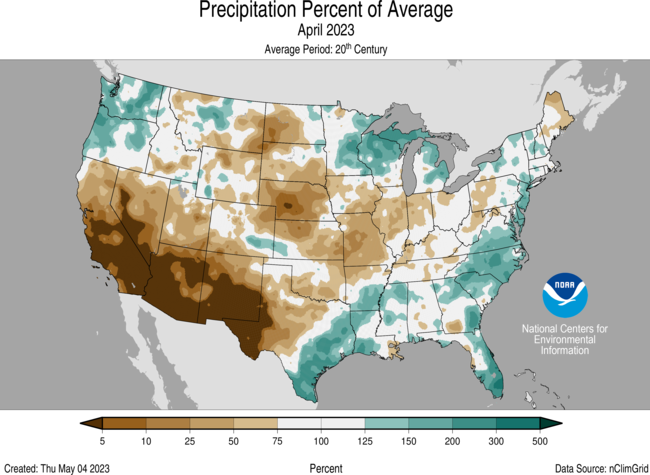
April precipitation for the contiguous U.S. was 2.40 inches, 0.12 inch below average, ranking in the middle third of the historical record.
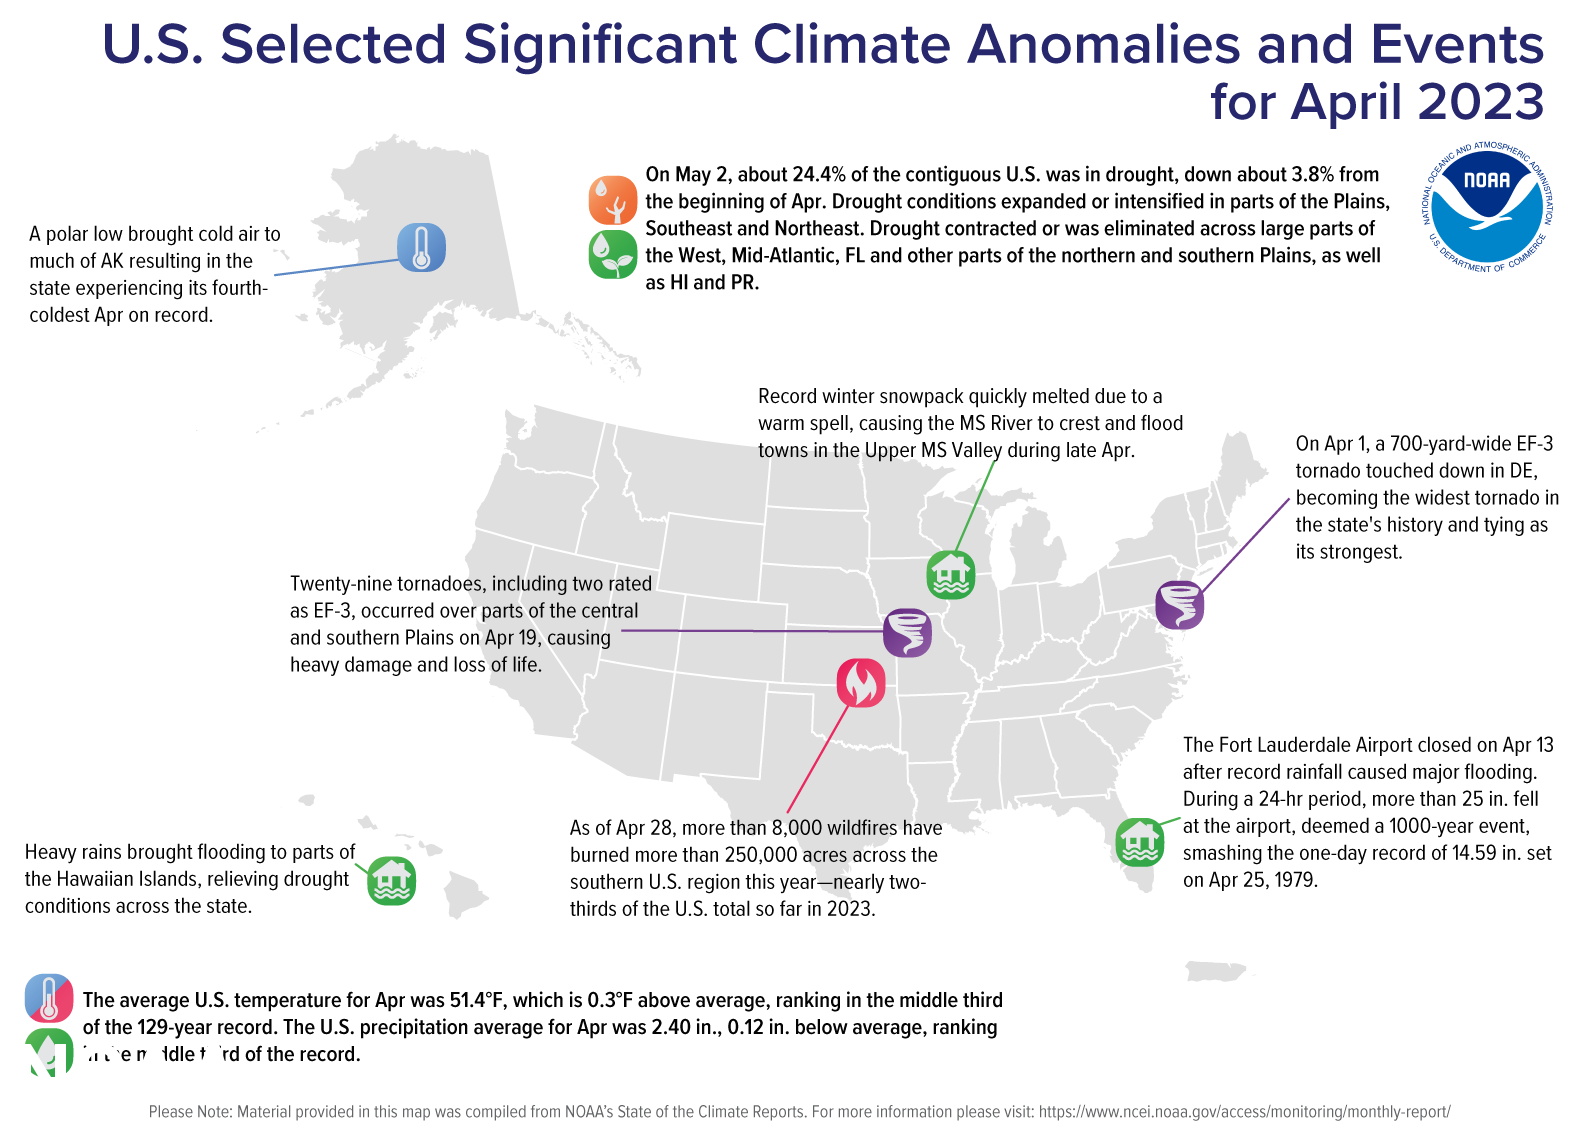
A map of the United States plotted with significant climate events that occurred during April 2023. Please see the story below as well as the full climate report highlights at http://bit.ly/USClimate202304offsite link. (Image credit: NOAA/NCEI)
Other Highlights:
Temperature
Generally, temperatures were below average from the Northwest to the central Rockies and northern Plains and parts of the southern Plains. Temperatures were above average from the central Plains to the Great Lakes, along the East and Gulf coasts and in parts of the Southwest and southern Plains. Maryland and Delaware ranked second warmest on record for April while New Jersey ranked third, with nine additional states ranking among their top-10 warmest April on record. Conversely, North Dakota ranked 10th coldest on record for the month.
The Alaska statewide April temperature was 16.3°F, 7.0°F below the long-term average. This ranked as the fourth-coldest April in the 99-year period of record for the state. Temperatures were below average across almost the entire state with near-normal temperatures in parts of the Southeast and Aleutians during the month.
For the January–April period, the average contiguous U.S. temperature was 40.9°F, 1.8°F above average, ranking in the warmest third of the record. Temperatures were above average across much of the eastern U.S. with near- to below-average temperatures from the northern Plains to the West Coast. Pennsylvania, New Jersey, Maryland, Delaware, Virginia, North Carolina and Florida each had their warmest January–April period on record. New Hampshire, Massachusetts, Rhode Island, Connecticut, New York, West Virginia and South Carolina each had their second warmest, while 14 additional states ranked among their warmest 10 year-to-date periods on record. Nevada and California both ranked 17th coldest on record for this four-month period.
The Alaska January–April temperature was 11.7°F, 1.4°F above the long-term average, ranking in the middle third of the record for the state. Much of the state was near-normal for the four-month period while temperatures were above-average across much of the North Slope and in parts of the southeast and Aleutians.
Precipitation
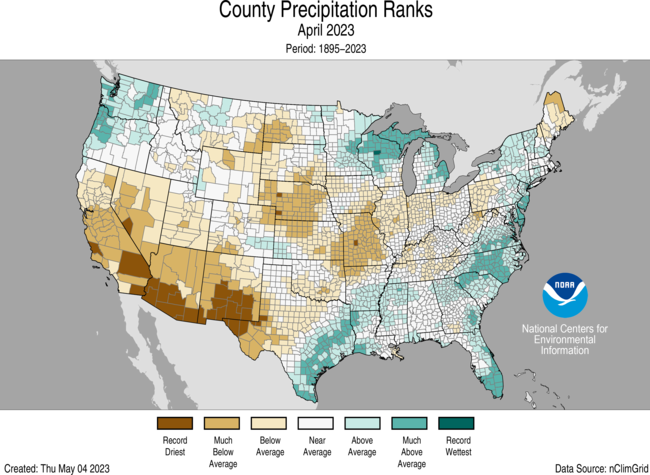
Precipitation was above average across portions of the Northwest, along the Gulf and East coasts and Upper Midwest and below average from California to the Ohio River Valley and in parts of the northern Rockies and Maine. Arizona, Missouri, Nebraska and New Mexico ranked third to sixth driest on record, respectively. Conversely, Delaware ranked seventh wettest, North Carolina ranked eighth wettest and New Jersey had its 10th-wettest April on record.
Across the state of Alaska, the average monthly precipitation was 2.01 inches, ranking in the middle third of the 99-year record. Conditions were wetter than average across much of the North Slope, eastern Interior and in parts of the Panhandle. Much of the central Interior to the West Coast and parts of the Southeast were near average, while parts of the Aleutians and Northwest Gulf experienced below-average precipitation for the month.
The January–April precipitation total for the contiguous U.S. was 10.22 inches, 0.74 inch above average, ranking in the wettest third of the 129-year record. Precipitation was above average across much of the Southwest and Great Lakes, and in parts of the southern Mississippi Valley, Southeast and Northeast. Wisconsin ranked wettest on record while Michigan ranked fourth and Utah ranked seventh wettest on record, respectively. On the dry side, precipitation was below average across parts of the Northwest, central and northern Plains, Mid-Atlantic and Florida during the January–April period. Maryland ranked 13th driest on record for this four-month period.
The January–April precipitation ranked in the wettest third of the 99-year record for Alaska, with above-average precipitation observed across much of the eastern Interior, North Slope and in parts of the Panhandle while the West Coast was much wetter than average. The central Interior and parts of the Southwest and Southeast were near average while south central Alaska and parts of the Aleutians experienced below-average precipitation during this period.
Billion-Dollar Disasters
There have been seven confirmed weather and climate disaster events, each with losses exceeding $1 billion this year. These disasters consisted of five severe storm events, one winter storm and one flooding event. The total cost of these events exceeds $19 billion, and they have resulted in 97 direct and indirect fatalities. The number of disasters so far this year is the second-highest number recorded during the first four months of a year. Only 2017 and 2020 had more, with eight separate disasters recorded in January-April. The first four months of 2023 places the total, direct costs of the confirmed billion-dollar events ($19.0 billion) in second place behind the first four months of 2021 ($36.1 billion mostly driven by the historical Feb. 2021 winter storm and/ cold wave that crippled the Texas energy grid).
The U.S. has sustained 355 separate weather and climate disasters since 1980 where overall damages/costs reached or exceeded $1 billion (including CPI adjustment to 2023). The total cost of these 355 events exceeds $2.540 trillion.
Other Notable Events
In less than a 24-hour period, more than 25 inches of rain fell at the Fort Lauderdale Airport on April 13. The event, deemed a 1000-year event by the National Weather Service, smashed the previous one-day record of 14.59 inches of rain set on April 25, 1979.
Several notable weather systems produced severe thunderstorms and a number of tornadoes that impacted portions of the U.S. in April.
On April 1, a 700-yard-wide EF-3 tornado touched down in Delaware, becoming the widest tornado in the state’s history and tying as its strongest.
A tornado outbreak occurred across areas of the southern and central Plains on April 19. A total of 29 tornadoes, including two EF-3 tornadoes, was confirmed by the National Weather Service, causing heavy damage and loss of life.
On April 30, a state of emergency was declared after a rare EF-3 tornado touched down in Virginia Beach, destroying more than 100 structures.
Portions of the Upper Midwest and parts of the mountainous West received additional snowfall in April, adding to an already record- to near-record snowfall season.
Duluth, Minnesota had its snowiest season on record with 140.1 inches of snow, besting 1995-96 by nearly 5 inches.
Alta Ski Area in Utah surpassed 900 inches of snowfall on April 25—the most snowfall ever recorded at this ski resort.
Jackson Hole Mountain Resort in Wyoming set a new snowfall record with 595 inches this season.
During late April, record winter snowfall across the northern Plains and Upper Midwest quickly melted due to a warm spell, causing the Mississippi River to crest and flood towns in the Upper Mississippi Valley.
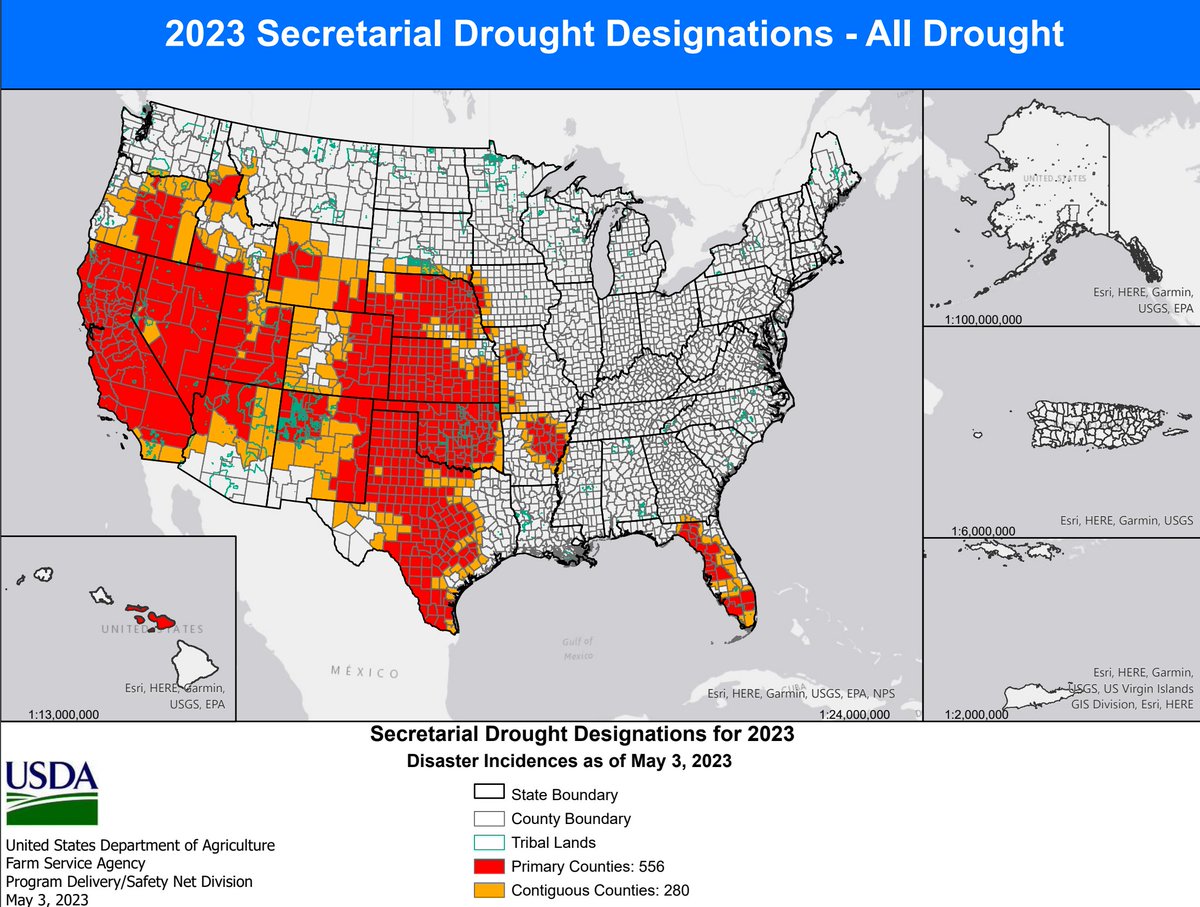
According to the National Interagency Fire Center situation report released on April 28, more than 8,000 wildfires have burned more than 250,000 acres across the Southern U.S. this year. This is nearly two-thirds of all fires and acres consumed across the U.S. to date in 2023.
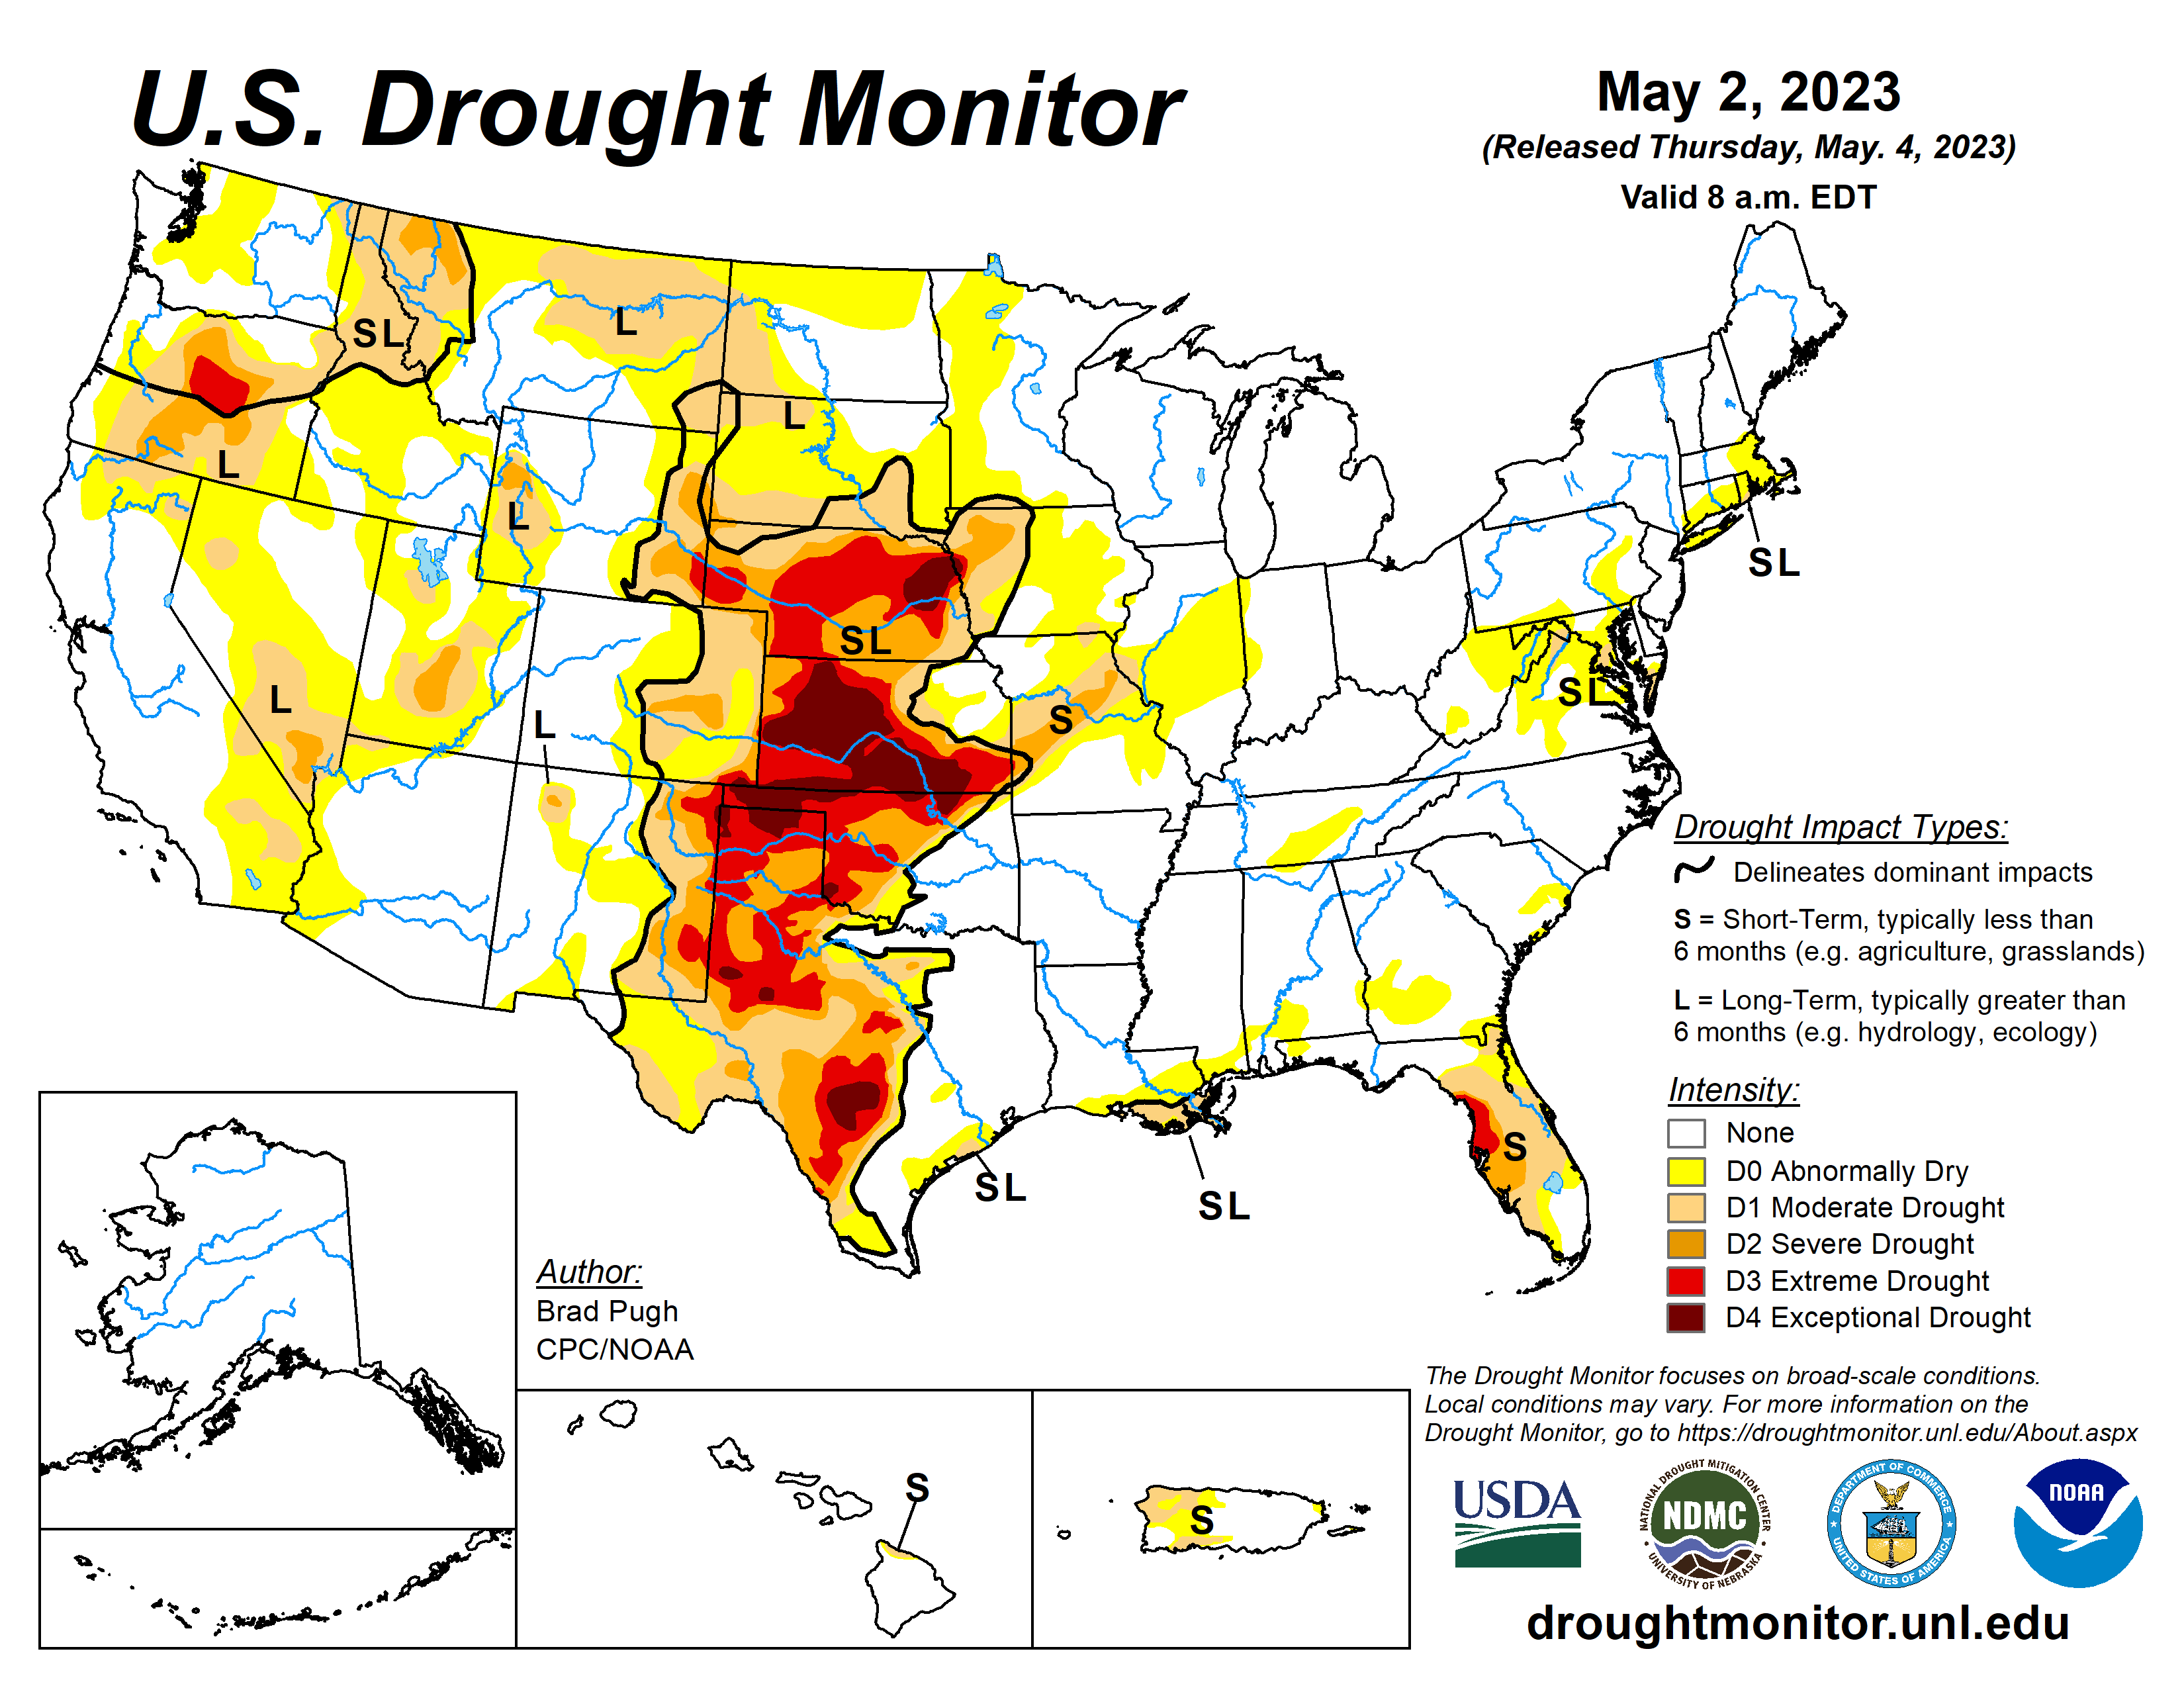
US Drought Monitor map May 2, 2023.
Drought
Monthly Outlook
According to the April 30 One-Month Outlook from the Climate Prediction Center, areas from the Northwest to central Rockies, New England, Florida Peninsula and northern Alaska favor above-normal monthly mean temperatures in May, with the greatest odds likely to occur along eastern Washington to western Montana and southern Florida. The best chances for below-normal temperatures are forecast from California to southwestern New Mexico, Ohio and Tennessee River valleys and parts of the Southeast as well as across southeast Alaska. California to southern Idaho and states along the Gulf Coast, as well as parts of western Alaska, are favored to see above-normal monthly total precipitation. Below-normal precipitation is most likely to occur from the northern Plains to the Great Lakes. Drought improvement or removal is forecast across portions of the southern Plains, Mid-Atlantic and Florida, while persistence is more likely in portions of the West, the Northern to Central Plains and western Puerto Rico. Drought development is likely across the central parts of the Plains and Mississippi River Valley regions and in northwest Puerto Rico.
According to the One-Month Outlook issued on May 1 from the National Interagency Fire Center, portions of western Texas have above-normal significant wildland fire potential during May, while portions of the Southwest and northern Plains are expected to have below-normal potential for the month.
A strong area of mid-level low pressure, near the West Coast, resulted in anomalously wet weather during the first week of May throughout the Pacific Northwest, Northern Rockies, Great Basin, and California. Scattered thunderstorms brought pockets of heavy rainfall (more than 2 inches), from May 2 to 8, to parts of Texas, central Nebraska, and the Midwest. However, much of Kansas, Missouri, and southern Nebraska missed out on this beneficial rainfall. Following a wet end to April across the East, drier weather prevailed this past week from the Mid-Atlantic south to Florida. 7-day temperatures, ending on May 8, averaged below-normal across most of the East along with California, the Great Basin, and Desert Southwest. Weekly temperatures averaged above-normal across the Great Plains…
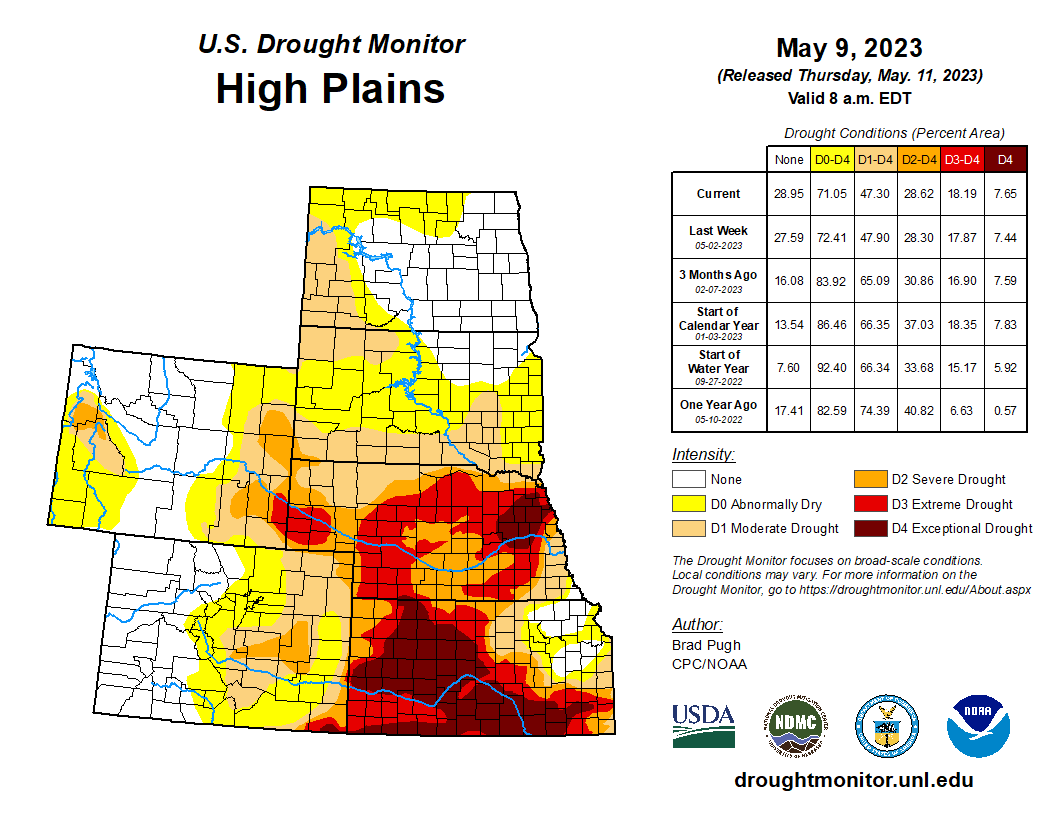
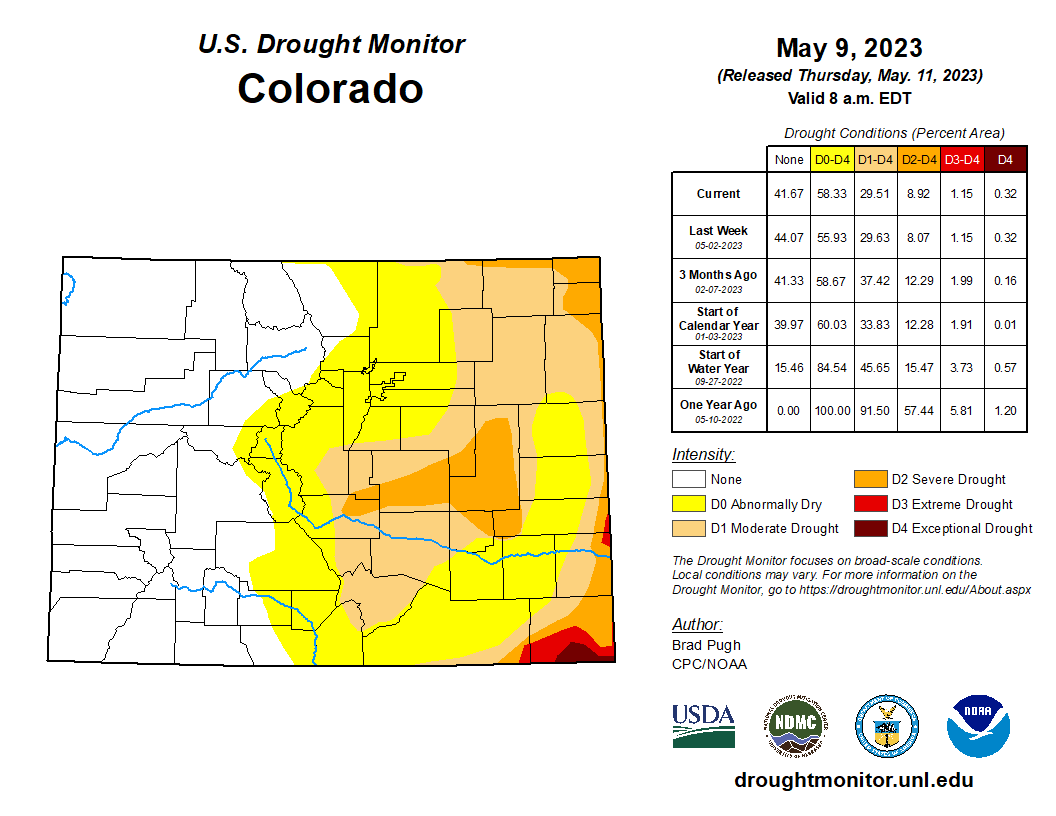
Convective rainfall, typical for early May, occurred this past week across parts of Kansas and Nebraska. In areas such as central Nebraska, that received more than 2 inches of rainfall and there was a lack of support from SPI at various time scales and NDMC’s objective drought blends, a 1-category improvement was made. However, in areas that missed out on this rainfall, a 1-category degradation was necessary for parts of southern Nebraska and central to eastern Kansas. According to the U.S. Department of Agriculture, 64 and 68 percent of the pastures and ranges for Kansas and Nebraska, respectively, are rated poor to very poor. Abnormal dryness (D0) was expanded westward near and along the Colorado Rockies based on SPIs at various time scales, while an increase in severe drought (D2) coverage was justified for parts of the High Plains of eastern Colorado that missed out on the recent heavier precipitation. Based on multiple indicators including Condition Monitoring Observer Reports, abnormal dryness (D0) was reduced across northern parts of North Dakota…
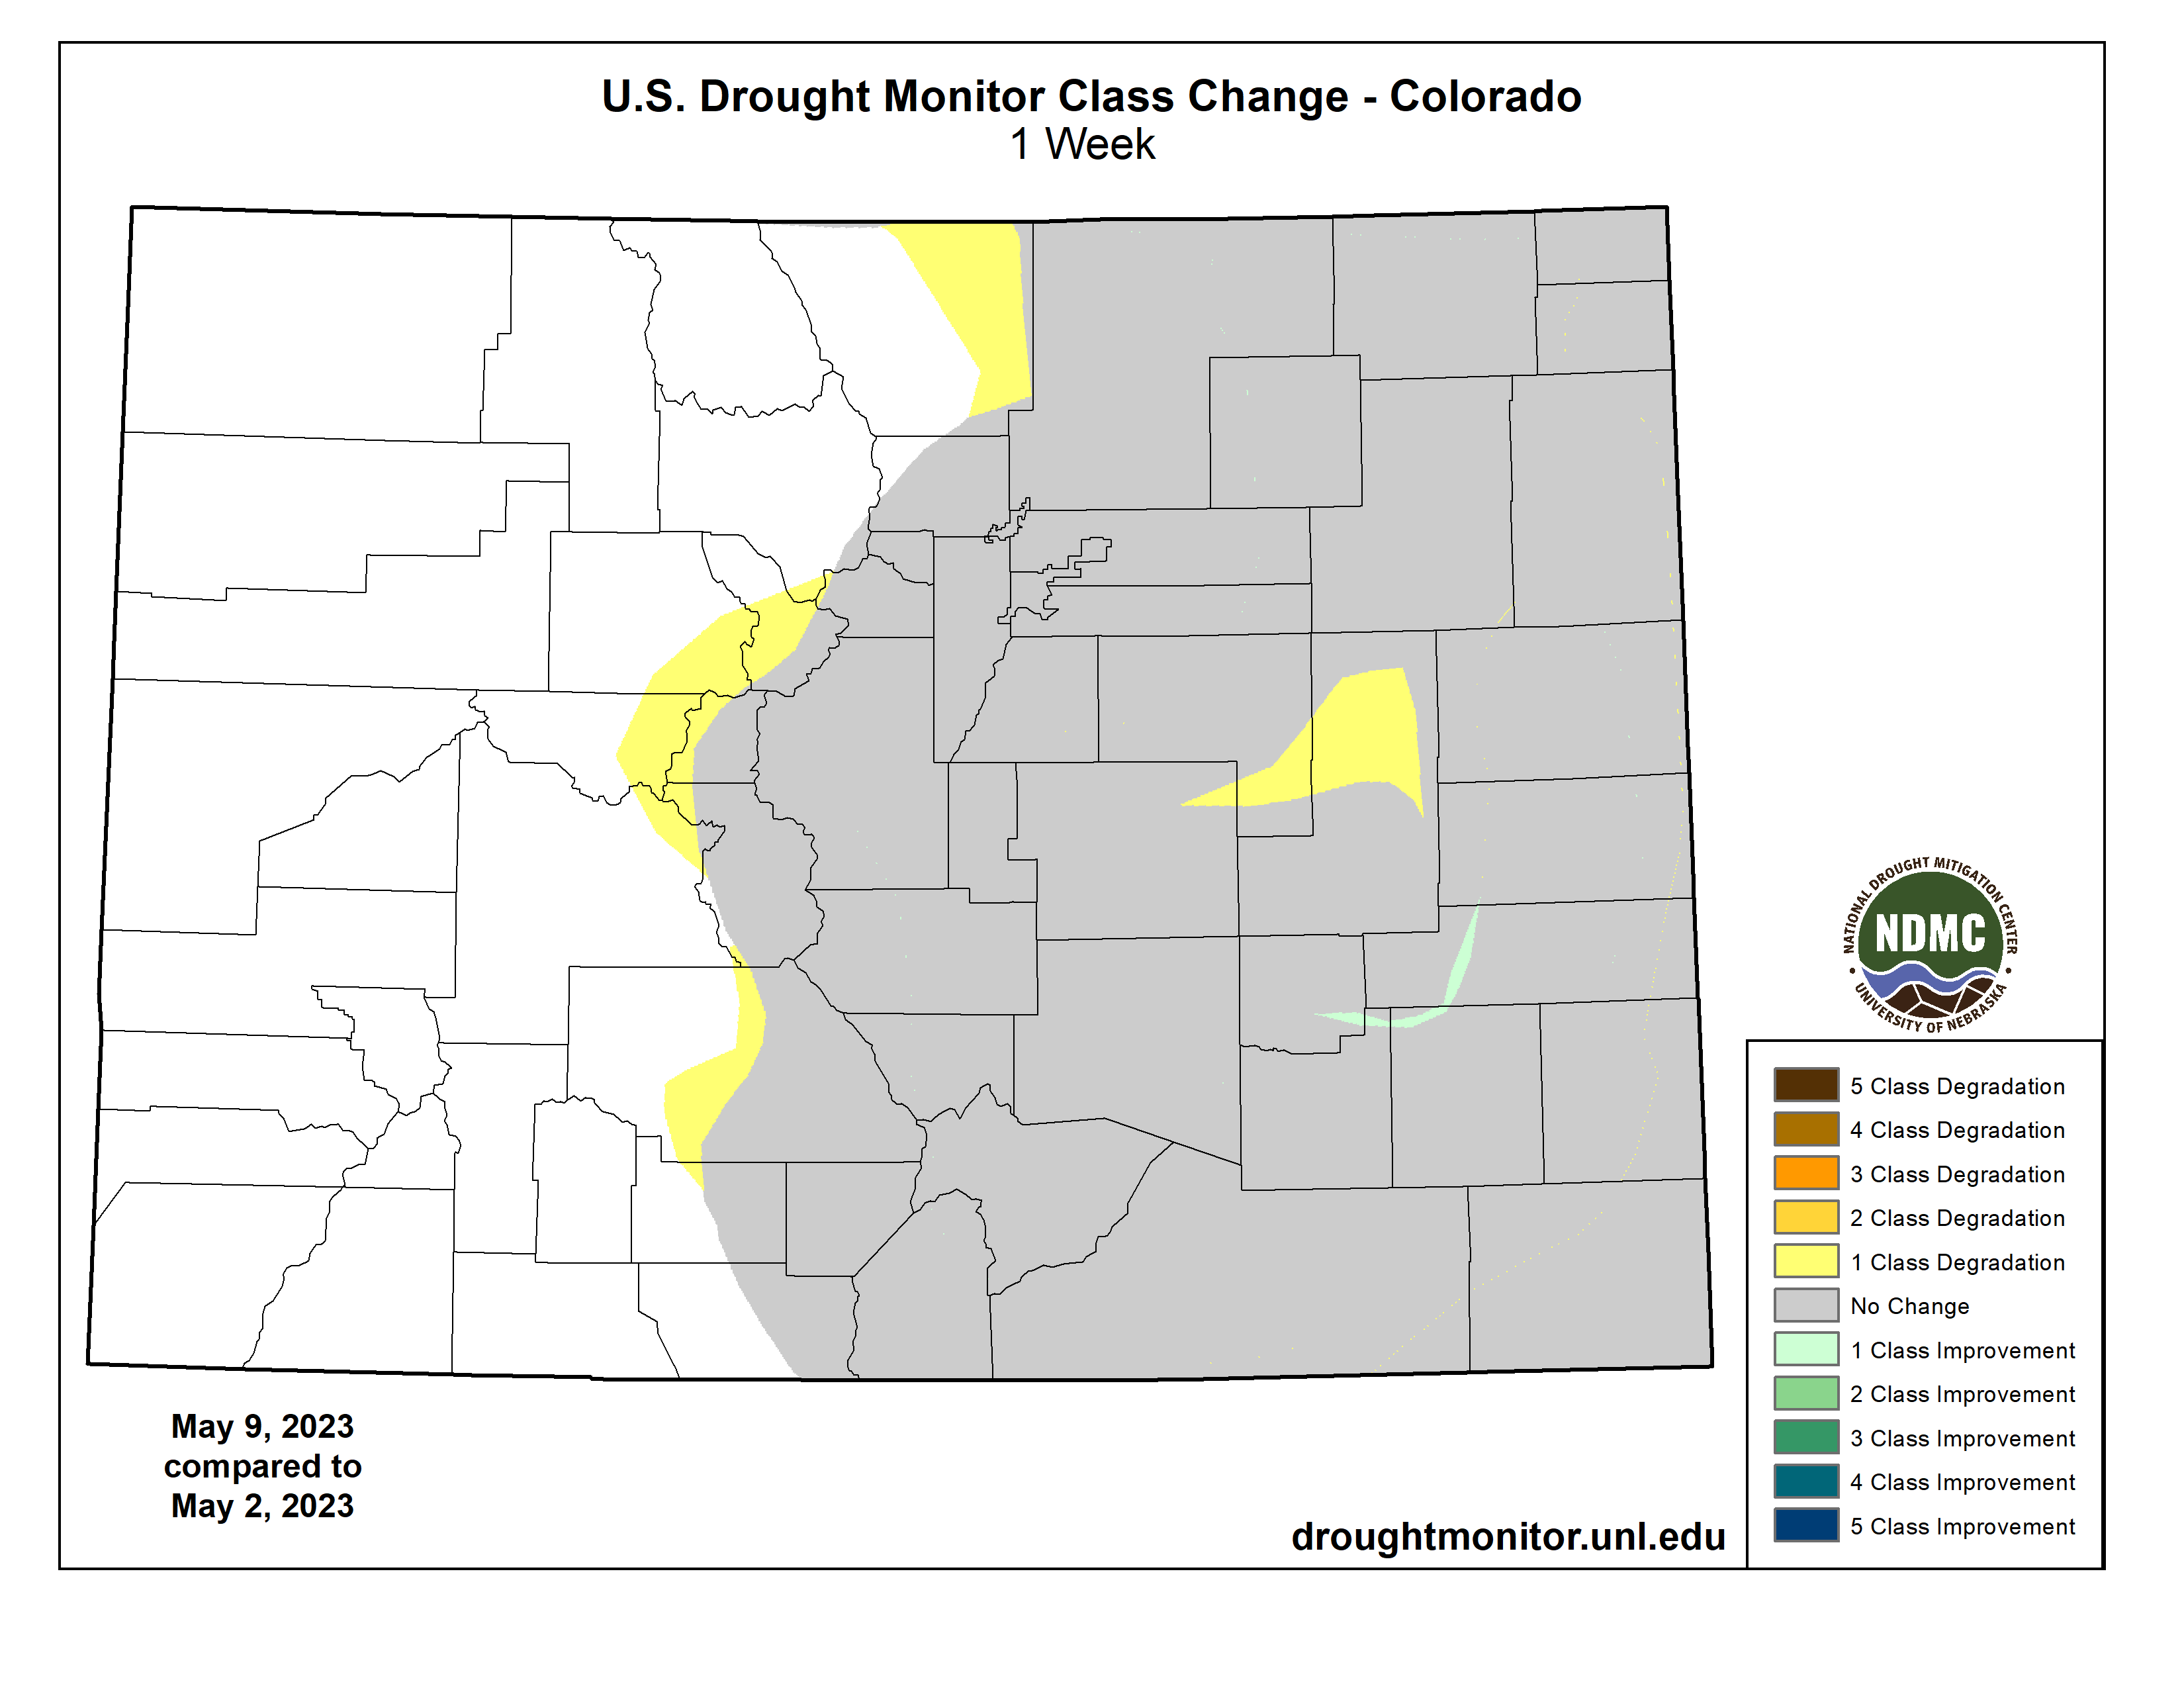
Colorado Drought Monitor one week change map ending May 9, 2023.
Anomalously wet, cool weather prevailed across the West at the beginning of May. A 1-category improvement was made to parts of northern California after the wet start to the month and this improvement was also consistent with 24-month SPI, NDMC’s long-term drought blend, and NASA’s GRACE groundwater. It should be noted that Trinity reservoir in northern California remains at half of its historical average. A 1-category improvement was also warranted for parts of Oregon based on 24-month SPI, GRACE 1-meter soil moisture, and the wet first week of May. A decrease in abnormal dryness (D0) across parts of Washington was supported by SPI at multiple time scales, 28-day streamflow, and GRACE soil moisture. Based on 60-day SPI and longer time scales, moderate drought (D1) was reduced in coverage across southwestern Wyoming. D1 was changed to long-term abnormal dryness (D0) in northeast Montana based on SPI at multiple time scales and a favorable soil moisture response this spring down to 20 inches. Severe drought (D2) was removed from central Utah due to a lack of support from long-term indicators…
A mix of degradations and improvements were made this past week to the Southern Great Plains, western Gulf Coast, Lower Mississippi Valley, and Tennessee Valley. Severe drought (D2) was slightly expanded in southeast New Mexico, based on 90-day SPI and USGS 28-day average streamflows falling below the 10th percentile along parts of the Black River. Based on declining soil moisture indicators, extreme drought (D3) was expanded westward across the Edwards Plateau. More than 1.5 inches of rainfall this past week resulted in a 1-category improvement to parts of central and northwest Texas, the Texas Panhandle, and central Oklahoma. According to NDMC’s long-term objective drought blend, there remains a sharp gradient between extreme to exceptional drought (D3-D4) in northwest Oklahoma to anomalously wet conditions in southeast Oklahoma. An increase in abnormal dryness (D0) was warranted for parts of northwest Arkansas based on increasing 30-day precipitation deficits and 28-day average streamflows below the 30th percentile. The D0 coverage was modified across Tennessee after central parts of the state received more than 1.5 inches of rainfall. However, D0 was expanded to include more of western and northeastern Tennessee, based on 30 to 60-day SPI and 28-day average streamflows. Recent heavy rainfall and 120-day SPI supported elimination of D0 in coastal Mississippi and a slight D0 decrease in southeastern LA. Also, the coverage of moderate drought (D1) decreased across southeastern Louisiana. A small area of D0 was added to central Louisiana where 30 to 60-day precipitation deficits are increasing…
Looking Ahead
During the next five days (May 11 – 15, 2023), widespread moderate to heavy rainfall (1 to 5 inches, locally more) is forecast across the Great Plains with the heaviest amounts expected to occur from southwestern Oklahoma south to the Middle Rio Grande Valley. Lighter amounts are predicted for southeastern Nebraska, northeastern Kansas, and the Middle Mississippi Valley. Rainfall amounts are expected to vary throughout the Midwest and Southeast, while the Northeast remains mostly dry. Compared to the start of May, much drier weather is forecast for the West.
The Climate Prediction Center’s 6-10 day outlook (valid May 16-20) depicts a highly amplified pattern with anomalous mid-level high pressure over the Northwest. Therefore, large probabilities for above-normal temperatures are forecast throughout the West. Associated with a wetter pattern likely for the south-central U.S. during mid-May, below-normal temperatures are favored for the Southern Great Plains and Lower Mississippi Valley. Below-normal temperatures are also favored across the Great Lakes, Eastern Corn Belt, and Northeast, while above-normal temperatures are more likely across the Southeast. Above-normal precipitation is favored across the southern tier of the U.S. with the largest probabilities forecast for the Southwest which is typically dry during this time of year. Elevated probabilities for below-normal precipitation are forecast across the Northern to Central Great Plains, Upper to Middle Mississippi Valley, and Corn Belt.
US Drought Monitor one week change map ending May 9, 2023.
The San Juan River, below Navajo Reservoir. Photo: Brent Gardner-Smith/Aspen Journalism
From email from Reclamation (Susan Novak Behery):
May 10th, 2023
In order to begin moving sediment in advance of the spring peak release, and to slow the reservoir rise, the Bureau of Reclamation has scheduled in the release from Navajo Dam from 500 cubic feet per second (cfs) to 1200 cfs for the evening of Friday, May 12th , and from 1200 cfs to 2000 cfs on Monday, May 15th, where it will remain for much of the week. The release changes will occur as per the following schedule:5/12 (Friday)
10:00 PM: Increase from 500 to 700 cfs
5/13 (Saturday)
12:00 AM: Increase from 700 to 900 cfs
2:00 AM: Increase from 900 to 1100 cfs
4:00 AM: Increase from 1100 to 1200 cfs
5/15 (Monday)
8:00 AM: 1200 to 1400 cfs
10:00 AM: 1400 to 1600 cfs
12:00 PM: 1600 to 1800 cfs
2:00 PM: 1800 to 2000 cfs
This increase is being made in advance of the ramp up to the spring peak release, which is still scheduled to begin at the end of next week. PLEASE STAY TUNED FOR UPDATES AS THIS OPERATION IS DEPENDANT ON ON-THE-GROUND CONDITIONS AND WEATHER.If you have any questions, please contact Susan Behery (sbehery@usbr.gov or 970-385-6560), or visit Reclamation’s Navajo Dam website at https://www.usbr.gov/uc/water/crsp/cs/nvd.html
Click the link to read the article on the NOAA website (Theo Stein):
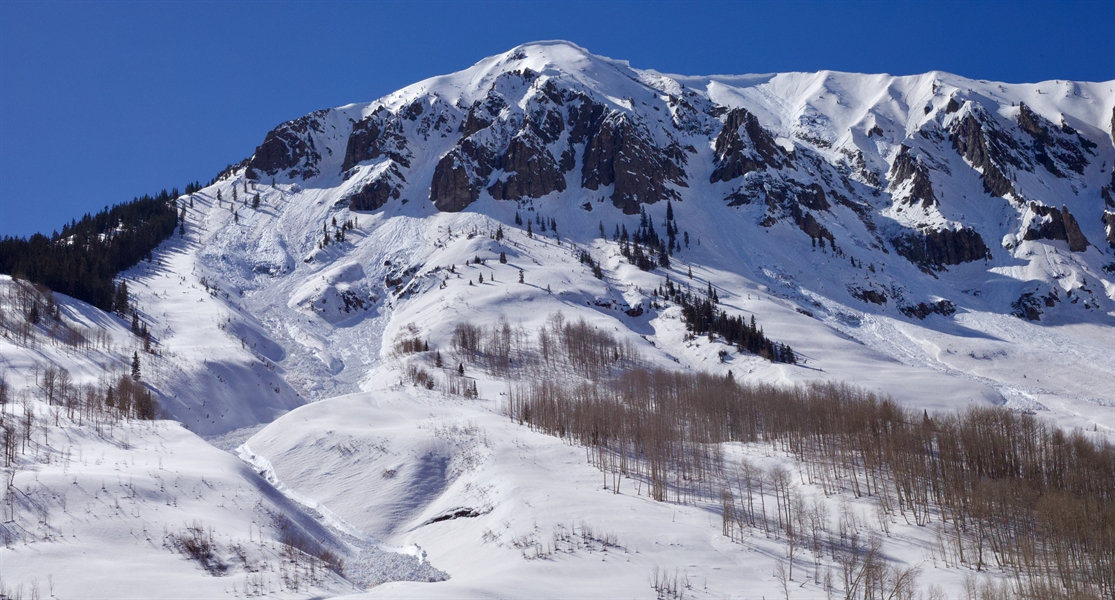
In the thrall of a 22-year megadrought, the record snowpack that built up in southwestern Colorado was a welcome break in a string of dry winters.
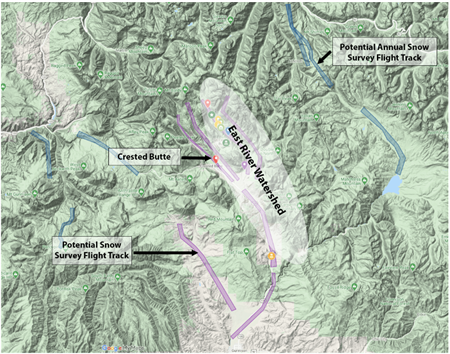
Topographic image of the Crested Butte–Gunnison region, showing the location of SPLASH surface instrumentation (colored icons) and potential NOAA snow survey flight tracks (purple). Together, the SPLASH network and airborne snow survey measurements provide a unique set of observations that can inform seasonal water supply and flood risk outlook. Credit: NOAA Physical Sciences Laboratory
For a pair of NOAA scientists, part of a team conducting an intensive two-year study of how precipitation forms in the East River watershed near Crested Butte, the softening spring snows provided just a little extra challenge for a scheduled ski and snowshoe trek into the rugged mountain valley in late April.
“Ski conditions were not great,” said Janet Intrieri, a research scientist with NOAA’s Physical Sciences Laboratory. “In the morning it was super crusty, in the afternoon it was super mashed-potato-y. But we got what we needed.”
When scientists from PSL and CIRES installed a comprehensive, state-of-the-art observing network in the East River watershed in the fall of 2021 to study how precipitation forms in the complex, high-altitude terrain, they couldn’t have imagined a year like this. As storm after storm plastered the mountains with snow this winter, the network of radars, instrumented towers, and meteorological sensors measured temperatures, precipitation amounts, soil moisture and snowpack properties. Complementing this array were two stations installed nearby by Global Monitoring Laboratory field engineers and researchers consisting of sophisticated radiometers, ceilometers, a total sky imager, a cloud optical depth sensor, and other meteorological instruments.
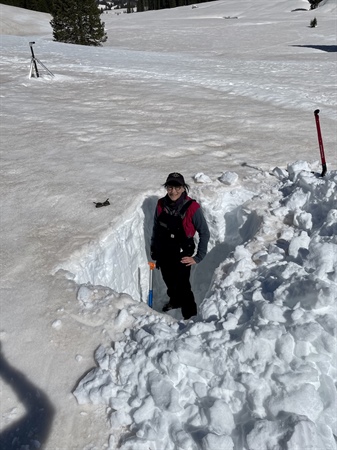
NOAA scientist Janet Intrieri pauses halfway through digging a snow pit where she and Chris Cox collected samples for analysis of dust in the snowpack. Dust on snow speeds melting. Credit: Chris Cox, NOAA Physical Sciences Laboratory
The mountains of data collected by the study, dubbed SPLASH, will be analyzed alongside data collected by an adjacent field campaign directed by the Department of Energy and Lawrence Berkeley Laboratory. The findings help improve several important NOAA models, including the Unified Forecast System, Rapid Refresh Forecast System, and National Water Model. The ultimate goal of this project will be more accurate weather and river flow forecasts in watersheds critical to the southwestern U.S. water supply.
“We’re simultaneously studying all of the aspects of the lower atmosphere and hydrometeorology that we can,” Intrieri said. “That’s kind of what the special sauce is.”
On the to-do-list that day for Intrieri and fellow PSL scientist Chris Cox was collecting bags of snow at regular intervals from the side of an eight-foot deep pit they dug. One of the layers was marked by a thin line of fine dust blown in from the red desert soils to the southwest. In spring, dust-on-snow events hasten the melt, the dynamics of which are important for water managers who rely on mountain snowpack to fill the reservoirs to understand. The snow was bagged for researchers at Purdue University to analyze.
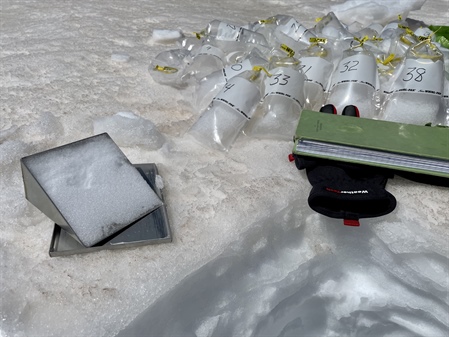
Bagged snow samples collected at a SPLASH study site in the East River watershed near Crested Butte were taken to the Rocky Mountain Biological Laboratory for analysis. Credit: Christopher Cox, NOAA Physical Sciences Laboratory
Cox said one of the main goals for this particular research station is to learn about how sunlight, temperature and the presence of dust particles influence whether snow turns to meltwater or evaporates directly into the atmosphere. Sometimes, there’s a big gap between how much water is in the snowpack and how much water ends up in reservoirs and streams.
“Improving our understanding of these physical processes will help us give water managers more accurate forecasts of how much runoff they can expect from Colorado’s snowpack each spring,” he said.
This winter’s abundance was a marked change from 2021-2022, which started off dry, peaked with a monstrous New Year’s storm known locally as the “Santa Slammer,” then quieted down through spring, resulting in an average year.
“Capturing the extremes is always great,” said Gijs deBoer, a CIRES scientist working at PSL. “That’s where a lot of action is when it comes to water supply issues.”
OAA scientist Chris Cox checks an Atmospheric Surface Flux Station, designed and built by PSL and CIRES to collect data that measures all aspects of the exchange of energy between land and atmosphere. By analyzing these measurements, researchers can gain insight into both local and regional weather and climate systems. This unit is sitting on top of two stacked picnic tables buried under the snow. Credit: Janet Intrieri, NOAA Physical Sciences Laboratory
Since 2000, waves of drought have depleted the flow of the Colorado River, relied upon by six states and 40 million people from Denver to Los Angeles, by as much as 20 percent, causing water levels in Lake Mead and Lake Powell to fall to critically low levels. Climate change is projected to further reduce flows by another 10 to 50 percent in the next few decades.
The long-term drought has forced the six basin states to wrestle with the realization that there’s simply not enough water in the Colorado River system to satisfy all uses, which adds a sharp urgency to efforts to improve precipitation estimation and runoff forecasts.
For now, meltwaters are rushing off the surrounding West Elk mountains into the East River Valley, replenishing – for this year at least – soils and streams, and promising scientists a bounty of data to examine.
“It’s stunningly beautiful back there, and we picked a great weather window,” Intrieri said. “Great conditions, we got what we needed: thumbs up all around.”
For more information, contact Theo Stein, NOAA Communications, at theo.stein@noaa.gov.
Colorado lawmakers approved seven major new water bills this year, including one that approves millions in more funding for the Colorado Water Plan, another that makes restoring streams easier, and a third that creates a high-profile Colorado River task force.
The 2023 General Assembly, which adjourned May 8, also approved four others that address water wise landscaping, water use in oil fields, “don’t flush” labels for the disposable wipes that plague water systems, and one giving more muscle to an interim legislative committee whose job is to evaluate water problems and propose laws to fix them.
Two of the bills, the labeling requirement, as well as the legislative committee changes, have been signed into law by Gov. Jared Polis. The five remaining bills await his signature.
Funding Water Projects
Each year the Colorado General Assembly considers the Colorado Water Conservation Board (CWCB) “projects bill,” which this year—Senate Bill 177—appropriates $95 million from three sources: CWCB’s construction fund, severance taxes on oil and gas production, and sports betting revenue. No general fund tax dollars are used. An important part of the funding goes to support grants for projects that help implement the state water plan.
A major difference in this year’s bill is the amount of money coming from sports betting. Last year’s bill appropriated $8.2 million from that source, the first time since the passage of Proposition DD in 2019, which legalized sports betting and authorized the state to collect up to $29 million in taxes on gambling proceeds, with over 90% of that going for water. SB 177 triples that amount, appropriating $25.2 million to fund projects that help implement the state water plan. Sen. Dylan Roberts, D-Avon, a bill sponsor, noted that sports betting revenue provides critical funding “that never existed before for water.” As he pointed out, “that number keeps growing every year which is positive for our water future.”
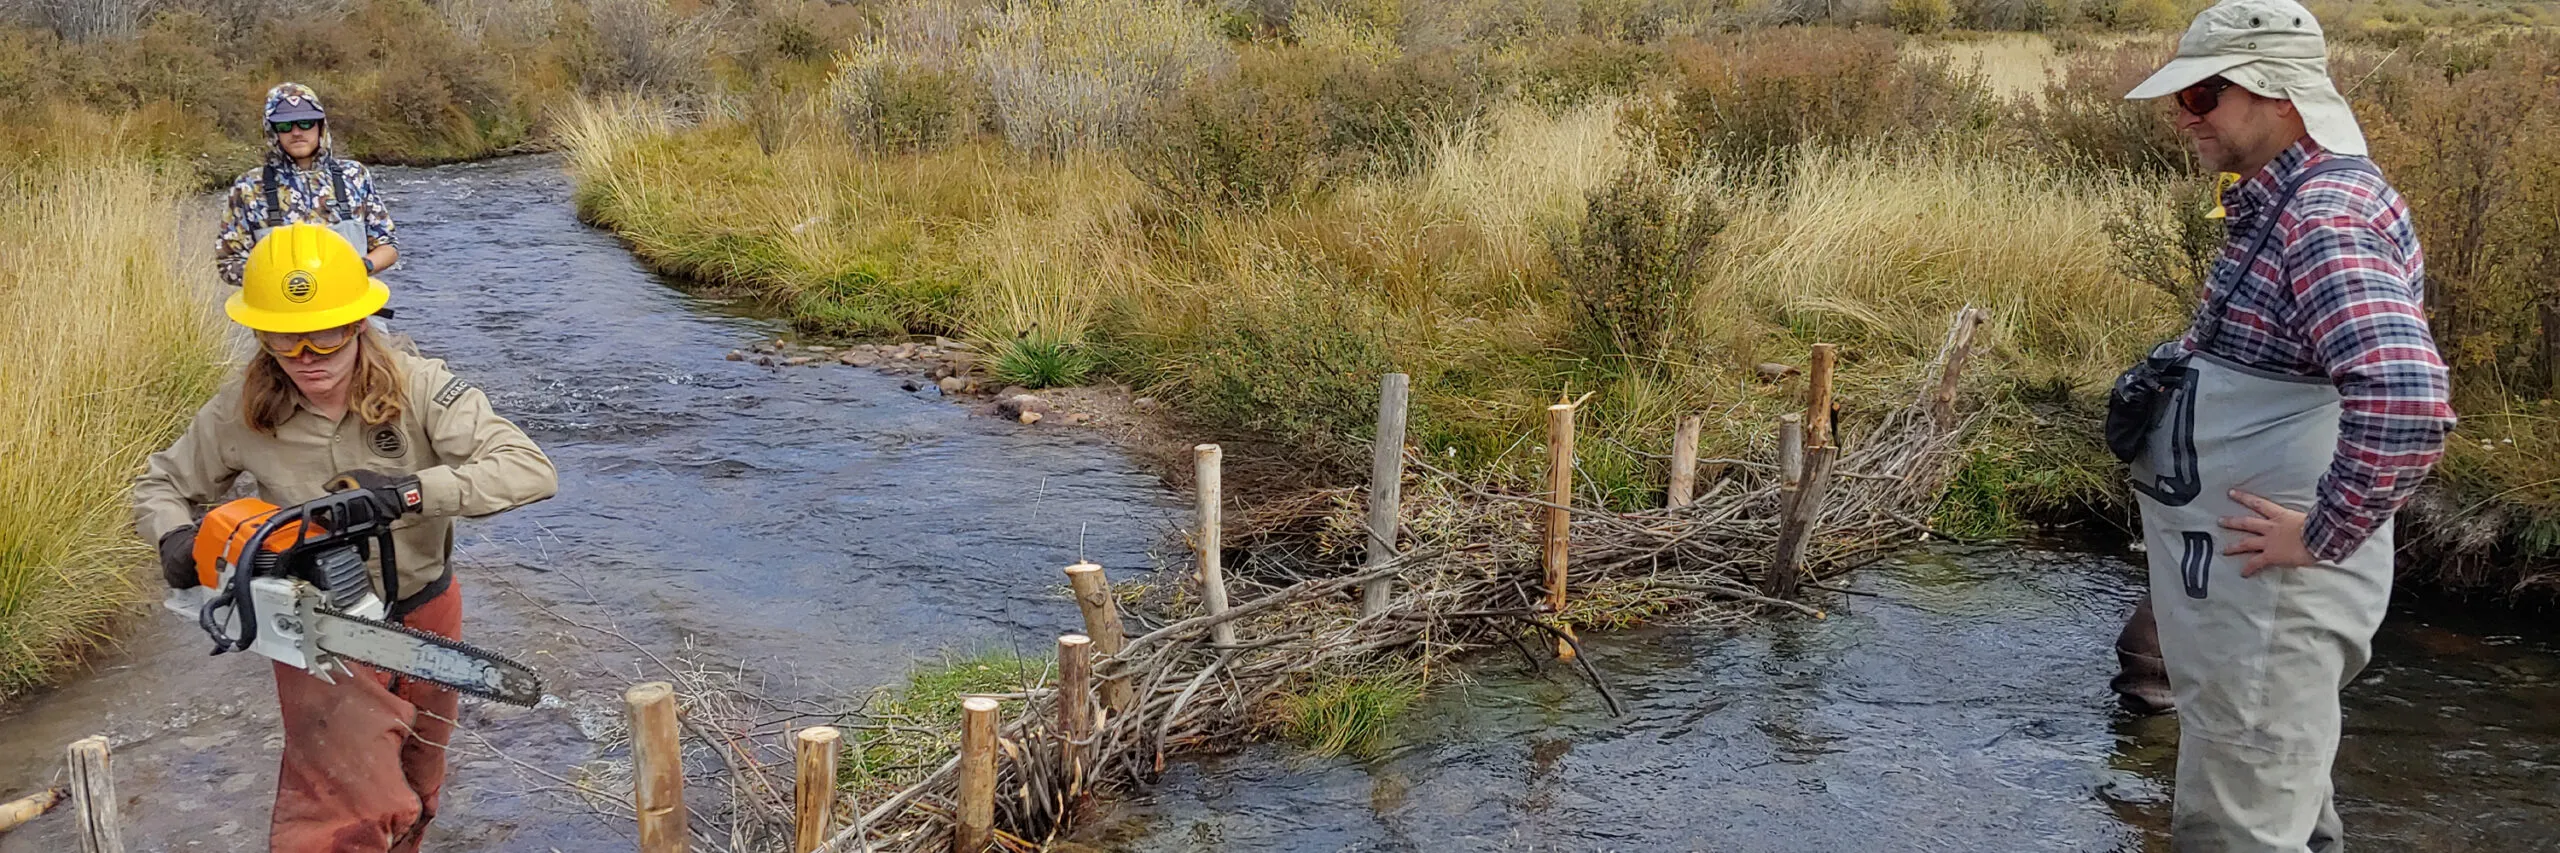
Construction of Beaver Dam analogue Photo courtesy of the Rio Grande Headwaters Restoration Project.
Stream Restoration
Senate Bill 270 allows minor stream restoration activities to proceed without having to secure a water right. Its intent is to promote the benefits natural stream systems provide—clean water, forest and watershed health, riparian and aquatic habitat protection—by mitigating damages caused by mining, erosion, flooding and wildfires. Minor stream restoration activities include stabilizing stream banks and beds, installing porous structures that slow down water flow and temporarily increase surface water area, and rechanneling streams to recover from wildfire and flood impacts.
At the bill’s initial hearing in the Senate Agriculture & Natural Resources Committee, Sen. Roberts, committee chair and a bill cosponsor, emphasized that stream restoration activities “help promote recovery from natural disasters like fires and floods.” He also noted the bill could “help access federal dollars that are available in sort of a once-in-a-lifetime opportunity right now that could be used for these very valuable projects.”
Another bill cosponsor, Sen. Cleave Simpson, R-Alamosa, a water right holder and water conservation district manager, recognized “the value and importance of healthy rivers and streams and what it means to all water users.”
As introduced, SB 270 would have created a “rebuttable presumption” that a stream restoration project does not cause material injury to a vested water right. It was amended in committee after testimony by several witnesses who expressed concern over the bill’s potential impacts on water rights—loss of water due to evaporation and infiltration into soils, and delayed timing of delivery downstream. They all expressed support for the concept of stream restoration and with the amendments adopted, pledged to work together in the future to strike a balance between stream restoration benefits and protecting water rights.
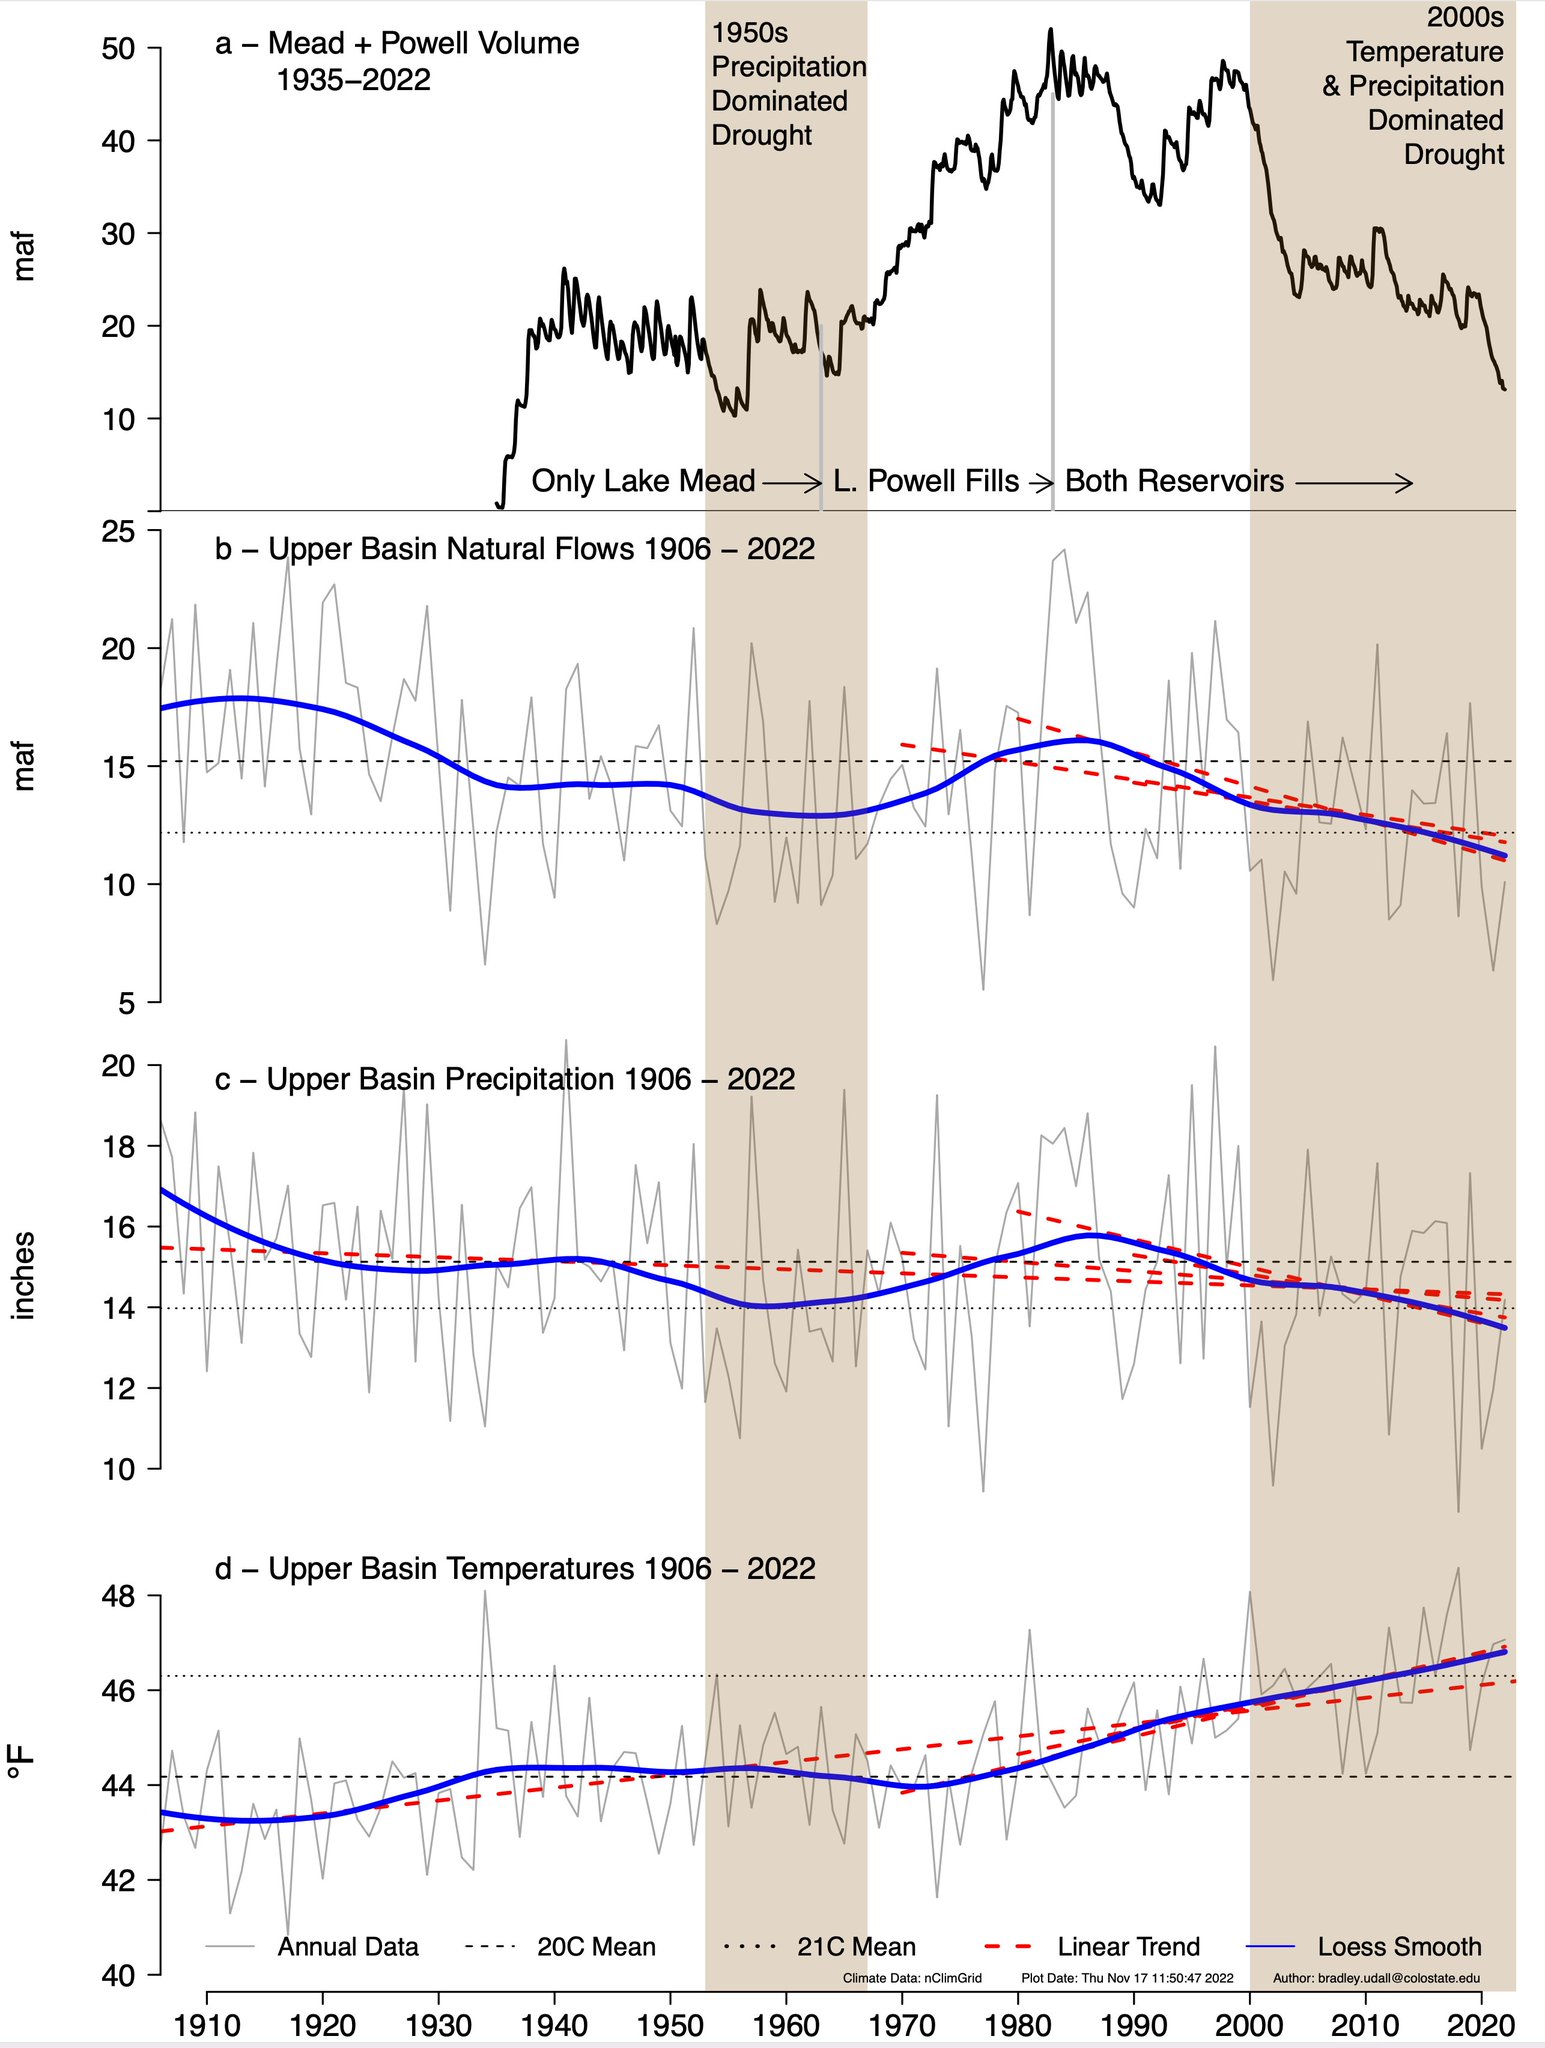
Updated Colorado River 4-Panel plot thru Water Year 2022 showing reservoirs, flows, temperatures and precipitation. All trends are in the wrong direction. Since original 2017 plot, conditions have deteriorated significantly. Brad Udall via Twitter: https://twitter.com/bradudall/status/1593316262041436160
Colorado River Drought Task Force
Faced with two decades of drought in the Colorado River Basin, Senate Bill 295 creates a task force to make legislative recommendations that will help water users most directly affected by drought and aid the state in meeting its commitments under the Colorado River Compact. The task force’s focus is on reducing water demand and on ensuring that any effort to achieve that goal by fallowing irrigated farmland must be done on a voluntary, temporary and compensated basis.
The task force is made up of 17 voting members representing agricultural, municipal, industrial, conservation, environmental and tribal stakeholders from across the state, with the state engineer serving in an advisory capacity. It includes a sub-task force to study and make recommendations on tribal matters comprised of five members, including representatives from the Southern Ute Indian Tribe and the Ute Mountain Ute Tribe. The task force and sub-task force must report any recommendations, which are to be made by majority vote, to the General Assembly’s Water Resources and Agriculture Review Committee by Dec. 15, 2023.
Testimony in the Senate Agriculture & Natural Resources Committee raised concern with the bill’s timing. Several Front Range municipal water providers said the state’s primary focus should be on supporting federal efforts to force lower basin states—primarily California and Arizona—to reduce their river use since they have consistently exceeded their compact allocations while the Upper Basin states have never fully utilized theirs. Sen. Roberts, the bill’s sponsor, acknowledged that but emphasized “There is drought happening in Colorado right now … The purpose of the task force isn’t just to consider interstate obligations, it’s also to make recommendations surrounding drought mitigation and drought security.”
Others worried that the bill might split the state’s West Slope and East Slope water users, but lawmakers pledged the task force would seek cooperative solutions. “This bill is going to codify a collaborative path forward on some difficult issues facing the Western Slope and the entire state,” said Rep. Marc Catlin, R-Montrose.
This home is part of the City of Aurora’s water-wise landscape rebate program. Aurora City Council last month passed an ordinance that prohibits turf for aesthetic purposes in all new development and redevelopment, and front yards. Photo credit: The City of Aurora
Water-Wise Landscaping
Senate Bill 178 is designed to reduce barriers to residents in homeowner association (HOA)-governed communities (roughly half the state’s population) who want to plant landscapes that use less water than bluegrass lawns. To encourage HOAs and owners of single-family detached homes to work together in planting landscapes that conserve water, improve biodiversity, and expand the amount of food grown in private gardens, SB 178 requires HOAs to adopt three pre-planned water-wise landscape designs that homeowners can install if they want to replace non-native turf. It doesn’t preclude other designs with HOA approval. Although the bill removes some aesthetic discretion, HOAs retain the authority to reject designs for safety, fire or drainage concerns.
Water Conservation in Oil and Gas Operations
House Bill 1242 seeks to reduce freshwater use in oil and gas operations and increase recycling and reuse of produced water, which is water in or injected into the ground and coproduced with oil or natural gas extraction. It is often disposed off-site but can be recycled and reused if properly treated.
The bill requires oil and gas well operators to report periodically to the Colorado Oil and Gas Conservation Commission on the volume of freshwater and recycled or reused produced water used, produced water removed for disposal, and produced water recycled or reused in another well and removed for recycling or reuse at a different location. The commission will use this data in adopting rules by July 1, 2024 to require a statewide reduction in freshwater use and a corresponding increase in recycled or reused produced water in oil and gas operations.
The bill also creates the Colorado Produced Water Consortium in the Department of Natural Resources to make recommendations to the General Assembly and state agencies by Nov. 1, 2024 on legislation or rules necessary to remove barriers to recycling and reuse of produced water. The consortium consists of 28 members that will work with state and federal agencies, research institutions, colleges and universities, non-government organizations, local governments, industries, environmental justice organizations and members of disproportionately impacted communities in conducting its work and making recommendations.
Disposable Wipes and Water Quality
Aimed at reducing sewer backups and water pollution in Colorado, Senate Bill 150 requires a manufacturer of disposable wipes sold or offered for sale in the state, and a wholesaler, supplier or retailor responsible for labeling or packaging those products to label them “Do Not Flush.” Disposable wipes include baby, cleaning and hand sanitizing wipes made of materials that do not break down like toilet paper when flushed. They end up clogging pipes and releasing plastics into waterways, costing water utilities a lot of money to fix.
Water Resources and Agriculture Review Committee
Senate Bill 10 turns the interim Water Resources and Agriculture Review Committee into a year-round committee. The committee will meet at the call of the chair, conduct hearings and vet issues as they come up instead of having to wait until after each session adjourns. It will not duplicate the functions of existing standing committees, but will continue to recommend bills to the Legislative Council, which will refer them to relevant committees for action.
Larry Morandi was formerly director of State Policy Research with the National Conference of State Legislatures in Denver, and is a frequent contributor to Fresh Water News. He can be reached at larrymorandi@comcast.net.


