Fridays on the Farm: Brewing Success with Farm Loans — Farmers.gov

Click the link to read the release on the USDA website (Elizabeth Thomas):

December 8, 2023

This Friday meet Audrey Gehlhausen and Chris Dellabianca of Billy Goat Hop Farm LLC, located in Montrose, Colorado. Chris and Audrey’s passion for the industry started while working in different microbreweries in Idaho, and they eventually decided to start the process of owning an operation to grow hops. This operation is a dream come true for these beginning farmers, and it was made possible with hard work, determination, and a beginning farmer loan from USDA’sĀ Farm Service AgencyĀ (FSA).

Billy Goat Hop Farm is a dream come true for beginning farmers Audrey Gehlhausen and Chris Dellabianca. Photo courtesy of Billy Goat Hop Farm LLC.

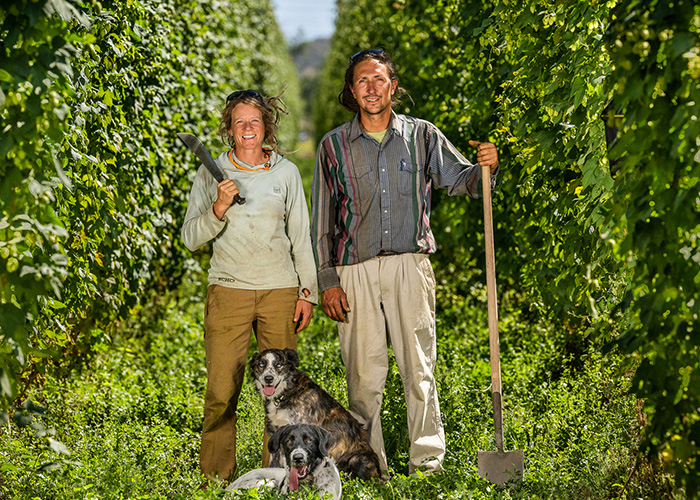
Chris found an internship with an 800-acre Idaho hop farm where he experienced all the aspects of the job throughout a full hop season. After the season, Chris and Audrey packed up their life to go on a road trip across five states to learn more and find the right land to start their own operation, eventually planting roots in Montrose in 2017.

Settling Down in Colorado

ā€œWe really enjoyed the craft brew scene, the people we were around, and the outdoors,ā€ Audrey said. The town’s access to outdoor activities and agricultural resources like local cooperatives, irrigation companies, and a localĀ USDA Service CenterĀ made Montrose a great fit.

Local resources and outdoor activities made Montrose a great fit for Chris and Audrey’s operation. Photo courtesy of Billy Goat Hop Farm LLC.

Once settled in Colorado, Audrey and Chris reached out to their local FSA office to apply for a farm ownership loan to purchase their land.

Farm ownership loans can be used to purchase or expand a farm or ranch. This loan can help with paying closing costs, constructing or improving buildings on the farm, or to help conserve and protect soil and water resources.

ā€œWe would not have done this if that didn’t exist and that opportunity was not there,ā€ Audrey said. ā€œI don’t think we would have even gone on the road trip looking at properties without the FSA loan. We were really starting at ground zero for everything and a [traditional] bank isn’t going to loan you that kind of money.ā€

Once settled in Colorado, Audrey and Chris reached out to their local FSA office to apply for a farm ownership loan to purchase their land. Photo courtesy of Billy Goat Hop Farm LLC.

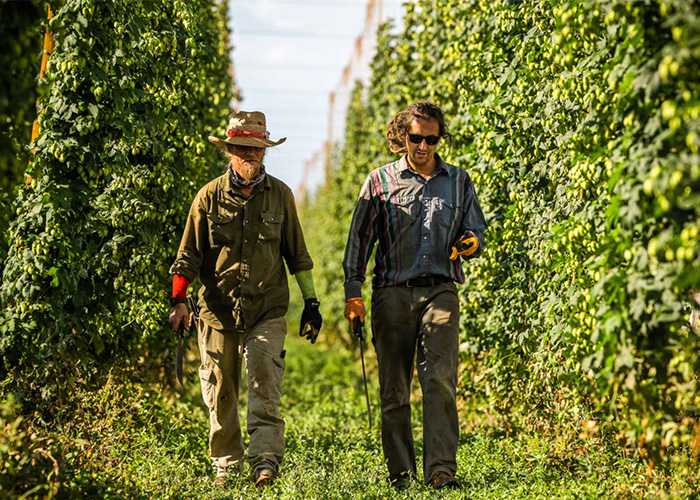
Once the land was purchased, Audrey and Chris utilized FSA’s operating loans to establish the stand of hops and to purchase farm equipment for harvesting, drying and baling. Operating loans help producers start, maintain, and strengthen a farm or ranch.

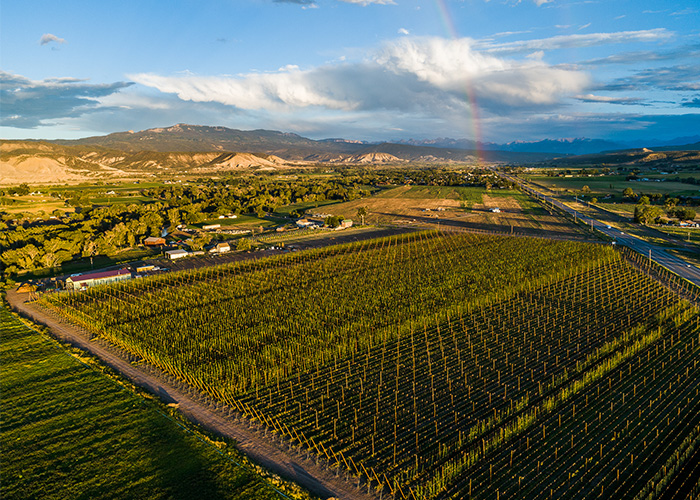
Billy Goat Hop Farm sits on 32-acres where they produce hops and brew beer, in addition to offering brews from other farms. They are currently partnered with eight local breweries on the eastern slope of Colorado and sell microbrews to over 120 different breweries across the United States.

Growing for the Future

Audrey and Chris recently received the prestigious Cascade Cup Award, judged by the Hop Quality Group. They submitted their sample and won first place, being the first ever to win outside of Washington or Oregon, the largest hop producing states in the country.

Outside of their success, Audrey and Chris are passionate about bringing awareness to communities about agriculture and the smaller producers.

FSA’s operating loans helped establish the stand of hops and to purchase farm equipment for harvesting, drying, and baling. Billy Goat Hop Farm

FSA’s operating loans helped establish the stand of hops and to purchase farm equipment for harvesting, drying, and baling. Billy Goat Hop Farm

ā€œ[People] have gotten used to looking for local products and that’s normal,ā€ Audrey said. ā€œWhen you go to a local craft brewery, you are looking at supporting the local brewery, but you aren’t necessarily thinking where the ingredients come from.ā€

Audrey and Chris don’t plan to slow down any time soon. They have high hopes for the future and have set goals of selling out their hops before the next harvest and building a client base that cares.

More Information

Visit local farms, ranches, forests, and resource areas through our Fridays on the Farm stories. Meet farmers, producers, and landowners who are working to improve their operations with USDA programs.

USDA offers a variety of risk management, disaster assistance, loan, and conservation programs to help producers weather ups and downs in the market and recover from natural disasters as well as invest in improvements to their operations. Learn about additional programs.

For more information about USDA programs and services, contact your local USDA service center.

Elizabeth Thomas is the communications coordinator for FSA in Colorado.

Assessing the U.S. #Climate in November 2023 — NOAA

Click the link to read the article on the NOAA website:

Record-warm seas fuel active Atlantic hurricane season and a lake-effect snowfall buries portions of the Northeast in more than three feet of snow

Key Points:

  • Record- warm sea surface temperatures in the Atlantic basin brought 20 named tropical systems during 2023, ranking fourth for the most named storms in a year since 1950. Three of these storms made landfall—Hurricane Idalia and tropical storms Harold and Ophelia.
  • The first significant lake-effect snowstorm of the season occurred on November 27–29, bringing snow accumulations of greater than 40 inches to portions of New York state.
  • Year-to-date temperatures across the eastern U.S. have been warmer than average in 2023 with 31 states experiencing a top-10 warmest January–November.
  • Although no new events were identified in November, a total ofĀ 25 separate billion-dollar weather and climate disastersĀ have been confirmed this year—the most events on record during a calendar year. The total cost of these events exceeds $81.0 billion.
  • November 2023 was the 19th-warmest November on record for the nation, and precipitation ranked 12th driest in the historical record for the month.

Other Highlights

Temperature

The average temperature of the contiguous U.S. in November was 44.4°F, 2.7°F above average, ranking 19th warmest in the 129-year record. Generally, November temperatures were above average across much of the contiguous U.S., while below-normal temperatures were observed in parts of the Northeast. No state ranked among their top-10 warmest or coldest November on record.

The Alaska statewide November temperature was 20.3°F, 8.6°F above the long-term average, ranking fourth warmest in the 99-year period of record for the state. Above-normal temperatures were observed across the entire state during the month.

The meteorological autumn (September–November) average temperature for the contiguous U.S. was 56.1°F, 2.5°F above average, ranking sixth warmest on record. Temperatures were above average across most of the contiguous U.S., with record-warm temperatures observed in parts of New Mexico, western Texas and northern Maine. New Mexico and Texas each ranked third warmest on record, while Maine ranked fourth warmest for this autumn season. An additional 10 states ranked among their top-10 warmest on record for this period.

The Alaska autumn temperature was 29.6°F, 3.7°F above the long-term average, ranking 13th warmest on the record for the state. Temperatures were above average across most of the state of Alaska while some parts of south-central Alaska saw near-average autumn temperatures.

For January–November, the average contiguous U.S. temperature was 55.8°F, 2.0°F above average, ranking 10th warmest on record for this period. Temperatures were above average from parts of the Southwest to the East Coast and along much of the Northern Tier, with near- to below-average temperatures from the central Rockies to California and in parts of the northern and central Plains. Texas, Louisiana and Mississippi each ranked warmest on record while Massachusetts, Connecticut and Florida each ranked second warmest for the January–November period. An additional 25 states had a top-10 warmest year-to-date period. No state experienced a top-10 coldest January–November.

The Alaska January–November temperature was 30.5°F, 2.5°F above the long-term average, ranking 18th warmest in the historical record for the state. Much of the state was above normal for the 11-month period while temperatures were near average across small parts of western and interior parts of the state.

Precipitation

November precipitation for the contiguous U.S. was 1.38 inches, 0.85 inch below average, ranking 12th driest in the historical record. Precipitation was near to below average across most of the contiguous U.S., while above-normal precipitation was observed in parts of southern California, the Rockies, central and southern Plains and Southeast. No state ranked in their top-10 wettest November on record for this period. On the dry side, Indiana ranked third driest on record for the month, while four additional states in the Midwest ranked among their top-10 driest November on record.

Across the state of Alaska, the average monthly precipitation was 4.62 inches, ranking as the 16th- wettest November in the historical record. Precipitation was above average in parts of the North Slope, Interior and along parts of the Gulf of Alaska, while precipitation was near normal across much of the West Coast and in parts of the Southwest, northeast Interior and Panhandle. Below-normal precipitation was observed in the parts of the Aleutians during the month.

The U.S. autumn precipitation total was 5.66 inches, 1.22 inch below average, ranking 15th driest in the September–November record. Precipitation was below average across much of the eastern half of the U.S., the Southwest, California and in parts of the Northwest and central Plains. Autumn precipitation was above average from the northern Rockies to the western Great Lakes and in parts of the Great Basin, southern Plains, Northeast and Southeast. Tennessee ranked third driest with three additional states in the Mississippi and Ohio Valleys ranking among their top-10 driest autumn season on record. No state ranked in their top-10 wettest on record for the September–November period.  

For autumn season precipitation, Alaska ranked in the wettest third of the record with wetter-than-average conditions observed across much of the state. Near-normal precipitation was observed in parts of the Interior and south Central Alaska, while below-normal precipitation occurred in parts of the Southwest and Aleutians during this season.

The January–November precipitation total for the contiguous U.S. was 26.89 inches, 0.70 inch below average, ranking in the driest third of the 129-year record. Precipitation was near to above average across much of the Northeast, from the northern Plains to the West Coast, as well as in parts of the central and southern Plains, northern Great Lakes, Lower Mississippi Valley and Southeast. Wyoming ranked seventh wettest on record, while four additional states ranked among their top-10 wettest for this year-to-date period. Conversely, precipitation was below average from parts of the Southwest to the Gulf of Mexico and in parts of the Northwest, upper and central Mississippi Valley and Mid-Atlantic during the January–November period. Louisiana and Maryland ranked seventh and eighth driest on record, respectively, for this 11-month period.

The January–November precipitation ranked ninth wettest in the 99-year record for Alaska, with above-average precipitation observed across most of the state. Near-normal precipitation was observed in parts of the Southwest, while parts of the Aleutians experienced below-average precipitation during this period.

Other Notable Events

Persistent heat brought above-normal temperatures to much of the U.S. during 2023. Approximately 32 million people were impacted by record heat during the January–November period.

By November 21, more than 39 inches of snow accumulated in Anchorage, Alaska, with this November becoming the snowiest November since record-keeping began in 1953—the previous record was 38.8 inches set in 1994.

Much of the country observed temperatures 10–20°F below average during the late part of November. On the morning of November 29, record-low temperatures occurred over parts of the eastern U.S.

A Kona Low brought heavy rains and flooding to parts of the Hawaiian Islands during late November. Parts of the Big Island received up to 7 inches of rain while higher elevations reported up to 5 inches of snow.

Drought

According to the November 28 U.S. Drought Monitor report, about 36.1% of the contiguous U.S. was in drought, down about 0.4% from the end of October. Moderate to exceptional drought was widespread across much of the Lower Mississippi Valley to the Tennessee Valley, central Great Plains and Southwest, with moderate to extreme drought across parts of the southern Great Plains, Hawaii and in parts of the Florida Peninsula. Moderate to severe drought was present in parts of the Northwest, Mid-Atlantic and New York, as well as moderate drought in parts of the Great Lakes and Puerto Rico.

Drought conditions expanded or intensified across much of the central Mississippi and Ohio valleys, and in parts of the Southwest, central plains, Southeast, Mid-Atlantic, Northeast and Hawaii this month. Drought contracted or was reduced in intensity across much of the Northwest and southern Plains, and in portions of the Southeast, Great Lakes and Puerto Rico.

Monthly Outlook

According to the November 30 One-Month Outlook from the Climate Prediction Center, above-normal monthly average temperatures are favored for much of the contiguous U.S. and parts of northern Alaska in December, with the greatest odds across parts of the Mississippi River Valley. Below-normal temperatures are most likely for parts of Southwest Alaska this month. Much of the Pacific Northwest and parts of the central and southern Plains to the East Coast, as well as eastern Alaska are favored to see above-normal monthly total precipitation while below-normal precipitation is most likely to occur for parts of North Dakota to northern Michigan. Drought improvement or removal is forecast along parts of the Pacific Northwest coast, for parts of the central and southern Plains, Hawaii, and in parts of the Southeast and Mid-Atlantic. Persistence is more likely across much of the Northern Tier, Southwest and upper Midwest.

According to the One-Month Outlook issued on December 1 from the National Interagency Fire Center, the islands of Hawaii have above-normal significant wildland fire potential during the month of December.

This monthly summary from NOAA’s National Centers for Environmental Information is part of the suite of climate services NOAA provides to government, business, academia and the public to support informed decision-making. For more detailed climate information, check out our comprehensive November 2023 U.S. Climate Report scheduled for release on December 13, 2023. For additional information on the statistics provided here, visit the Climate at a Glance and National Maps webpages.

ā€˜So Far, So Good’ for the #ColoradoRiver Watershed in 2023 — Jack Schmidt (Center for Colorado River Studies) #COriver #aridification #CRWUA2023

“New plot using the nClimGrid data, which is a better source than PRISM for long-term trends. Of course, the combined reservoir contents increase from last year, but the increase is less than 2011 and looks puny compared to the ā€˜hole’ in the reservoirs. The blue Loess lines subtly change. Last year those lines ended pointing downwards. This year they end flat-ish. 2023 temps were still above the 20th century average, although close. Another interesting aspect is that the 20C Mean and 21C Mean lines on the individual plots really don’t change much. Finally, the 2023 Natural Flows are almost exactly equal to 2019. (17.678 maf vs 17.672 maf). For all the hoopla about how this was record-setting year, the fact is that this year was significantly less than 2011 (20.159 maf) and no different than 2019” — Brad Udall

Click the link to read the article on the Utah State University website (Jack Schmidt):

December 7, 2023

In Summary

By the end of November 2023, storage in the reservoirs of the Colorado River watershed had been reduced 1.73 million acre feet from the high of mid-July. We’ve used 21% of the gains from the exceptional 2023 runoff, a drawdown slower in the annual cycle than in it has been in all but one year of the previous decade. New policies to reduce basin-wide consumptive use may be working. To date, about one-third of losses were from Lake Powell and Lake Mead, one third from CRSP reservoirs upstream from Lake Powell, and one-third from other Upper Basin reservoirs. Losses in the combined storage in Lake Powell and Lake Mead specifically have been much less than in previous years.

Farview Reservoir Mesa Verde NP

Reservoirs are the ultimate buffer between water use and a water crisis, especially during extreme dry spells, such as occurred in 2002-04 and 2020-22. Although the runoff in 2002-04 was worse than the later event, the later one caused relatively more alarm, as reservoir storage was already low. Then the exceptional water year in 2023 provided the second largest runoff of the 21stĀ century and restored some lost storage in the reservoirs. We still have a long way to go to return the reservoir system to full conditions (see blog post,Ā Water Year 2023 in Context: a cautionary tale). There is an imperative to retain as much of the 2023 runoff as possible to create a buffer, especially if another dry spell occurs.

During the 1983 Colorado River flood, described by some as an example of a “black swan” event, sheets of plywood (visible just above the steel barrier) were installed to prevent Glen Canyon Dam from overflowing. Source: Bureau of Reclamation
Some Context

The last time the basin’s reservoirs were completely full (in fact, a bit overfull) on July 15, 1983, they held 63.6 million acre feet (af) of water, as reported in Reclamation’s basin-wide reservoir database. Today, the maximum capacity of the reservoir system is a bit extended, due to completion of few new reservoirs (e.g., McPhee and Nighthorse). Reclamation’s database, although quite complete, and reporting the status of 42 reservoirs, does not include every reservoir in the basin (for example, Wolford Mountain, Stagecoach, and Elkhead reservoirs). The data as it stands is still useful for assessing the present condition of basin reservoir storage.

During the 21st century, 60-80% of all reservoir storage (not including storage on Lower Basin tributaries) has been in Lake Powell and Lake Mead, the two largest reservoirs in the United States. Further downstream on the mainstem river, 4-8% of the basin’s storage occurs in Lake Mohave and Lake Havasu. These reservoirs are typically maintained near full pool. Lake Havasu is operated to provide a stable pumping forebay for California’s Colorado River Aqueduct and for the Central Arizona Project, and Lake Mohave is operated to maximize hydroelectric power generation and to reregulate releases from Lake Mead. These four reservoirs – from Lake Powell to Lake Havasu — store water to meet the needs of the Lower Basin and Mexico. Because there are no significant withdrawals from Lake Powell or in the Grand Canyon, Lake Powell and Lake Mead can be considered one integrated reservoir unit, even though the reservoirs are in the Upper Basin and Lower Basin, respectively. The reservoirs upstream from Lake Powell provide storage for Upper Basin agriculture and trans-basin diversions and account for 16-32% of the total storage in the watershed.

The amount of water in a reservoir is a result of the difference between the amount of water that flows in, and the amount released downstream, as well as the amount that evaporates or seeps into the regional ground water. For ease of writing, ā€œlossā€ here means the amount of reservoir storage decline—loss results from changes in reservoir inflows, reservoir releases, and evaporation.

How are we doing this year?

Conditions this year are ā€œso far, so good.ā€ Between July 13, 2023, when total storage reached its maximum — 29.7 million af — and November 30, 2023, storage declined by 1.73 million af (Fig. 1). The total gain in storage that occurred from the 2023 snowmelt runoff was 8.38 million af. We have now lost 21% of that original gain. Losses between mid-July and November 30 were only 68,000 af greater than the total losses between mid-July and October 31 (see blog post, Protecting Reservoir Storage Gains from Water Year 2023: how are we doing?), and 79% of the total reservoir storage gained in the 2023 runoff season remains.  

Since mid-July, the loss in storage has occurred in three places:

  • Total storage in Lake Mead and Lake Powell between mid-July and November 30 has declined by 540,000 af;
  • Total storage in other Upper Basin reservoirs of the Colorado River Storage Project (Blue Mesa, Morrow Point, Crystal, Fontenelle, Flaming Gorge, Navajo) during the same period declined by 500,000 af; and,
  • Total storage in other Upper Basin reservoirs, such as Granby, Dillon, McPhee, Strawberry, Starvation, and Nighthorse, declined by 620,000 af.

The rate of loss this year is much lower than in any other of the previous ten years (except for 2014 when there were large monsoon season inflows), suggesting that current policies of reducing consumptive use may be working. I calculated the loss in each of the last ten years, beginning on the day of maximum basin storage (Fig. 2). Each curve in this graph represents the loss in storage from the peak of each year. For example, on November 20, 2020, reservoir storage was 4.42 million af less than the peak storage that had occurred on June 18, 2020. In contrast, storage on November 30, 2023, was only 1.73 maf less than the peak storage that occurred on July 17, 2023.

Figure 2. Graph showing loss in basin-wide storage from the maximum storage of each year. Note that the losses in 2023 have been less than in any other year except 2014. Credit: Jack Schmidt

Management policy concerning where storage is retained and where storage is reduced appears to be in transition. In contrast to previous years, storage in Lake Powell and Lake Mead is being reduced very slowly (Fig. 3). Today, storage in these two reservoirs is only 544,000 af less than the mid-July peak, whereas storage in these reservoirs in 2020 was 2.85 million af less than the maximum storage of that year.

Figure 3. Graph showing loss in the combined contents of Lake Powell and Lake Mead from the maximum storage in each year. Note that the losses in 2023 have been less than in any other year, indicating that the combined water storage in Lake Powell and Lake Mead remains relatively high. Credit: Jack Schmidt

Next week, Colorado River water users and managers will gather for the 2023 Colorado River Water Users Association meeting in Las Vegas. The river’s stakeholders are in the midst of negotiating new agreements on how to share the pain of water shortage during the ongoing Millennium Drought, and there is significant interest centered on this event.

Although we ought to feel good about our collective effort to retain desperately needed storage, we must remain vigilant to continue the hard work to reduce consumptive use. Today’s total watershed reservoir storage of 28.0 million af is the same as it was in early May 2021 in the middle of the 2020-2022 dry period (Fig. 4). Let’s hope for a good 2023/2024 winter and spring snowmelt.

Figure 4. Graph showing reservoir storage in the 21st century in three parts of the watershed, as well as the total storage. Note that conditions on 30 November 2023, at the far right hand side of the graph, are similar to conditions in early May 2021 and less than during most of the 21st century. Credit: Jack Schmidt

Acknowledgment: Helpful suggestions to a previous draft were provided by Eric Kuhn.

Power of Progress – 2023 Annual Report — The Sonoran Institute

Download the report here.

Click the link to read the release on the Sonoran Institute website.

As we near the end of another impactful year, we are delighted to present our 2023 Annual Report, titled ā€œPower of Progress.ā€ This report embodies our focus on delivering results with a commitment to diverse and equitable outcomes for communities across the North American West.

Inside our 2023 Annual Report, you’ll learn how our more than two decades of work restoring and reconnecting communities to the Colorado River Delta is now a proposed state park that protect as much as 85,000 acres from the U.S.-Mexico border to the Upper Gulf of California for generations to come. Our $4.3 million partnership with California Water Boards promises to reshape the lives of more than 200,000 people in Mexicali and Calexico and improve water quality in the New River. Our award- winning program Growing Water Smart has expanded from Colorado and Arizona into California and along the U.S.-Mexico border to provide tools for the Colorado River communities to address the worst drought in modern history. Our One Basin initiative has assessed the water needs of 19 Tribal Nations, setting the stage for accessing much-needed capacity building partnerships. The Santa Cruz River Program’s three decades of restoration have revitalized the river, drawing diverse communities to a thriving ecosystem. In Tucson, volunteers collected 11,000 pounds of trash during river cleanups, turning these events into vibrant community celebrations.

Your support has been instrumental in these accomplishments. As the year ends, consider making a meaningful year-end gift to continue powering our progress and inspiring positive change.

Thank you for being a part of the Sonoran Institute’s journey and mission.

Biden-Harris Administration Announces $72 Million from Investing in America Agenda to Restore the #SaltonSea #ColoradoRiver #COriver #aridification

The Salton Sea is shallow saline lake located near Palm Springs, CA. Photo credit: USBR

Click the link to read the article on the Reclamation website:

December 7, 2023

The Biden-Harris administration today announced $72 million from President Biden’s Investing in America agenda to accelerate restoration of the Salton Sea, California’s largest lake. The funding will expedite implementation of the state’s 10-year Salton Sea Management Plan by accelerating dust suppression, aquatic-restoration, and water conservation efforts needed to protect the important wildlife habitats and the surrounding communities.

Acting Deputy Secretary of the Interior Laura Daniel-Davis and Bureau of Reclamation Commissioner Camille Calimlim Touton announced the agreements during an event with leaders from the California Natural Resources Agency, Torres Martinez Desert Cahuilla Indians and other members of the Salton Sea Coordinating Committee.

ā€œThe Biden-Harris administration is committed to bringing every tool and resource to bear to help manage the drought crisis and provide a sustainable water system for families, businesses and our vast and fragile ecosystems,ā€ said Acting Deputy Secretary Laura Daniel-Davis. ā€œAs we seek to stem the impacts of the drought crisis on wildlife, habitats and communities, historic investments from President Biden’s Investing in America agenda are helping to support the Imperial and Coachella Valley and the environment around the Salton Sea.ā€

ā€œThis funding is a critical step in our collective efforts to address the challenges at the Salton Sea and our important partnership with the State of California, the Imperial Irrigation District and the Coachella Valley Water District,ā€ said Reclamation Commissioner Camille Calimlim Touton. ā€œAs we look to conserve critical water supplies in the Colorado River, we are united in our desire to preserve the Salton Sea, not only as a vital link in the Pacific Flyway but also as a valuable resource for the people of Southern California, in protecting their health, and in protecting the regional economy.ā€

Today’s agreements, funded by the Inflation Reduction Act, include:

  • $70 million to the state of California to fund expansion of the Species Conservation Habitat Project, which will create up to 7,000 acres of aquatic habitat for wildlife and cover exposed lakebed.
  • $2 million to the Torres Martinez Desert Cahuilla Indians over five years to expand the Tribe’s technical capacity by funding positions entrusted with supporting Salton Sea project implementation.

An additional $178 million of funding will be made available upon the implementation of voluntary conservation actions by the Imperial Irrigation District and Coachella Valley Water District under the Lower Basin System Conservation and Efficiency Program.

The Inflation Reduction Act investment complements the $583 million in state funding committed to date for Salton Sea projects. 

Approximately 60 miles from Palm Springs, California, the Salton Sea has suffered from declining inflows of water in recent years because of the impacts of climate change, including reduced agricultural runoff. The exposed lakebed is contributing to dust emissions in the surrounding environment, and declining water levels have reduced important wildlife habitat.

Map of the Colorado River drainage basin, created using USGS data. By Shannon1 Creative Commons Attribution-Share Alike 4.0

#NewMexico’s #drought persists as winter looms — Source NM #aridification

New Mexico Drought Monitor map December 5, 2023.

by Danielle Prokop, Source New Mexico
December 8, 2023

Winter is coming, and New Mexico’s outlook for much-needed moisture this season remains uncertain.

The water year has been like a rollercoaster. Rivers overbanked and ran high after surprise spring snows boosted rivers across the state during the springtime melt.

Wet winter buoys NM rivers, but drought tempers optimism: https://sourcenm.com/2023/04/20/wet-winter-buoys-nm-rivers-but-drought-tempers-optimism/embed/#?secret=b3z6YumKdX#?secret=z7O46ys1uC

However, scorching temperatures, and a ridge of high pressure prevented the seasonal storms from dropping rainfall, as temperatures soared across the globe. In August, much of the river dried between Socorro and the Isleta Pueblo.

The El NiƱo pattern ā€œloads the dice for a colder, wetter winterā€ for the Southwest, said Andrew Mangham, a hydrologist for the National Weather Service office in Albuquerque.

El NiƱo describes a pattern of atmospheric and ocean temperatures in the Pacific, which impact U.S. weather patterns.

But it’s uncertain how much snow may hit New Mexico, and where it might accumulate.

Many factors – not just atmospheric patterns – impact how weather will behave, said Andrew Mangham, a hydrologist for the National Weather Service office in Albuquerque.

Here are the typical outcomes from both El NiƱo and La NiƱa for the US. Note each El NiƱo and La NiƱa can present differently, these are just the average impacts. Graphic credit: NWS Salt Lake City office

Forecasters are less certain with prediction because there’s not very much data for more intense El NiƱo patterns. Mangham said only a dozen of those events have happened over the past 50 years.

ā€œI don’t want to make a strong statement like, ā€˜yes, everyone get out your snowshoes, we know we’re gonna, we’re gonna have a great winter.’ That’s not what I’m saying,ā€ he said. ā€œBut on the whole, looking at the past 50 years looking at about 12 events, typically, we do see more snow.ā€

Currently, more than 96% of the state is in varying degrees of drought. Drier areas include pockets in the Northwestern portion of the state and banded across much of southern New Mexico.

In a presentation on Dec. 5 , climate technologist Curtis Riganti, with the National Drought Mitigation Center at the University of Nebraska Lincoln said that drought is expected to persist through the end of the month, but additional snows through the winter ā€œmay improve drought conditions.ā€

ā€œWe’re not necessarily forecasting for the drought to get significantly worse; we’re just also not forecasting for any better,ā€ Mangham said.

New Mexico’s snowpacks are vital sources of water for its rivers, people, crops and ecosystems. The snowpacks are shrinking overall, as climate change has made conditions across the Southwest hotter and drier. Snow water is a measure of how much moisture is contained in a snowpack when it’s melted down, and is often measured in inches.

Recent storms blanketed mountains in snow and boosted snow-water averages for the state for this time of the year. But New Mexico snowbanks often don’t peak until February or March.

Meteorologist Randall Hergert told Source NM there are some chances for the very northern portion of the state to see snow this weekend, but not very much.

ā€œWe’re forecasting the storm system to give the majority of the forecast area unfortunately, a lot of wind,ā€ Hergert said.

Another storm system shows potential for another storm to hit the state the weekend of Dec. 15, but it’s too soon to tell if it’ll be cold enough for snow in eastern New Mexico.

ā€œThe question right now is just how that storm system is going to evolve and if that’s going to be a majority rain or snow,ā€ he said.

Source New Mexico is part of States Newsroom, a network of news bureaus supported by grants and a coalition of donors as a 501c(3) public charity. Source New Mexico maintains editorial independence. Contact Editor Shaun Griswold for questions: info@sourcenm.com. Follow Source New Mexico on Facebook and Twitter.

At #COP28, a Growing Sense of Alarm Over the Harms of Air Pollution — Inside #Climate News

Denver’s Brown Cloud via the Denver Regional Council of Governments.

Click the link to read the article on the Inside Climate News website (Victoria St. Martin):

In one home video, Ella Adoo-Kissi-Debrah bops to a choreographed BeyoncĆ© dance. In another, she looks at the camera, and her mom and plants a big kiss on her lips. Then there is a photo of her mid-laugh when she told her mom she could not climb any more steps at a monument. And in some of the final images taken of Ella as she neared the end of her all-too-brief life, the 9-year-old lies in a London hospital room struggling to breathe, an oxygen mask covering nearly all of her tiny, oval face.

When she died in 2013, after years of seizures and a long struggle with asthma, Ella’s death marked a grim milestone in the planet’s battle against climate change: She is believed to be the first person for whom ā€œair pollutionā€ was listed as her official cause of death.

ā€œNot only do you have to grieve, but to carry this and to fight this is huge,ā€ Ella’s mother, Rosamond Adoo-Kissi-Debrah, said of her work as an advocate for clean air during the decade since her daughter’s death. ā€œYou do have to thank God for His mercy. But I think it’s the injustice of it all, seeing it all continue. I think that’s also quite heartbreaking.ā€

If, in the years since her death, Ella Adoo-Kissi-Debrah has emerged as a symbol of the fight against air pollution, then this year’s COP28 conference on climate change in Dubai stands as a reminder of how the crisis continues to worsen.

On the eve of the conference, a peer-reviewed study in the British Medical Journal found that there were more than 8 million deaths each year that are attributable to air pollution and fine particulate matter. Roughly 5 million of those deaths, the scientists said, could be directly traced to the air pollution caused by fossil fuels.

ā€œI think it’s easy when we hear these statistics to let them wash over us,ā€ said Jane Burston, chief executive officer and founder of the Clean Air Fund, during the conference’s first ever ā€œHealth Dayā€ on Sunday. ā€œThey’re big, big numbers; we listen to them, and then we forget. But the people that don’t forget are the families who are absolutely devastated by the quality of life of their loved one’s deteriorating, and ultimately their death.ā€

Burston noted that deaths from air pollution are rising—a 2020 study cited 6.6 million related deaths in 2019— and are expected to double by 2050.

Those deaths are also expected to disproportionately affect low-income communities and people of color, who, researchers say, because of limited economic opportunities, bias and other systemic factors are often compelled to live in areas where air quality is worse than their wealthier and white counterparts.

With that in mind, many attended the conference, which began Nov. 30 and ends on Dec. 13, with environmental justice and equity as issues at the top of mind.

Robert Bullard, a distinguished professor of sociology at Texas Southern University who is regarded as the father of the environmental justice movement, was in attendance at the conference and said in an interview that he was disappointed by the relative dearth of attention paid to addressing systemic inequities.

Bullard said that he was also discouraged by comments from Sultan al-Jaber, the president of the conference, who said last week that there was ā€œno scienceā€ to support the contention that phasing out the use of fossil fuels could slow global warming.

Robert Bullard, a Texas Southern University professor, was disappointed by the handling of environmental justice issues at this year’s COP28. Credit: Courtesy of Robert Bullard

ā€œIt’s almost like ignoring the facts, ignoring the data and ignoring all of the studies that are showing the health benefits of getting off of fossil fuels,ā€ Bullard said. ā€œThis is not some low-level bureaucrat. This is the person over this whole thing. And if that’s the framing, then it means that going forward, there’s probably less of a chance of taking health as seriously. It’s as if you were going to keep doing the same thing.ā€Ā 

Bullard noted that the handling of environmental justice issues contrasts sharply with what he experienced at last year’s gathering in Egypt, an event where organizers seemed determined to ā€œbring the world’s climate justice, environmental justice, organizations and institutions and friendly governments under one big umbrella and one big tent.ā€

This year?

ā€œThis COP seems to be taken over by the oil and gas, fossil fuel entities,ā€ he said. ā€œAnd it’s to the point where it’s really a bit disturbing given the urgency in which we need to move away from that type of energy.ā€

Given that this year’s meeting was held in the United Arab Emirates—which produces about 2.8 million barrels of oil a day—Bullard said that he expected a significant presence from industry officials.

ā€œBut to have it come forward in such an in-your-face way is a bit disturbing,ā€ he said.Ā 

Many researchers were encouraged by a declaration on climate and health that was signed by over 100 countries recognizing ā€œthe urgency of taking action on climate changeā€ and noting ā€œthe benefits for health from deep, rapid, and sustained reductions in greenhouse gas emissions, including from just transitions, lower air pollution, active mobility, and shifts to sustainable healthy diets.ā€ 

In addition to concerns about air pollution, the conference also focused attention on other ways that climate change is affecting public health—from weather changes to the spread of illnesses and pathogens.

ā€œI think it just bears reminding that the evidence abounds showing that rising temperatures and sea levels, more frequent and intense extreme weather events, the heavy rains and typhoons, cyclones, heat waves, floods,ā€ said Avril BenoĆ®t, executive director of Doctors Without Borders. ā€œIn addition to all these events, we’re seeing altered patterns of infectious diseases, malaria, dengue, shifting to new zones.ā€ 

BenoĆ®t said she hopes that this COP will highlight these issues and drive home the important link between the environment and our health. 

ā€œYou need concrete political action to implement all those solutions that we know are out there to limit climate change, to limit the devastating impacts of it on humanitarian crises,ā€ she said.

Cecilia Sorensen, a physician andĀ director of the Global Consortium on Climate and Health Education at Columbia University, said that researchers have found evidence of air pollution in placentas.Ā 

ā€œIt gets into this very, very, fragile, delicate developing child system,ā€ Sorensen said. ā€œAnd this is why the World Health Organization predicts something like 90 percent of health impacts are going to be on this next generation because they start experiencing these exposures even before they’re born.ā€

Sorensen said those impacts are amplified throughout the life of the child.

ā€œThere’s been really good data looking at when you’re able to shut down fossil fuel producing facilities and in neighborhoods where there’s populations who are pregnant, that birth outcomes improve,ā€ she said. ā€œYou can think about the benefits of that to the health and longevity of those individuals, but also about the avoided health costs and the benefits to the economy and to society. It’s huge.ā€

Mitigating those crises in her own small way is now Rosamond Adoo-Kissi-Debrah’s mission. She continues to work to keep other families from experiencing the pain that has endured for her family since Ella’s death.