
Click the link to read the latest briefing on the Western Water Assessment website:
December 6, 2023 – CO, UT, WY
November was generally drier and warmer than average across the region. Regional snowfall was also below average during November and the month ended with Colorado at 54% snow water equivalent (SWE) statewide and Utah at 60% of average SWE. Drought conditions expanded slightly to cover 14% of the region with the most severe conditions in western Colorado. Strong El Niño conditions currently exist and there is an 80% chance that El Niño conditions continue through spring. NOAA seasonal forecasts suggest an increased probability of above average December–February precipitation for much of Colorado and Utah and an increased probability of below average precipitation for northern Wyoming.
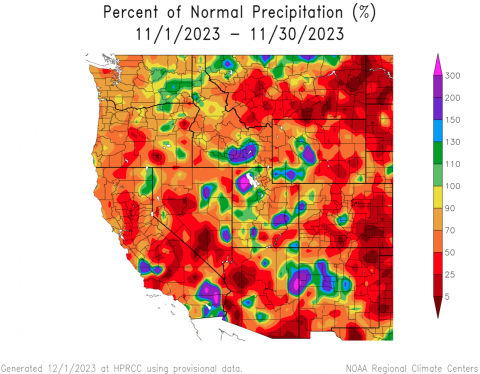
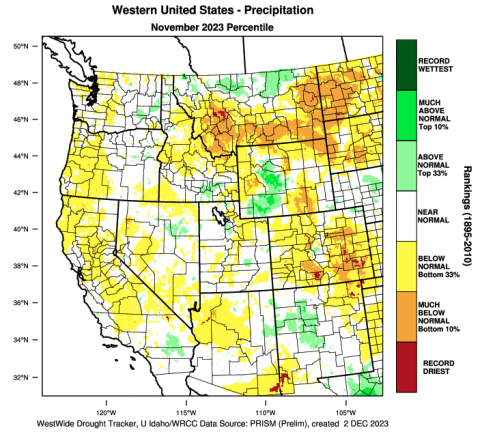
November precipitation was below normal for much of the region, especially in Colorado and eastern Wyoming where large areas received less than 50% of average monthly precipitation. A few locations in southern Colorado received record-low November precipitation. Locations in southwestern and central Wyoming received average to above average precipitation. In Utah, November precipitation was a mix of below and above average conditions.
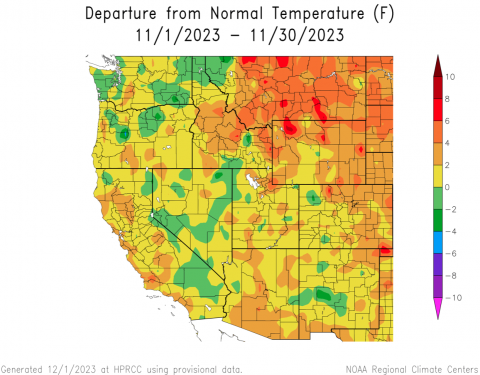
Regional temperatures were above average during November. In Utah, western Colorado and southwestern Wyoming, November temperatures were slightly above average. In eastern Colorado and much of Wyoming, temperatures were generally 2-4 degrees above average.
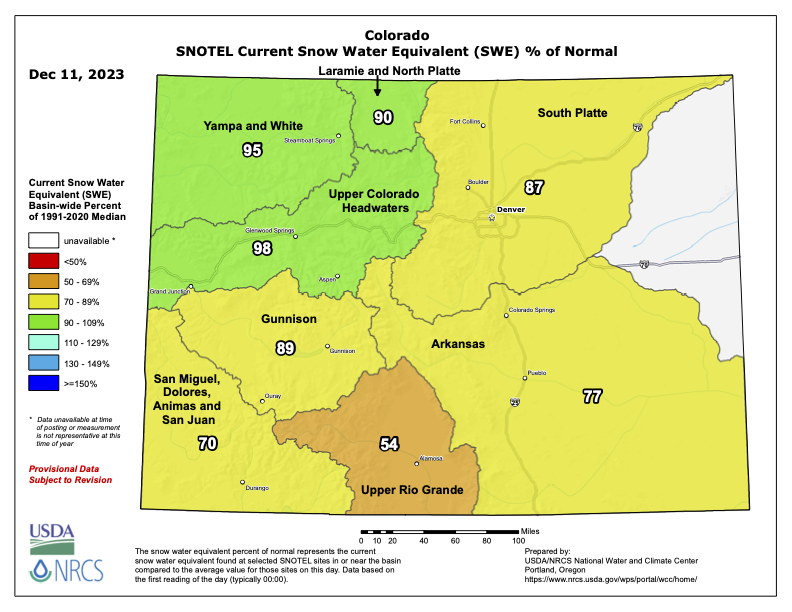
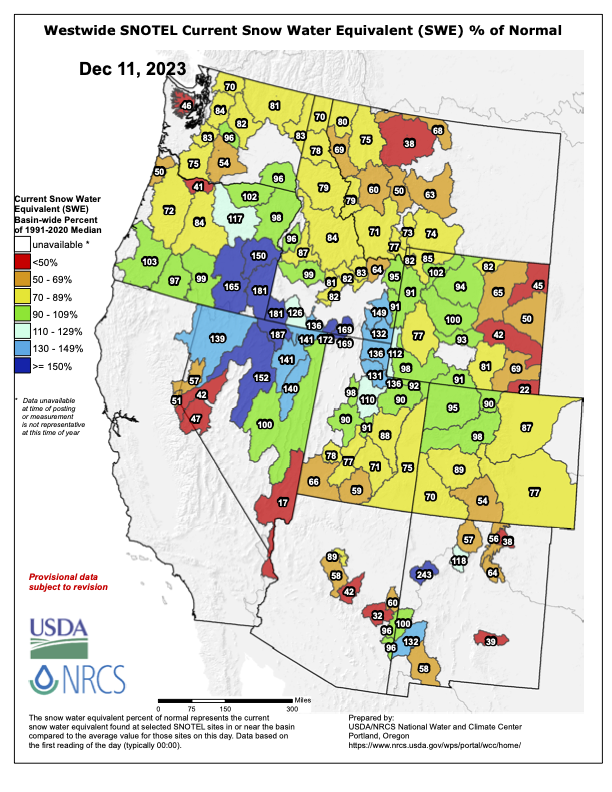
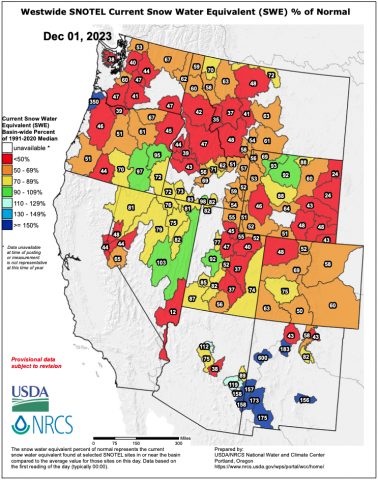
November snowfall was below average across the region. As of December 1, snow water equivalent was below to much-below average for all river basins; statewide SWE was 60% of average in Colorado and 54% of average in Utah. A prolonged winter storm affected the region on December 1-3, significantly improving snowpack conditions across most of Utah, western Colorado and parts of Wyoming.
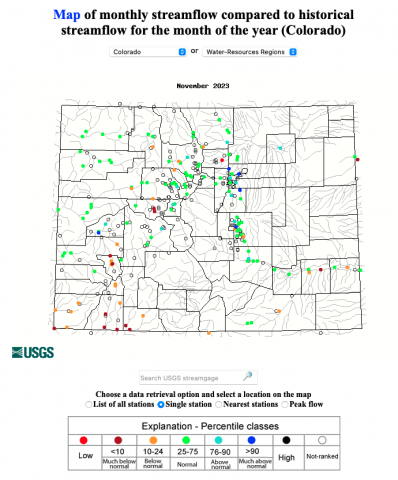
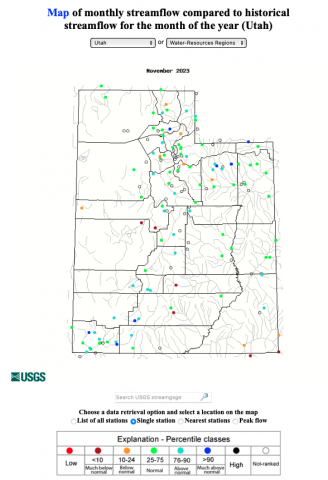
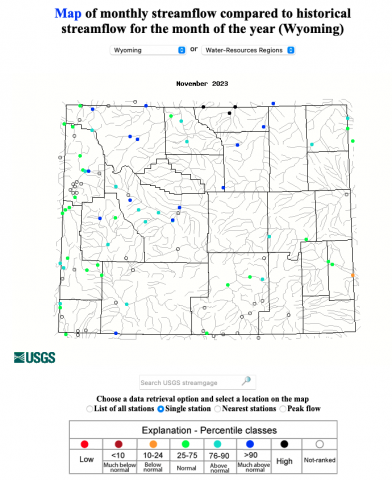
Monthly streamflow during November was lowest relative to the average in Colorado where many sites along the Arkansas, Rio Grande and San Juan Rivers reported below to much-below average streamflow, coinciding with regions experiencing the worst drought conditions. November streamflow in Utah was near-average at most streamflow gauges except for a few drier sites in central and southeastern Utah. In Wyoming, November streamflow was average across most of the state except for northern Wyoming where November streamflow was above average. The Colorado Basin River Forecast Center will issue its first water supply forecast of the season by December 13.
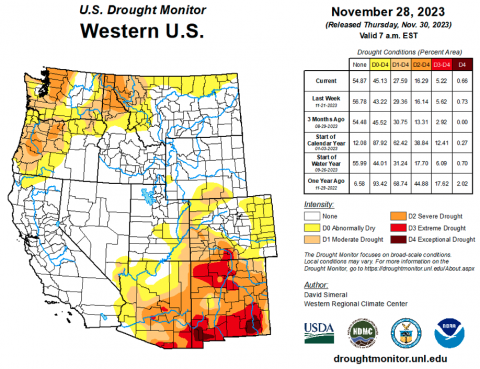
Regional drought conditions expanded slightly during November and now cover 14% of the region, a 3% increase from late October. Drought conditions remained largely unchanged in Utah and Wyoming, but expanded in Colorado. By late November, most of western Colorado was in drought and extreme (D3) drought developed in the Rio Grande River Basin.
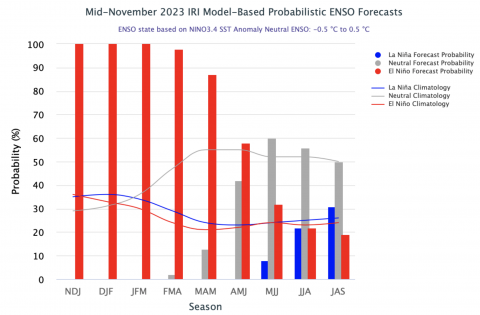
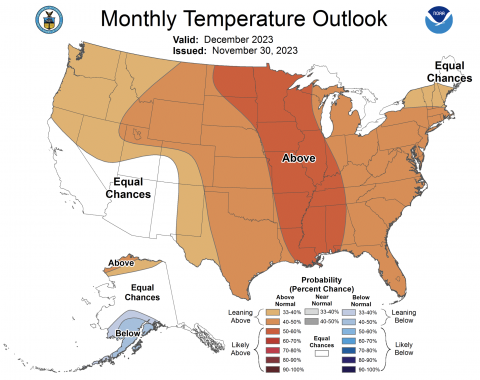
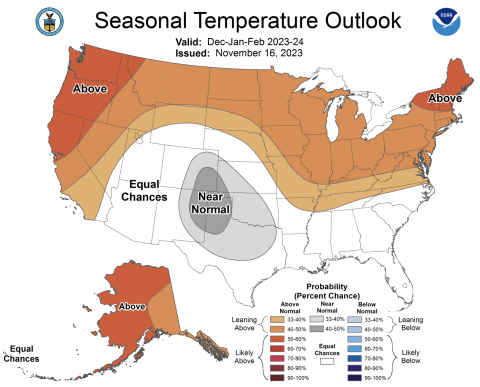
El Niño conditions continued during November and Pacific Ocean temperatures are consistent with a strong El Niño. There is over an 80% probability of El Niño conditions persisting through spring and a 55% chance of a strong El Niño continuing through mid-winter. The NOAA temperature outlook for December suggests an increased probability of above average temperatures for much of the region. The NOAA seasonal forecast for December–February suggests an increased probability of above average precipitation for much of Utah and Colorado and an increased probability for below average precipitation across much of Wyoming. In northern Wyoming, there is an increased probability of above average temperatures from December–February.

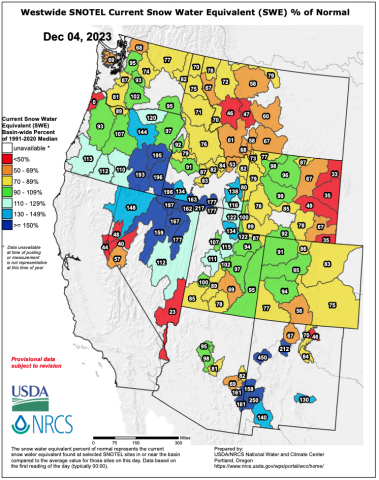
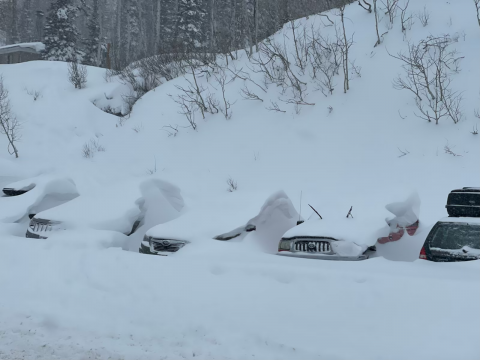
Significant weather event. December 1-3 winter storm. November was a relatively quiet month for regional weather, but December began with a very powerful winter storm impacting most of Utah, northern Colorado and western Wyoming. The three-day storm began very cold with snowfall across all elevations, but warmed significantly during the second half of the storm. Utah saw the most significant snowfall and statewide SWE improved from 60% of average before the storm to 113% of average after the storm. Colorado’s statewide SWE improved from 54% to 85% following the storm. While early season snowpack as a percentage of average can change dramatically with single storms, snowfall, especially in northern Utah, was significant. Snowfall and SWE totals from the storm included: 38” of snow (6.6” SWE) at Tony Grove Lake near Logan, 50” of snow (6.6” SWE) at Ben Lomond SNOTEL near Ogden and 51” of snow (4.7” SWE) at Alta. The storm also brought prolonged periods of very strong winds with peak gusts approaching 110 mph at 11,000 feet in the central Wasatch Mountains.

Click the link to read the article on the Department of Interior website:
Projects funded from President Biden’s Investing in America agenda will generate renewable energy, increase water efficiency
December 8, 2023
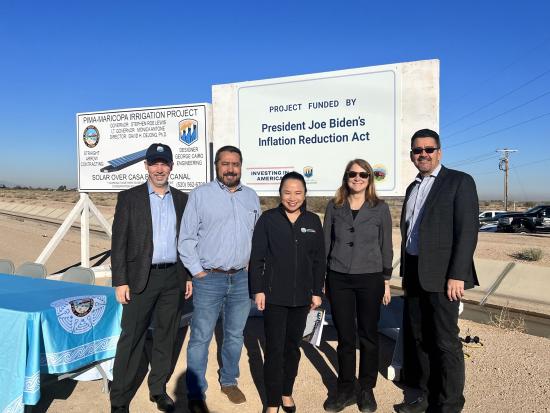
The Biden-Harris administration today announced $5.65 million from President Biden’s Investing in America Agenda for the Gila River Indian Community in Arizona to construct and install solar panels over the Casa Blanca Canal. Acting Deputy Secretary Laura Daniel-Davis and Bureau of Reclamation Commissioner Camille Calimlim Touton celebrated the investments with the Gila River Indian Community today.
“President Biden’s Investing in America agenda is unlocking resources for new and innovative ways to combat the climate crisis, including simultaneously generating renewable energy and increasing water efficiency,” said Acting Deputy Secretary Laura Daniel-Davis. “In partnership with local stakeholders, the Interior Department will continue to invest in essential water infrastructure projects that mitigate the worst impacts of climate change and invest in communities across the country.”
“We look forward to working with the Gila River Indian Community on this novel idea to conserve water and generate renewable energy with funding from President Biden’s Inflation Reduction Act,” said Reclamation Commissioner Touton. “Reclamation is working hard on projects that support water conservation and energy efficiency. This project will help inform similar projects to better understand their impacts and make that information publicly available so that we can all understand the scale and corresponding benefits they provide.”
Solar panels placed over canals have the potential to create several significant benefits, including:
- Generating renewable energy;
- Reducing evaporation losses of the canal;
- Increasing efficiency and production of solar panels because of the cooling effect of the water beneath the panels;
- Creating land savings for open space and agricultural use;
- Reducing facility maintenance by mitigating algae and/or aquatic plant growth; and
- Reducing the energy footprint and carbon emissions required to operate and maintain the facility.
The Department of the Interior’s Bureau of Reclamation will work with the Gila River Indian Community to cover 2,782 linear feet of the Casa Blanca canal with approximately 2,556 solar panels. The solar panels are expected to generate 1.31 megawatts of clean energy, providing 2.26 million kilowatt-hours of annual electricity to the Gila River Indian Community. This pilot will serve as a five-year study period and provide important information for future solar projects over canals and for the Gila River Indian Community as they seek to include solar panels over 18.5 miles of canal.
President Biden’s Investing in America agenda represents the largest investment in climate resilience in the nation’s history and provides much-needed resources to enhance Western communities’ resilience to drought and climate change. The Inflation Reduction Act made available $25 million for the design, study and implementation of projects to cover water conveyance facilities with solar panels. Today’s announcement is the first award of this funding, with more expected in the coming months.
Through the Bipartisan Infrastructure Law, Reclamation is also investing $8.3 billion over five years for water infrastructure projects, including rural water, water storage, conservation and conveyance, nature-based solutions, dam safety, water purification and reuse, and desalination. Over the first two years of its implementation, Reclamation selected 372 projects to receive almost $2.8 billion.
This funding is also advancing President Biden’s Justice40 Initiative, which aims to ensure that 40 percent of the overall benefits of certain climate, clean energy, and other federal investments flow to disadvantaged communities marginalized by underinvestment and overburdened by pollution.
Click the link to read the post on the NOAA website (Amy Butler and Laura Cisato):
We are excited to announce that NOAA Climate.gov, home of the highly popular ENSO Blog, is venturing into a colder, darker, and windier corner of the atmosphere with the new Polar Vortex Blog. We plan to explore various facets of the winds, climate, and chemistry within the fascinating region of the atmosphere known as the polar stratosphere, and explain how this region can sometimes drive big changes in our weather patterns!
While ENSO may be the seasoned celebrity in the seasonal forecasting world, in recent years the stratospheric polar vortex has become a rising star: constantly making headlines and being stalked by the paparazzi, but often misunderstood or misrepresented. We hope to clear up misconceptions, highlight new research, and discuss what the polar vortex is up to and how it may affect our winter’s weather. We expect there to be 1-2 posts per month between December and March, with the initial focus on the Northern Hemisphere polar vortex (yep, there’s one down south, too!).
So who’s on the team?
- Amy Butler is a research scientist at the NOAA Chemical Sciences Laboratory and an expert on the stratosphere and its influence on weather;
- Laura Ciasto is a meteorologist at the NOAA Climate Prediction Center. She leads the development of stratospheric and teleconnection forecast products, but is also a Week 3-4 forecaster (NOAA’s description for forecasts of weather conditions 3-4 weeks in the future);
- The Climate.gov graphics and data visualization team and managing editor, Rebecca Lindsey, with the NOAA Climate Program Office.
While we [Amy & Laura] are the lead editors of the blog, we hope to have guest contributors who can share their own perspectives and research on the polar vortex and related topics. And of course, this blog will not succeed without active engagement from you, our readers. We are happy to hear your constructive feedback and suggestions, and are excited to engage with you on this topic!
After reading this introduction, the first question you might have is likely: What is the polar vortex? And so, that’s where we’ll begin!!
What is the stratospheric polar vortex?
In recent years, most people have heard the phrase “the polar vortex”, which has made regular appearances in media headlines, often with an exciting, albeit sometimes ominous “Day after Tomorrow”, flavor:
- “Get ready: here comes the polar vortex”
- “Northeast U.S. latest to experience polar vortex temperatures”
- “Polar vortex invades central U.S.”
- “Polar vortex breaks record-low temps, snaps steel, empties cities”
But the “polar vortex” is not actually a synonym for “cold snap”; rather, it’s a well-known feature of Earth’s atmosphere that describes the high-altitude winds that blow around the pole every winter, miles above us in a region called the stratosphere.

The stratospheric polar vortex forms in the winter hemisphere when the Earth’s pole is pointed away from the sun. The polar stratosphere enters darkness and becomes cold relative to the tropical stratosphere [footnote 1]. The temperature contrast makes for strong winds in the stratosphere that blow from west to east. This wintertime stratospheric wind is what we call the Arctic polar vortex [footnote 2].
An atmosphere dance party: who’s the wallflower, and who’s the extrovert?
If we were at a dance party, your first impression might be that the stratospheric polar vortex is the wallflower standing alone on the upstairs balcony, while the tropospheric jet stream is showing off on the dance floor with its flamboyant troughs, ridges, and cut-off lows. But as is so often true, first impressions are not always correct: while the polar vortex often doesn’t mind doing its own thing, it is not a passive watcher of the atmospheric dance down below. With some encouragement, polar vortex can actually become one of the most dynamic dancers there.
Making an impression
Why does the polar vortex matter to us, given it is so high and far away in the polar atmosphere? That’s one of the things we hope to explore in much more detail on this blog. But one of the main reasons is because the vortex does not always sit quietly by itself. Though it might (literally) need a little push from the troposphere to get its groove on, it can really break down with a move called a “sudden stratospheric warming”.
In this move, the polar vortex may wobble, swing far from its normal position over the pole, or stretch itself way out, sometimes even splitting in two (doing the “splits”? We can hear the groans from here…). And when this happens, the chances of cold weather across many populated regions can increase for many weeks afterwards.
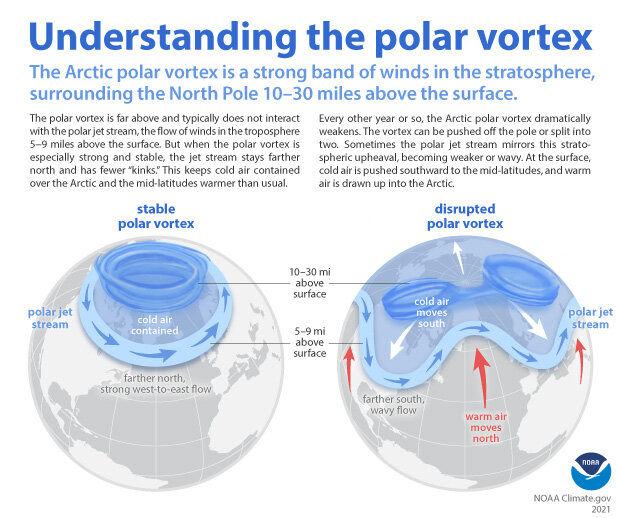
Alternatively, sometimes the vortex does another extreme move where it becomes super fast and stable, encouraging the cold air at the surface to stay over the pole, which increases the chances of winter heat extremes in some regions. We will be getting into all the details of these events and their influence on our weather in future blog posts.
Polar vortex groupies
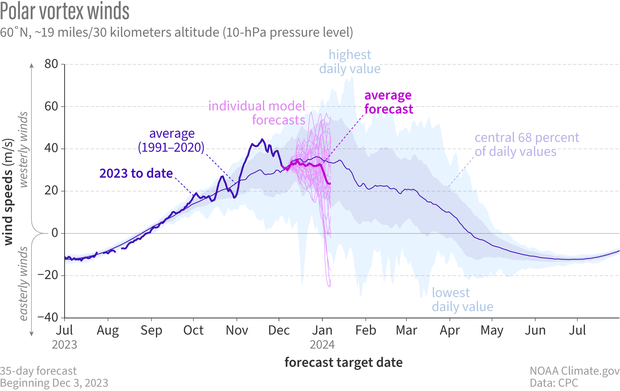
It’s hard to not be fascinated by the strong silent type that suddenly wows you with its awesome dance moves, particularly when those moves can cause extreme weather impacts, so scientists and forecasters have increasingly appreciated the need to monitor what the polar vortex is doing. We usually start by looking at the zonal (east-west) winds at 60N (the latitudes near Anchorage, AK or Oslo, Norway) at around 19 miles (30 kilometers) in altitude, where the air is so thin that the pressure is only 10 millibars (10 hectoPascals). By looking at a time series of these zonal winds we can get an idea of whether the polar vortex is really strong and stable, or weakening and ready to bust into its sudden stratospheric warming moves.
In addition to the strength of the vortex, we often want to know more about its shape. A great way to do this is by simply looking at a map of the thickness of the atmosphere. Throughout the winter, the polar vortex can shift, stretch, or just wobble from its usual spot over the pole, kind of like dancing in place. During strong events or sudden stratospheric warmings, these moves become much more distinct. Seeing the shape shows us which areas are poised to feel the biggest impacts of any unusual polar vortex behavior. There are other cool ways to see what the polar vortex is up to and whether it’s interested in tangoing with the troposphere but we’ll leave that for another post.
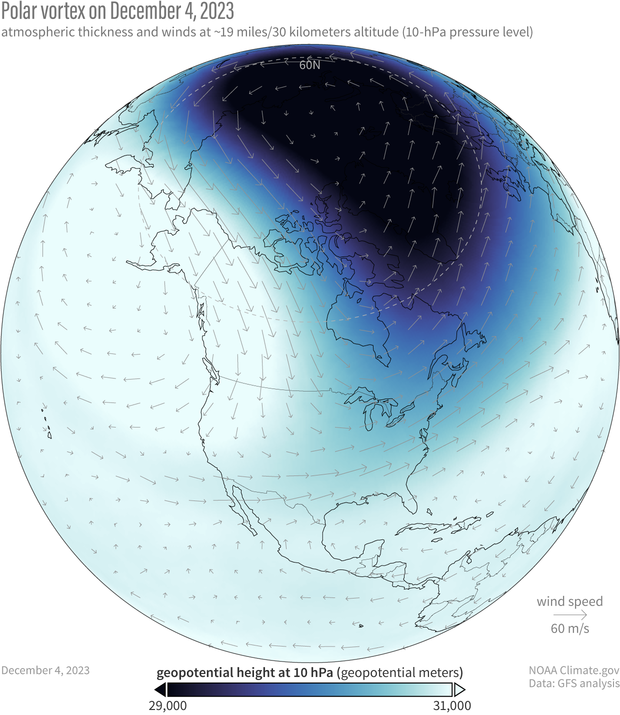
So what’s the polar vortex doing now? For the last few weeks it’s been embracing its wallflower persona as it sits over the polar region with stronger than average westerly winds. However, it does look like the stratosphere is at least thinking about joining the winter dance. If we look at the average of all the model forecasts from NOAA’s operational forecasting system (known as the Global Ensemble Forecasting System, or GEFS), it predicts that the zonal winds will weaken through the start of the new year.
The real question is whether the polar vortex just wants to dance in place (like it often does) or really show its steps. If we look at the individual forecasts that make up the average, some indicate that those polar vortex westerlies will not only weaken but change direction to blow from east to west [footnote 3], which is how we define a sudden stratospheric warming. In addition, the leading forecast system for Europe (the ECMWF model, short for European Centre for Medium-range Weather Forecasting) shows an even higher likelihood that the vortex will be weaker than normal during December. These hints of a shift towards a weaker polar vortex means we will keep a close eye on whether the polar vortex wants to join an early winter party or sit this one out.
Further Reading
If you can’t wait for the next post to learn more about the polar vortex, our friends at the ENSO blog and at Climate.gov have posted several primers on the polar vortex and some of its most recent disruptions.
- Polar Vortex
- Understanding the Arctic Polar Vortex
- 2021 Sudden Stratospheric Warming
- 2023 Sudden Stratospheric Warming
Other good references on the polar vortex:
- The Stratospheric Polar Vortex and Sudden Stratospheric Warmings
- What Exactly is the Polar Vortex?
- What’s in a Name? On the Use and Significance of the Term “Polar Vortex”
Footnotes
- Now, you might be thinking, “But isn’t the stratosphere always colder at the poles than it is at the equator? No! In the summer, it’s actually warmer. We’ll cover this in a future post.
- Most of our descriptions in this post are talking about the Arctic polar vortex, but there is also an Antarctic polar vortex at 60S. It has some of the same features as its Arctic counterpart, but the Antarctic polar vortex is also unique, often dancing to the beat of a different song. We’ll delve into that more in future posts.
- When the winds blow from west to east, as is typically the case with the stratospheric polar vortex, this is said to be “westerly” flow, and is marked by zonal wind speeds that are positive in sign. When the winds blow from east to west, which is what happens when a sudden stratospheric warming occurs, the flow is instead called “easterly” and is denoted by zonal wind speeds that are negative in sign.
Click the link to read the article on the Aspen Daily News website (Austin Corona). Here’s an excerpt:
As competition grows for Colorado’s limited water resources, Front Range cities are disproportionately vulnerable to interstate water cuts on the beleaguered Colorado River, according to a recently updated study. The study found that 96% of Front Range water use from the Colorado River is subject to possible cuts under an interstate agreement. Updated this year by Hydros Consulting, the study was conducted on behalf of the Colorado River Water Conservation District. It is part of a seven-year effort to analyze the potential impacts of water cuts under the Colorado River Compact in Colorado…
While the vast majority of Front Range water use is theoretically subject to compact curtailment, only 30% of Western Slope water use — consumptive use, not diversions — shares the same vulnerability. In addition, the Front Range accounts for 48% of the state’s curtailable Colorado River water use, despite only making up 23% of the state’s overall use of the river. The majority of Front Range water rights on the Colorado River are vulnerable to curtailment because they are newer than the Colorado River Compact, which was signed in 1922. In Colorado water law, water rights receive priority during shortages according to their age, meaning the compact trumps any water rights newer than it…
The study found that under current hydrologic trends and reservoir operations, Colorado’s growing water demand is not likely to trigger this situation. [ed. emphasis mine] A sustained period of severe drought, however, could make it happen. In the last 20 years, the Colorado River’s average flow dropped to 11 million acre-feet for a period of seven years (the longer-term norm has been 13 million). Study facilitators say that if that seven-year stretch were to become the new normal, river flows would drop below the lower basin’s entitlement, even if Colorado’s water demand stays flat. If Colorado’s water demand follows future growth projections, it would likely speed up that process, potentially decreasing annual flows by an additional half-million acre-feet. Even without a natural drop in river flows, rising Colorado water demand could cause other interstate issues on the river outside of the Colorado River Compact. Under Colorado water demand projections for 2050, created by the Upper Colorado River Commission, the upper basin could fail to meet its obligation of sending an additional .75 million acre-feet downstream to Mexico.
