#Drought news December 19, 2024: Moderate drought improved in N. #Utah and S.W. #Wyoming. Extreme drought expanded in N.W. Wyoming while N. #Colorado had abnormally dry and moderate drought expand slightly

Click on a thumbnail graphic to view a gallery of drought data from the US Drought Monitor website.

Click the link to go to the US Drought Monitor website. Here’s an excerpt:

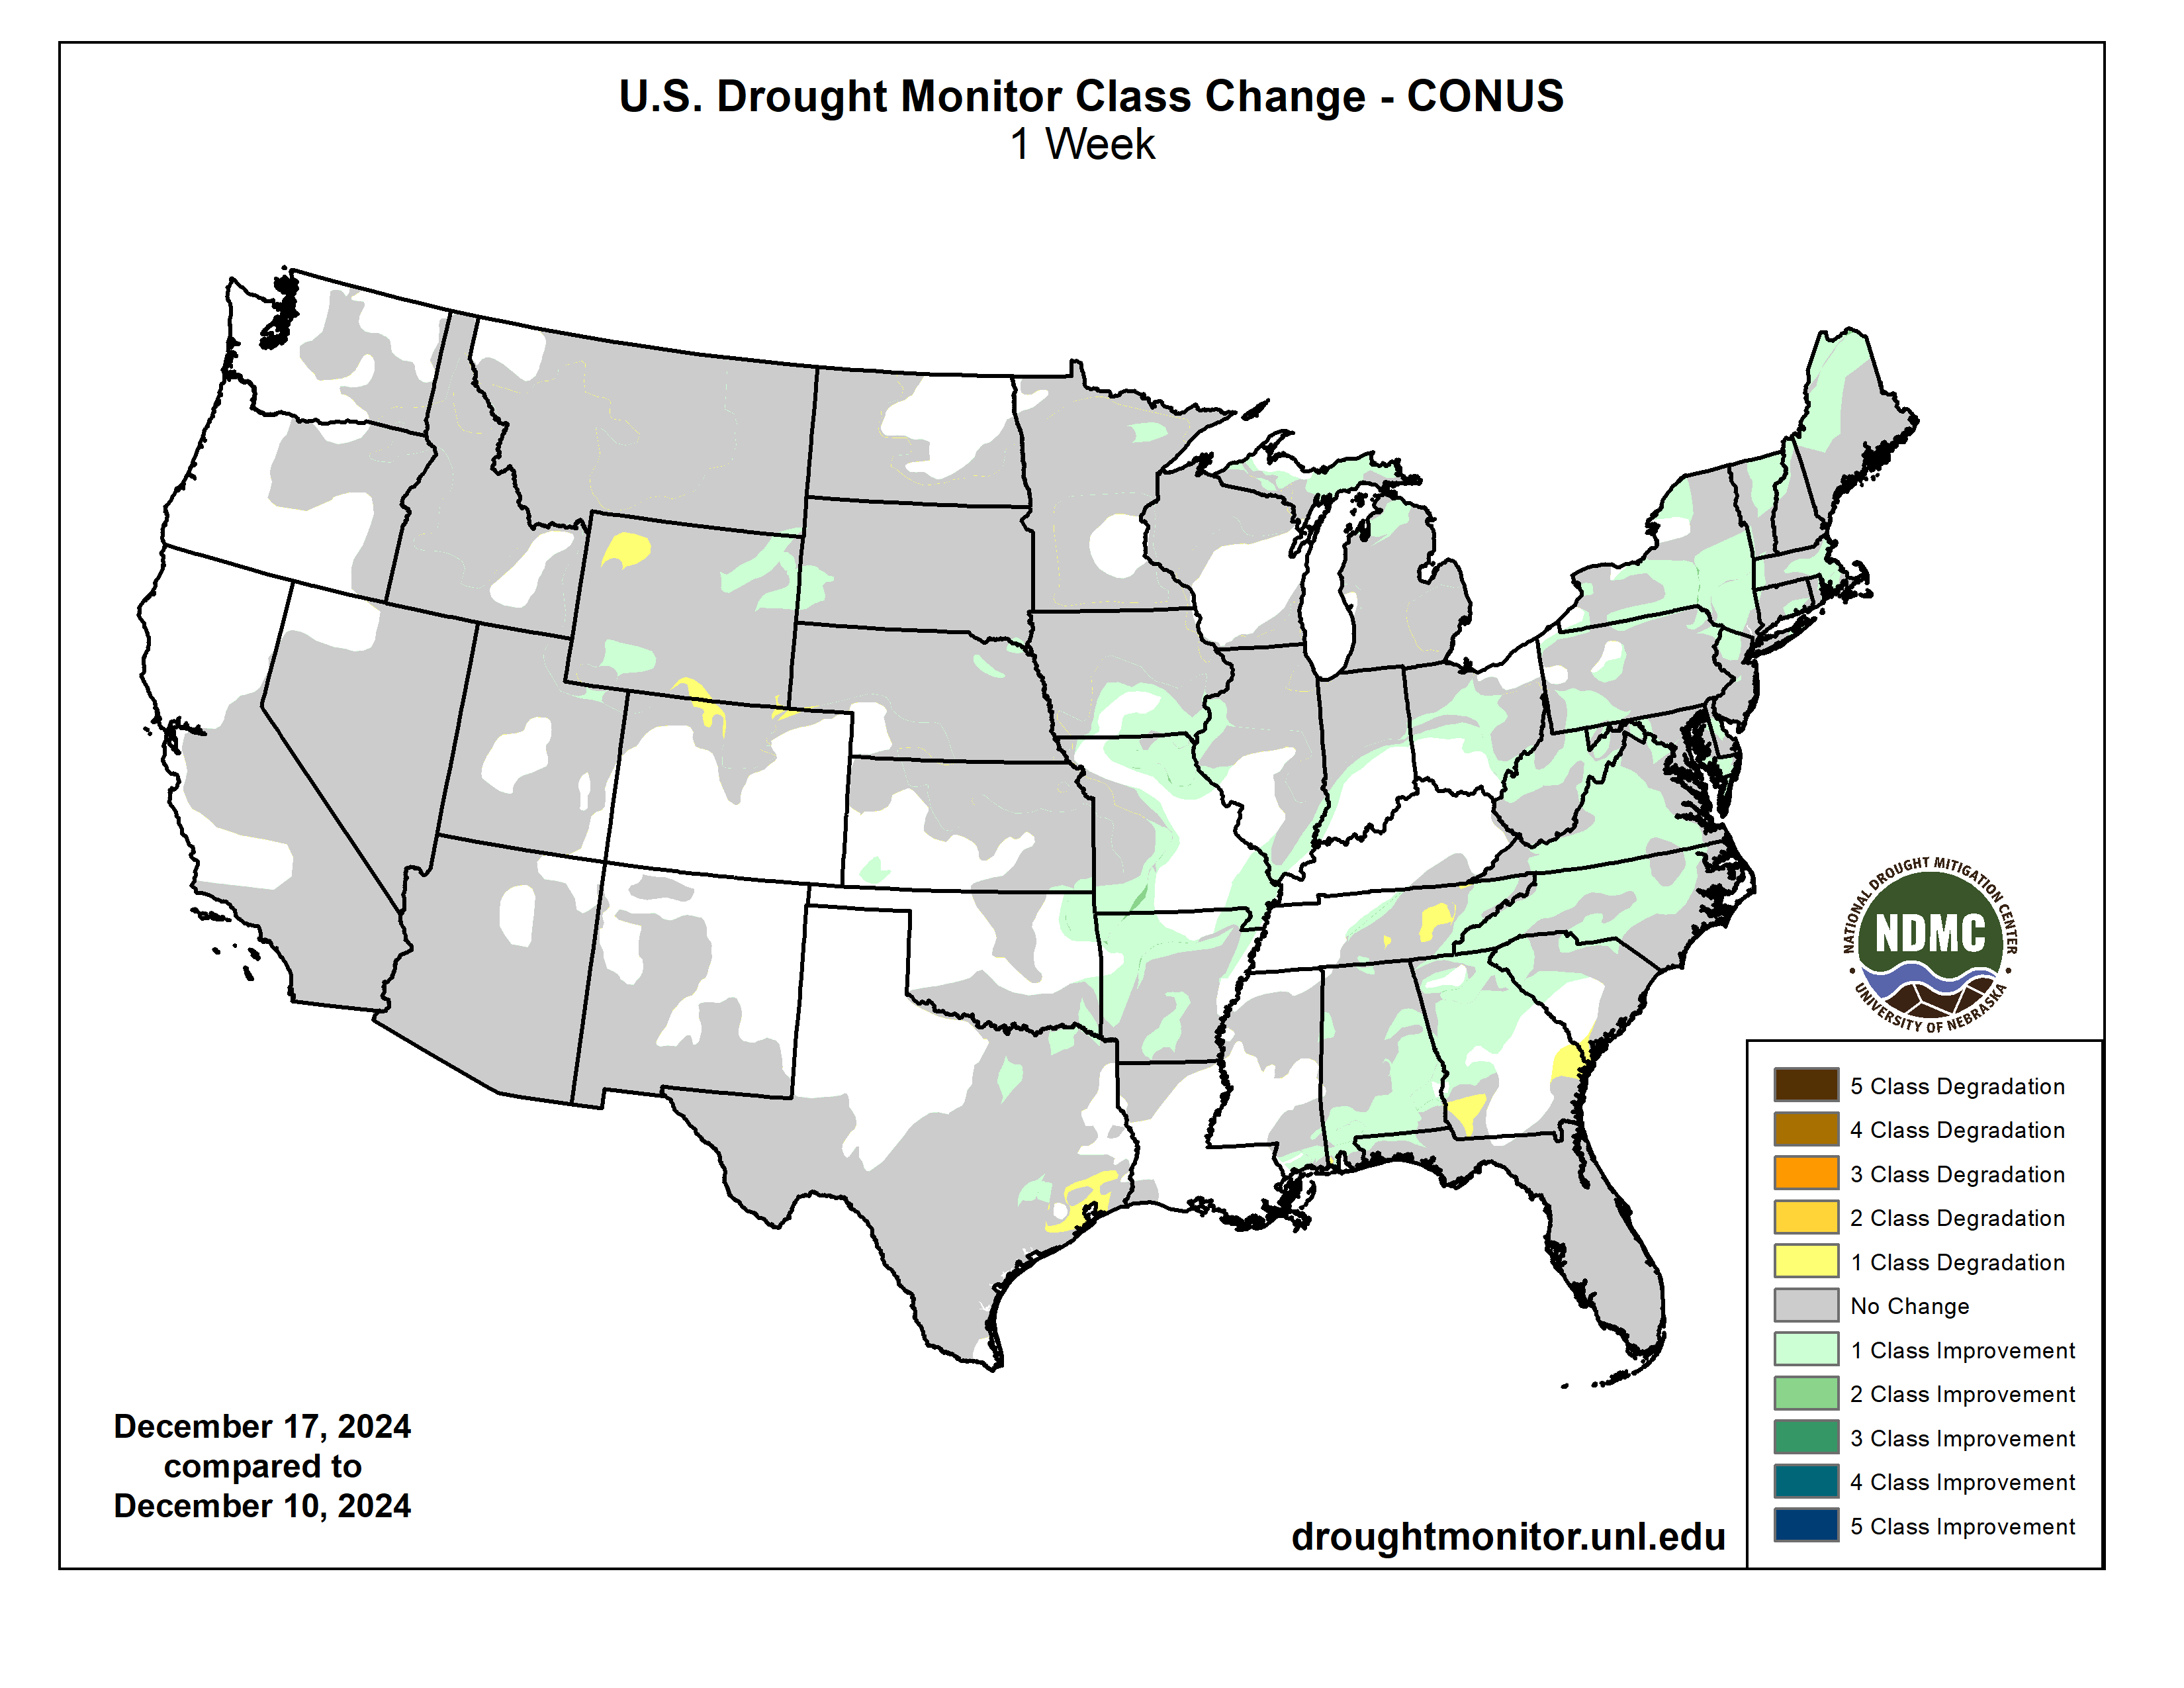
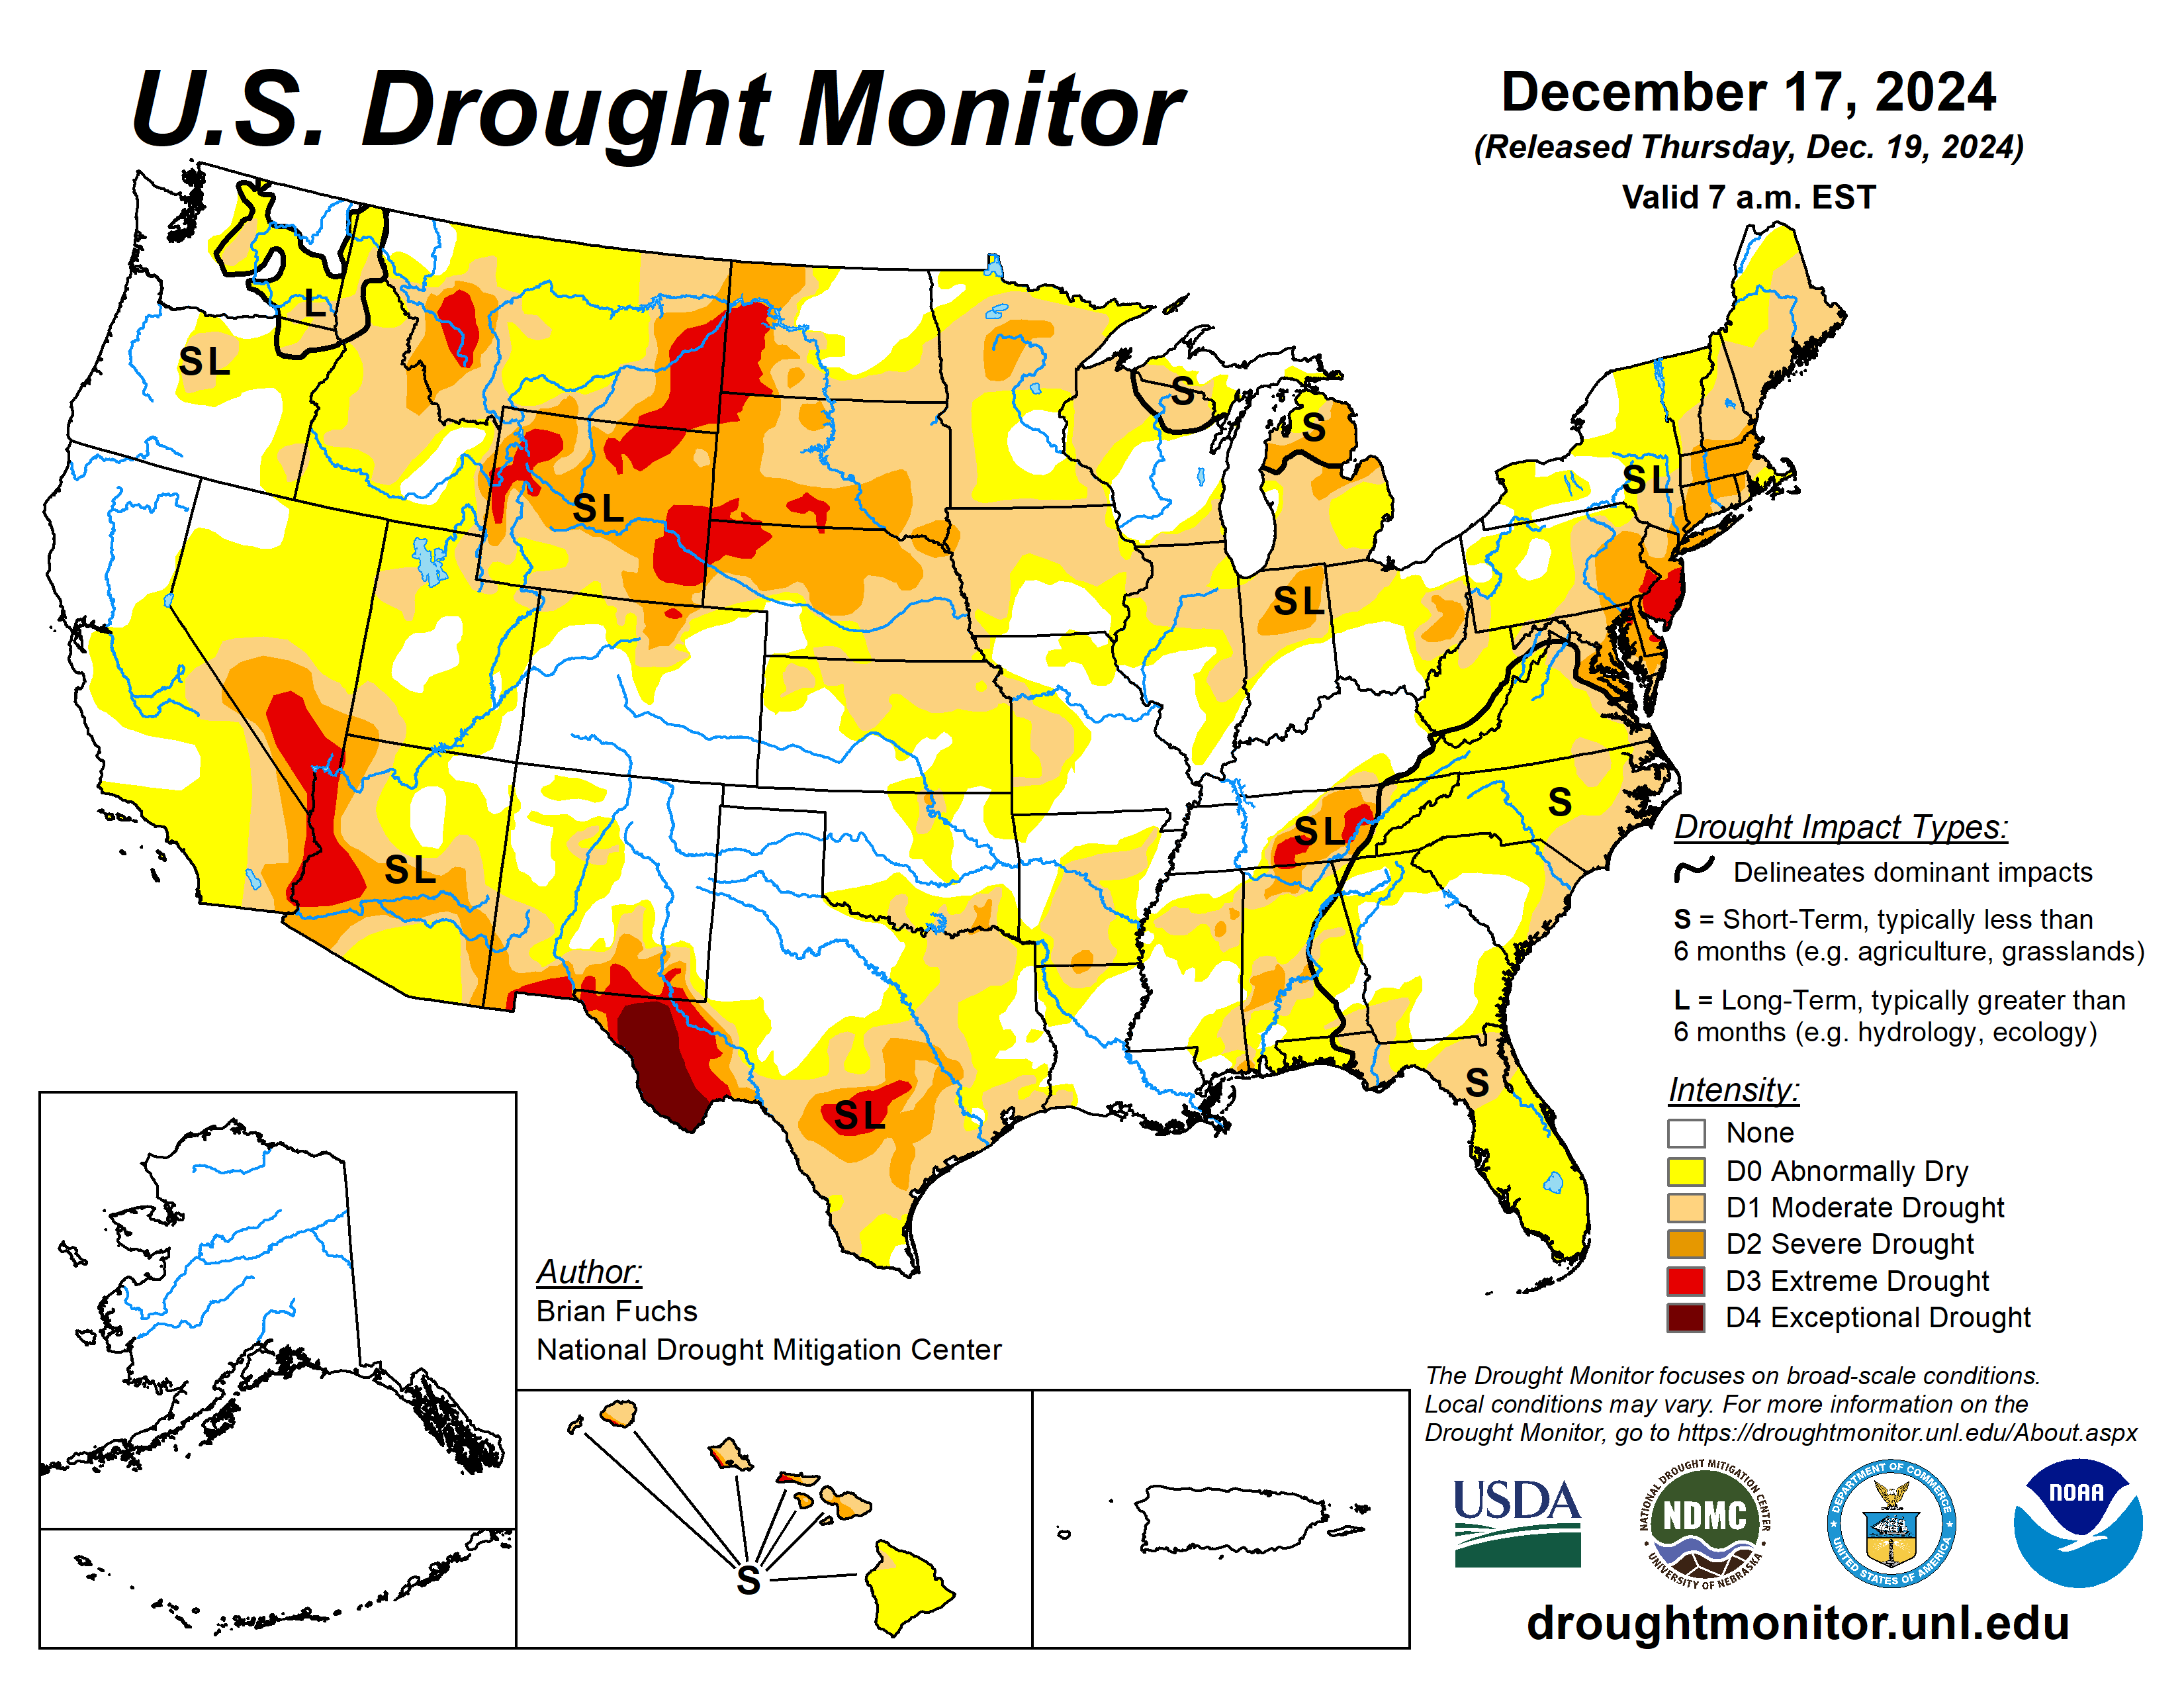
This Week’s Drought Summary

Over the last week, precipitation was greatest in portions of the Southeast and coastal areas of northern California. Widespread precipitation was recorded from Arkansas into the Midwest and along much of the eastern seaboard from the Mid-Atlantic up into New England. Much of the Plains, Southwest, and Rocky Mountains were quite dry during this period as well as much of the Florida peninsula. Temperatures were cooler than normal over the northern Plains and much of the Midwest with departures of 5-10 degrees below normal. Above normal temperatures were recorded over the northern Rocky Mountains, the southern Plains and into the South, where departures were 5-10 degrees above normal. Most other locations observed temperatures near normal…
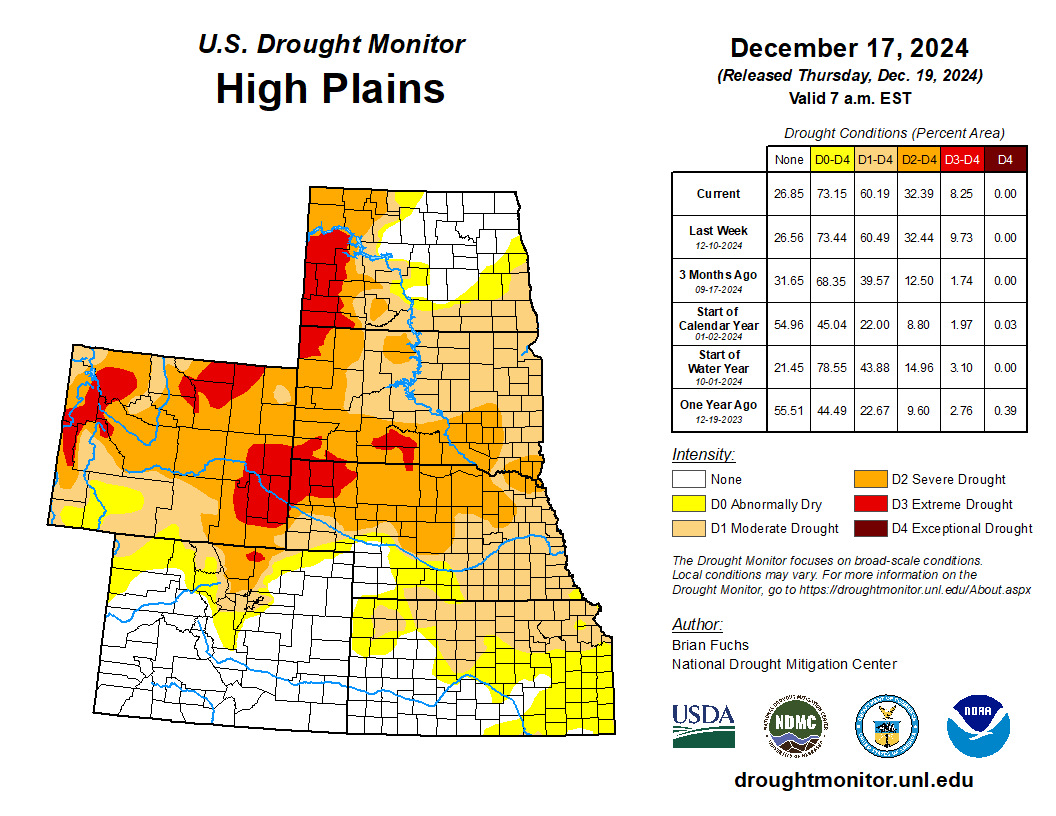
High Plains

It was a dry week for most of the region with only areas of southeastern Nebraska, northeastern Kansas, northern North Dakota and the Plains of eastern Wyoming and Montana showing any above-normal precipitation. Temperatures were cooler than normal over the Dakotas with departures of 3-6 degrees below normal while most of the rest of the region was 3-6 degrees above normal for the week. Abnormally dry conditions improved over southwest and southeast Kansas while severe drought improved in northeast Wyoming and into western South Dakota. The extreme drought in northeast Nebraska was reassessed and removed as the convergence of the indicators at extreme drought levels no longer existed, even with some long-term signals still showing some dryness in the extreme levels…
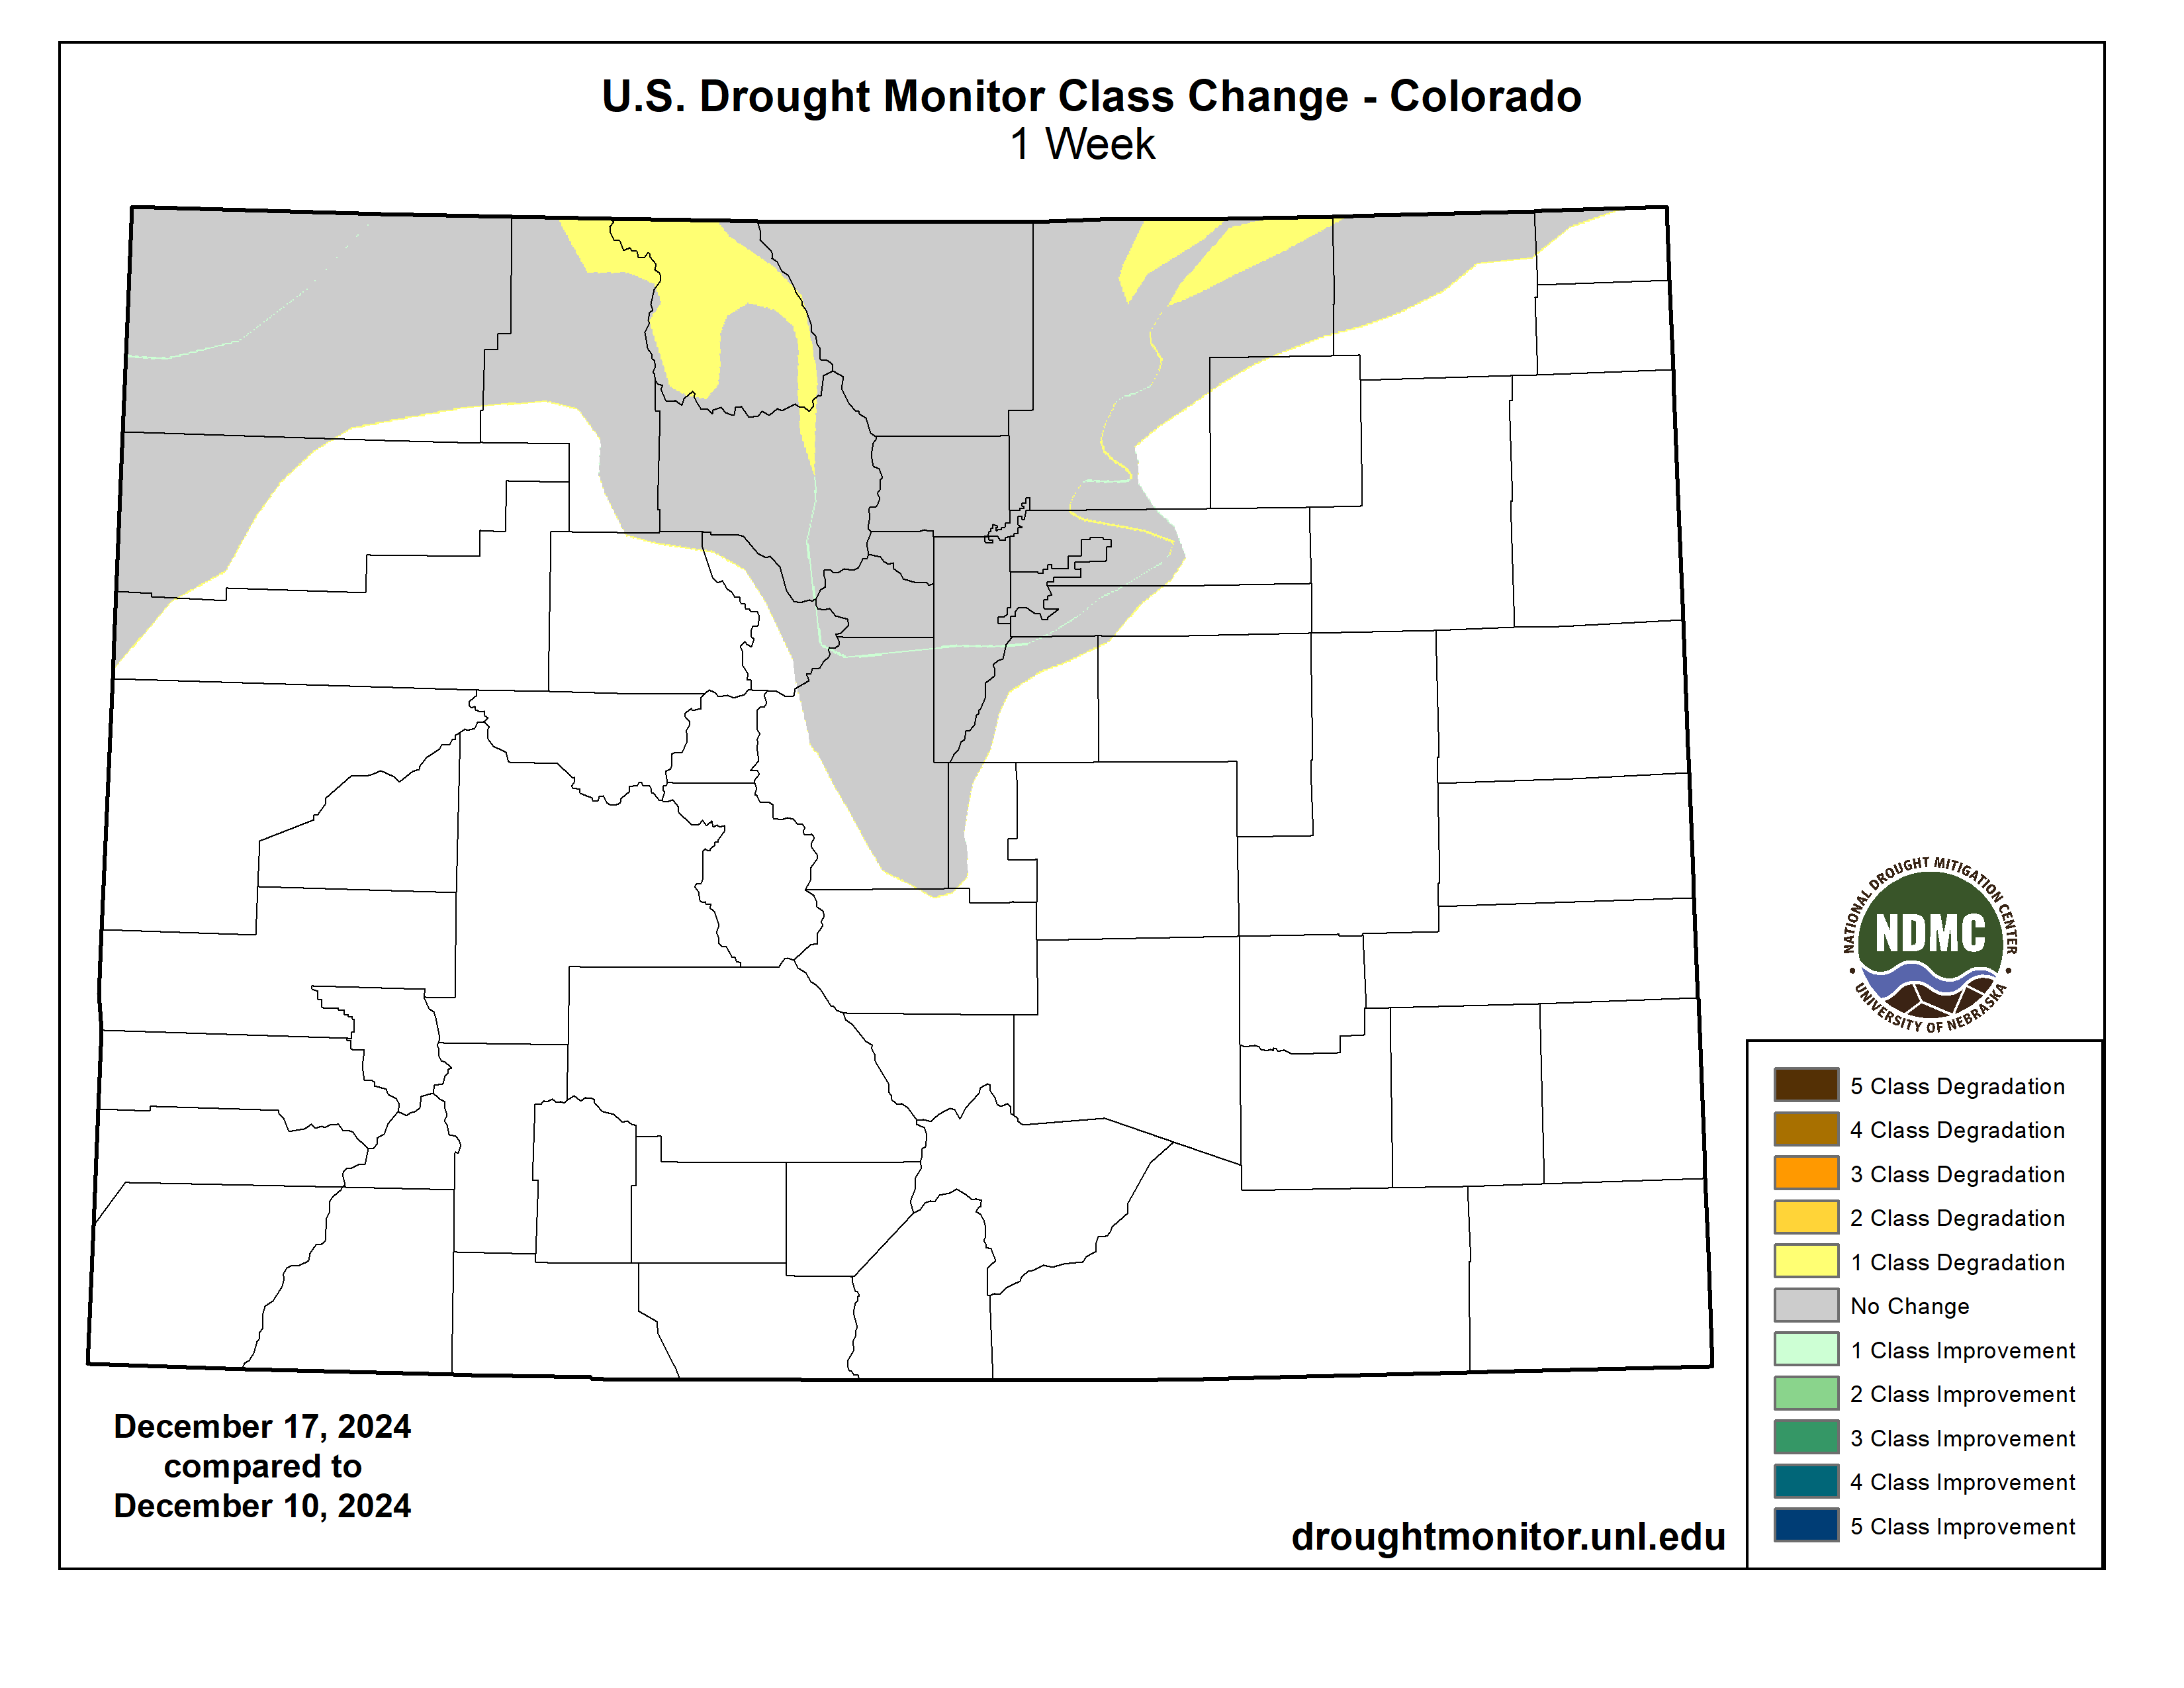
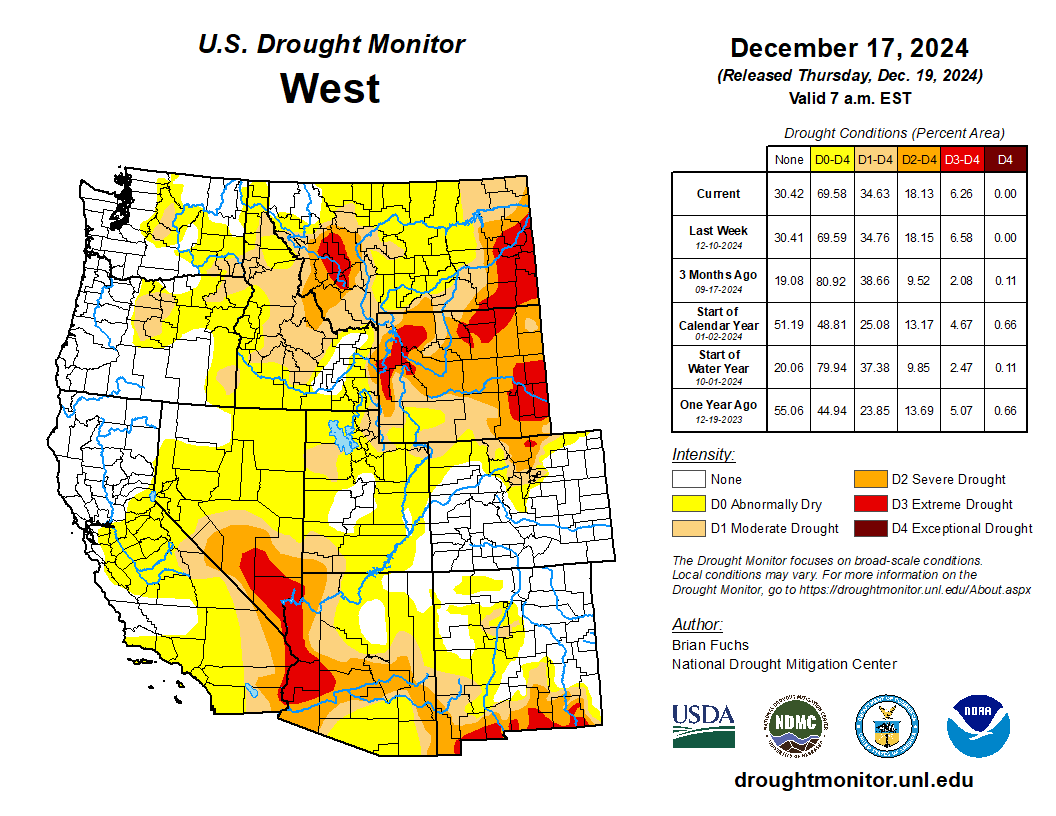
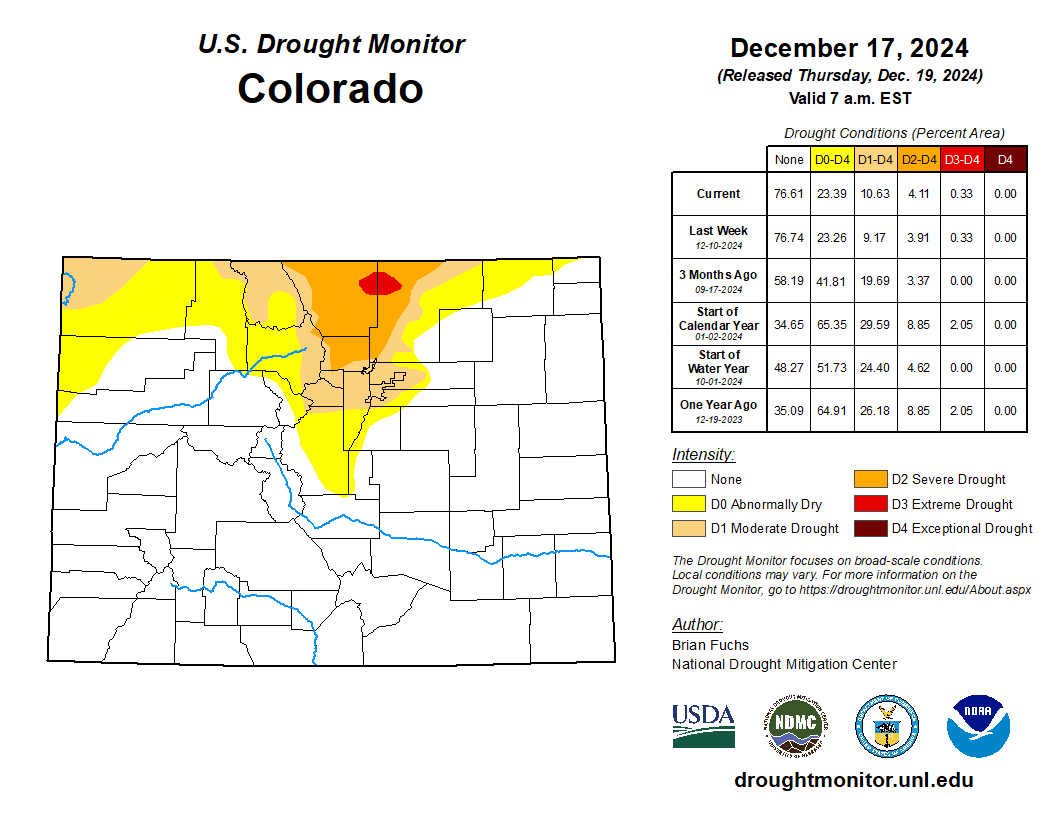
Colorado Drought Monitor one week change map ending December 17, 2024.

West

Most of the southern and southwest portions of the region were dry for the week. After an early start to the snow season, many areas have seen it drop off considerably and are below normal for this time of year. The wettest areas were in northern California into the Great Basin and southern Idaho and Montana. Temperatures were mainly 3-6 degrees above normal over the region with only those areas recording the most rains being below normal for the week. Even with the precipitation in areas, changes to the drought status in the region were minimal this week. Moderate drought improved in northern Utah and southwest Wyoming. Extreme drought expanded in northwest Wyoming while northern Colorado had abnormally dry and moderate drought expand slightly…

South

Temperatures were warmer than normal over most of the region with departures of 5-10 degrees above normal for the week. The wettest areas were in eastern Oklahoma, Arkansas and northern Mississippi, where most recorded 150-200% of normal precipitation for the week. Moderate drought and abnormally dry conditions improved over much of northern, western, and central Arkansas and in far eastern Oklahoma. Moderate drought improved over extreme southeast Mississippi and in far eastern Tennessee. Portions of eastern Tennessee continued to be dry and a new pocket of extreme drought was added. Exceptional drought was removed from south central Tennessee and some improvements to moderate drought and abnormally dry conditions were made in central Tennessee. Moderate drought expanded in east Texas while severe drought contracted in north Texas and portions of east Texas…

Looking Ahead

Over the next 5-7 days, it is anticipated that the best chances for precipitation will be over the Pacific Northwest, Midwest, and the eastern third of the United States. Much of the central and southern Plains, Southwest, and Rocky Mountains will expect little to no precipitation. Temperatures during this period will be above normal over the western half of the country with the greatest departures expected over the Southwest where it could be 10-13 degrees above normal. The coolest temperatures will be along the East Coast where departures of 7-10 degrees below normal can be anticipated from North Carolina up to New York.

The 6-10 day outlooks show that the probability of warmer-than-normal temperatures covers almost the entire country outside of the East Coast from North Carolina to Massachusetts where probabilities lean to near normal conditions. The highest probabilities of above-normal temperatures will be in the northern Plains and upper Midwest. The greatest chances of above-normal precipitation will be in the Pacific Northwest and portions of the South. The best chances of below-normal precipitation are in the Southwest and northern New England.

US Drought Monitor one week change map ending December 17, 2024.

Anthropogenic warming has ushered in an era of temperature-dominated droughts in the western United States — Science Advances

Fig. 1. Contributions of P′ and PET′ to the WUS drought.
(A) Drought severity time series of 12-month moving cumulative Pā€²āˆ’PET′, P′, and āˆ’PET′ during 1948–2022 averaged over the WUS (with cosine latitude weighting); the thin lines represent 12-month cumulative values, while the thick lines are their 20-year moving average; the yellow-shaded area represents drought periods identified when average Pā€²āˆ’PET′ falls below its 30th percentile value for the 1948–1999 climatological period (marked by the gray dashed horizontal line); the vertical dotted line separates 1948–1999 (P1) and 2000–2022 (P2). We multiply PET′ by āˆ’1 for direct comparison with P′. (B) Time series of drought coverage and contributions from P′ and āˆ’PET′; thin lines represent total areas within the WUS (11 contiguous US states, 3.12 Ɨ 106 km2 in total) that are in drought condition (local Pā€²āˆ’PET′ below the 30th percentile value for any grid point; black) and those where PET′ (red line) or P′ (blue line) alone was strong enough to cause drought (Materials and Methods); thick lines are their 20-year moving average. (C) Map of averaged PET′ contribution to drought severity, i.e., āˆ’PET′/(Pā€²āˆ’PET′), during drought periods in P1; the thick black line marks the boundary of the WUS region. (D) Same as (C), but for drought periods in P2. (E) Change of PET′ contribution from P1 to P2, i.e., the difference between (D) and (C); gray dotted areas indicate insignificant change (P ≄ 0.05; P values are adjusted using the false discovery rate (FDR) criterion of αFDR < 0.05).

Click the link to access the article on the Science Advances website (YizhouĀ Zhuang,Ā RongĀ Fu,Ā JoelĀ Lisonbee,Ā Amanda M.Ā Sheffield,Ā Britt A.Ā Parker, andĀ GenovevaĀ Deheza). Here’s the abstract:

Historically, meteorological drought in the western United States (WUS) has been driven primarily by precipitation deficits. However, our observational analysis shows that, since around 2000, rising surface temperature and the resulting high evaporative demand have contributed more to drought severity (62%) and coverage (66%) over the WUS than precipitation deficit. This increase in evaporative demand during droughts, mostly attributable to anthropogenic warming according to analyses of both observations and climate model simulations, is the main cause of the increased drought severity and coverage. The unprecedented 2020–2022 WUS drought exemplifies this shift in drought drivers, with high evaporative demand accounting for 61% of its severity, compared to 39% from precipitation deficit. Climate model simulations corroborate this shift and project that, under the fossil-fueled development scenario (SSP5-8.5), droughts like the 2020–2022 event will transition from a one-in-more-than-a-thousand-year event in the pre-2022 period to a 1-in-60-year event by the mid-21st century and to a 1-in-6-year event by the late-21st century.

Udall/Overpeck 4-panel Figure Colorado River temperature/precipitation/natural flows with trend. Lake Mead and Lake Powell storage. Updated through Water Year 2024. Credit: Brad Udall

An Abrupt Decline in Global Terrestrial Water Storage and Its Relationship with Sea Level Change — Springer Nature Link

Click the link to access the report on the Springer Nature Link website (Matthew Rodell,Ā Anne Barnoud,Ā Franklin R. Robertson,Ā Richard P. Allan,Ā Ashley Bellas-Manley,Ā Michael G. Bosilovich,Ā Don Chambers,Ā Felix Landerer,Ā Bryant Loomis,Ā R. Steven Nerem,Ā Mary Michael O’Neill,Ā David WieseĀ &Ā Sonia I. Seneviratne). Here’s the abstract:

November 4, 2024

As observed by the Gravity Recovery and Climate Experiment (GRACE) and GRACE Follow On (GRACE-FO) missions, global terrestrial water storage (TWS), excluding ice sheets and glaciers, declined rapidly between May 2014 and March 2016. By 2023, it had not yet recovered, with the upper end of its range remaining 1Ā cm equivalent height of water below the upper end of the earlier range. Beginning with a record-setting drought in northeastern South America, a series of droughts on five continents helped to prevent global TWS from rebounding. While back-to-back El NiƱo events are largely responsible for the South American drought and others in the 2014–2016 timeframe, the possibility exists that global warming has contributed to a net drying of the land since then, through enhanced evapotranspiration and increasing frequency and intensity of drought. Corollary to the decline in global TWS since 2015 has been a rise in barystatic sea level (i.e., global mean ocean mass). However, we find no evidence that it is anything other than a coincidence that, also in 2015, two estimates of barystatic sea level change, one from GRACE/FO and the other from a combination of satellite altimetry and Argo float ocean temperature measurements, began to diverge. Herein, we discuss both the mechanisms that account for the abrupt decline in terrestrial water storage and the possible explanations for the divergence of the barystatic sea level change estimates.

Article Highlights

  • Global terrestrial water storage, excluding glaciers and ice sheets, declined abruptly between May 2014 and March 2016, with a corollary increase in sea level
  • A series of droughts, possibly linked to global warming, has since helped to prevent global terrestrial water storage from recovering
  • Also around 2015, two independent estimates of barystatic sea level began to diverge, but we find no evidence of a connection with the terrestrial water storage decline
Illustration of the NASA’s Gravity Recovery and Climate Experiment Follow-On (GRACE-FO) spacecraft, which will track changes in the distribution of Earth’s mass, providing insights into climate, Earth system processes and the impacts of some human activities. GRACE-FO is a partnership between NASA and the German Research Centre for Geosciences. Credits: NASA/JPL-Caltech