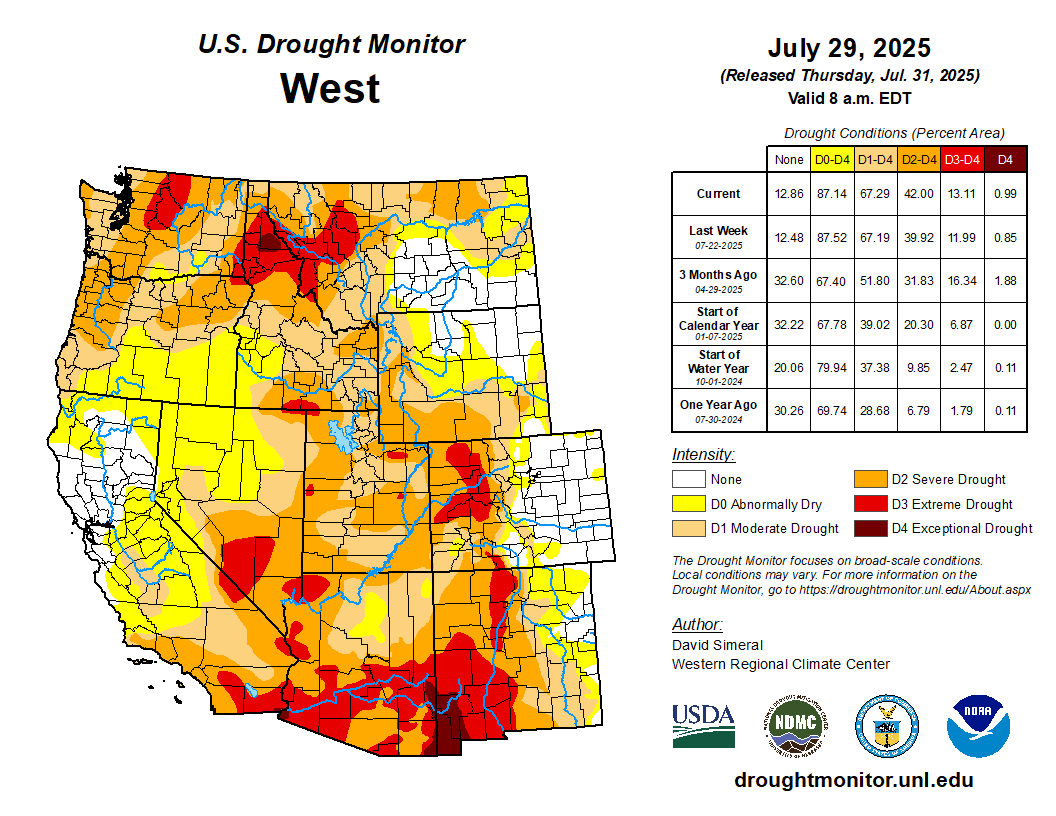
#Drought news July 31, 2025: In the West, poor surface water conditions were present in many streams and rivers of western #Wyoming, #Utah, western #Colorado, central #Arizona, and northern #NewMexico

Click on a thumbnail graphic to view a gallery of drought data from the US Drought Monitor website.
Click the link to go to the US Drought Monitor website. Here’s an excerpt:

This Week’s Drought Summary

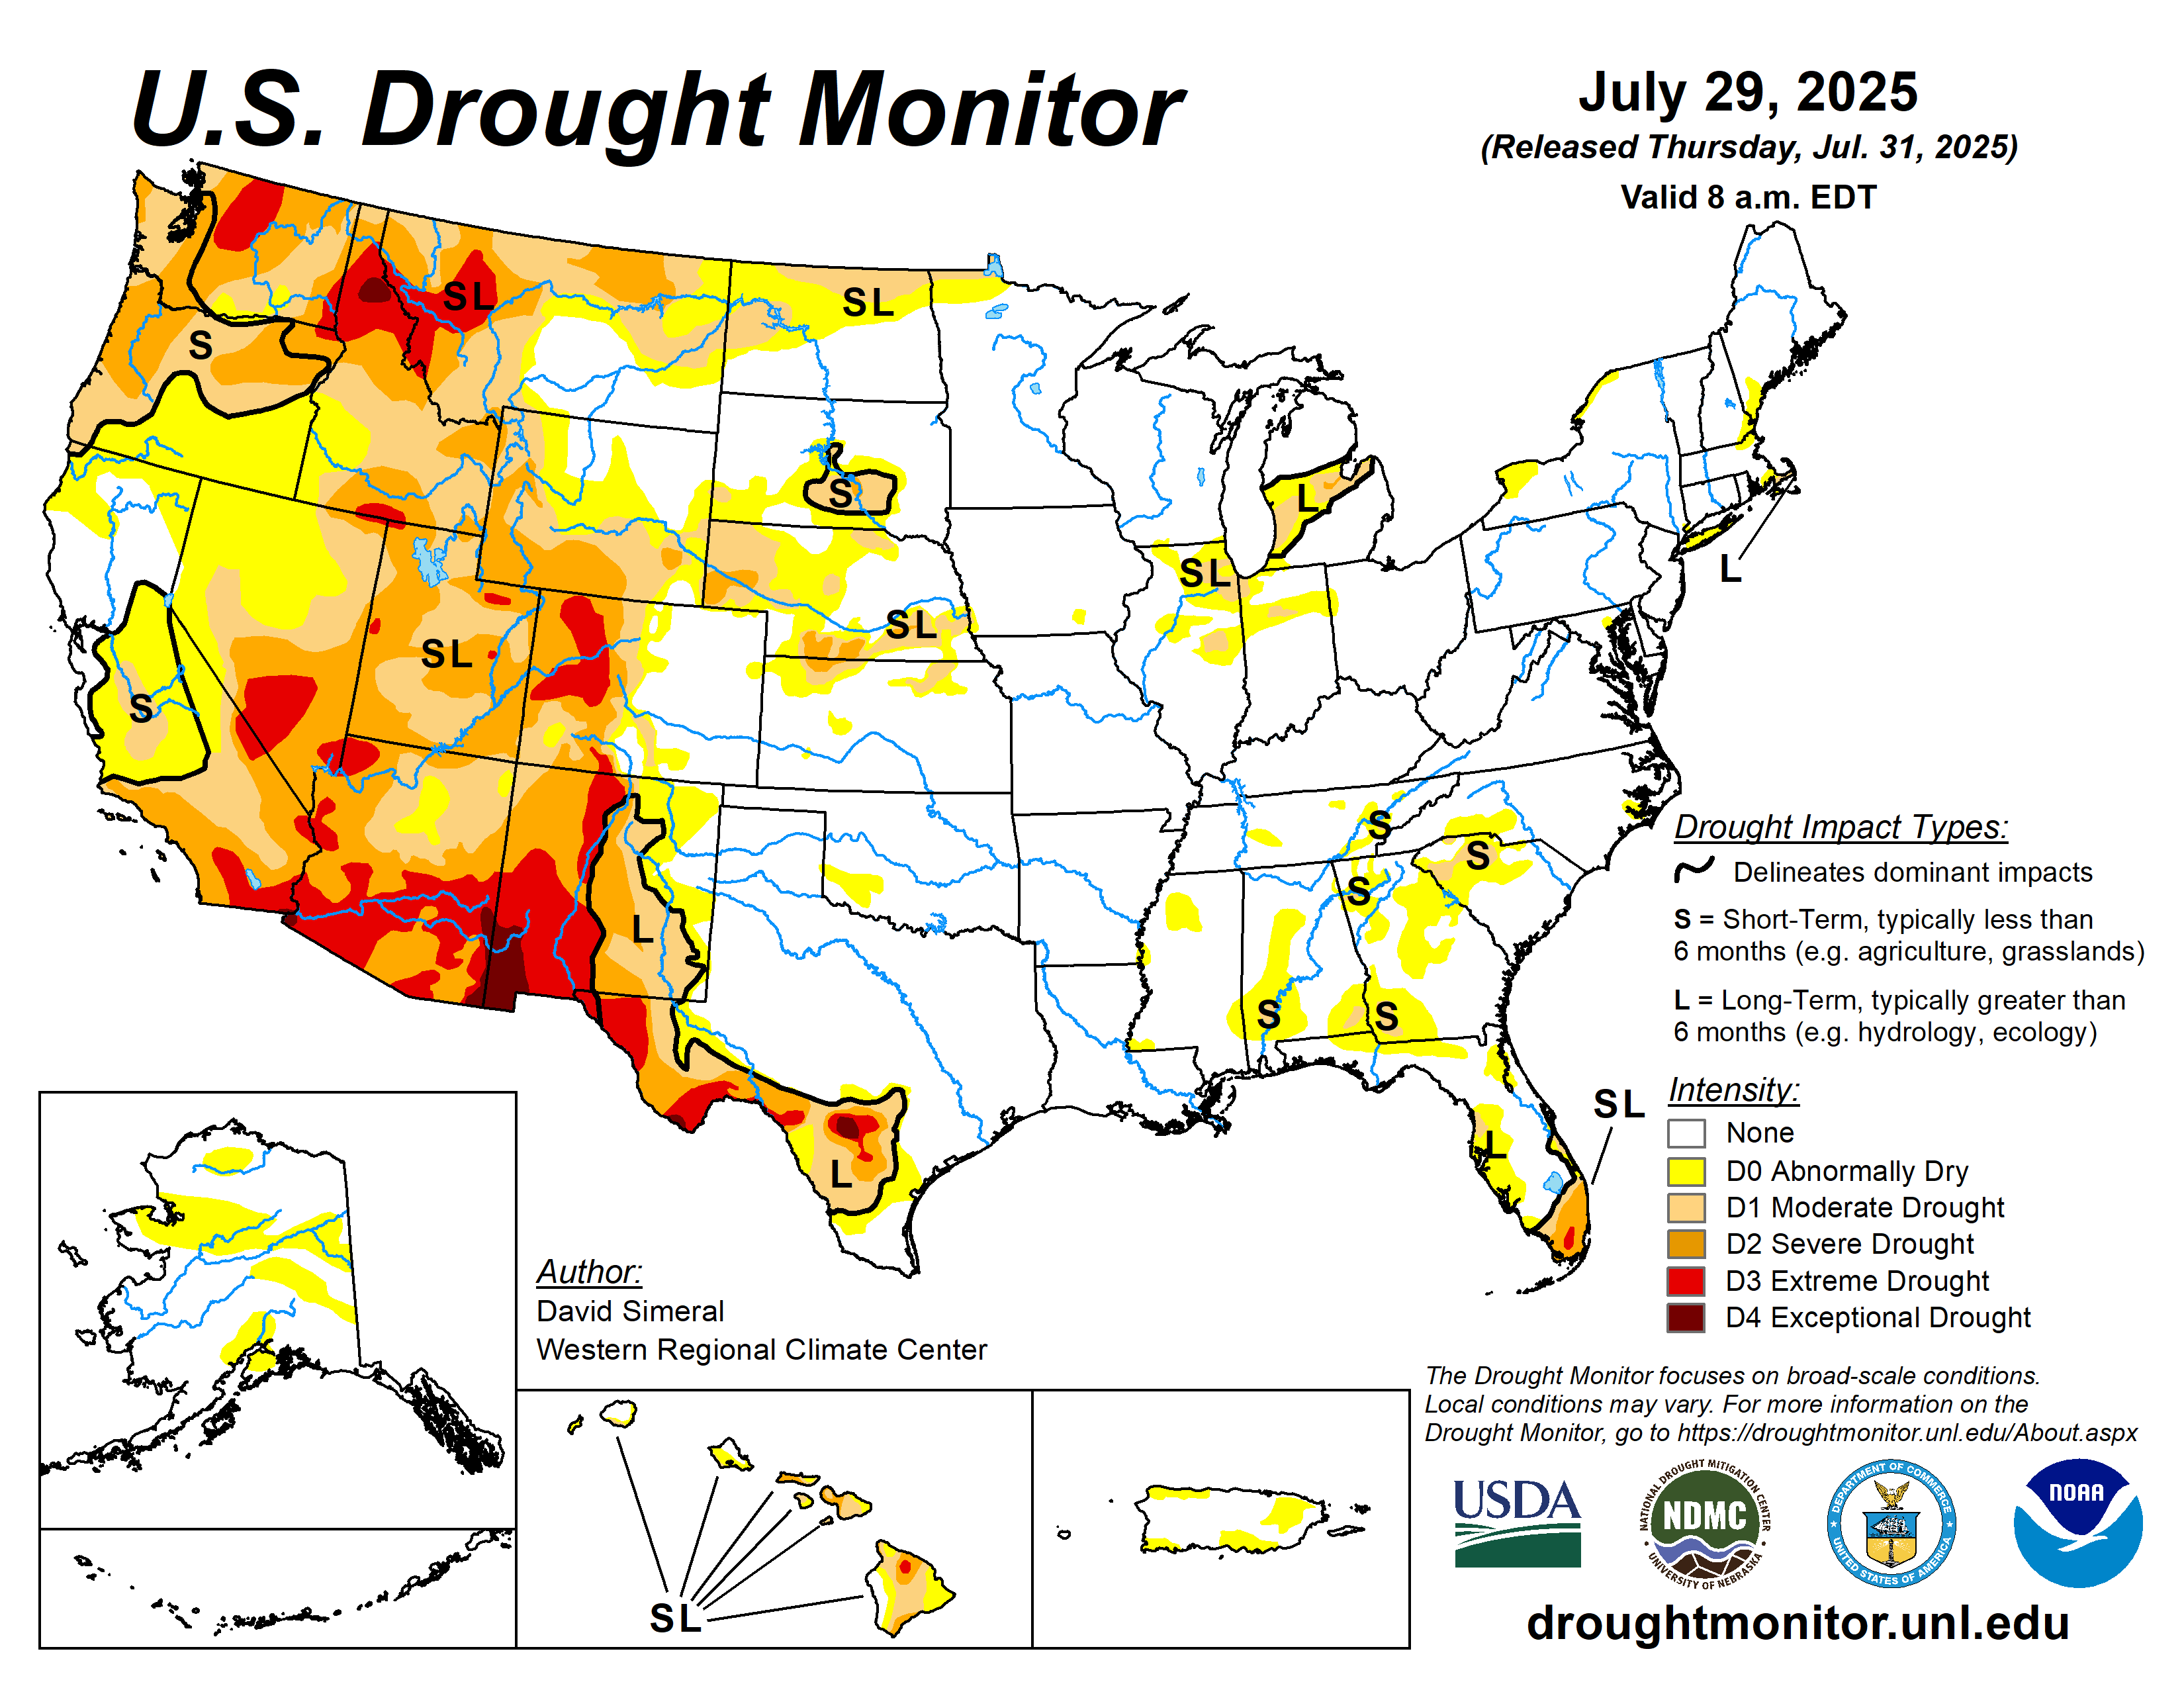
This U.S. Drought Monitor (USDM) week saw continued improvement in drought-related conditions across areas of the Midwest (Michigan, Ohio, Indiana, Illinois, Iowa, Minnesota), central and northern Plains (Kansas, Nebraska, Dakotas, eastern Montana), South (Texas), and in the Desert Southwest (New Mexico). During the past week, the most significant rainfall accumulations were observed across areas of Kansas, Missouri, Iowa, and Minnesota, where they ranged from 3 to 7+ inches. Elsewhere, short-term precipitation shortfalls (past 30 to 60 days) led to continued expansion of Abnormally Dry (D0) areas across the Southeast states including the Carolinas, Georgia, and Alabama as well as the introduction of isolated areas of Moderate Drought (D1) in Alabama, Georgia, and South Carolina where agriculture-related drought impacts are being reported. In the South, drought conditions continued to improve in western portions of Texas as well as in areas of eastern New Mexico where monsoonal storms have provided some minor relief to areas experiencing long-term drought. In the West, conditions continued to deteriorate across the Pacific Northwest (Oregon, Washington, Idaho) and areas of the Intermountain West (Wyoming, Utah, and Colorado), while areas of eastern Montana saw improvement in drought in response to precipitation events during the past few weeks. In terms of reservoir storage in the West, California’s major reservoirs continue to be at or above historical averages for the date (July 29), with the state’s two largest reservoirs, Lake Shasta and Lake Oroville, at 105% and 116% of average, respectively. In the Southwest, the U.S. Bureau of Reclamation is reporting (July 27) Lake Powell at 32% full (46% of average), Lake Mead at 31% full (51%), and the total Colorado system at 39% of capacity (compared to 44% of capacity the same time last year)…

High Plains

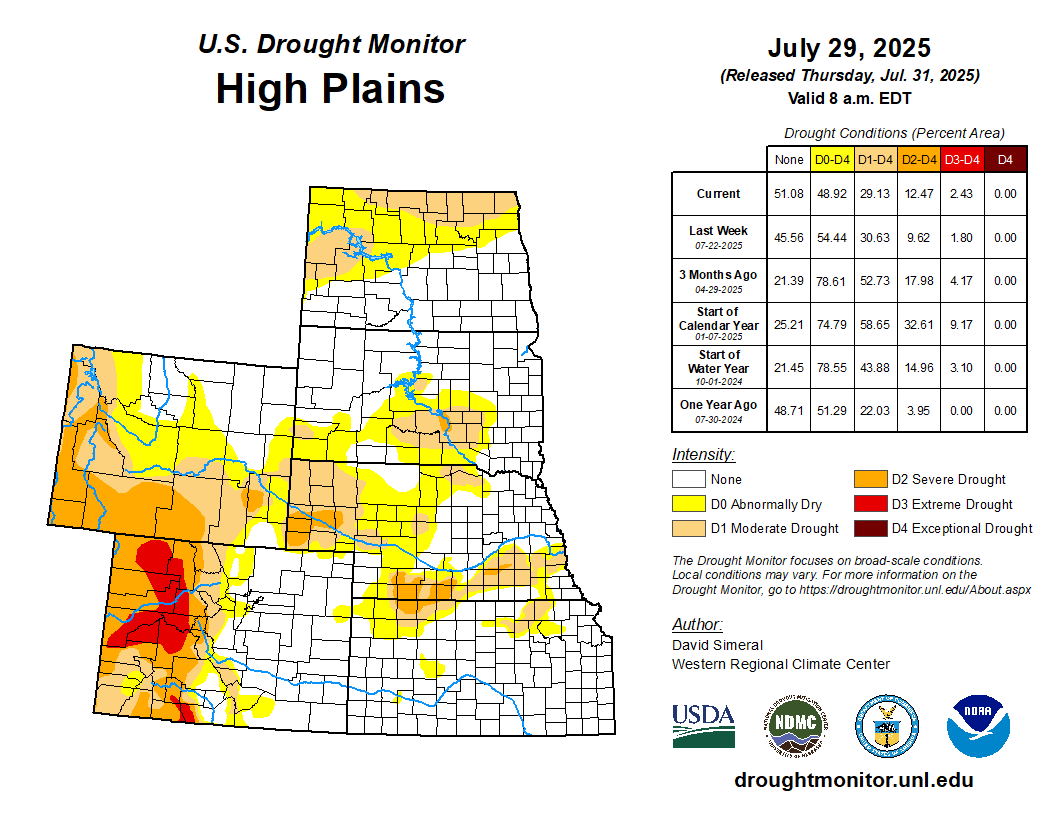
On this week’s map, improvements continued from Kansas to North Dakota after another week of scattered shower activity with light-to-moderate accumulations. During the past 30 days, drought-related conditions have improved significantly in northern Kansas, eastern Nebraska, southeastern and southwestern South Dakota, and southwestern North Dakota as evidenced in a variety of drought monitoring products including streamflows, soil moisture, and vegetation health indicators. However, conditions have degraded in other parts of the region, including central South Dakota and northern North Dakota. For the week, average temperatures were generally above-normal average (1 to 6 degrees F) across the region, with eastern portions experiencing the largest departure, while far western portions of the Dakotas observed temperatures 1 to 4 degrees F below normal…
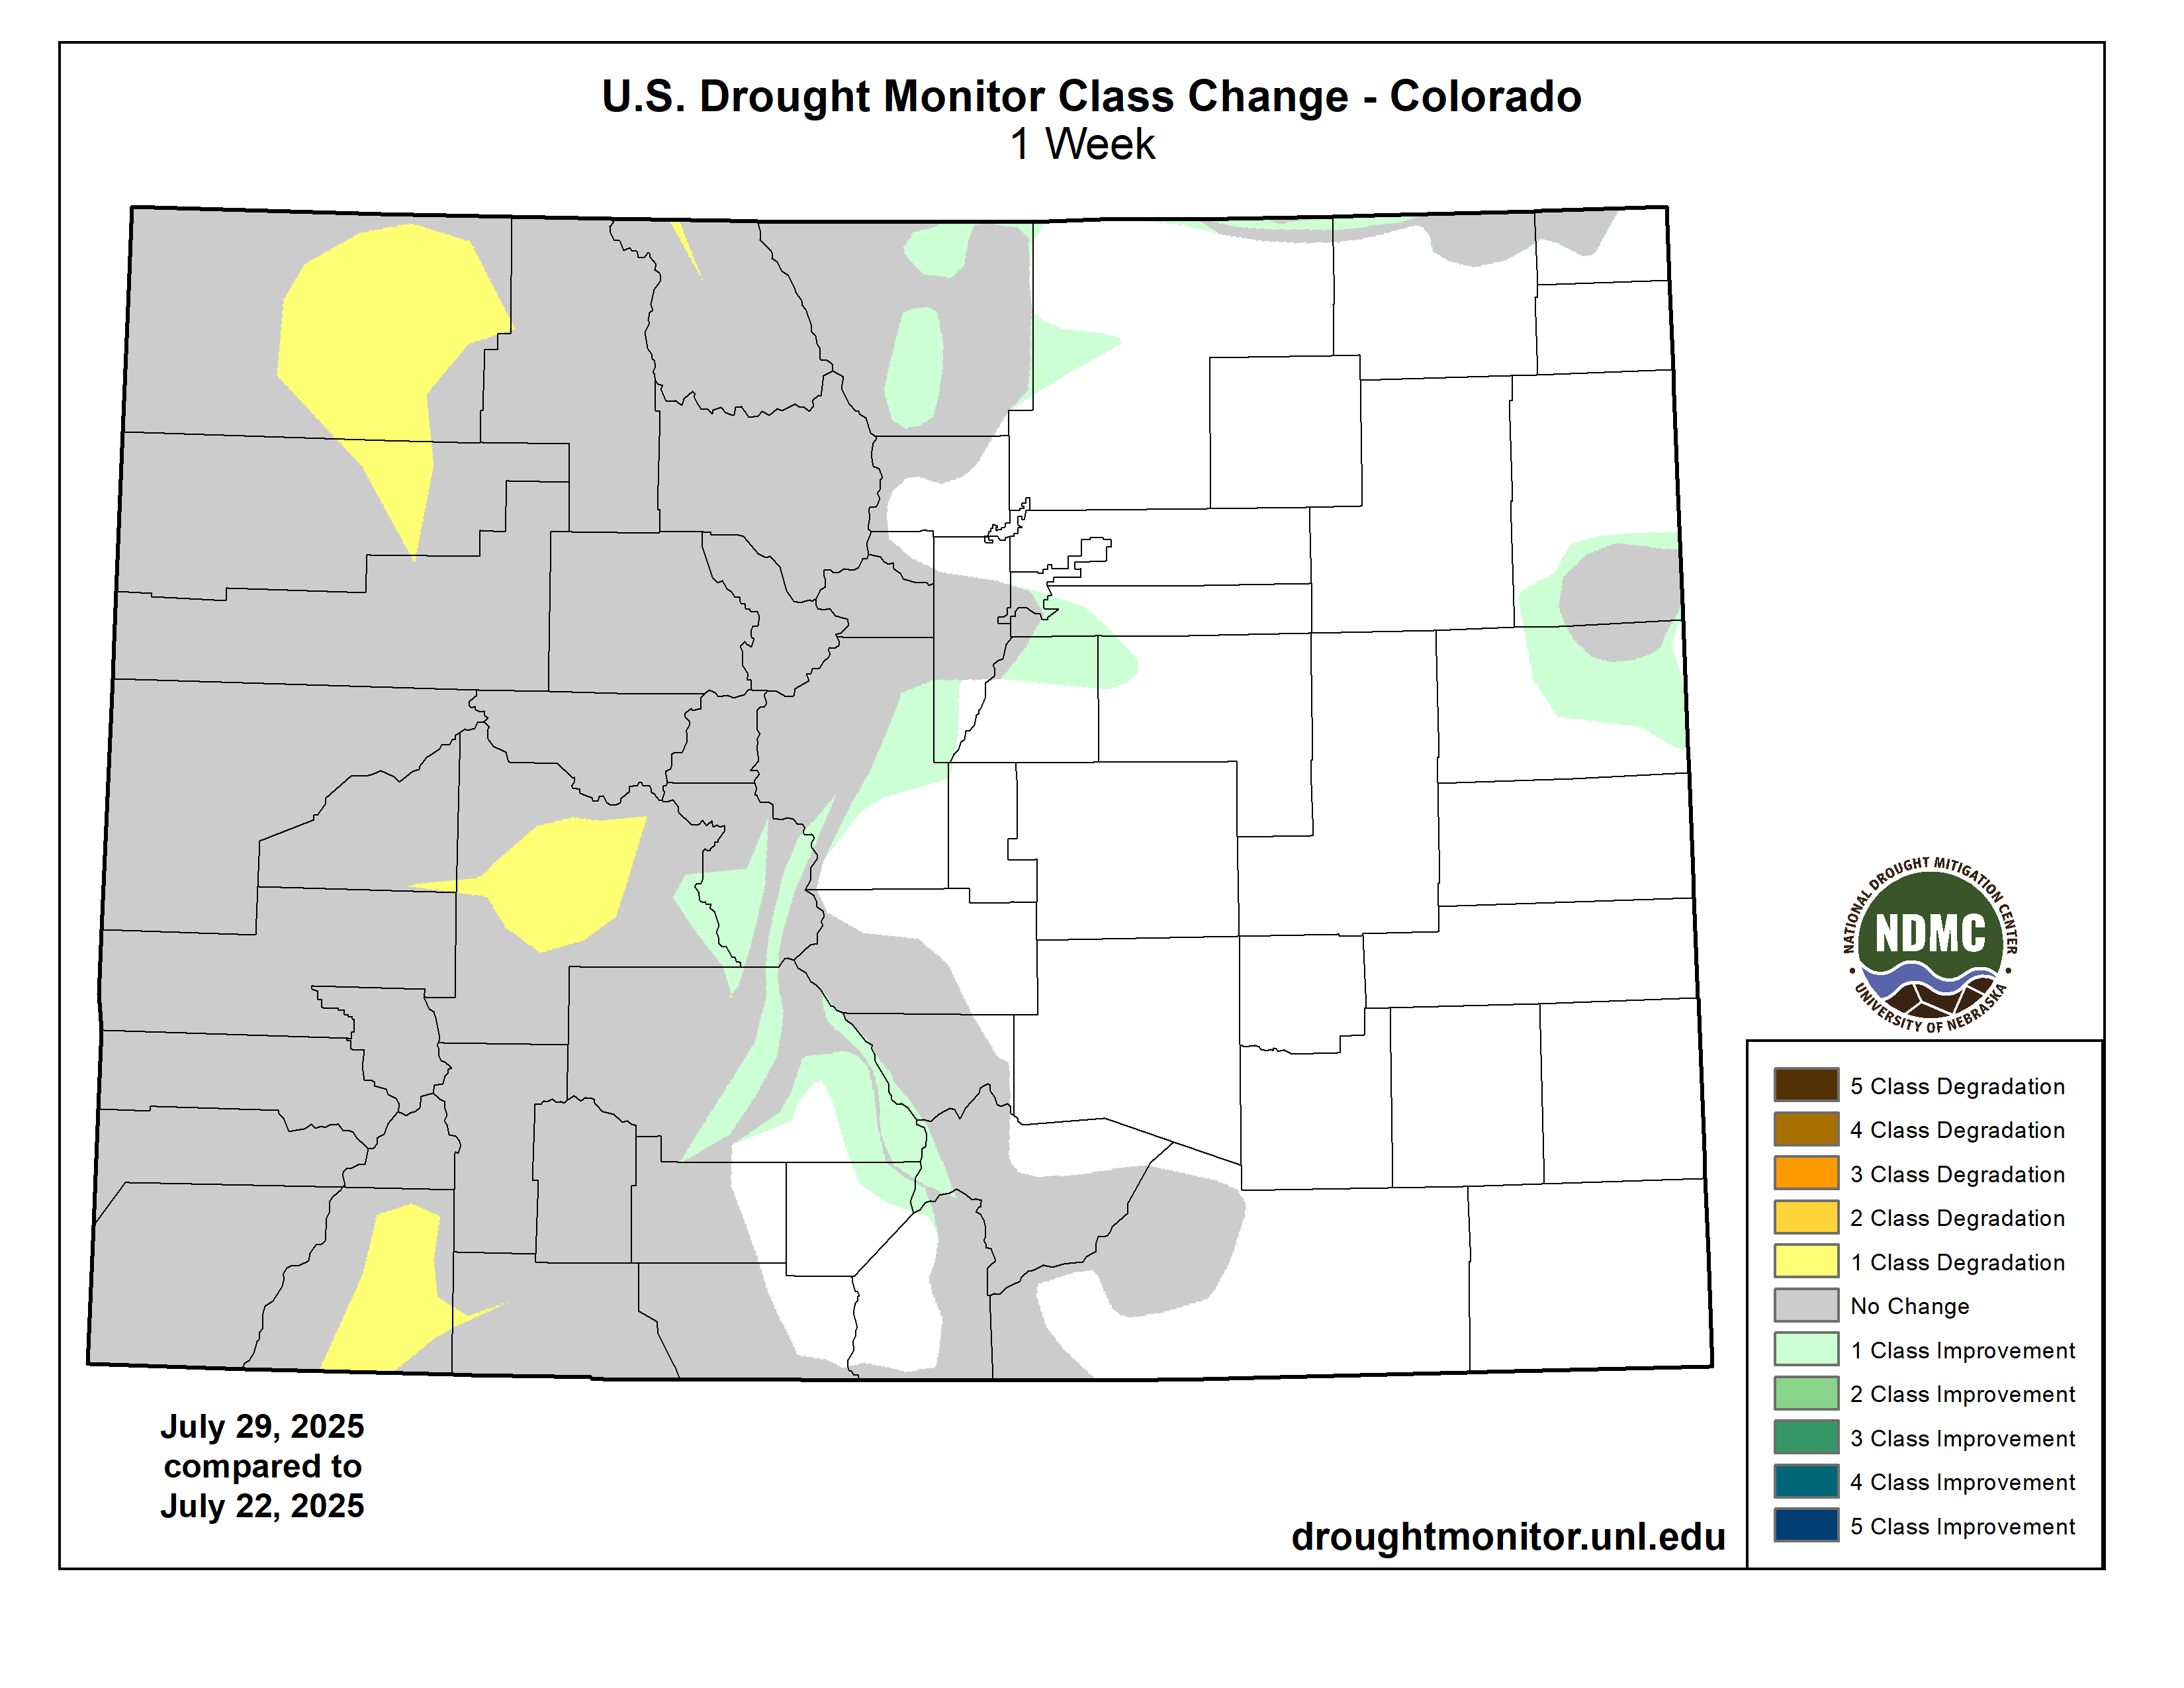
Colorado Drought Monitor one week change map ending July 29, 2025.

West

Out West, generally dry conditions prevailed over much of the region except for some isolated shower activity in northeastern California, northwestern Nevada, eastern New Mexico, eastern Colorado, and Montana. On the map, degradations were made across areas of the Pacific Northwest (Oregon, Washington, Idaho) and Intermountain West (Utah, Wyoming, Colorado). In the Pacific Northwest, streamflow activity continues to be well below normal levels across the Cascade Range of Oregon and Washington as well as in the mountain ranges of northern Idaho and western Montana. Similarly, poor surface water conditions were present in many streams and rivers of western Wyoming, Utah, western Colorado, central Arizona, and northern New Mexico. For the week, average temperatures were below normal across most of the region, with anomalies ranging from 2 to 10+ degrees F and the greatest departures observed across California and Nevada…

South

On this week’s map, improvements were made in areas of South Texas and the Trans Pecos region of Texas in response to above-normal precipitation during the past 30-120 days. In these regions, improvements were made in numerous drought categories (D1-D3). In other areas of the region, degradations occurred in southwestern Oklahoma, northern Mississippi, and central Tennessee, where rainfall has been below normal during the past 30 to 60 day period. For the week, average temperatures were above normal in the eastern and northern areas of the region, with anomalies ranging from 2 to 8 degrees F. Conversely, the western extent of the region, including areas in the southern half of Texas, experienced temperatures ranging from 1 to 4 degrees F below normal…
Looking Ahead

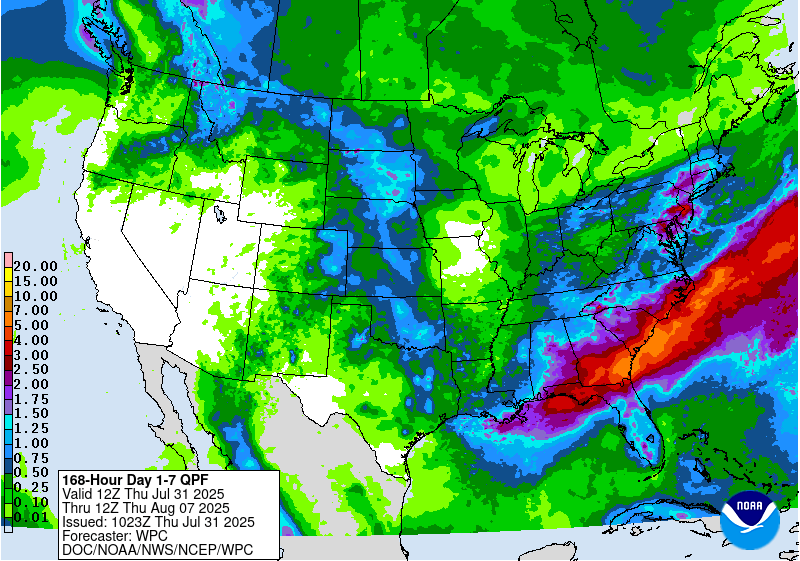
The NWS Weather Prediction Center (WPC) 7-Day Quantitative Precipitation Forecast (QPF) calls for generally dry conditions across much of the western U.S. except for some light shower activity (accumulations generally <1 inch) across areas of the Rockies (Idaho, Montana, Wyoming, Colorado) and mountain ranges of New Mexico. East of the Rockies, light-to-moderate accumulations (ranging from 1 to 4 inches) are expected across areas of the Plains states with the heaviest accumulations expected in western Oklahoma. In the lower Midwest, Mid-Atlantic, South (Gulf Coast areas), and portions of the Southeast, 1 to 5+ inch accumulations are forecast, with the heaviest accumulation expected along the coastal plains of Carolina and Georgia. The Climate Prediction Center (CPC) 6-10-day outlooks call for a moderate-to-high probability of above-normal temperatures across the Desert Southwest, southeastern portions of the Intermountain West, Plains, Midwest, New England, South, and southern portions of the Southeast region. In contrast, below-normal temperatures are forecast for areas of the West, including southern California, the Great Basin, and Pacific Northwest. In terms of precipitation, there is a low-to-moderate probability of above-normal precipitation across the Pacific Northwest, northern portions of the Intermountain West, northern Plains Midwest, Mid-Atlantic, and Southeast. Elsewhere, below-normal precipitation is expected across the southern half of the western U.S., southern Plains, and Texas.
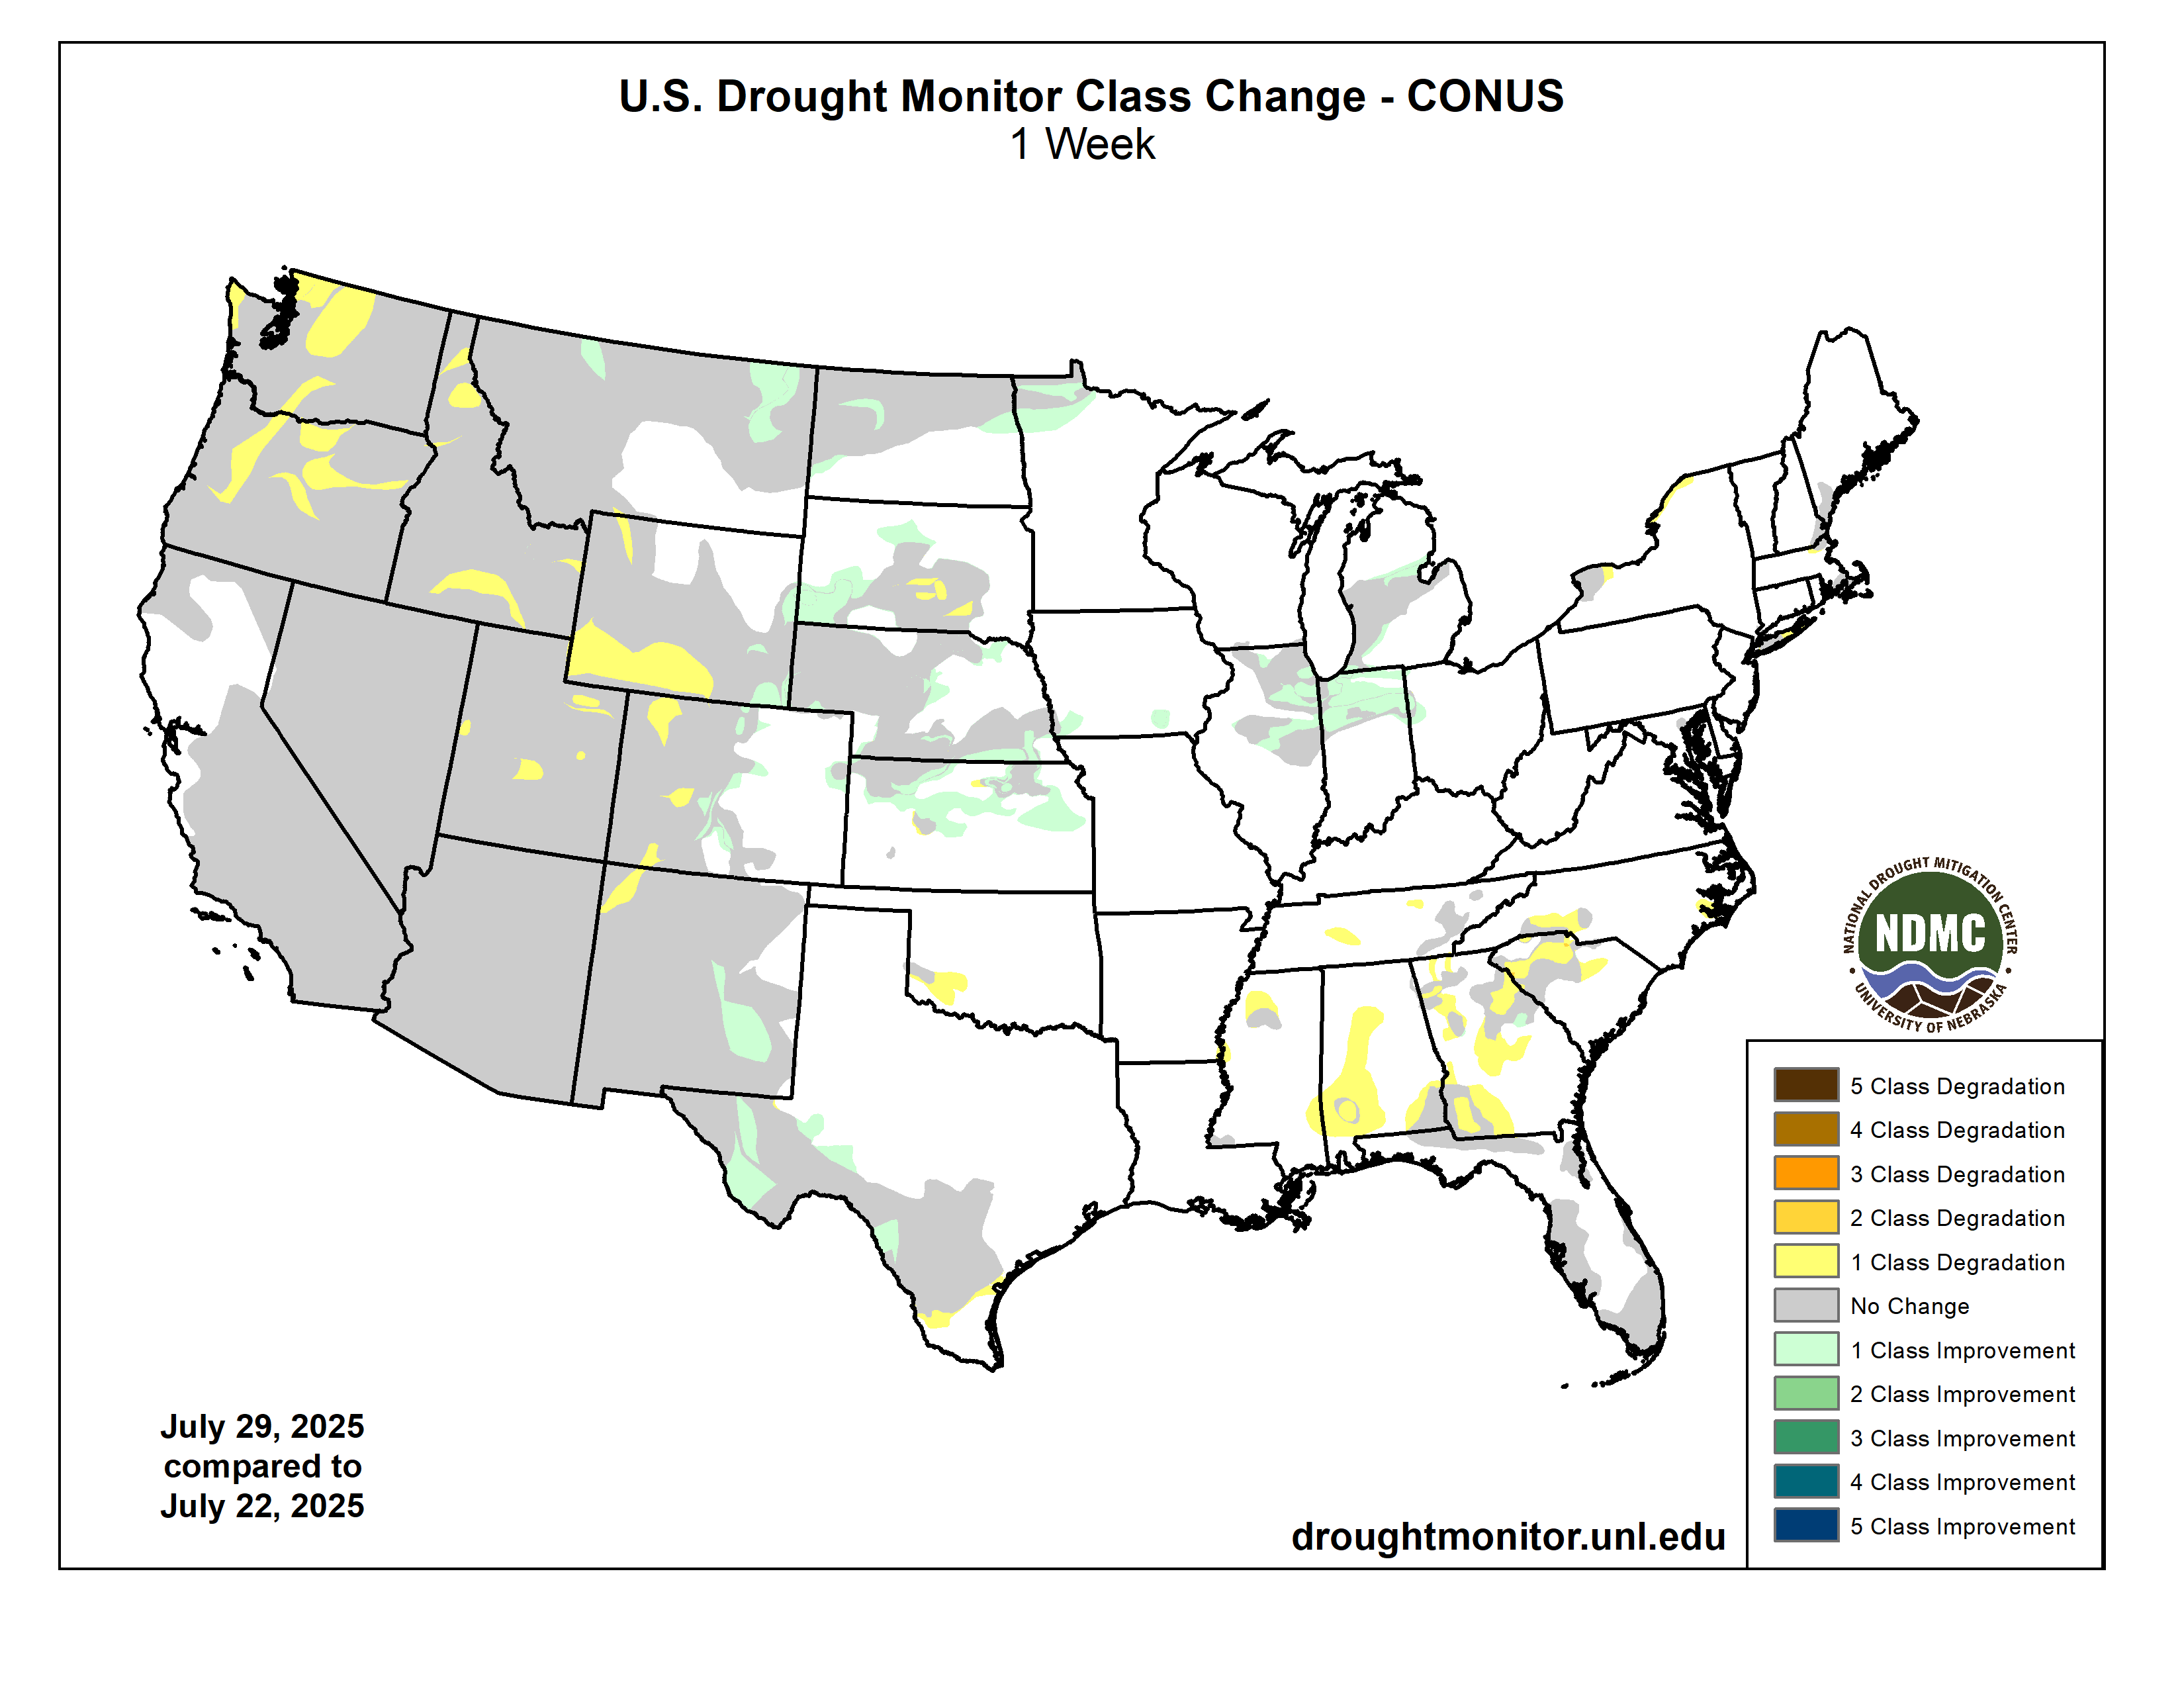
US Drought Monitor one week change map ending July 29, 2025.

#Colorado’s peak flash flood season — Russ Schumacher (Colorado Climate Center) #monsoon

Click the link to read the blog post on the Colorado Climate Center website (Russ Schumacher):

July 27, 2025

NOTE: Russ wrote this earlier in the week.

It’s been called the “summer of flash flooding” in the US. The worst was the tragic flooding in Texas Hill Country on July 4, which took over 135 lives. But there have also been significant flash floods in other places across the country, from Ruidoso, New Mexico, to West Virginia, to Chicago, to the Washington, DC area, and many other places in between.

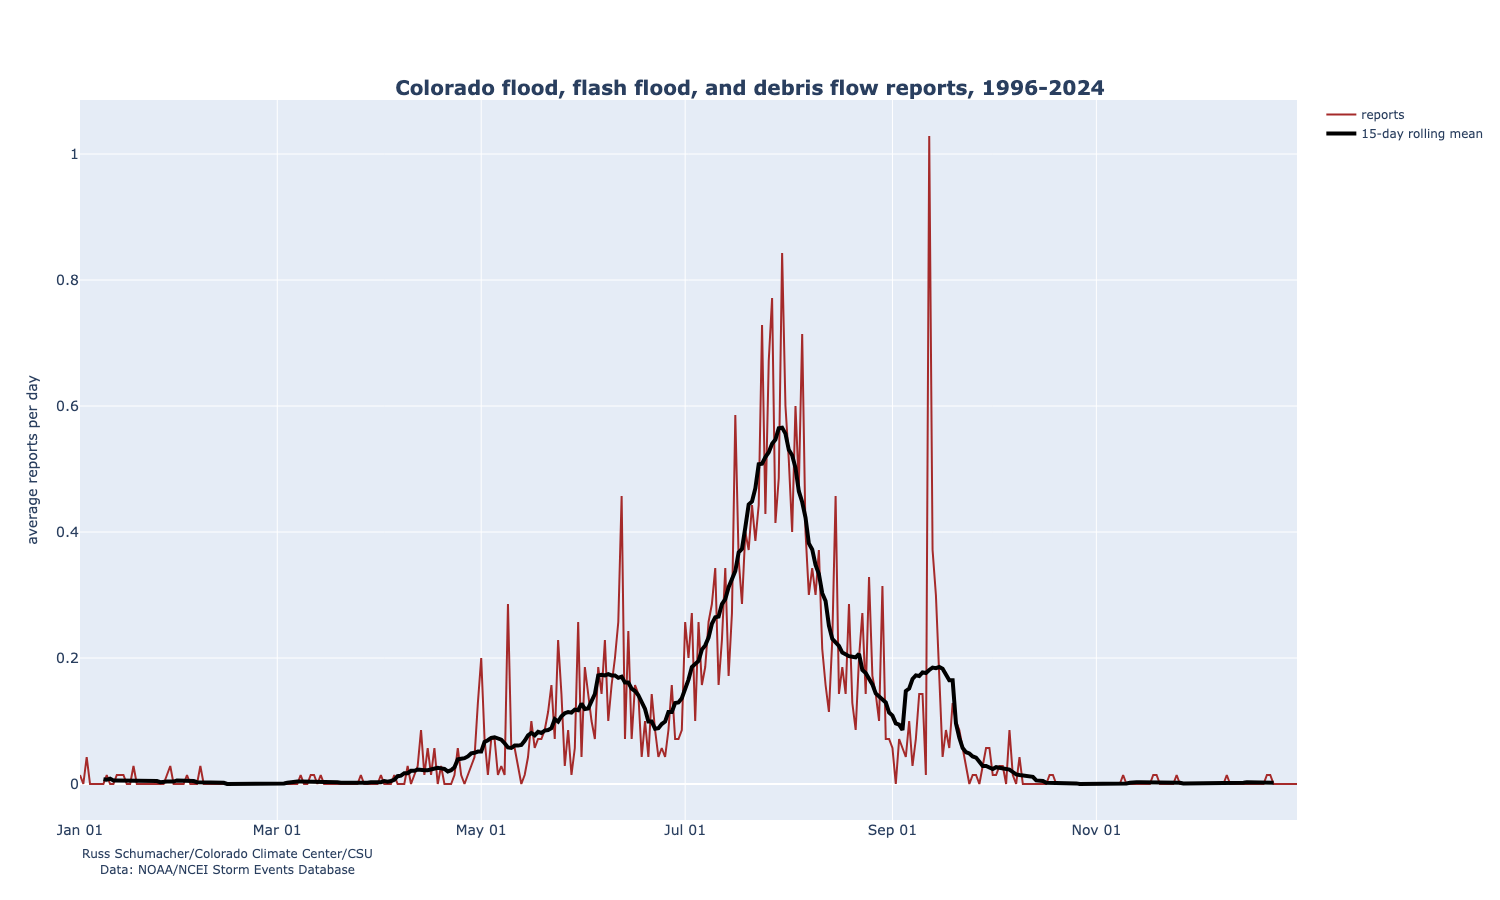
Here in Colorado, thankfully we haven’t experienced a lot of flash flooding so far this summer. There have been a handful of flash flood warnings and reports, but no major incidents. However, we are now in the midst of the peak season for flash floods. The last 10 days or so of July and the first week of August are when we’ve historically seen by far the most flash flood activity across the state.

Average number of reports of flood, flash flood, or debris flow in Colorado from 1996-2024. The brown line shows the average number of reports on each calendar day; the thick black line is a 15-day rolling average. Data source: NOAA/NCEI Storm Events Database.

One of the worst disasters in state history, the 1976 Big Thompson flood, happened on July 31. The Fort Collins flood of 1997: July 28. The Saguache Creek flood in the San Luis Valley in 1999: July 25. The heavy rain on the Grizzly Creek burn scar that closed I-70 for weeks in 2021: several rounds of storms in late July, especially on the 30th and 31st. And that’s just a sampling; the list could go on and on! 

It’s not the only time of year at which flash flooding happens in Colorado. The graph above shows another peak in early to mid June, which is when some other historic floods have occurred like the 1921 Arkansas River flood and the 1965 flood on the South Platte in Denver. There’s also a big spike in September associated with the Great Colorado Flood of September 2013. Still, it’s remarkable how sharp of a peak there is in late July into early August.

What’s so special about late July and early August?

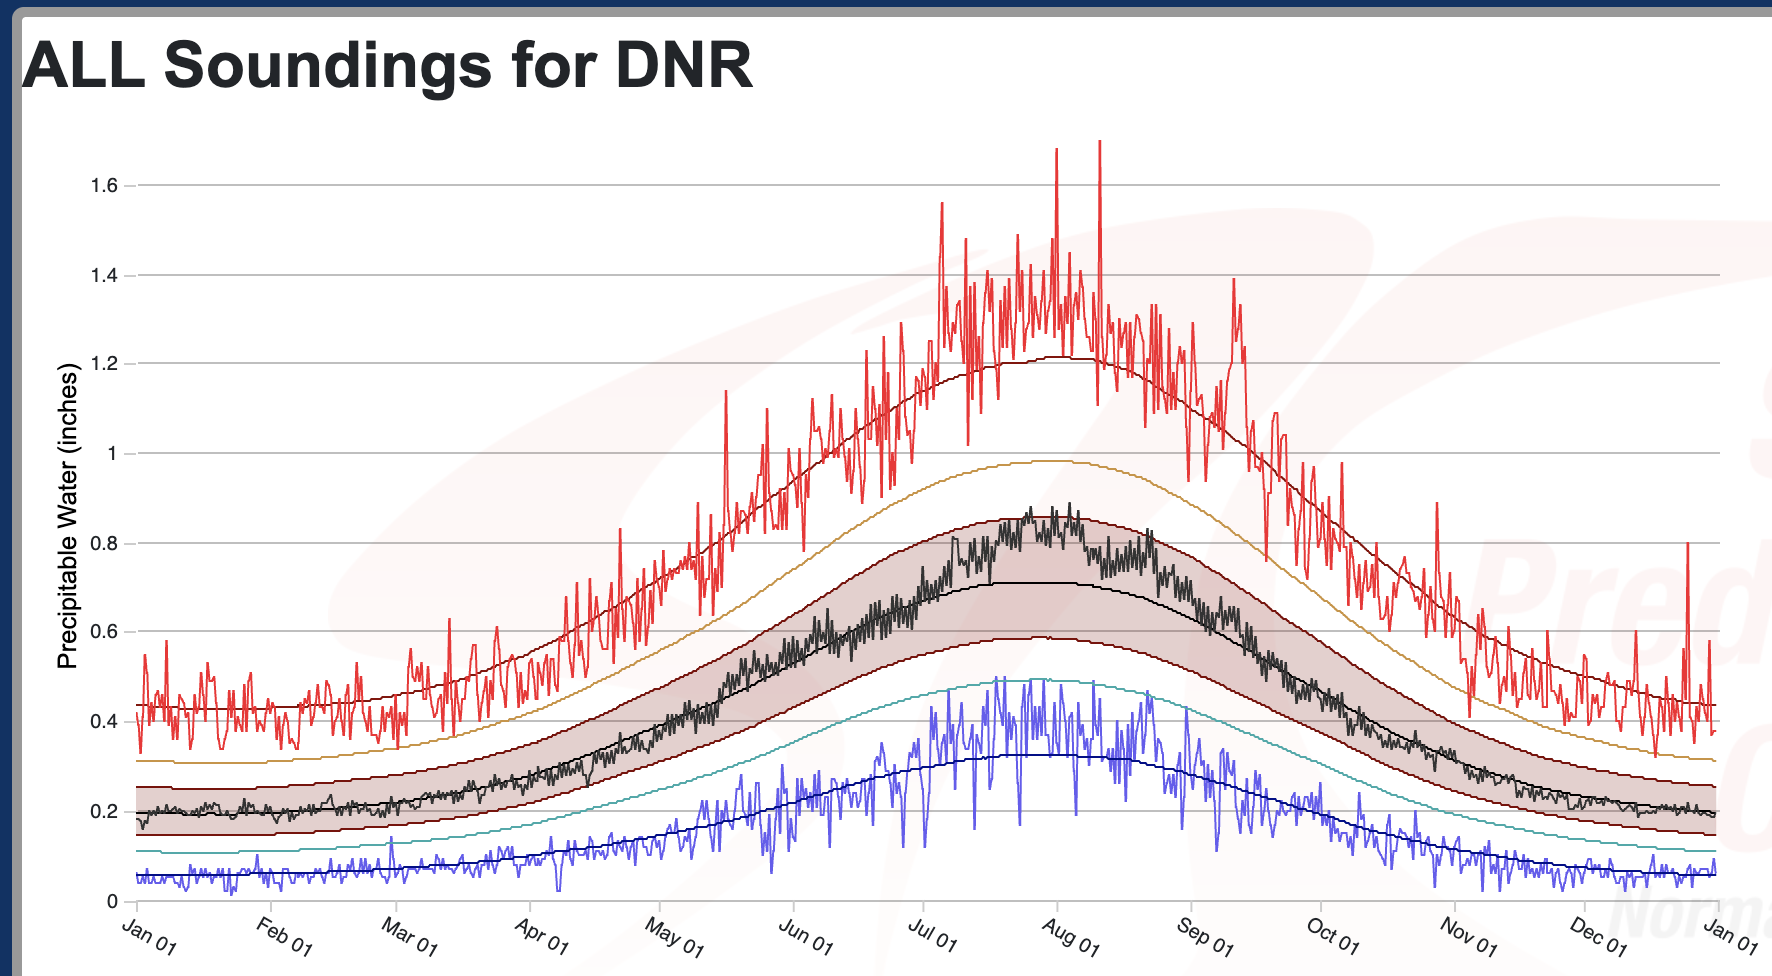
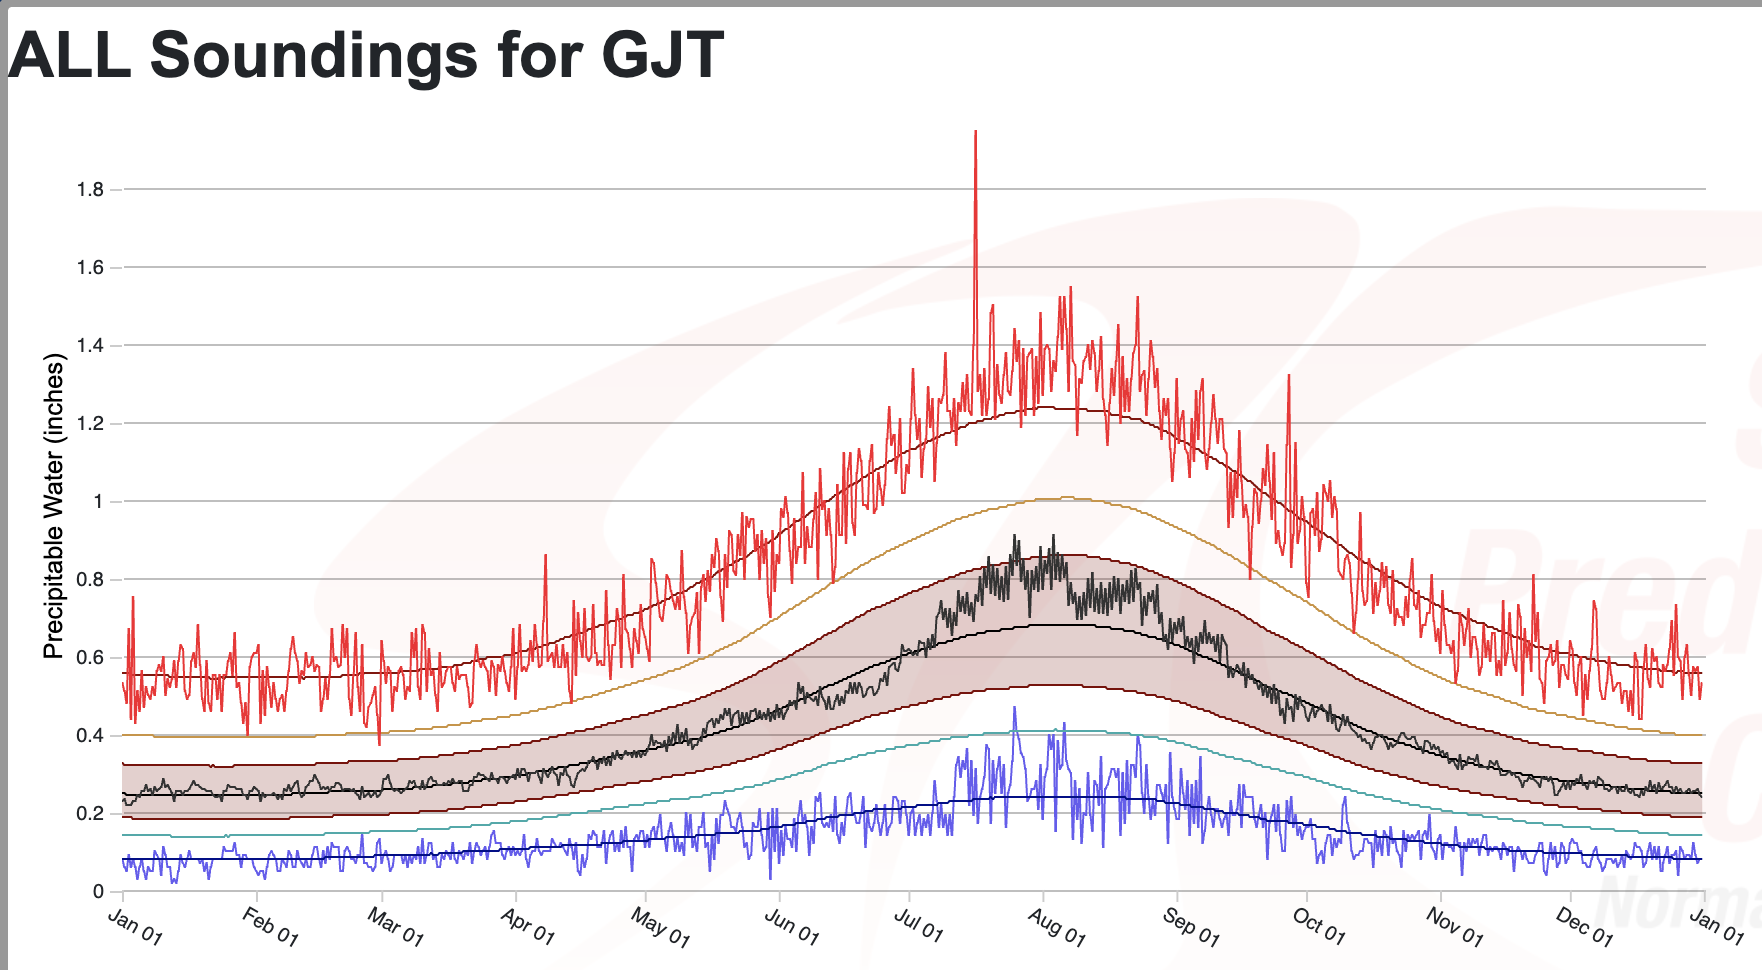
Meteorologically, the end of July through the beginning of August is when atmospheric moisture is at its highest on average. The North American Monsoon regularly transports moisture into Colorado in late summer, and at both Grand Junction and Denver, the precipitable water—the total amount of water vapor measured throughout the atmosphere—peaks right around August 1.

Annual cycle of precipitable water at Denver. The daily average is in the black line, the daily maximum in red, and the daily minimum in blue, with rolling averages also shown. From the NOAA Storm Prediction Center sounding climatology site.
Annual cycle of precipitable water at Grand Junction. The daily average is in the black line, the daily maximum in red, and the daily minimum in blue, with rolling averages also shown. From the NOAA Storm Prediction Center sounding climatology site.

At this time of year, the winds through the atmosphere tend to be pretty weak, as the jet stream is positioned far to our north. That means that when storms do form, they don’t tend to move very quickly, and in some situations can stay over the same location for hours. And they have plenty of moisture to tap into (at least by Colorado standards), leading to large rainfall accumulations. 

Flash flooding isn’t just about the rainfall, however. It also matters *where* that rain falls. When slow-moving, heavily raining storms develop over complex terrain, or over wildfire burn scars, that water can quickly turn into runoff or a debris flow. The combination of extreme rain rates in a steep canyon led to the Big Thompson flood. There were many unfortunate parallels between this month’s tragic flooding in Texas and the Big Thompson flood, including a rapid “wall of water”, people visiting the area on a holiday weekend, and challenges with communicating warnings, among others. Eve Gruntfest’s analysis of what people did during the Big Thompson flood remains relevant and will provide a point of comparison for studies of the 2025 Texas hill country disaster.

Schematic depiction of the processes that led to the 1976 Big Thompson Flood. From this 2006 USGS publication, which credits the University Corporation for Atmospheric Research for the original.

What can we expect during flash flood season this year?

Last week, on July 22-24, there were some storms that produced heavy rainfall, and several flash flood warnings were issued across the state, but no significant flash flooding was reported. Then, the moisture moved out, resulting in very hot and dry conditions for late July. But the outlook for the coming week has some reason for concern, in part because it’s our climatological peak in flash flooding, and also because a significant surge of moisture will move into Colorado. 

Following the near-record highs and dry conditions on Sunday and Monday, a cold front is expected to move through Colorado sometime on Tuesday, with winds from the east (i.e., upslope flow) and plentiful moisture behind it. This figure from NOAA’s Global Ensemble Forecast System shows the precipitable water at Denver going from extremely low on Sunday (below the climatological 10th percentile) to extremely high (above the 90th percentile) on Wednesday. Anytime the PW gets above 25 mm (~1 inch) it warrants paying attention to for the potential of heavy rainfall.

NOAA’s Global Ensemble Forecast System predictions of precipitable water at Denver, for the forecast initialized early on Sunday the 27th. Each colored line represents a different member of the ensemble, and the thick black line is the ensemble mean. The dashed gray lines show the 10th and 90th percentiles and the solid gray line shows the median, based on historical radiosonde observations.

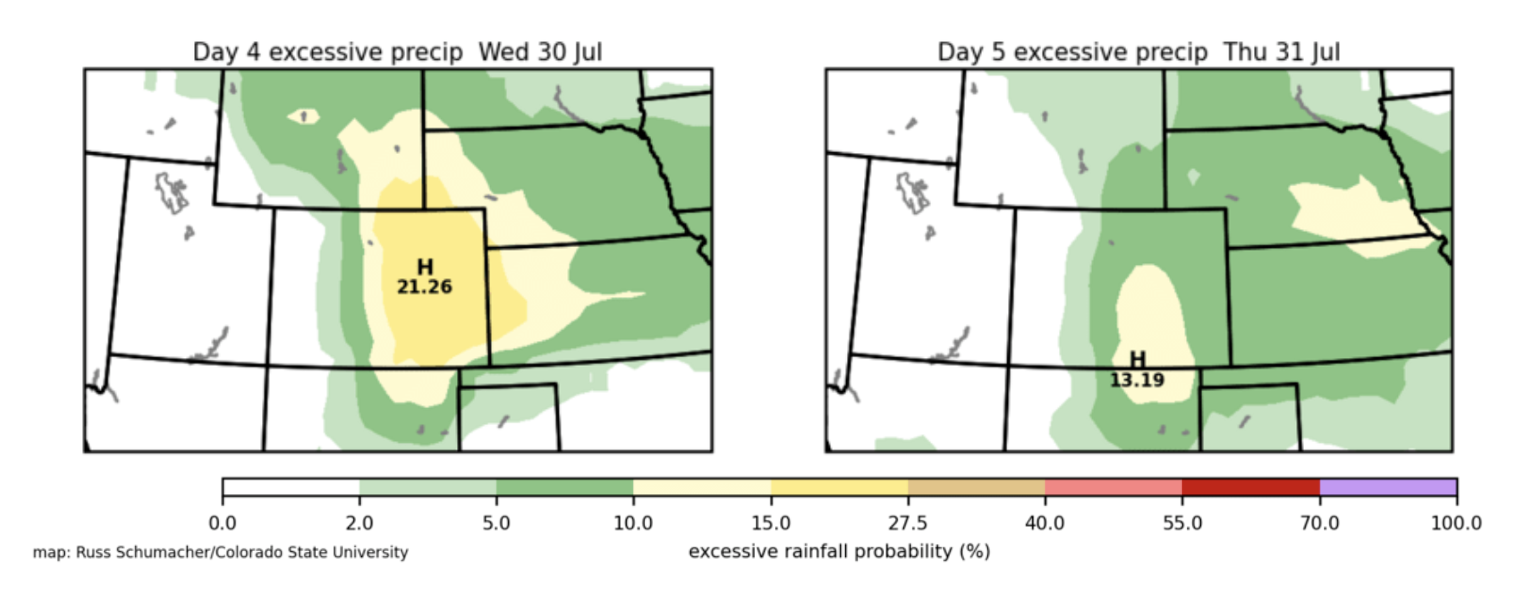
For the last several years, my research group has developed tools that use machine learning to identify the probability of excessive rainfall and severe weather. These models have been consistently showing a strong signal for heavy rainfall along the Front Range on Wednesday, July 30th. In fact, for the current version of these models that have been running since 2020, this is the first time that both models (which were trained using slightly different definitions of ‘excessive rainfall’) have had probabilities greater than 20% four days in advance along the northern Front Range. Probabilities are relatively high for Thursday the 31st as well.

Graphics showing the probability of excessive rainfall from the Colorado State University-Machine Learning Probabilities system, issued on Sunday July 27, and valid for (left) Weds July 30 and (right) Thurs July 31. These zoomed in versions are available on this <a href=”https://schumacher.atmos.colostate.edu/weather/“>website</a>, or visit the main <a href=”https://schumacher.atmos.colostate.edu/hilla/csu_mlp/“>CSU-MLP site</a> for more information about the models.

Flash flooding remains extremely difficult to forecast, because it requires predicting both the rainfall itself, and what will happen to that water once it hits the ground. So it’s too early to say exactly what will play out this week. But when forecast models are pointing to the potential for heavy rainfall that lines up with the climatological peak in flash flooding (the last week of July), it’s worth keeping a close eye on. If you live in a flood-prone area, or will be traveling through a beautiful Front Range canyon this week, take a moment to think about how you’ll get warnings if they are issued (do you have a NOAA weather radio?), and what you might do in case of a flash flood.

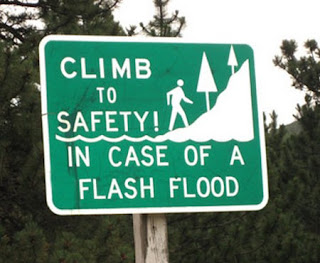
Sign that says “Climb to safety! In case of a flash flood”, which are seen in many canyons in Colorado.

No, there is not plenty of water for data centers: And, yes, we should worry about it, along with the facilities’ power use — Jonathan P. Thompson (LandDesk.org) #ColoradoRiver #COriver #RioGrande #aridification

A satellite view of Mesa, Arizona, showing a handful of the 91 energy- and water-intensive data centers in the greater Phoenix metro area. Source: Google Earth.

Click the link to read the article on The Land Desk website (Jonathan P. Thompson):

July 29, 2025

📈 Data CENTER Dump 📊

When I first read a recent headline in Matthew Yglesias’s Slow Boring newsletter, I assumed it was a sort of joke to rope me into reading. “There’s plenty of water for data centers,” it said, reassuringly. “Probably the last worry you should have about either water or AI.”

Unfortunately, he wasn’t joking. But he opened his piece with a line that should have warned his readers to take everything else he said with a grain of salt:

Before I continue with my rant, I’d just like to encourage Yglesias to do a little more thinking about water scarcity before writing about it. Oh, and also, maybe consider spending a little bit of time in the water-starved West before committing punditry about it. (This is the same guy who tweeted that Sen. Mike Lee’s proposal to sell off public land was “pretty reasonable” and an “okay idea on the merits”).

Yglesias acknowledges that data centers use water, and that more data centers will lead to more water consumption. But it’s okay, he says, because “We’re not living on Arrakis, and rich countries are not, in general, abstemious in their water usage.”

No, we are not on Arrakis, but have you seen the lower reaches of the Colorado River or even the mid-reaches of the Rio Grande lately? It’s looking pretty Dune-like if you ask me.

Well, sure, Yglesias argues, but even in those places, people are doing frivolous things with water, like filling up their Super Soakers or using it to make ice cubes for their cocktails. Yes, he used those actual examples. Never mind that the potable water used each day by a single Microsoft data center in Goodyear, Arizona, could yield more than 35 million ice cubes or fill about 223,000 Super Soakers. That would be one big, drunken water fight.

Yglesias also notes that agriculture, especially growing alfalfa and other feed crops for cattle, is an even larger water consumer than Big Tech. True, for now. And he writes:

His logic appears to be: People are currently using a lot of water for all sorts of things — frivolous or otherwise. So, it should be fine to use a lot more water for data centers in perpetuity, since water is “sufficiently plentiful.” This is the sort of thinking that got the Colorado River Basin into its current mess, in which there actually may not be enough water to drink very soon if its collective users don’t change their ways. Adding a fleet of water-guzzling hyperscale data centers to places like Phoenix, Las Vegas, and Tucson, where water is anything but “sufficiently plentiful,” will only exacerbate the crisis.


A Dog Day Diatribe on AI, cryptocurrency, energy consumption, and capitalism — Jonathan P. Thompson


Researchers have tried various methods to determine how much water a single ChatGPT query or AI-assisted Google search uses as compared to, say, streaming a Netflix video or writing a standard e-mail. So far the estimates diverge wildly. An early calculation came up with a whopping 500 ml for each AI query, but the estimates have since gone down. The difficulty is due in part to the fact that water use data isn’t always publicly available, and also because data centers’ water use can vary depending on location, as do their carbon footprints.

What is clear is this: Data centers use large quantities of both energy and water, no matter where they are. The massive server banks churning away in warehouse-like buildings on the fringes of Phoenix and Las Vegas, and even in rural Washington and Wyoming, each gobble as much electricity as a small city to process AI queries, cryptocurrency extraction, and other aspects of our increasingly cloud-based society. The harder they work, the hotter they get, and the more power and water they need to cool off to the optimum operating temperature of between 70° to 80° F.

Evaporative or adiabatic cooling, where air is cooled by blowing it through moistened pads (i.e. high-tech swamp coolers), works well in arid areas like Phoenix, Tucson, or Las Vegas. They use less energy than refrigerated cooling, but also use far more water.

Data centers can also indirectly consume water through their energy use, depending on the power source. Thermal coal, nuclear, or natural gas plants need water for cooling and steam-production (some of this water may be returned to the source after use, except with zero-discharge facilities); natural gas extraction uses water for hydraulic fracturing; and solar installations can require large amounts of water for dust-suppression and cleaning. This explains how Google’s data centers withdrew 8.65 billion gallons of water globally in 2023 1.


Energy-Water Nexus Data Dump 1: Fracking — Jonathan P. Thompson


A 2023 study found that a single Chat GPT-3 request processed at an Arizona data center uses about 30 milliliters of water, compared to 12 ml per request in Wyoming. That doesn’t seem like much (it’s less than a shot-glass) until you consider that there are at least 1 billion ChatGPT queries worldwide per day and growing, using a total of some 8 million gallons of water daily, worldwide. And, training the AI at an Arizona data center would use about 9.6 million liters — or 2.5 million gallons — of additional water.

Another estimate finds the average data center uses between 1 million and 5 million gallons of water per day, onsite, which would be far more than the aforementioned Goodyear center (56 million gallons/year), but in line with a planned Google data center in Mesa, Arizona. When Google was first planning the facility back in 2019, the city of Mesa guaranteed delivery of nearly 1 million gallons of water per day. If they reach certain milestones they can use up to 4 million gallons daily, or about 4,480 acre-feet per year.

Now multiply those numbers by the more than 90 data centers of various sizes and water and energy intensity in the Phoenix area, alone, which would amount to somewhere between 14 million to 450 million gallons per day. No matter how you add it up, they collectively are sucking up a huge amount of water and power, and enough to strain even Yglesias’s purported “sufficiently plentiful” supplies (which do not exist in Arizona, by the way).

The average Phoenix-area household uses about 338 gallons of water per day, or almost 123,000 gallons per year. One of these big data centers, then, could guzzle as much water as some 10,000 homes. And yet housing developments in groundwater-dependent areas on Phoenix’s fringe must obtain 100-year assured water supply certification before they can begin building. The same is not the case for data centers.

According to Open ET maps, a 75-acre alfalfa field in Buckeye (western Phoenix metro area), uses about 156 acre-feet — or 50.8 million gallons — per year. That’s far less than the 28-acre Apple Data Center in Mesa consumes. Of course, there are the equivalent of about 3,470 alfalfa fields of that same size in Arizona (260,000 acres), meaning the total water consumption of hay and alfalfa is still greater than that of data centers. But it shows that while replacing an alfalfa field with houses would result in a net decrease in water consumption, replacing those same fields with data centers would substantially increase consumption.

And don’t forget that the 75-acre alfalfa field produces about 690 tons of alfalfa per year, which could feed quite a few dairy cows, which in turn would produce a bunch of milk for making cheese and ice cream. Just saying. Maybe it’s time to update the old saying: “I’d rather see a cow than a data center.”


Western water: Where values, math, and the “Law of the River” collide, Part I — Jonathan P. Thompson


Data centers aren’t going away. After all, they are the hearts and brains of the Internet Age. Many of us may wish that AI (not to mention cryptocurrency), which are more water- and energy-intensive than other applications, would just up and vanish. But that’s probably too much to ask for. Besides, AI, at least, does have real value. 

So what can be done to keep the data center boom from devouring the West’s water and driving its power grid to the snapping point? Here’s where Yglesias had a good point: Policymakers and utilities should adjust water and power pricing for large industrial users, i.e. data centers, to discourage waste, incentivize efficiency and recycling, and push tech firms to develop their own clean energy sources to power their facilities.

It’s imperative that utilities force data centers to pay their fair share for infrastructure upgrades made necessary by added water or power demand, rather than shifting those costs to other ratepayers, as is usually the case. Arizona should make data centers prove out their water supply, just like they do with housing developments. Plus, states should stop trying to lure data centers with big tax breaks, which ultimately are paid for by the other taxpayers. And local governments and planners should subject proposed data centers to the highest level of scrutiny, and not give in to promises of jobs and economic development if it means sacrificing the community’s water supply or the reliability of the power grid.

Proper policy isn’t a cure all, by any means. But it could mitigate the impacts of the imminent data center boom. Meanwhile, Mr. Yglesias, I will reiterate that the West, at least, does not have plenty of water for data centers, and I will continue to worry about them guzzling up what little water remains.


📖 Reading Room 🧐

  • The Land Desk is reading all of y’all’s great responses to last week’s open thread about forms of resistance. Check it out and weigh in if you haven’t already.
  • Len Necefer has had some really strong pieces on his All At Once by Dr. Lennewsletter recently, including this one musing about the opportunities for the Navajo Nation to build a recreation economy on the San Juan River (great idea!). He writes about how strange it is that he, a Navajo Nation citizen, must get a permit from the BLM to raft the river, when it borders his homeland (and is at the heart of Diné Bikeyah). I also like that he sees boating/recreational opportunities along the entirety of the river, not just from Sand Island to Clay Hills Crossing. I’ve always thought it would be super cool to boat the reaches between Farmington and Bluff (actually, I’ve always wanted to boat from Durango to Farmington to Bluff). 
  • Another Substack that’s been getting my attention is Time Zero, a podcast and Substack on “the nuclearized world.” The Wastelanding series is about the legacy of uranium mining and milling on the Colorado Plateau, the Navajo Nation, and on Pueblo lands. Very powerful stuff. 
  • The Colorado Sun’s Shannon Mullane has a good story about the Southern Ute Tribe finally getting some of its Animas-La Plata water, which was the whole reason the last big Western water project, as it’s known, was finally built.

Cisco Resort and other water buffalo oddities — Jonathan P. Thompson


1 This is not the same as consumption, which is the amount of water withdrawn minus the amount returned to the source.

Udall/Overpeck 4-panel Figure Colorado River temperature/precipitation/natural flows with trend. Lake Mead and Lake Powell storage. Updated through Water Year 2024. Credit: Brad Udall