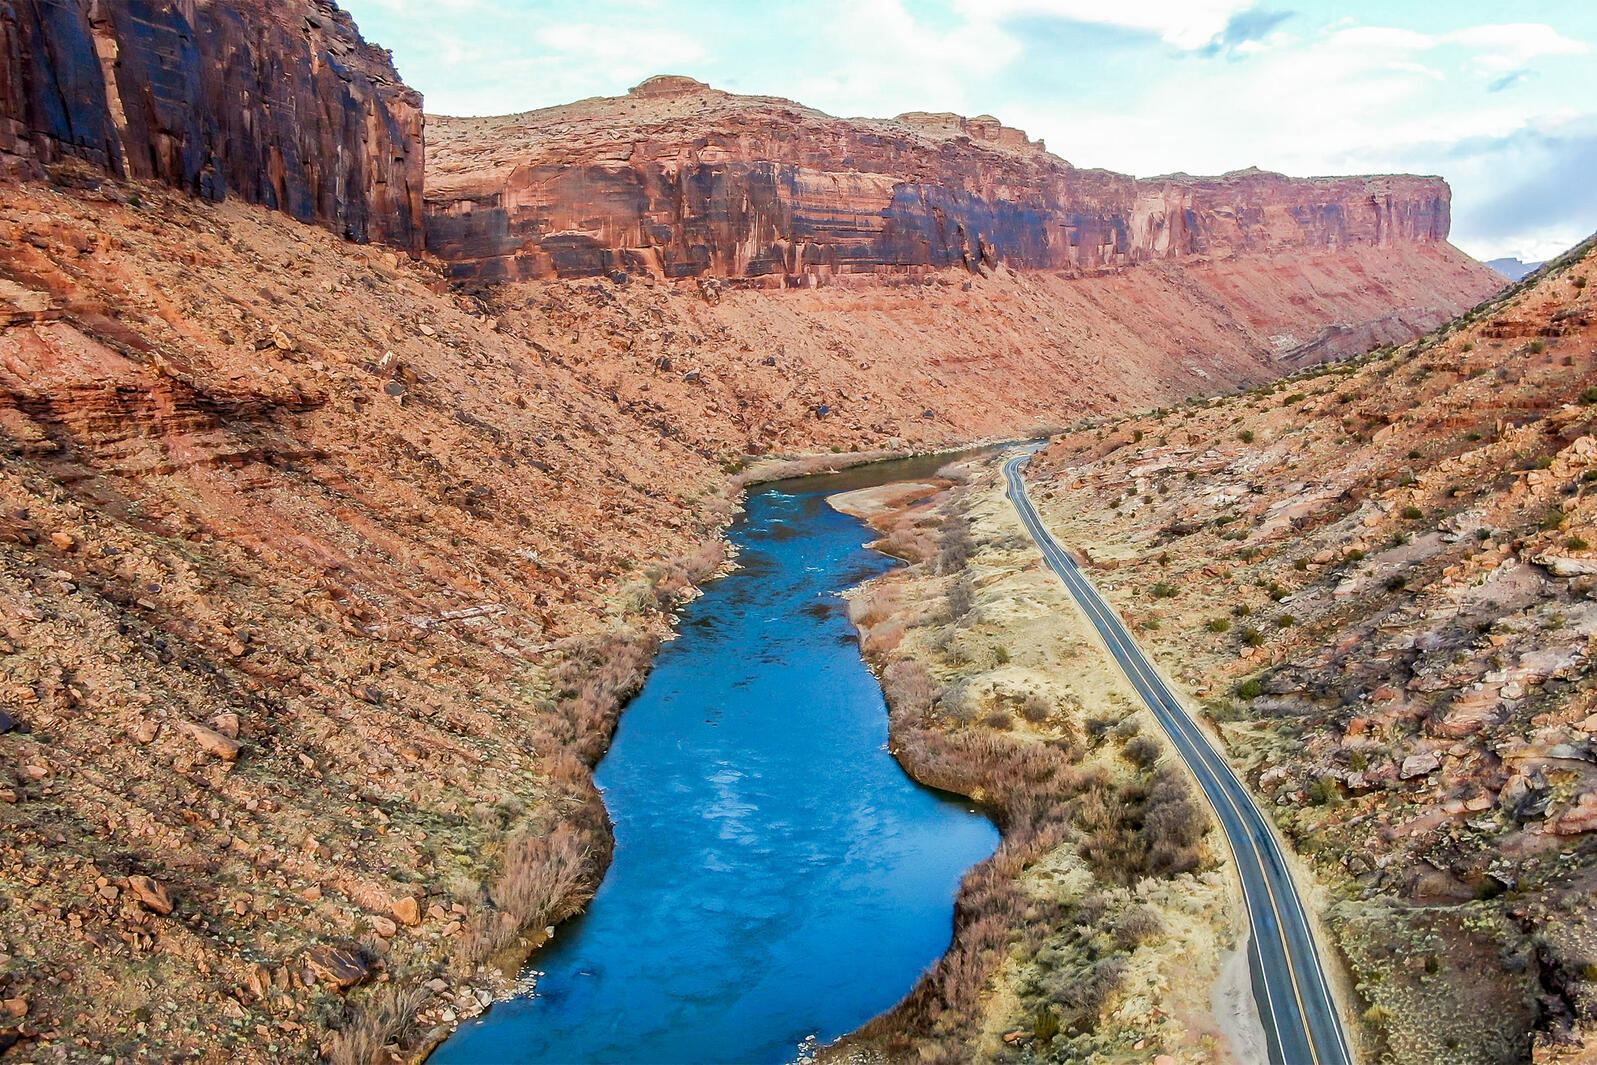
Colorado River in Grand Junction. Photo credit: Allen Best
Click the link to read the article on the CIRES website:
May 1, 2024
The Colorado River’s future may be a little brighter than expected, according to a new modeling study from CIRES researchers. Warming temperatures, which deplete water in the river, have raised doubts the Colorado River could recover from a multi-decade drought. The new study fully accounts for both rising temperatures and precipitation in the Colorado’s headwaters, and finds precipitation, not temperature, will likely continue to dictate the flow of the river for the next 25 years.
Precipitation falling in the river’s headwaters region is likely to be more abundant than during the prior two decades. The work, published today in the Journal of Climate, comes as policymakers, water managers, states, and tribes look for answers on how to govern the Colorado River’s flows beyond 2025.
“It’s a sort of nuanced message,” said Balaji Rajagopalan, CIRES Fellow and co-author of the study. “Yes, the temperature is warming, but that’s not the full story—you add precipitation and you get a fuller picture.”
CIRES affiliate Martin Hoerling and Fellow Balaji Rajagopalan worked with colleagues from several other institutions to analyze data from a suite of models, including climate projections from the Intergovernmental Panel on Climate Change (IPCC). They determined that while warming temperatures have depleted Colorado River flows in recent decades, precipitation variations have mostly explained the swings between wet and dry periods since 1895.
Because precipitation has explained the vast majority of the ups and downs of the Colorado River’s flows in the last century, climate models forecasting a 70 percent chance of increased precipitation offer hope that the river’s near-term future is not necessarily drier than the last two decades.
“We find it is more likely than not that Lee Ferry flows will be greater during 2026-2050 than since 2000 as a consequence of a more favorable precipitation cycle,” said Martin Hoerling, the paper’s lead author. “This will compensate the negative effects of more warming in the near term.”
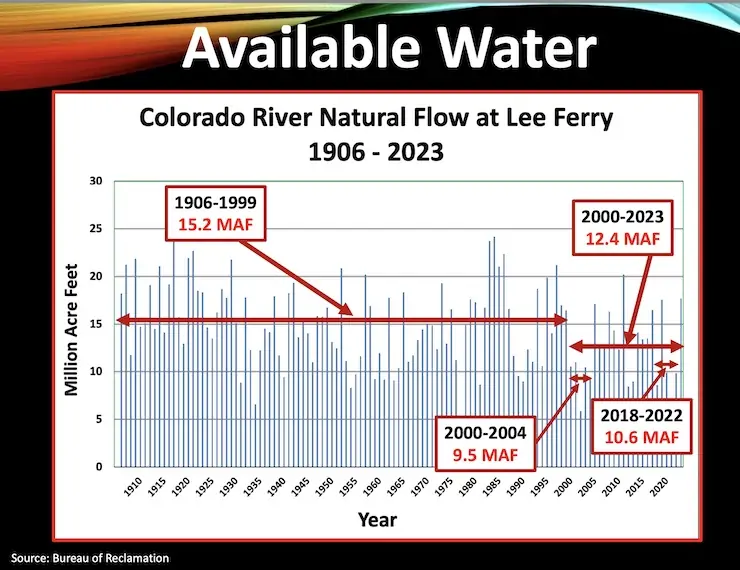
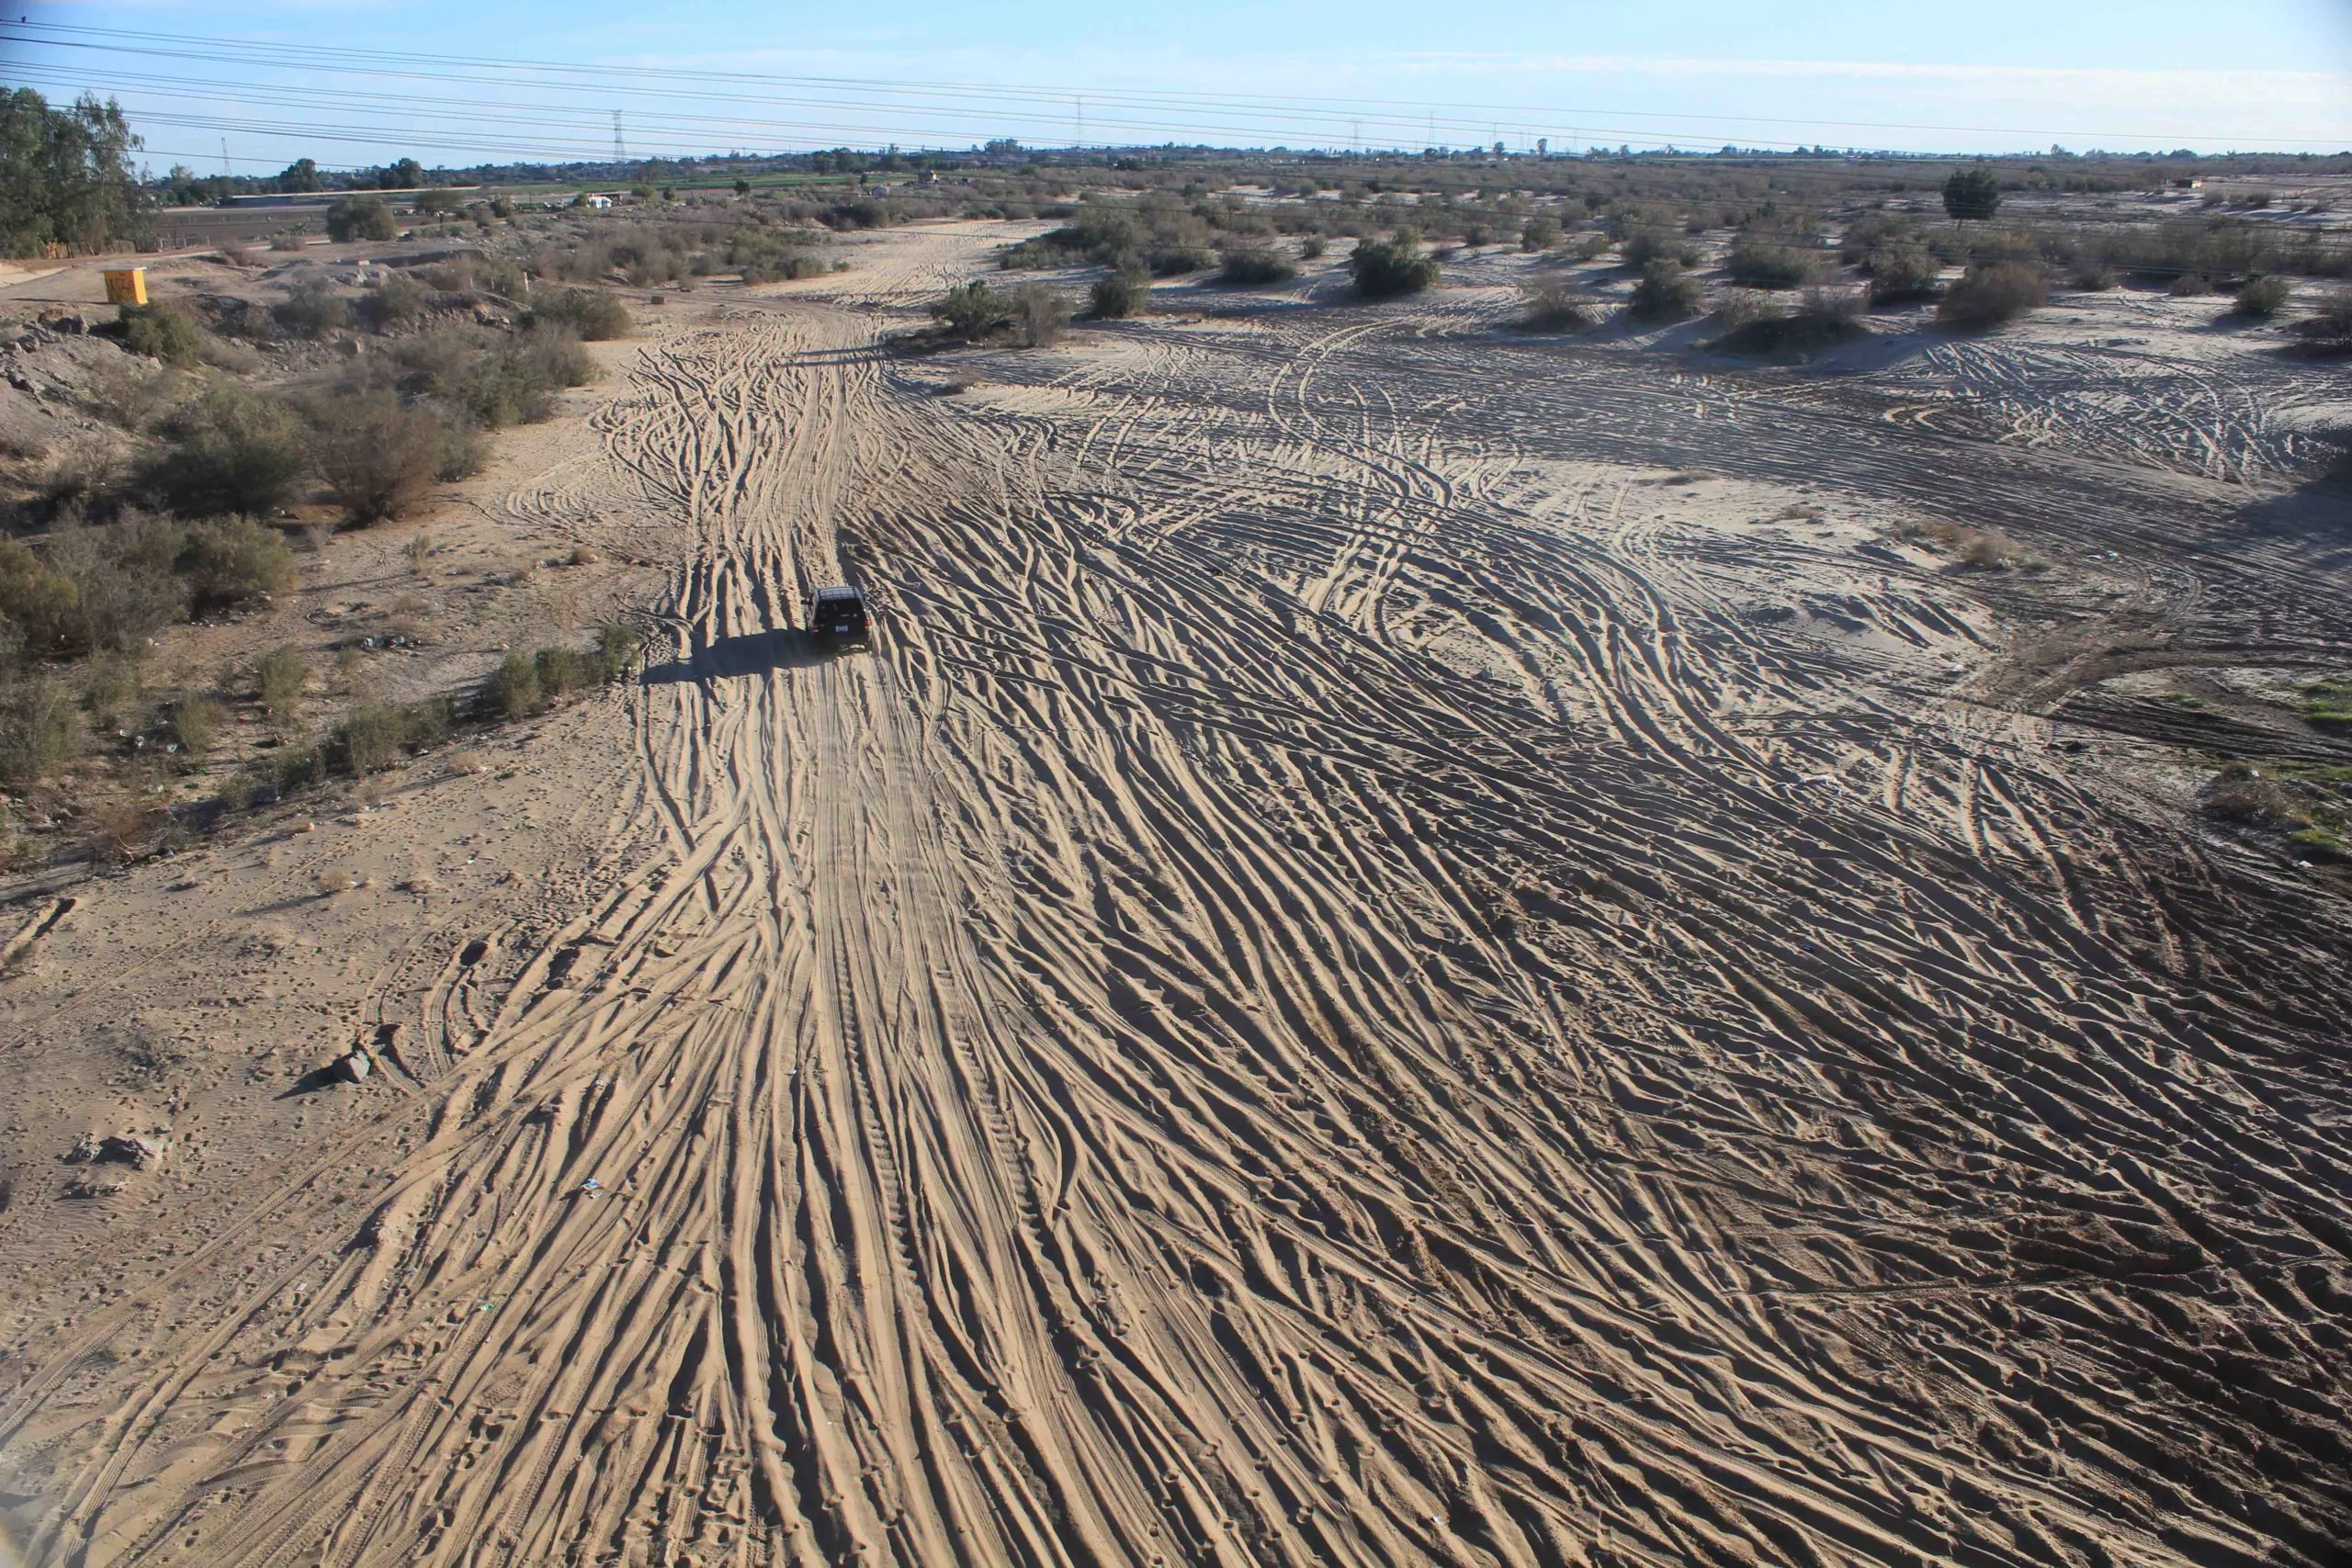
The authors analyzed flow records at Lee’s Ferry, the dividing point of the river’s upper and lower basins, dating back to 1895. They confirmed natural changes in precipitation have ebbed and flowed over the century, dictating extreme wet and dry periods for the river, when flows exceeded 15 million acre-feet or dropped well below that key figure. For example, the current megadrought that began in 2000 has resulted mostly from low precipitation which left the river at about 12.5 million acre-feet reducing it to dry sandy river beds in Mexico.
Looking ahead, the team used climate models, including the latest climate projections from the IPCC, to predict the river’s flow 25 years into the future. Most of the water that feeds the Colorado River begins as snow in the region’s headwaters—mountains above 10,000 feet in Colorado and Wyoming. The area represents a small slice of the basin’s geography, about 15 percent, but generates 85 percent of the water that flows through seven states. So precipitation in this “upper basin” is integral to flows in the entire river system. And the team found it is likely to increase, partially offsetting further declines linked to rising temperatures.
September 21, 1923, 9:00 a.m. — Colorado River at Lees Ferry. From right bank on line with Klohr’s house and gage house. Old “Dugway” or inclined gage shows to left of gage house. Gage height 11.05′, discharge 27,000 cfs. Lens 16, time =1/25, camera supported. Photo by G.C. Stevens of the USGS. Source: 1921-1937 Surface Water Records File, Colorado R. @ Lees Ferry, Laguna Niguel Federal Records Center, Accession No. 57-78-0006, Box 2 of 2 , Location No. MB053635.
While an increase in precipitation is likely, the study finds a low probability that precipitation might not recover and could decline even further. If this happens, ongoing warming would further reduce water resources, resulting in even lower flows at Lee’s Ferry than those that have led to today’s crisis.
“There’s roughly a 4 percent chance that Lee Ferry flows could decline another 20 percent in the next quarter century compared to the last 20 years,” Hoerling said. “So, policymakers who must especially take into account risks of extended dry times, might consider this non-zero threat that the river could yield only 10 million acre-feet a year during 2025-2050.”
As the deadline slowly approaches to determine the next set of guidelines that will govern the river for the next 25 years, the new forecast may shed new light on the future
“Decision makers are confronted with a more optimistic vision of the available supply in coming decades than might have generally been foreseen previously,” Hoerling said, “but also confronted with a small, but perhaps unacceptable, risk for historically low flows.”
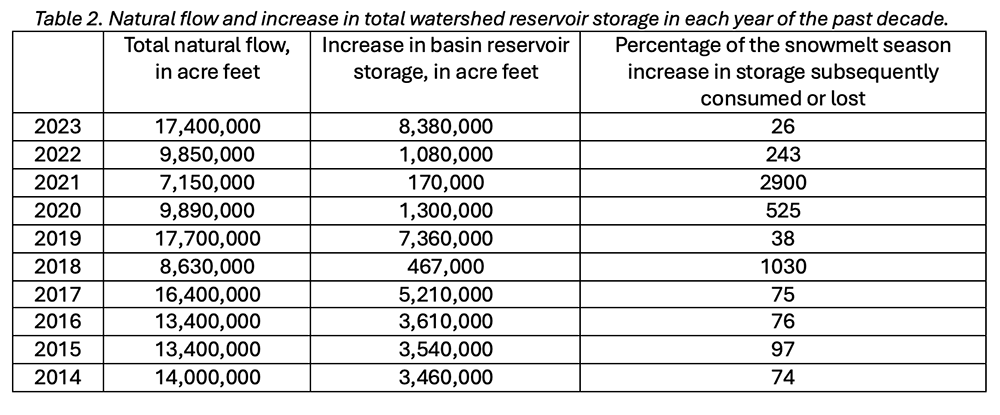
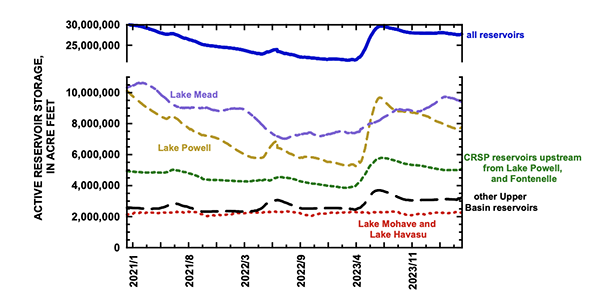
“New plot using the nClimGrid data, which is a better source than PRISM for long-term trends. Of course, the combined reservoir contents increase from last year, but the increase is less than 2011 and looks puny compared to the ‘hole’ in the reservoirs. The blue Loess lines subtly change. Last year those lines ended pointing downwards. This year they end flat-ish. 2023 temps were still above the 20th century average, although close. Another interesting aspect is that the 20C Mean and 21C Mean lines on the individual plots really don’t change much. Finally, the 2023 Natural Flows are almost exactly equal to 2019. (17.678 maf vs 17.672 maf). For all the hoopla about how this was record-setting year, the fact is that this year was significantly less than 2011 (20.159 maf) and no different than 2019” — Brad Udall
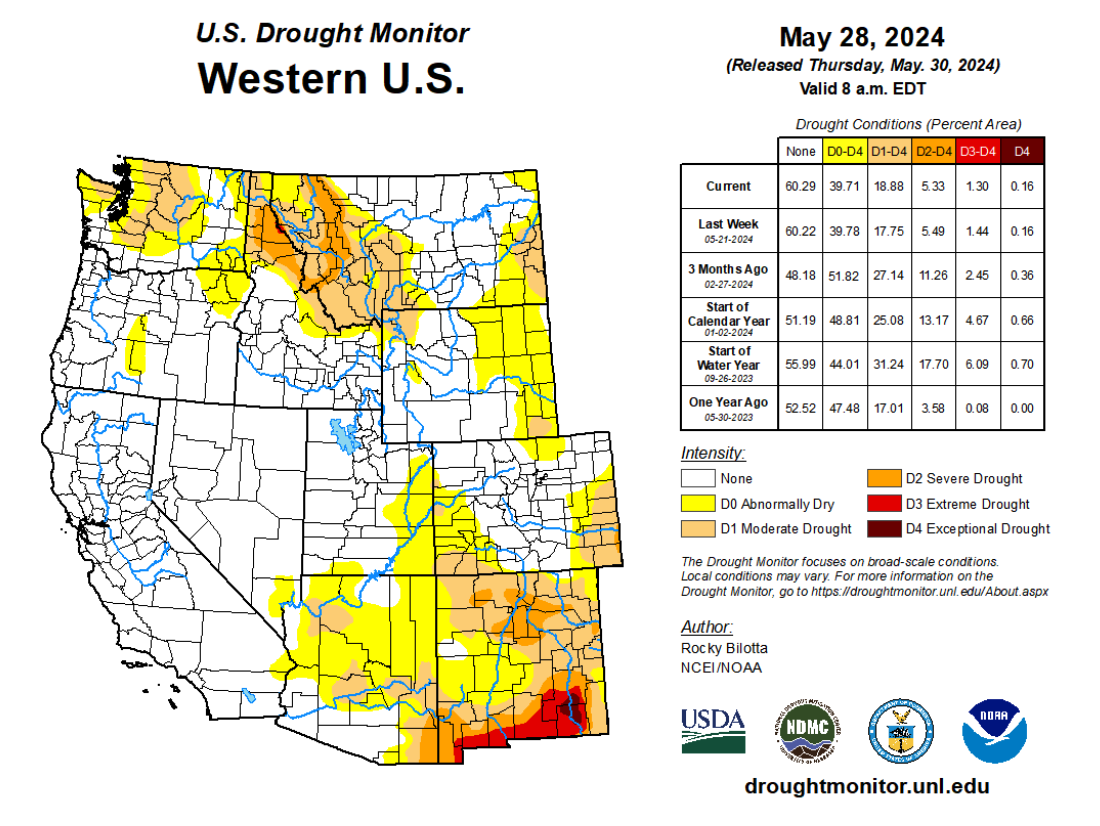
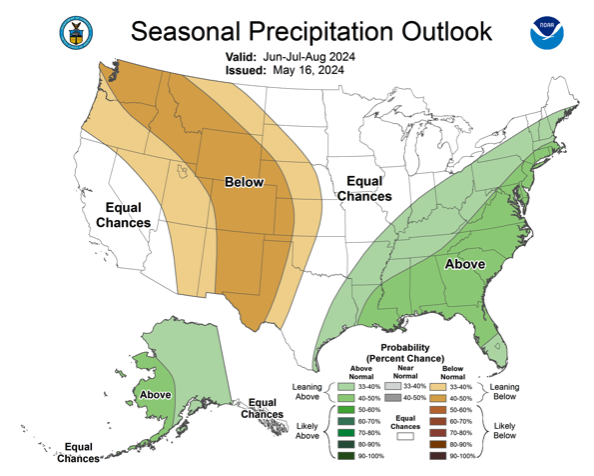
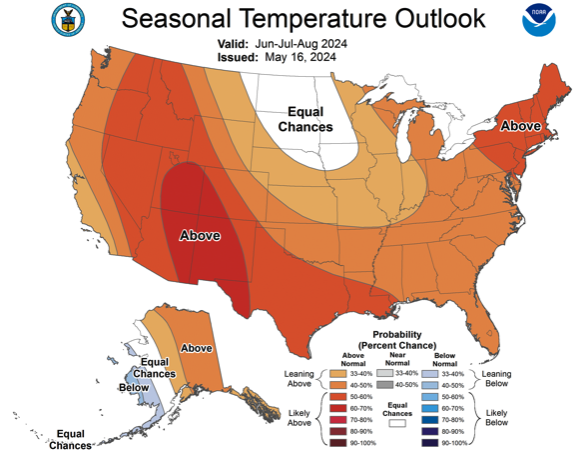
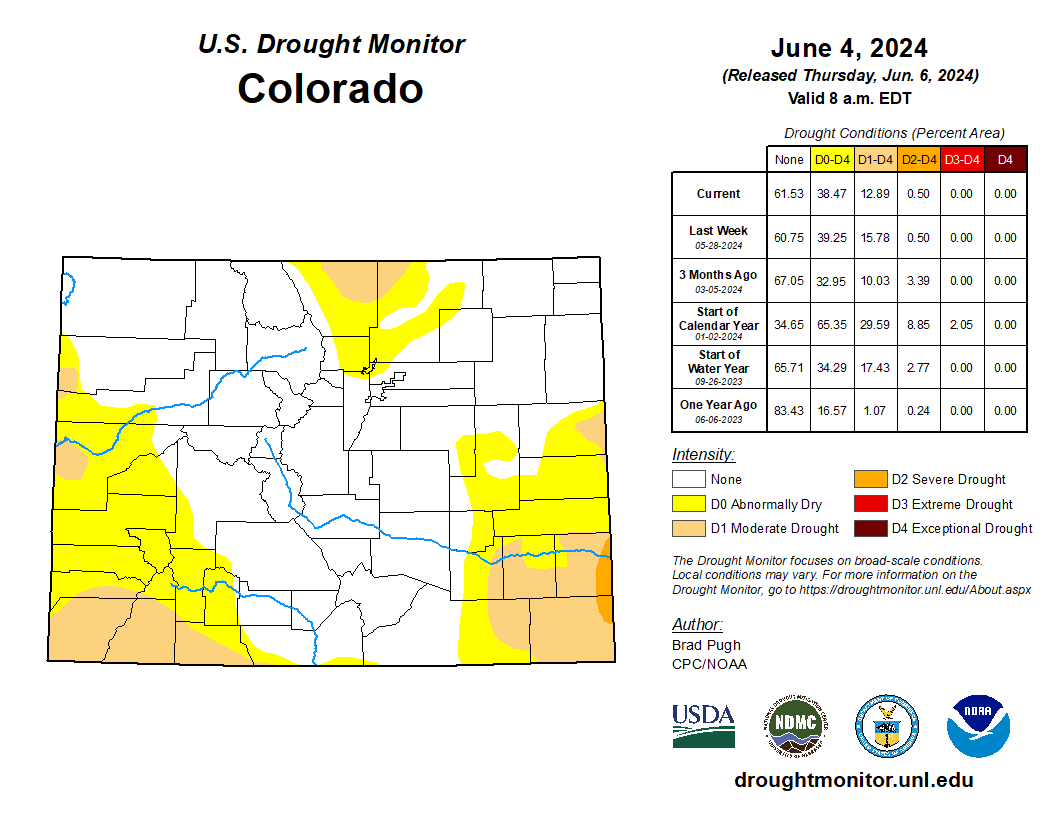
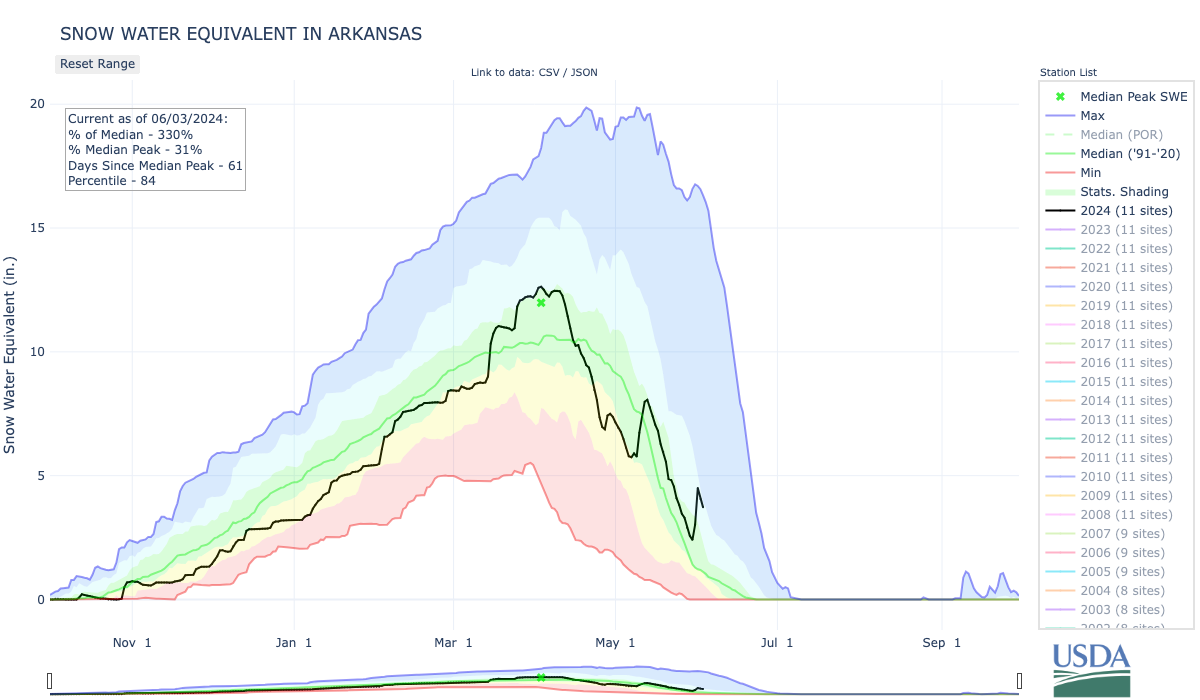
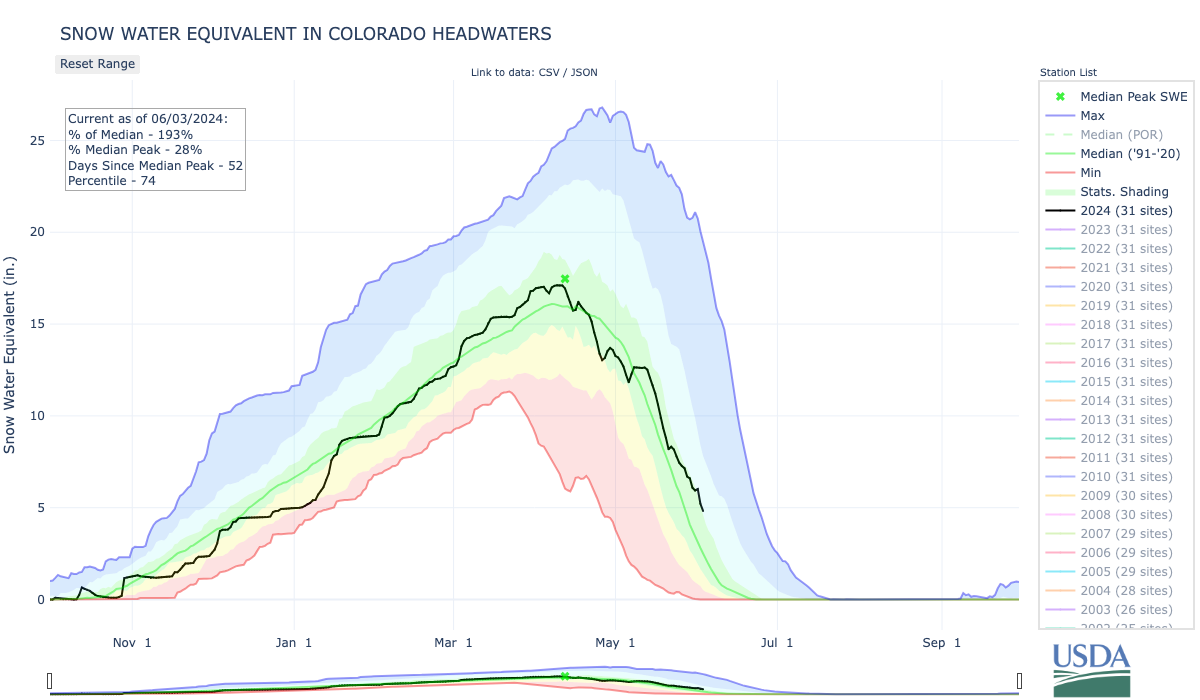
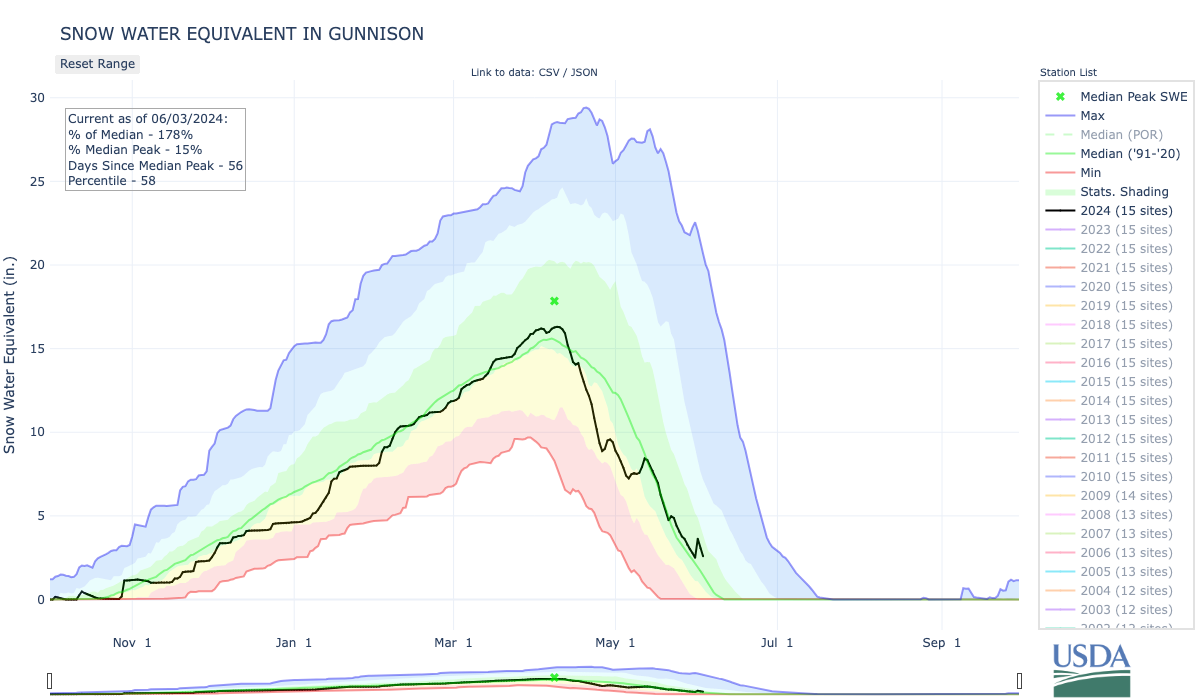
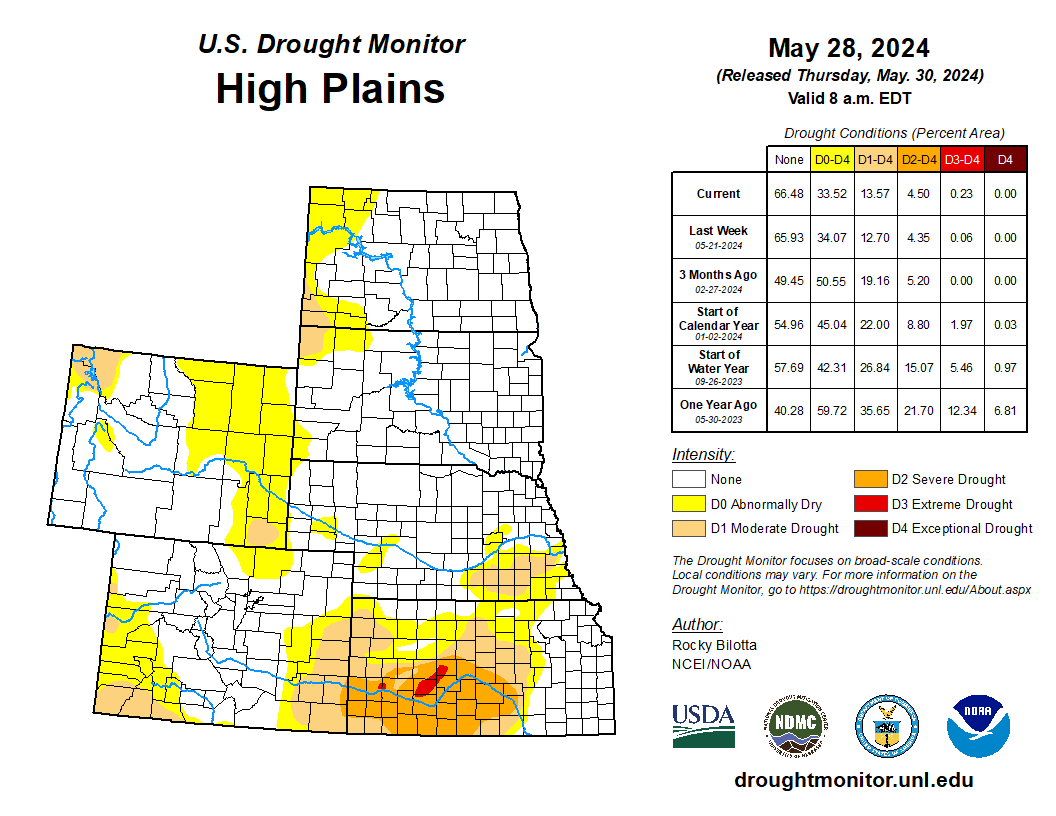
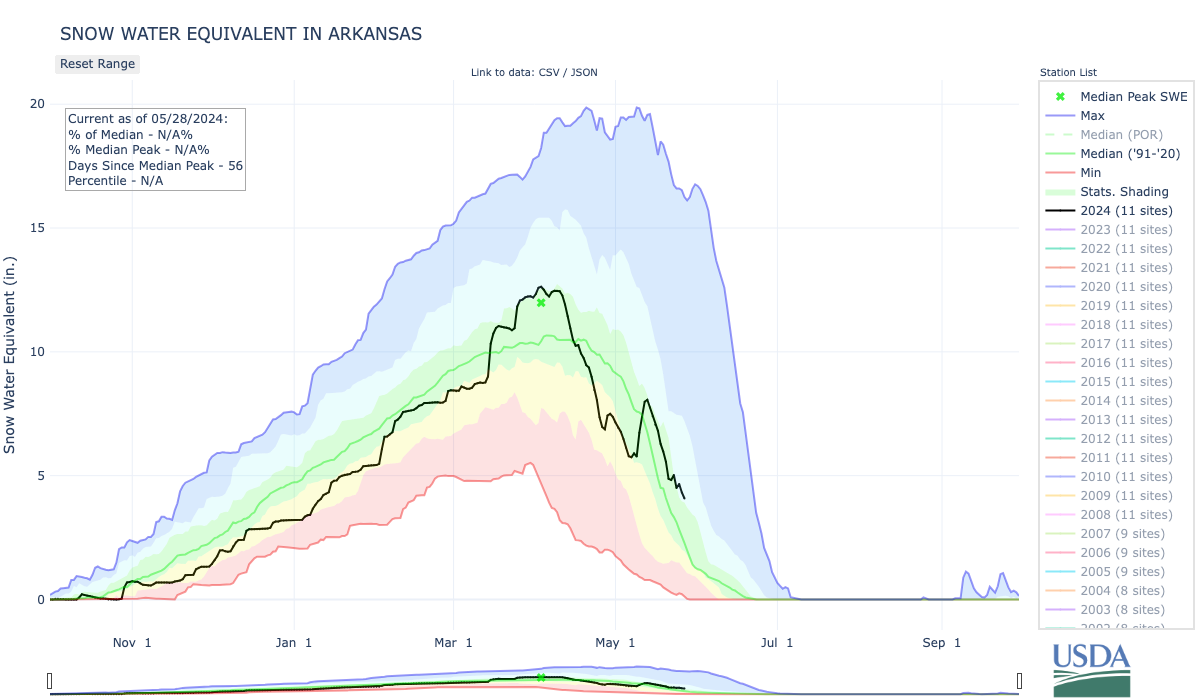
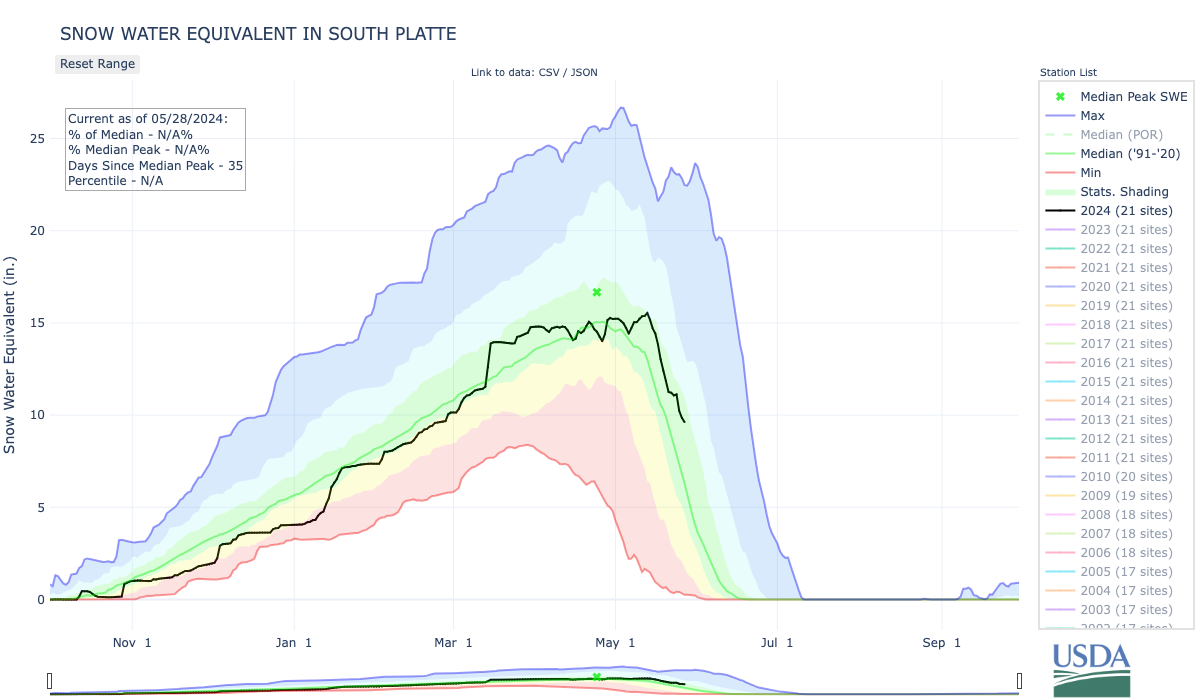
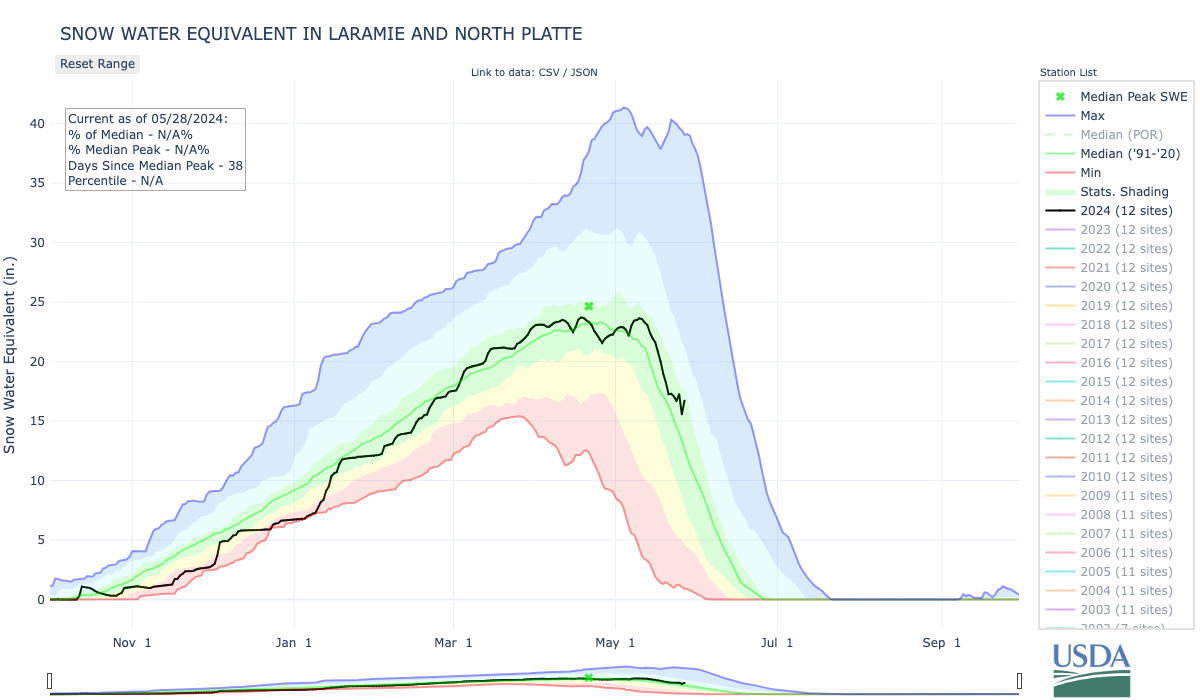
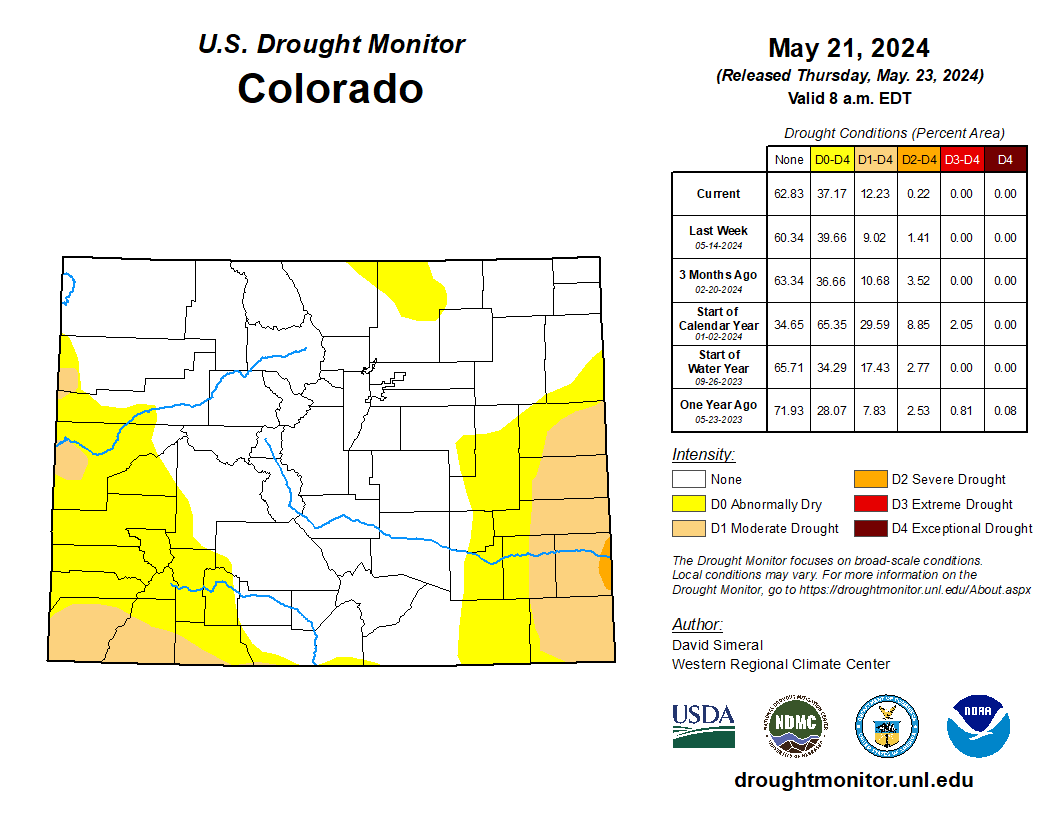
Cool May temperatures coupled with continued snowpack accumulation in some mountain areas slowed snowmelt, leading to above average seasonal streamflow volume forecasts for many river basins including the Arkansas, Gunnison, North Platte, Powder, Provo, Six Creeks, Weber and Yampa. Regional drought conditions contracted to cover 8% of the region, driven largely by drought removal in northern Wyoming. NOAA seasonal outlooks predict an increased probability of above average temperatures and below average precipitation for June-August.
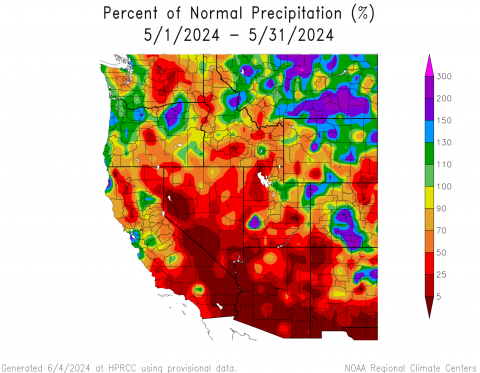
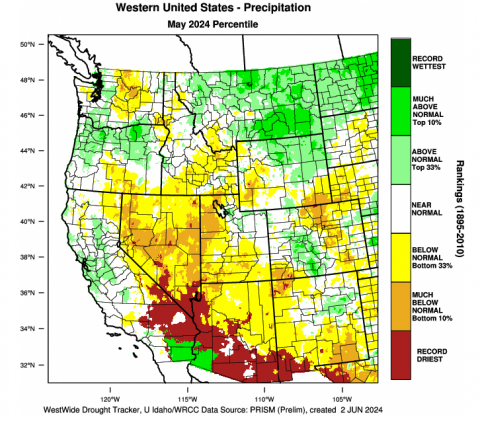
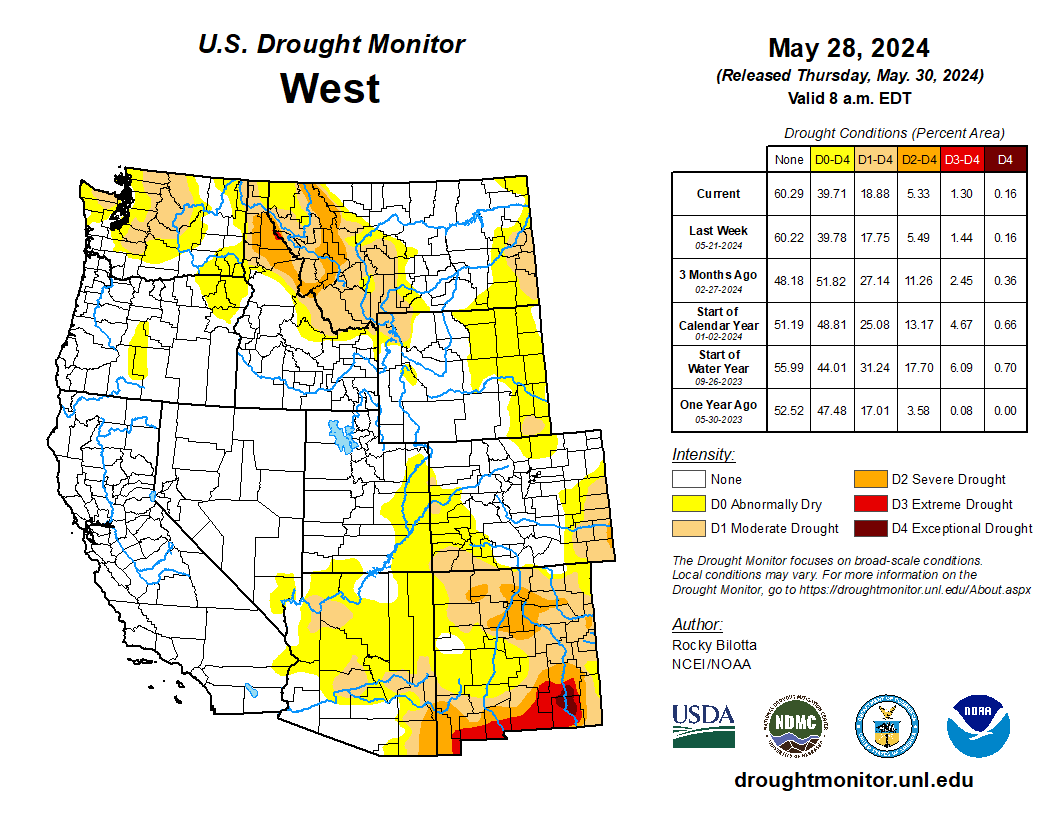
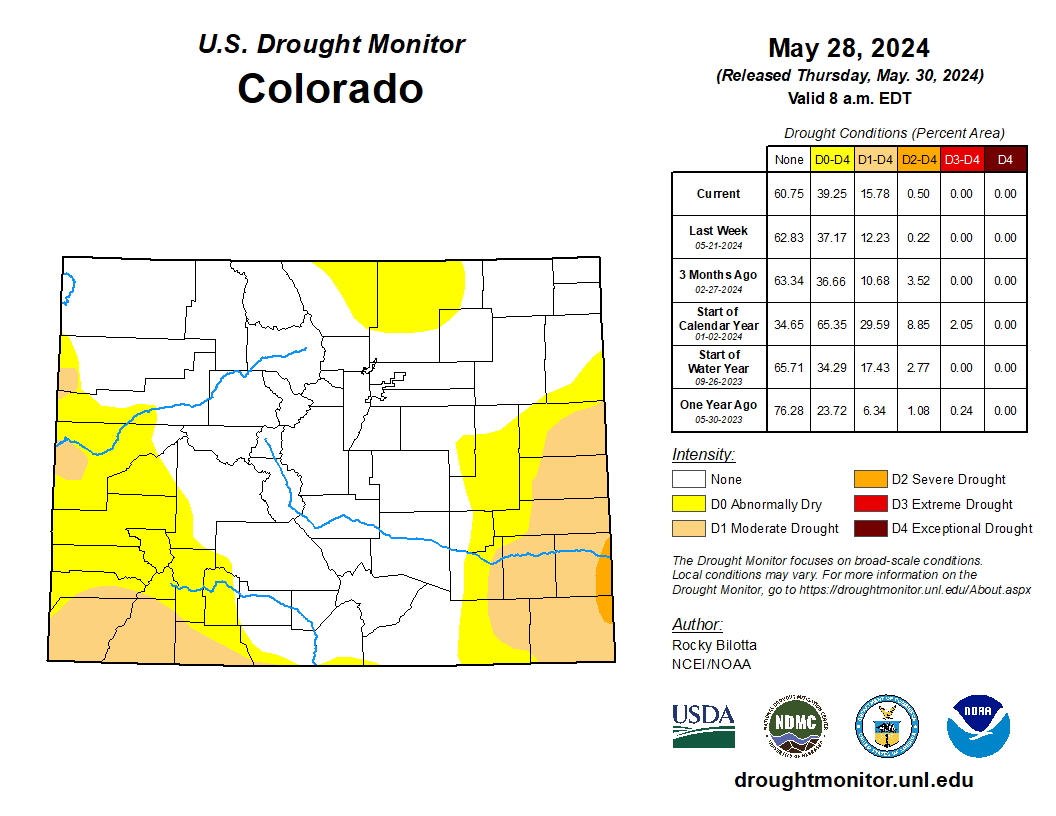
Regional May precipitation was a mix of above and below average conditions. Average to much-above average (150-200%) precipitation fell in northwestern and central Colorado and northern Wyoming. In Utah, the central Wasatch and western Uinta Mountains received near-average precipitation during May. Locations in western and southern Utah, southwestern and northeastern Colorado and southeastern Wyoming received less than 50% of average May precipitation. Isolated locations in Larimer and La Plata Counties in Colorado and Washington County in Utah received record low May precipitation. In Boulder, CO, total May precipitation was only 0.44”, the driest May in 50 years and the second driest on record.
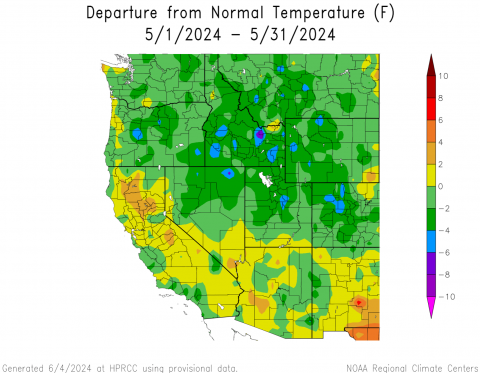
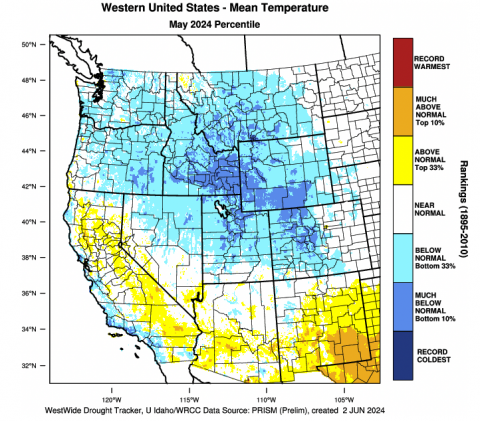
May temperatures were below average for nearly the entire region. In central Colorado, northern Utah and western Wyoming, temperatures were 2-4ºF below average. Region-wide (CO, UT, WY), May 2024 was the coldest since May 2019.
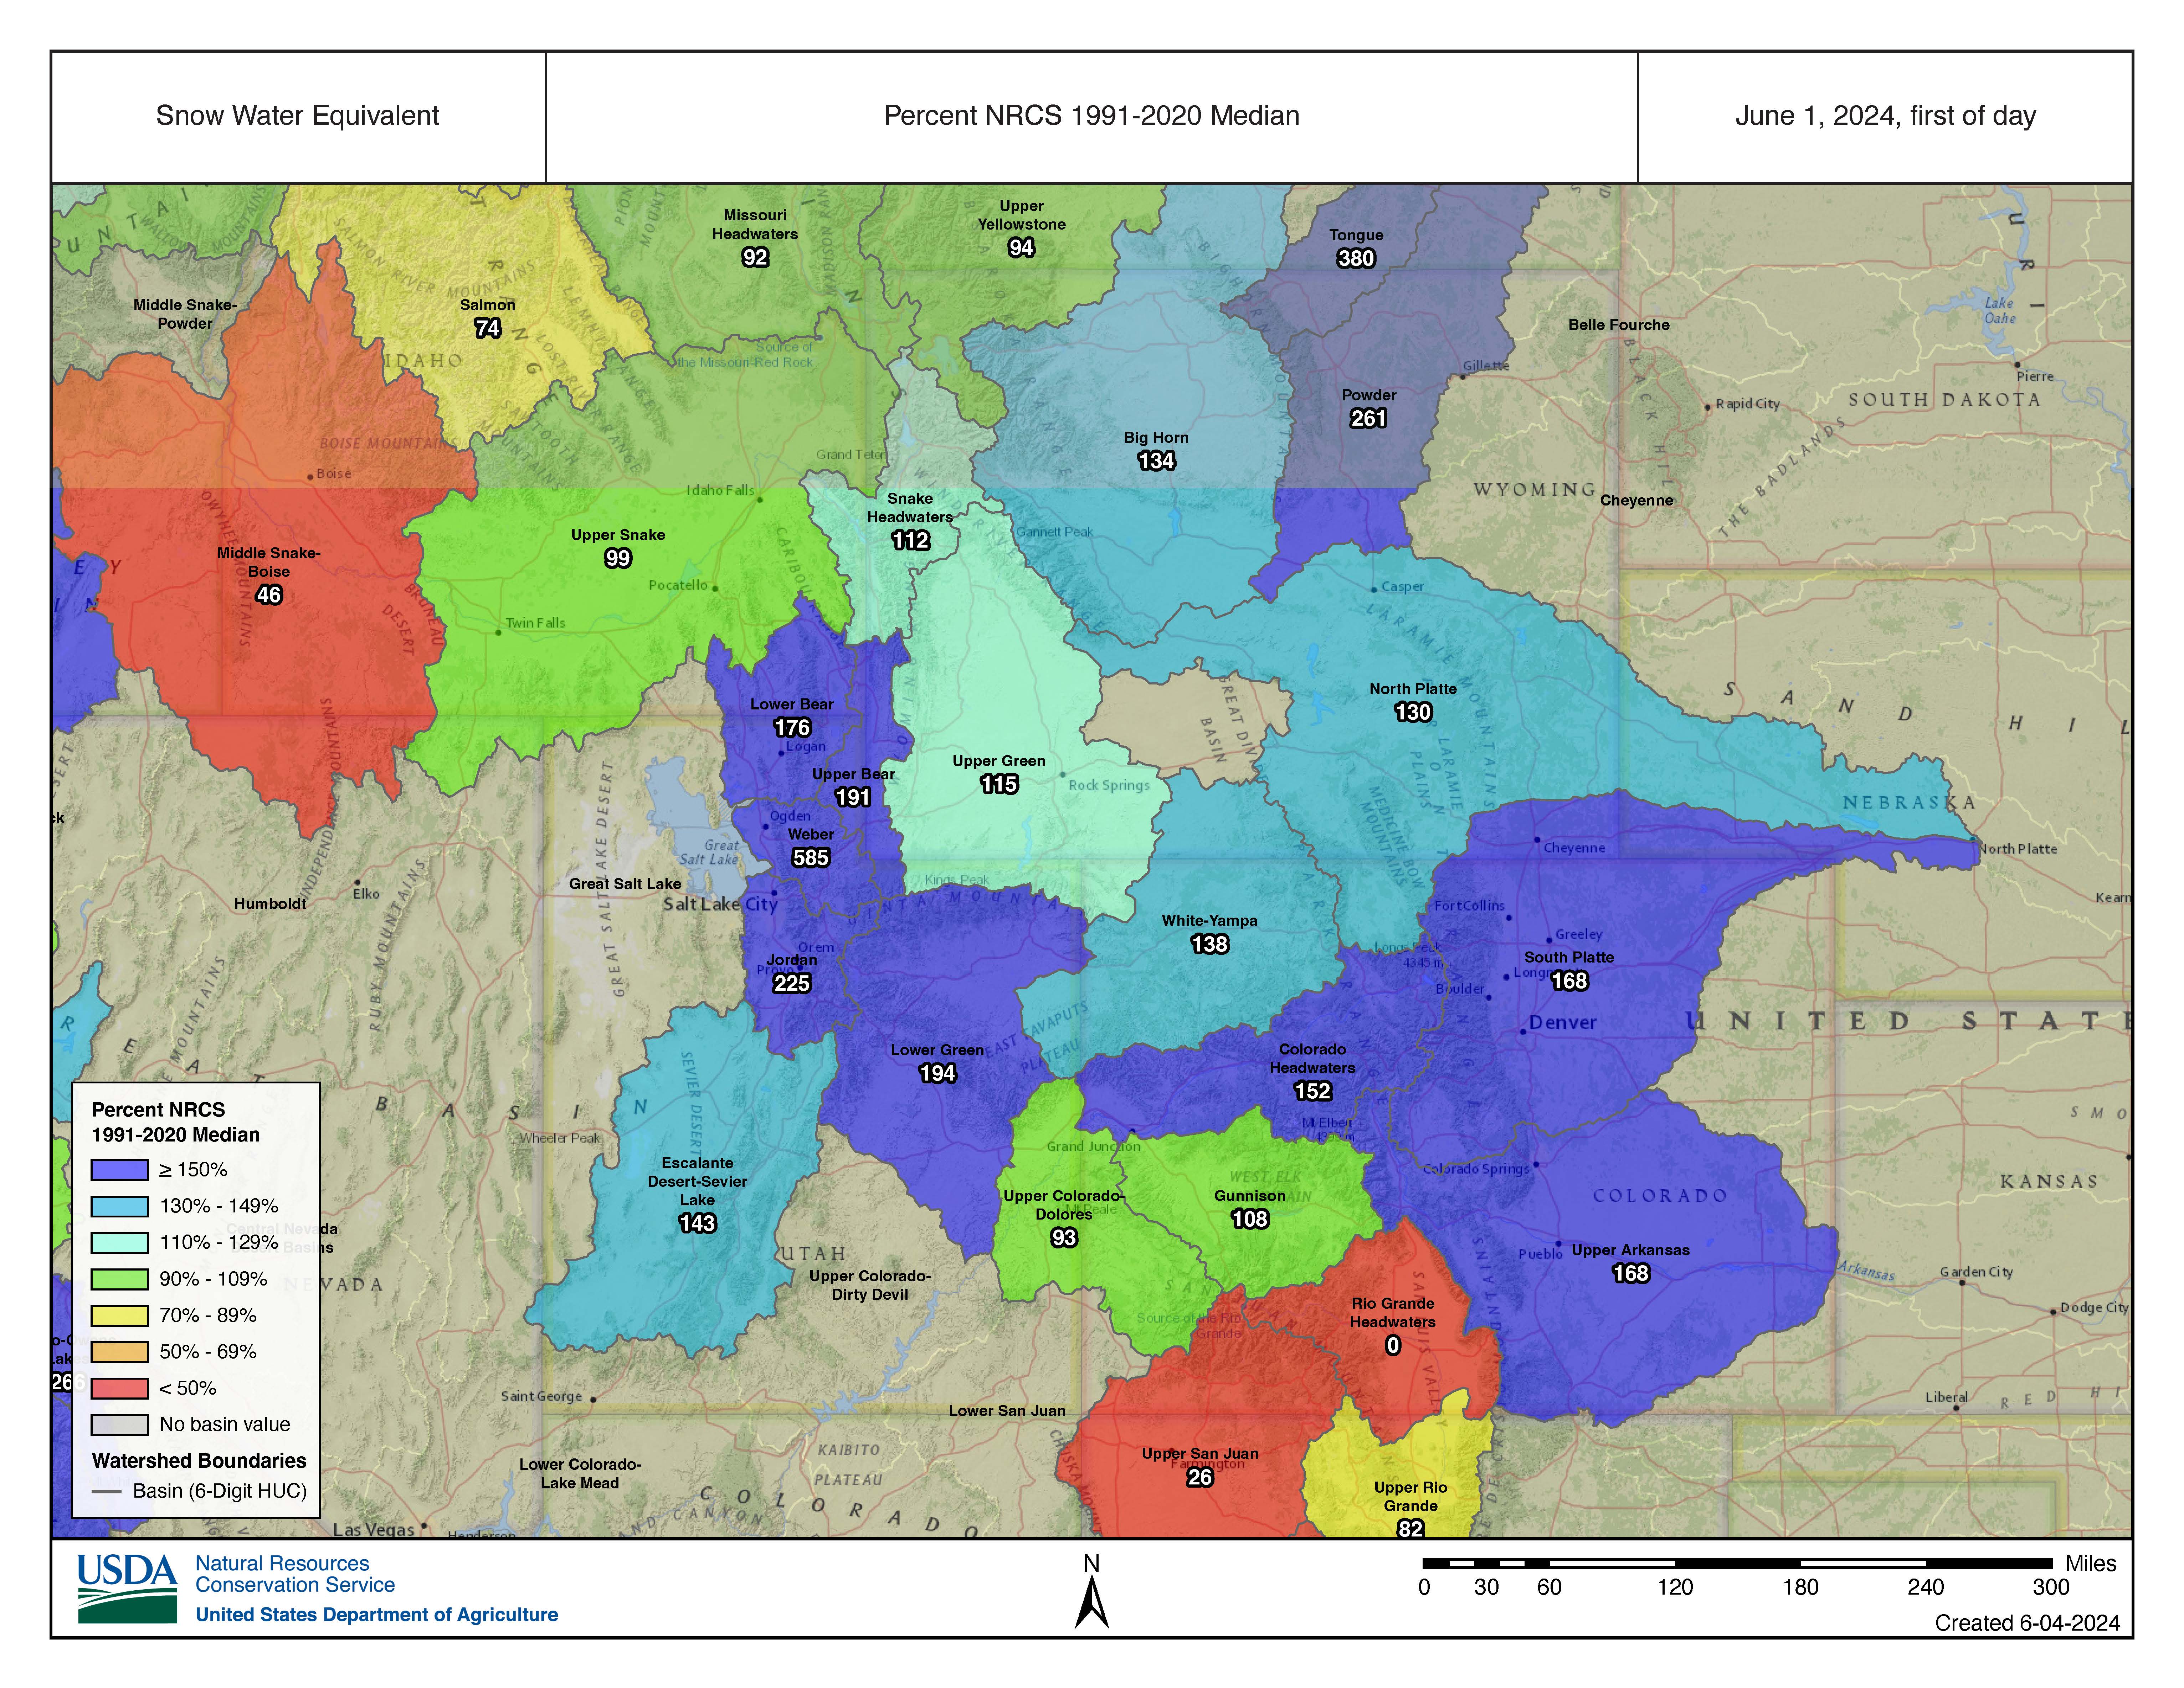
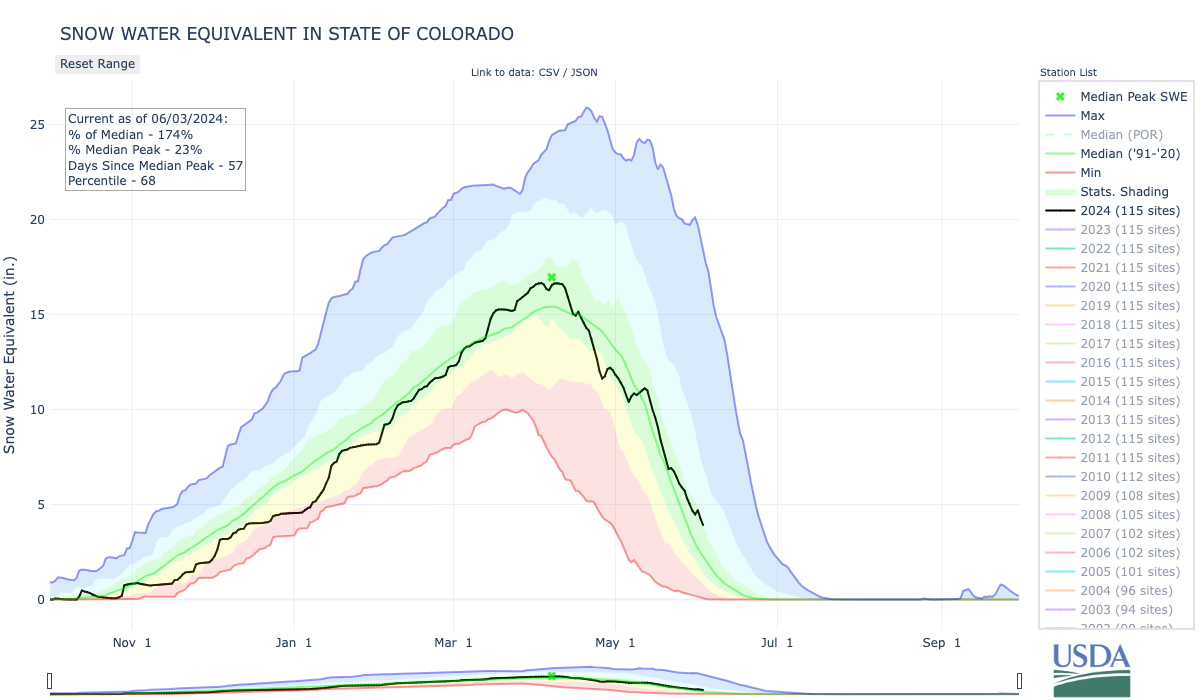
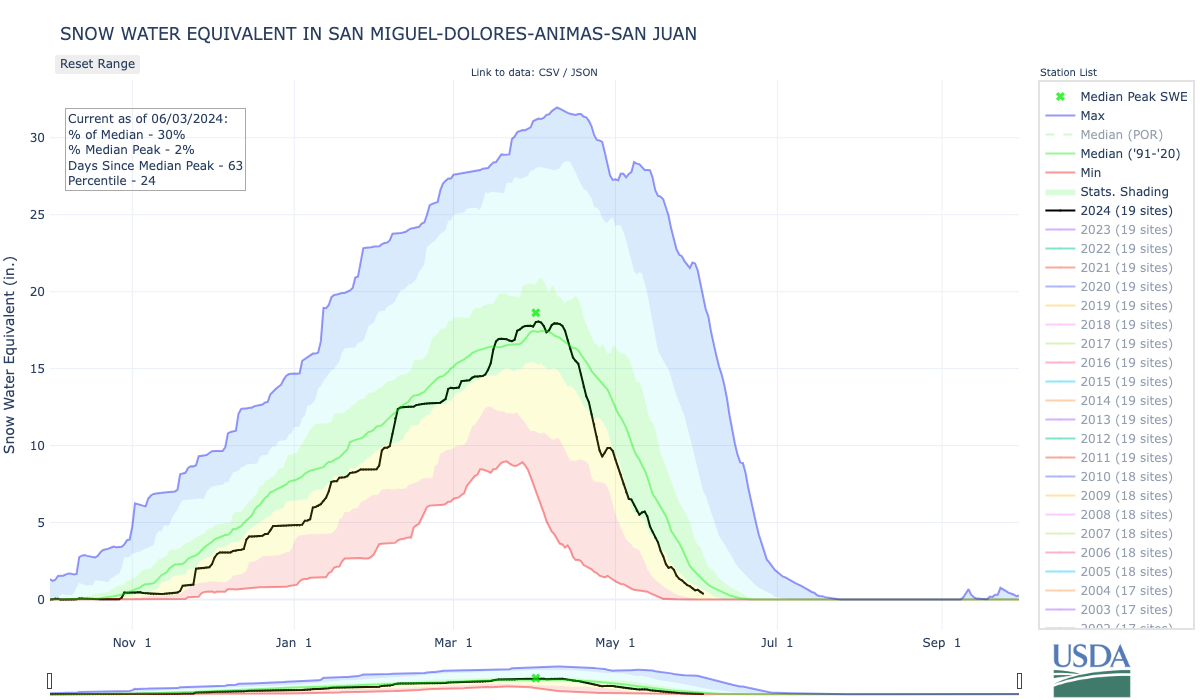
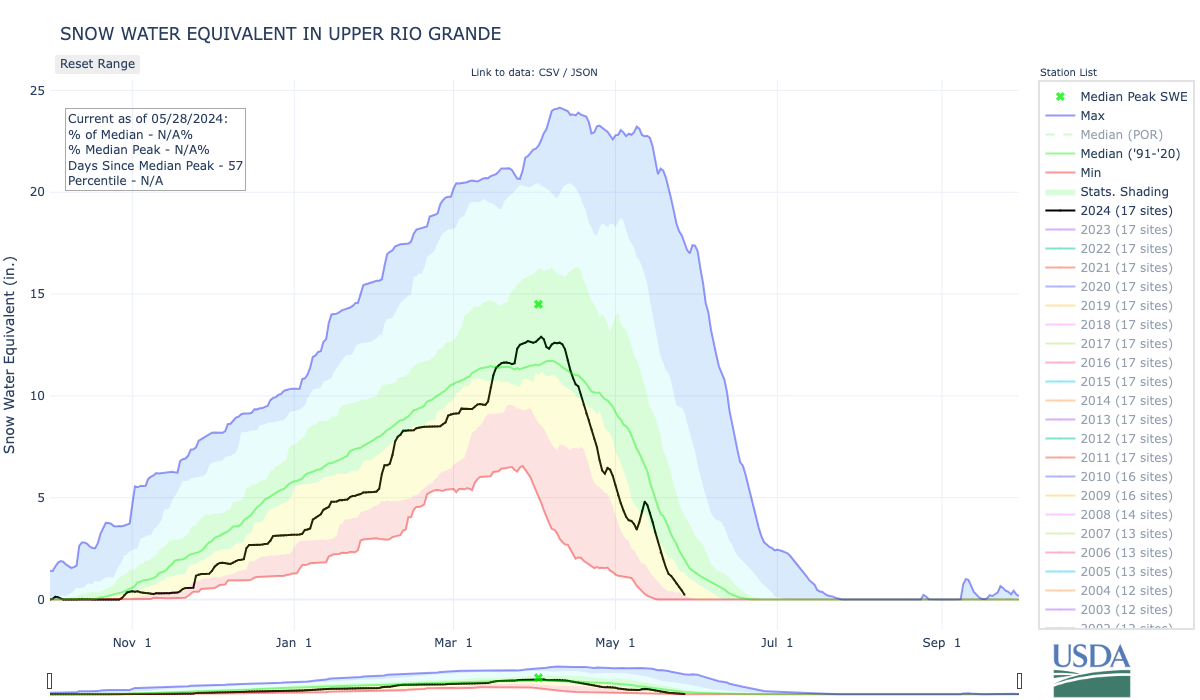
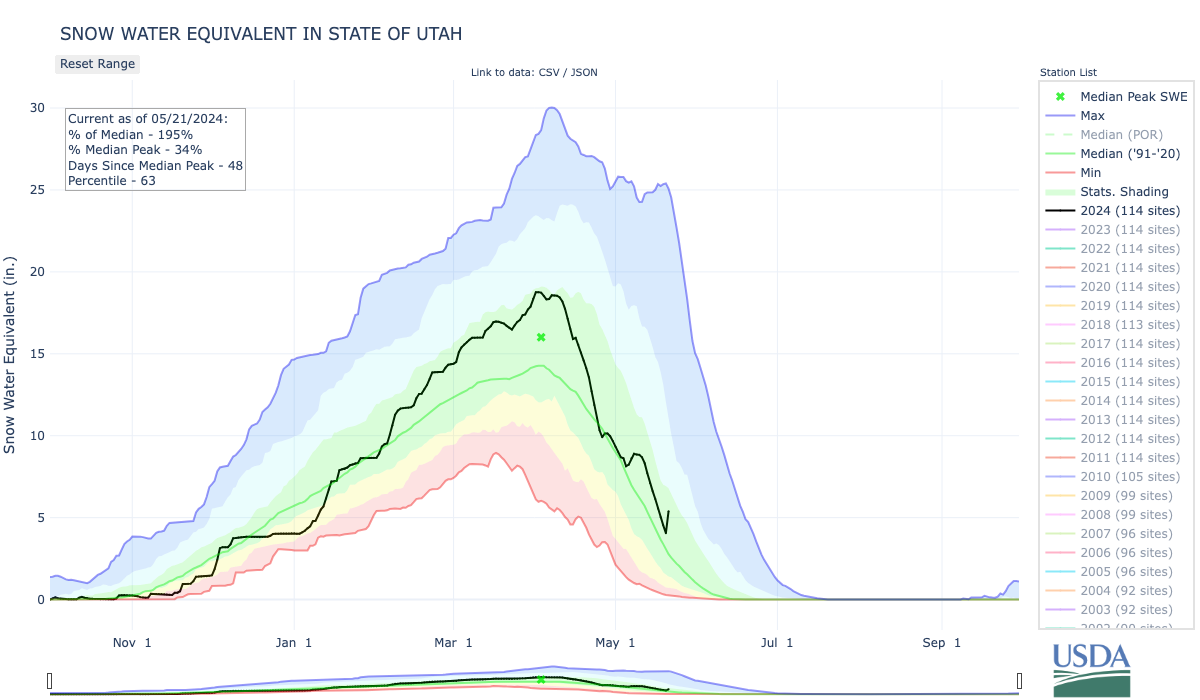
Despite below average May precipitation across much of the region, cool May temperatures preserved existing snowpack and regional snow water equivalent (SWE) is above-to-much-above average in most river basins. SWE is highest relative to average in Utah where SWE is 585% of average in the Weber River Basin and 225% of average in the Provo-Jordan River Basin. On a statewide basis, SWE is 136% of average in Colorado, 196% of average in Utah and 125% of average in Wyoming. Snow is completely melted in the Rio Grande River Basin and nearly melted in the Dolores and San Juan watersheds. Significant May snow accumulation occurred in Wyoming’s Bighorn Mountains and in parts of the Colorado Rockies.
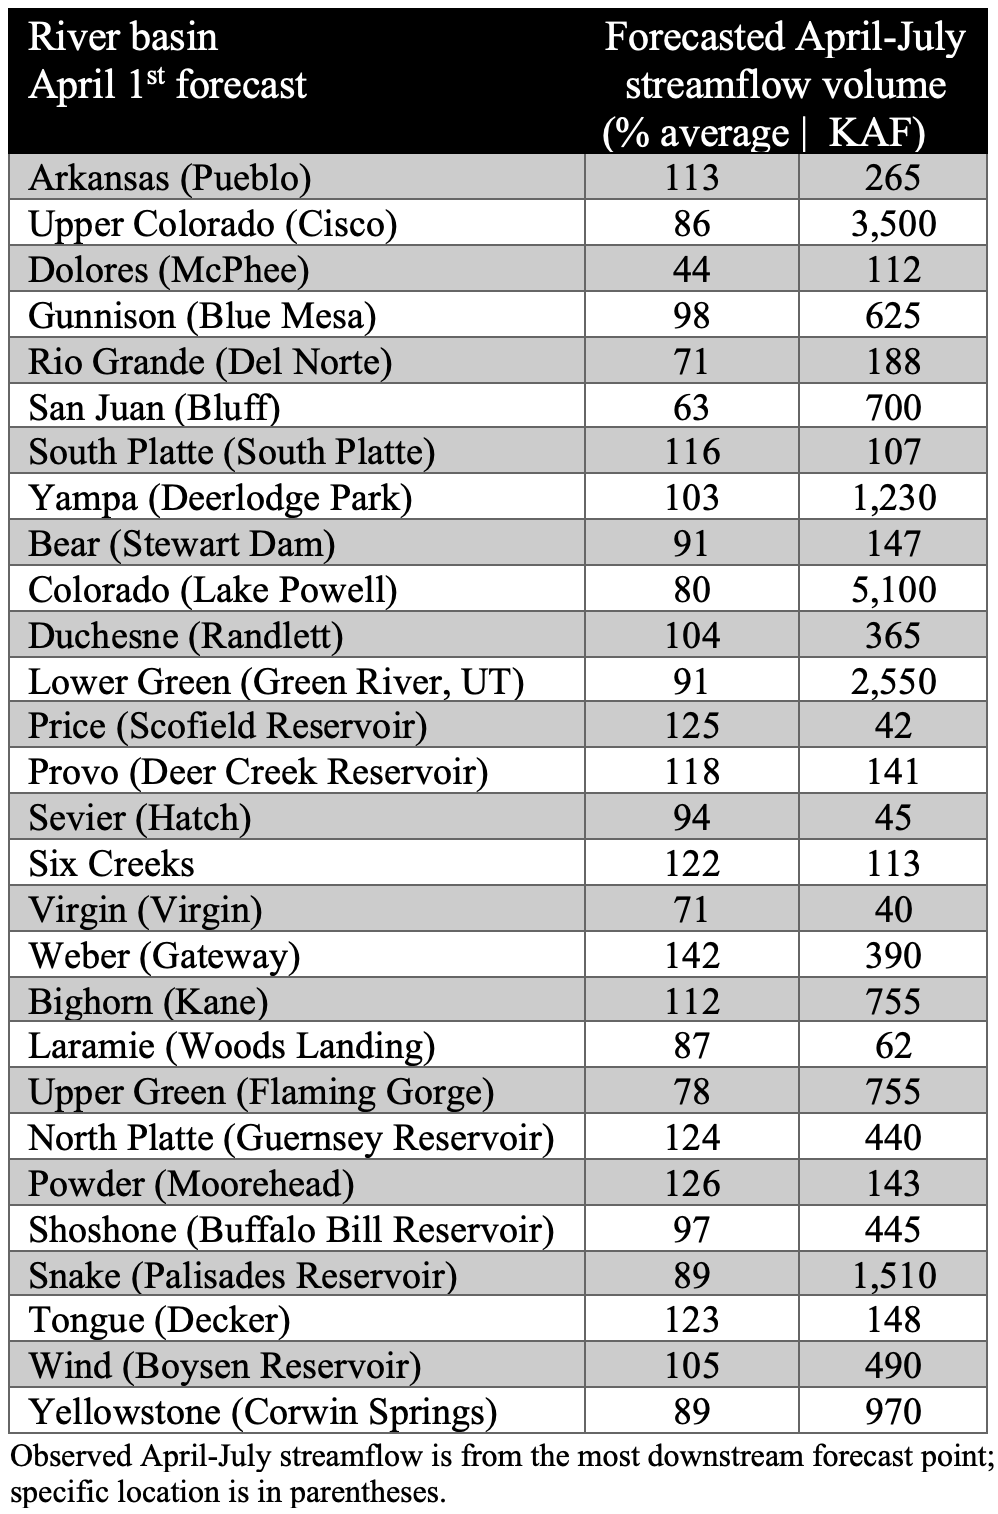
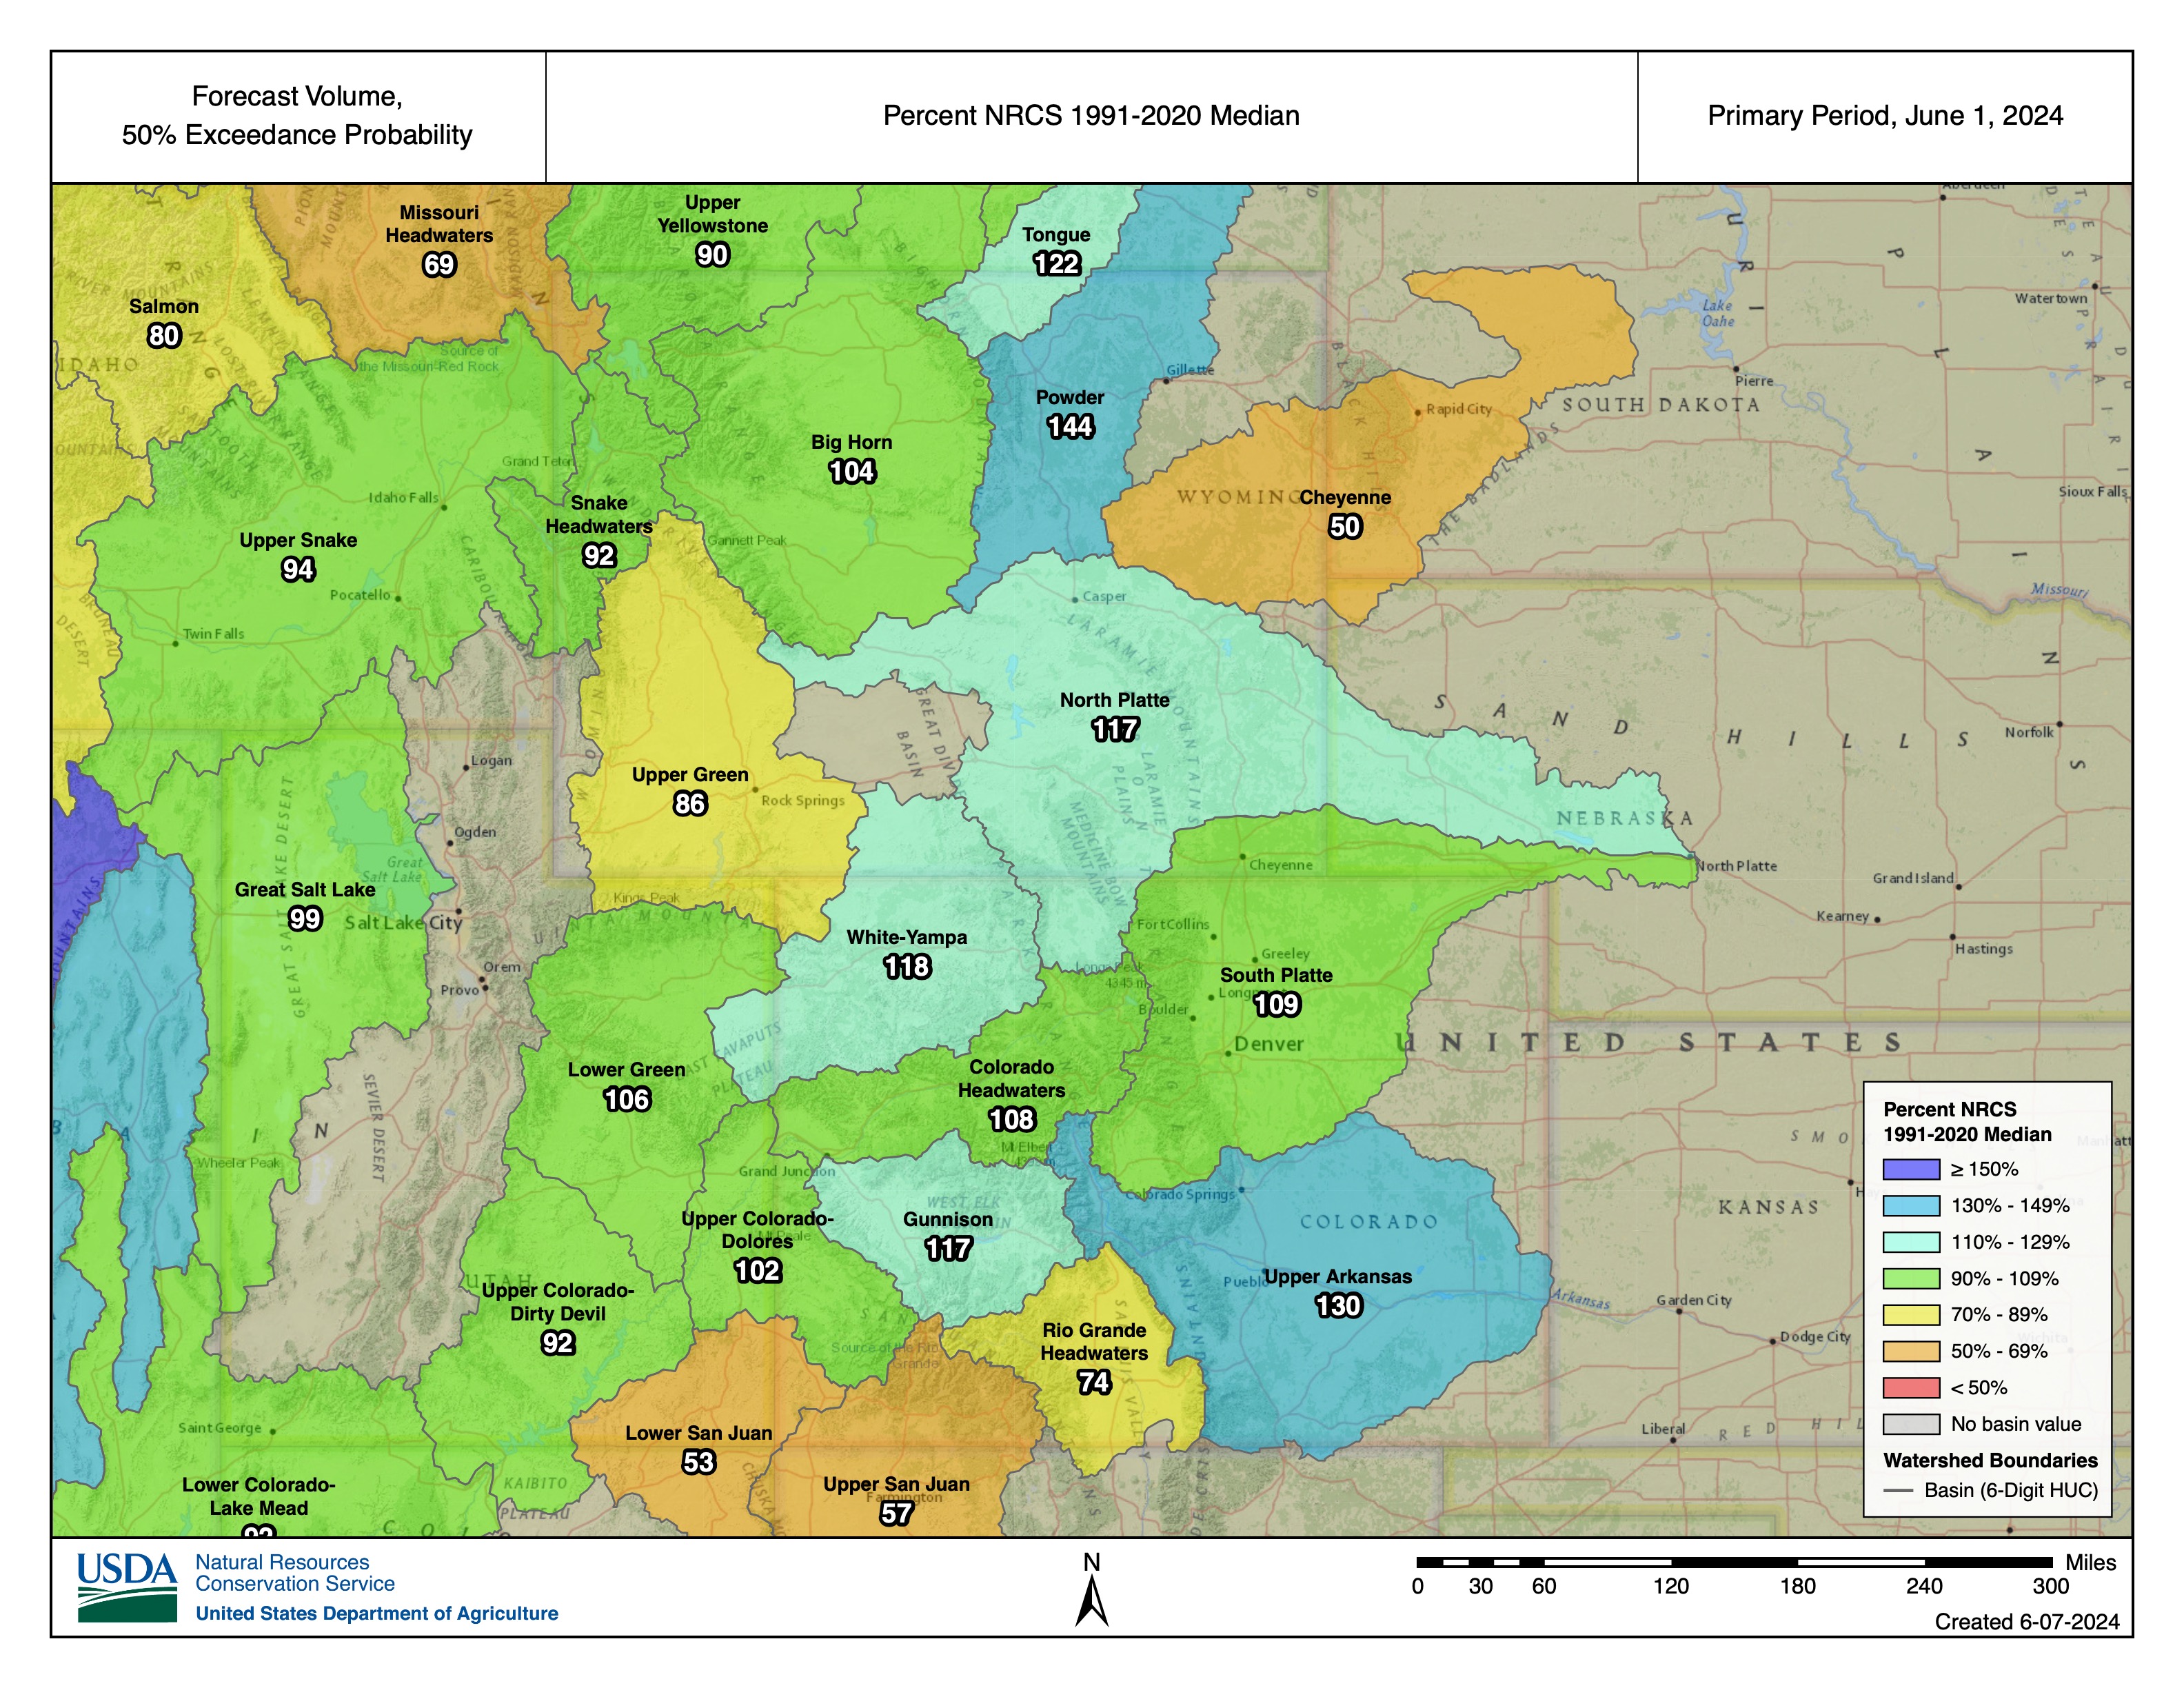
Seasonal streamflow volume forecasts on June 1 are generally average to slightly above average except for below average streamflow forecasts in the Cheyenne, Upper Green, Rio Grande and San Juan River Basins. Snowpack accumulation continued in some mountain regions during May and cool May temperatures slowed snowmelt for much of the month. Relative to average, the highest streamflow volumes are forecasted in northern Utah, particularly the Provo, Six Creeks and Weber River Basins. Significant increases in streamflow volume forecasts compared to May 1 were observed in the Arkansas, Gunnison, North Platte, Powder and Tongue River Basins. The lowest streamflow volumes relative to average are forecasted for the Dolores (44%) and San Juan Rivers (64%). The inflow volume forecast for Lake Powell is 80% of average (5.1 million acre-feet).
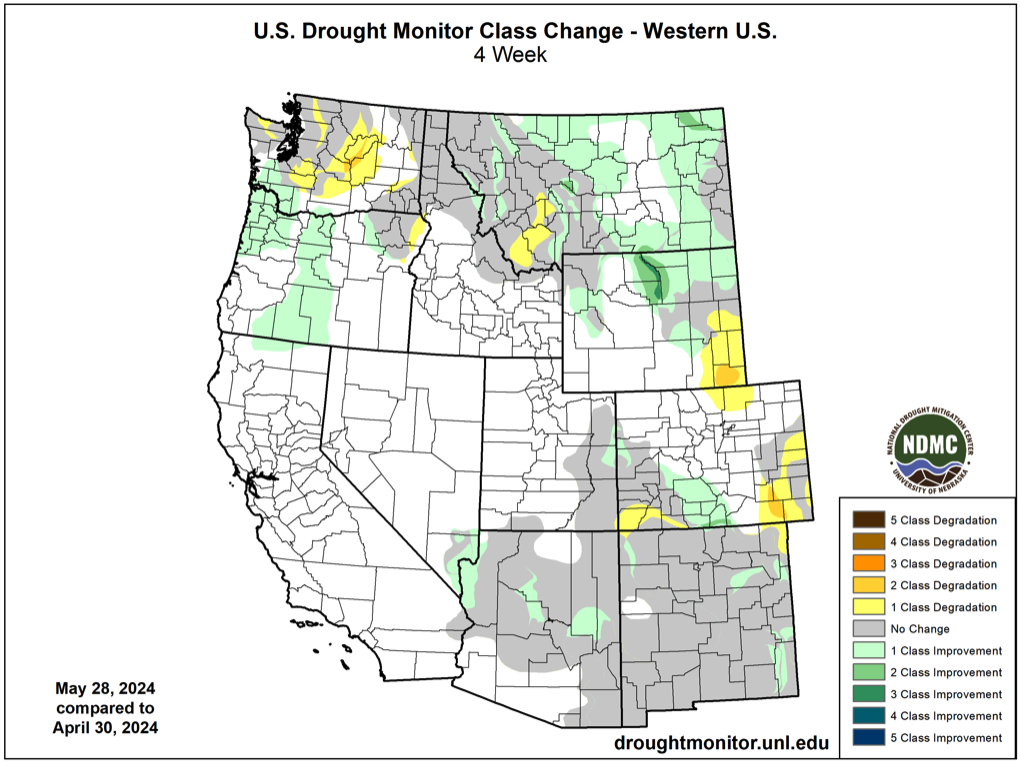
Regional drought conditions improved during May and now cover 8% of the region, compared to 10% at the end of April. Much-above average precipitation in northern Wyoming caused the removal of D1 and D2 drought conditions. Drought was entirely removed from Utah during May and the area of D1 drought contracted in western Colorado. Dry conditions in other parts of the region caused drought emergence in southeastern Wyoming, severe (D2) drought emergence in southeastern Colorado and a slight expansion of D1 drought conditions in southwestern Colorado.
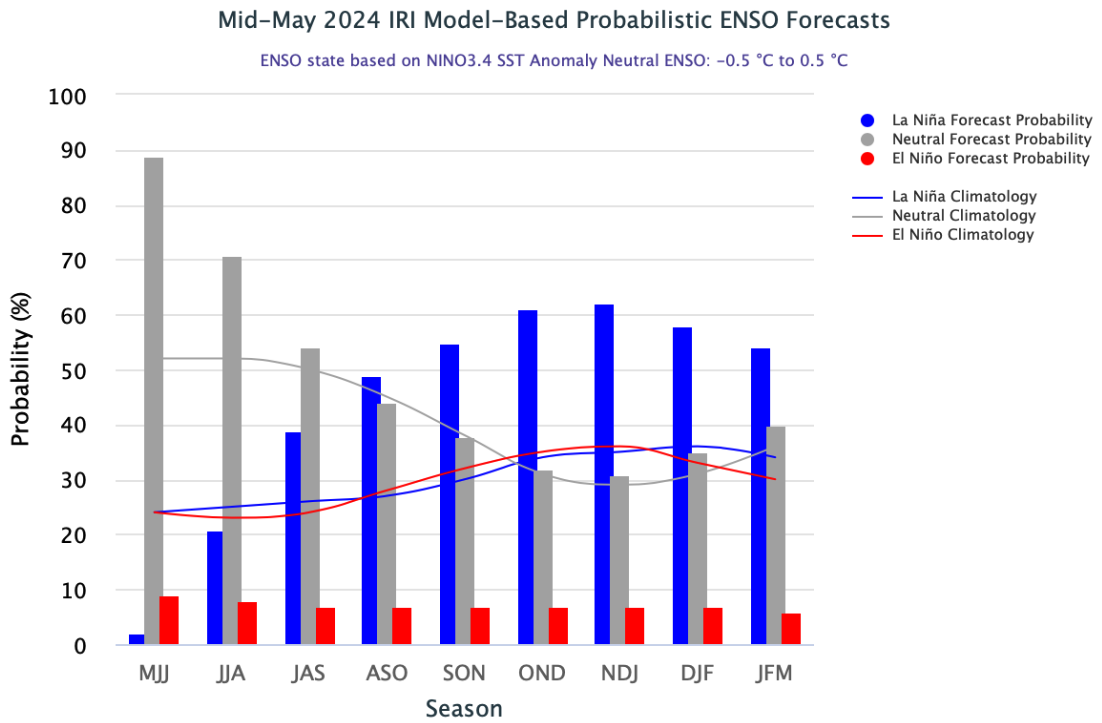
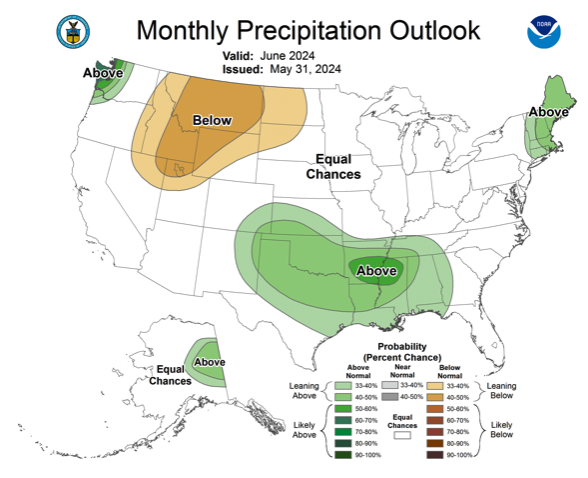
The strong El Niño event of 2023-2024 ended during May and Pacific Ocean temperatures are near average and ENSO-neutral conditions exist. There is at least a 70% probability of ENSO-neutral conditions remaining through summer, but by fall, there is a 50-60% probability of La Niña conditions forming. The NOAA Monthly Precipitation Outlook suggests an increased probability of below average June precipitation in northern Utah and above average June precipitation for southeastern Colorado. The NOAA Seasonal Outlook for June-August forecasts an increased probability of below average precipitation and above average temperatures for the entire region.
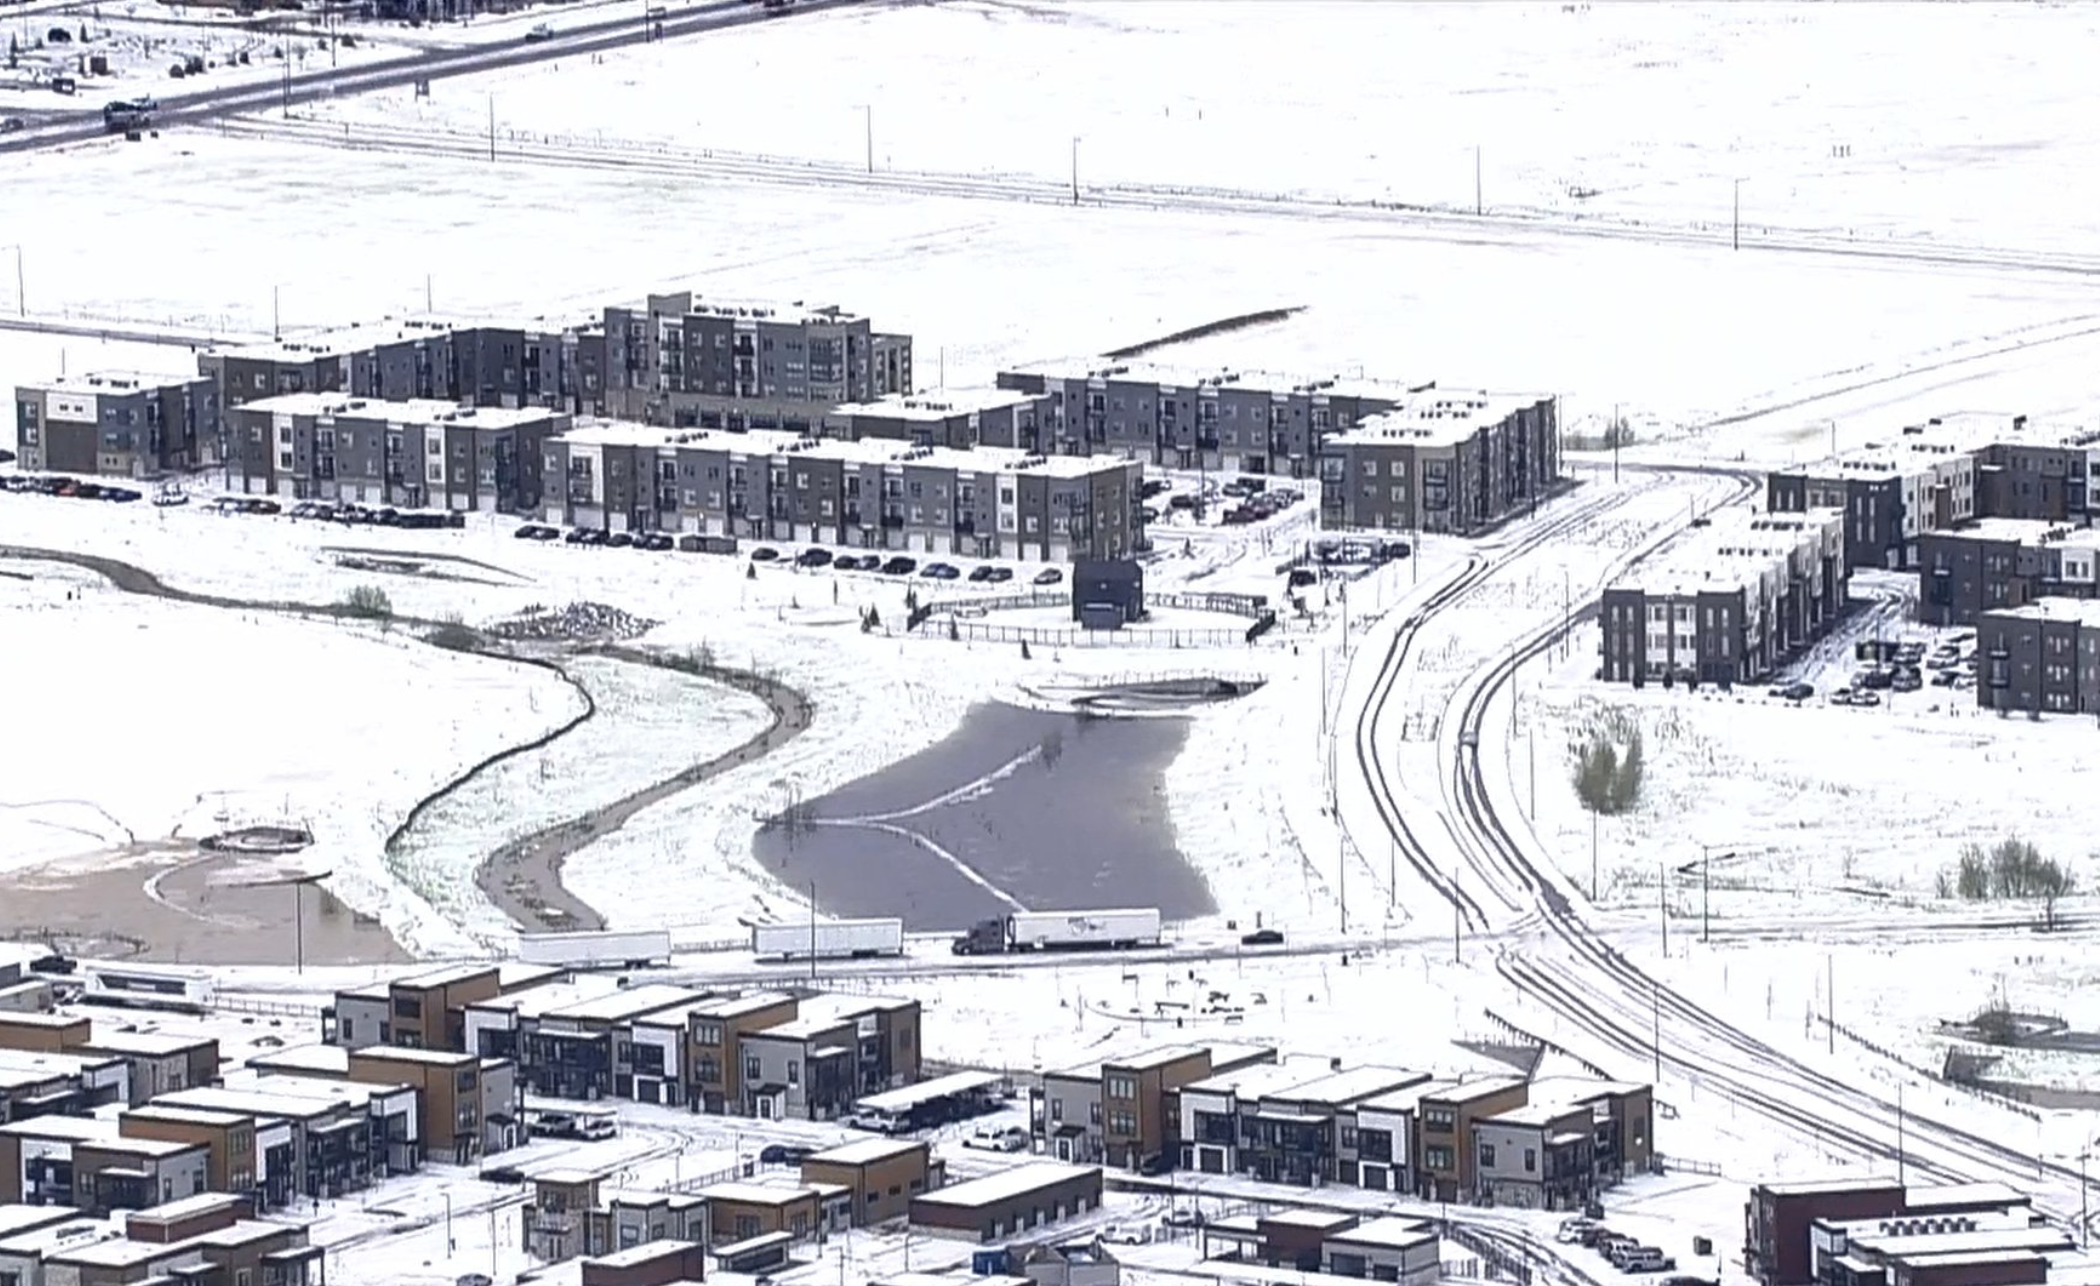
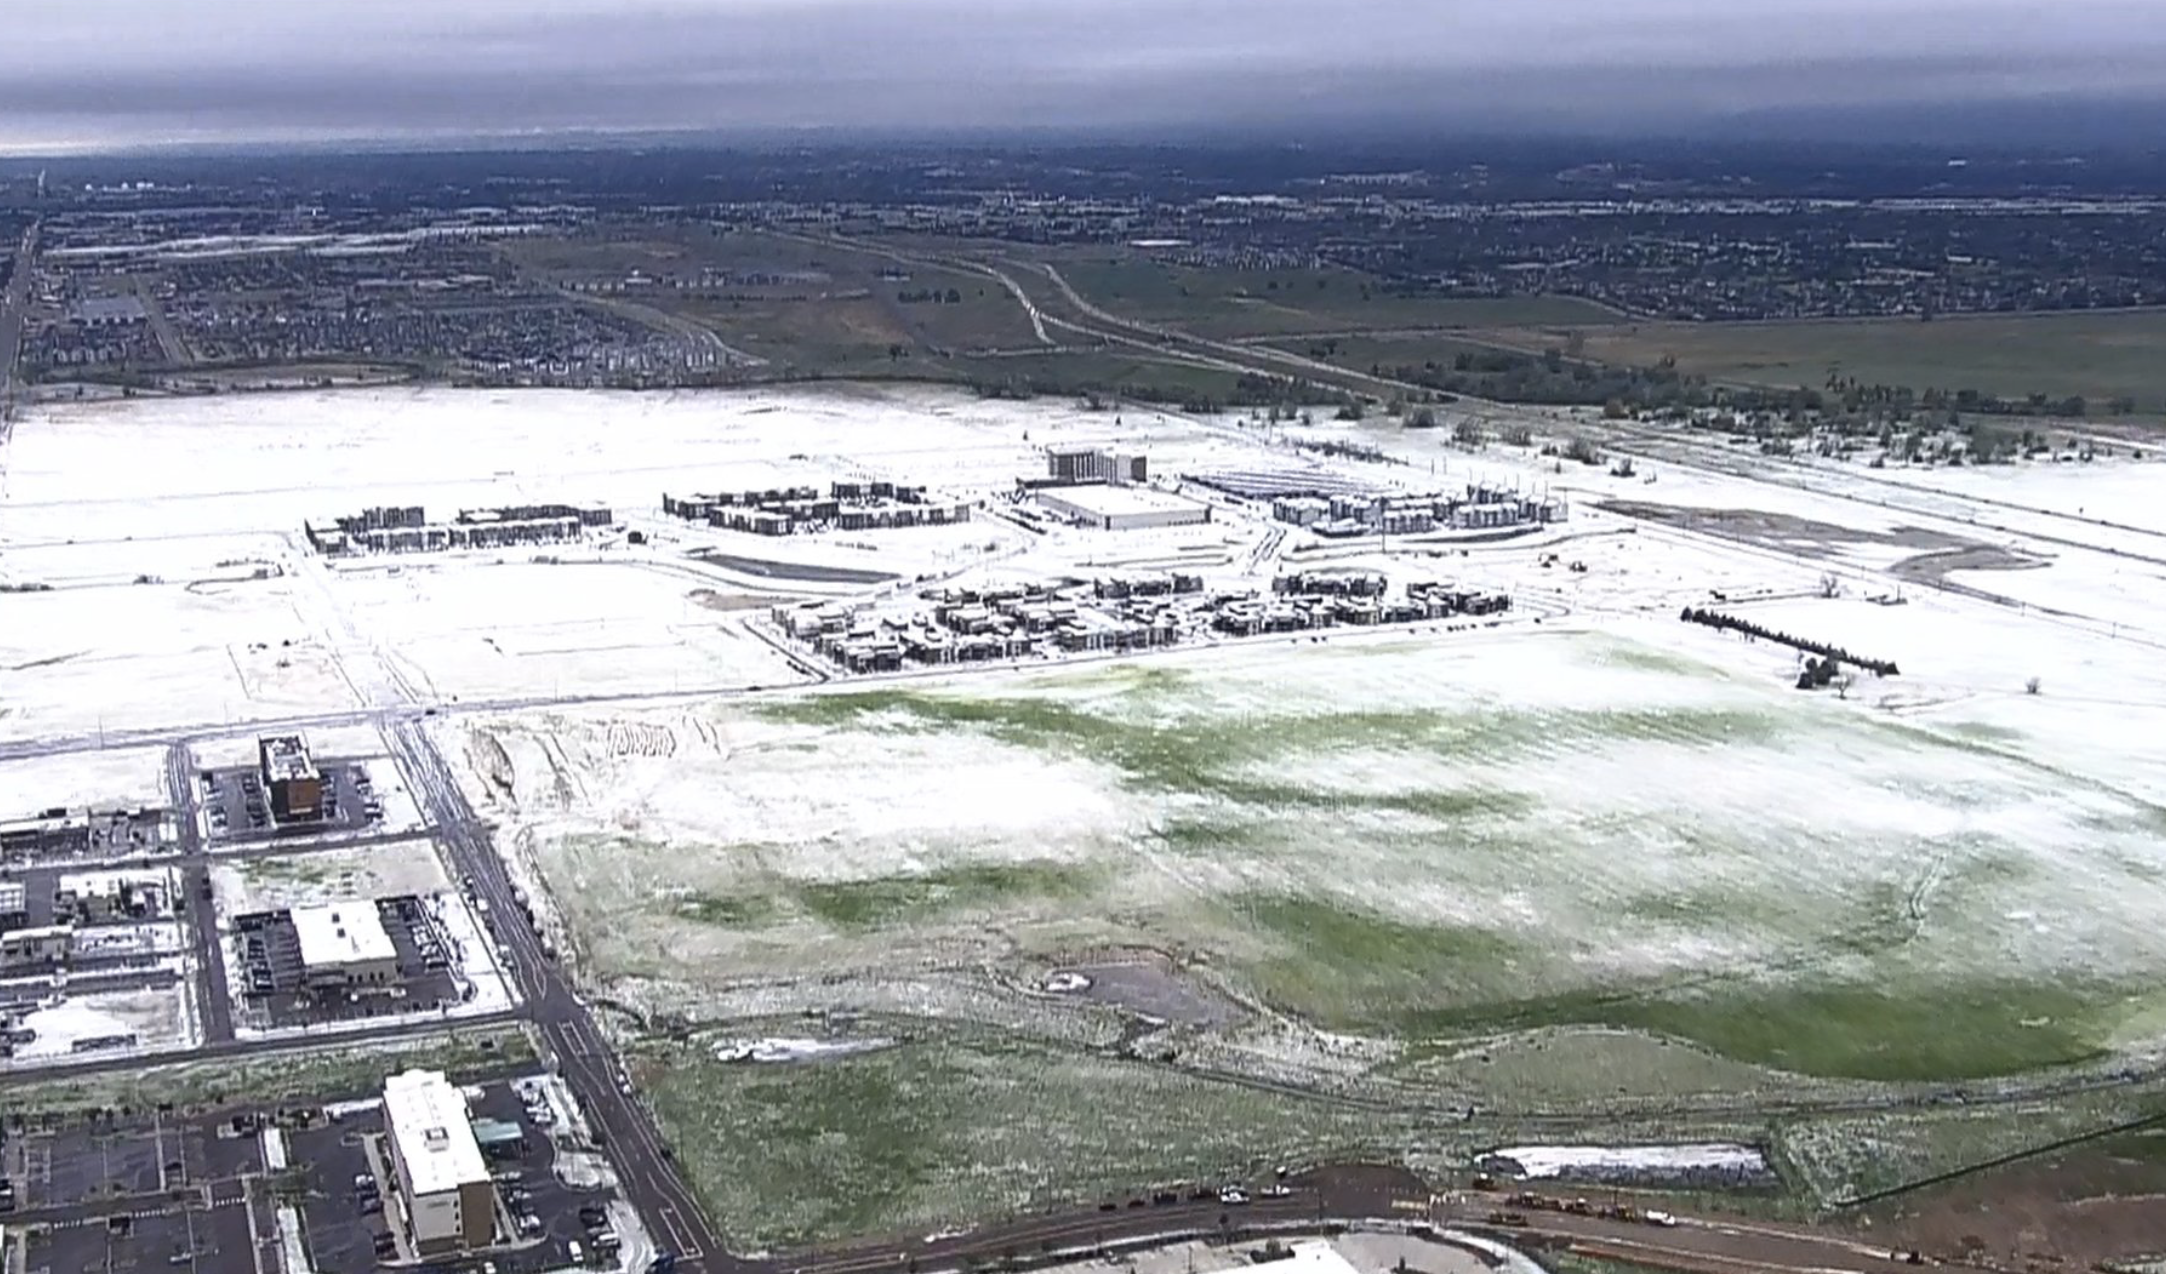
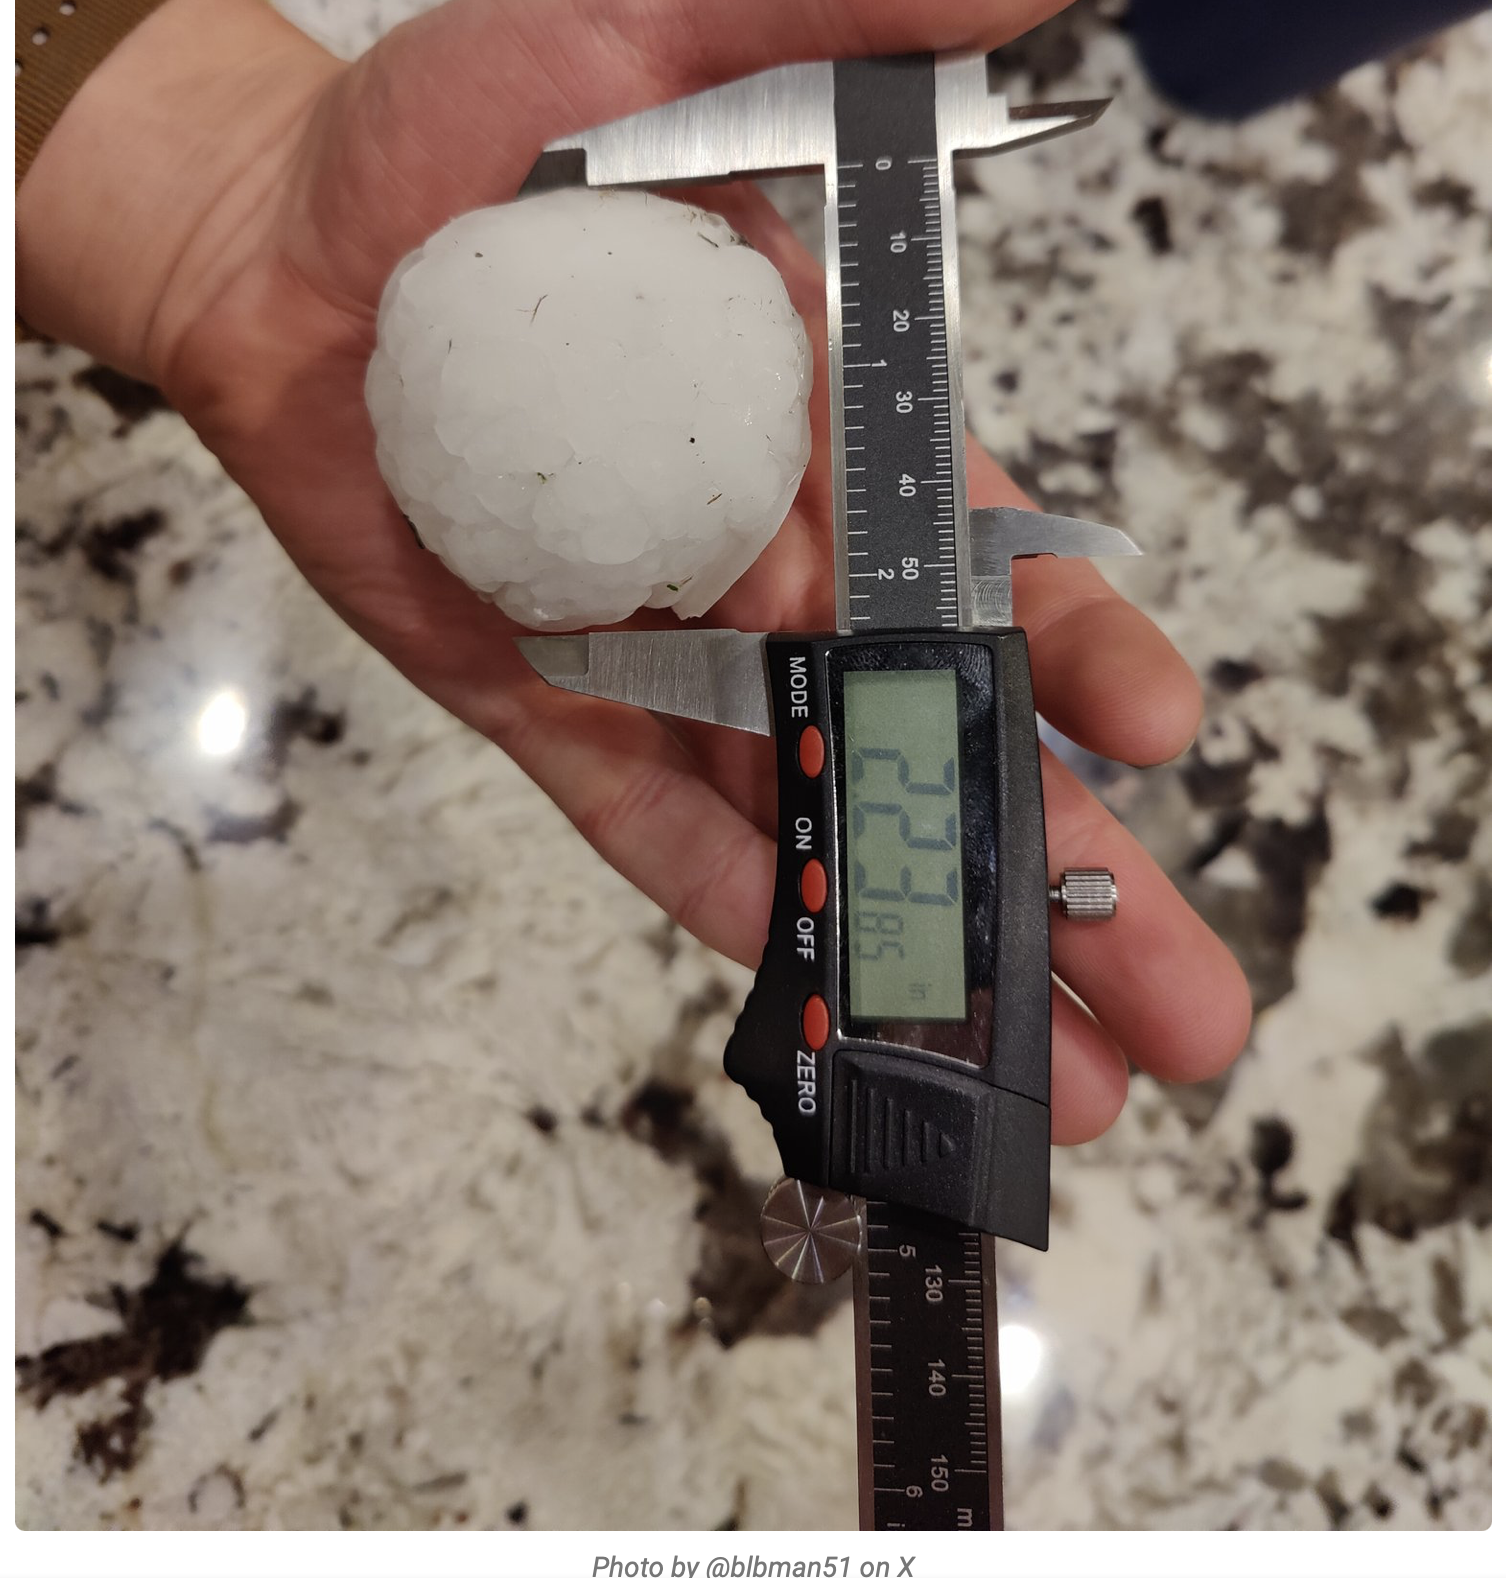
May significant weather event: Front Range severe thunderstorms. On May 30, two supercell thunderstorms rapidly formed over the Front Range and caused severe hail damage in the northern Denver metro area. Very large hail fell on the north side of Denver with hail covering roads and reaching up to 2” in diameter. (BoulderCast, Denver Hailstorm Recap, https://bouldercast.com/denver-hailstorm-recap-unexpected-nocturnal-supercells-pummeled-parts-of-the-denver-area-with-up-to-baseball-sized-hail-thursday-night/) Rainfall amounts from these thunderstorms were only a quarter to a half inch in the Denver area, but storms lingered to the northeast of Denver where up to 1.3” of rain fell in Akron on 5/30-5/31.
Click the link to read the release on the NRCS website:
June 8, 2024
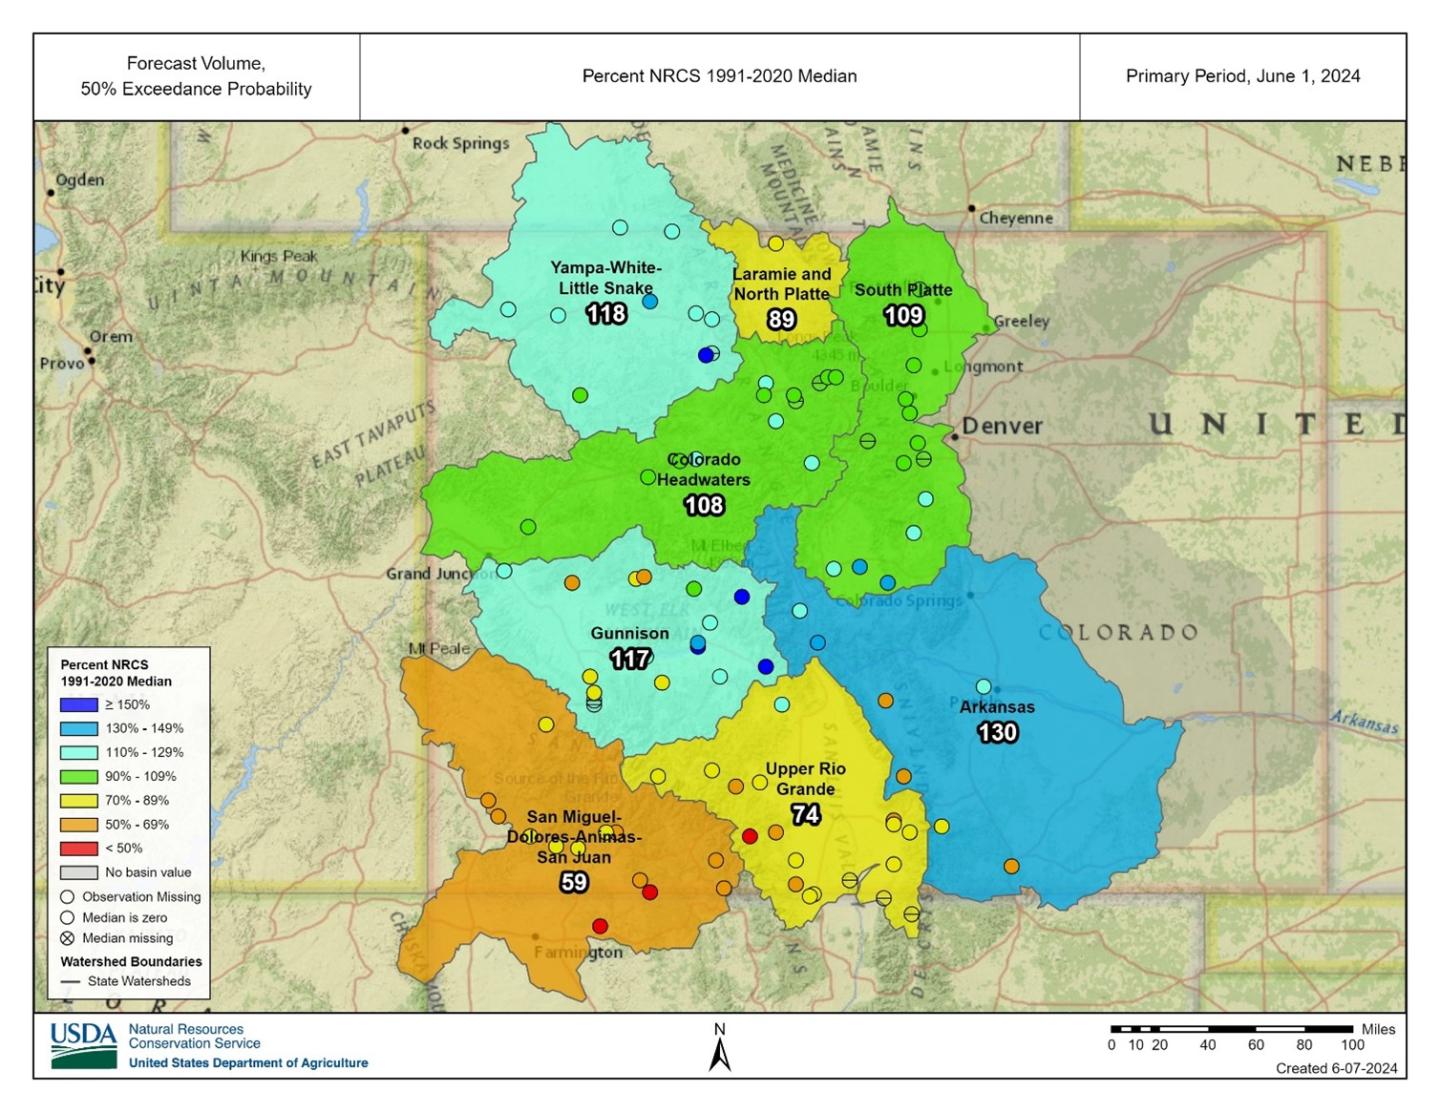
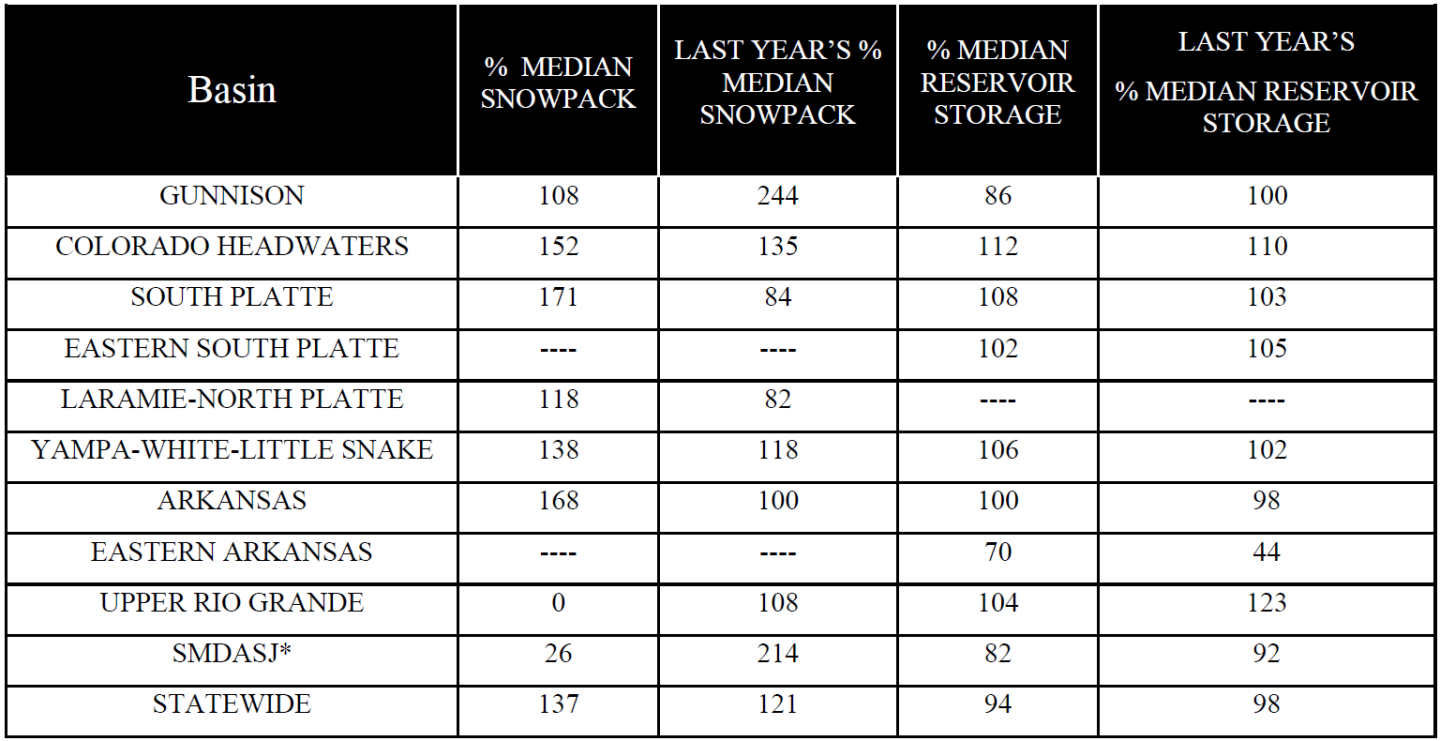
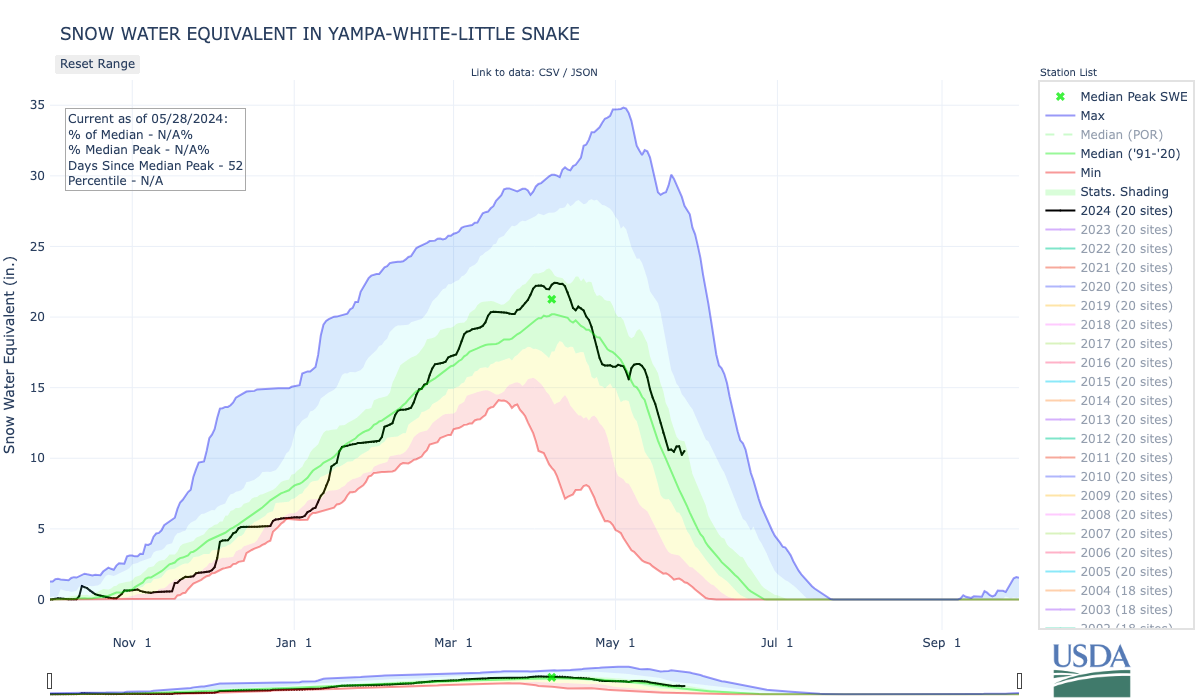
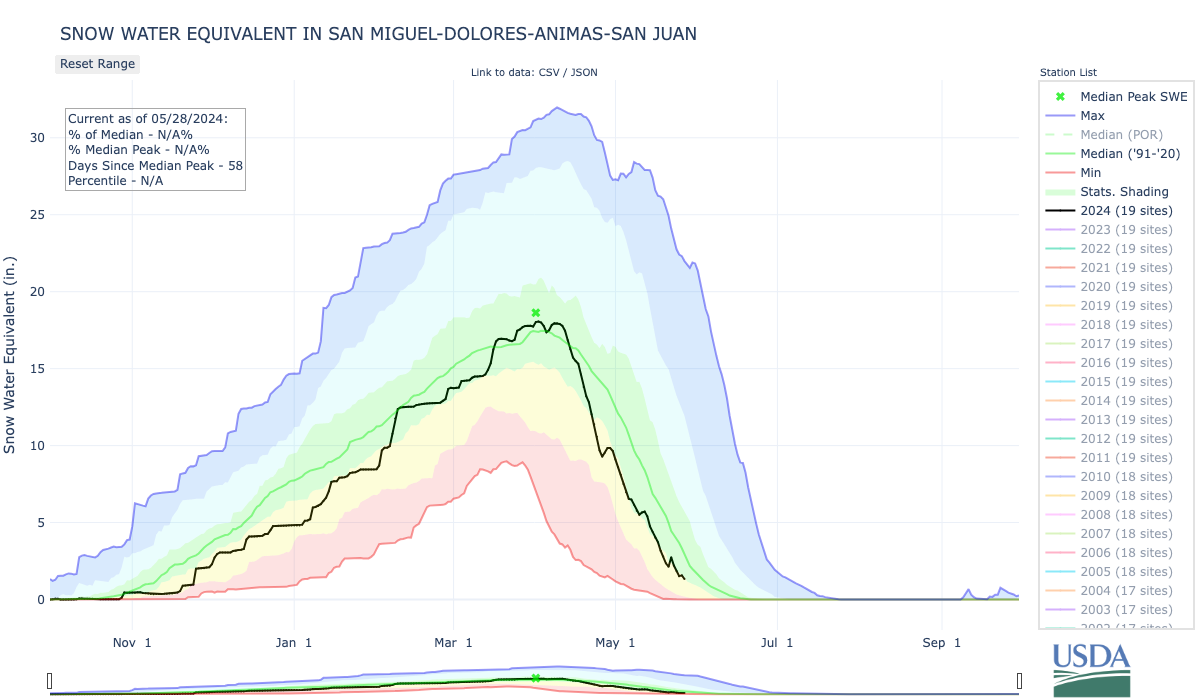
A cooler and wetter May have resulted in all but the Upper Rio Grande and the combined San Miguel-Dolores-Animas-San Juan River basins maintaining an above median snowpack
A cooler and wetter May have resulted in all but the Upper Rio Grande and the combined San Miguel-Dolores-Animas-San Juan River basins maintaining an above median snowpack. With much of the lower elevation snow melted out, only 45 of Colorado’s 124 SNOTEL stations recorded snow on the ground at the end of May. Most of the remaining snowpack is in northern and central basins along the Continental Divide. “During May, much of the central part of the state received above normal precipitation, combined with cooler temperatures, has allowed more snow to persist at higher elevations in some areas. These factors are leading to optimistic late season runoff volume forecasts for many river basins,” notes NRCS Hydrologist Joel Atwood. Runoff volume forecasts for June and July across the state are generally optimistic with the Gunnison, Arkansas and the combined Yampa-White-Little Snake River basins all forecasted to have well above median runoff. In addition, the South Platte and Colorado Headwaters River basins are also expecting slightly above median runoff volumes at 109 and 108 percent of median, respectively. Atwood continues, “In southern Colorado, many SNOTEL stations in the San Juan Mountains melted off around a week earlier than normal despite a near normal peak snowpack. In addition, the northern Sangre de Cristo mountains had a below normal peak snowpack. These conditions contribute to a less optimistic late season water supply in southwest Colorado.” The southwestern river basins of the combined San Miguel-Dolores-Animas-San Juan and Upper Rio Grande are forecasted to have below normal runoff volumes for June and July, at 59 and 74 percent of median, respectively.
At of the end of May, reservoir storage across Colorado was 94 percent of median. Several basins were reporting above median storage, ranging from 100 percent of median in the Arkansas River basin to 112 percent of median in the Colorado Headwaters River basin. The combined San Miguel-Dolores-Animas-San Juan, Upper Rio Grande and Eastern Arkansas River basins all were reporting below median reservoir storage ranging from 70 percent of median in the Eastern Arkansas River basin to 86 percent of median in the Gunnison River basin.
Most of the state received well above median precipitation with a few exceptions. The combined Laramie-North Platte, South Platte, and San Miguel-Dolores-Animas-San Juan River basins each received 100, 89 and 63 percent of median precipitation, respectively. Other basin across the state received much higher totals compared to normal, ranging from 110 percent of median in the Colorado Headwaters River basin to 153 percent of median in the Arkansas River basin. Statewide precipitation during May was above normal at 107 percent of median.
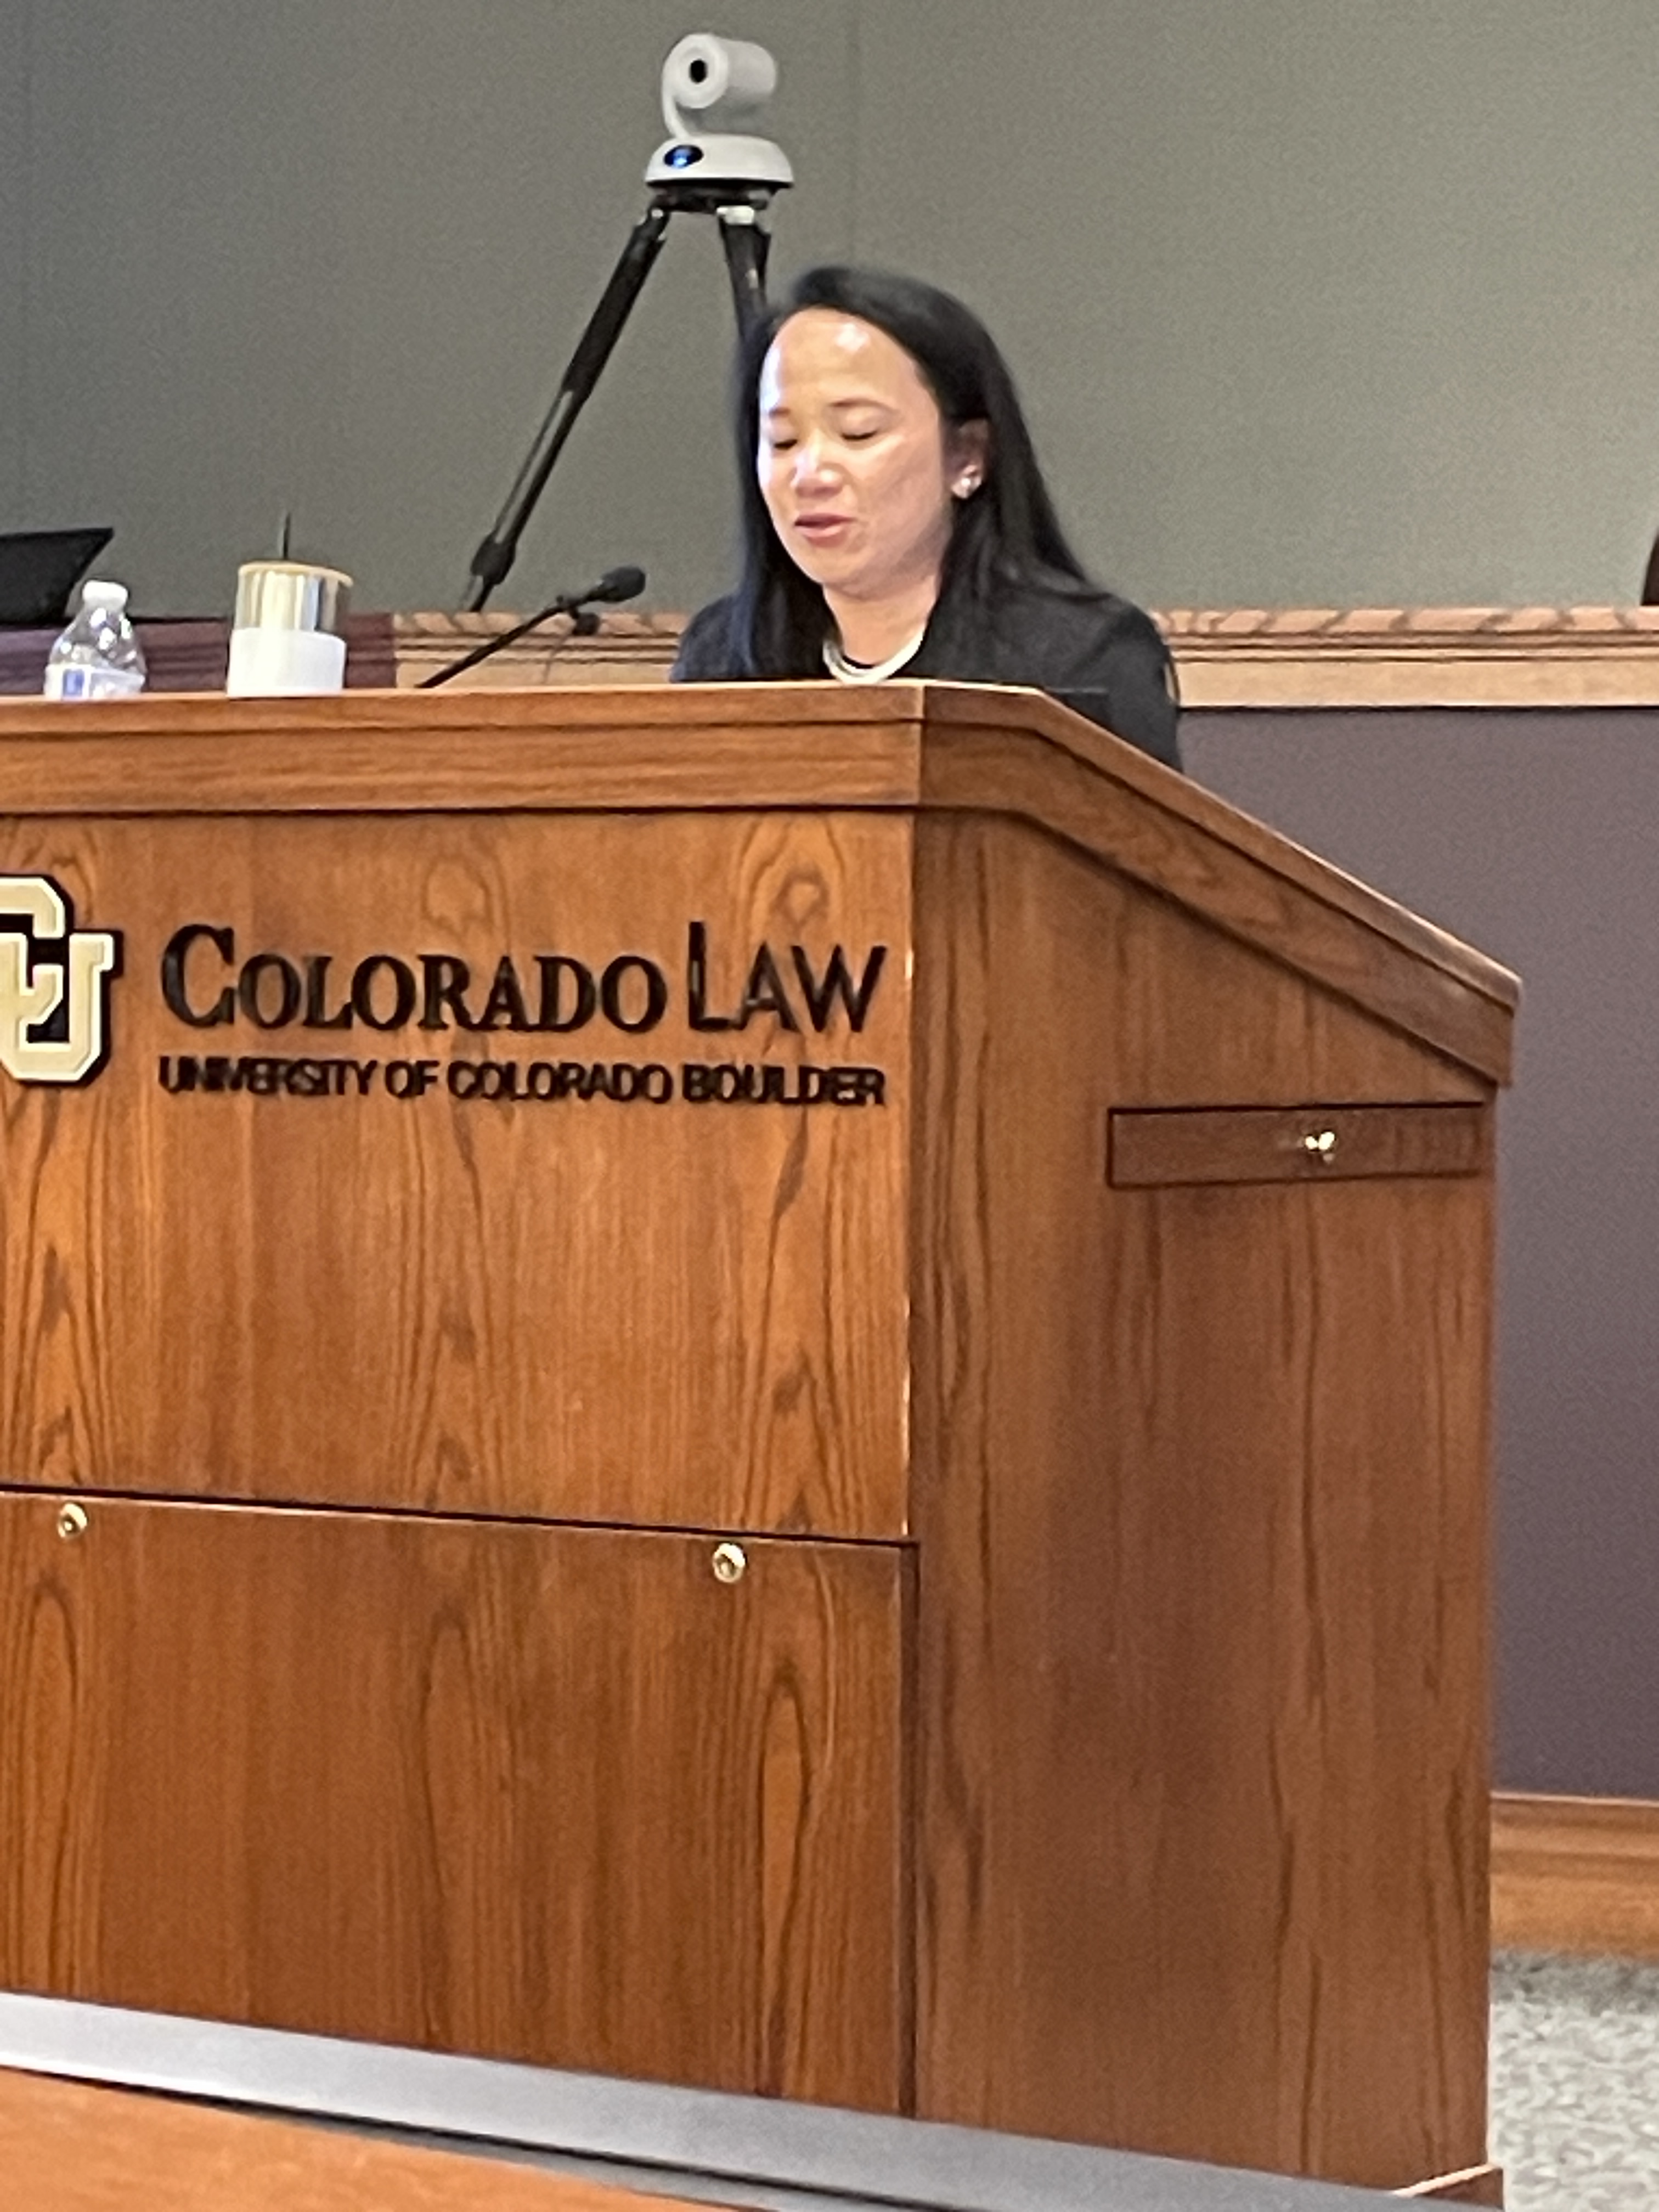
Bureau of Reclamation Commissioner Camille Calimlim Touton, speaking at the June 6, 2024 Getches-Wilkinson/Water and Tribes Initiative conference on the Colorado River at CU-Boulder May 6, 2024.
Click the link to read the article on the Colorado Politics website (Marianne Goodland). Here’s an excerpt:
June 7, 2024
U.S. Bureau of Reclamation Commissioner Camille Calimlim Touton touted the accomplishments of the Biden-Harris administration over the past three years, noting efforts that have poured billions of dollars into shoring up the Colorado River basin. Those efforts mean the near-term threat to the river basin has been fended off, and the system has been stabilized to protect water deliveries, the ecosystem, and power production, Touton told the audience at the 2024 Conference on the Colorado River at the University of Colorado Boulder law school. One of those accomplishments will mean an extra five feet of water elevation at Lake Mead. That resulted from a new agreement with Mexico, called Minute 330, which went into effect in April. Touton said the new deal under the 1944 treaty with Mexico will conserve 400,000 acre-feet over 30 months through the end of 2026…
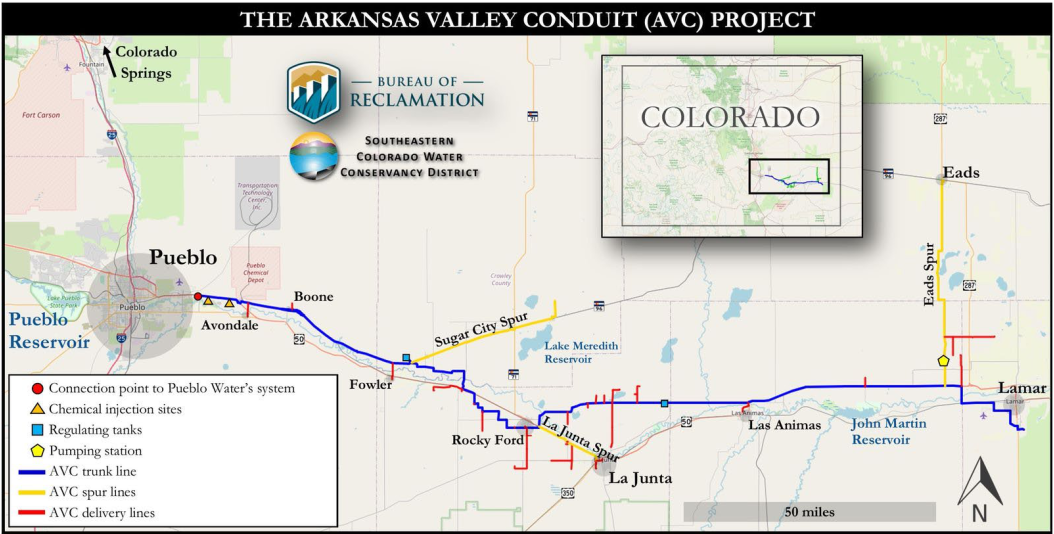
Touton also listed the various water projects headed to the Colorado River basin and funded by the Biden-Harris administration through the Bipartisan Infrastructure Act and the Inflation Reduction Act. This includes $4.1 billion for 537 projects in all the states where the bureau operates west of the Missouri River. Among her favorite projects, not necessarily all applying to the Colorado River, Touton noted the Arkansas Valley River Conduit, a President John Kennedy administration-initiated project that finally broke ground two years ago. That project will bring clean drinking water from Pueblo Reservoir through a pipeline to Lamar.
Arkansas Valley Conduit map via the Southeastern Colorado Water Conservancy District (Chris Woodka) June 2021.
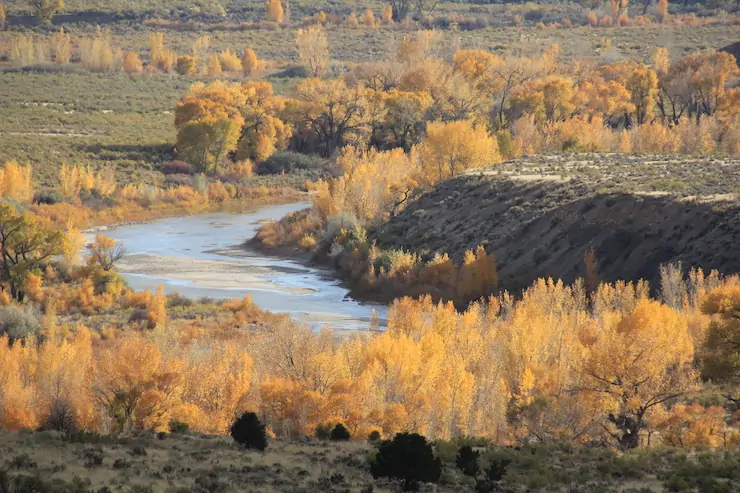
Autumn view of the wetlands and cottonwood groves in the Yampa River basin at Carpenter Ranch, located west of Steamboat Springs, Colorado. Photo courtesy of The Nature Conservancy
One year after the U.S. Supreme Court removed federal regulations protecting wetlands and streams from development pressures in its Sackett v. the EPA decision, Colorado is the first state in the nation to pass legislation replacing those regulations, according to a new national report.
The report, by the Clean Water For All coalition and Lawyers for Good Government, shows that eight other states have taken action to restore some level of protection or are trying; five launched failed attempts to impose further cutbacks; and one state, Indiana, rolled back protections further. Thirty-five states have taken no action.
Environmentalists say the spotty response is a clear indication that Congress must intervene to create consistent, clearly defined protections that work for all states, and which protect rivers and wetlands that cross state boundaries.
“Different states are struggling to see how to respond to it,” said Kristine Oblock, senior campaign manager for the Clean Water for All coalition. “And the state-by-state solutions are not going to be enough to protect our waters. … Our goal is to restore federal protections.”
The problem is particularly acute in Colorado and other Western states, where vast numbers of streams are temporary, or ephemeral, flowing only after major rainstorms and during spring runoff season, when the mountain snow melts. The Sackett decision said, in part, that only streams that flow year-round are subject to federal oversight. It also said that only wetlands that had a surface connection to continually flowing water bodies qualified for protection. Many wetlands in Colorado have a subsurface connection to streams, rather than one that can be observed above ground.
The Sackett decision came after decades of federal court battles over murky definitions about which waterways fall under the Clean Water Act’s jurisdiction, which wetlands must be regulated, and what kinds of dredge-and-fill work in waterways should be permitted. There also were long-running disputes over what authority the act had over activities on farms and Western irrigation ditches, and what activities industry and wastewater treatment plants must seek permits for.
Finding a clear, bipartisan solution that Congress might embrace isn’t likely to be easy. “It’s only been a year, so a lot of different entities are still working out the path forward,” said Jonathan Wood, vice president of law and policy at Montana-based Property and Environment Research Center, or PERC, a conservative think tank that filed a brief supporting the Sacketts, in last year’s Supreme Court case. The Sacketts are private landowners.
“It’s possible that Congress could act,” Wood said. “I think there is an appetite for it but it seems unlikely. And if the suggestion is to just go back to how it was applied pre-Sackett, I don’t see a path forward for that.”
Polls in Colorado and nationwide show majority support among Democrats, Republicans and independents for restoring protections.
Colorado lawmakers were able to win bipartisan backing for their bill after weeks of intense negotiations. Whether the same thing could occur at the national level is a big question.
“Bipartisan is easier at the state level because you aren’t trying to regulate different hydrologies across the country. Any time you’re trying to establish a rule that applies to New England and the West, it is difficult,” Wood said. That Colorado lawmakers were able to agree on regulatory exemptions for agriculture, developers, some cities and other industries also likely helped propel the measure to passage, Wood said.
And there are other options besides Congress. PERC’s mission is to find free market solutions to environmental problems. Wood said PERC would like to see incentives for private landowners to protect wetlands, something Indiana lawmakers approved this year, even after removing other protections. PERC would also like to see industry held accountable for paying the costs of restoring the wetlands that have already been lost.
“Wetlands reduce pollution from someone else, so why not make the polluters pay,” Wood said. “These kinds of opportunities all provide a path forward that is less conflict ridden than the Clean Water Act regulations that have applied for the last several decades.”
Still, environmentalists plan to keep their eyes on Congress, said Josh Kuhn, senior water campaign manager for Conservation Colorado.
“It’s clear that there is bipartisan support for this effort from the public and we need them to make their voices heard,” Kuhn said. “Doing so will create the political will to address the threat of deteriorating water quality and the impacts of climate change,” Kuhn said.
More by Jerd SmithJerd Smith is editor of Fresh Water News. She can be reached at 720-398-6474, via email at jerd@wateredco.org or @jerd_smith.
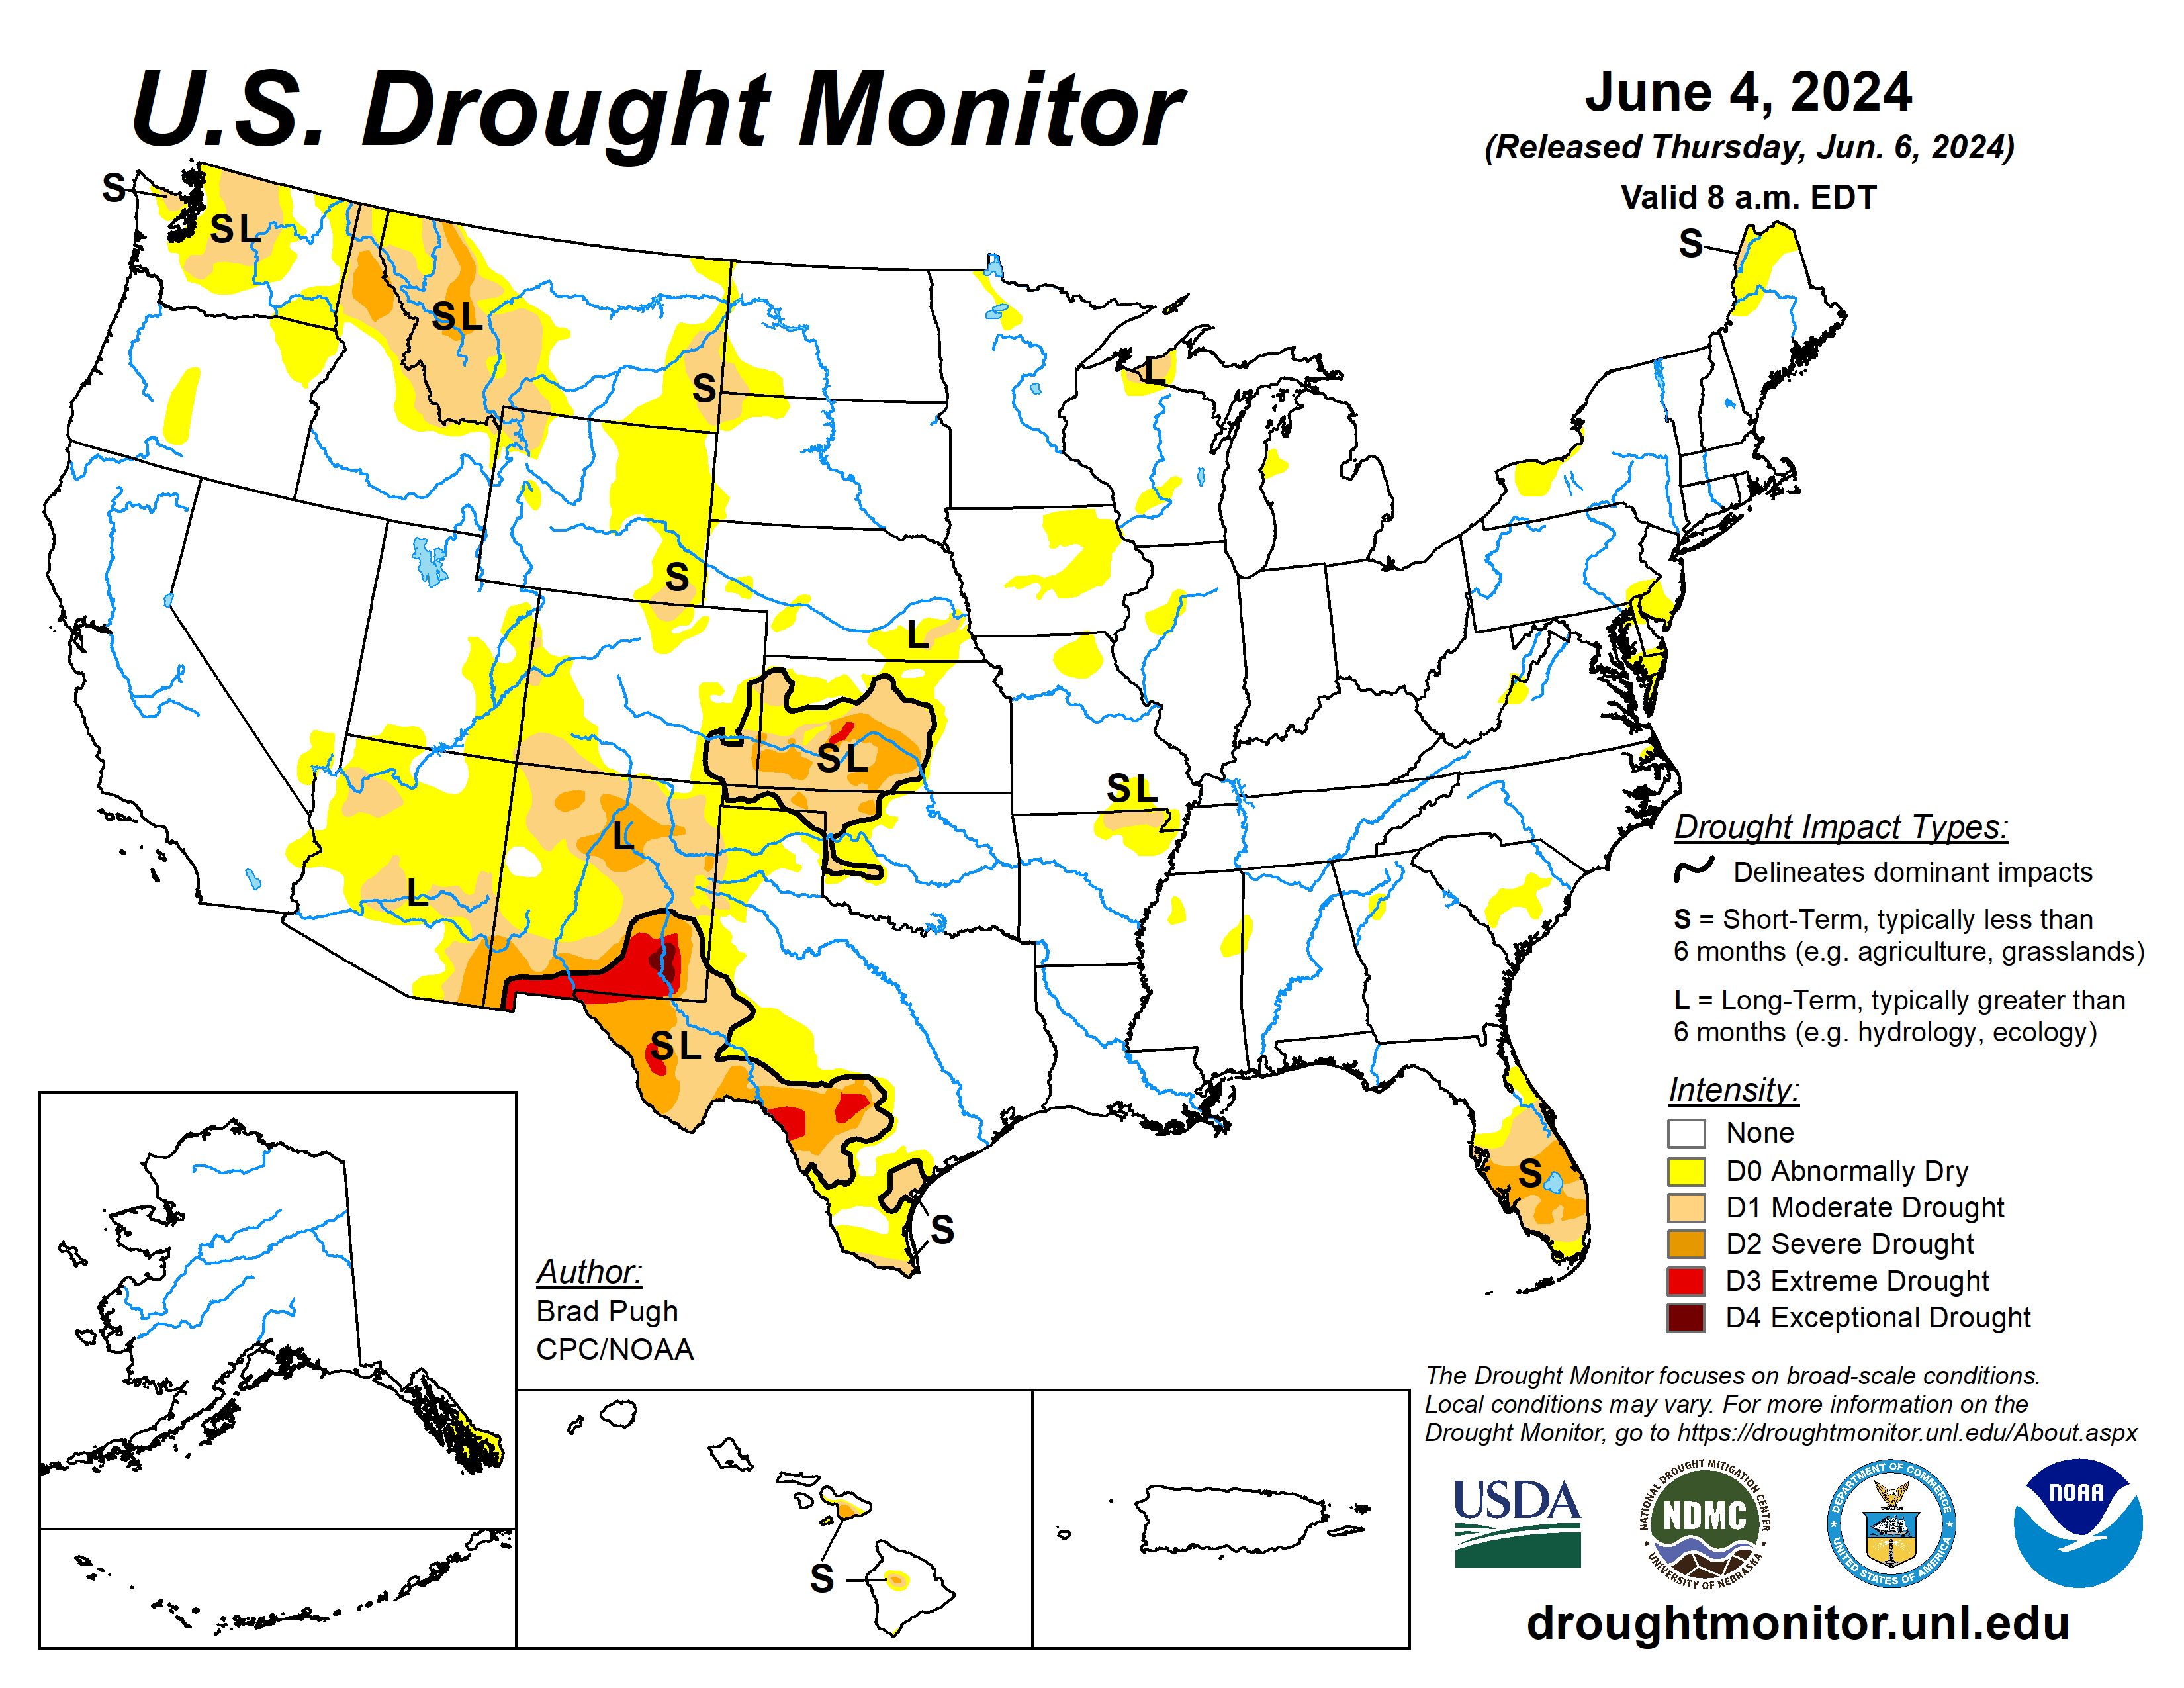
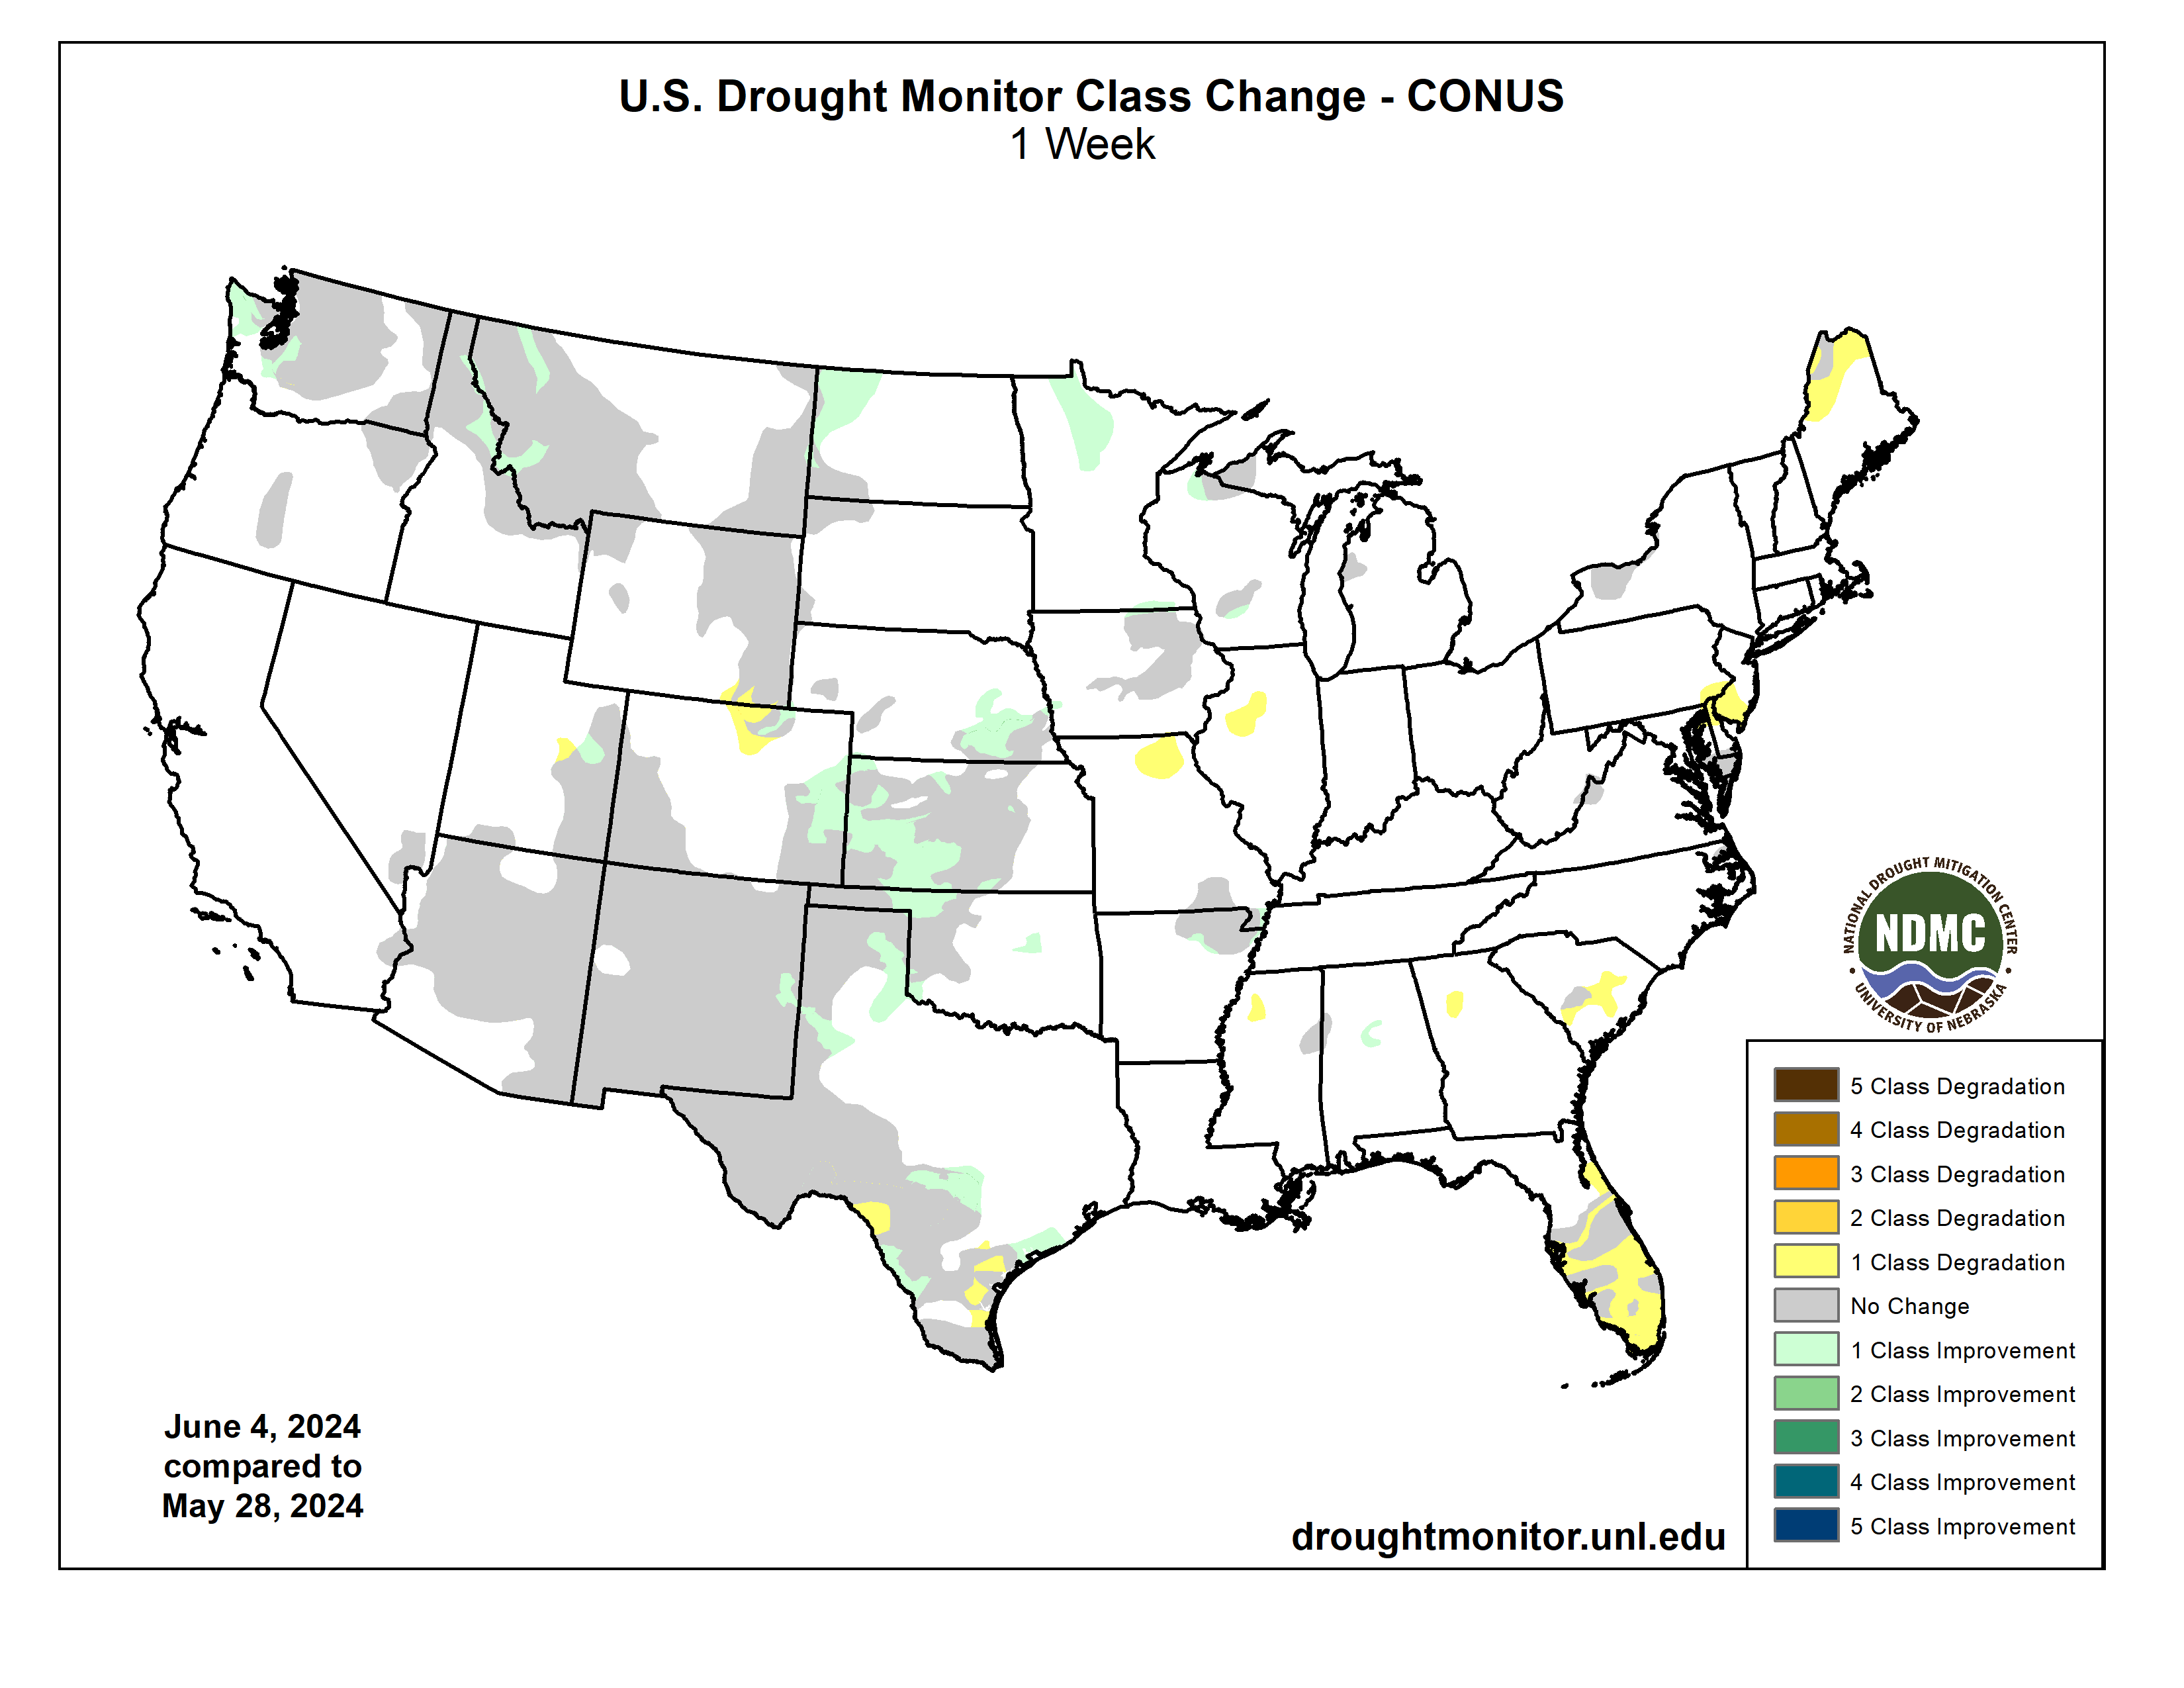
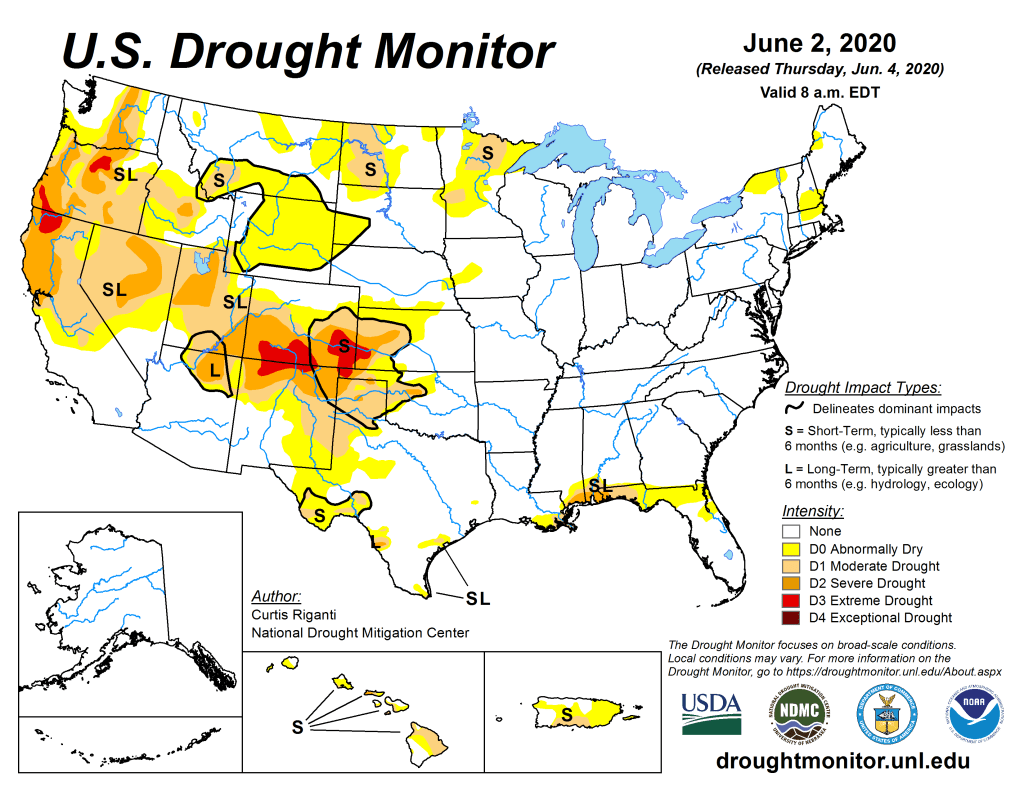
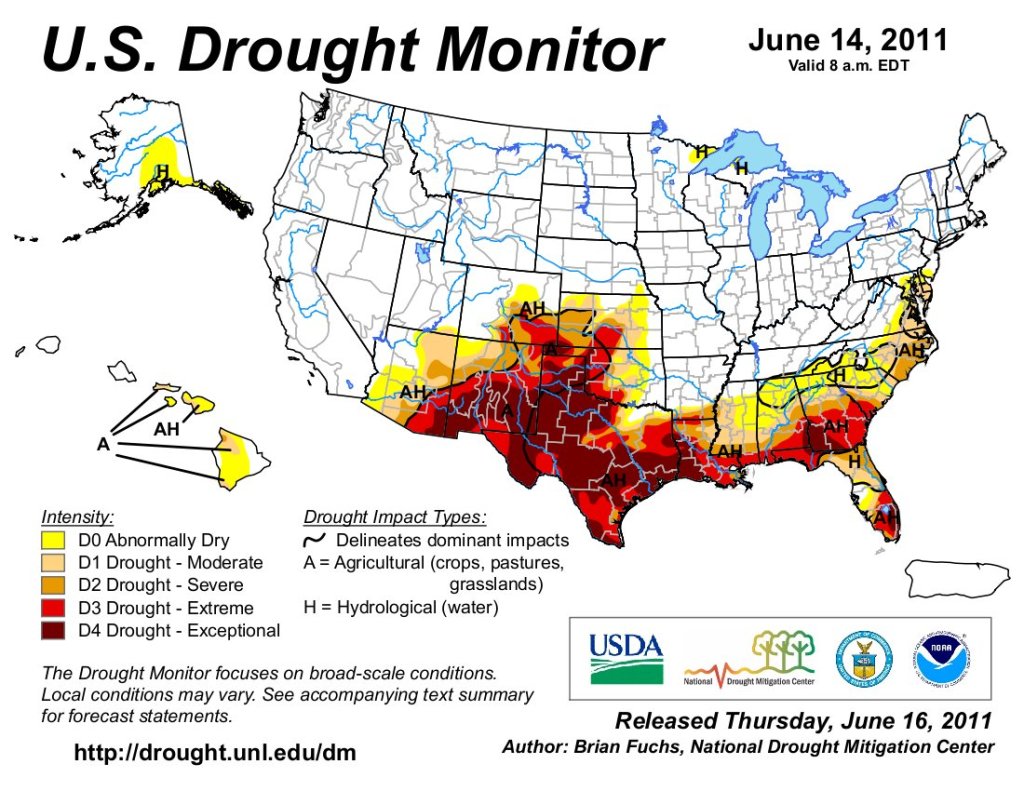
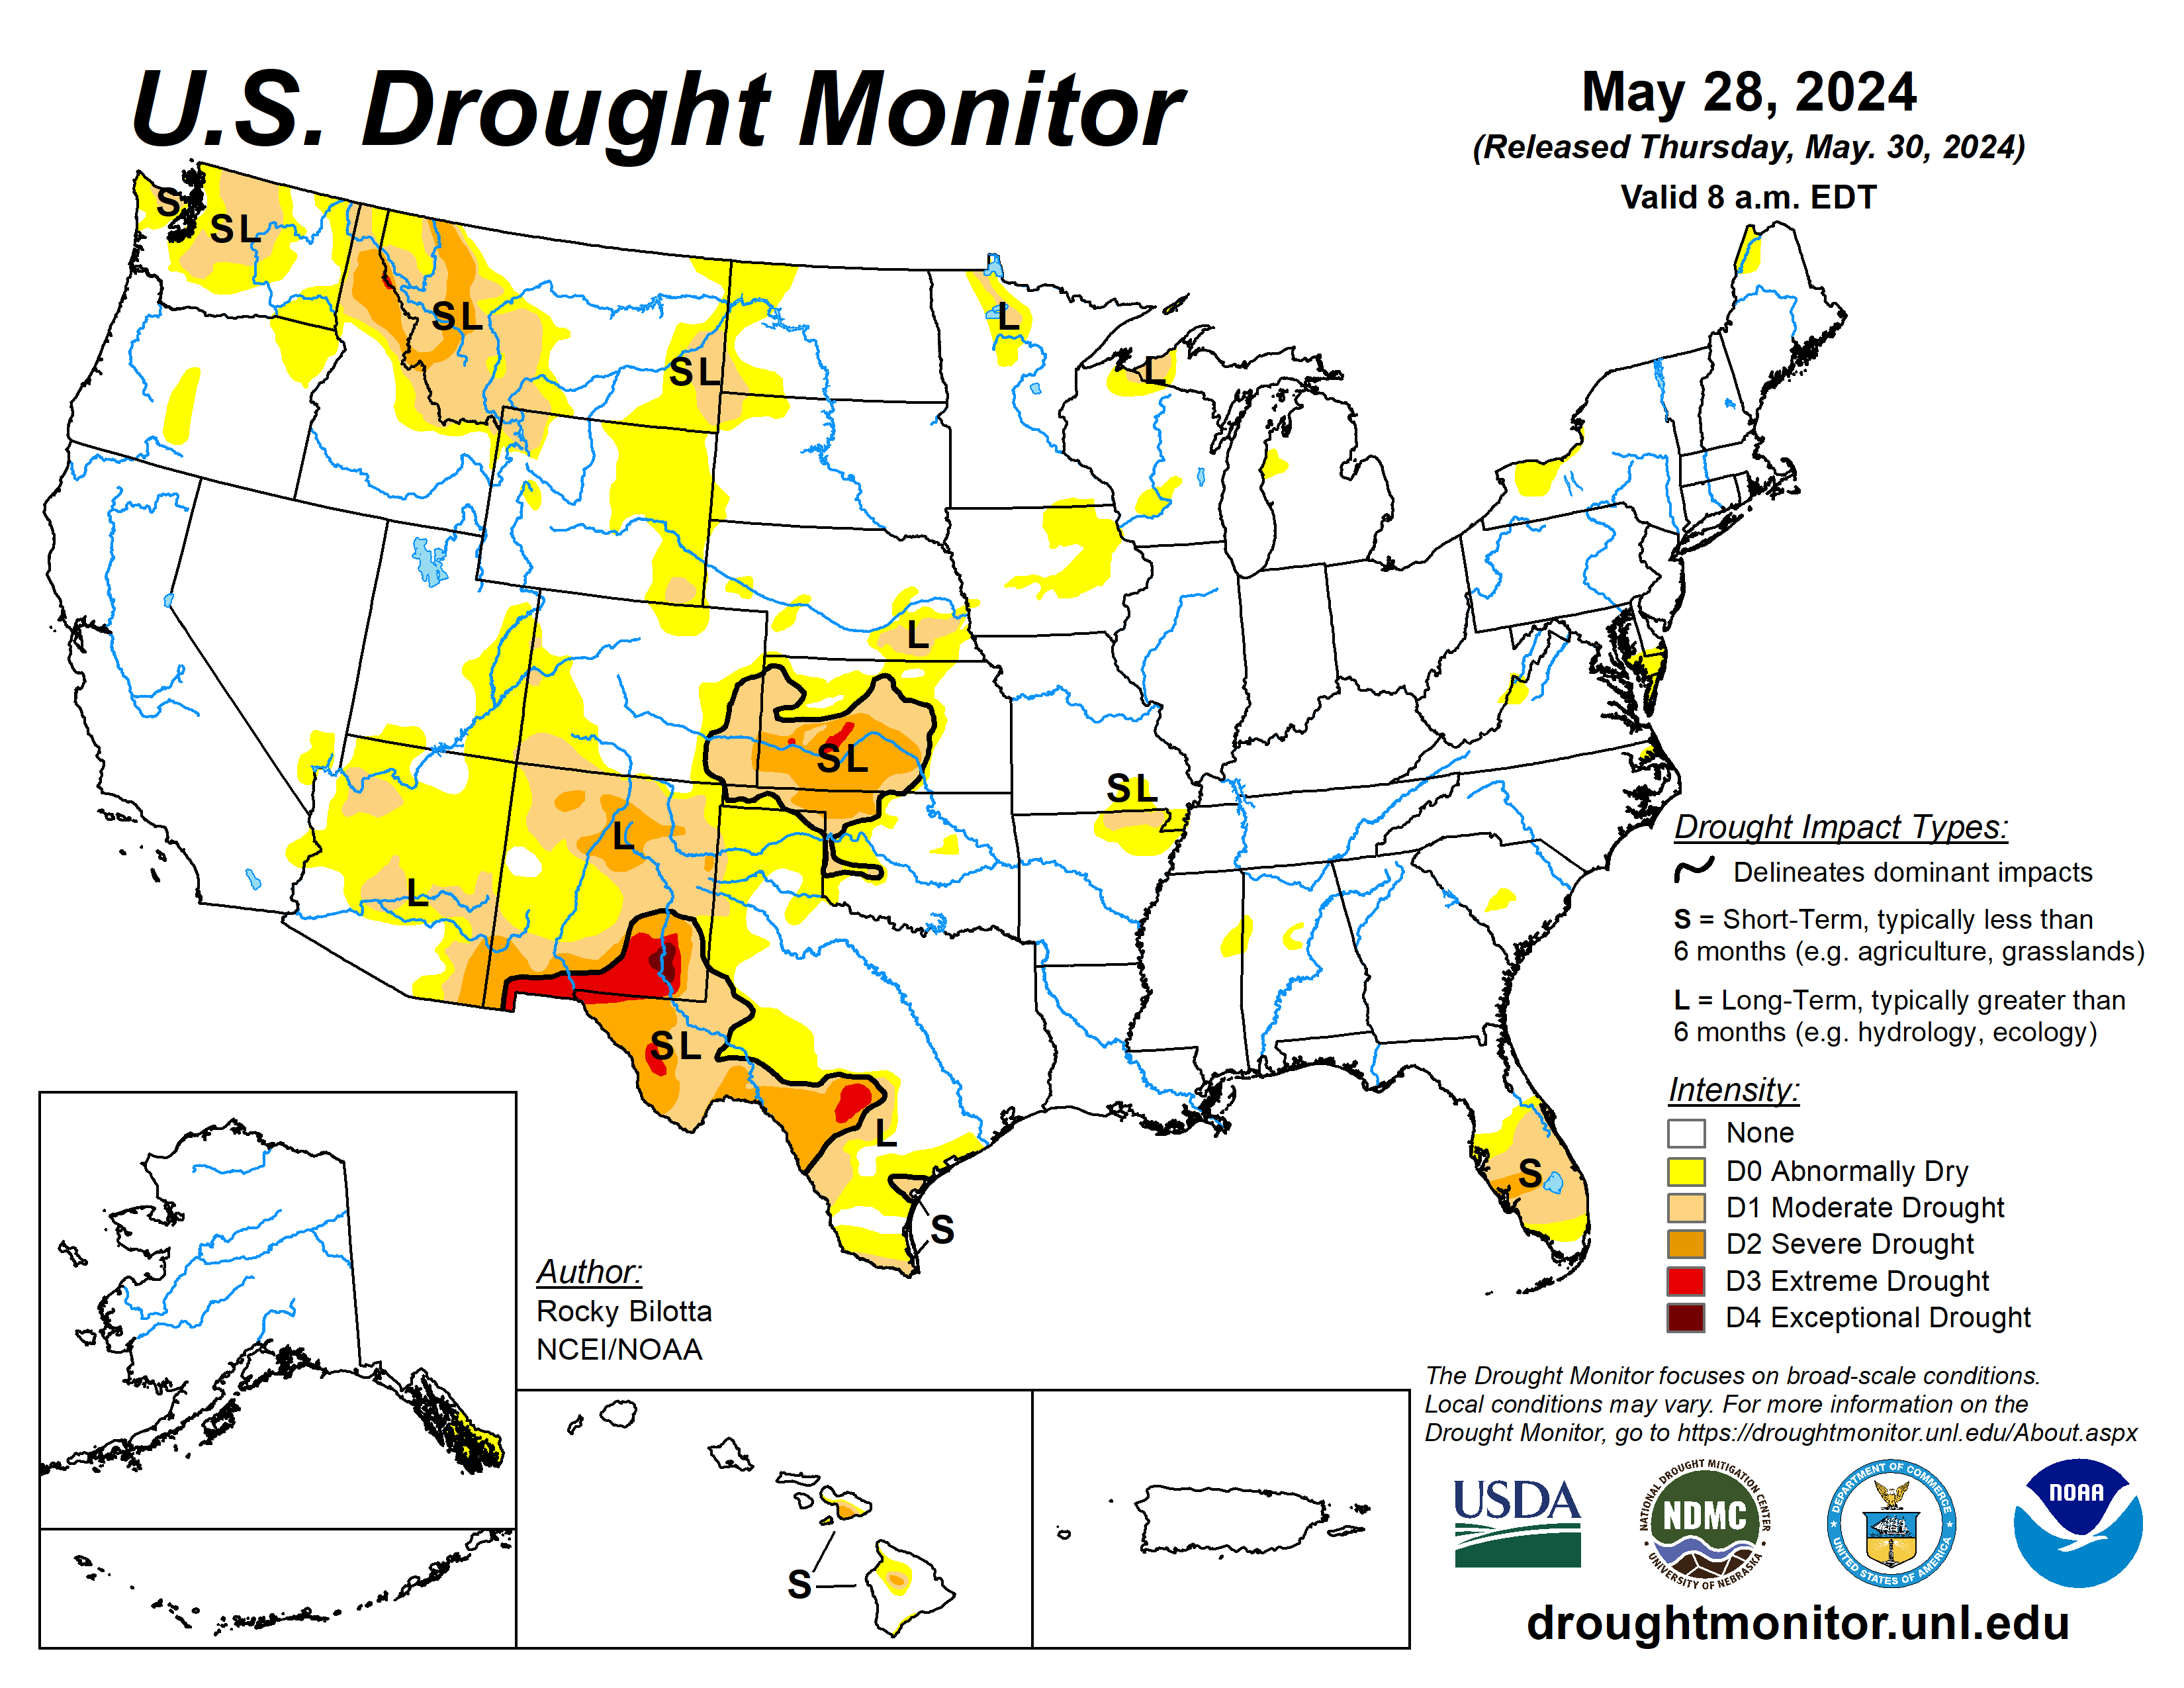
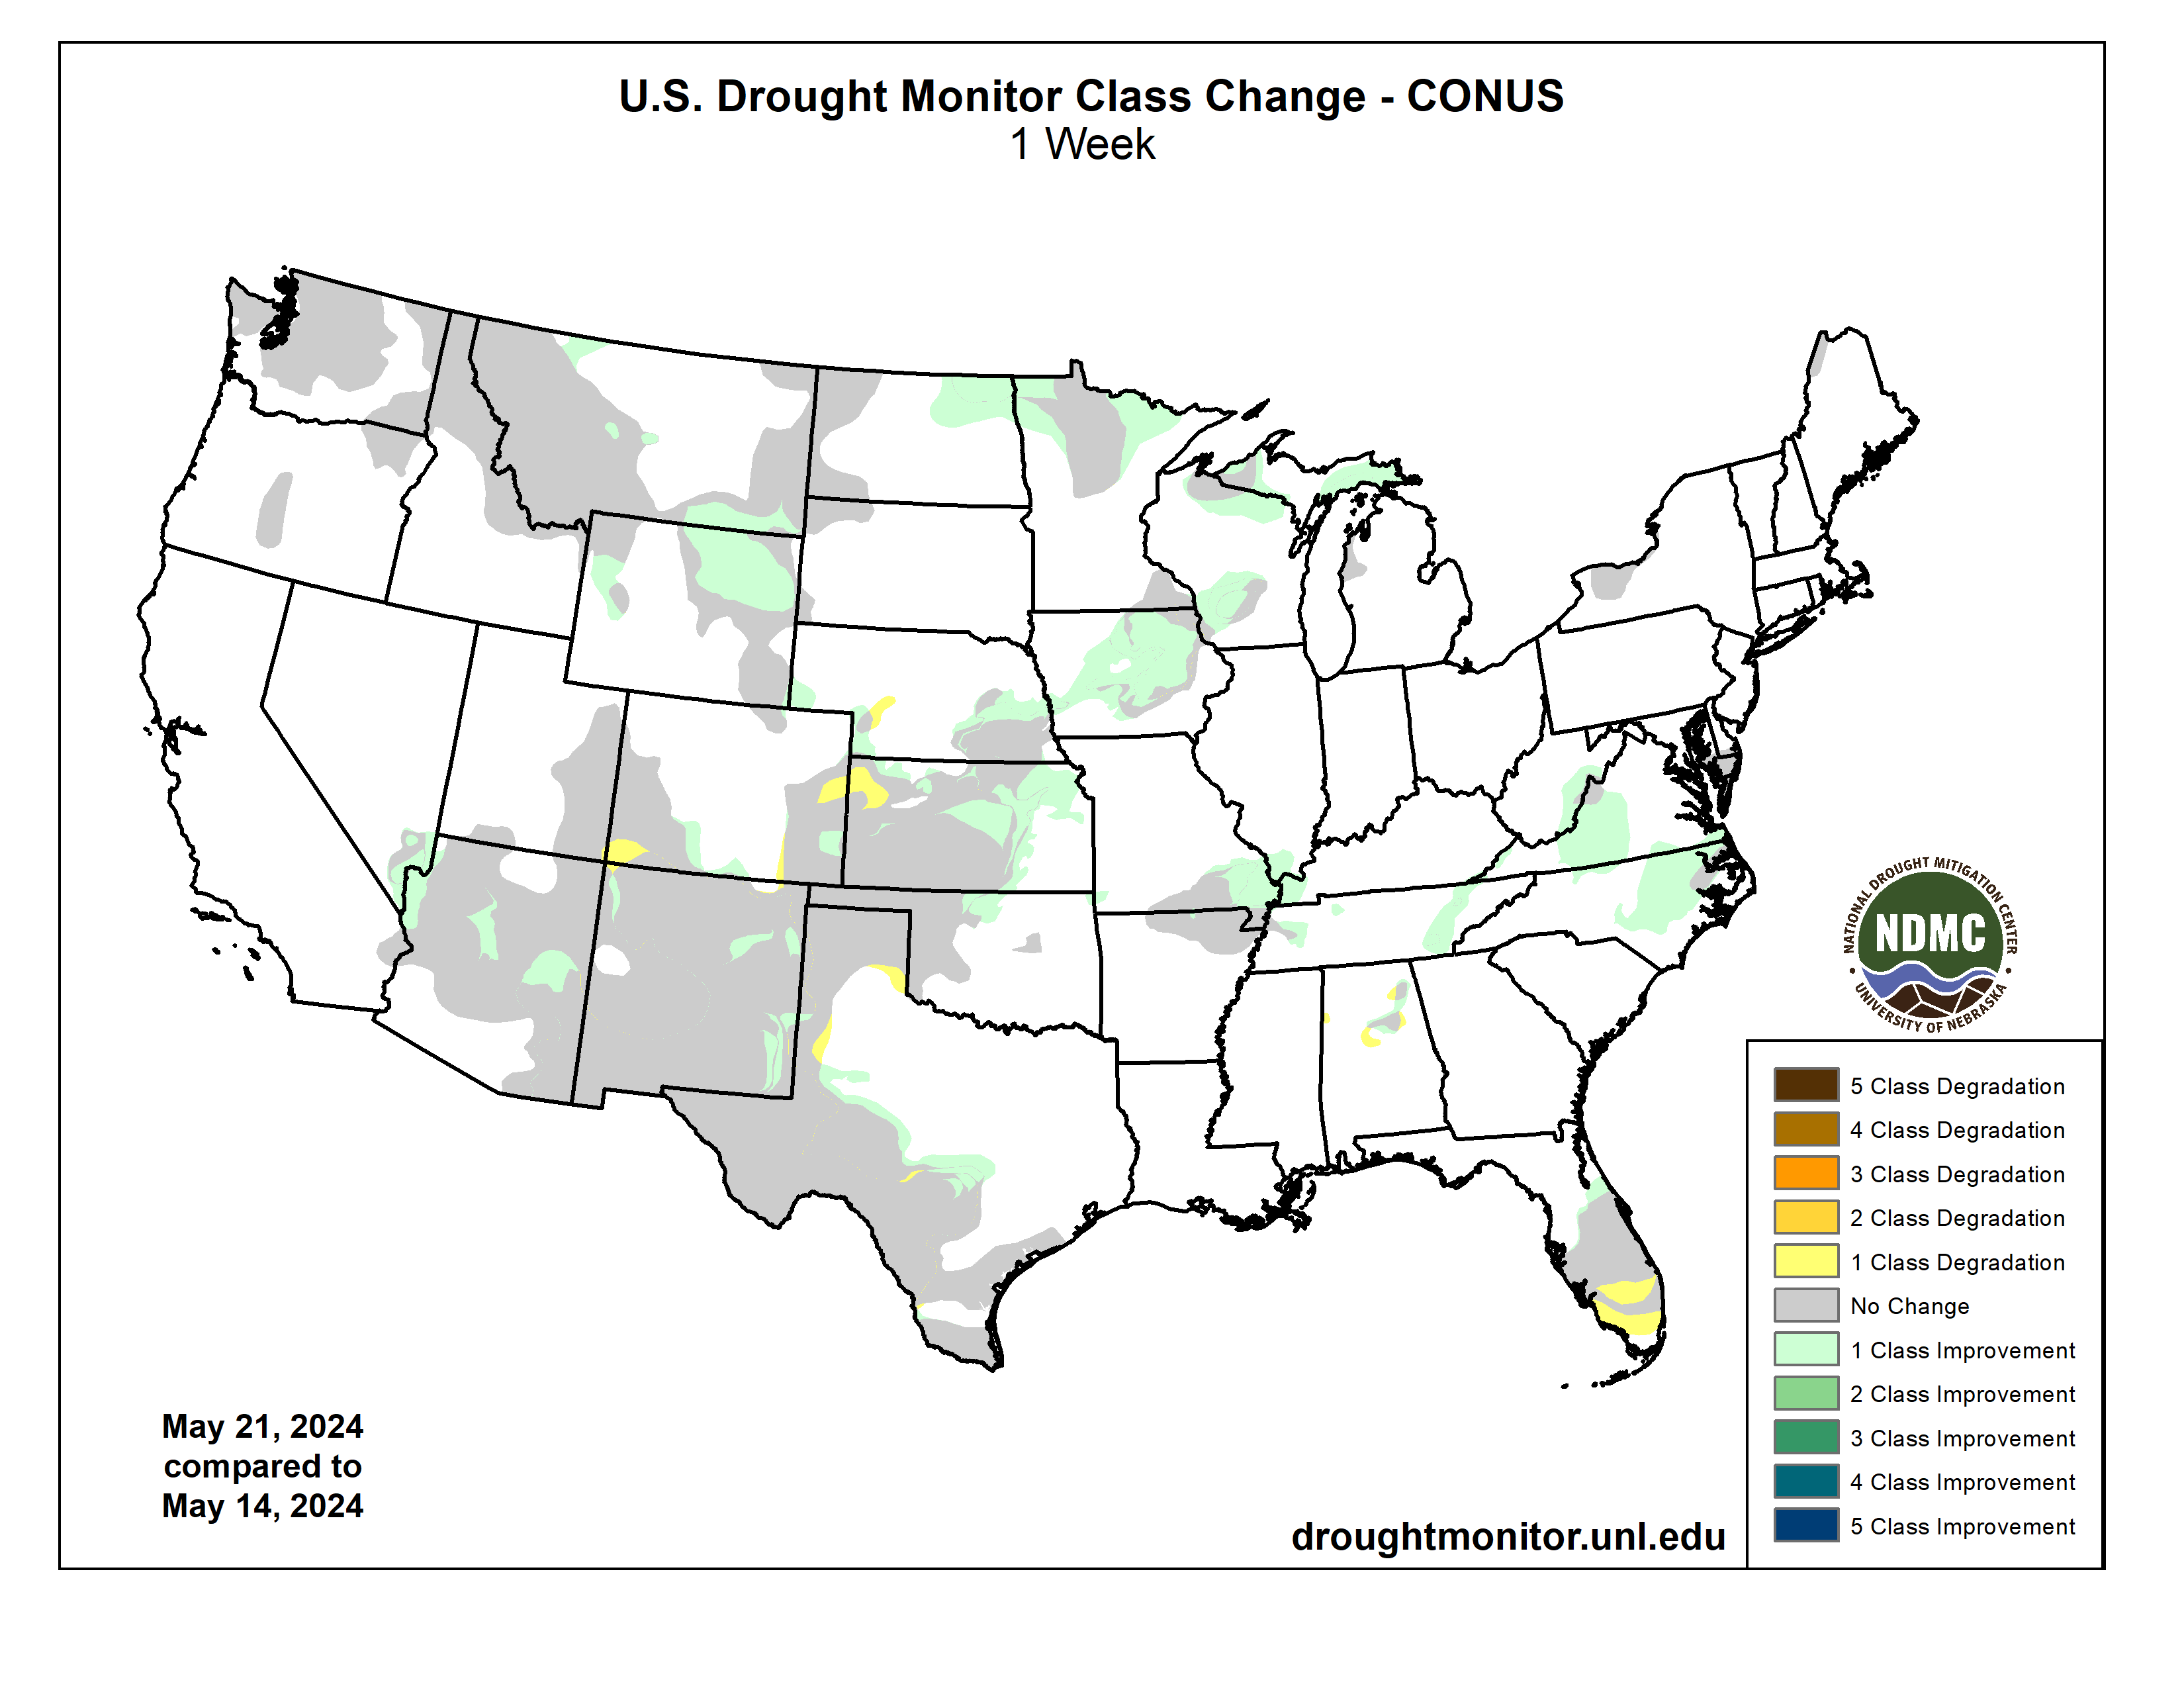
Following a stormy pattern with frequent periods of heavy precipitation and severe weather outbreaks, major drought improvement occurred this spring across the Great Plains and Mississippi Valley. Recent heavy precipitation from May 28 to June 3 resulted in additional improvements to parts of the central and southern Great Plains. A dry start to the thunderstorm season and above-normal temperatures continued to result in drought expansion and intensification across the southern half of the Florida Peninsula. Anomalously heavy precipitation for late May into the beginning of June led to drought improvement across parts of Washington, northern Idaho, and western Montana. Alaska and Puerto Rico remain drought-free, while drought of varying intensity persists for parts of Maui and the Big Island of Hawaii…
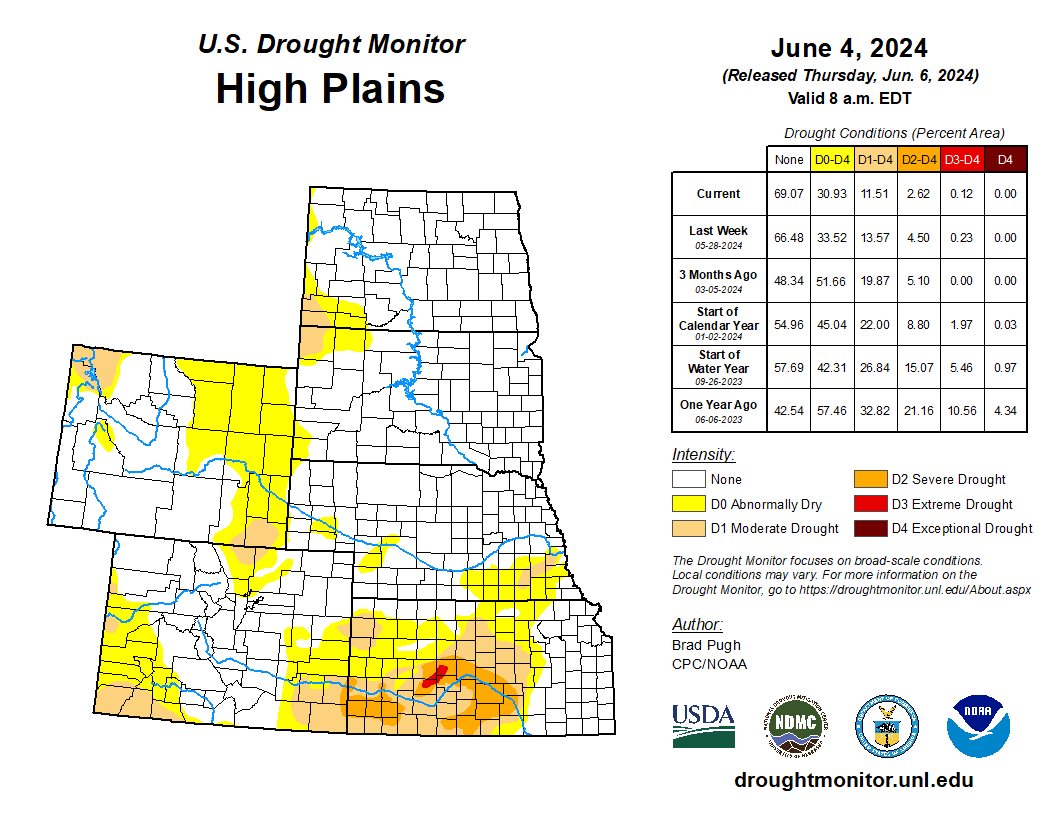
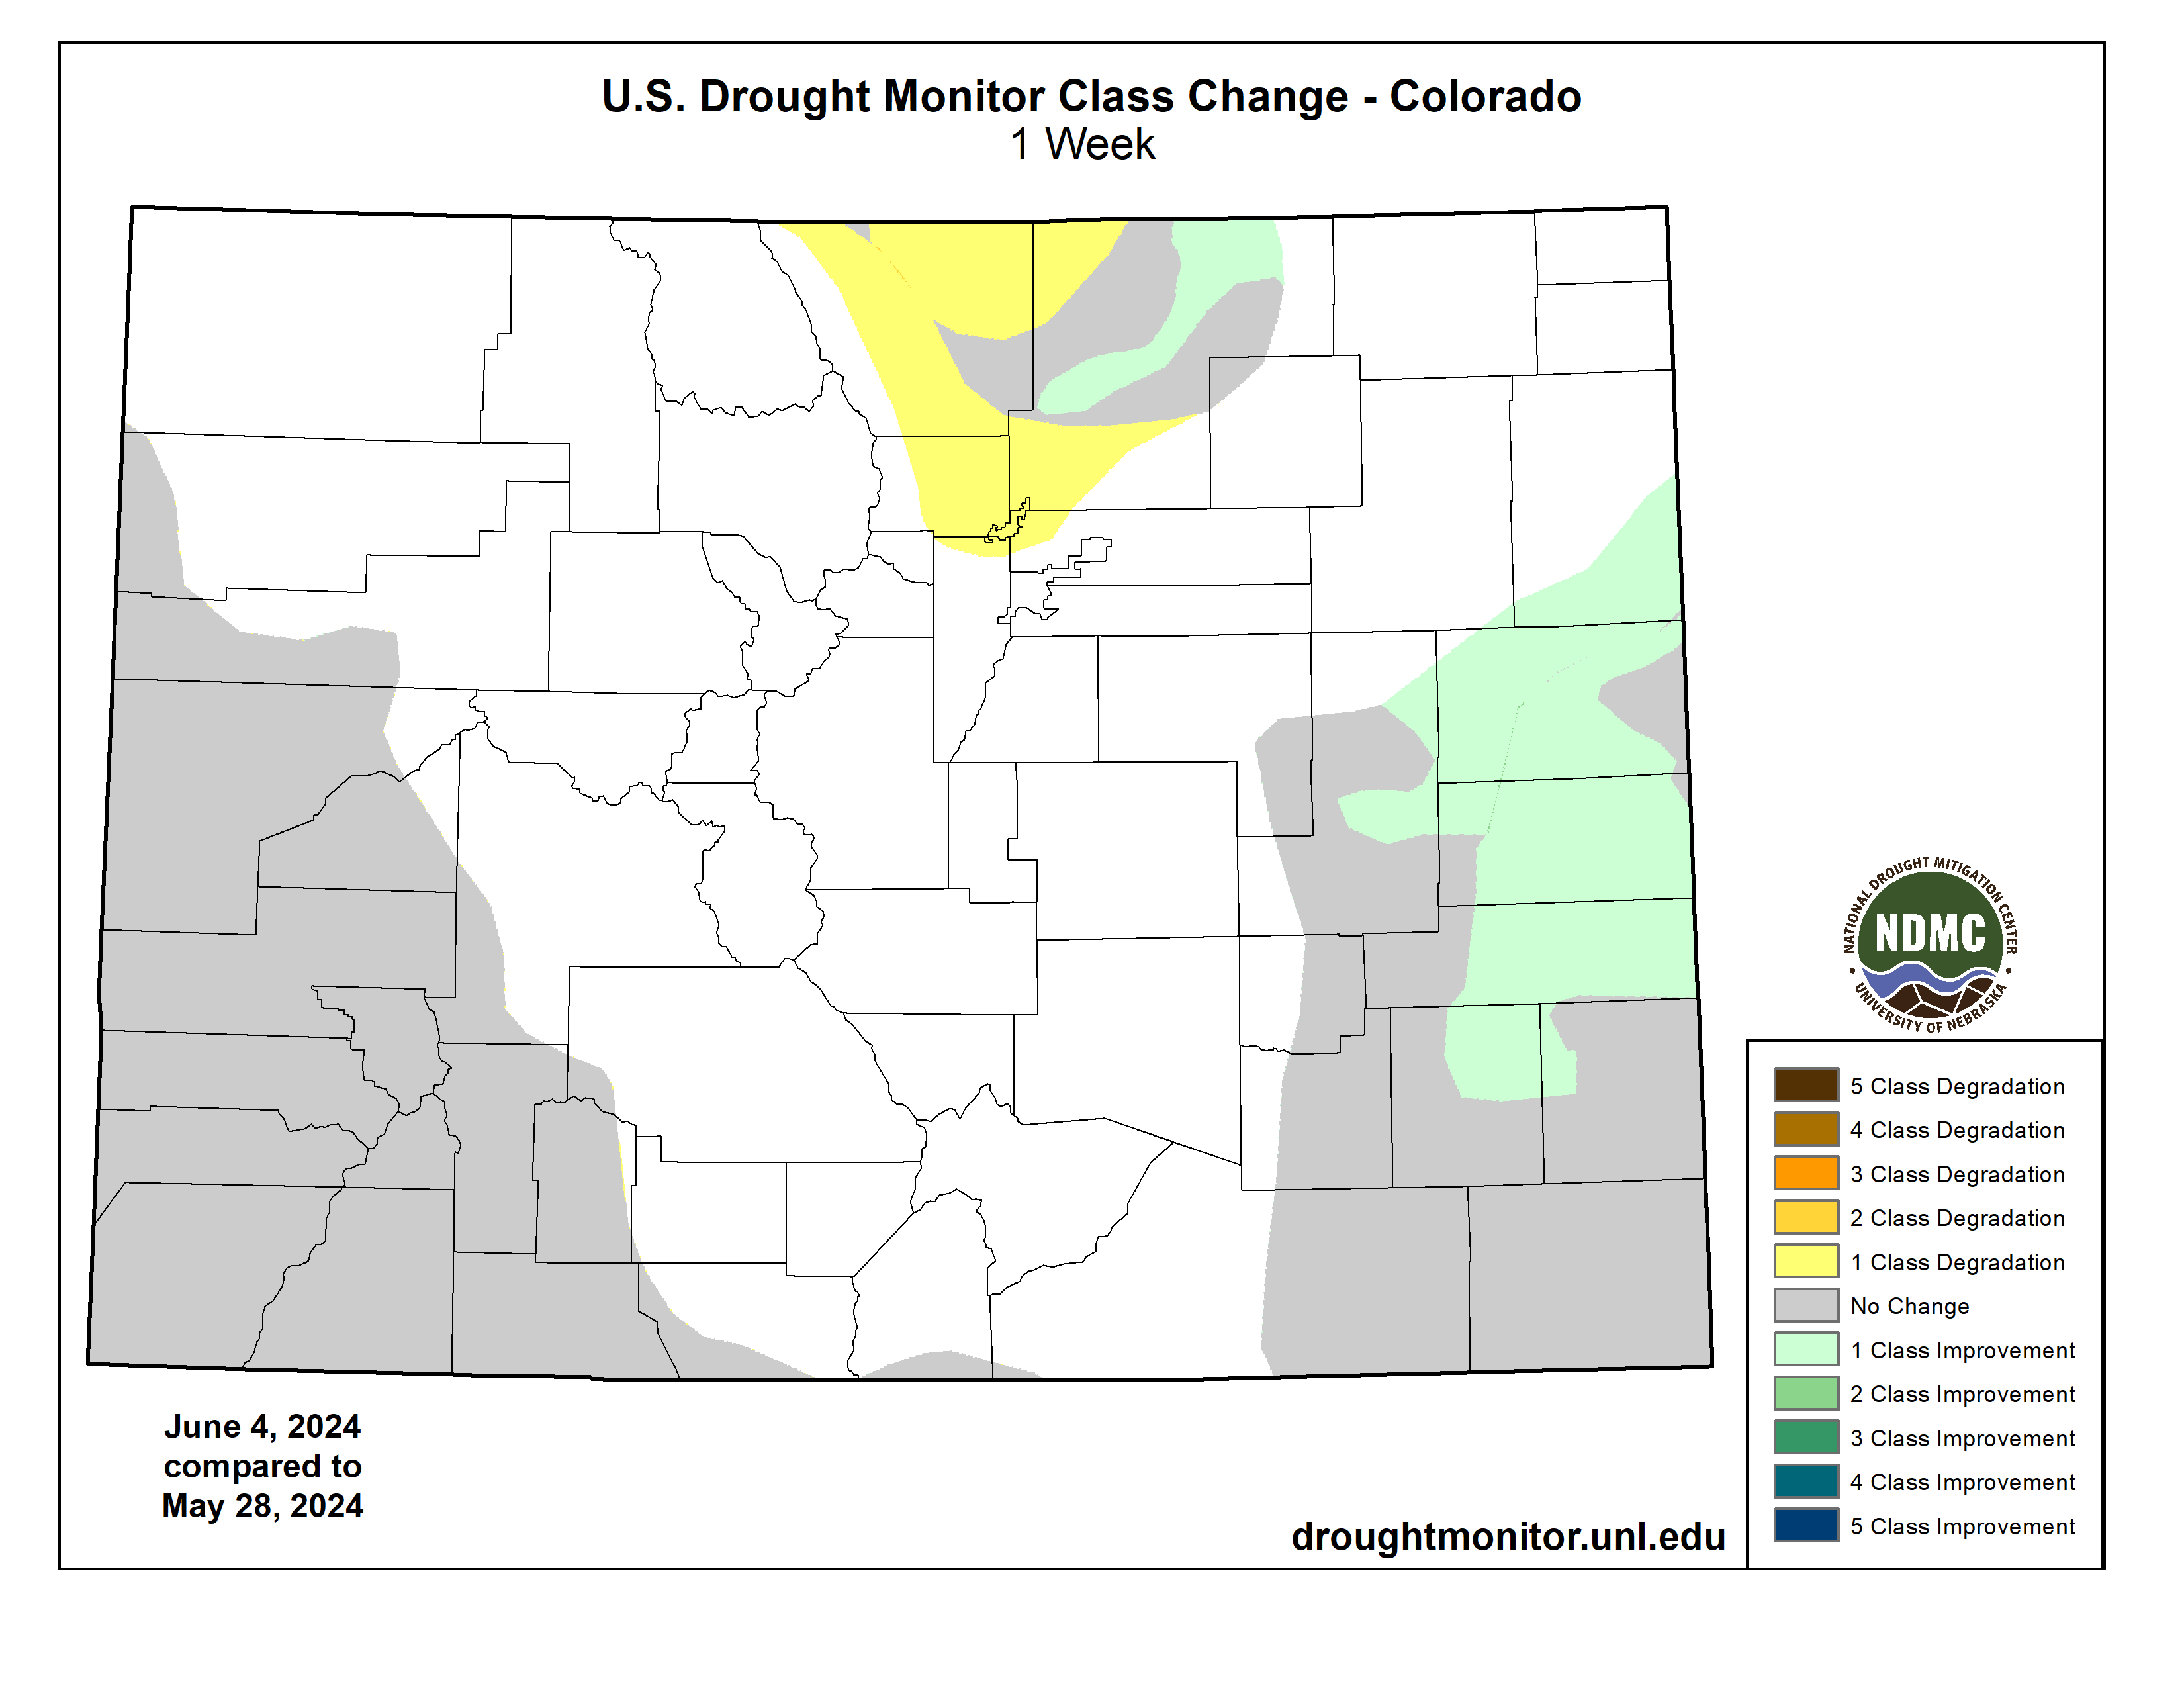
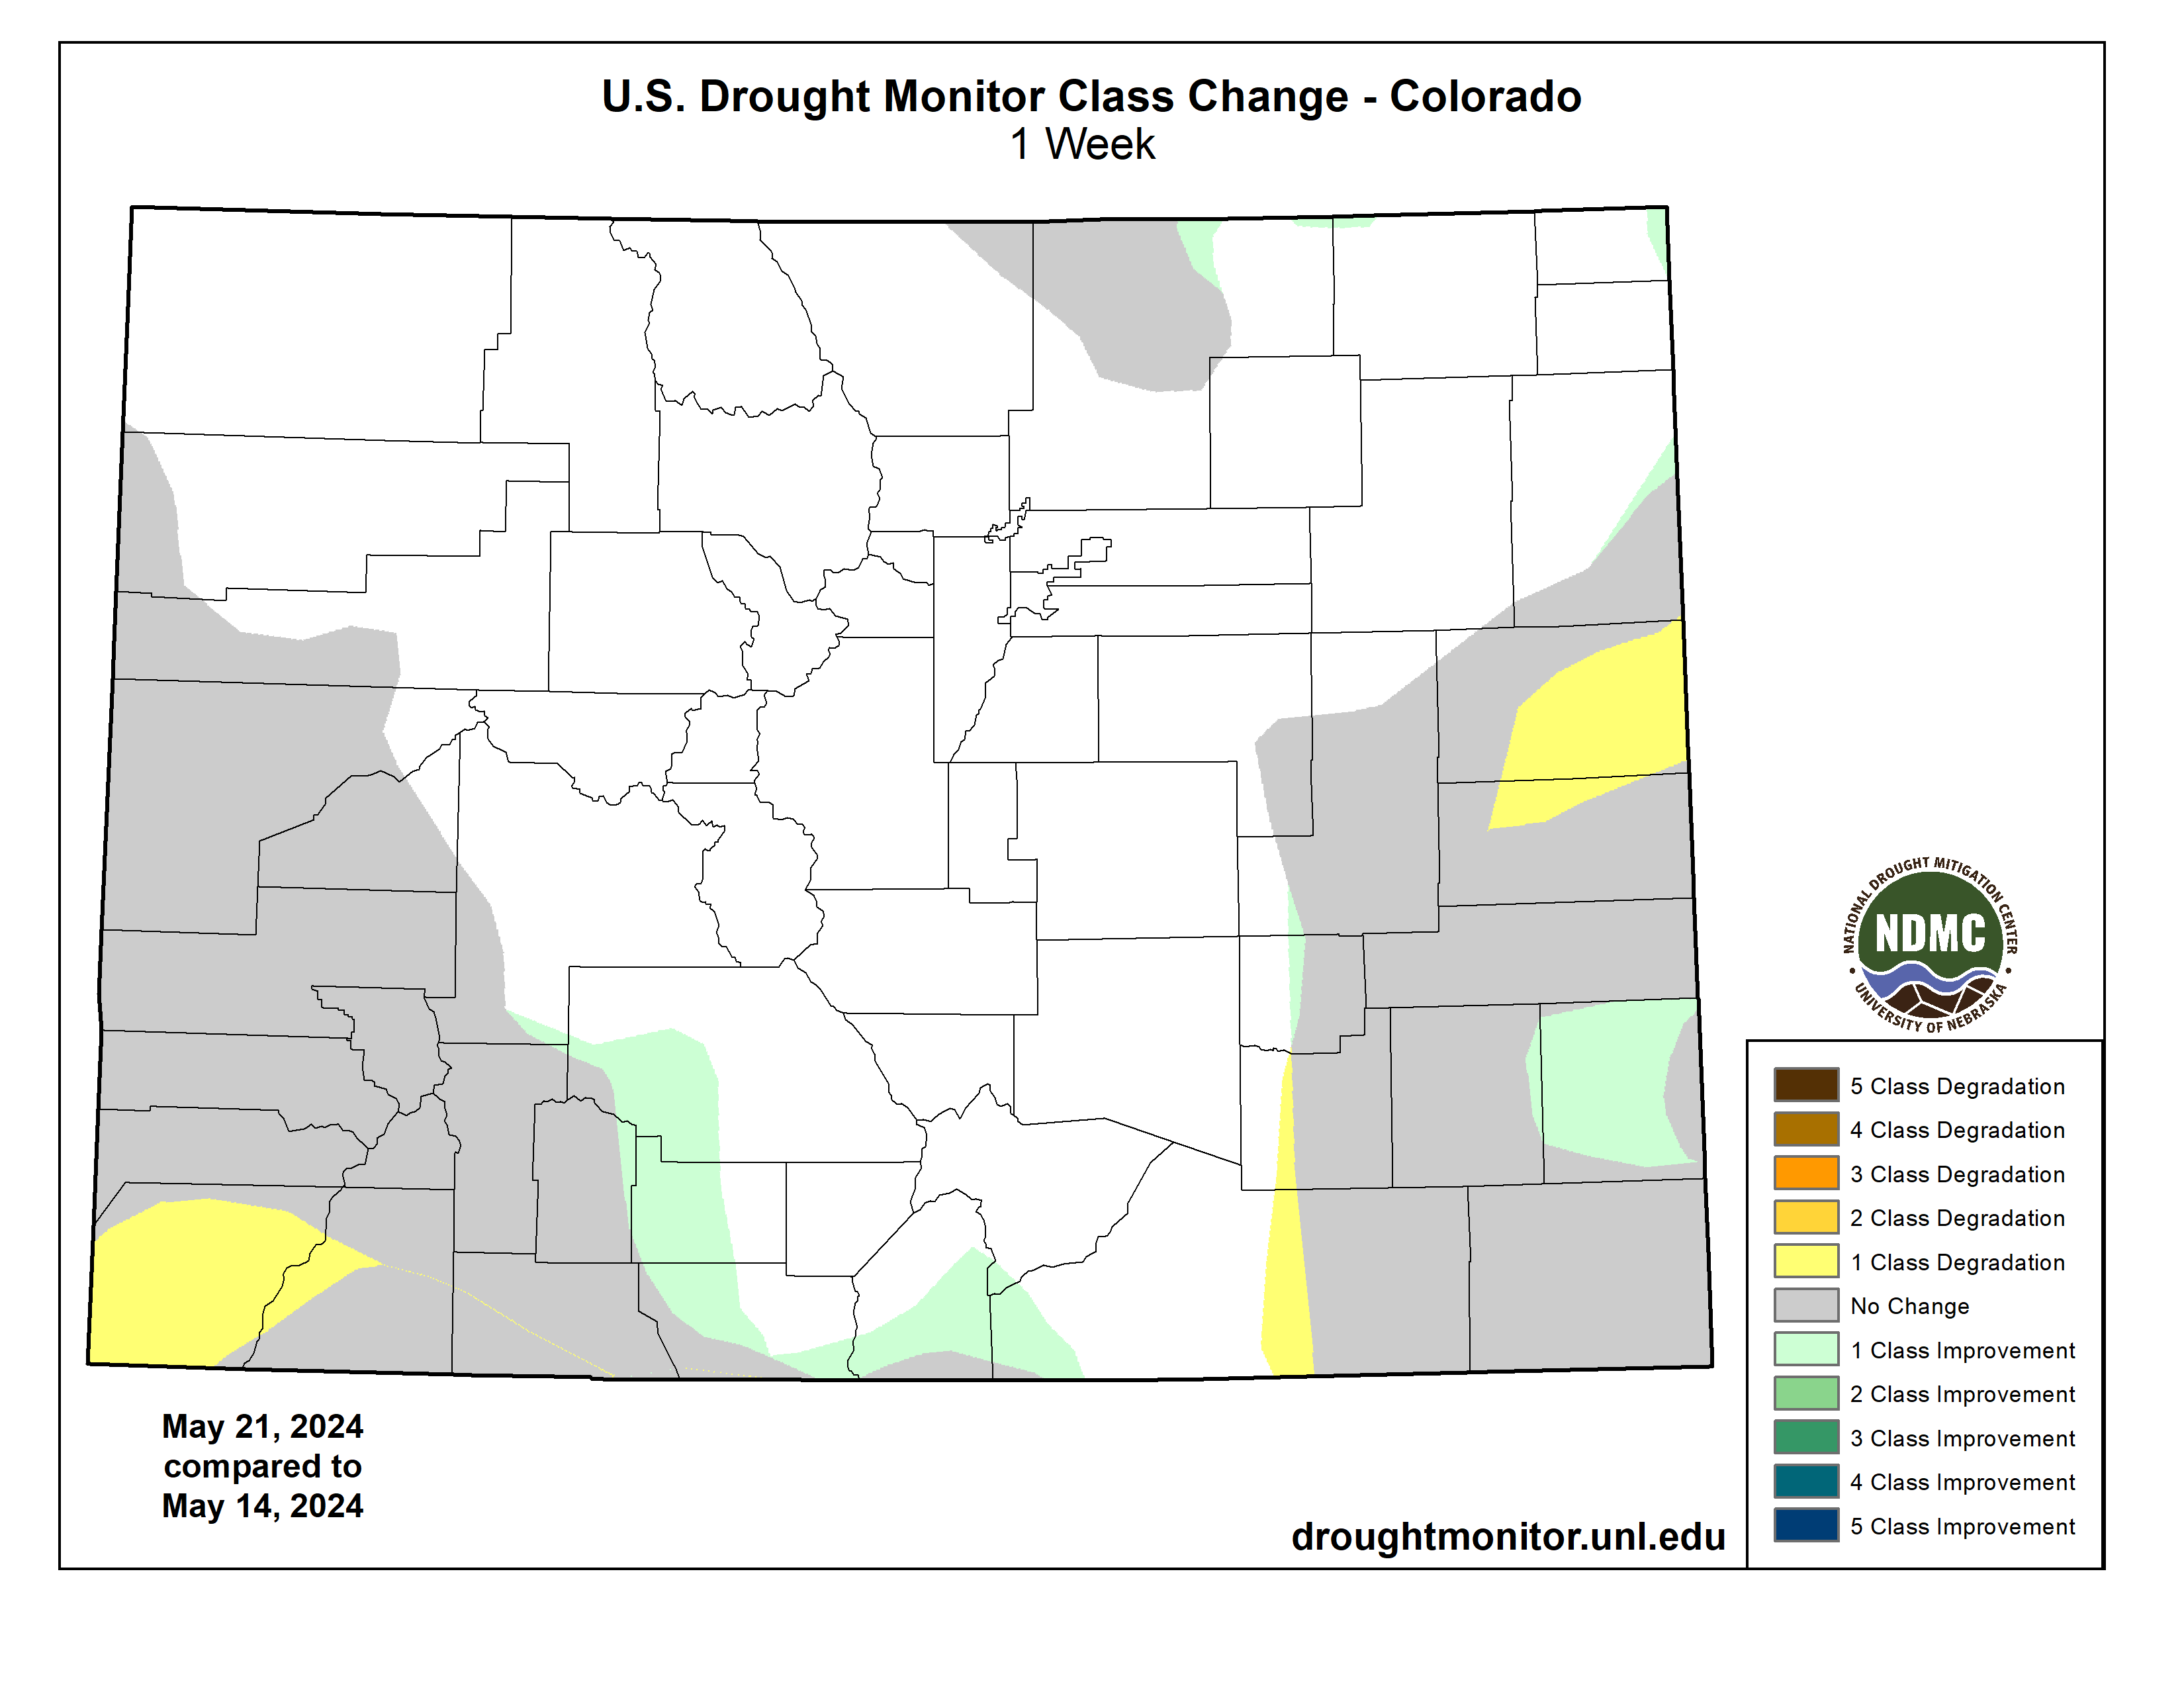
Widespread heavy precipitation (1 to 3 inches, locally more) resulted in a 1-category improvement to parts of Kansas, eastern Colorado, and southeastern Nebraska. A small area of long-term D1 was maintained for southeastern Nebraska that received less than 1 inch of precipitation this past week and a long-term drought signal continues. Based on neutral or wet soil moisture percentiles and NDMC drought blends, a 1-category improvement was made to northwestern North Dakota where more than 1 inch of precipitation occurred this past week. 30 to 60-day SPI and soil moisture indicators supported an expansion of abnormal dryness (D0) and moderate drought (D1) for northern Colorado and southeastern Wyoming…
Colorado Drought Monitor one week change map ending June 4, 2024.
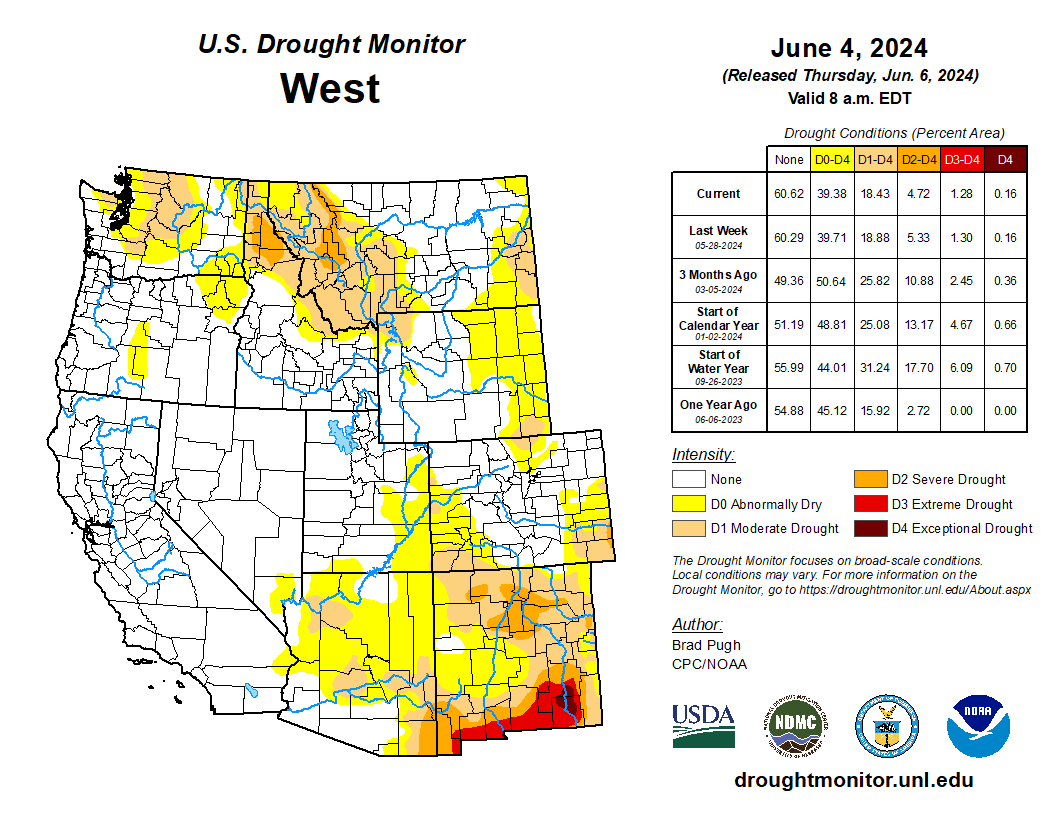
The climatology becomes much drier during May through the beginning of June across California, the Great Basin, and Southwest. There was little to no change in Dx coverage throughout these areas. Heavy precipitation (1.5 inches or more) this past week supported a 1-category improvement to parts of northeastern New Mexico. Recent precipitation with a relatively cool late spring and SPIs at multiple time scales resulted in a 1-category improvement to western Montana and adjacent areas of northern Idaho. Unusually heavy precipitation (locally more than 3 inches) for the late spring led to a decrease in abnormal dryness (D0) and moderate drought (D1) coverage across parts of Washington. However, much of the existing moderate drought area of north-central Washington remained unchanged with precipitation averaging less than 50 percent of normal since October 1, 2023…
Widespread heavy precipitation (2 to 5 inches, locally more) this past week generally occurred outside of existing Dx areas of the South region. However, the heavy precipitation did overspread a few of the Dx areas. Heavy precipitation along with considerations of NDMC drought blends supported a 1-category improvement to parts of northwestern Oklahoma, Texas Panhandle, and south-central Texas. Also, a slight reduction in abnormal dryness (D0) was warranted for northeastern Arkansas and western Tennessee. 30 to 60-day SPEI and soil moisture indicators led to a 1-category degradation to parts of southern Texas and the middle Rio Grande Valley. Maximum temperatures have averaged 4 to 8 degrees F above normal during the past two weeks across the middle to lower Rio Grande Valley which is likely drying out topsoil and a factor in worsening drought conditions…
Looking Ahead
During the next five days (June 6-10, 2024), multiple cold fronts are forecast to progress across the eastern and central contiguous U.S. The heaviest precipitation (more than 1 inch) is forecast for the Northeast, Tennessee Valley, and Ozarks region. Locally heavy rainfall may accompany thunderstorms across the central to southern Great Plains. Dry weather, typical for this time of year, is forecast for the Southwest, California, and the Pacific Northwest. A heat wave will affect the Southwest and Central Valley of California during early June.
The Climate Prediction Center’s 6-10 day outlook (valid June 11-15, 2024) favors above-normal temperatures across most of the West, Great Plains, New England, and Florida. Below-normal temperatures are most likely for the Ohio and Tennessee Valleys and central to southern Appalachians. Below-normal precipitation probabilities are slightly elevated for much of the Corn Belt, Mississippi Valley, and Pacific Northwest. Above-normal precipitation is favored for the central to southern Rockies and high Plains along with the coastal Southeast and Florida.
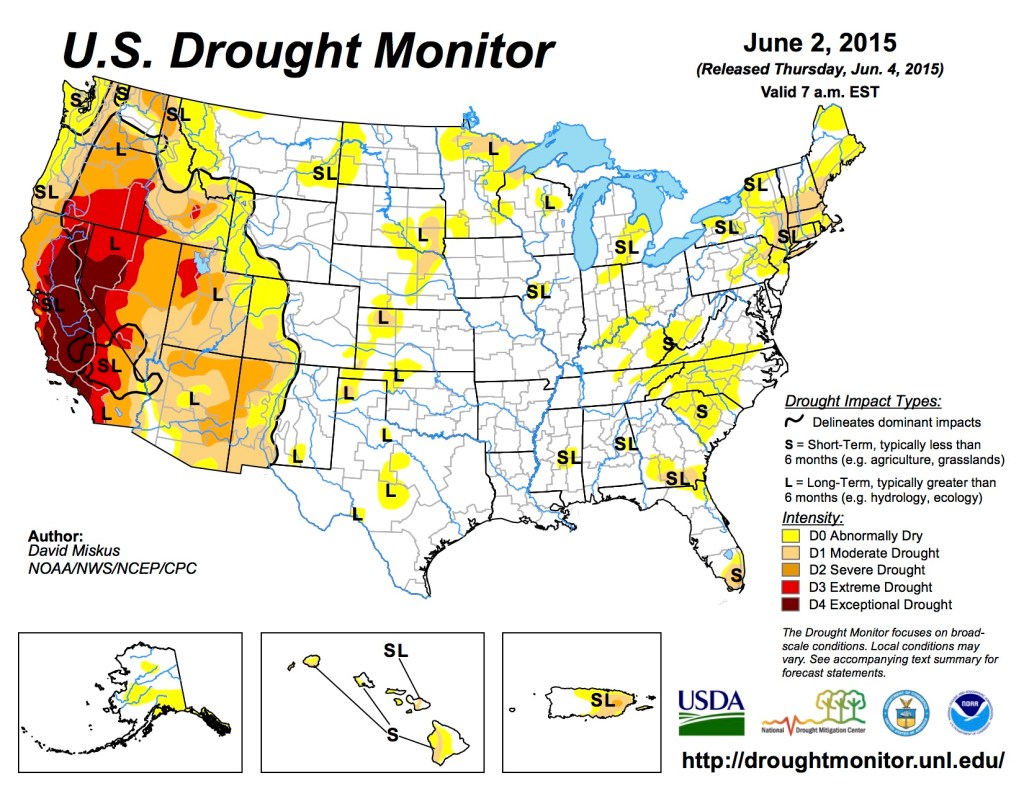
US Drought Monitor one week change map ending June 4, 2024.
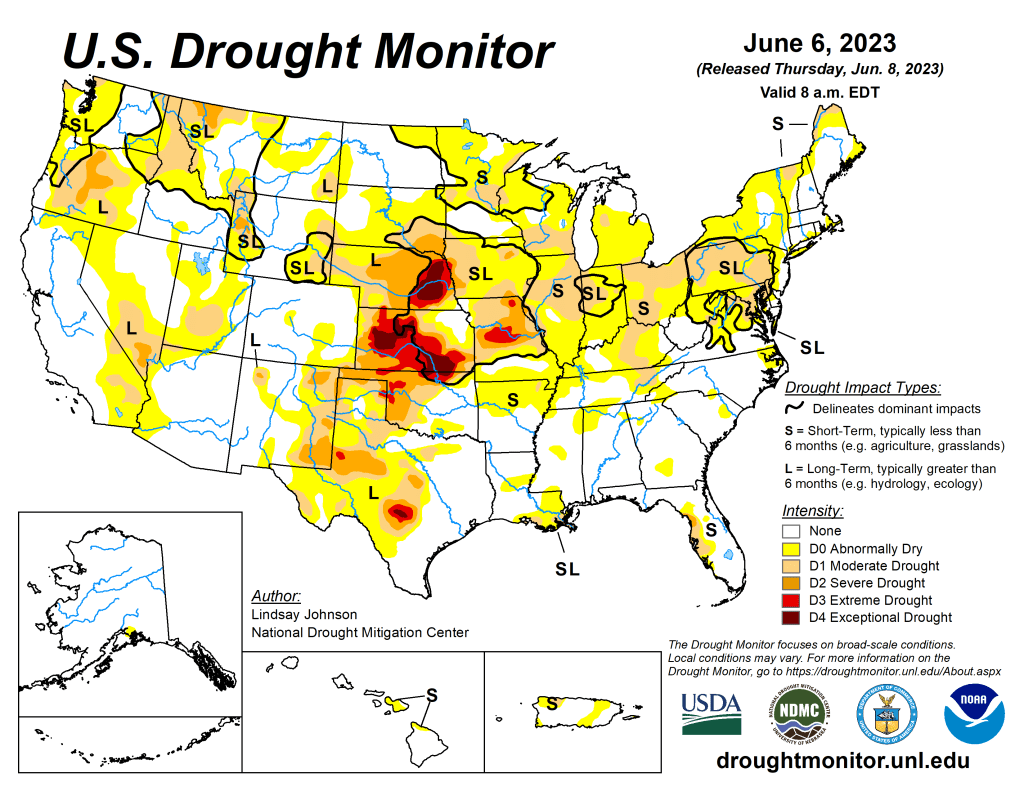
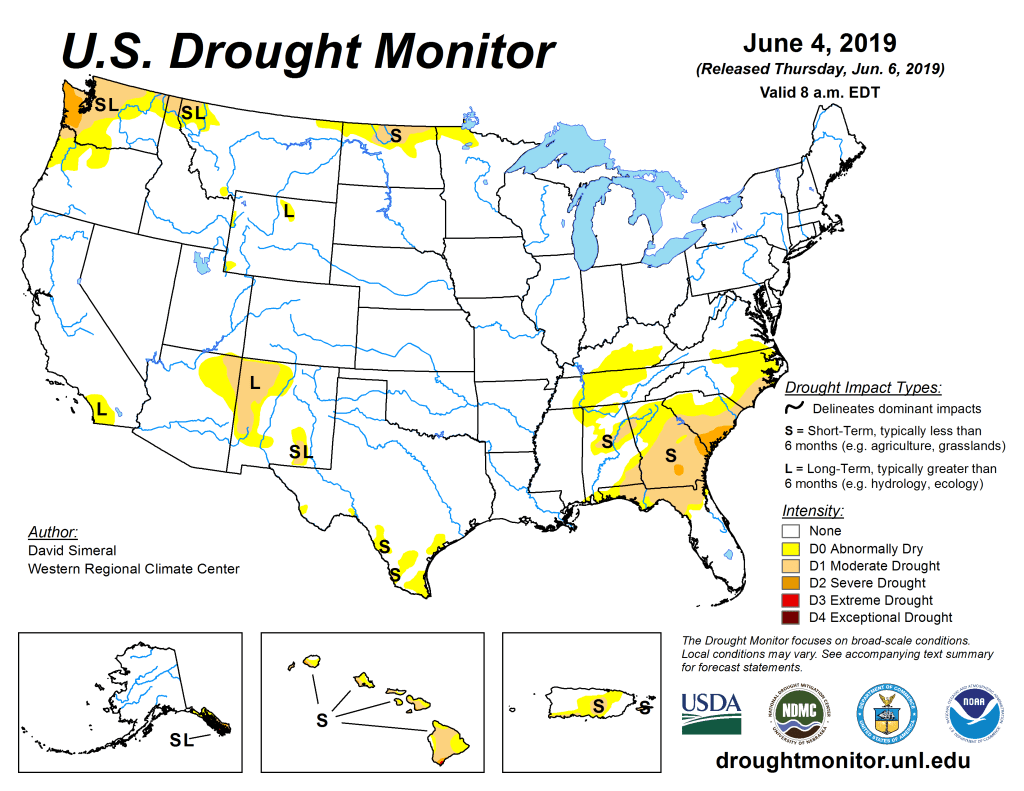
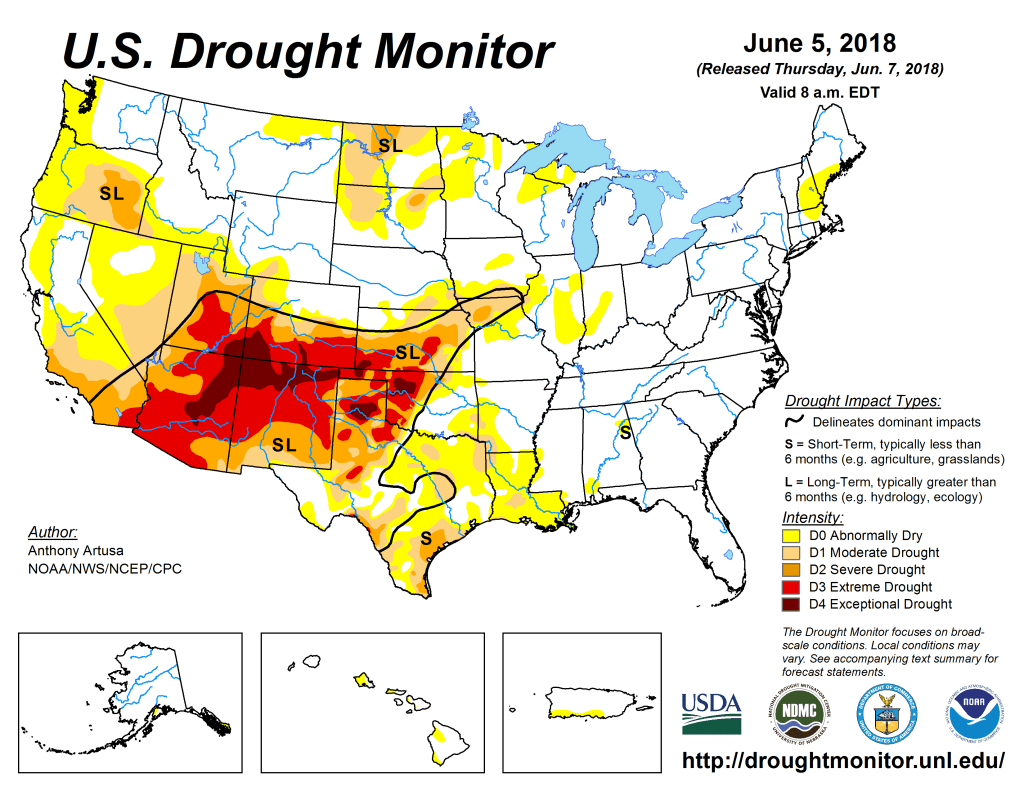
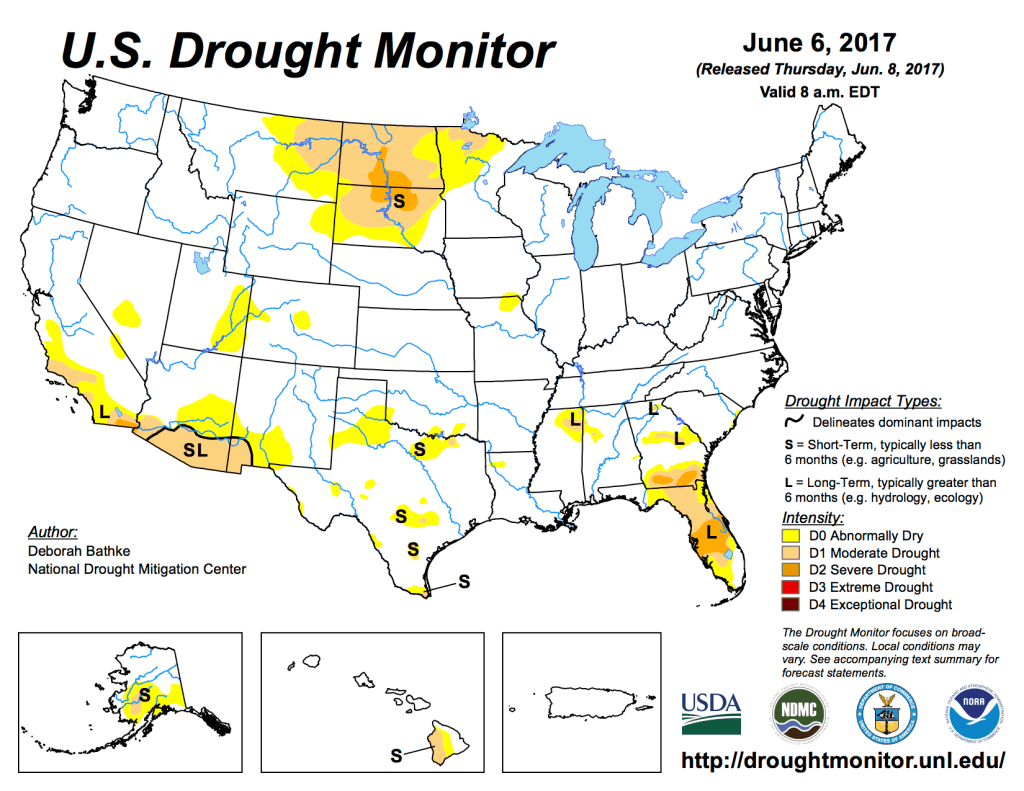
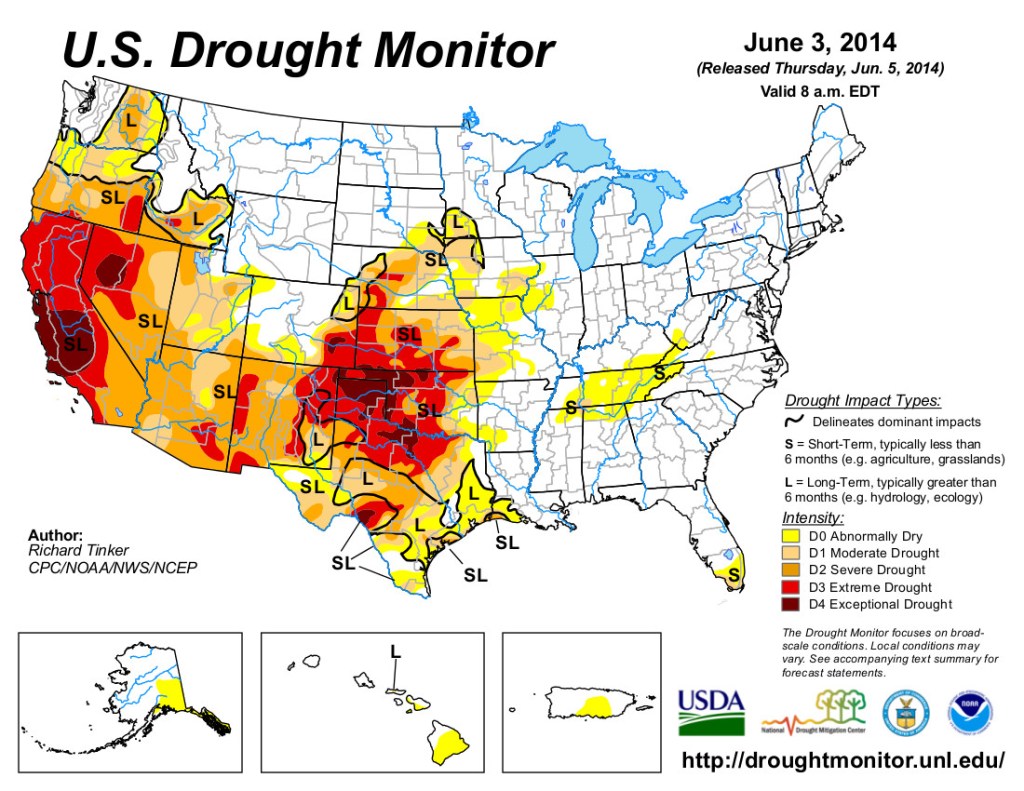
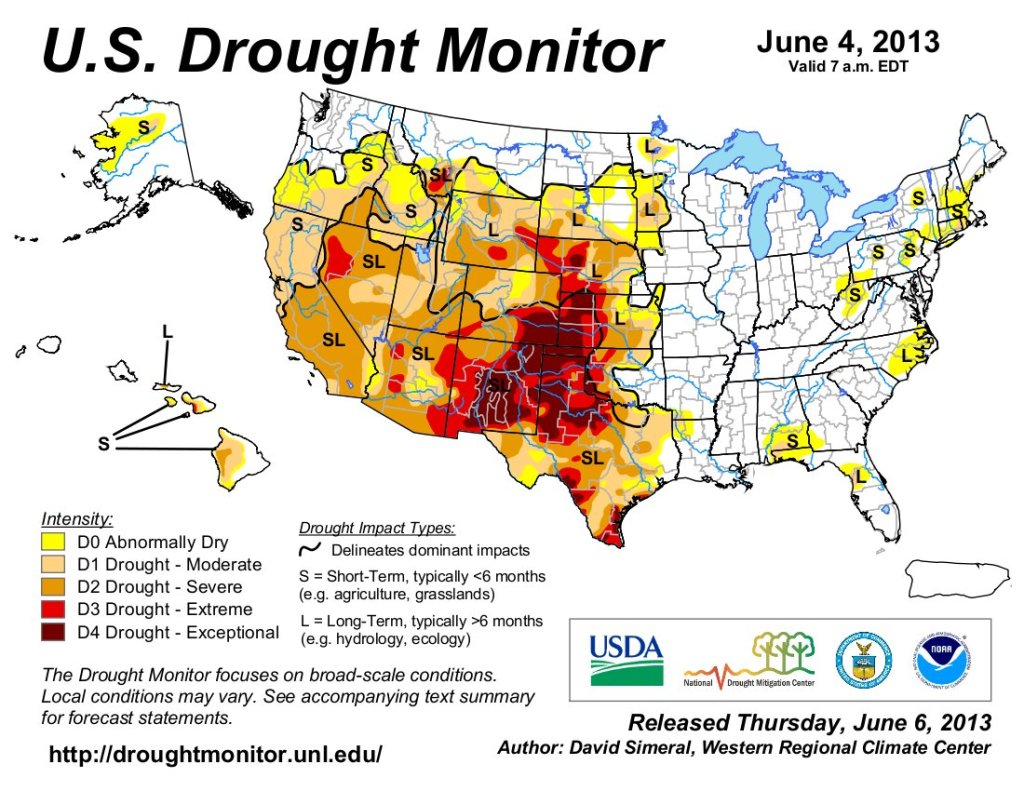
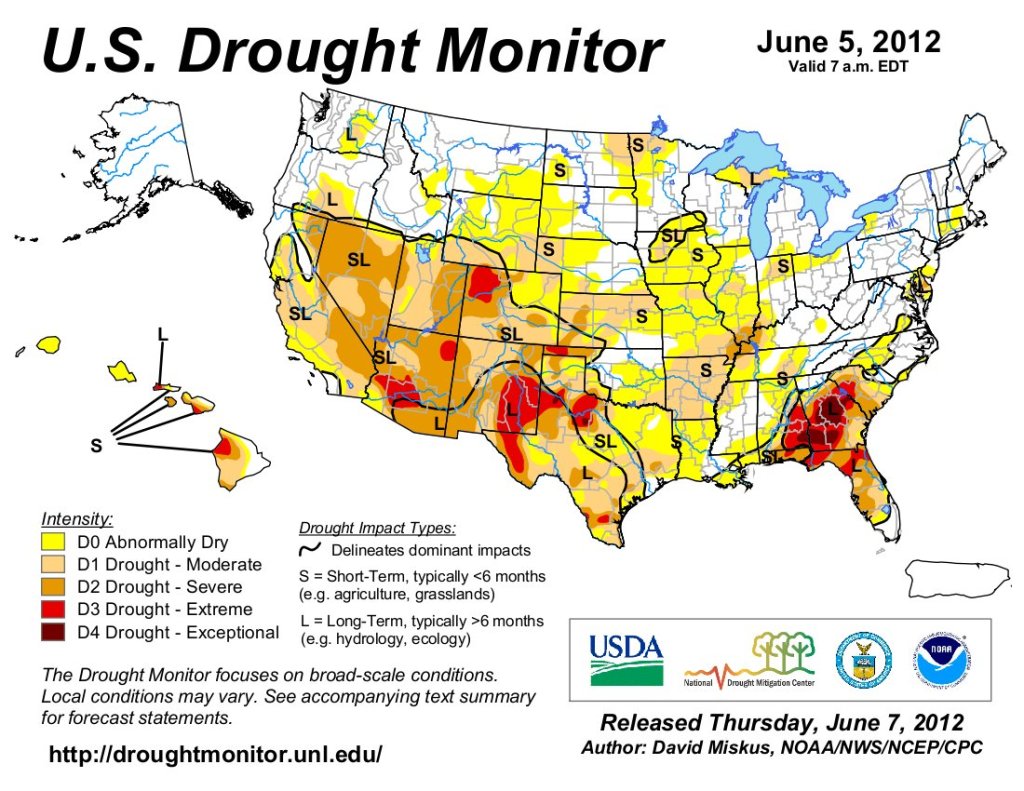
Just for grins here’s a slideshow of early June US Drought Monitor maps for the past few years.
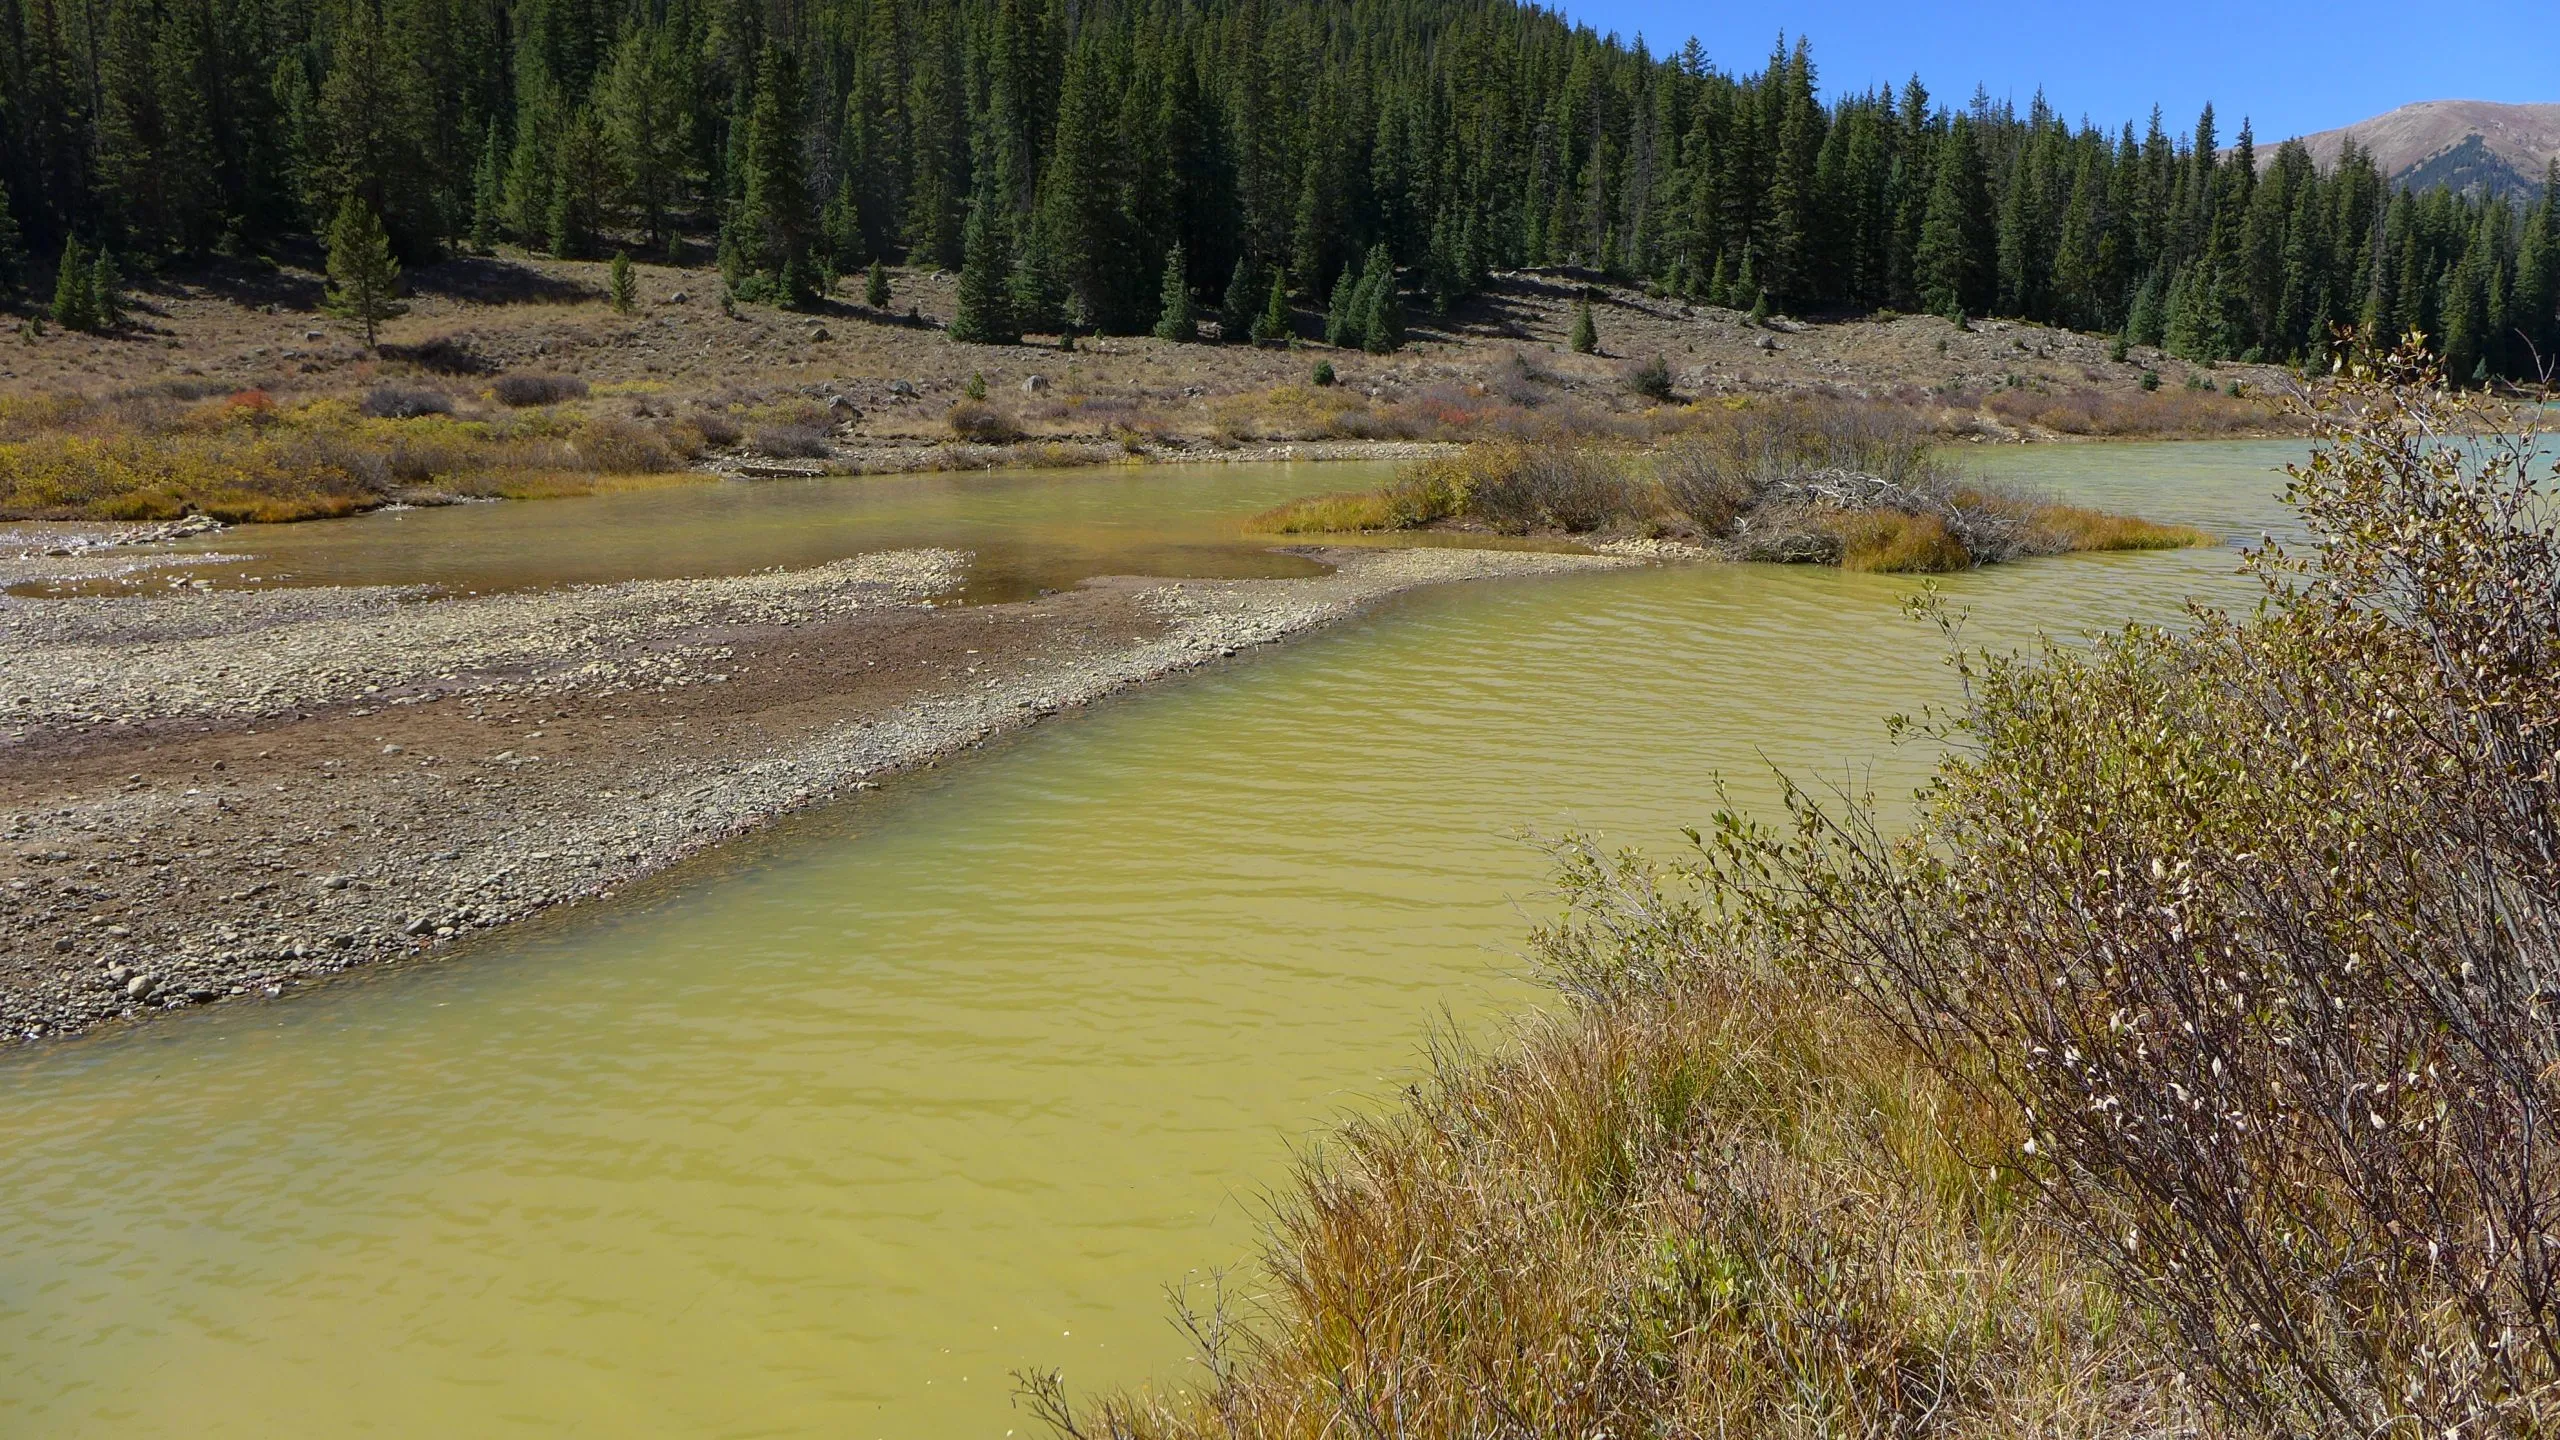
Colorado River “Beginnings”. Photo: Brent Gardner-Smith/Aspen Journalism
Here is the release from the Department of Interior (Sally Tucker):
June 6, 2024
Investments from the Inflation Reduction Act will build a more resilient western landscape to help local, state, and Tribal communities tackle the climate crisis and enhance water security
WASHINGTON – The Department of the Interior today announced an initial $700 million investment from President Biden’s Investing in America agenda for long-term water conservation projects across the Lower Colorado River Basin. This investment – which has the potential to save more than 700,000 acre-feet of water in Lake Mead – will fund innovative projects like water distribution structures, advanced metering infrastructure, farm efficiency improvements, canal lining, turf removal, groundwater banking, desalination, recycling water and water purification. These projects are critical for enhancing the long-term drought and climate resilience of the Colorado River’s Lower Basin.
The Colorado River Basin provides water for more than 40 million people, fuels hydropower resources in seven U.S. states, is a crucial resource for 30 Tribal Nations and two states in Mexico, and supports 5.5 million acres of agriculture and agricultural communities across the West. Despite improved hydrology in recent months, a historic 23-year drought has led to record low water levels at Lake Powell and Lake Mead. The Biden-Harris administration has led a comprehensive effort to address the ongoing drought and to prevent the Colorado River System’s reservoirs from falling to critically low elevations threatening water deliveries and power production in the region.
“The Biden-Harris administration is committed to making western communities more resilient to the impacts of climate change,” said Secretary Deb Haaland. “Building on our significant efforts to protect the Colorado River System, we are continuing to make smart investments through the President’s Investing in America agenda to strengthen the stability and sustainability of the Colorado River System and support the 40 million people who rely on this basin now and into the future.”
The funding announced today is for “Bucket 2” projects being funded by the Lower Colorado Basin System Conservation and Efficiency Program, which was established through the Inflation Reduction Act, which represents the largest investment in tackling climate change in history. The program uses historic investments to address the drought crisis with prompt and responsive actions by providing resources for short-term water management and long-term conservation efforts in the Colorado River Basin.
“We are already seeing returns on the historic investments made by the Biden-Harris administration in the Lower Colorado River Basin, with commitments to save more than 1.7 million acre-feet of water in the basin through 2026 facilitated largely through the Bucket 1 program,” said Bureau of Reclamation Commissioner Camille Calimlim Touton. “These Bucket 2 projects will build long-term resiliency in the basin by investing in system efficiency projects across all sectors.”
Reclamation is working with Tribal, state and individual water entitlement holders on proposals for projects located in Arizona, Nevada and Southern California to utilize this funding. Selected projects and details of agreements will be announced on a rolling basis in coordination with basin partners.
President Biden’s Investing in America agenda represents the largest investment in climate resilience in the nation’s history and is providing much-needed resources to enhance Western communities’ resilience to drought and climate change. Through the Bipartisan Infrastructure Law, Reclamation is investing a total of $8.3 billion over five years for water infrastructure projects, including rural water, water storage, conservation and conveyance, nature-based solutions, dam safety, water purification and reuse, and desalination. The Inflation Reduction Act provides an additional $4.6 billion to strengthen drought resilience across the West.
ALAMOSA, COLORADO – Meandering toward Boulder for this week’s Getches-Wilkinson Center Colorado River conference, I stopped this evening in Alamosa, Colorado, in the San Luis Valley. I love the drive up the back way, through the San Luis Valley and into the heart of the Rockies, and I split it up into a couple of days this year to get some bike riding in.
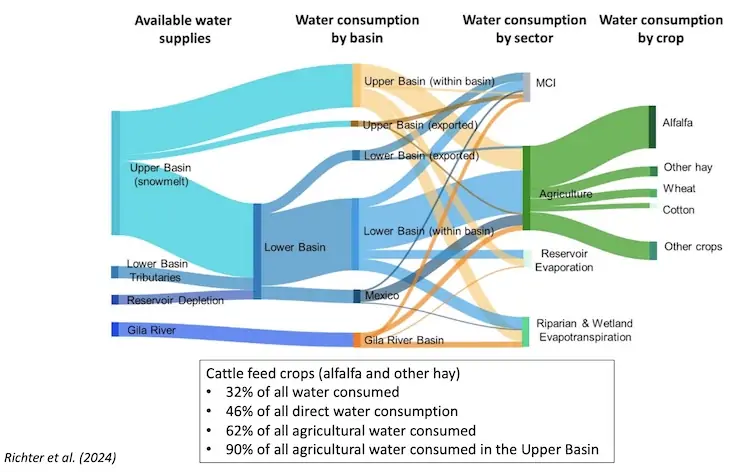
Long western drives have always been a part of my process, quality thinking time, and the San Luis Valley is a great writing prompt. It’s broad, high, pan flat, and a really good place to grow alfalfa and potatoes. (There’s a flatbed of alfalfa in the Walmart parking lot next to my motel, headed for a dairy somewhere – future burgers and pizza cheese.)
When the railroad and the Mormons arrived in the 1800s, they starting growing a lot of stuff to export, reducing the flow in the Rio Grande which, through a series of knock-on effects, led us in central New Mexico to import Colorado River water via the San Juan-Chama Project, which is why I’m headed to Boulder. For want of a nail….
FOUNDATIONS OF THE LAW OF THE RIVER: SHAKY
It’s the San Juan-Chama linkage – critical to Albuquerque’s water supply – that got me started working on Colorado River issues nearly 20 years ago, which led to a couple of books (Water is For Fighting Over, Science be Dammed) a growing list of academic publications, and this crazy blog, which I’m happy to report Emily Guerin called “influential”! The second book was a collaboration with Eric Kuhn, and during the years working at it we more than once met up at the Holiday Inn Express in Alamosa, midway between his home in Glenwood Springs and mine in Albuquerque, holed up in the breakfast area working through chapters. Is it possible to have fond memories of a Holiday Inn Express breakfast area? I do.
The collaboration continues, joined by my Utton Center colleague Rin Tara, with a couple of new papers digging into the history of the development of the Upper Colorado River Compact and its implications for 21st century river management. A preprint of the first of the two papers, a deep dive into the negotiation history, went up over the weekend and I already blogged about it.
The world’s biggest solar plant has come online in China, capable of powering a small country with its annual capacity of more than 6 billion kilowatt hours. The facility in a desert region of the north-west province of Xinjiang covers 200,000 acres – roughly the same area as New York City. The 5GW complex, which was connected to China’s grid on Monday, is powerful enough to meet the electricity demands of a country the size of Luxembourg or Papua New Guinea.
China has led the world in solar power adoption, boosting its capacity in 2023 by more than 50 per cent. The new solar farm overtakes the Ningxia Teneggeli and Golmud Wutumeiren solar projects, which are both also in China, to become the largest in the world. A recent report by the International Energy Agency (IEA) described China’s drive towards renewables as “extraordinary”, with the country commissioning as much solar capacity last year as the entire world did in 2022.
One year ago, the Supreme Court issued its sweeping decision in the case Sackett v. EPA, which invalidated federal Clean Water Act protections for most streams and wetlands in the United States. Since then, the fight for clean water protections has been at the state level. This report outlines the state of clean water protections one year out from the Sackett decision and why federal protections for our critical waters is vital in the face of worsening climate change and other threats.
In the year since the Supreme Court ruling, two states passed or introduced legislation to create new permitting programs to fill the gap in federal protections and eight states passed or introduced stronger laws and policies to strengthen state protections. Two states passed legislation weakening state-level protections, while efforts to weaken state protections failed in four other states.
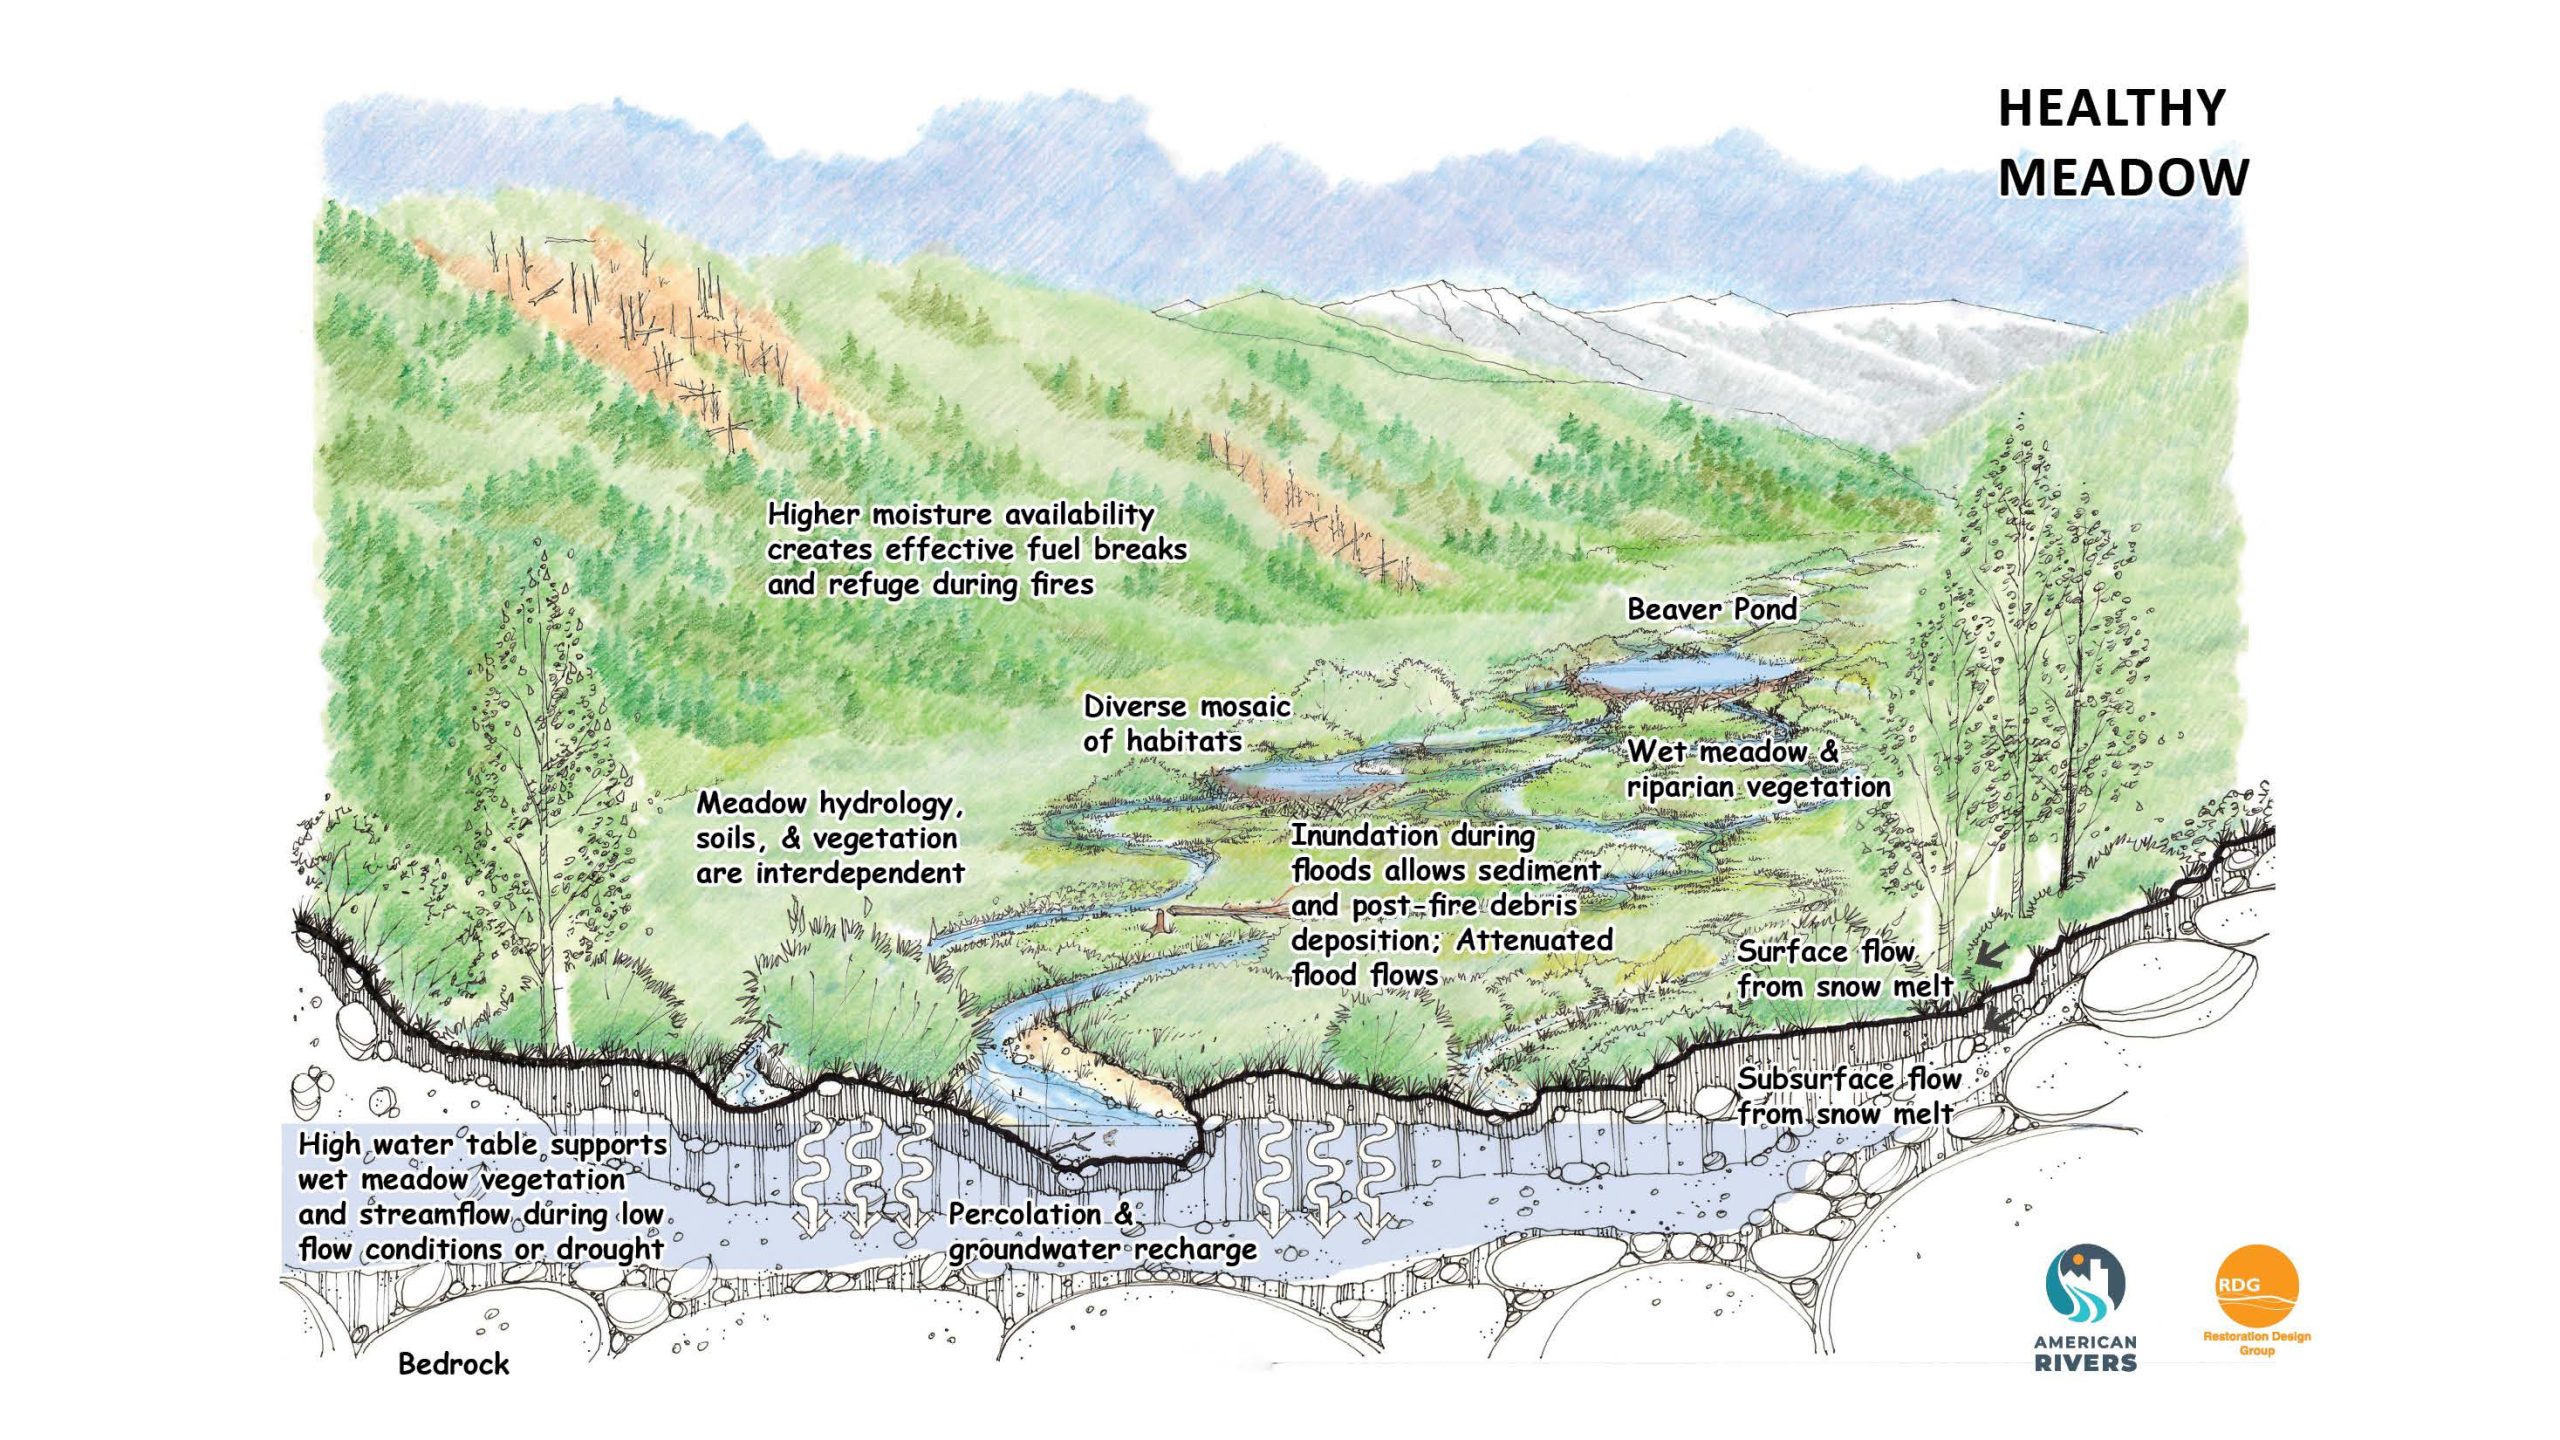
Healthy mountain meadows and wetlands are characteristic of healthy headwater systems and provide a variety of ecosystem services, or benefits that humans, wildlife, rivers and surrounding ecosystems rely on. The complex of wetlands and connected floodplains found in intact headwater systems can slow runoff and attenuate flood flows, creating better downstream conditions, trapping sediment to improve downstream water quality, and allowing groundwater recharge. These systems can also serve as a fire break and refuge during wildfire, can sequester carbon in the floodplain, and provide essential habitat for wildlife. Graphic by Restoration Design Group, courtesy of American Rivers
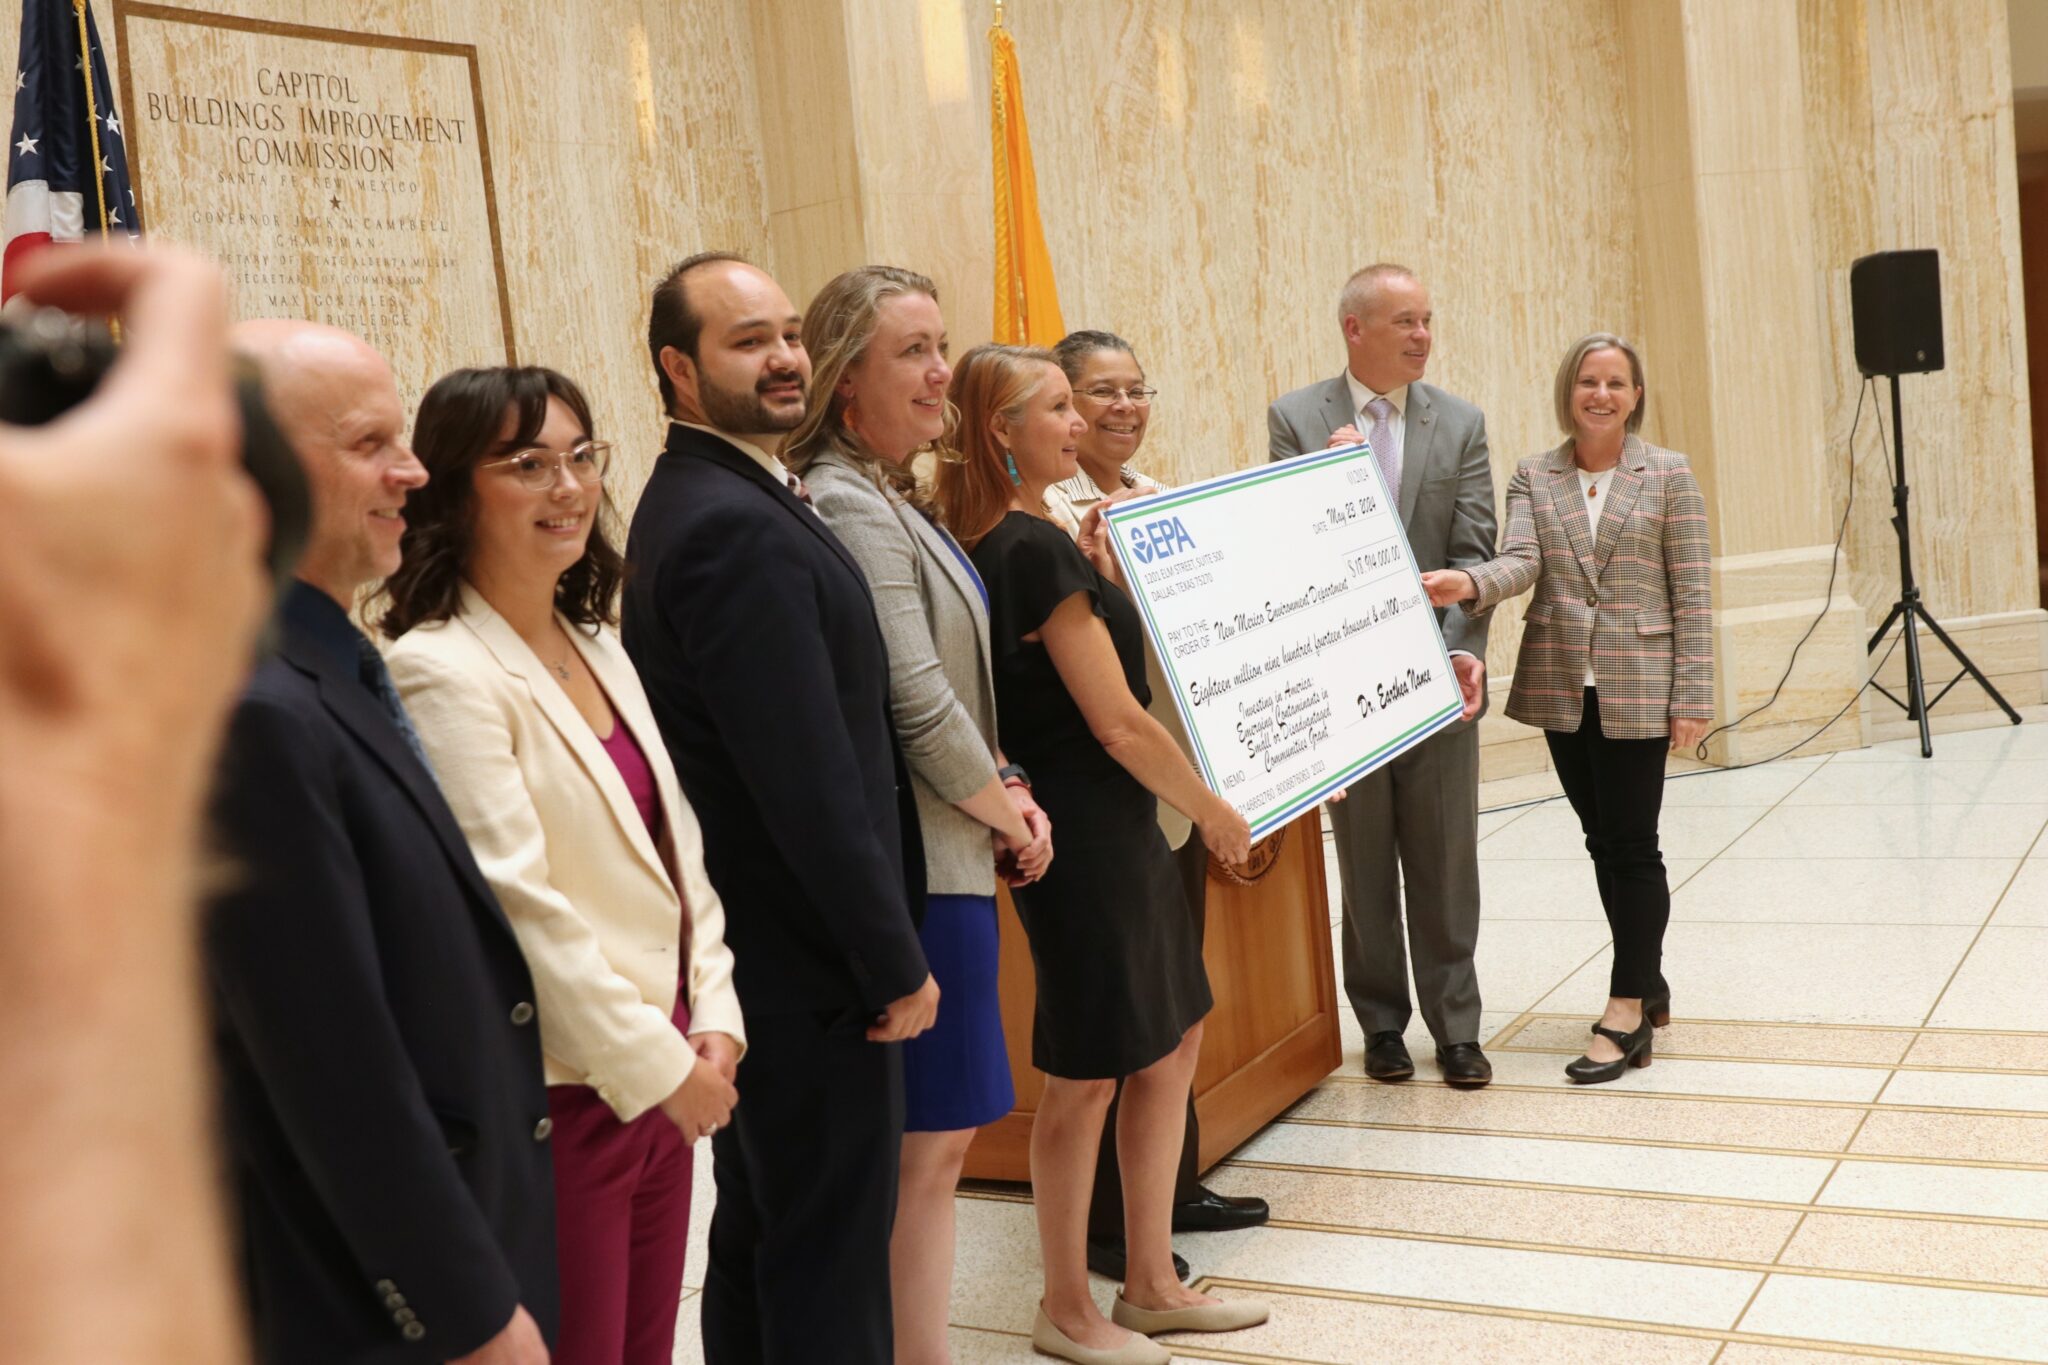
Staff from New Mexico’s Congressional Delegation, Rep. Melanie Stansbury, and U.S. Environmental Protection Agency Region 6 Director Earthea Nance present New Mexico Environment Department Secretary James Kenney, and Rebecca Roose, the infrastructure advisor to the governor, with an $18.9 million dollar check for ‘forever chemical’ detection on Thursday, May 23, 2024 at the Roundhouse rotunda. (Danielle Prokop / Source NM)
Federal grant is authorized in two-year chunks, NM Environment Department aims to pull more than $47M for PFAS detection and clean-up over the next five years.
Big check energy at the Roundhouse.
National and state environmental officials celebrated a $18.9 million federal grant for most of New Mexico’s water systems to use over the next two years to detect “forever chemicals,” in the state’s drinking water.
State officials say they hope to pull down a total of $47.2 million in the next five years in additional rounds of federal grants. The first two years will focus on detection and subsequent phases will address removal of Per-and polyfluoroalkyl substance (PFAS for short) in drinking water.
More than 496 systems serving 231,000 New Mexicans are eligible for the funding, state officials said.
A check of this size will help the state “fund its way” out of pollution, said New Mexico Environment Secretary James Kenney from the Roundhouse Rotunda.
“These forever chemicals will not be a forever legacy. We will address these chemicals and New Mexico will be the leader in the way we do that,” he said.
What are PFAS?
This class of synthetic chemicals are ubiquitous, present in the blood of most people in the U.S. They are toxic and extremely hard to break down. There are nearly 15,000 types of these chemicals, according to the U.S. Environmental Protection Agency.
Their resistance to breaking down in sunlight, water, oil and fire over time makes them useful in fabrics, nonstick cookware, food packaging, in our carpets, clothes and firefighting foam. It also means they build up in our bodies, linked to cancer, heart and liver problems, developmental damage, vaccine resistance and other health issues.
Despite decades of rising concern about the dangers of these chemicals, the EPA only implemented drinking water limits for only the five most-common, releasing the final rule in April 2024.
These drinking water limits for the two most-studied and common chemicals – PFOA and PFOS – is 4 parts per trillion, the lowest limit the EPA believes to be technologically possible. The new rule requires water systems to be compliant by 2029.
The size of the problem will require billions of dollars in spending, with an estimated cost of $1.5 billion to implement the drinking water rules.
And that’s just the low estimate. The U.S. military estimated PFAS clean-up just on military bases and surrounding communities to be at least $31 billion.
New Mexico context
As the nation grapples with the reality of these contaminants’ omnipresence – in rainwater, in our bodies, in animals – New Mexico water systems are already struggling.
In 2021, the environment department found PFAS in at least 15 water systems in New Mexico, according to tests performed with federal assistance.
The most impacted communities are in Curry County and Otero County, according to that data. That’s also where PFAS plumes from firefighting foam infiltrated the groundwater for decades next to military bases. The state tested more than three dozen cities and water systems for 28 compounds. Only five compounds are subject to the proposed limits.
Firefighting foam containing PFAS chemicals is responsible for contamination in Fountain Valley. Photo via USAF Air Combat Command
A Clovis dairy had to euthanize more than 3,600 cows after Cannon Air Force base contaminated water sources infiltrated wells on the dairy.
Rep. Melanie Stansbury described hearing about the moment, saying that the disaster made PFAS not just an economic issue, but a personal one for New Mexico.”
“It’s a big day for New Mexico. it’s a big day for families, it’s a big day for ranchers, and it’s a big day in our fight to really tackle the chemical contaminants that affect our communities,” Stansbury said.
Rebecca Roose, acting as the infrastructure czar in the governor’s office said addressing PFAS is part of a larger plan to address water scarcity in the arid state.
“When we talk about our water being polluted and contaminated and not safe, there’s few things we take more seriously than that,” Roose said. “Perhaps right up there with it is protecting the water so that it never becomes polluted, contaminated or unsafe, because there is not a drop of water to spare.”
The federal grant is funded from the 2021 Bipartisan Infrastructure Act, which contained at least $9 billion earmarked for addressing PFAS contamination.
This is the first grant of its kind in the region, said Earthea Nance, who oversees EPA Region 6, which includes Texas, Louisiana, Oklahoma and New Mexico.
Nance said there are no set plans for enforcement for holding PFAS polluters accountable in Region 6, but said that could change with more information.
“I don’t want to say no, because we mean, tomorrow, we could start putting a plan together,” she said.
Nance said the EPA Region 6 office is relying on state officials to help determine how large the enforcement response will be.
“Because we’re giving this money to the state of (New) Mexico, some of that will fall on them in terms of assessing the situation so that we can then figure out how to identify enforcement issues,” Nance said.
EPA R6 Director Earthea Nance, right, sits with NMED Secretary James Kenney at Thursday, May 23, 2024 event in the rotunda. (Danielle Prokop / Source NM)
How does the program work?
The grant has the unwieldy name; Emerging Contaminants in Small or Disadvantaged Communities Program (EC-SDC). Name aside, it will allow for New Mexico’s environment leaders to spend up to $18.9 million over the next two years.
The program’s first phase will oversee water sampling, creating a statewide database and outreach to water systems, according to environment department officials.
Public water systems with 10,000 or fewer connections, or communities where the median household income falls between $56,828 – $75,770 are eligible to opt in, using this form.
“The great thing about this grant is we will be hiring and controlling a lot of the contract work and actually implementing it, which does take a little bit of a relief off the water systems,” said Kelsey Rader, the deputy division director for Water Protection with the state.
Rader said further federal money, two years from now, would offer more than testing, but also water treatment.
“That’s what’s really special about this grant is that it covers everything from the testing, from the design to the actual remediation, in paying for the necessary upgrades,” she said.
When asked if the $18.9 million is close to addressing the scope of PFAS in New Mexican’s water systems, Rader said the department doesn’t have a date set on when they’ll be able to test every New Mexico system.
“It’s difficult to say when that’s going to happen,” she said.
More work to do
Kenney said the state is still working to address current contamination, noting the environment department recently sent a letter asking for the federal government to commit to clean up water surrounding the Cannon Air Force base, not just beneath it.
A contentious court fight continues on, as the New Mexico Environment Department is still attempting to require the U.S. Air Force to follow state testing and treatment protocols over contamination at Cannon Air Force base. The case has stretched on for years in federal district court and now is in the 10th Circuit Appeals Courts.
The state is currently in mediation with the U.S. Air Force over the litigation and has been for over a year, said Bruce Baizel, the compliance and enforcement director for the environment department. The parties just extended that mediation period through late June.
The $18.9 million for clean-up would go farther, if people’s contact with PFAS in everyday items were reduced, said Kenney.
“In our legislative session, I’d like to see a bill introduced that bans PFAS but for essential uses, like medical devices,” he said. “But if given the choice of having a toxic chemical in your house that then becomes a toxic chemical in your body, I would choose not to have it in my house, or my body.”
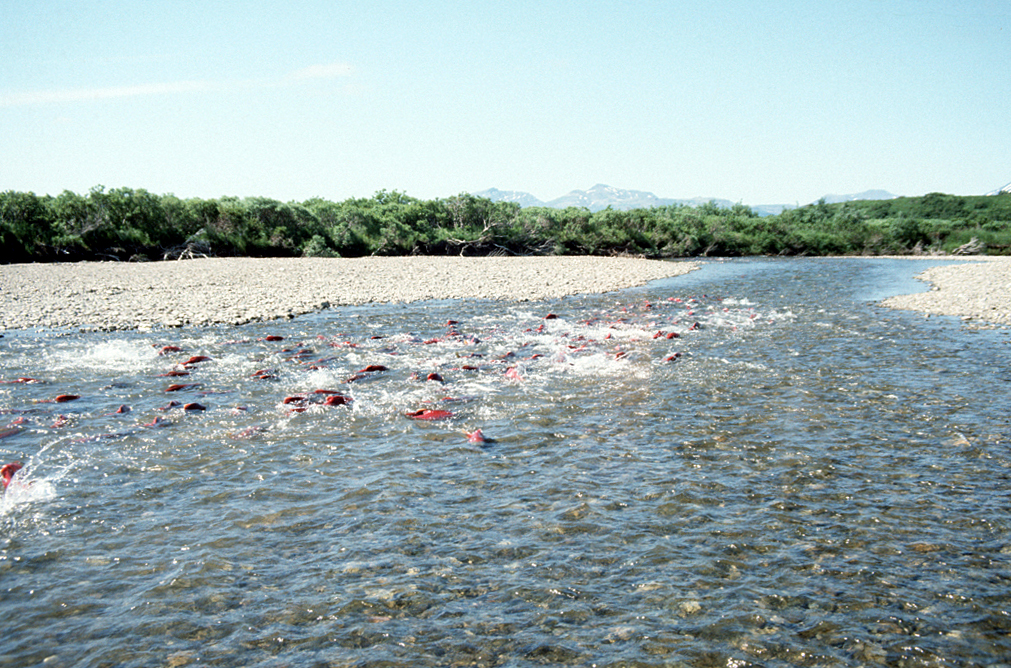
Spawning Salmon in Becharof Stream within the Becharof Wilderness in southern Alaska, USA. By U.S. Fish and Wildlife Service – US Fish & Wildlife Service – [1], Public Domain, https://commons.wikimedia.org/w/index.php?curid=3525119
Migratory fish populations have crashed by more than 80% since 1970, new findings show. Populations are declining in all regions of the world, but it is happening fastest in South America and the Caribbean, where abundance of these species has dropped by 91% over the past 50 years. This region has the world’s largest freshwater migrations, but dams, mining and humans diverting water are destroying river ecosystems. In Europe, populations of migratory freshwater fishes have fallen by 75%, according to the latest update to the Living Planet Index.
Migratory freshwater fish partially or exclusively rely on freshwater systems – some are born at sea and migrate back into fresh water, or vice versa. They can in some cases swim the width of entire continents and then return to the stream in which they were born. They form the basis for the diets and livelihoods of millions of people globally. Many rivers, however, are no longer flowing freely due to the construction of dams and other barriers, which block species’ migrations. There are an estimated 1.2m barriers across European rivers. Other causes of decline include pollution from urban and industrial wastewater, and runoff from roads and farming. Climate breakdown is also changing habitats and the availability of freshwater. Unsustainable fishing is another threat.
Herman Wanningen, founder of the World Fish Migration Foundation, one of the organisations involved in the study, said: “The catastrophic decline in migratory fish populations is a deafening wake-up call for the world. We must act now to save these keystone species and their rivers.
“Migratory fish are central to the cultures of many Indigenous peoples, nourish millions of people across the globe, and sustain a vast web of species and ecosystems. We cannot continue to let them slip silently away.”
Workers for Pate Construction Company install 30-inch PVC pipe on Colorado Highway 96 as part of the Arkansas Valley Conduit Project. Photo credit: Southeastern Colorado Water Conservancy District
Here’s the release from the Southeastern Colorado Water Conservancy District (Chris Woodka):
May 30, 2024
The Arkansas Valley Conduit received another $90 million in federal funding as construction continues on the drinking water line that will serve 39 water systems east of Pueblo.
“This is great news for the AVC and the people of Southeastern Colorado. Funding at this level is needed to keep the AVC moving forward, and we really appreciate the hard work that our congressional delegation and Reclamation officials at all levels have put into the AVC project,” said Bill
Long, President of the Southeastern Colorado Water Conservancy District. “The Southeastern District is looking forward to the day when we can fulfill the promise to bring clean drinking water to the people of the Lower Arkansas Valley.”
The Department of Interior announced the funding from the Bipartisan Infrastructure Law, along with other Western water projects. The AVC received the largest amount of BIL funding for any of the projects included in this year’s funding.
Arkansas Valley Conduit map via the Southeastern Colorado Water Conservancy District (Chris Woodka) June 2021.
The AVC is being built by the U.S. Bureau of Reclamation and the Southeastern Colorado Water Conservancy District. The 130-mile pipeline will serve 50,000 people when completed. To date, federal appropriations total more than $321 million, with state loans and grants of up to $120 million pledged. Local governments have contributed about $10 million, including American Rescue Plan Act funds.
Construction began on the AVC in 2023, with Reclamation constructing the Trunk Line from its connection with the Pueblo Water system at 36th Lane and U.S. Highway 50. So far, three federal contracts totaling almost $100 million have been issued for the AVC to date. In addition, $22 million has been paid to Pueblo Water for conveyance, treatment and transmission of AVC water from Pueblo Reservoir.
The District, through its Water Activity Enterprise, has built delivery lines to Avondale and Boone,using $1.2 million contributed by the Pueblo County Commissioners through American Rescue Plan Act (ARPA) funding.
Pueblo Dam. Photo courtesy of Colorado Parks and Wildlife
Click the link to read the blog post on the Water — Use it wisely website (Amy Peterson):
May 6, 2024
This blog was originally featured on Water – Use It Wisely and was written by Amy Peterson, an Environmental & Water Resource Manager at the City of Surprise
THIS IS GOING TO “Be GROSS” It’s time to talk about something unpleasant, folks, because what you flush matters, and I’ll tell you why. Hold onto your seats while I take you through a guided tour of a typical wastewater treatment plant.
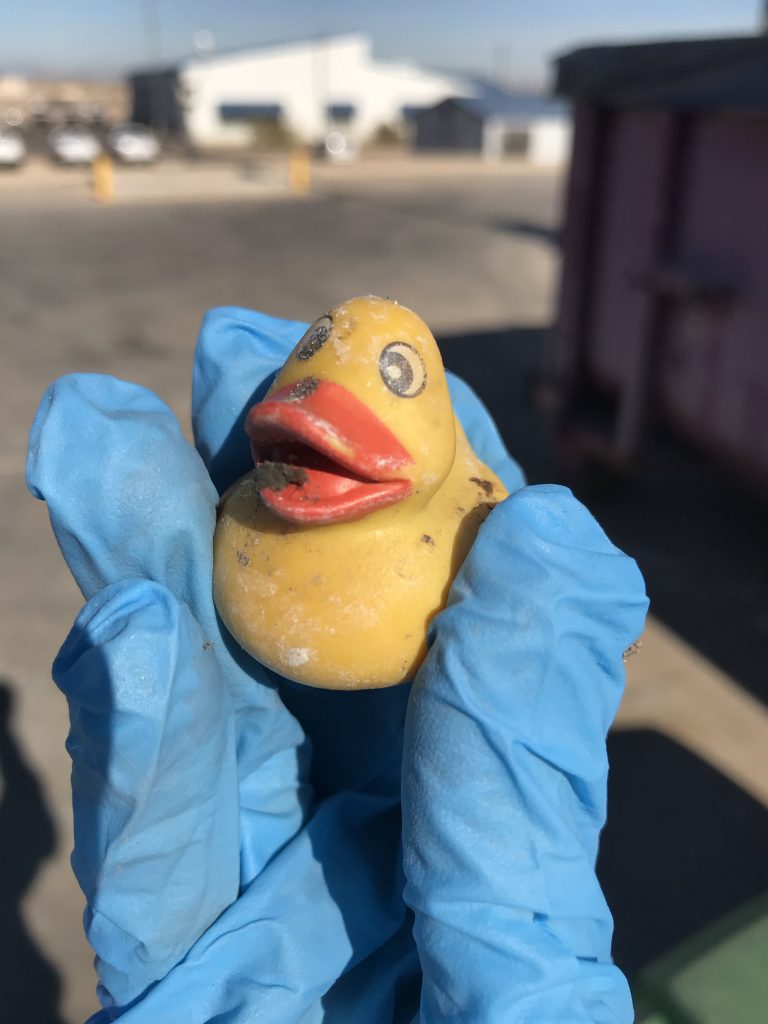
SOCKS, BASEBALLS, AND RUBBER DUCKIES. OH MY.
On any given day, wastewater treatment operators encounter a staggering variety of strange objects while operating and maintaining the equipment at their treatment plants. If it is small enough to fit through a typical household pipe, we’ve seen it. While at my job, I personally have encountered baby wipes, sanitary wipes, floss, hair, socks, miscellaneous clothing, a rubber ducky, thousands of feminine products, latex products (you know what I mean), a car key fob, ID badges, bandages, fruit stickers, candy wrappers, a regulation-sized baseball, and a twenty-dollar bill. Some of my colleagues in sewer collections have even claimed to find jewelry from time-to-time while emptying out their vacuum trucks at the landfill. While these “treasures” make for funny anecdotes, they can actually create major problems in the sewer pipes as well as the treatment plants.
It’s hard to believe that this duck is still smiling after what it’s been through. Photo credit: Water Use it Wisely
The simple truth is that napkins, paper towels, “flushable” wipes (they’re not really flushable), and other paper products should NOT go down the toilet. Period. Let alone any of the other oddities I mentioned previously.
BREAK IT DOWN FOR ME.
Toilet paper has been specifically engineered as a one-time-use product that is durable enough to “do the job” but breaks down fairly quickly when submerged and subjected to the scouring forces of the sewer or wastewater system. Other paper products, while biodegradable in the long run, do not break down quickly enough to be processed at a wastewater treatment plant. In fact, if they do make it through the miles of sewer pipe without accumulating and causing a blockage, they will have to be physically removed at the inlet end of the plant for the treatment process to continue effectively. Why is that? Traditional wastewater treatment is engineered and designed to stabilize organic waste. In other words, the main process used to treat municipal waste is the same biological process of decomposition that happens in nature—but done at an industrial scale. In order to process the millions of gallons (sometimes hundreds of millions at larger plants) of municipal waste that we receive every day, the raw waste must be entirely broken down by the time it gets to our bioreactors. (Note: a bioreactor is a large tank where the biological processes of wastewater treatment occur. It is the heart—or rather the stomach—of a wastewater treatment plant.)
While treatment plants are designed with an initial trash-removal step that we call “headworks,” the system is not foolproof, and solid debris often does make it past the initial removal phase, causing problems with downstream equipment.
Found Cousin It! Rags that get caught in the system can include flushable wipes, tampons, napkins, Kleenex, hair, floss, water bottles, towels and clothing, or candy wrappers. Photo credit: Water Use it Wisely
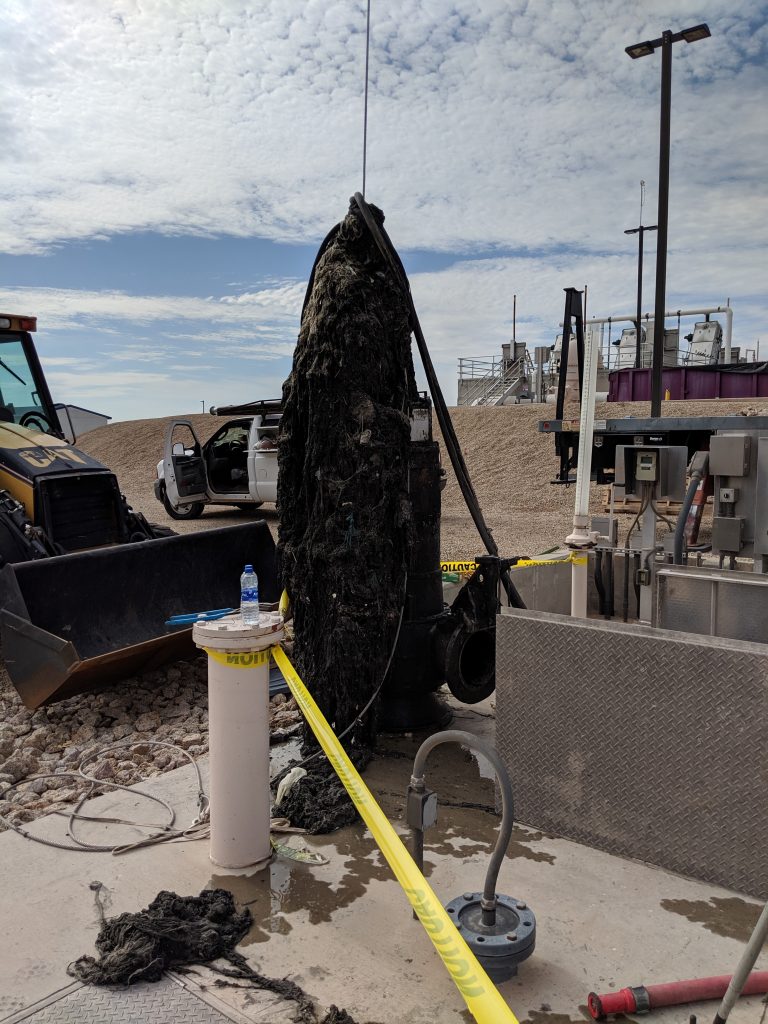
SHOW AND TELL.
The images shown throughout this blog are examples of the various types of equipment that operate submerged and are downstream from the plant’s headworks and therefore tend to accumulate solid debris to a point of failure. About once a year, the bioreactors or oxidation ditches are individually emptied for maintenance and for repairs to the equipment housed in them. What is drained gets sent back to the start of the plant to be reprocessed. What is left after draining is a lot of solid garbage that should not enter that part of the plant in the first place. It tends to accumulate in the ditch, catching onto equipment and creating long strands of what we in the industry call “rags.” Rags are just a catch-all term for anything solid that doesn’t break down in the sewer system before reaching the plant: flushable wipes, tampons, napkins, Kleenex, hair, floss, water bottles, towels and clothing, candy wrappers, etc. The smaller non-biodegradable materials (eggshells, dirt, sand, orange peels, basically anything that people put into their garbage disposal), settle on the bottom of the ditch and create sand bar formations of what we call “grit.”
Clogged mud valve. Photo credit: Water Use it Wisely
About once a year, operators climb down into the empty ditches to physically remove tangled rags from equipment and shovel piles of grit out of the bottom of the ditch. It is a very labor-intensive process and can be particularly unpleasant on a hot summer day.
THIS IS PREVENTABLE.
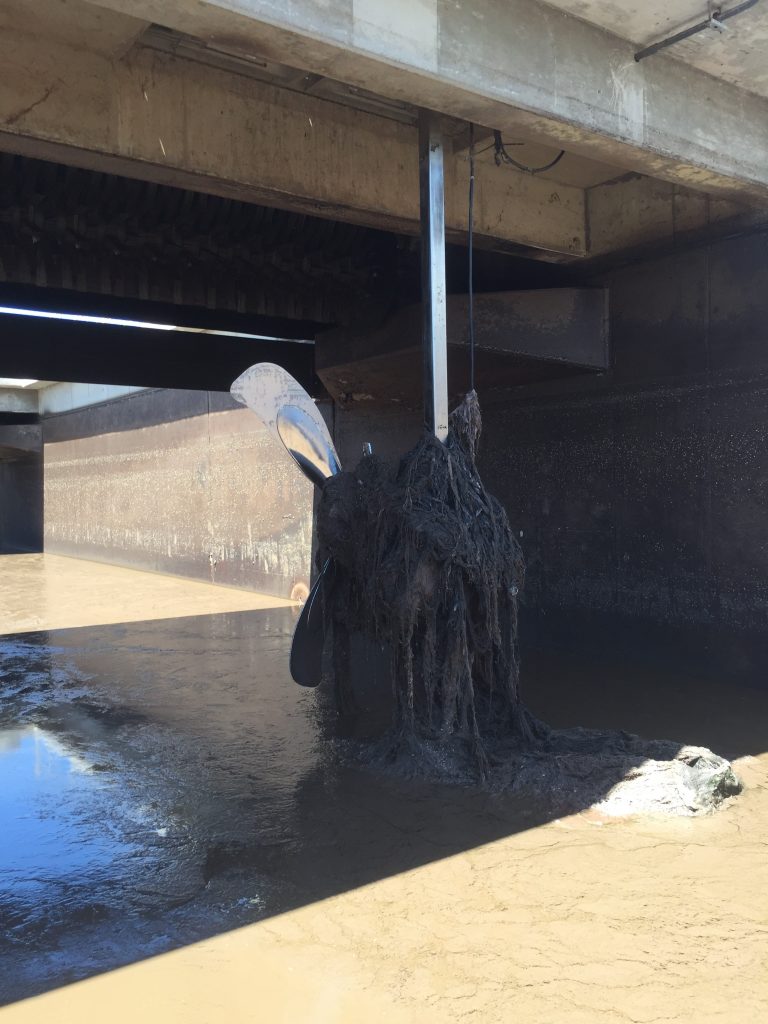
While the cleaning of the ditches is a preventative maintenance task that every wastewater utility conducts, it is worth noting that the accumulation of rags on equipment can and does eventually lead to failure of the equipment. Rotors and mixers can eventually experience motor failure due to working against the resistance of a heavy load from a giant rag ball. Mud valves and gate stems get stuck with rag balls while trying to close them, thus preventing us from fully isolating a piece of equipment. A new rotor can cost up to $65,000 and a mixer can cost up to $25,000.
The utility’s goal is to protect the environment while keeping costs to the rate-payers (our customers) as low as possible. The more we all take responsible flushing seriously, the longer our equipment can last for the benefit of the environment and public health.
Mixer with a giant rag ball. Photo credit: Water Use it Wisely
So, can it be flushed? The simple answer is that unless it is one of the three P’s — pee, poo, paper (toilet paper) – then NO!
(OK, a fourth P can happen due to the flu or too much drinking).
Be G.R.O.S.S.
The City of Surprise Water Resource Management Department created a campaign in 2017 to help spread the word about what should and should not go down your pipes: Be G.R.O.S.S. stands for “Be Guardians Regarding our Sewer System.” If you’re interested in learning more about wastewater treatment and the ways you can help protect your local sewer, feel free to visit surpriseaz.gov/begross or follow our Instagram page @SurpriseBeGross for more icky photos. Lastly, we hope you take a minute to enjoy our fictional movie trailer that stars some of our local wastewater heroes:
If you enjoyed this blog and the video above you may enjoy The Case of the Missing Sign! Seriously, this is a great story having something to do with Winnie the Pooh (no pun intended… OK, maybe it was)!
Click the link to read the release on the Reclamation website (Peter Soeth):
May 23, 2024
The Bureau of Reclamation announced 41 projects selected to receive $3.7 million to improve water efficiency in the Western United States. Projects receiving funding through the Small-Scale Water Efficiency Projects include the installation of flow measurement or automation in a specific part of a water delivery system, lining of a section of a canal to address seepage, or other similar projects that are limited in scope.
“As leaders, we must recognize the pivotal role water plays in sustaining our communities and ecosystems,” said Bureau of Reclamation Chief Engineer David Raff. “Through strategic investments like these, we pave the way for a more resilient future, ensuring that every drop counts and every project, no matter how small in scale, contributes to the greater goal of water efficiency and sustainability in the Western United States.”
This announcement is for the first application period of this year’s Small-Scale Water Efficiency Projects Funding Opportunity. The funding opportunity for application period two is open and Reclamation is accepting applications through July 9, 2024.
Moapa Valley Water District, Water Meter and Data Collection System Upgrade: $100,000
Oregon
North Unit Irrigation District, Improve Water Management & Conservation Through Spill Reduction at 58-11 Pipeline: $51,285
Texas
City of Universal City, City of Universal City Advanced Metering Infrastructure: $100,000
Utah
Ogden River Water Users Association, Ogden River Water Users Association SCADA Project: $100,000
Washington
Chelan County Natural Resources, Wenatchee Water Smart Gardens Program: $77,405
Columbia Irrigation District, Columbia Irrigation District Cox Spillway Liner Project: $88,721
Quincy Columbia Basin Irrigation District, Automation of W39.9 Lateral Turnout of the West Canal: $78,360
Wyoming
City of Cheyenne, Measurement and Canal Efficiency Project: $100,000
Reclamation provides cost share funding the Small-Scale Water Efficiency Projects to irrigation and water districts, Tribes, states and other entities with water or power delivery authority for small water efficiency improvements that have been identified through previous planning efforts.
Small-Scale Water Efficiency Projects are part of the WaterSMART Program. It aims to improve water conservation and sustainability, helping water resource managers make sound decisions about water use. The WaterSMART Program identifies strategies to ensure this generation and future ones will have enough clean water for drinking, economic activities, recreation and ecosystem health. To learn more, please visit www.usbr.gov/watersmart.
Click the link to read the article on The Durango Herald website (Reuben M. Schafir). Here’s an excerpt:
May 12, 2024
Fish native to the Colorado River Basin evolved in a highly connected network of streams, explained CPW Aquatic Biologist Jim White. Fish will swim into smaller streams like Cherry Creek to spawn, before larvae drift back into larger bodies like the La Plata River. That interconnected network has been severed by roads that pass over culverts that were not designed with fish in mind…With $702,000 of federal funding, contractors will remove a standard 60-foot-long steel culvert pipe in Cherry Creek and replace it with a “box culvert.” The new passage will allow for a more natural stream bed and allow upstream access to about 20 miles of habitat for roundtail chub, bluehead sucker and flannelmouth sucker.
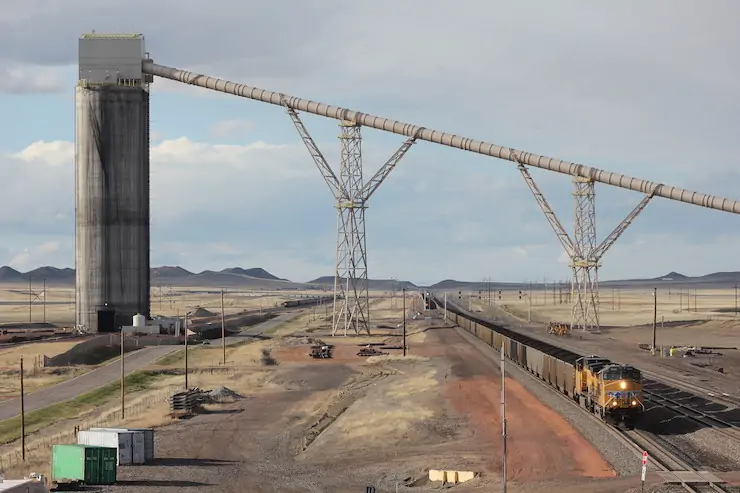
Trains load with Powder River Basin coal at the Black Thunder Mine in May 2011. Photo/Allen Best
Click the link to read the article on the Big Pivots website (Allen Best):
May 30, 2024
Wyoming politicos were furious, some enviros elated. But the Biden administration decision about Powder River coal leasing actually had no real consequence. Here’s why in a richer, deeper read.
Hisses and cheers, outrage and elation. These were predictable responses when the Biden administration announced that it plans no new leasing for coal in the Powder River Basin.
Wyoming’s congressional delegation had their usual talking points. Sen. John Barrasso called it part of President Joe Biden’s war on Wyoming.
“This will kill jobs and could cost Wyoming hundreds of millions of dollars used to pay for public schools, roads, and other essential services in our communities,” Barrasso said in a statement. “Cutting off access to our strongest resource surrenders America’s greatest economic advantages — to continue producing affordable, abundant, and reliable American energy.”
Other politicos from Wyoming echoed his words. This will cause the United States to become dependent on energy from other countries. It will create more pollution in other countries who don’t have access to Wyoming’s clean coal. And so forth.
My e-mail revealed some hurrahs from those in the environmental camp. “Wow,” said one individual. Organizations were supportive but more restrained. “A monumental decision,” said an individual from Earthjustice.
My take? It was a decision without consequence. Several people in Wyoming confirmed my reaction.
Provided to YouTube by CDBaby Wyoming Wind · Terry Yazzolino & Dan Thomasma Good Medicine ℗ 2007 Medicine Tree Music Released on: 2007-01-01
“This is a symbolically significant decision for the climate but in terms of practicality it means absolutely nothing,” Shannon Anderson, the staff attorney for the Powder River Basin Resource Council in Sheridan, Wyo., told me.
At current rates of extraction, coal companies that mine in the Powder River Basin have enough deposits to continue mining until 2041, she pointed out, citing research by the Bureau of Land Management. The BLM, the federal agency, is responsible for leasing coal from the subterranean land. It does so only in response to proposals from mining companies. In other words, the companies must ask to mine more coal. They haven’t done so lately.
None have done so since 2012. Two pending leases have stalled since 2015, awaiting action by the companies. The door was open for a long time without any coal companies walking in.
“It doesn’t make sense to make federal land available for coal leasing if the coal industry doesn’t want that land,” said Anderson.
In its announcement of the end of new coal leases in the Powder River Basin of Wyoming, the BLM noted that coal continues to be extracted from 12 surface mines in the field. They produced 220 million short-tons of coal in 2022, compared to 400 million tons in 2008, the peak year for coal extraction in both the Powder River Basin and the United States altogether.
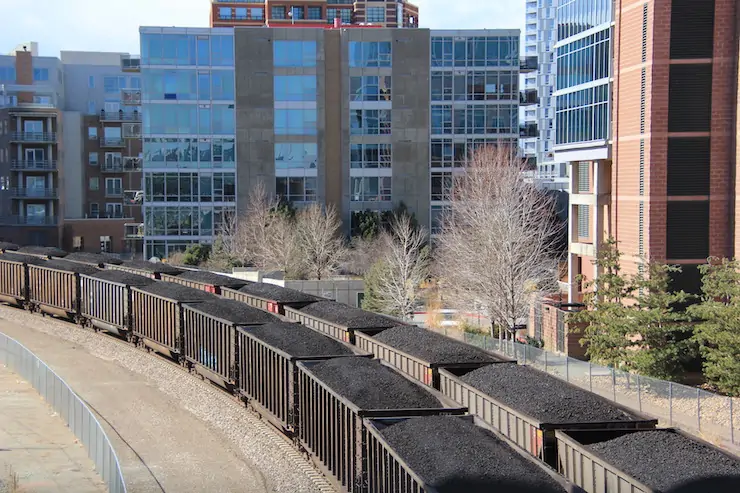
Coal trains two-abreast wound their way through Denver’s LoDo district in March 2018. Demand from Colorado power plants for Powder River Basin coal has already slackened and will cease altogether before 2031. Photo credit: Allen Best/Big Pivots
Paramount is the decline in demand for coal. We’re burning less coal but that’s not because it is less available. Rather, it’s because we have cheaper alternatives and ones that produce fewer or no greenhouse gas emissions.
Colorado burns Powder River Basin coal, but not as much as it once did. Two coal-burning units went down in 2022, one in Pueblo and the second in Colorado Springs.
Two more at Pueblo will follow plus one near Colorado Springs (Nixon), and one north of Fort Collins (Rawhide). Near Brush, the Pawnee coal plant will be converted to natural gas no later than 2026.
All burn Powder River coal, and all will be closed by the end of 2030, perhaps earlier.
On X, the social media platform, I noticed the reaction of Larry Wolfe, who lives in Cheyenne and was for 30 years an attorney specializing in energy with legal heavyweight Holland and Hart.
“You are not watching the news, John (Barrasso), the coal industry is going out of business,” he had written the day after the announcement. “They don’t need new leases. They don’t have the demand for the coal they already own. Down 20% this year, with the companies forecasting 10% annual declines. Done in WY in 10 years or less.”
I called Wolfe to get a keener understanding of Wyoming coal and energy more broadly.
“If you are going to be realistic about this, you have to look at some of these coal companies,” he told me. “They’re not great companies anymore. They used to be — Peabody and Arch and a couple of others. They are not great companies anymore.”
Arch and Peabody were among the 60 coal companies who declared bankruptcy between 2012 and 2020. In addition to mines in the Powder River Basin, they also have mines in Colorado.
Colorado for a couple years had the coal equivalent of man bites dog. A company had reopened a mine west of Trinidad. Then it, too, closed. My research suggests limited coal mining in northwest Colorado beyond 2028, when the last power plant there closes.
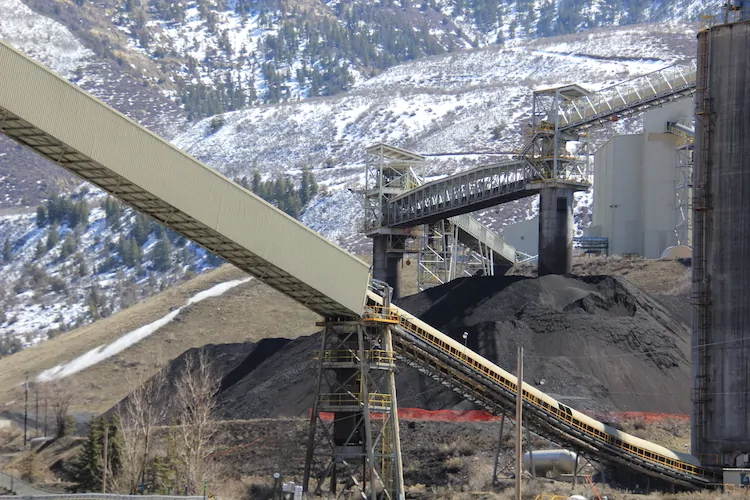
West Elk, near Paonia, the state’s largest producer, which is owned by Arch Resources, may last longer. It has reserves of 10 to 12 years at current rates of extraction. It produces about one-tenth the volume of the company’s Black Thunder Mine in the Powder River Basin.
The West Elk Mine near Paonia in March 2022. Photo/Allen Best
On the campaign trail in 2016, Donald Trump promised to bring back “clean, beautiful coal.” He didn’t.
In November 2020, after the election, S&P Global Market Intelligence recalled Trump’s campaign vow. Instead, said S&P, a market analyst, coal jobs had declined 24% during his presidency. In leaving the White House he will likely leave the nation with the “lowest coal production and job figures in recent history.”
Coal undeniably benefited Wyoming. Wyoming accumulated $2 billion in just coal lease bonuses. The money was used to upgrade almost every school in the state, says Wolfe. That went away after about 2015-2016.
The hard-right component of the Republican Party of Wyoming professes to believe that the world around Wyoming has not changed except for the lunk-headed Democrats in Washington D.C. and maybe wayward states like Colorado.
Gov. Mark Gordon, also a Republican, has a more moderate view. He wants to see carbon capture and sequestration technology emerge as the answer that will allow Powder River coal to have a future. There are several coal plants near Gillette and, of course, Powder River coal for decades was delivered to power plants as far away as Georgia.
In his year as chair of the Western Governors Association, Gordon has made CCS (also called carbon capture storage and utilization, or CCSU) his key initiative, the way that Colorado Gov. Jared Polis the prior year had made geothermal his key initiative.
Wyoming also adopted a law that required its coal plants to test carbon capture.
In Colorado, the Polis administration sees a more limited role for carbon capture, such as for sequestering emissions from ethanol plants. Tri-State Generation and Transmission also proposes a new natural gas plant in concert with carbon capture technology.
The Colorado Land Board seems to think this can constitute a revenue stream in years ahead. It has already leased lands near Yuma, Pueblo, and in Weld County.
With his eye on Wyoming, Wolfe is skeptical the technology will pan out.
“Carbon capture doesn’t work very well. It’s not any kind of salvation. The trouble the carbon capture people have is they want to put this technology on old (coal) generation stations that have outlived their useful lives.”
Doing so will require spending perhaps a half-billion dollars per plant. And that will mean having to operate the coal plants for another 30 to 50 years to monetize the additional cost.
Wolfe calls it one of those “little naughty problems that lawyers bring up that people don’t want to talk about, but which are very real.”
Electric utilities “have been passing along research costs to consumers, and those costs have been tolerable. But they have to start making major investments about how to figure out everything,” says Wolfe. “The consumers will just go ballistic, because they won’t want to absorb the cost of what is likely to be a unproductive technology.”
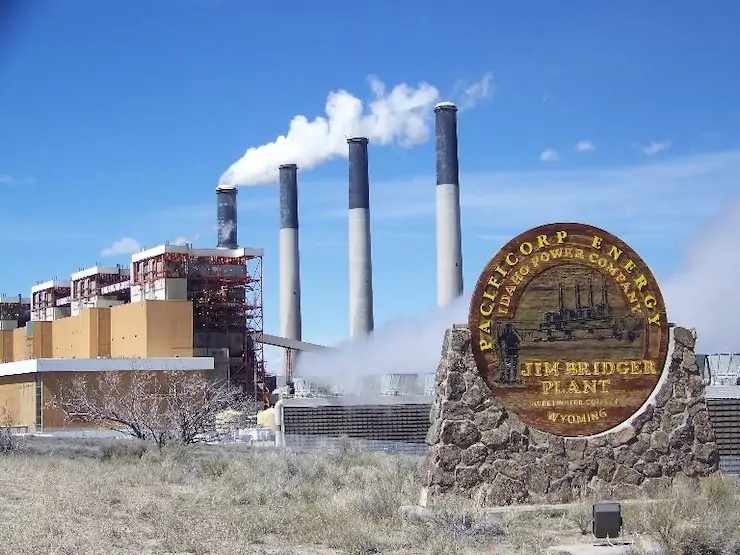
Can carbon capture and sequestration technology be demonstrated to be economically feasible at the Jim Bridge Station in southwestern Wyoming? Photo/Allen Best
Jim Bridger, Wyoming’s largest coal plant, has a capacity of almost 2,442 megawatts — alone equal to the four coal plants on Colorado’s Eastern Slope. It has been identified as among the coal plants that may get retrofitted with carbon capture equipment.
WyoFile’s Dustin Bleizeffer, in an April 2, 2024, story, reported that two electric utilities were planning advanced engineering studies and analysis of potentially retrofitting Bridger’s four coal-burning units. Wyoming ratepayers, he reported, were already paying more than $3 million annually for the initial phases of study but will soon be paying $10 million to $20 million — “with no guarantee that a single coal plant might ultimately be retrofitted with the technology.”
In 2023, he reported, Rocky Mountain Power had estimated a cost of $1 billion per coal unit to install the technology. Another utility, Black Hills Energy, had reported the cost of retrofitting a power plant near Gillette called Wygen II at between $500 million and $668 million. The company in 2008 had estimated the cost at $182.5 million, or the equivalent of $268 in current dollars).
Where might the demand for coal-fired power come from? Cheyenne has been loading up on data centers. They can be seen while driving west from Cheyenne on Interstate 80. Microsoft has two and Meta just weeks ago was revealed to be the company behind a 945-acre data center development in Cheyenne. An 800,000-square-foot facility is planned.
Low electricity costs and Cheyenne’s coolish temperatures – spring comes about a month after it does in Denver just 100 miles to the south – help explain the draw. Resource adequacy could conceivably revive the coal market somewhat, although a safer bet would be on natural gas.
The same questions are starting to be asked in Colorado. The state’s energy office estimates that demand for electricity will increase 50% by 2040.
Wolfe predicts a cascading decline for Powder River coal. Multiple mines will close, leaving just a few that will be highly efficient, using autonomous mining machinery. Railroads – essential to delivery of Powder River coal – will lose interest in serving the much-diminished industry. “They will be wanting to repurpose the engines,” says Wolfe.
“This notion of a sort of glide path down, I wouldn’t count on that for a moment. If you have a couple of back-to-back winters that are really warm and the utilities are maintaining large stockpiles, the companies are going to get into desperate straits.”
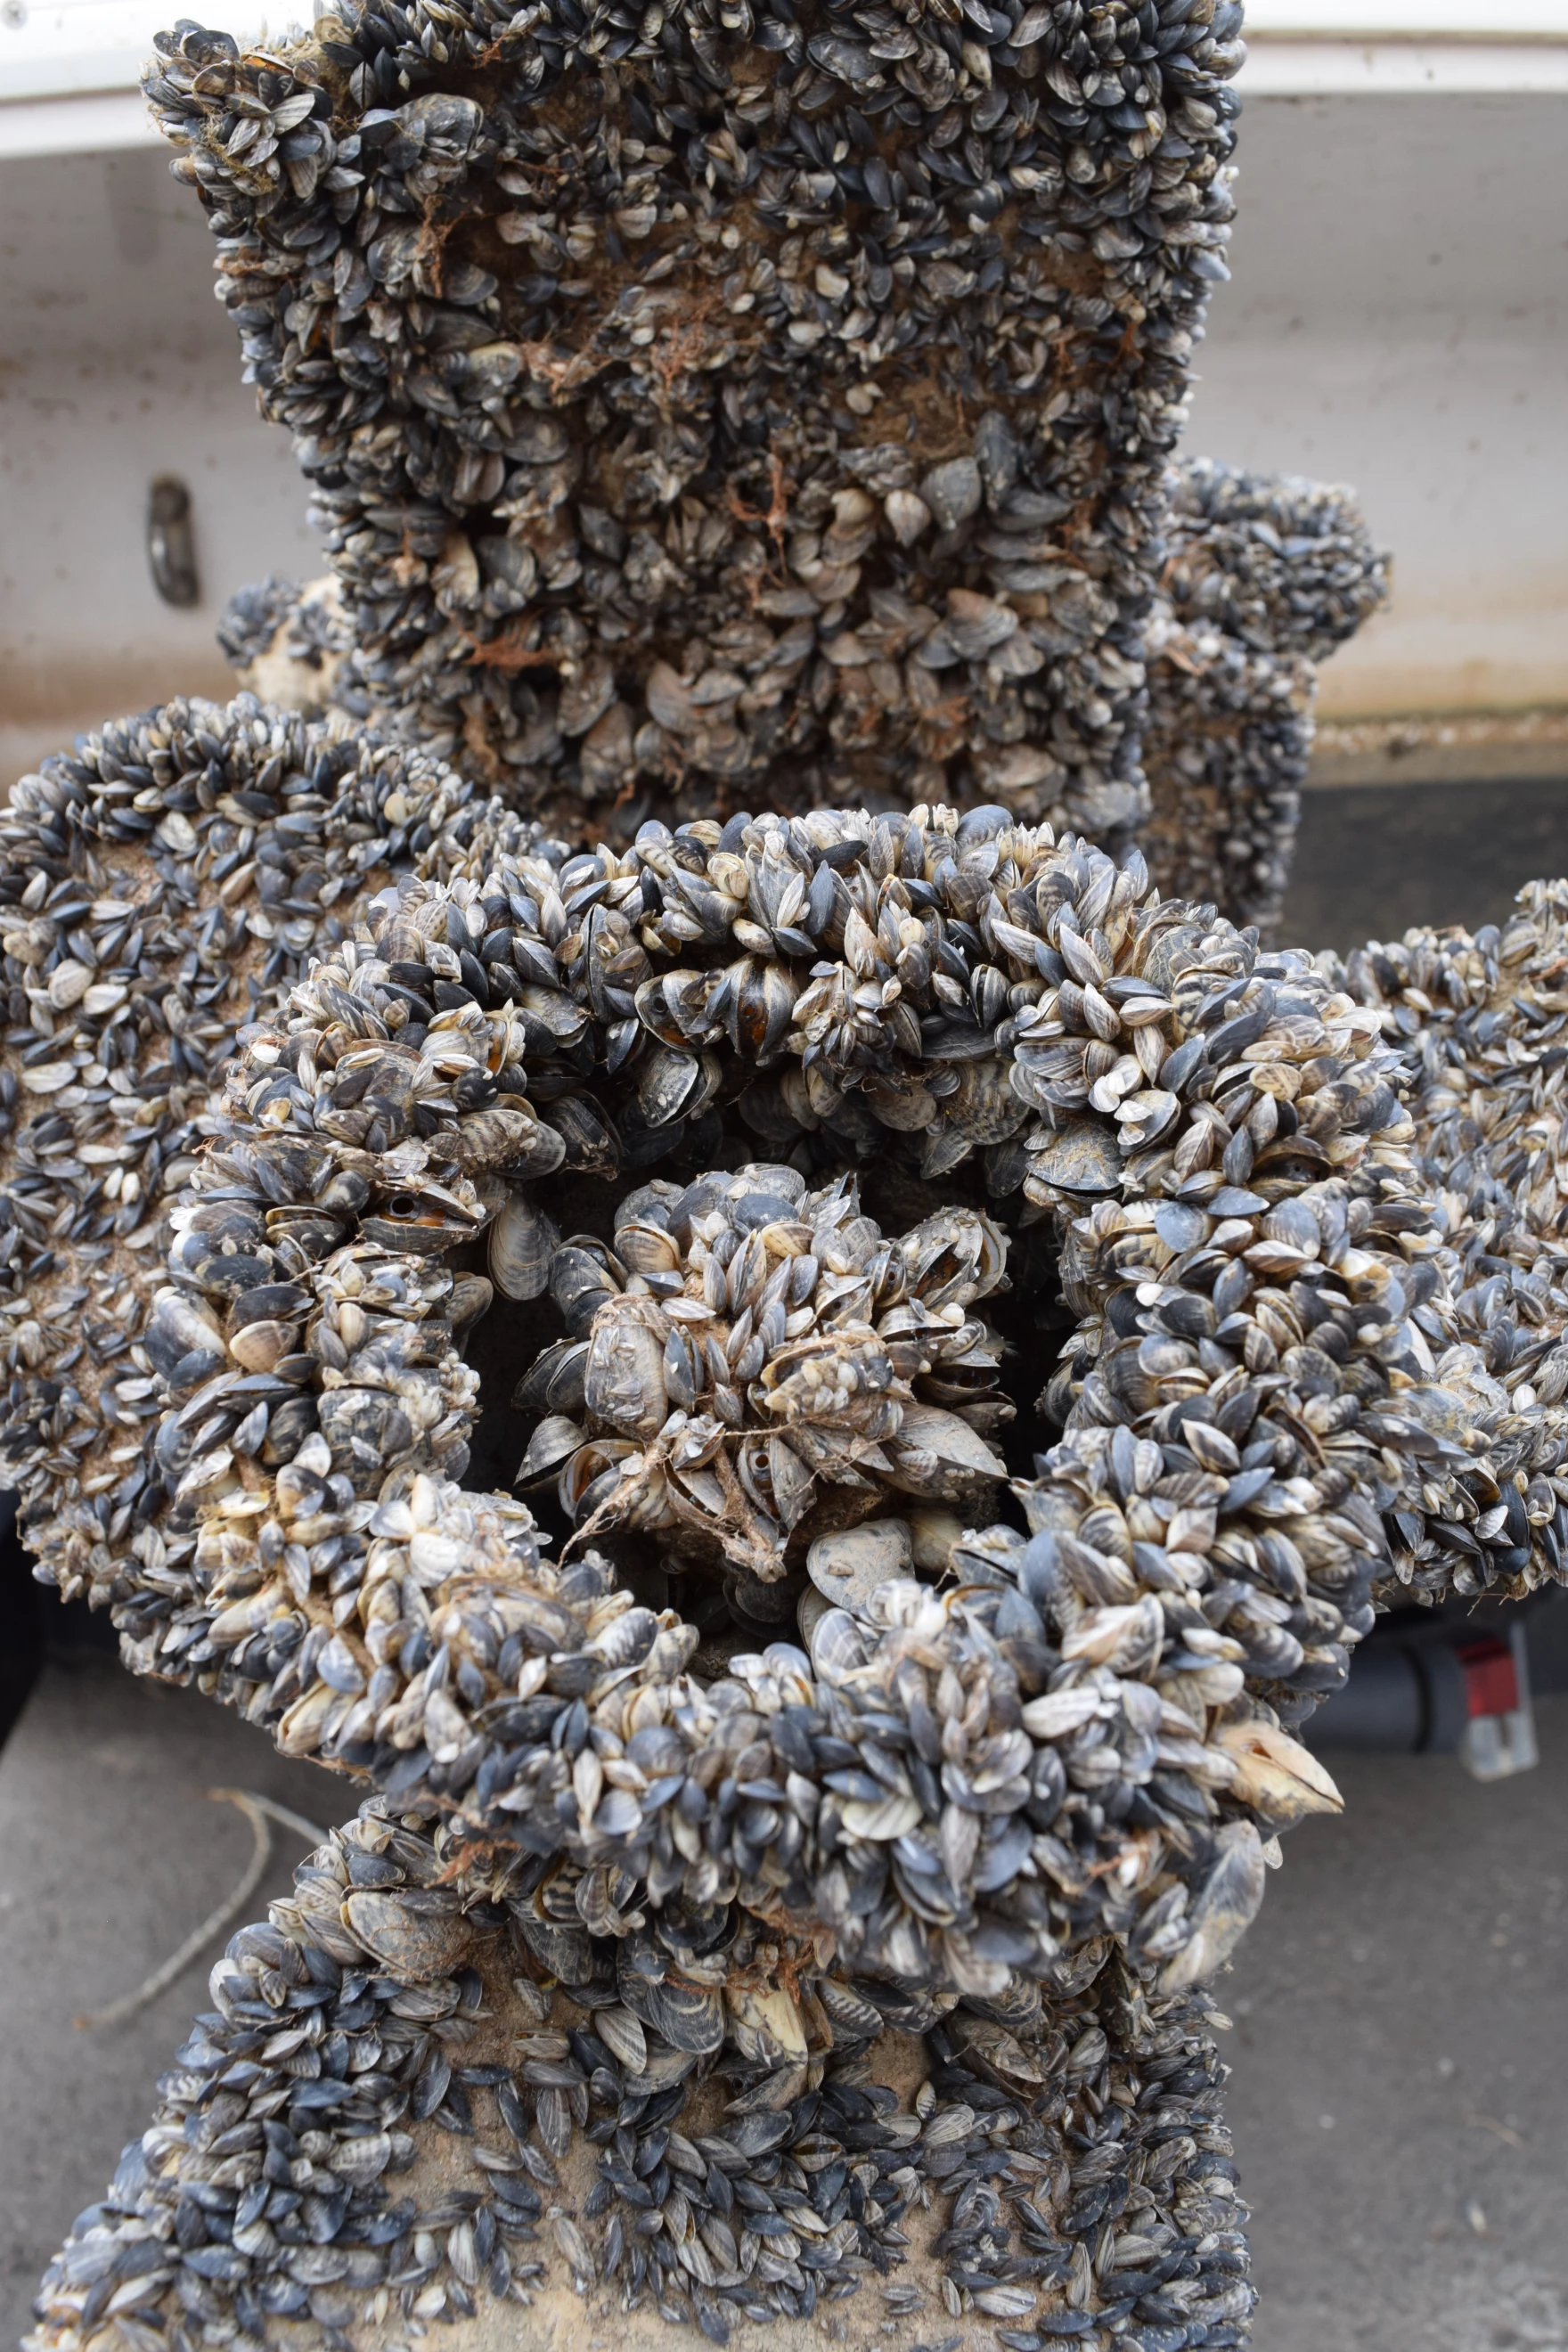
On Wednesday, May 1st, the Ruedi Reservoir boat ramp opened along with motorized watercraft inspection and decontamination for aquatic nuisance species such as the quagga and zebra mussels. On the second day of the season, two boats were found to be infested with mussels as opposed to only three boats for the entirety of the 2023 season. Most of the infected boats are coming from Lake Powell, which is ridden with quagga mussels. Due to the increasing threat they pose, Reudi Reservoir has a mandatory inspection and decontamination protocol in place for entry and departure in compliance with state regulations. The inspection station is operated by CPW from daylight to dark through October.
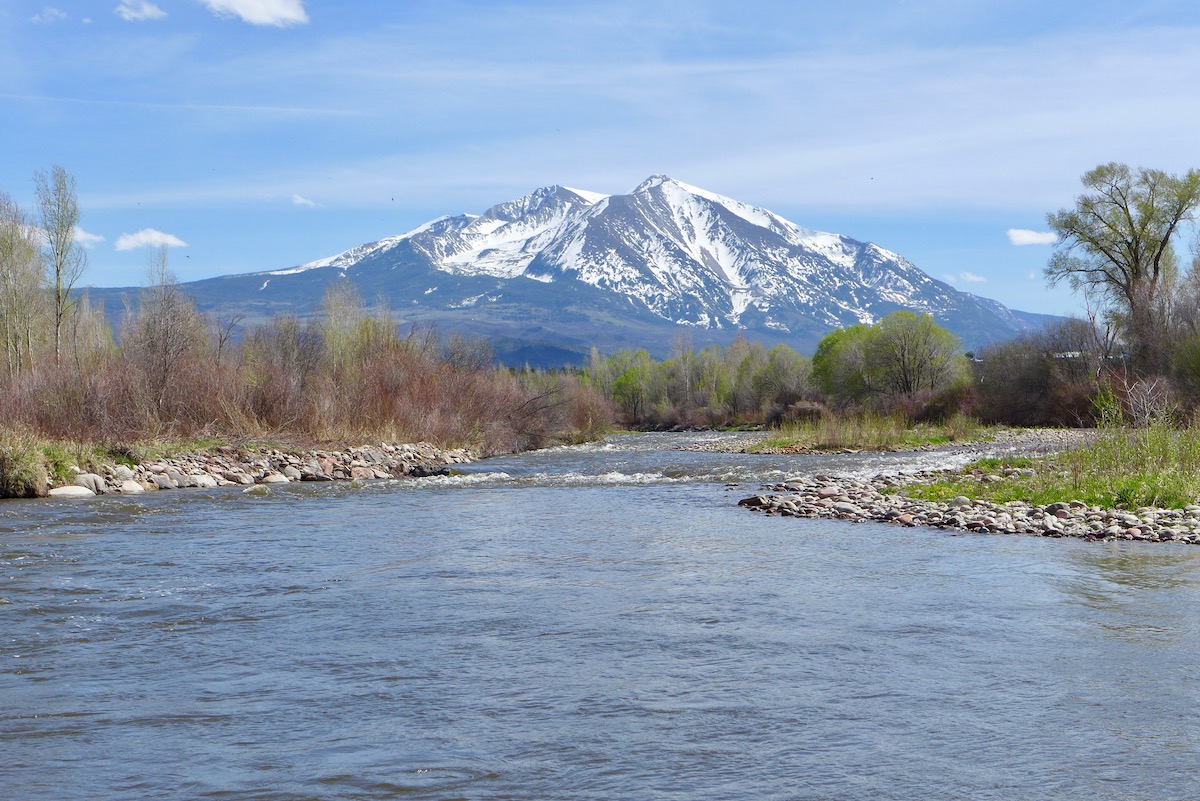
The Roaring Fork River just above Carbondale, and Mt. Sopris, on May 3, 2020. Photo credit: Brent Gardner-Smith/Aspen Journalism
Click the link to read the article on the Aspen Daily News website (Austin Corona). Here’s an excerpt:
May 21, 2024
Two groups of states submitted conflicting proposals in March describing how federal officials should manage reservoirs on the Colorado River after 2026. Former Colorado River Water Conservation District General Manager Eric Kuhn, along with two other water experts, have their own idea to pitch. Kuhn and his co-authors, University of New Mexico professor John Fleck and Utah State University professor Jack Schmidt want to add more flexibility to dam operations to address environmental and recreation concerns in the Grand Canyon below Glen Canyon Dam (the dam that forms Lake Powell). Kuhn presented what has been called the “academic proposal” during a Colorado Basin Roundtable meeting in Glenwood Springs on Monday. He said the document is not a “proposal” akin to the states’ proposals, describing it as more of an “approach” that can be incorporated with other proposals.
“What we’ve proposed is a one-speed bicycle with pedal-back brakes,” Kuhn said. “What all of the parties are likely to negotiate for an actual accounting system is more like a Mars rover.”
The two alternatives submitted by the states propose regulations that will layer on top of the 1922 Colorado River Compact to regulate how federal officials release water from major reservoirs after current regulations expire at the end of 2026. One proposal, submitted by the “Upper Basin” states (Colorado, Utah, New Mexico and Wyoming) would regulate releases from Lake Powell, while the “Lower Basin” states (California, Arizona and Nevada) proposal reaches farther to affect releases from Powell, Lake Mead and five other reservoirs spread across both basins…
Kuhn’s, Fleck’s and Schmidt’s solution, Kuhn said, is to allow the U.S. Secretary of the Interior to adjust Glen Canyon releases when necessary to address these diverse and changing issues. Every time managers adjust for environmental or other concerns, though, it will mean that Powell (which is in the Upper Basin) or Mead (in the Lower Basin) ends up with a different amount of water from what the guidelines officially dictate. To deal with this disparity, the authors propose setting up a special “account” of water in one reservoir that compensates for unexpected losses in the other. If managers choose to release more water from Powell than expected, it means the Upper Basin lets more water flow to the Lower Basin than is obligated. Therefore, that water would be held in an “account” in Lake Mead, and it would count against Powell’s future releases to the Lower Basin. The reverse would be true if managers release less water from Powell than expected — they would set up an account in Powell that would later add on top of future releases to Mead.
“New plot using the nClimGrid data, which is a better source than PRISM for long-term trends. Of course, the combined reservoir contents increase from last year, but the increase is less than 2011 and looks puny compared to the ‘hole’ in the reservoirs. The blue Loess lines subtly change. Last year those lines ended pointing downwards. This year they end flat-ish. 2023 temps were still above the 20th century average, although close. Another interesting aspect is that the 20C Mean and 21C Mean lines on the individual plots really don’t change much. Finally, the 2023 Natural Flows are almost exactly equal to 2019. (17.678 maf vs 17.672 maf). For all the hoopla about how this was record-setting year, the fact is that this year was significantly less than 2011 (20.159 maf) and no different than 2019” — Brad Udall
The size of Wyoming’s proposed and controversial West Fork Dam in the Medicine Bow National Forest in Carbon County is in flux as federal environmental analysts juggle economics and conservation in a review of the planned 264-foot high concrete structure, key analysts say.
As now planned, the structure would flood 130 acres and hold 10,000-acre-feet of water on a headwaters tributary of the Colorado River Basin where drought and climate change plague a river system that supports 40 million people. The dam’s reservoir would hold enough water to supply 20,000 households for a year but it would be used principally to benefit a few dozen irrigators, federal and state documents show.
Releases from the proposed reservoir would flow down Battle Creek to irrigators in the Little Snake River Valley in Wyoming and Colorado. But Wyoming’s plan has drawn public scrutiny and controversy over its purported benefits and impacts.
Studies and analysis reveal that some parts of the plan are uneconomical, officials with the U.S. Natural Resources Conservation Service said last week. That’s leading the agency to consider reducing the cost and scope of the project, cutting the amount of water to be impounded and also employing irrigation conservation measures, federal analysts said.
Even as reviewers flesh out various ways to supply irrigators with late-season water, along with some public benefits and habitat improvements, Wyoming’s design remains “one of the leading alternatives,” said Shawn Follum, an engineer with the federal conservation service.
As envisioned by the Savery-Little Snake Water Conservancy District, Colorado’s Pothook Water Conservancy and the Wyoming Water Development Office, the 700-foot-long dam near the confluence of Battle and Haggarty creeks would span a gorge and back up water for almost two miles.
Project backers estimated in 2017 that the entire project would cost $80 million, most of which the state of Wyoming would fund.
Some alternatives being considered in the environmental impact statement are “just not economically viable,” Follum said. “There’s no net benefit to the government.
“There’s a possibility of maybe changing the scope of that dam a little bit as we’re going through some of the economics to try to reduce some costs,” he said.
“We haven’t identified a modified West Fork [Dam] that’s practical yet,” Follum said. “But we are looking at [whether] we [can] reduce the need of the impounded water with some conservation measures, like lining a ditch to reduce seepage.”
Ongoing studies could propose a smaller project: “That’s what we’re hoping,” he said. But analysts haven’t resolved that size issue, Natural Resources Conservation Service public affairs specialist Alyssa Ludeke said.
“We just don’t have the final answer on that yet,” she said.
December deadline
A draft environmental impact statement likely won’t be completed and released for public comment until December, the two officials said in a telephone interview. The federal conservation service began reviewing the project in December 2022, coordinating with other federal and state agencies, including the Wyoming Water Development Office, the Medicine Bow National Forest and the Wyoming Office of State Lands and Investments.
The state lands office proposed exchanging Wyoming property located inside the Medicine Bow for federal property at the dam site, a swap officials said would expedite environmental reviews. Wyoming sought 1,762 acres of federal land in exchange for an equal value of state property — until last month.
That’s when Jenifer Scoggin, director of the land office, reduced Wyoming’s proposal by 272 acres, or about 16%.
Wyoming’s Office of State Lands and Investments proposed this 1,490-acre Forest Service parcel be traded to Wyoming to enable construction of the West Fork Dam. the parcel is 16% smaller than Wyoming’s original request. (OSLI via Medicine Bow National Forest)
The amendment to seek only 1,490 acres was “based on discussions with the U.S. Forest Service,” Scoggin wrote Jason Armbruster, Bush Creek/Hayden District ranger with the Medicine Bow. The change “addresses resource issues” identified by field studies, she wrote.
Some of the parcels the state sought required Wyoming to surmount “larger hurdles than we could jump,” said Jason Crowder, deputy director of the state lands office.
“We’ve been working for the past year or so trying to come up with a package of land that would move easily through the federal exchange system,” he said in an interview. “It just made sense to change the make-up of the parcels involved [to follow an] easier path.”
The Medicine Bow will use the updated Wyoming proposal as the basis for a “feasibility analysis,” forest spokesman Aaron Voos wrote in an email. That finding — whether the exchange is possible — is the first of two steps.
If the swap is feasible, the Medicine Bow would then determine whether it is in the public interest.
Alternatively, the environmental review might suggest that the state construct and operate a reservoir under a federal permit instead of acquiring the land underneath and surrounding the dam and reservoir. Wyoming has not favored that path.
The Natural Resources Conservation Service and U.S. Forest Service continue their independent reviews.
“I believe the land exchange will probably be slower than the EIS itself,” Follum said. “But that won’t impact [us at the conservation service] because we’re going forward with the kind of a dual assumption; it’ll either be a land exchange or permit.”
The conservation service identified six alternatives when it announced its environmental review, including a no-action alternative. Three other alternatives consider building the dam as proposed under a Forest Service permit or through a land exchange. A fifth option calls for locating a reservoir elsewhere and a sixth calls for water conservation and habitat-improvement projects.
West Fork Fire June 20, 2013 photo the Pike Hot Shots Wildfire Today
Click the link to read the article on the USGS website:
May 21, 2024
Wildfires are a natural process in many ecosystems, but they are increasing in size, severity and frequency in many areas across the United States.
After a wildfire, loss of canopy vegetation and changes to soil properties can occur, which leads to more water flowing over land during rainfall. This can lead to flooding, erosion, and the movement of sediment, ash, pollutants and debris to surface water.
The range of water quality impacts after a wildfire varies, from no noticeable change to large increases in the amount of sediment, nutrients, metals and other constituents. This can result in decreased water quality, loss of reservoir storage capacity, stream habitat degradation and increased treatment costs for drinking water providers.
The most severe water quality impacts are often delayed until high-intensity rainstorms occur, which can happen months to years after a wildfire. This can complicate efforts to collect post-wildfire water quality data, as funding opportunities for data collection have likely diminished by the time the most severe impacts have occurred.
To improve understanding of how wildfires affect water supplies, USGS scientists developeda strategy for selecting water sampling locations and methodologies for data collection, in order to improve the identification of regional insights into wildfire impacts on water quality.
“We don’t currently have enough data to estimate how wildfires affect water quality in different regions,” said Sheila Murphy, USGS research hydrologist and lead author of the study. “Monitoring water quality after wildfires in a strategic, consistent way would help us assess and predict the impact of wildfires on surface waters, which is critical to human and ecosystem health.”
USGS Gallinas Creek near Montezuma, NM (08380500) streamgaging and water-quality monitoring station in August 2022 (watershed burned by Calf Canyon/Hermit Peak Fires April-August 2022) (photo showing Johanna Blake, USGS; photo by Jeannie Barlow, USGS)
A USGS streamgage at Gallinas Creek near Montezuma, NM in August 2022. The watershed was burned by the 2022 Calf Canyon/Hermits Peak Fire.
With hundreds of wildfires occurring in watersheds across the country each year, it would be difficult to monitor every stream within or downstream of a burned area. Collecting post-wildfire water quality data from sites that are diverse in climate, land use, geology and vegetation can build a foundation for distinguishing regional differences in impacts to water.
One of the study’s key insights is a list of important parameters to measure after a wildfire. These parameters are critical to understanding how post-wildfire water quality impacts humans, wildlife and the environment.
The parameters are divided into two tiers in order to help balance the collection of essential data with fiscal and practical constraints. Parameters in the first tier, which includes water temperature and turbidity are considered the highest priority for assessing impacts of wildfire on water quality. Parameters in the second tier, such as alkalinity, lay the groundwork for next-generation modeling capabilities but can also substantially increase monitoring costs.
This USGS research can provide water providers, reservoir operators, land managers and emergency response agencies with actionable guidance to prepare for and mitigate against wildfire impacts to water supplies.
Learn more about how the USGS is working to assist the water resources community in planning for and adapting to impacts on water resources after wildfires here.
Shoshone Falls hydroelectric generation station via USGenWeb
Click the link to read the article on the Sky-Hi News website (Elliot Wenzler). Here’s an excerpt:
May 30, 2024
A major deal to secure flows along the Colorado River in perpetuity is gaining momentum after Gov. Jared Polis signed a bill appropriating $20 million to the water right acquisition Wednesday in Silverthorne.
“I’m not being hyperbolic when I say it’s a once in a lifetime opportunity,” said Zane Kessler with the river district. “This has been a priority for our predecessor’s predecessors on the Western Slope.”
[…]
With the $20 million from the state, another $20 million from the river district and about $11 million from several other entities across the Western Slope, the sale is halfway to being fully funded. The district hopes to receive the rest of the funding from the federal government by the 2027 deadline to secure enough money…The funding was part of the annual water projects bill, which lawmakers pass each year to dedicate funding to various projects throughout the state. This year, about $56 million total was set aside. That’s higher than in years past because of an increase in revenue gained from sports betting. The state will ask voters to let them grow that funding further in November.
A front over the Northwest to the Great Basin brought rain and higher-elevation snow to parts of the region, as well as rain and extreme weather to most of the Plains and Lower Mississippi Valley as the front advanced eastward. An additional front from southern Plains to the Great Lakes brought severe weather and thunderstorms from Texas to New York. Meanwhile, a sub-tropical upper-level high over Mexico brought record- to near-record warmth to portions of Texas. Temperatures were above normal across the eastern contiguous U.S., by as much as 10+ degrees F above average from parts of the eastern Great Lakes to the Northeast and in parts of Texas. Precipitation was below normal across much of the southern contiguous U.S. and the Northeast, as well as portions of the Northwest and parts along the East Coast. The most widespread improvements were made to portions of the Midwest and in eastern parts of the High Plains and South, as well as Montana and Hawaii, where above-normal precipitation was observed this past week. Dry conditions continued across the western portions of the Southern region, southern High Plains and Southeast, with degradations occurring in parts of the western Plains and Florida Peninsula. Drought and abnormal dryness also expanded or intensified in portions of the northern Rockies and Pacific Northwest. In Alaska, heavy rainfall resulted in the removal of abnormal dryness from the central interior this week…
Precipitation fell across much of the region this week, which was enough to prevent further degradation but not enough to warrant large improvements. The heaviest rainfall amounts fell across much of North Dakota and along eastern portions of the region, where rainfall totals were up to 600% of normal and ranged between 1 to 4 inches this week. Severe drought (D2) was improved in south-central Kansas, while improvements to moderate drought (D1) and abnormal dryness (D0) were made in northern Kansas and southeast Nebraska. Abnormal dryness was also removed from northern Wyoming and northeast North Dakota due to heavy precipitation and improvement shown in soil moisture and short-term SPI/SPEI indicators this week. Conversely, dry conditions persisted in eastern portions of the High Plains this week. Deteriorating conditions shown in short-term SPI/SPEI, streamflow, soil moisture and snow water equivalent (SWE) data justified degradations in Colorado and eastern portions of Nebraska and Kansas. Extreme drought (D3) and severe drought were expanded in eastern Kansas, while moderate drought was introduced into southeast Wyoming where precipitation amounts were 50% of normal over the past month. Abnormal dryness was expanded in parts of Colorado, eastern Wyoming and western Nebraska this week…
Colorado Drought Monitor one week change map ending May 28, 2024.
Much of the West remained as status quo this week, while temperatures were below normal (2 to 10 degrees F below normal) across most of the region. Precipitation fell across northern portions of the West, with the heaviest amounts falling over parts of western Washington and Montana. Above-normal precipitation (up to 3 inches), along with cooler temperatures (up to 10 degrees F below normal), resulted in improvements to extreme drought (D3), severe drought (D2), moderate drought (D1) and abnormal dryness (D0) across parts of Montana. Parts of Southwest Montana missed out on some of the beneficial rains resulting in the expansion of moderate drought in the area. Conditions remained dry in the interior parts of Washington, resulting in expansion of moderate drought and abnormal dryness based on short-term SPI/SPEI data, as well as low soil moisture and streamflow…
Dry conditions continued across the western portions of the South this week, while heavy precipitation fell across eastern portions of the region. Most of Arkansas and Tennessee, as well as eastern parts of Oklahoma and Texas, received between 1 to 6 inches of rainfall (200% to 800% above normal) this week, resulting in the improvement of moderate drought (D1) and abnormal dryness (D0) in Arkansas while D0 was removed from most of Tennessee. Conversely, conditions continued to deteriorate in parts of eastern Oklahoma, Texas and Mississippi, where precipitation totals were 1 to 4 inches below normal this month. Severe drought (D2) and moderate drought were expanded in parts of eastern Oklahoma, while moderate drought was introduced in southern Texas. Abnormal dryness was also expanded into parts of northern and southern Texas and small portions of eastern Mississippi. Temperatures were 2 to 8 degrees F above normal across much of the region this week, while parts of southern Texas observed temperatures between 8 to 10 degrees F above normal. The expansion and intensification of drought categories were based on short-term SPI/SPEI, reservoir levels, streamflow and soil moisture data…
Looking Ahead
During the next five days (May 28–June 1, 2024), moisture convergence along a frontal boundary and east of a dryline across Texas and Oklahoma will likely generate scattered to numerous showers and thunderstorms, with the potential for episodes of locally heavy rainfall early to mid-week. The threat of heavy rainfall will be highest in Texas Tuesday into Wednesday as an upper level shortwave moves over the southern Plains, where the potential exists for storms with rainfall rates approaching 2 inches per hour. The coverage of showers and storms will likely expand north across the central and northern Plains later in the week as an organized frontal system moves into the central U.S. from the Rockies. Locally heavy rainfall will be possible across portions of the Rockies going into late Friday and early Saturday as the cold front intercepts an increasingly humid airmass. In terms of temperatures, the Gulf Coast region will continue to remain hot and humid on Tuesday before some limited relief arrives by midweek as a cold front drops southward. However, the heat and humidity will likely continue across Deep South Texas and South Florida with highs running up to 10 degree above average, and heat indices in the 100-110 degree range, especially for southern Texas. Some triple digit heat is also likely for the lower elevations of the Desert Southwest, but very low humidity here will help keep heat indices in check.
The Climate Prediction Center’s 6-10 day outlook (valid June 2–6, 2024) favors above-normal precipitation along much of the West Coast, from the southern Plains to the East Coast, and across much of Alaska, with below-normal precipitation across most of the interior West and Hawaii. Increased probabilities for above-normal temperatures are forecast for Hawaii and much of the contiguous U.S., while below-normal temperatures are likely across the state of Alaska and in parts of Georgia and South Carolina.
US Drought Monitor one week change map ending May 28, 2024.
Fast-growing northern Colorado won approval for two major water loans from the state this month that will help finance a new dam outside Loveland and a major regional water project northwest of Fort Collins.
Vetted by the Colorado Water Conservation Board and approved by a bipartisan group of lawmakers May 1, the $155 million for Chimney Hollow Reservoir and the $100 million for the Northern Integrated Supply Project, or NISP, are among the largest financing packages the state has approved in recent years, according to the board.
“Is it a lot, yes,” said Jeff Stahla, a spokesperson for Northern Water, the agency that is sponsoring the projects for a group of cities that includes Loveland, Broomfield, Erie, and Greeley.
“We know that these were big asks, and we are grateful for the support. We also recognize that these projects are going to benefit hundreds of thousands of people in the fastest-growing part of the state right now,” Stahla said.
The full costs of the water projects, $561 million for Chimney Hollow and roughly $2 billion for NISP, are being financed by water users, as well as the state, Stahla said.
The Northern Integrated Supply Project, currently estimated at $2 billion, would create two new reservoirs and a system of pipelines to capture more drinking water for 15 community water suppliers. An environmental group is now suing the Army Corps of Engineers over a key permit for Northern Water’s proposal. (Save the Poudre lawsuit, from Northern Water project pages)
The loans come as forecasts show the state’s streams shrinking as much as 30% due to the warming climate while the area’s population continues to grow.
Kirk Russell, the board’s finance section chief, said the two loans combined make up 20% of the agency’s $1.1 billion revolving loan fund. The program operates by providing cash to borrowers below market rates. The interest that is generated, in turn, helps finance loans for new borrowers as these are repaid.
The mega loans mean the state will have somewhat less to lend next year, Russell said, for the state’s 2025 fiscal year, which begins July 1.
“I estimate we will have about $50 million to $60 million in loan funds available next fiscal year. That’s about our average annual total [in available loan funds] for the last few years,” Russell said via email.
The loan program is funded with cash generated by interest and loan payments, as well as federal mineral lease payments and severance taxes collected from oil and gas production, Russell said.
Among its other major loans in recent years is the Arkansas Valley Conduit in southeastern Colorado, which received a $90 million loan, and Aurora’s Prairie Waters Project, which received a $60 million loan, according to Russell.
Rep. Karen McCormick, D-Longmont, said she and her fellow lawmakers are pleased the state has been able to provide the financial help. McCormick was one of the bipartisan group of lawmakers who sponsored House Bill 1435, the legislation authorizing the loans.
“These projects are super important, especially to my area of Colorado,” McCormick said. “To have these new reservoirs completed is critical. A lot of different water providers are depending on this.”
The projects are not without controversy, however. Federal permitting for both began 20 years ago, according to Stahla, and each has been delayed numerous times after environmentalists sued over concerns about the impact on the drought-strapped Colorado River, the supply that will eventually fill Chimney Hollow, and the equally stressed Cache la Poudre River, whose flows will be used by NISP.
In fact, the Chimney Hollow loan grew from its original $90 million to $155 million in part due to the cost of litigation and increases in construction costs, Stahla said.
Though Chimney Hollow is under construction, NISP continues to face delays due partially to a lawsuit by Save the Poudre against the federal agencies that approved the deal. It was filed in January.
And it will also have to eventually win an OK from the City of Fort Collins, which has historically opposed the project. Mayor Jeni Arndt declined to comment on the state funding, but said the project would still have to undergo review by the city.
How quickly that might occur isn’t clear…
More by Jerd SmithJerd Smith is editor of Fresh Water News. She can be reached at 720-398-6474, via email at jerd@wateredco.org or @jerd_smith.
Bridging Water Rights and River Restoration: My Path with the Colorado Water Trust
As the former State Engineer of Colorado, I have dedicated my career to understanding and managing our state’s most precious resource: water. Throughout my tenure, the challenges posed by water management in the arid West have only grown, exacerbated by increasing demand and the effects of climate change. It’s a complex puzzle, especially within the framework of Colorado’s prior appropriation system, often summarized by the old maxim, “first in time, first in right.” I grew up understanding the challenges of this doctrine being raised on an irrigated farm that continues today as I share this passion of farming with my children and grandchildren. However, my involvement with the Colorado Water Trust has reinforced my belief that there are innovative solutions to restore water to our streams and rivers while continuing to meet our traditional water needs, despite these challenges.
The prior appropriation system, which governs water rights in Colorado, was developed during a time of rapid expansion and development in the West. It was designed to encourage the settlement and economic development of arid lands by granting water rights to those who first diverted water from streams for beneficial use. While this system has been instrumental in the development of agriculture and industry, it has also led to situations where environmental needs, such as maintaining streamflow for ecosystem health, were often overlooked.
Recognizing this gap, I became a member of the Colorado Water Trust, a nonprofit organization dedicated to restoring flows to Colorado’s rivers in need. The Water Trust works within the existing legal framework to develop voluntary, market-based projects to secure water for environmental needs. This approach not only respects the rights of existing water users but also highlights the potential for collaboration and innovation in water management.
One of the primary reasons I joined the Water Trust was to help foster these collaborative efforts. By working with water rights holders, local communities, government agencies, and other stakeholders, the Water Trust develops solutions that benefit both people and the environment. These solutions often involve water leasing, water rights donations, or infrastructure improvements that free up water to be returned to the rivers without harming the original users’ needs. The Cache la Poudre River-Poudre Flows Project symbolizes an innovative solution involving collaboration among many stakeholders.
Confluence of the Cimmaron and Gunnison rivers. Photo: Brent Gardner-Smith/Aspen Journalism
Additionally, Colorado Water Trust has facilitated projects where agricultural water users temporarily lease part of their water rights to enhance streamflows during critical times of the year. These arrangements provide farmers and ranchers with additional income while ensuring that streams receive much-needed water during drought periods or when fish and wildlife are most vulnerable. Two projects that exemplify this approach are the Little Cimmaron River-McKinley Ditch Project and the Slater Creek Project. These projects not only demonstrate that environmental restoration and agricultural prosperity can go hand in hand, but also serve as proof of concept that flexible water management can work under prior appropriation.
Dick Wolfe
Board Member, Colorado Water Trust
M.S., P.E. Retired Colorado State Engineer, Senior Advisor LRE Water. Photo credit: Colorado Water Trust
Moreover, my involvement with Colorado Water Trust has been a deeply rewarding part of my post-official career because it aligns with my longstanding commitment to finding balanced solutions to water management challenges. It allows me to continue my work in a meaningful way, contributing to the sustainability of our water resources and the health of our river ecosystems.
In conclusion, my decision to join the Colorado Water Trust was driven by a commitment to stewardship and a belief in the power of cooperation. Despite the constraints of the prior appropriation system, I am optimistic about our ability to find creative and sustainable solutions to water management. The success of the Colorado Water Trust shows that it is possible to restore flows to our rivers and streams, ensuring that they continue to thrive for future generations. Through continued collaboration and innovative thinking, we can protect and enhance Colorado’s waterways, preserving our natural heritage while meeting the needs of all water users.
With the obligatory shovels in pre-softened dirt, a group of political leaders from the Navajo Nation, New Mexico state and local government, and water agencies this morning (Wed. 5/15/2024) formally inaugurated a new pipeline being built to connect the Navajo community of To’Hajiilee to the 3.5 million gallon reservoir in the picture – clean, piped water to a community that now has one working well and water so bad no one drinks it.
One of the oldtimers who’d been working on it for more than two decades walked up to me and said, “This is an impossible project.”
What he meant was that the project had overcome seemingly insurmountable hurdles in the interactions between a welter of government agencies with overlapping jurisdictions and sometimes incompatible responsibilities.
I went to the event wearing two hats – as a member of the Albuquerque Bernalillo County Water Utility Authority’s Technical Customer Advisory Committee, and on behalf of the Utton Center, which has a long history of working on Native American water stuff. (I was literally wearing my ABCWUA gimme cap, I don’t have an Utton one.)
To’Hajiilee, 35-ish miles west of Albuquerque, has six water wells. Five have already failed. The sixth is regularly off line. When it’s down, they have to shut down school and the clinic. When it’s working, the water is awful.
The vision statement from the Universal Access to Clean Water For Tribal Communities project is simple: “Every Native American has the right to clean, safe, affordable water in the home ensuring a minimum quality of life.”
In this 1999 book Development as Freedom, the Nobel laureate economist and moral philosopher Amartya Sen explains freedoms as “the capabilities that a person has, that is, the substantive freedoms he or she enjoys to lead the kind of life he or she has reason to value.”
“Rights” are tricky political terrain, because they’re often framed in negative terms – the absence of coercion or interference from others, particularly the state. But Sen’s making an affirmative argument here. It is not enough for the collective to simply get out of the individual’s way. The collective has an affirmative moral obligation to create the conditions under which the individual can flourish – to pursue that which they “have reason to value,” to repeat Sen. That’s sorta what my friends at the Universal Access project are saying with their vision statement.
At the urging of a colleague, I’ve been reading Sen lately in an effort to make sense of the moral underpinnings of the collective choices we face as we cope with the reality of less water. (For those familiar with Sen, know that I am not reading the mathy parts – they’re impenetrable!)
THE PLUMBING – PHYSICAL AND FINANCIAL
The Albuquerque Bernalillo County Water Utility’s 7W reservoir, the tan thing in the picture, sits on high ground midway between Albuquerque and To’Hajiilee, a perfect water source for the community. In eighteen months under the current construction schedule, we’ll have a 7 mile pipe from here to there.
If the tally in my notes is correct (don’t hold me to this, I’m not a real journalist any more), it’s a ~$20 million project, with a mix of federal, state, and Navajo Nation funding.
The actual water in the pipes is the result of a fascinating agreement between the Navajo Nation and the Jicarilla Apache Nation in norther New Mexico. The Navajo Nation will lease Jicarailla water, which will be wheeled down the San Juan River, into the Rio Grande, and then diverted by the Albuquerque Bernalillo County Water Utility Authority, treated, and pumped up to 7W.
THE STRUGGLES TO GET THIS DONE
Former Bernalillo County Commissioner Debbie O’Malley, speaking at the groundbreaking, told the story of the bare-knuckle politics it took to overcome the intransigence of a landowner that stood in the way of the project – Western Albuquerque Land Holdings. And for sure, O’Malley and the group she worked with deserve a ton of credit for the use of their knuckles at a critical point in the struggle to get the pipeline built.
But more important is the community of To’Hajiilee itself, people like Mark Begay, my colleague on the Albuquerque water utility’s Technical Customer Advisory Committee. For decades, Begay and the other leaders in To’Hajiilee acted on behalf of their community to pursue “that which they had reason to value” – water!
This is about the community’s own collective agency, “the result of collective processes and collective actions in which people’s interactions shape their common destiny.” (Oscar Garza-Vázquez)
It was a joy to share the celebration of their success. I’ll be back in 18 months when they open the taps.
On April 3 2024, the snow accumulation season in the Colorado River watershed ended and the snow water equivalent of the snowpack of the Upper Basin peaked. Two weeks later on April 17, the watershed’s reservoirs1 dipped to their lowest level of the year. Now runoff is underway, and the watershed’s reservoirs are beginning to refill. This is a good time to assess how well water managers did during the past nine months to retain the bounty of 2023’s excellent runoff season, an essential part of rebuilding reservoir storage and regaining basin-wide water supply security.
The good news is that water managers did quite well, and reservoirs lost only 26% of the total amount accumulated during the 2023 runoff season. This was the smallest loss of any year in the last decade. Most of the decrease in storage that followed last year’s snowmelt inflow occurred in Upper Basin reservoirs, and Lake Mead and Lake Powell lost only 5% of the storage that accumulated in those two reservoirs. It is imperative that water managers continue to work to reduce consumptive uses, reduce losses, and retain the bounty of the few unusually wet years of the 21st century, as they did following the 2023 snowmelt.
Opportunities to rebuild basin-wide reservoir storage have been rare in the 21st century, and there have been many years in which there is significant risk of basin-wide reservoir storage depletion. Hydrologic and reservoir storage data between 2014 and 2023 indicate that annual snowmelt-derived gains in reservoir storage exceeded losses when natural flow at Lees Ferry exceeded 13.7 million acre feet per year (af/yr). Annual flows less than this amount occurred in 16 years of the 21st century. Opportunities to significantly rebuild basin-wide reservoir storage existed when natural flow exceeded 15.8 million af/yr, which only occurred six times in the 21st century. Development of a sustainable policy for managing Colorado River reservoir storage must focus on reducing consumptive uses and losses in both wet and dry years.
To recap, the natural flow of the Colorado River at Lees Ferry in 2023 was the third highest of the 21st century and was exceeded only in 2011 and 2019 (Table 1). Unregulated inflow to Lake Powell in Water Year (WY) 2023 was ~13.4 million af2.
In response to this large runoff, the basin’s reservoirs recovered a significant amount of storage. The watershed’s reservoirs reached their maximum in mid-July (13 July 2023) when total storage was 29.7 million af. The increase in basin storage between mid-April and mid-July was 8.38 million af and was the largest single-year increase in storage in the last decade, and approximately 1 million af more than the increase in storage that had resulted from the inflows of 2019 (Table 2).
However, the runoff in 2023 did not eliminate critically low reservoir storage conditions. The increased reservoir storage that peaked in mid-July 2023 recovered storage to the amount it had been in mid-February 2021 in the early stages of the 2020-2022 water crisis (Fig. 1). Based on average annual water consumption3 2023’s runoff would need to be repeated five more times to refill the reservoir system. Good runoff years rarely occur consecutively. The projected unregulated inflow to Lake Powell in 2024 is estimated to be only 81% of average.
Figure 1. Graph showing reservoir storage in the Colorado River basin between 1 January 1999 and 1 May 2024. Note that at the peak of storage in mid-July 2023, the total stored water supply was the same as it had been in mid-February 2021. Credit: Jack Schmidt/Center for Colorado River Studies
When we entered mid-summer 2023, I expressed concern about water managers’ ability to conserve the benefit of 2023’s runoff season, because we had not done so in previous years of good runoff. In those years, the benefit of reservoir storage recovery was not retained for more than two years (see blog post from October 2023). The benefit of 2011, the largest runoff of the 21st century, had been completely consumed in 19 months, and the benefit of large runoff in 2019 had been consumed in 24 months. I suggested that public understanding about the status of reservoir storage and the need to conserve the bounty of good years would be improved if water managers regularly reported how much of the previous year’s inflow benefit was retained. Such a metric could highlight success in rebuilding water storage or could be used to sound a warning of the need for additional conservation.
Throughout winter and early spring 2023 and 2024, I reported on the status of reservoir storage and showed that water managers were successfully conserving reservoir storage. Between mid-July (13 July 2023) and mid-April (17 April 2024), total basin-wide reservoir storage lost only 2.2 million af (Fig. 2) which was 26% of the total “gains” of the 2023 snowmelt season. Most of this decrease in storage occurred upstream from Lake Powell, where reservoirs lost 1.4 million af. In contrast, storage in the Lake Powell-Lake Mead reservoir system decreased by only 0.83 million af.
Figure 2. Graph showing reservoir storage in the Colorado River basin between 1 January 2023 and 1 May 2024. Credit: Jack Schmidt/Center for Colorado River Studies
The percentage of the accumulated snowmelt in 2023 that was consumed or otherwise lost from reservoirs in the subsequent months was less than in any other year of the past decade and was less than following the 2019 runoff season and significantly less than the years between 2014 and 2017 when runoff was moderately good (Table 2). I compared the rate and magnitude of decrease of reservoir storage in 2023-2024 with similar data for the previous nine years. The results are presented in a complicated Figure 3. Each line on this graph is the loss in storage in each year, plotted as the cumulative decrease in storage from the peak that had occurred in early summer. Lines that plot higher on this graph reflect smaller decreases in basin storage. The decrease in storage was notably large after the 2020 snowmelt season; total basin storage was nearly 7 million af less in spring 2021 than it had been in summer 2020. There were also large reductions after the snowmelt inflows of 2018 and 2021. In contrast, the reduction in storage after the 2023 runoff season (the thick blue line) was smaller than in the other years; this pattern is reflected by the thick blue line that plots higher on Figure 3 than in most other years.
Figure 3. Graph showing the decrease in reservoir storage during late summer, fall, winter, and early spring following each year’s snowmelt season. Credit: Jack Schmidt/Center for Colorado River Studies
Although the combined storage contents of Lake Mead and Lake Powell reflect the balance (or imbalance) between basin water supply and consumptive use, the trajectories of individual reservoirs also result from reservoir operational rules specific to each facility. Lake Powell reached its peak storage of the year in early July (8 July 2023; 9.67 million af) and subsequently lost 2 million af by mid-April, because water was transferred downstream (Fig. 4). Storage began to accumulate again in Lake Powell in mid-April (18 April 2024). In contrast, storage in Lake Mead steadily increased between August 2022 and early March (4 March 2024), gaining 2.7 million af of storage. Lake Mead has been losing storage since early March.
Figure 4. Graph showing the distribution of reservoir storage in different parts of the Colorado River basin between 1 January 2021 and 1 May 2024. Credit: Jack Schmidt/Center for Colorado River Studies
The trajectory of storage in Upper Basin reservoirs differed between those facilities authorized or linked to the Colorado River Storage Project (CRSP)4 in contrast to other facilities (Fig. 4). Peak storage upstream from Lake Powell peaked in early (facilities unrelated to the CRSP peaked on 5 July 2023 at 3.69 million af ) to mid-July (CRSP related facilities peaked on 15 July 2023 at 5.79 million af). Storage in facilities unrelated to the CRSP was quickly reduced to approximately 3 million af by mid-September, and storage was maintained at that quantity until the beginning of the 2024 snowmelt season. In contrast, storage in CRSP related facilities progressively lost storage of approximately 0.8 million af until mid-February 2024 when storage stabilized at approximately 5 million af. The longer period of declining storage in CRSP-related facilities was caused by policies related to transferring water to Lake Powell.
Insights about the Future
The data and analyses presented above provide insight about the likely trajectory of future Colorado Basin reservoir storage if no changes are made in policies concerning consumptive use and reservoir operations. During the past decade, the increase in basin-wide reservoir storage is well predicted by a power function based on the natural flow at Lees Ferry5(Fig. 5).
Figure 5. Graph showing the relationship between annual natural flow at Lees Ferry and increase to basin-wide total storage during the snowmelt inflow season between 2014 and 2023. Credit: Jack Schmidt/Center for Colorado River Studies
The proportion of snowmelt-derived gain in storage subsequently lost during the following nine months is well predicted as an inverse power function6 of the increase in storage. The greater the increase in storage, the smaller the proportion of that increase subsequently lost. In years when there is little increase in storage, basin-wide consumptive uses and losses far exceeded the annual increase in storage (Fig. 6). Such was the case in 2018 and between 2020 and 2022.
Figure 6. Graph showing the proportion of the annual accumulated reservoir storage consumed or lost during the following nine months prior to the beginning of the next runoff season. Credit: Jack Schmidt/Center for Colorado River Studies
These correlations indicate that annual consumption and losses in excess of annual storage gains occurred when gains were less than approximately 3.2 million af. Between 2014 and 2023, storage gains were less than this amount when natural flows were less than approximately 13.7 million af, which occurred in 16 years of the Millennium Drought. Significant retention of reservoir storage, defined as retention of at least 50% of the annual accumulation, occurred when storage increased by at least 5.7 million af. Such an increase of storage only occurred when natural runoff exceeded 15.8 million af (Fig. 5), which only occurred six times between 2000 and 2023.
Take-Home Messages
The essential purpose of negotiating new reservoir operational guidelines for the Colorado River basin is to maintain sufficient reservoir storage to provide a reliable and secure water supply. At the beginning of the 2024 snowmelt season, basin-wide reservoir storage is comparable to what it was in late spring 2021, demonstrating that the Millennium Drought water crisis persists. The opportunity for significant retention of the benefits of significant increases in reservoir storage exist when natural flow exceeds approximately 15.8 million af, a situation that has rarely occurred since 2000. When natural flow is less than approximately 13.7 million af, there is significant risk of depletion of basin-wide storage. Development of a sustainable policy for managing Colorado River reservoir storage must focus on reducing consumptive uses and losses in both wet and dry years.
Healthy mountain meadows and wetlands are characteristic of healthy headwater systems and provide a variety of ecosystem services, or benefits that humans, wildlife, rivers and surrounding ecosystems rely on. The complex of wetlands and connected floodplains found in intact headwater systems can slow runoff and attenuate flood flows, creating better downstream conditions, trapping sediment to improve downstream water quality, and allowing groundwater recharge. These systems can also serve as a fire break and refuge during wildfire, can sequester carbon in the floodplain, and provide essential habitat for wildlife. Graphic by Restoration Design Group, courtesy of American Rivers
Groundwater interactions with mountain streams are often simplified in model projections, potentially leading to inaccurate estimates of streamflow response to climate change. Here, using a high-resolution, integrated hydrological model extending 400 m into the subsurface, we find groundwater an important and stable source of historical streamflow in a mountainous watershed of the Colorado River. In a warmer climate, increased forest water use is predicted to reduce groundwater recharge resulting in groundwater storage loss. Losses are expected to be most severe during dry years and cannot recover to historical levels even during simulated wet periods. Groundwater depletion substantially reduces annual streamflow with intermittent conditions predicted when precipitation is low. Expanding results across the region suggests groundwater declines will be highest in the Colorado Headwater and Gunnison basins. Our research highlights the tight coupling of vegetation and groundwater dynamics and that excluding explicit groundwater response to warming may underestimate future reductions in mountain streamflow.
Map of the Colorado River drainage basin, created using USGS data. By Shannon1 Creative Commons Attribution-Share Alike 4.0
Click the link to read the article on the Associated Press website (Susan Montoya Bryan). Here’s an excerpt:
May 23, 2024
The Navajo Nation Council has signed off on a proposed settlement that would ensure water rights for its tribe and two others in the drought-stricken Southwest — a deal that could become the most expensive enacted by Congress. The Navajo Nation has one of the largest single outstanding claims in the Colorado River basin. Delegates acknowledged the gravity of their vote Thursday and stood to applause after casting a unanimous vote. Many noted that the effort to secure water deliveries for tribal communities has spanned generations…
The San Juan Southern Paiute Tribal Council also voted to approve the settlement Thursday, while the Hopi tribe approved it earlier this week. Congress will have the final say. For Hopi, the settlement is a path to ensuring a reliable water supply and infrastructure for the health, well-being and economic prosperity of the tribe for generations to come, Hopi said in a statement late Thursday…
Congress has enacted nearly three dozen tribal water rights settlements across the U.S. over the last four decades and federal negotiation teams are working on another 22 agreements involving dozens of tribes. In this case, the Navajo, Hopi and San Juan Southern Paiute tribes are seeking more than $5 billion as part of their settlement…About $1.75 billion of that would fund a pipeline from Lake Powell, one of the two largest reservoirs in the Colorado River system, on the Arizona-Utah border. The settlement would require the U.S. Bureau of Reclamation to complete the project by the end of 2040. From there, water would be delivered to dozens of tribal communities in remote areas.
Way too much is happening in the world today, beyond the Colorado River. An Armageddon is shaping up in the mideastern Cradle of Too Many Civilizations that makes Colorado River problems look like sandlot scuffles; we’re in a long slog toward an election in the Untied (sic) States that would not even be close in a rational nation-state but somehow, ominously, is close here; a so-called Cold War is heating up again between competing military-industrial complexes that are again dragging us to the brink of unimaginable disaster. As if the changing climate were not already enough unimaginability. Much about our future is unimaginable today.
Those apocalyptic challenges make a focus on my favorite river almost feel like a guilty diversion, but there’s a lot of fundamental roiling and boiling going on along and around the Colorado River too – a lot of it dependent on intelligent adaptation to unimaginables like the supercharged climate. Will the Upper and Lower River Basins reconvene – together – in time to get serious about planning for the Post-2026 era? Does the expiration of the beat-up and bandaged Interim Guidelines also mean the expiration of the dysfunctional Colorado River Compact and its two-basin wet dream for a pluvial river that no longer exists? Will the Bureau engineers have to breach Glen Canyon Dam to get water past it, once the bypass tubes collapse, raising dead pool to a third of the reservoir capacity? And – oh yeah, will the seven states actually incorporate the 30 First People tribes into actively helping plan our water-based future?
This post will follow through on that last question. In my last post, I was trying to provide some historical and cultural context for a letter sixteen of the Basin’s First People tribes sent to Reclamation Commissioner Camille Touton in late April, reiterating emphatically their strong desire to become a full partner in the future planning and use of the Colorado River:
We, the undersigned tribal leaders, believe it is now time to more specifically explain the Basin Tribes’ key principles that must be adhered to if the United States, as our trustee, and the Basin States expect our support of any proposed or preferred alternative for the Post-2026 Guidelines.(Emphasis added)
That’s a fairly emphatic government-to-government demand from people historically confined to the role of powerless petitioners, signers of ‘in perpetuity’ treaties that often barely lasted a decade before their trustees broke them. What can the First People do if, as usual, that demand is ignored, and their federal trustee and the seven states continue to not be unduly concerned about having the support of the tribes in what they do (including what they do to the tribes)?
I actually think the First People could probably do quite a bit at this point, not with bows and arrows, but by applying what they’ve learned from civilized America and taking their self-appointed trustee, the U.S. government, to court – not just the warpedy judicial system, but also the ‘world court’ of mediated public opinion. For the last third of the 20th century, since the American Indian Movement, with Western Civilization beginning to show cracks and peeling facades, public awareness of, interest in, and concern about the First People and their cultures has increased; thay have developed a voice that is heard.
The shape of the future may have been set this year, at roughly the same time the 16-nation letter went to the Bureau: the Upper Colorado River Commissioners held their first formal meeting with representatives of the six tribes in the Upper Basin; both parties have committed to regular meetings in the future.
What will they talk about? Probably they will talk first about the three ‘key principles’ in the letter to the Bureau: first, that their alleged trustees ‘take actions to actively protect Tribal water rights’ as the permanent cuts in use begin for the post-2026 epoch. Second, that the Tribes themselves finally be empowered ‘to determine how and when to use their water rights by adopting and supporting a portfolio of flexible tools’ for the Tribes. And third, that the government and states ‘provide for a permanent, formalized structure for Tribal participation in implementing Post-2026 Guidelines, and in any future Colorado River policy and governance.’
From the 2018 Tribal Water Study, this graphic shows the location of the 29 federally-recognized tribes in the Colorado River Basin. Map credit: USBR
A first question in contemplating these principles might be – what are the ‘Tribal water rights’? They were first asserted by the U.S. Supreme Court, in the 1908 Winters v. United States decision, that granted tribes confined to reservations enough water to achieve the reservation purpose (‘civilizing’ the First People). A number of the tribes have actually acquired substantial portfolios, mostly dating to the creation of their reservation. A compilation from two reputable studies indicates that 23 of the 30 First People tribes have paper rights to 4,379,375 acre-feet of water – a full third of the current annual flow of the river. Because this information might sound a little unbelievable, these are the two documents that reveal it: first, a joint study by the Bureau of Reclamation and a ‘Ten Tribes Partnership’; the second, a Congressional Research Service study on ‘Indian Water Rights Settlements.’
First People water rights, you might recall from an earlier post, are obtained in two ways – either of which typically takes years, even decades, to execute: one is to take the federal or state government to court, suing for their rights. Their rights were ‘federal reserved rights,’ but they had to be adjudicated through the legal processes of the state they were in.
The other way was for the First People to engage in direct negotiations with the Euro-American entities – mostly irrigators and private and public domestic users – who have been legally using their ‘federal reserved’ water. The federal government rides shotgun with the tribes on such negotiations, putting on the table the amount of money Interior lawyers figured it would cost the government to go to court for the First People. The farmers and municipalities and others using the water are willing to negotiate as an alternative to going to court in what might ultimately be an expensive losing case.
These negotiated ‘settlements’ have become the preferred method for both the tribes and the governments, offering a lot more flexibility in ‘horse trading’ than the courts allow. Eighteen of the First People tribes in the Basin have obtained rights through negotiated settlements, five through the courts; the remaining seven First People nations with no decreed rights will probably follow the settlement course. If you are interested in browsing a copy of a settlement agreement, this links to the one for the Salt River Pima-Maricopa Indian Community – the People whose Great Seal is the maze illuminating the last post here. Just a quick look at the table of contents will show why the maze is an appropriate symbol for these still-evolving relationships.
But this tally of 4.4 million acre-feet (maf) of water rights for 23 of the 30 Colorado River Basin tribes is, as noted, ‘paper water’ – the right to use the water. To actually put the water to use – turn it into ‘wet water’ serving some purpose – requires expensive infrastructure, especially in the desert. On average, the individual First People tribes have only turned, on average, a fourth of their decreed paper water into wet water, according to the 2018 study by the Bureau and Ten Tribe Partnership. The rest of their decreed water is being used (free) by others – mostly farmers and municipalities, all with legal rights.
In trying to address this situation, the First People tribes are well aware that the Colorado River is already over-appropriated almost everywhere, and that their federal reserved water has been used productively for more than a century by other users with legal water rights that would become ‘junior’ if contested by the tribe’s senior reserved rights. But forcing those longtime users to give up the Indian water would just push them to pumping more groundwater, still (unbelievably) unrestricted in most of Arizona. The tribes specifically asked in their letter to the Bureau that the government ‘facilitate the creation of compensated forbearance agreements that enable Basin Tribes to benefit from their water rights in a manner that avoids increasing cumulative consumptive demand.’ (Emphasis added) In other words – don’t make us make the situation worse for everyone else in making it better for us.
The logical, common sense action would be to allow the First People to charge current users of their water to continue using it and not be forced to the expense of pumping groundwater, with the First People using the proceeds to improve their own water infrastructure, making their water go further. This logical, common sense action, however, is illegal under the antiquated 1834 ‘Indian Non-Intercourse Act,’ forbidding First People nations to lease or sell their reservation land and resources without Congressional approval.
One First People community right on the Colorado River has gone to Congress to seek that approval, and in 2022 Congress passed the ‘Colorado River Indian Tribes Water Resiliency Act,’ which, despite the omnibus sound of the title, only permitted the First People community on one reservation to address the opportunity of ‘compensated forebearance agreements.’
The ‘Colorado River Indian Tribes’ (CRIT) reservation was created in 1865 for the groups of the Chemehuevi and Mojave tribes – at their request. Well into their own transition from hunter-foragers to farming, they were concerned that their traditional lands were being overrun by the white tsunami unleased by the gold and silver ‘rushes,’ and they were willing to sacrifice their upland hunting grounds if they could be have their floodplain farmland along the river. Indian Affairs agent Charles Poston made that happen for them, generating a relatively large reservation, 353 square miles in Arizona and 67 square miles in California, and 113 miles of Colorado River access. A reservation town is named for Poston, an agent who treated them like humans.
After that unusual 19th century beginning, the People experienced the usual traumas imposed by American Indian policy, combining general neglect with efforts at forced assimilation – a combo that the tribes barely survived.There were also unintentional challenges: their farming technique was to plant their ‘three sisters’ – corn, beans and squash – in the rich mud as the annual spring flood of snowmelt receded, with no additional irrigation required. That was disrupted when Hoover Dam was completed, ending the floods. They petitioned Indian Affairs for assistance in setting up an irrigation system with marginal results. And the Indian Affairs Office also doubled the number of First People tribes in the CRIT community, bringing several bands of Hopis and Navajos onto the reservation, an unwelcome addition crowding an already inadequate irrigation infrastructure.
Headgate Rock Dam. Photo credit: Alltech Engineering
But then, as the nation descended into World War II, the four-tribe community got way more crowded: the reservation became host to the largest internment camp for American citizens of Japanese descent relocated from the West Coast – 17,000 people by 1945. But this was followed by a most unexpected but welcome development. In the early years of World War II, with all the nation’s industrial resources diverted to war production and most of the traditional workforce in the military, the Bureau of Reclamation found enough concrete and steel and workers to build the Headgate Rock Diversion Dam across the Colorado River, to divert irrigation water onto – an Indian reservation? And internment camp?
I searched the Bureau’s websites in vain for information on this project, and found nothing – from an organization that has excellent histories for nearly all of the projects it has built; they don’t even list Headgate Rock as a project – perhaps because the Bureau of Indian Affairs manages it. But accounts of the internment camp note that the Japanese Americans worked with the CRIT First People in developing the irrigation works, and all who survived the experience did so in part because of the extensive new irrigation system. Typically for the internment camps for Japanese Americans, by the time they were released in 1945, the camp itself had become a more livable place with gardens and trees; after the war, the Hopi and Navajo people were moved into some of the housing.
The CRIT then received a big break in 1964. In the decree resolving (sort of) the ongoing feud between Arizona and California, the U.S. Supreme Court included water rights for all the First People tribes and the CRIT multi-tribe community living along the Colorado River, rights quantified in the 1970s; CRIT, being the largest Colorado mainstem reservation with the most existing water development, got consumptive use decrees for 719,000 acre-feet in Arizona and California, the largest decree for any single entity in Arizona. They have managed to put to use about half of their decree, and want to lease some of the rest to those already using their water, which is why they petitioned Congress recently for the 2022 act to do that.
And that brings us to the photo at the beginning of this post, which is the signing of the agreement between the CRIT People and the Arizona and federal governments. Any reader with a sense of history will see immediately what is unusual about this picture: the signers are all women – and two of them are of the First People: on the viewer’s left, Amelia Flores, Chair of the CRIT community; in the center, Deb Haaland, U.S. Interior Secretary (Laguna Pueblo); and on the right, Arizona governor Katie Hobbs, who had the gumption to shut down part of Arizona’s growth juggernaut, the ‘Hassayampa romantics’ who could not verify a hundred-year water supply for their developments.
Everyone in the Colorado River region today talks about a need to be ‘thinking outside the box.’ That picture seems to me to be ‘outside the box’ – as does the meeting between the Upper Colorado River Commission and the six First People tribes in the upper basin states. Congress might follow that by repealing the 1834 Indian Non-intercourse Act and generalizing the 2022 CRIT Water Resiliency Act with a uniform policy for all First People reservations – although uniformity has never been an international feature of the Indian nations.
Of course, that will all change if Trump wins the presidency: he promises to take us back to the past to avoid the unimaginable future.
But that note is no way to end this; I’ll instead give the last word to the ‘Poston (Arizona) Community Alliance’ on the CRIT reservation, committed to carrying forward ‘Poston’s unique multicultural history, involving Japanese Americans and Native Americans.’ In 1992, the 50th anniversary of the internment camp, the Alliance raised a 30-foot monument with this quotation:
This memorial is dedicated to all those men, women, and children who suffered countless hardships and indignities at the hands of a nation misguided by hysteria, racial prejudice, and fear. May it serve as a constant reminder of our past so that Americans in the future will never again be denied their constitutional rights, and may the remembrance of that experience serve to advance the evolution of the human spirit.”
Colorado River headwaters-marker. Photo credit: Allen Best/Big Pivots
Click the link to read the article on the Big Pivots website (Allen Best):
May 23, 2024
Expert suggests “Law of the River” discussions about realigning demand with supplies are doomed to fall short
Before Jack Schmidt wrapped up his comments about the Colorado River in a recent webinar sponsored by the Sierra Club, he had David Brower rolling in his grave.
Brower, the leader of the Sierra Club in the 1950s and 1960s, had famously fought efforts to harness the Colorado River, drowning its fabulous canyons in the process.
The environmental community in the ‘50s and ‘60s had “simple, clear fights: stop dams, don’t drown spectacular canyons,” he said.
Brower and other environmentalists won the argument at Echo Park, in Dinosaur National Monument. They won the argument at Marble Canyon. Those who opposed Glen Canyon lost that battle.
“But it was a simple, clear fight,” said Schmidt.
The story has become far messier, the issues more complex. He cited the dilemma about fish.
When Lake Powell was full, water was withdrawn from the cold depths of the reservoir. Rafters at Lees Ferry, just downstream from Glen Canyon Dam and the waters of Powell, soon had ankles that tingled when rigging their boots. The water was cold.
Not now after 22 years of declining water levels in Powell. Water temperature at Lee Ferry reached 70 degrees Fahrenheit in September 2022.
Non-native fish in Powell now get swept through the dam where they swim to the Grand Canyon, threatening the native fish there.
Some environmental groups and the National Park Service have advocated that the best way to keep the water temperatures low and keep these fish out of the Grand Canyon is to preferentially keep Lake Powell higher, said Schmidt, a professor at Utah State University who directs the Center for Colorado River Studies. Others glory in seeing the canyons of the Colorado that few had ever seen.
Higher or lower water levels? Higher is better for downstream native fish. Lower levels allow the magnificence of long-submerged Glen Canyon to emerge.
Different questions, different equations have emerged. He suggested that looking beyond all the federal laws, the story of the Colorado River at this point can be simplified to a few basic questions: “What ecosystem conditions do we want? What values do we have?”
And he also asked his 26 listeners to ponder whether we — including the Sierra Club and other environmental groups — have been looking at the Colorado River in the most useful way.
“Let’s celebrate the fact that we are a nation of laws, but let’s go past that,” he said. Instead of viewing the river through the legal lenses that we have used for the last century, we should look at it in terms of sectors. Among those sectors, agriculture uses by far the most water, and most of that ag water has been devoted to growing forage for animals.
Anne Castle had spoken first in the webinar, and she laid out those laws, agreements, and other legal processes now underway. She also shared the now familiar numbers that help explain why the Colorado River has become a national story.
“New plot using the nClimGrid data, which is a better source than PRISM for long-term trends. Of course, the combined reservoir contents increase from last year, but the increase is less than 2011 and looks puny compared to the ‘hole’ in the reservoirs. The blue Loess lines subtly change. Last year those lines ended pointing downwards. This year they end flat-ish. 2023 temps were still above the 20th century average, although close. Another interesting aspect is that the 20C Mean and 21C Mean lines on the individual plots really don’t change much. Finally, the 2023 Natural Flows are almost exactly equal to 2019. (17.678 maf vs 17.672 maf). For all the hoopla about how this was record-setting year, the fact is that this year was significantly less than 2011 (20.159 maf) and no different than 2019” — Brad Udall
From 1906, when record-keeping began, until 1999, the Colorado River averaged flows of 15.2 million acre-feet. From 2002 to 2023, the river delivered 12.5 million acre-feet. And within that span, there were other years of yawn-inducting flows, including an average 10.6 million from 2018 to 2022.
“Climate change is the reason,” she said. “It’s hotter, it’s drier. And there are lesser flows.”
These numbers conflict dramatically with what was assumed in the Colorado River Compact of 1922: annual average flows of at least 17.5 million acre-feet.
“You can see we have a problem,” said Castle, a water attorney in Denver for 28 years before serving from 2009 to 2014 as assistant secretary for water and science in the U.S. Department of Interior. There she had responsibility for the Bureau of Reclamation and the U.S. Geological Survey. She is now on the Upper Colorado River Commission and a founding member of the Water Policy Group.
This inequation of supply and demand has many twists. The Colorado River Compact allocated 7.5 million acre-feet to the lower basin states – Arizona, California and Nevada, or those principally below Lee Ferry. A similar amount was awarded the upper basin, with an acknowledgement that something would have to be delivered to Mexico. (It ended up being 1.5 million acre-feet).
The upper-basin delivers nearly all the water in the Colorado River, and Colorado delivers the lion’s share: about 55%.
Now, get into the metaphoric frame of mind. Castle instructed listeners to imagine a checking account. Even though the upper basin was using only 3.5 to 4.5 million acre-feet per year and leaving any excess to flow into Lake Powell, Powell continue to be drawn down to meet demands from the lower basin and from Mexico. The annual deficit during the 21st century varied between 0.6 million acre feet and 3.6 million acre-feet.
“You can only draw your checking account so far,” she said. “You have to live within the means of the river, and that’s what we’re trying to do now.”
Castle then outlined the sequence of responses since the river’s flows plunged to an average 9.5 million acre-feet during 2002-2004 – and the reservoir levels shrank accordingly.
The first response, if a very tepid one, came in 2007. That agreement acknowledged shortages but provided no real response to the imbalance between supply and demand. Another response came in 2019. That was best seen as a temporary fix-it that fell short of the muscular responses needed. By then, many had begun to understand that “drought” was a less useful way to understand what was happening than “aridification.” Yes, drought was at work. That might change. Reduced flows caused by the human-induced warming temperatures — roughly 50% by one study released in 2017 — could not.
Even so, some warned that the 2019 agreement might not be enough should conditions intensify.
For several years, they did. By May 2022 a shelf in the wall of Glen Canyon created with railroad tracks emerged from the water. It had been submerged since shortly after completion of the dam in the 1960s.
Had 2023 been another bum snow year, the situation would have been dire indeed. Instead, 2023 was a bumper year for snow. Some in Colorado’s Yampa River Basin and its tributary, the Little Snake could remember nothing deeper. There was lots of snow. And, if not quite so much, a lot of runoff into Powell.
Which now leaves the reservoirs back to the levels they were in …. 2021.
Castle used the word “frantic” in describing the efforts to create solutions before the 2023 runoff created breathing room. With that small cushion, the Bureau of Reclamation, as manager for the two big reservoirs, Mead and Powell, issued a plan in March 2024 that was finalized on May 9. In this still-incomplete process, the federal agency adopted a proposal from the lower basin states as its preferred alternative for governing the river until 2026.
What happens then in 2026?
This is the work that some thought needed to be undertaken in 2017. Everybody with an interest has a proposal: the states, the 30 tribes that have 20% to 25% of water rights in the river (but have to a substantial extent not developed them), the major agriculture organizations, the major municipal providers, the environmental groups, and still others.
Castle described the ideas. The most important element of the proposal from the three lower-basin states, she said, is that if the reservoirs are at 23% to 38% full – where they are now and are likely to be under even the more optimistic scenarios – then reductions of 3.9 million acre-feet are to be shared between the upper and lower basins.
Not surprisingly, the upper basin sees the onus for reductions differently. Colorado along with Wyoming, Utah, and New Mexico have no big, big reservoirs. They have no big checking accounts. They have smaller reservoirs, Blue Mesa being the largest in Colorado, with 800,000 acre-feet in storage. Powell has more than 25 million acre-feet and Mead more than 30. The upper basin states are limited by what nature delivers in any given year or sequence of years. They live hand to mouth.
The tribes, meanwhile, are very concerned about impacts to their water rights. Castle did note the recent signing of an MOU among the four upper-basin states and the six upper-basin tribes. She called it a “significant milestone in the inclusion of tribal voices.”
Tribes have never really had a seat at the table. They had no representatives in Santa Fe in 1922 when the river was carved up, nor in the 1948 Upper Colorado River Basin Compact. Amazing to many, they have not even had a formal position in river proceedings in the 21st century until the MOU that Castle referenced.
Schmidt called for bigger shift in how we view the Colorado River. “Ann emphasized the nature of all these different proposals,” he said. “The upper basin says we’ll be damned if we’re going to cut a drop because we use less than half of what you guys use downstream. But on the other hand, of the 40 million people who use water from the Colorado River, half are in southern California. When we talk about equity, there’s a lot of different ways to define equity. And one of those ways is by the agreements set a 100 years ago of 7.5 (million acre-feet) used by each basin. But obviously, given the population distribution and the economic importance of the lower basin, you could argue the principle of equity in many different ways. That’s something worth thinking about.”
Topping Schmidt’s values – what he considers most important — is restoring water to the delta of the Colorado River. Not the full amount, because that is clearly impossible, but enough to create a semblance of the ecosystem that disappeared gradually over the last century.
“Ironically, the largest city that sits on the banks of the Colorado Rivers is not in the United States. It’s in Mexico. And that city is San Luis Rio Colorado. The river at that point is bone dry. That tells you all you need to know about the Colorado River. It is fully tapped. Not one drop of water makes it to the sea in most years. So when we talk about a declining supply in a river where nothing gets to the ocean already, then we have a problem.”
Almost no water has flows through the Colorado River Delta since the late 1990s and only sporadically before that after the 1970s. February 2017 photo at San Luis Rio Colorado/Allen Best
Lost at the delta, he said, was the “most biologically diverse ecosystem in North America.”
Where does Schmidt propose to get this water? He didn’t go into details. He only painted with broad brushes what those who know much about the Colorado River Basin already understand: agriculture uses half the water in the basin (higher in some states). And this isn’t necessarily for growing cantaloupes and cabbage — although, of course, the Imperial Valley and Yuma areas provide the great majority of vegetables consumed in the United States and Canada during winter, by some estimates around 90%.
Even during those months, though, much is going to livestock.
“A vast majority of the water in agriculture is used for livestock feed, either in the production of beef, in particular, but also in dairies. This is not what is being negotiated. This is important, I think, for every citizen to understand. I’m going to overstate this, because I’m that kind of guy – we’re trapped in a hundred years of thinking about this in a legal construct and we celebrate that we are a nation of laws. But the flip side is we’re using all this water in agriculture for heaven’s sakes. We’re using all this, a large part of this water for livestock feed. We’re not using this primarily in the big cities. And someday the negotiation about the future of the Colorado River inevitably will have to shift to a discussion about using water by economic sectors, not by using water in an upper or lower basin.”
Schmidt suggested that the legal framework was not the central issue that environmental groups should be talking about.
“We’re not talking about the big issue,” he said. “The big issue is what economic sectors are using water. As Marc Reisner, the author of Cadillac Desert, said long ago, the American West doesn’t have a water supply crisis. The American West has a water allocation crisis, but this is an issue that people won’t touch.”
Writer’s note: I have gone to dozens of water conferences over the years, and this two-hour session was by far the most productive use of time I’ve invested in the Colorado. To see the full two-plus-hour session (and see the PowerPoints that the speakers used), go to this address and then plug in this password. 6.!BFDW* These slides are used courtesy of the speakers.
…according to a briefing Tuesday in a webinar called the Intermountain West Drought and Climate Outlook, Utah can look forward to hotter than normal summer temperatures from June through August…The drought particularly impacts the Four Corners region, roping in Colorado, Arizona, New Mexico and Utah, which may be in a particular struggle as the months progress. Conversely, the bulk of Utah in its current conditions were highlighted in blue — a good thing — but as conditions persist over the summer, rangeland conditions could change. That means impacts to growing seasons, and available forage for rangeland and ranching. And maybe the water for your lawn…
West Drought Monitor map May 21, 2024.
If you look at the current map of drought conditions of the Western United States released by the U.S. Drought Monitor, it shows Utah in pretty good shape — for now…The Pacific Northwest has it worse than us, as does Arizona and New Mexico.
One hundred and one years ago, my Ute ancestors were forced to live within a barbed-wire camp in Blanding, a small town in southeast Utah.
For six weeks, nearly 80 people were trapped in a cage, sleeping in tents and hastily constructed hogans. Only meager meals were provided, and the captors sometimes tossed food over the fence.
Like the infamous Japanese American prison camps during World War II, the only crime my relatives committed was belonging to a group of people that the white majority deemed a threat. There was no due process for Japanese Americans or for the Utes.
But while Japanese American incarceration sites, including the Topaz Camp near Delta, Utah, have memorials to the victims, there are no plaques or interpretive displays in Blanding acknowledging the suffering my ancestors endured.
In fact, the events that led up to their imprisonment are best known by misleading names like the “Posey War” and the “Last Indian Uprising.” My ancestor, William Posey, was a leader in the Anikanuche Band who continued traditional hunting across the vast Canyonlands and Bears Ears region into the 1920s, long after many other Indigenous people had been forced onto reservations.
On March 19, 1923, two Ute men were convicted for the alleged raiding of a shepherd’s camp. After an altercation with the San Juan County sheriff, the two men fled and joined their families.
They escaped over Comb Ridge into what is now Bears Ears National Monument. A posse of 50 armed white settlers pursued the Ute people on horseback and in a Model-T Ford. County commissioners also requested an airplane equipped with WWI bombs for use in the chase. Before a plane arrived, the posse found the families, forced them into trucks at gunpoint, then transported them to the barbed-wire stockade in Blanding.
I tell this story because the jailing of Ute people 101 years ago had devastating consequences for my community and healing is necessary even today.
Two Ute men were murdered, including Posey. Ute children were among those shipped to Indian Boarding Schools, separating families and cutting off traditional teachings. As a condition of release, prisoners in the camp had to sign allotment papers for small parcels of land that relinquished their claims to the large Ute reservation that had once been proposed for nearly all of San Juan County.
These events were tragic but they were not a “war” or an “uprising.” Like the Long Walk of the Diné people in 1864, or the Trail of Tears that began in the 1830s, my Anikanuche ancestors were subjected to brutal settler violence in Utah, which had no similarities to a war fought between two nations’ militaries.
Despite these injustices, my people carry on what we call a Legacy of Resilience, and last year the Ute Mountain Ute community of White Mesa began telling our side of the story for the first time.
I was selected to direct the 100 Years of Silence project, and I’ve been working with elders, historians and artists to facilitate healing. We’ve hosted many meetings to listen to community members talk about this history. Seven local artists produced pieces now on display at The Leonardo Museum of Creativity and Innovation in Salt Lake City until May 28. On March 23, we hosted a public launch for the project with presentations from 18 Ute Tribal members.
Throughout the process, I’ve been inspired by the courage and wisdom of my community. Our collective effort aims to end a century of silence to usher in an era of recognition and empowerment for all sides.
As the 101st anniversary of the Anikanuche incarceration drew to a close last month, we hoped Utahns would begin to acknowledge the events of 1923. We ask that those awful weeks no longer be referred to as the “Posey War,” a term based on misinformation that spread as the events unfolded. The 100 Years of Silence project is currently seeking input from the White Mesa community to rename this series of traumatic events.
Shaun Ketchum Jr.
Perhaps one day, a memorial could be installed on the site of the incarceration camp that is near the historic bank building that still stands in Blanding. As the Ute scholar Forrest Cuch reminded us at the anniversary, healing cannot occur until the truth is known and accepted.
Shaun Ketchum Jr is a contributor to Writers on the Range, writersontherange.org, an independent nonprofit dedicated to spurring conversation about the West. He directs the 100 Years of Silence project and is a member of the Ute Mountain Ute Tribe.
Navajo Nation President Buu Nygren signed a historic water settlement with the federal government on Friday, the day after the Navajo Nation Council approved it unanimously. Speaker Crystalyne Curley said she believes Congress will support the measure, finally bringing the promise of water for thousands of people. The Northeastern Arizona Indian Water Rights Settlement Agreement, once passed by Congress, will settle the Navajo Nation’s claims to water rights to all Colorado River water in Arizona.
The separate Rio San José Stream System Water Rights Settlement Agreement will settle water rights claims in the Rio San José Stream System and the Rio Puerco Basin in New Mexico for the Navajo Nation if considered by Congress…
Included in the agreement is proposed funding of about $5 billion to build essential water projects required by the Navajo Nation, money that would require appropriations by Congress.
After the 25th Navajo Nation Council took office, along with Nygren and Vice President Richelle Montoya, a consensus emerged to address water rights claims, initiating discussions that had dragged on for years. Leaders emphasized that the effort was a collaborative endeavor involving Navajo Nation leadership, the Navajo Department of Justice, the Navajo Attorney General’s office, the Navajo Department of Water Resources and the Navajo Nation Water Rights Commission.
The states are currently negotiating how the river and its reservoirs should be operated after current agreements expire in 2026.
This article is published through the Colorado River Collaborative, a solutions journalism initiative supported by the Janet Quinney Lawson Institute for Land, Water, and Air at Utah State University.
Another point of agreement between the basins: states should use actual hydrologic conditions to determine how to operate the country’s two largest reservoirs, Lake Powell and Lake Mead, instead of unreliable forecasts.
Ridgway’s Rail. Photo: Robert Groos/Audubon Photography Awards
Click the link to read the release on the Audubon website (Jennifer Pitt):
May 21, 2024
The Colorado River is flowing again in its delta. While this is welcome news for birds and people, the long-term progress to keep the Colorado River alive in Mexico with habitat restoration and water deliveries depends on high stakes negotiations currently underway.
For the third time since 2021, the United States and Mexico are collaborating to deliver water to improve conditions in the long-desiccated delta. Environmental water deliveries began mid-March and will continue into October, ensuring the river flows through the summer’s heat, making restored riverside forests and wetlands more hospitable to birds like Abert’s Towhees and Crissal Thrashers and other wildlife including beavers and lynxes. We know that birds rely on water in the Delta as they migrate to locations all over the United States.
Restoration in the Colorado River Delta is implemented by Raise the River, a coalition of NGOs including Audubon, in partnership with U.S. and Mexican federal agencies. Funds, water, and collaboration for this work were committed first in Minute 319 and again in Minute 323, the United States–Mexico treaty agreements that have been widely hailed for modernizing Colorado River management with a host of benefits to water users in both countries including rules for sharing water shortages, as well as work to use relatively small volumes of water to revive the delta for wildlife and people. The terms of Minute 323 sunset in 2026, but delta restoration efforts remain a work in progress.
The good news: the United States and Mexico are poised to negotiate a successor agreement to Minute 323 in parallel with new federal rulemaking in the United States for Colorado River management. Domestic Colorado River rules, like the binational agreements, have for decades been the result of consensus-based negotiations, in this setting between the seven Colorado River Basin States with concurrence of the U.S. Bureau of Reclamation. This domestic rulemaking also has a 2026 deadline.
The bad news: at the moment, the Colorado River Basin states appear to be nowhere near consensus, with disagreements about which states, and which water users, will cut back when there’s not enough to satisfy all. These are difficult and high stakes negotiations. Failure to reach agreement increases the risk of water supply crises and could even throw the dispute in front of the U.S. Supreme Court.
That brings me back to the Abert’s Towhees and Crissal Thrashers, the beavers and lynxes in the Delta. If the Colorado River Basin states fail to reach consensus, there’s considerable risk that the work of restoring the Colorado River in its delta comes to a halt. Delta restoration depends on binational consensus, and binational consensus depends on a U.S. domestic consensus. It’s an extraordinarily complex decision-making framework for governance of water supply for 40 million people. The failure to reach consensus may create problems for some people who use Colorado River water, but it is certain to create collateral damage in Colorado River ecosystems including the Delta.
Two key takeaways from Monday’s (May 13, 2024) Middle Rio Grande Conservancy District board meeting:
El Vado Dam, crucial for managing irrigation, municipal, and environmental water through New Mexico’s Middle Rio Grande valley, will be out of service indefinitely – for many, many years.
The vague structure of alternative storage options, using other existing dams, is beginning to take shape.
El Vado, built in the 1930s on the Rio Chama, has been out of service since 2022 for rehabilitation work by the US Bureau of Reclamation’s dam safety program. Challenges in fixing it have sent Reclamation’s engineering team back to the drawing boards. Work was supposed to be done by 2025. It’s now clear that the dam will be out of service for the foreseeable future.
Without the ability to store some of each year’s spring runoff for use in late summer and fall, the Rio Grande through Albuquerque is at the mercy of summer rains, without which it will dwindle to near nothing every year unless or until El Vado is fixed or we sort out alternative storage arrangements.
More on this part – the status of trying to fix El Vado – in a separate post to come later (once I write it I’ll add a link here), because the more important bits at Monday’s meeting involved the first cagey public discussions about what we will do in the meantime.
EXPLORING WATER STORAGE ALTERNATIVES FOR THE MIDDLE RIO GRANDE
The always quotable Socorro farmer and MRGCD board member Glen Duggins offered a simple plea: “Just give us somewhere to park our water.”
Much of Monday’s discussion – sometimes explicit, sometimes in coded language – focused on this question.
If you look at the monthly reservoir storage graphic from Reclamation printed as a handout for Monday’s meeting (printed as a handout for every meeting), you’ll see there are two other reservoirs flanking El Vado upstream and downstream, and they have enough empty space in them to make up for most, if not all, of El Vado’s now unusable ~180,000 acre feet of capacity.
Abiquiu Reservoir currently has ~100,000 acre feet of available storage space
Heron Reservoir has ~300,000 acre feet of available storage space
But the details of using them for this new purpose, storing Middle Valley irrigation and environmental water, which is different than the purposes for which they were built, are staggeringly tricky.
Abiquiu
Abiquiu Reservoir, built in the 1960s by the U.S. Army Corps of Engineers on the Rio Chama as part of a massive federally funded project to protect the Middle Rio Grande Valley from flooding, is huge.
In 1981, Congress authorized a change in use to allow imported San Juan-Chama water to be stored in Abiquiu – up to 200,000 acre feet. (It requires an act of Congress.) Subsequent to that, the Albuquerque Bernalillo County Water Utility Authority got a storage permit from the New Mexico Office of the State Engineer (Storage requires a state permit, I hope you can see what I’m doing with the parentheticals.) to store its SJC water in Abiquiu. Then in 2020 another act of Congress did something I’m a bit confused about that allowed native water storage, not just San Juan-Chama water, and maybe more than the 200,000 acre feet, I think (Note: Another act of Congress required.) And then the Army Corps of Engineers had to rewrite its water operations manual, which nearly four years later is just now being completed. (It requires not only an act of Congress to change the purpose of use at Abiquiu, but also a lengthy Corps process to rewrite its rules.)
My Utton Center colleagues are far smarter than I about these institutional nuances – Utton has long worked on the legal plumbing – but I wasn’t about to wake them up at 6 in the morning, so you’re stuck with me.
So yes, there is space in Abiquiu for us to park our water. But the rules tangle is of Gordian proportions.
Heron
Upstream, Heron Reservoir sits on a tributary to the Chama, built in the 1970s to store water imported beneath the continental divide from three Colorado River headwaters streams. It seems ill-suited for storing Rio Grande water.
It currently holds ~100,000 acre feet of imported San Juan-Chama project water, with room for another ~300,000 acre feet. (Note bene: I’m rounding all the numbers off here to one or a few significant digits.) The trick here is to hold the San Juan-Chama water in Heron and then do a series of carryover accounting and maybe native water swaps that I can’t begin to understand, let alone explain, in order to kinda sorta use Heron as well.
THE NEGOTIATIONS
One of the reasons the discussions about all of this at yesterday’s board meeting were kinda vague is that the three parties crucial to cutting the Gordian tangle – MRGCD, the Bureau of Reclamation, and the Albuquerque Bernalillo County Water Utility Authority – are in negotiations about what sort of parenthetical agreements might be needed to make it all work.
They need space to sort out thorny incentive problems – the interests of the municipal water utility to protect and manage its own municipal supply will be key. In this regard alone, it my be in the water utility’s best interests to help. Low late summer river flows, which are inevitable without storage, force the utility to switch to groundwater pumping to get water to my tap. As a result, the aquifer recovery, of which we are rightly proud in Albuquerque, has stalled.
Also key will be the broader community interests of flowing ditches and a flowing river, which while not directly related to ABCWUA’s water supply nevertheless may be things the water utility’s board members – city councilors and county commissioners – care about.
The typically blunt Duggins was unusually cryptic at Monday’s meeting, but I infer this is what he was talking about when he said: “We’re neighbors. I don’t understand why it would take a year or two to get papers signed.”
Spawning Salmon in Becharof Stream within the Becharof Wilderness in southern Alaska, USA. By U.S. Fish and Wildlife Service – US Fish & Wildlife Service – [1], Public Domain, https://commons.wikimedia.org/w/index.php?curid=3525119
Click the link to read the article on the NOAA website:
May 22, 2024
NOAA is recommending nearly $240 million in funding for 46 fish passage projects this year, as well as an additional $38 million in funding in future years. The projects are funded under the Biden-Harris Administration’s Bipartisan Infrastructure Law and Inflation Reduction Act. With this historic level of funding, our partners will reopen migratory pathways and restore access to healthy habitat for fish across the country.
Twenty-one of these projects—more than $112 million in funding—will be led by tribes and tribal organizations. This will include projects for fish passage and for building tribal organizational capacity. In addition to projects led by tribes, more than half of the remaining projects will directly involve tribes and are aligned with tribal priorities. Across these projects, tribes will:
Play key roles in decision-making,
Build capacity to help recover tribally-important migratory fish
Provide community and economic benefits such as jobs and training opportunities
These projects will help recover endangered migratory fish and support the sustainability of commercial, recreational, and tribal fisheries. They will also support coastal communities by:
Removing derelict and unsafe dams
Removing contaminated sediments
Improving opportunities for recreation
Adapting to climate change by reducing flooding and improving threatened infrastructure
This funding builds on the more than $166 million awarded for 36 projects through our first round of fish passage awards, which will provide significant benefits to endangered migratory fish and sustainable fisheries.
Tribal Priority Fish Passage Projects Recommended for Funding
These projects will support tribes in their role as managers and stewards of tribal trust resources for cultural, spiritual, economic, subsistence, and recreational purposes. They will support tribally important fish passage barrier removal projects and help to increase tribal capacity to participate in developing current and future fish passage projects.
These projects will help restore access to healthy habitat for migratory fish across the country through efforts, including:
On-the-ground fish passage restoration
Engineering and design
Future project development
Building the capacity of new and existing partners to design projects and manage multi-faceted restoration efforts
Fish Passage and NOAA
Every year, millions of fish migrate to their spawning and rearing habitats to reproduce. Some fish need to swim thousands of miles through oceans and rivers to reach their destinations. They are often blocked from completing their journey by barriers like dams and culverts. When fish can’t reach their habitat, they can’t reproduce and maintain or grow their populations. As a result, many fish populations have declined. NOAA works to reopen these migratory pathways, restoring access to healthy habitat for fish.
NOAA’s Office of Habitat Conservation has a long history conducting habitat restoration efforts, including fish passage, with large-scale competitive funding opportunities and expert technical assistance through our Community-based Restoration Program. The Bipartisan Infrastructure Law and Inflation Reduction Act provide a historic opportunity for us to continue supporting fisheries, protected resources, and coastal communities. In our first round of funding opportunities, we awarded more than $480 million for 109 projects across the country through this funding.
Lincoln Creek flows into Grizzly Reservoir and is a source of drinking water for Colorado Springs. Experts say mineral concentrations are increasing in streams across Colorado due to climate change. CREDIT: HEATHER SACKETT/ASPEN JOURNALISM
Colorado’s mountains are pockmarked with orange tailings piles, adits, tunnels and rusted tramways, the remnants of a historic mining industry often blamed for fouling the state’s waterways.
But a recent study points the finger at a different culprit as the cause of increasing metals concentrations in Colorado’s high mountain streams: climate change. And these findings have implications for local ecosystems and the water supplies of mountain communities.
Scientists from the U.S. Geological Survey and the University of Colorado Boulder analyzed water chemistry data over the past 40 years for 22 stream sites throughout Colorado’s mountains. They found that concentrations of zinc and copper have doubled over the past 30 years, with melting of previously frozen ground being a likely major cause.
“These trends are concerning because, even at low concentrations, dissolved metals can negatively affect downstream ecosystem health and the quality of water resources,” reads the paper, which was published in Water Resources Research in late April.
Tanya Petach, a climate scientist at the Aspen Global Change Institute, worked on the study. She said the trend of increasing metals concentrations is relatively steep and widespread across Colorado’s mountains.
“There’s this theory that those increases in metal concentrations in these streams are really driven by a climate change signal,” Petach said. “We are really used to tying increases in metals to mining activities, but in this case, we’re only seeing a climate response.”
The process that causes metals leaching into streams can be both naturally occurring and caused by mining activities. In both cases, sulfide minerals in rock come in contact with oxygen and water, producing sulfuric acid. The acid can then leach the metals out of the rock and into a stream, a process known as acid rock drainage. As temperatures warm, rock that has long been encased in ice becomes exposed to weathering.
“These high-elevation streams, some of them have mean annual air temperatures right around freezing,” Petach said. “So you go from having permafrost to melting that permafrost. Once you lose the ice, you’ve created a phenomenal conduit for new water and oxygen to come into contact with sulfide minerals that have been blocked for centuries, if not millennia.”
Diane McKnight, an environmental engineering professor at CU Boulder’s Institute of Arctic and Alpine Research, has been measuring the pH levels of the upper Snake River in Summit County for decades. On a recent trip with students, a stream that usually had a pH level of about 4 measured 2.75, meaning the acidity had greatly increased.
“I said: Wait, the probe must be wrong, the probe must be broken,” McKnight said. “Guess what, the probe was not broken. … The public should be aware the world is changing and there are surprises.” [ed. emphasis mine]
The study says declining streamflows are also contributing to increasing metals concentrations, but not as much as the increase in acid rock drainage caused by climate change.
This map shows 22 stream sites throughout Colorado’s mountains where scientists from the U.S. Geological Survey and the University of Colorado Boulder analyzed water chemistry data over the past 40 years.
Lincoln Creek similarities
These findings on the Snake River and other sites in Colorado are important for the members of a workgroup trying to figure out how to address increasing metals concentrations in Lincoln Creek above Aspen. Although Lincoln Creek wasn’t one of the sites included in the study, the conditions in Lincoln Creek mirror many of the headwaters study sites.
“Lincoln Creek is very intriguing because it matches a similar pattern,” Petach said. “The Lincoln Creek system seems fairly similar to a lot of these other high-elevation headwaters catchments where this occurs.”
Water quality issues in Lincoln Creek have been a concern for years and have been getting worse. A November report by the U.S. Environmental Protection Agency showed that metals concentrations in Lincoln Creek are high enough to be toxic to fish and aquatic life. The creek above Grizzly Reservoir exceeds state water quality standards for aluminum, cadmium, copper, iron, lead, manganese and zinc, and aluminum and copper concentrations were higher than standards set by the Colorado Department of Public Health and Environment (CDPHE) in multiple locations.
The report found that the vast majority of the contamination was coming from a “mineralized tributary” to Lincoln Creek and not from the nearby Ruby Mine, where prospectors in the early 1900s dug for gold, silver and lead.
A workgroup dedicated to Lincoln Creek and composed of officials from state, local and federal agencies, nonprofit environmental groups and others has been meeting often since the EPA report was released. Since the EPA is authorized to address elevated metals concentrations only from human-caused activities like mining, it’s unclear how the contamination would be cleaned up or what agency is responsible for it.
But the workgroup is making headway on the issue, said member Karin Teague, executive director of the nonprofit environmental group Independence Pass Foundation.
“It could be a model for how a community might respond to contamination in its watershed,” Teague said. “We are really getting our arms around the problem, the extent of it, the nature of it, and then, of course, the million-dollar question being: What, if anything, can be done about it?”
Pitkin County Environmental Health Manager Kurt Dahl and Pitkin County Healthy Rivers Administrator Lisa Tasker gave an update on the group’s progress to county commissioners at a work session Tuesday. There are plans for four different water quality projects this summer: the U.S. Forest Service plans to collect water quantity and flow data; Colorado Parks and Wildlife will monitor metals concentrations in Lincoln Creek and the Roaring Fork River; the Roaring Fork Conservancy will take samples below Grizzly Reservoir to look for impacts related to a Grizzly Dam rehabilitation project; and scientists and students from CU’s INSTAAR program will look for rare earth metals in the water, sediment and bugs of Lincoln Creek. Pitkin County has approved grants for three of the four projects so far.
Grizzly Reservoir was a bright shade of turquoise in September 2022. The man-made alpine lake has high concentrations of metals that are toxic to fish, according to a report from the Environmental Protection Agency.
CREDIT: HEATHER SACKETT/ASPEN JOURNALISM
What about the water supply?
Lincoln Creek is one of seven streams in the Roaring Fork basin’s headwaters that feed the Twin Lakes Reservoir and Canal Co.’s Independence Pass transmountain diversion system, which provides drinking water sources for Front Ranges cities, including Colorado Springs, which owns a majority of the system’s water. Grizzly Reservoir, on Lincoln Creek below the contamination source, is used as a collection pool for water collected from the creeks, which is sent through the Twin Lakes Tunnel to the Arkansas River basin and eventually to the Front Range. The Snake River system where McKnight has conducted research flows into Dillon Reservoir, Denver Water’s biggest storage bucket.
A map of the Independence Pass Transmountain Diversion System, as submitted to Div. 5 Water Court by Twin Lakes Reservoir and Canal Co.
The EPA report said that in the case of Lincoln Creek, the dilution, the distance the water travels and the water-treatment process limit the impacts to drinking water. But since the issue is widespread across Colorado’s mountains, communities that get their drinking water from high-elevation streams could be impacted.
“These metal concentrations tend to be diluted when the small tributaries confluence with larger, cleaner streams, so we don’t tend to think of these as being a huge problem for large municipal water supplies,” Petach said. “But the place where it could impact the drinking water supply is in high-elevation mountain communities that are receiving waters from smaller tributaries.”
The city of Aspen gets the majority of its drinking water from Castle Creek, a mountainous tributary of the Roaring Fork River. Aspen’s Utilities Resource Manager Steve Hunter said that source water protection is a key concern for the city.
“After talking with our water treatment staff, they are not seeing a rise in these metals at the treatment plant and all treated water meets or exceeds CDPHE/EPA requirements,” Hunter said in a prepared statement. He added that the city has not done source water sampling for these compounds in either Castle or Maroon Creek watersheds as CDPHE/EPA does not require testing Aspen’s source water for these compounds.
It wasn’t exactly the news anyone wanted to hear, but the West’s two-year snowpack party looks like it may be coming to an end for a while.
According to a report from the National Weather Service’s lead forecaster, the Southwest is in line for the effects of a strong “La Nina” condition in the eastern Pacific Ocean, indicating drier-than-normal months to come.
“We’re seeing the first vestiges of a La Nina effect now,” said Mark O’Malley of the National Weather Service at a meeting of the Drought Interagency Coordinating Group on Tuesday. “It’s going to be the largest climate driver of the next 12 months.”
The Interagency Coordinating Group (ICG) is an advisory body to the Governor on Arizona drought issues, co-chaired by the ADWR Director.
It’s comprised of state, federal and non-governmental organizations, and meets twice a year to evaluate drought conditions in Arizona and across the West and to consider recommendations to the governor.
To exactly no one’s surprise, the ICG panelists chose to recommend to Governor Hobbs that the state’s Drought Emergency Declaration be continued for at least until the next meeting of the panel six months from now.
“My viewpoint is that we’ll be recommending to the Governor to continue the Drought Declaration,” said ADWR Director Tom Buschatzke at the meeting’s end as he watched panelists nod in agreement.
The U.S. Southwest has experienced two consecutive healthy seasons of moisture, including a near-record setting 2022-2023 winter snowpack season, as well as coastal storms that brought dozens of “atmospheric rivers.” Now, the forecasters say that we could be facing a dry spell. How likely is it? Alas, their computer modelling projections are telling them that it is looking pretty certain.
“We’re seeing fairly good agreement in models,” observed O’Malley. “Normally we see uncertainty. We see that July, August and September will be dipping into La Nina and in the fall we’ll be falling into a full La Nina state.”
The region is looking at a “better than 80 percent chance of a full La Nina in 2024-2025 Winter,” he said, with the odds tilted in favor of above normal temperatures.
The Phoenix area is looking at a 60 percent chance of above normal temperatures this summer, a trend the south-central part of the state has been experiencing for a long time.
“Last summer was quite warm and there is no sign of this slowing down anytime soon,” he said.
North American Monsoon graphic via Hunter College.
On the plus side, O’Malley said Arizona can anticipate “a fairly average monsoon” in terms of rainfall, but that, overall, a La Nina winter produces below average water years and warmer temperatures.
This U.S. Drought Monitor (USDM) week saw widespread improvement in drought-related conditions on the map across areas of the South, Plains, Midwest, Mid-Atlantic, and the West. In the Plains and Midwest, locally heavy rainfall accumulations (up to 7 inches) were observed in drought-affected areas of Oklahoma, Kansas, Nebraska, Missouri, and Iowa leading to continued improvements of conditions on the ground (vegetation health, soil moisture, surface water) as well as reductions in the longer-term precipitation deficits. Likewise, above-normal precipitation during the past several months led to removal of areas of drought on the map in Michigan’s Upper Peninsula as well as in southern Wisconsin. In the South, isolated areas of central and west-central Texas saw minor improvements in response to recent rains and improving conditions during the past 30-day period. In the Mid-Atlantic, 1-6-inch accumulations were observed in areas of North Carolina and Virginia this week leading to removal of areas of Abnormally Dry (D0). Out West, some minor improvements were logged in central and northern Arizona where precipitation has been above normal since January 1. In southeastern Montana, recent rains erased Water Year (since October 1) deficits and have improved soil moisture conditions and vegetation health. Across the border in the Bighorn Mountains of north-central Wyoming, areas of Moderate Drought (D1) were removed in response to above-normal snowpack conditions observed in its associated drainage basins. In California, the state’s reservoirs are above normal levels moving into the dry season with the state’s two largest reservoirs (Lake Shasta and Lake Oroville) at 115% and 126% of their historical average for the date (May 21), respectively. In the Southwest, Lake Powell is currently 33% full (58% of typical storage level for the date) and Lake Mead is 35% full (62% of average) with the total Lower Colorado system at 42% full as of May 20 (compared to 37% full at the same time last year), according to the U.S. Bureau of Reclamation. In Arizona, the Salt River Project is reporting the Salt River system reservoirs at 95% full, the Verde River system at 70% full, and the total reservoir system at 92% full (compared to 99% full a year ago). In New Mexico, the state’s largest reservoir along the Rio Grande is currently at 23% full (59% of average). In the Pacific Northwest, Washington’s Franklin D. Roosevelt Lake is at 87% full (176% of average for the date). In terms of degradations on the map this week, the only noteworthy ones were made in areas of South Florida where areas of Moderate Drought (D1) expanded in response to dry conditions during the past 60-day period with reports of various impacts including burn bans, lake levels dropping at Lake Okeechobee, reduced soil moisture, and some minor impact in the recreation sector due to low surface water levels. Overall, looking at the broader drought situation across the conterminous U.S., the total percentage of drought coverage is at its lowest since 2020…
On this week’s map, Kansas, Nebraska, North Dakota, and the eastern Plains of Montana saw improvements in drought-affected areas. In Kansas and Nebraska, moderate to heavy rainfall accumulations (2 to 7+ inches) led to a reduction in areas of drought and provided a boost in soil moisture and streamflow levels. In North Dakota, areas of Moderate Drought (D1) were reduced in response to above-normal precipitation during the past 30-to-90-day period as well as numerous recent field reports coming into the National Drought Mitigation Center’s Condition Monitoring Observer Reports (CMOR) system. According to the USDA (May 19), statewide pasture and range conditions rated good to excellent are as follows: North Dakota 68%, South Dakota 83%, Nebraska 56%, and Kansas 42%. According to the latest USDA Kansas Crop Progress and Condition Report (May 19), winter wheat condition was rated 11% very poor, 20% poor, 36% fair, 30% good, and 3% excellent. In terms of NOAA NCEI’s regional climatological rankings, the Great Plains Region observed its 44th wettest (near normal) and 12th warmest (+3.9 degrees F anomaly) January-April period on record…
Drought Monitor one week change map ending May 21, 2024.
Out West, some minor improvements were made on the map in central and northern Arizona, eastern New Mexico, southern Colorado, southern Nevada, north-central Wyoming, and southeastern and central Montana. Looking at precipitation across the region, the start of the Water Year was not looking good with most of the region experiencing below-normal precipitation levels. However, the period from January 1 to current (May 21) was much more promising with above-normal precipitation observed across much of the region, with the exception of areas of the Pacific Northwest including Washington, northern Idaho, and western and central Montana as well as areas of the Southwest (eastern New Mexico and northwestern Arizona). In terms of snowpack, the Natural Resources Conservation Service SNOTEL network is reporting (May 21) the following region-level (2-digit HUC) snow water equivalent levels (percent of 1991-2020 median): Pacific Northwest 73%, Missouri 100%, California 147%, Great Basin 137%, Upper Colorado 112%, Arkansas-White-Red 140%, Lower Colorado 232%, and Rio Grande 52%. For the week, conditions were very dry across the region except for some isolated, light shower activity in eastern portions of New Mexico, Colorado, Wyoming, and Montana…
Across portions of the region, the active pattern continued with significant rainfall accumulations observed in portions of eastern Texas, southern Louisiana, and southern Mississippi, where 7-day totals ranged from 2 to 8 inches. Moreover, beneficial rainfall continued to help ease drought-related conditions in areas of Texas and Oklahoma. On the map, isolated rainfall activity this week led to some minor improvements in north-central Oklahoma, while areas of central and west-central Texas saw minor improvements. According to Water for Texas (May 22), statewide reservoirs are currently at 77.3% full with numerous reservoirs in the eastern part of the state near capacity, while many reservoirs in the western half of the state are experiencing below-normal levels. In terms of pasture and range conditions across the region, the USDA (May 19) is reporting statewide pasture and range conditions rated good to excellent as follows: Tennessee 74%, Mississippi 65%, Arkansas 61%, Louisiana 61%, Oklahoma 57%, and Texas 33%. Looking at climatological rankings for the January 2024-April 2024 period, the region experienced its 19th wettest (+2.32-inch anomaly) and the 11th warmest (+3.2 degrees F anomaly) on record, according to NOAA NCEI…
Looking Ahead
The NWS Weather Prediction Center (WPC) 7-Day Quantitative Precipitation Forecast (QPF) calls for moderate-to-heavy rainfall accumulations ranging from 2 to 5 inches across areas of the eastern portions of the Southern Plains (Oklahoma), South (northeastern Texas, Arkansas, northern Mississippi, Tennessee, Kentucky) and the Midwest (Illinois, Indiana, Ohio) while lesser accumulations (1 to 2.5 inches) are expected in areas of the Upper Midwest, Mid-Atlantic, Northeast, and out West in isolated areas of the Northern Rockies, and eastern plains of Montana. Dry conditions are expected across California, the Great Basin, the Southwest, and the southern extent of the Intermountain West. Likewise, much of the Gulf Coast region is expected to experience relatively dry conditions. The Climate Prediction Center (CPC) 6-10-day Outlook calls for a moderate-to-high probability of above-normal temperatures across much of the South, Southeast, lower Mid-Atlantic, and northern portions of the Northeast. Likewise, above-normal temperatures are expected across most of the western U.S., with the exception of the Far West coastal areas from California to Washington where near-normal temperatures are expected. Conversely, below-normal temperatures are expected in eastern portions of the Central Plains and across much of the Midwest. In terms of precipitation, there is a low-to-moderate probability of above-normal precipitation across the South, Southeast, Mid-Atlantic, and Northeast, while below-normal precipitation is expected across most of the western U.S., Northern Plains, and areas of the Upper Midwest.
US Drought Monitor one week change map ending May 21, 2024.
Click the link to read the article on the Big Pivots website (Allen Best):
May 14, 2024
Ranchers in Colorado’s Yampa River Valley traditionally measured the severity of winters by snow accumulation on their stock fences. Plentiful accumulation put the snow at the top wire, making it a three-wire winter. Four wires have become the norm on stock fences. No matter. By early March 2023, those wires at the foot of Rabbit Ears Pass were covered too. The Yampa Valley was sublimely white. It was a winter like the old days.
As expected, runoff was big and thrashing. Creeks tumbling through Steamboat Springs in May spilled over their banks. Downstream 75 miles, the Yampa River at Maybell peaked on May 18 at 16,500 cubic feet per second, more than 200% the average peak streamflow at that gauging station.
What happened afterward was very different. By July, the Yampa’s meager flows in Steamboat so concerned water managers that they nearly closed the warming river to recreationists in order to protect fish.
Snow topped the stock fences at the foot of Rabbit Ears Pass on March 4, 2023. Photo/Allen Best
That big snowpack that resulted in head-high snowbanks along the streets in Steamboat? It produced a big runoff. But thievery had also occurred. Who or what absconded with the water? And how?
This mystery was not entirely new. April 1 snow depth in the Yampa and most of Colorado’s river basins has rarely correlated perfectly with runoff. Whether spring weather turns wetter and cooler or hotter and drier can alter the runoff dynamics. “There is always that component of what the temperature and precipitation regimes are from April 1 through July,” says Karl Wetlaufer, a hydrologist and assistant supervisor at the Natural Resource Conservation Service, the federal agency that delivers the longest-running and most-used runoff forecasts. “They really drive a lot of what those forecast errors end up being.”
SNOTEL automated data collection site. Credit: NRCS
Then, too, the traditional methods for measuring snowpack have fallen short. Data from snow telemetry (SNOTEL) sites, is collected automatically from stations across Colorado. But those stations are relatively few compared to the complex geography. One station provides insights about one station, not a whole hillside or mountain. They provide an index.
A climate that has turned warmer and some say weirder during the last 10 to 20 years has some water managers wanting new tools. Whether in the San Luis Valley or the Yampa River Valley, what lies on the ground on April 1 remains the best predictor of river flows come July, August and September.
Water managers, from ranchers and farmers to reservoir operators and city staff, though, want improved models and data that more completely reveal the complexity of what is happening. They want to better understand why a huge snowpack can, by July and August, be such a dud.
What’s up with soil cracks and a changing climate?
Patrick Stanko, at his ranch four miles downstream from Steamboat Springs, has been puzzling over changes since he was a boy in the 1970s and 1980s. Summers have become hotter, winters less cold. Snow is gone sooner.
“The big snow banks of winter just disappear,” says Stanko. Water disappearing into the atmosphere is not a new process. But higher temperatures exacerbate it, whether that loss is to sublimation, where snow transforms directly into a gas, or evaporation, where snow melts and that water enters the atmosphere as a gas.
Milk Creek, which flows through the ranch that has been in his family since 1909, had become intermittent in its flows. Late-season grasses that his 100 head of cattle graze have become sparser with lessening summer rains.
Most striking are cracks in the ground that Stanko has noticed in recent years. He believes they have something to do with the shifted summer dynamics — dynamics that have implications into the next year’s runoff.
North American Monsoon graphic via Hunter College.
“We don’t get the rains that we used to get,” he says. “You used to be able to set your clock by the monsoon that would come.”
Haying in the Yampa River and other high country locations traditionally began in July or early August. Rain storms arrived almost simultaneously. If the rain forced ranchers to leave the grasses to dry, it was also helpful. Stanko says hay is best with 10% to 14% moisture content. Now, the timothy hay, brome grass and dryland alfalfa he grows on his 600 acres is often too dry after being cooked by hot winds.
Alfalfa growing on the Ute Mountain Ute land in southwestern Colorado in October 2022. Photo credit: Allen Best/Big Pivots
Drying soils in fall have implications for spring runoff—the soils want their share of water first. That could bite into the total runoff, particularly in dry winters. Rainstorms in September have the reverse effect.
The 2024 Climate Change in Colorado report confirms many of Stanko’s observed changes. For example, summer precipitation has decreased 20% across northwest Colorado in the 21st century as compared to 1951-2000. Models suggest drier summers may become the norm — even with increased winter precipitation.
And warming has made the atmosphere thirstier. Evaporative demand is another name for this thirst. Warm air can hold more moisture than cool air. If nothing else changes, warmer temperatures increase evaporative demand.
The Climate Change in Colorado report, which was commissioned by the Colorado Water Conservation Board, cites a measure of evaporative demand called potential evapotranspiration (PET). It refers to the amount of water that would be evaporated or sublimated from the snow, soil, crops, and ecosystem if sufficient water was available. Between 1980 and 2022, PET increased 5% during Colorado’s growing season. When the ground holds less moisture, more of the sun’s energy heats the land’s surface and the atmosphere above it instead of evaporating moisture. This drives faster warming and lowers humidity.
Since 2000, streamflow across Colorado’s major river basins has been 2% to 19% less compared to the half-century before. Modeling studies have attributed up to half the declines to warming temperatures. And with declining streamflows, the need to make the most of available streamflows is heightened.
The Blanca massif, located just south of Great Sand Dunes, has been been a landmark for people for thousands of years. The #SnowMoon rising behind it is the full moon that occurs each February. Photo: NPS/Patrick Myers 2024
San Luis Valley and improved runoff forecasting
The story of dry conditions and low streamflows echoes 250 miles to the south in the San Luis Valley. There, water appropriation dates are older, elevations a little higher, and mid-summer temperatures a trifle toastier. Fifteen of the 20 hottest daily maximum temperatures recorded in Alamosa, including several in 2023, have occurred in the 21st century.
Snowfall in the San Juan Mountains largely determines how much alfalfa Cleave Simpson can grow on his farm south of Alamosa. The farm has water rights from 1879, but that isn’t senior enough to ensure reliable water deliveries, says Simpson, who is a Colorado state senator in addition to being a farmer and general manager of the Rio Grande Water Conservation District. State officials make adjustments to the water that can be diverted. “They do that every day,” says Simpson. “All in an effort to deliver to the state line as close as is possible the amount that we’re required to deliver.”
The Rio Grande Compact specifies how much water Colorado must deliver to downstream states. Depending on the year’s flows, Colorado sends between 35% and 70% of the Rio Grande’s water downstream. To ensure those deliveries, water managers must carefully calibrate flows they expect against demand from irrigators. Like those on the Yampa, water managers have wanted new ways of forecasting flows. “Because the old ways just aren’t working that well,” explains Craig Cotten, Colorado’s Division 3 water engineer, who leads administration in the Rio Grande Basin.
The old ways use primarily snow telemetry data, better known as SNOTEL data, which is automatically collected from stations across the state. That data is used to project flows using what Cotten describes as a “fairly simple regression analysis.” In other words, if X amount of snow in the past produced Y amount of water, then the same formula should hold today. But in the early 2000s, Cotten began to see that in some years, streamflow forecasts were not as accurate as he would have liked, he says.
Spruce beetle-impacted forest in Southwestern Colorado with moderate levels of tree mortality. Photo credit: Sarah Hart
What changed? Bark beetle infestations, by stripping trees of needles and exposing more snow to sunlight, altered runoff. So did wildfires, which in 2013 scarred 113,000 acres in Rio Grande headwaters areas. “That changed the dynamics of the forest system and how it related to the snowpack melting and running into the streams,” says Cotten, a 33-year veteran with Colorado’s Division of Water Resources. Dust-on-snow events work the same way. Dust blown from distant deserts accumulates on snow, drastically reducing the albedo, or reflectivity. The warmed snow melts more rapidly.
Overall flows have trended down. Flows on the Rio Grande at a gauging station near Del Norte, upstream from most diversions, averaged 8% less from 2000 through 2022 than during the preceding 50 years.
Snowpack in the Rio Grande’s headwaters in the San Juan Mountains was above average in 2019 and again in 2023, Cotten points out. But late-summer seasonal flows were below average. “Even in a good year, our farms and ranches struggle in the late season because we have below-average streamflow at that time.” And always, there’s the need to meet compact obligations, a task that Cotten says has become harder because of tightening water supplies.
The Dolores River between Rico and Dolores in southwestern Colorado on Memorial Day 2009. Photo credit: Allen Best/Big Pivots
With stretched water supplies, accuracy in forecasting is increasingly important. A new tool, the high-resolution LiDAR of Airborne Snow Observatories (ASO) has meant better data on the amount of water contained in snowpack, and has improved runoff projections. Through ASO, a plane flies over entire watersheds or basins, collecting snow-depth data. Flights in 2024 include the Conejos River – of help to Cotten — and the Yampa and Elk rivers.
“Whether it’s a county commissioner, a dam operator, or maybe Craig Cotten or another division engineer, their challenge is that they’ve got a forecast of runoff, timing and volume,” says Jeff Deems, a snow scientist and part-owner of ASO. “They need to operate their headgates, their allocation, their dam, et cetera, while recognizing that their forecast is uncertain and that there’s a range of outcomes that could be undesirable. They need to make the best decision possible under that uncertain framework.”
This map shows the snowpack depth of the Maroon Bells in spring 2019. The map was created with information from NASA’s Airborne Snow Observatory, which will help water managers make more accurate streamflow predictions. Jeffrey Deems/ASO, National Snow and Ice Data Center
ASO claims it can achieve 98% accuracy in forecasting the amount of water contained in snow, known as the snow water equivalent, or SWE, across large areas. Water managers across Colorado, with the help of state funding, are contracting with ASO to collect data and boost their forecasting.
“It opens up understanding of different physical processes related to the snowpack that otherwise we may not understand very well,” says Angus Goodbody, of ASO. Goodbody is a forecast hydrologist with the NRCS.
While this data is invaluable to many water managers, NRCS can’t yet use ASO data in its modeling. But NRCS, too, is rolling out a new forecast system this winter. Goodbody describes the forecasting tools as improving incrementally. By using various forecasting tools and models to analyze data, NRCS aims to mitigate “the vulnerability of any one of those models on their own,” he says.
If a liquid like water is present in a way of tiny drops, in air, in a substance or on a surface we called it as moisture. But it is very difficult to define the “soil moisture”. Normally, soil moisture can be defined as the water that retain in between the spaces of the soil and rock particles. This is of two types. Those are: surface soil moisture; and, root zone soil moisture. Credit: Modern Farming
Digging into soil moisture
New tools have also topped Andy Rossi’s wish list for the Yampa. From the Steamboat Springs office of the Upper Yampa Water Conservancy District, where he has been the district’s general manager since 2020, Rossi directs operations of the district’s two upstream reservoirs, Stagecoach and Yamcolo, which provide water to ranches and municipalities, including Steamboat Springs.
When he started working for the Upper Yampa district as an engineer in 2009, runoff forecasts were “becoming more and more unreliable and really difficult for us to get our arms around what was going on in the basin,” he explains.
Temperature records for the Yampa Basin were very good. Soil moisture records? Not so much. Runoff predictions from past years mentioned soil moisture but relied solely on models. “There was no direct measurement of soil moisture going into our forecasting,” Rossi says. He decided the Yampa Valley needed more diverse measuring infrastructure to better collect data about soil moisture and atmospheric processes in order to see if and how soil moisture factors into runoff. Were dry soils sapping runoff, preventing it from reaching rivers? The puzzle was missing pieces. Integrating more non-snow data into runoff projections might result in better forecasts.
A partnership began to coalesce in 2018 between the Yampa Valley Sustainability Council, Colorado Mountain College, and the Scripps Institution of Oceanography’s Center for Western Weather and Water Extremes. Guided by a team of 15, the collaboration yielded a pilot soil moisture and weather monitoring station in September 2022 near Stagecoach Reservoir. In 2023, with aid from the Colorado Water Conservation Board and the Colorado River District, two additional stations were installed in the basin. The team in early 2024 was working on six more stations upstream of Craig. The stations collect continuous soil moisture measurements and data on meteorological conditions with the goal of sharing that data so that stakeholders can make management choices about changing water supplies.
The aim, in part, was to generate new and valuable data that wasn’t being collected elsewhere, says the sustainability council’s Madison Muxworthy, the project manager. “We didn’t want to duplicate existing efforts, such as SNOTEL stations,” she says.
The sustainability council has collaborated with the NRCS to install more soil moisture sensors at SNOTEL stations to go along with snowpack, precipitation and temperature data. The team will install four stations this summer and two more in 2025.
It’s still too soon to know the results of this monitoring. Measurements obtained from these new stations may reveal short-term changes, but other insights may require 10 to 20 years of data.
A similar network of soil moisture stations already exists in Colorado’s Roaring Fork Valley. There, 10 stations have been installed in an elevation band of 5,880 feet from Glenwood Springs to above 12,000 feet at Independence Pass. All stations have sensors to monitor soil moisture at depths of 5, 20 and 50 centimeters, and monitor soil temperature at 20 centimeters deep. They also record air temperature, relative humidity, rainfall, and more, recording measurements at least hourly.
This network was created by the Aspen Global Change Institute in response to local interest in measuring soil moisture in the Roaring Fork watershed. In 2012, as bark beetles proliferated, scientists at a small meeting on forest health identified soil moisture as a critical, understudied component of ecosystem vitality. With more than a decade of measurements, the data may help answer questions about hydrology and ecology in mountain systems.
A rambunctious Fryingpan River in the vicinity of Norrie was in a hurry to get to Ruedi Reservoir in late June 2018. Photo credit: Allen Best/Big Pivots
Key research questions for the Roaring Fork network include how will climate change impact water availability and timing in the watershed? And how can in-situ soil moisture data be used in water supply forecasts and models to better inform decision making for water managers and cities?
Elise Osenga, the Aspen Global Change Institute’s community science manager, stresses the complexities of runoff now further confused by climate change. Soil moisture plays a role, but it’s among many factors.
“You’re trying to predict the future based on how conditions played with each other in the past,” explains Osenga. “And now in the future, different wrenches will be thrown into the system where the past may not be a perfect representation.”
If dry soils only tell a small percentage of the story of this runoff thievery, that’s where the institute’s microscope is being applied. “Finding the quantitative relationship between a dry soil and change in runoff is going to be hard because it’s a small percent to begin with. It’s not that it doesn’t matter, but it’s also not the silver bullet,” Osenga says.
Soil moisture refers to water held in the pores of soil. Going deeper – the depth varies but often begins around a meter down—takes you to a saturated zone of groundwater. Groundwater adds further complexity to the question about runoff prediction. Rosemary Carroll is conducting research on that interplay. She’s a research professor in hydrology affiliated with the Desert Research Institute but based at Colorado’s Mt. Crested Butte.
Groundwater, she says, moderates flows between the years of big water and high flows and those of lesser runoff. During the big years, the water goes into storage in the form of groundwater. It stabilizes flows.
Healthy mountain meadows and wetlands are characteristic of healthy headwater systems and provide a variety of ecosystem services, or benefits that humans, wildlife, rivers and surrounding ecosystems rely on.
The complex of wetlands and connected floodplains found in intact headwater systems can slow runoff and attenuate flood flows, creating better downstream conditions, trapping sediment to improve downstream water quality, and allowing groundwater recharge. These systems can also serve as a fire break and refuge during wildfire, can sequester carbon in the floodplain, and provide essential habitat for wildlife. Graphic by Restoration Design Group, courtesy of American Rivers
But groundwater declines during hotter and drier years—think 2002, 2012 and 2018. Streamflow is sensitive to declines in groundwater storage, Carroll says, so flows also drop. Modeling that Carroll has worked on shows a loss of 30% in streamflows over the next century or so, assuming a 4 degree temperature increase.
Groundwater may seem to be on the margins of why runoff predictions on April 1 fail to materialize in July, but Carroll believes it needs to be part of the discussion. That connection will become more important in coming decades as temperatures continue to rise. “It’s really important, and it’s not often talked about,” she says.
Late season weather prediction accuracy
Despite all this research that seeks to narrow the uncertainty, uncertainty will remain in streamflow forecasting for the foreseeable future. That’s the conclusion drawn by Peter Goble, of the Colorado Climate Center, and Russ Schumacher, Colorado State Climatologist, in a study published in the Journal of Hydrometeorology December 2023 issue.
“What influences seasonal runoff more: antecedent soil moisture and groundwater conditions or meteorological conditions following April 1?” they asked. Sifting through evidence from 2020 and 2021, they reached a clear conclusion: “This study demonstrates that existing soil moisture and groundwater models are unlikely to provide ‘low-hanging fruit’ for improving forecasts.”
Improved weather forecasting skills will matter more, Goble and Schumacher said.
Weather forecasts are remarkably good for a week to 10 days. Beyond? Not so much. Will that change? Goble and Schumacher indicate little optimism.
Then there’s the shifting climate. If weather continues to become more variable, “that is only going to decrease our ability to predict ahead of time what the runoff is going to be,” Goodbody says. Too, if warmer winter temperatures produce more rain, there will be less snow to measure. “Then predictability by definition goes down until we actually can predict the future [after April 1] weather with more certainty,” Goodbody says.
The Little Snake River is about to join the Yampa River on Oct. 8, 2020. Photo credit: Allen Best/Big Pivots
Improved forecasts, however, won’t deliver more water. For management purposes, stored water still matters greatly. Consider the Yampa River after that three-wire winter of 2023. The rapidly slackening flows of the river through Steamboat during July surprised water managers and state officials. That year, the snowpack in the Yampa River Basin was dusty, moving the snow to melt and runoff to occur earlier than usual. Officials came close to closing the river to commercial fishing access, as they had the four previous years because of either low flows, high temperatures, or both.
Through a water lease agreement orchestrated by the Colorado Water Trust—a nonprofit that uses voluntary water-market transactions to restore streamflows—the Upper Yampa district released between 18 cubic feet per second and 40 cfs from Stagecoach from late August through late October to keep the Yampa flowing and at a cooler temperature. This added water helps the City of Steamboat Springs stay in compliance with federal water quality standards governing stream temperatures below the city’s wastewater treatment plant. It also benefits fish and those angling at them.
“We thought we were in great shape and thought we wouldn’t need [special] releases out of Stagecoach [Reservoir],” says Julie Baxter, water resources manager for the City of Steamboat Springs.
“It was definitely a big surprise.”
This story was published in the Spring 2024 issue of Headwaters magazine, a publication of Water Education Colorado. See the full contents here.
Climate change is worsening floods, droughts and is reducing water quality, posing an increasing threat to our health, according to a European Environment Agency (EEA) report published today. Fast-tracking implementation and better coordination of efforts by governments, water authorities and healthcare providers are urgently needed to prevent and reduce health impacts.
Between 1980 and 2022, 5,582 flood-related deaths and 702 wildfire-related deaths were recorded across 32 European countries. Already today, one in eight Europeans lives in areas potentially prone to river floods and around 30% of people in southern Europe face permanent water stress. Climate change will further increase exposure of people to weather extremes with serious health consequences. Senior citizens, children, those in poor health, lower income groups, farmers and emergency service teams are among the groups experiencing greatest health impacts from floods, droughts, wildfires or water- and vector-borne diseases.
With these facts, the report underscores the critical need to urgently implement existing EU legislation, notably various European climate, water and health policies and integrate them further, and roll out the already existing solutions across all sectors and government levels to protect lives, prevent adverse health outcomes and increase wellbeing.
“Protecting human lives and health from the impacts of climate change, including droughts, floods and worsened water quality is of utmost importance and urgency. Existing European climate, water and health policies offer a solid foundation for action, but they need to be implemented more broadly and systematically. To ensure our future well-being all levels of government across many sectors need to put in place effective solutions so that we can prevent and reduce physical and mental health impacts. We support them with knowledge through the activities of the EEA and the European Climate and Health Observatory.” — Leena Ylä-Mononen
Faster rollout of effective solutions
To enhance our preparedness for future climate-related challenges to health from floods, water scarcity and deteriorated water quality, responses are needed in both the health sector and other sectors that have an impact on health, including water management, spatial planning, building design or insurance.
The EEA report seeks to inspire action by showing various examples of practical solutions implemented in the EEA member and collaborating countries.
A precondition for upscaled action is the greater integration of climate change into health policies in Member States and increased resources and competencies for climate change adaptation with a focus on health at subnational levels. Quick wins include raising public awareness about the risks and solutions, while longer-term actions, including infrastructure improvements and nature-based solutions, require systematic planning and investment. The differences in vulnerability of various population groups and the geographical variation of impacts require an equity-based, targeted approach to preventing health impacts for all under the changing climate.
Sources/Usage: Public Domain.
Post-wildfire flooding and debris flow in a small canyon above the Las Lomas debris basin in Duarte, the winter after the the June 2016 Fish Fire in Los Angeles County, California.
Key risks calling for action
Floods
Between 1980 and 2022, 5,584 flood-related deaths were recorded in the 32 EEA member countries.
Currently, around 53 million people (12% of Europe’s population) live in areas potentially prone to river flooding, although often with flood defences in place. This number increased by 935,000 between 2011 and 2021, showing continuous development on floodplains.
One in nine hospitals in Europe is located in areas potentially prone to river flooding.
US Drought Monitor June 28, 2012
Droughts and water scarcity
Due to demand for water and droughts, regions in Europe are under nearly permanent water stress, and not just in the south.
Prolonged spells of dry and hot weather facilitate the spread of wildfires, mainly in southern Europe, but increasingly in other regions. Between 1980 and 2022, 702 people lost lives directly through wildfires in the 32 EEA member countries, and many more were affected by wildfire smoke.
Waterborne diseases are a significant global concern, particularly in regions with inadequate sanitation and contaminated water sources. Understanding the symptoms of waterborne diseases and implementing preventive measures is crucial to maintaining public health. Credit: Medium
Water quality
Rising air and water temperatures facilitate pathogen growth, increasing the risk of waterborne diseases.
Heavy rainfall events make it twice as likely to have harmful pathogen concentrations in water bodies due to contaminated run-off and combined sewage overflows.
In low-lying areas, sea level rise causes intrusion of saline water into groundwater and surface water aquifers, with spillover effects on crops.
Low flows during dry periods result in higher concentrations of pollutants, requiring costly wastewater treatment. During dry and hot periods, cyanobacterial blooms in nutrient-rich waters can jeopardise water quality.
About the report
The report is published as part of activities of the European Climate and Health Observatory, building on and complementing the Observatory’s work. The report follows from the European Climate Risk Assessment published earlier this year, which highlighted health as one of the at-risk sectors.
The federal government expects Lake Powell to rise, despite one Utah lawmaker’s claim that levels are ‘intentionally’ being kept low
Utah’s reservoirs are still at what the state calls “impressive” levels, with most hovering around 90% capacity — by comparison, statewide levels were a little over half full this time last year.
But Lake Powell, the country’s second-largest reservoir, is an outlier. According to the U.S. Bureau of Reclamation, it’s currently at about 35% capacity.
During a Legislative Water Development Commission meeting in Salt Lake City last week, director of the Utah Division of Water Resources Candice Hasenyager gave lawmakers an update on the state’s water outlook.
“Our reservoirs are about full, we’re at about 90% of our statewide average,” she said. But, she noted Lake Powell as a glaring exception.
“That’s still definitely a concern that we have,” Hasenyager told lawmakers.
In a statement, the U.S. Bureau of Reclamation said Lake Powell should not be compared to other reservoirs in the state because of its size and the various policies that dictate its levels.
“Lake Powell is substantially larger, with a live capacity of nearly 25 million acre-feet,” a spokesperson for the bureau said. “This capacity is more than eight times the capacity of Strawberry Reservoir.”
Those levels are often out of the state’s control, and are in part due to the complexity of the Colorado River Basin and the system that allocates water to seven states and Mexico, called the Colorado River Compact.
Through the compact, the bureau “has modified the operating guidelines for Glen Canyon and Hoover dams through 2026, to protect these facilities and lake levels if poor hydrologic conditions persist,” the spokesperson said.
Despite Lake Powell appearing to be far behind Utah’s other reservoirs in terms of capacity, the bureau noted that the situation is much better than last year — currently, it sits at about 24 feet higher than last May, and officials say levels will continue to rise, expected to hit about 41% capacity in June. After that, the bureau said it will decline until spring runoff in 2025.
Still, the state’s lack of control over Lake Powell drew some disapproval from outgoing Rep. Phil Lyman, R-Blanding, who is currently running for governor. Lyman, a fierce critic of the federal government’s presence in Utah, lamented the levels being “set by the Secretary of the Interior.”
“Are we working with the Secretary of the Interior, are we working with the federal government to keep that at a viable level?” Lyman asked. “What we’ve really seen is intentional, keeping that below a viable recreation level and I hope the legislature can influence that decision in the future.”
In response to Lyman’s comments, the Bureau of Reclamation pointed to the bevy of compacts, federal laws, court decisions, contracts and regulatory guidelines that control flows in the Colorado River and levels at Lake Powell.
“Reclamation has a long-standing history of working with all stakeholders in the basin on cooperative agreements that help define operational actions at critical times and to protect the levels at Lake Powell and sustain and protect the Colorado River Basin,” the bureau said.
When asked about Lyman’s comments, Utah Gov. Spencer Cox responded, “I have no idea what he’s talking about.”
“People can make up stuff all they want. Nobody is deliberately keeping the water levels low at Lake Powell,” the governor said during his monthly PBS news conference on Thursday, calling his gubernatorial opponent’s claim “bonkers.”
Cox pointed to ongoing negotiations among water managers from Colorado River basin states who are working on a new management plan ahead of 2026, when the current guidelines expire.
Cox told reporters the state has been releasing its own water from Flaming Gorge Reservoir to ensure the Glen Canyon Dam at Lake Powell can continue generating power. Some of that water was released to Lake Mead, he said — now, the state is hoping to get that water back.
“There are big discussions about where that water goes and where our portions of the water go. We’ve had huge releases from upstream reservoirs that have gone into Lake Powell,” Cox said. “That’s mostly our water. …These are very, very complex negotiations that are going back and forth, and part of the negotiations and what we’re doing right now is making sure we can restore the water that we released.”
‘Exactly what we need’
On Thursday, the Division of Water Resources said over half of the snow from this winter has melted, with recent weather patterns resulting in “optimal spring runoff.”
“A slow warmup is exactly what we need to have a safe and effective spring runoff,” Hasenyager said in a statement. “We still have a good amount of snow in the mountains, so we are hoping for a gradual snow melt.”
Here are some key takeaways from the state:
As of May 1, Utah’s major watersheds are at or above about 90% of normal precipitation, with northern Utah’s basins doing exceptionally well.
The state’s streams are flowing at about 89% of normal, which the division called a “widespread positive trend.”
The Great Salt Lake has risen about three feet since October. According to state data, the south arm of the lake is at above 4,195 feet, about three feet away from the bottom of the spectrum of what’s considered a healthy level, 4,198 feet.
It’s filling up. Already nine ballot measures have been approved for Colorado voters to decide in the Nov. 5 general election. Two of the measures are citizen initiatives – one requiring the state to seek voter approval to retain property tax revenue projected to increase more than 4 percent over the prior year; another asking voters to signal the right to an abortion, including allowing for health insurance coverage for public employees.
The other seven measures were sent to the ballot by the Colorado Legislature. Those include:
A proposed amendment to the Colorado Constitution that removes the provision that states, “Only a union of one man and one woman shall be valid or recognized as a marriage in the state.”
A ballot measure that would collect an 11 percent retail sales tax from firearms dealers, manufacturers, and ammunition vendors. The collected revenue would fund the Firearms and Ammunition Excise Tax Cash Fund that would support programs for crime victims, education, and mental and behavioral health for children and veterans.
A legislative-approved ballot measure that asks voters to allow the state to retain tax revenue collected above $29 million annually from sports betting. The money kept by the state would be used to pay for projects in the Colorado Water Plan.
In an episode of The Valley Pod, Colorado State Sen. Cleave Simpson and State Rep. Matthew Martinez talked about their support for the state legislature’s referred-measure to amend the Colorado Constitution on the definition of marriage. If adopted the amendment essentially would remove the ban on a same-sex marriage in the Colorado Constitution.
“Nobody here (in Colorado) has been denied a marriage license for same-sex marriage because of the direction from the U.S. Supreme Court. This just affirms and puts us in that position,” said Simpson. “And I have any number of same-sex marriage friends and acquaintances, and I just think out of respect to them, and this should be something that the people of Colorado should decide. It doesn’t have huge financial implications. It doesn’t have huge personal implications other than folks, I know that this impacts them. And I think this is something that the voters should be able to decide.”
“I think it’s pretty straightforward. And we’ve had this control through the legislature, the ability to have same-sex marriage for some time,” said Martinez. “This just really aligns what we’re already doing, both with the state and with the federal level.”
Simpson also weighed in on allowing Colorado to keep gambling revenue that exceeds $29 million in any given year. Currently revenue above $29 million that’s collected goes back to the casinos that generated the revenue.
In addition to the measures already on the ballot, there are 25 others with petitions out collecting voter signatures to try to qualify. Here’s a look at what’s qualified so far:
Other proposed amendments to the Colorado Constitution referred by the Colorado Legislature
Colorado Independent Judicial Discipline Adjudicative Board Amendment – Amendment to the Colorado Constitution concerning judicial discipline and establishing an independent judicial discipline adjudicative board, setting standards for judicial review of a discipline case, and clarifying when discipline proceedings become public.
Initiative No. 50 Voter approval to retain additional property tax revenue – Proposal “conditionally decreases property tax revenue in years when statewide property tax revenue is projected to grow more than 4 percent over the prior year, unless voters approve a ballot measure allowing for the additional revenue to be retained.” The initiative is sponsored by Advance Colorado Institute, a conservative think tank.
Initiative No. 89 Right to Abortion – Proposals reads, “The right to an abortion is hereby recognized. Government shall not deny, impede, or discriminate against the exercise of that right, including prohibiting health insurance coverage for abortion.” Initiative submitted by Dusti Gurule of the Colorado Organization for Latina Opportunity and Reproductive Rights; and Dani Newsum, director of strategic partnerships at Cobalt, reproductive advocates.