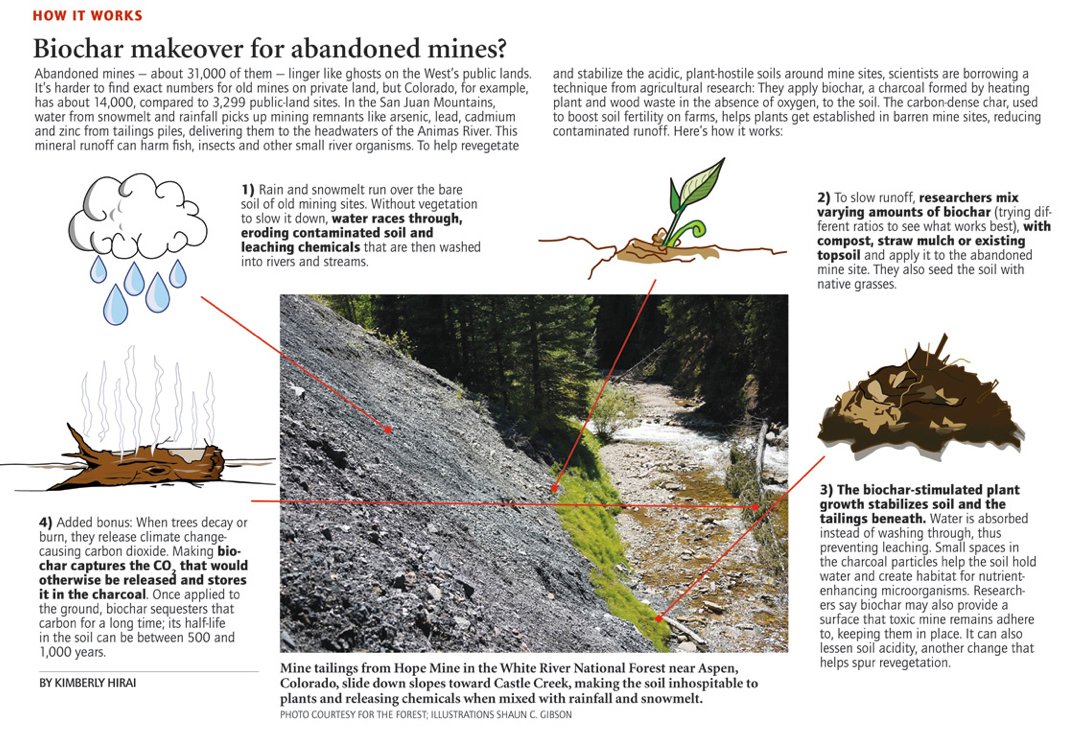
Click the link to read the report on the EPA website. Here’s the executive summary:
Collaboration is the gateway to greatness. Recycled water can be a safe and reliable water supply, but to develop it the agencies responsible for managing water, wastewater, and stormwater must work together. In the United States, this type of cooperation is inhibited by the challenge of aligning missions and allocating responsibilities and costs among separate organizations. Collaboration is also complicated by complex regulations, operational details, and a utility’s natural inclination to maintain independent control of all projects within their jurisdictions.
Recycling wastewater effluent, stormwater, and other impaired sources is an essential element of an integrated, resilient, and sustainable water supply. However, the dominant institutional arrangements in the United States (and most other nations) today constitute a patchwork approach to water resource management. Water utilities and wastewater agencies created years ago in response to historical needs now operate as distinct entities, each with its own legal mandate, service area, professional staff, management team and personality, governance and public oversight structure, regulatory and technological challenges, and financial and economic constraints. While these institutions were well-suited to solve last century’s water problems, they are less able to address today’s challenges that require integrated water management—including water reuse.
Despite this fragmented institutional landscape, many agencies have found ways to work together to create successful regional water reuse programs. By focusing on their common interests and forging durable working agreements, they have joined together to create “virtual” water utilities adding recycled water to their portfolio of supplies to complete the water cycle and achieve greater resilience for their communities. While the challenges are great, these examples of successful partnerships around the United States offer many important lessons.
The National Water Reuse Action Plan Action Item 2.16 was initiated to support the development of multi-agency water reuse programs by identifying “challenges, opportunities and models for interagency collaboration.” This project consists of 1) a framework for evaluating interagency relationships in the water sector (including an annotated bibliography); 2) five case studies of multi-agency reuse projects in the United States; and 3) a summary of “lessons learned,” references, and exercises to help agencies develop more productive collaborations.
The coal-fired Tri-State Generation and Transmission plant in Craig provides much of the power used in Western Colorado, including in Aspen and Pitkin County. Will Toor, executive director of the Colorado Energy Office has a plan to move the state’s electric grid to 100 percent renewable energy by 2040. Photo credit: Brent Gardner-Smith/Aspen Journalism
Click the link to read this important article that’s running on the New Yorker website (Bill McKibben). Here’s an excerpt:
On the last day of February, the Intergovernmental Panel on Climate Change issued its most dire report yet. The Secretary-General of the United Nations, António Guterres, had, he said, “seen many scientific reports in my time, but nothing like this.” Setting aside diplomatic language, he described the document as “an atlas of human suffering and a damning indictment of failed climate leadership,” and added that “the world’s biggest polluters are guilty of arson of our only home.” Then, just a few hours later, at the opening of a rare emergency special session of the U.N. General Assembly, he catalogued the horrors of Vladimir Putin’s invasion of Ukraine, and declared, “Enough is enough.” Citing Putin’s declaration of a nuclear alert, the war could, Guterres said, turn into an atomic conflict, “with potentially disastrous implications for us all.”
What unites these two crises is combustion. Burning fossil fuel has driven the temperature of the planet ever higher, melting most of the sea ice in the summer Arctic, bending the jet stream, and slowing the Gulf Stream. And selling fossil fuel has given Putin both the money to equip an army (oil and gas account for sixty per cent of Russia’s export earnings) and the power to intimidate Europe by threatening to turn off its supply. Fossil fuel has been the dominant factor on the planet for centuries, and so far nothing has been able to profoundly alter that. After Putin invaded, the American Petroleum Institute insisted that our best way out of the predicament was to pump more oil. The climate talks in Glasgow last fall, which John Kerry, the U.S. envoy, had called the “last best hope” for the Earth, provided mostly vague promises about going “net-zero by 2050”; it was a festival of obscurantism, euphemism, and greenwashing, which the young climate activist Greta Thunberg summed up as “blah, blah, blah.” Even people trying to pay attention can’t really keep track of what should be the most compelling battle in human history…
…the era of large-scale combustion has to come to a rapid close. If we understand that as the goal, we might be able to keep score, and be able to finally get somewhere. Last Tuesday, President Biden banned the importation of Russian oil. This year, we may need to compensate for that with American hydrocarbons, but, as a senior Administration official put it,“the only way to eliminate Putin’s and every other producing country’s ability to use oil as an economic weapon is to reduce our dependency on oil.” As we are one of the largest oil-and-gas producers in the world, that is a remarkable statement. It’s a call for an end of fire.
We don’t know when or where humans started building fires; as with all things primordial there are disputes. But there is no question of the moment’s significance. Fire let us cook food, and cooked food delivers far more energy than raw; our brains grew even as our guts, with less processing work to do, shrank. Fire kept us warm, and human enterprise expanded to regions that were otherwise too cold. And, as we gathered around fires, we bonded in ways that set us on the path to forming societies. No wonder Darwin wrote that fire was “the greatest discovery ever made by man, excepting language.”
Click the link to read the article on the Washington Post website (Jason Samenow and Kasha Patel). Here’s an excerpt:
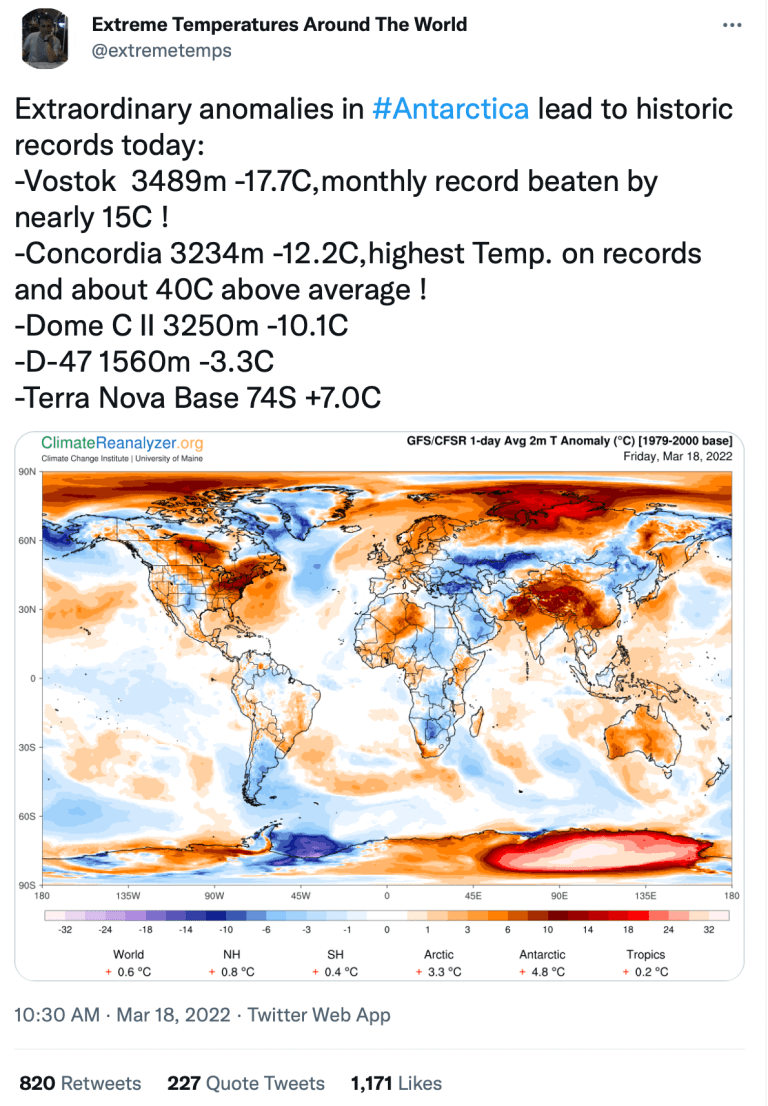
The coldest location on the planet has experienced an episode of warm weather this week unlike any ever observed, with temperatures over the eastern Antarctic ice sheet soaring 50 to 90 degrees above normal. The warmth has smashed records and shocked scientists…Parts of eastern Antarctica have seen temperatures hover 70 degrees (40 Celsius) above normal for three days and counting, Wille said. He likened the event to the June heat wave in the Pacific Northwest, which scientists concluded would have been “virtually impossible” without human-caused climate change…The average high temperature in Vostok — at the center of the eastern ice sheet — is around minus-63 (minus-53 Celsius) in March. But on Friday, the temperature leaped to zero (minus-17.7 Celsius), the warmest it’s been there during March since record keeping began 65 years ago. It broke the previous monthly record by a staggering 27 degrees (15 Celsius)…
Keller and Lazzara said in an email that such a high temperature is particularly noteworthy since March marks the beginning of autumn in Antarctica, rather than January, when there is more sunlight. At this time of year, Antarctica is losing about 25 minutes of sunlight each day.
Wille said the warm conditions over Antarctica were spurred by an extreme atmospheric river, or a narrow corridor of water vapor in the sky, on its east coast. According to computer models, the atmospheric river made landfall on Tuesday between the Dumont d’Urville and Casey Stations and dropped an intense amount of rainfall, potentially causing a significant melt event in the area. The moisture from the storm diffused and spread over the interior of the continent. However, a strong blocking high pressure system or “heat dome,” moved in over east Antarctica, preventing the moisture from escaping. The heat dome was exceptionally intense, five standard deviations above normal. The excessive moisture from the atmospheric river was able to retain large amounts of heat, while the liquid-rich clouds radiated the heat down to the surface — known as downward long-wave radiation.
Wille explained warm air is often transported over the Antarctic interior this way but not to this extent or intensity.
Click the link to read the article on the CWCB website:
During its March meeting, the Colorado Water Conservation Board (CWCB) – a group of 15 governor-appointed representatives from each major Colorado river basin with expertise in water policy and planning – approved 52 grants through the Water Plan Grant Program.
“The Colorado Water Conservation Board is pleased to approve more than 50 projects this month to help advance the Colorado Water Plan, many of which are a direct result from recent stimulus funding approved by Governor Polis,” said CWCB Chair Jackie Brown. “We also look forward to utilizing funding from sports betting as enacted by Proposition DD in the near future to make an even bigger impact. And as we prepare to release the next Water Plan, securing future funding will become increasingly important for our water future.”
This grant program provides critical funding for multi-beneficial water projects in all eight river basins that advance actions outlined within the Colorado Water Plan.
Here’s the release from Southeastern Water (Chris Woodka), USBR (Elizabeth Smith), and Pueblo Water (Joe Cervi):
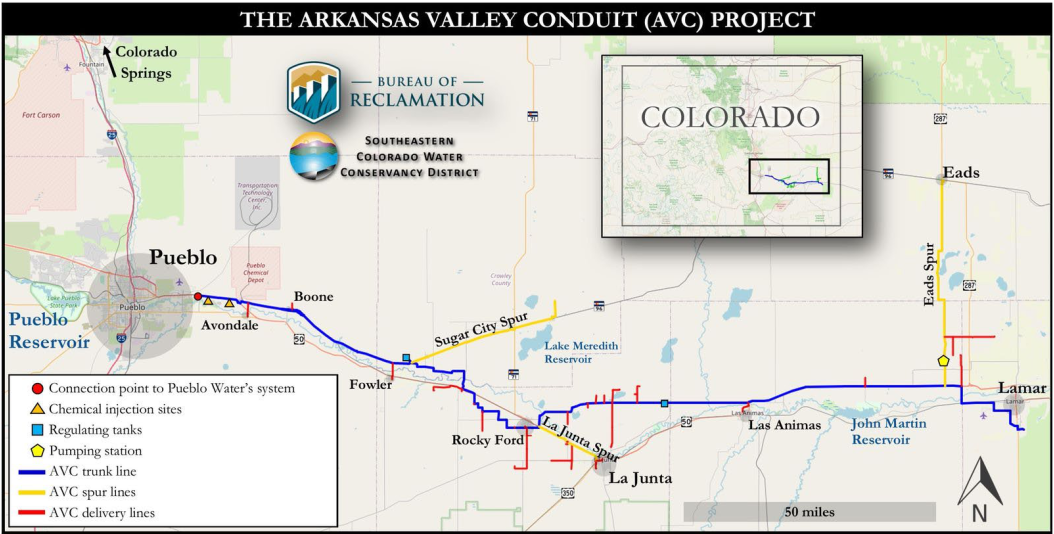
A three-party contract allowing for the Arkansas Valley Conduit to deliver clean drinking water to 50,000 people in 39 communities east of Pueblo was signed by the Bureau of Reclamation on March 18, 2022, following approval by the Southeastern Colorado Water Conservancy District Board and the Pueblo Board of Water Works (Pueblo Water). The contract was drafted after negotiations that began in November 2021.
“This contract signing marks one of the most significant milestones to date towards making the AVC a reality and bringing clean water to communities that desperately need it. It advances the project over 14 miles east from Pueblo Reservoir which puts us much closer to our first participants in Avondale and Boone,” said Brent Esplin, Regional Director of the Missouri-Basin and Arkansas-Rio Grande-Texas Gulf regions for Reclamation. “It is also the culmination of years of collaboration between Reclamation, Southeastern, and Pueblo Water to deliver a more cost-effective project to people of the lower Arkansas Valley.”
The contract will allow the Southeastern District to use capacity in Pueblo Water’s system to treat and deliver AVC water to a pipeline being constructed by Reclamation. The connection point for AVC is at the east end of Pueblo Water’s system, at 36th Lane and U.S. Highway 50.
Arkansas Valley Conduit map via the Southeastern Colorado Water Conservancy District (Chris Woodka) June 2021.
The water will be either Fryingpan-Arkansas Project water or from participants’ water portfolios, not from Pueblo Water’s resources. The route of the AVC follows the Arkansas River corridor from Pueblo to Lamar, with spurs to Eads and Crowley County. Reclamation is building the trunk line, while the Southeastern District will build the spur and delivery lines. Estimated total cost is about $600 million.
The Southeastern and Pueblo Water boards both unanimously approved the contract on March 15 and 17, 2022, respectively.
“This project is vitally important to the people of the Lower Arkansas Valley,” said Bill Long, President of the Southeastern District board. “It would not be viable, and certainly not affordable without the partnership with Pueblo Water, and I would like to express my appreciation to the board.”
“This is a truly monumental achievement and marks the culmination of decades of hard work, dedication, and collaboration by those who have devoted their lives to the business of water,” said Seth Clayton, executive director of Pueblo Water. “Pueblo Water is proud to be an integral participant in this important time in history.”
Many of the Lower Arkansas Valley water systems face water-quality enforcement actions for radionuclides or surface contaminants in groundwater sources. They face ever increasing costs to cope with these problems. The AVC will eliminate or reduce the effects of those contaminants by delivering filtered water from Pueblo Reservoir.
To deliver the full volume of water through the system, Pueblo Water must make some upgrades, and will receive a $20 million construction recovery fee. In addition, Pueblo Water will receive a $2 million investment payment. As the needs of AVC grow, Pueblo will receive funding for necessary improvements.
This is seen as a win-win opportunity by both Pueblo Water and the Southeastern District because it reduces the cost of an earlier plan to build a new pipeline south of Pueblo.
“Not only does the agreement save the AVC project hundreds of millions of dollars and years of construction time, but it also benefits Pueblo Water customers by providing an opportunity to use the excess capacity we have in our system and deliver water to our neighbors in the Lower Arkansas Valley,” Clayton said.
Pueblo Water will charge an initial rate of $2.19 per 1,000 gallons delivered, which reflects the operation and maintenance costs of those parts of the system needed by AVC. The rate will increase annually at the same rate as Pueblo Water’s other customers.
Pueblo Water will also renew its contract to store excess capacity water in Pueblo Reservoir for a 50- year period under the contract.
Finally, the contract spells out environmental commitments and operating conditions related to AVC.
“The significance of this action is that everybody will have the opportunity to have a clean source of drinking water after more than 20 years of work,” said Jim Broderick, executive director of the Southeastern District.
Alan Hamel, a Southeastern Board member, and former Pueblo Water executive director, said the idea for the AVC actually goes back 60 years, to the 1962 signing of the Fryingpan-Arkansas Project into law.
In 1968, there was a plan to jointly build a federal treatment plant for Pueblo Water and the water line for AVC.
The AVC was put on hold because of the inability of communities to pay for it. The AVC concept was revived in 2000, and a 2009 federal law provided for 65 percent federal funding, to be matched by 35 percent in other funding.
Reclamation issued a Record of Decision in 2014 which endorsed construction of the AVC to proceed via the “Comanche North” alignment. The alignment was modified in 2019 through a collaborative effort between Reclamation, Southeastern, and Pueblo Water which replaced the pipeline around Pueblo with this contract.
Federal funding so far has totaled $40 million, while $100 million in loans or grants is available to AVC through the Colorado Water Conservation Board. The District has contributed $4.8 million through its Enterprise, while participants have paid $1.5 million since 2011.
Pueblo County recently contributed $1.2 million to build delivery lines to Boone and Avondale through local American Rescue Plan Act funds, and other counties or cities in the Arkansas Valley are expected to contribute as well.
Putin crony Roman Abramovich’s ownership of London’s Chelsea soccer club has been crimped by sanctions levied by the U.K. The Colorado steel mill of which he is a major owner is operating as usual—for now. Photo credit: Allen Best/Big Pivots
Click the link to read the article on the Big Pivots Website (Allen Best):
In the early 20th century Pueblo’s steel mill was owned by American oligarchs, John Rockefeller Jr., the descendants of Jay Gould, and others. Might ownership of that steel mill—and Colorado’s largest solar array—revert to American ownership as a result of the Russian war against Ukraine?
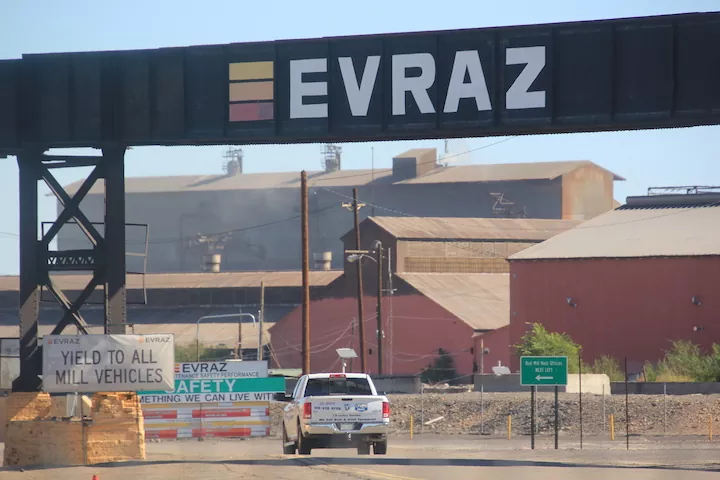
Now called Evraz, the steel mill is owned primarily by Russian oligarchs, with Roman Abramovich having the largest stake.
The United States has not yet imposed sanctions on Abramovich, unlike the United Kingdom and Canada. That leaves his ownership stake in the Pueblo steel mill intact as well as his ownership of two houses in Snowmass Village.
In Pueblo, there are doubts that the mill could end up being cut off from its Russian owners because the product is for the domestic consumption, not for export.
But then Chelsea, the soccer club in London that Abramovich owns, is no longer selling tickets, the result of sanctions applied last Thursday by the United Kingdom. As long as Russia’s war against Ukraine continues, ownership of the plant in Pueblo will remain an active question.
Evraz North America, which operates the steel mill, is a wholly owned subsidiary of Evraz, a company incorporated under laws of the United Kingdom, with shares traded on the London Stock Exchange—until last Thursday.
In sanctioning Evraz, the British government accused Roman Abramovich, the largest shareholder, of being a “pro-Kremlin oligarch” who has received preferential treatment and concessions from Putin and the Russian government and “is or has been involved in destabilizing Ukraine and undermining and threatening the territorial integrity, sovereignty and independence of Ukraine.”
The statement also accused Evraz of “potentially supplying steel to the Russian military, which may have been used in the production of tanks.” In response to a Financial Times inquiry, the company insisted it only made steel for the “infrastructure and construction” sectors, the Financial Times reported.
The Financial Times last Friday also reported that 10 members of Evraz had resigned after the United Kingdom’s action.
Canada last Friday also imposed sanctions on Abramovich, and on Tuesday so did the European Union.
Within hours of the Russian invasion of Ukraine, the United States imposed actions against several Russian oligarchs and institutions, but not Abramovich nor Evraz.
Five Russians own two-thirds of Evraz’s shares. Second to Abramovich in holdings is Alexander Abramov, a former scientist who founded Evraz in 1992. The other three are also Russian oligarchs, reported the Pueblo Chieftain in a March 5 story.
An oligarch is defined as a very rich business leader with a great deal of political influence. An oligarchy is a country ruled by oligarchs. Forbes in 2021 ranked Abramovich as 12th wealthiest among Russia’s billionaires, with a net worth of $14.5 billion.
Evraz also has steel, mining, and vanadium operations in Russia, the Czech Republic, and Kazakhstan.
In the United States, Evraz has mills in Pueblo, which has 1,100 employees, and in Portland, Ore. It also has five mills in Canada, three in Alberta and one in Saskatchewan, according to its website.
Evraz also has scrap operations, including one along the South Platte River north of downtown Denver.
Nowhere has there been even a suggestion that the Pueblo steel mill or other operations in North America have directly supported the Russian war effort.
The Pueblo mill primarily uses recycled steel to make its products, which requires a lower temperature than is necessary when using iron ore and other raw resources. Foundry operations became electrified in the early 1970s, the result of construction of the nearby Comanche 1 and 2 coal-burning units.
Early last November, a 298-megawatt solar farm was completed on land owned by Evraz between the steel mill and beyond the Comanche units. This allowed the steel company to proclaim that it had become the first solar-powered steel mill in the world, as Big Pivots explained. Financial and other details of that claim have never been made public.
The investment in the solar farm hinged upon plans to go forward with construction of a $500 million mill that will make quarter-mile rail segments that Union Pacific, Burlington Northern-Santa Fe, and other railroads want. The construction project employs 400 to 500 people.
Jeffrey Shaw, chief executive of the Pueblo Economic Development Corporation, says the impact to Pueblo and the steel mill there appears to be nil.
“We have asked what the impact of the global geopolitical front will be to the facility, and the answer we have gotten back (from Evraz) is—consistent with what has been reported—that they are moving forward with the facility,” he says. He also points that the market for the products of the steel mill is domestic, not foreign.
Driving by the mill, construction work continues with no evidence of slowdown. “We’re very optimistic that it will carry on” as planned, he added.
The Pueblo Chieftain story by editor Karin Zeitvogel reported no changes evident at the steel mill in early March. “We haven’t seen anything yet, and everything is just like it was a week ago,” said Eric Ludwig, president of the United Steelworkers 2102 Union, a week after the invasion.
The Evraz annual report for 2021 noted the cloudy global horizon, referring to Ukraine five times and potential for sanctions nine times. The report mentions the “worsening situation relating to Ukraine and heightened risk of the economic sanctions.”
In modeling, the company also described a “severe downside scenario” that could cause it to reduce capital spending by $500 million a year.
Might that include the work on the new Pueblo mill? No mention there.
Abramovich was the focus of a lengthy New York Times article on Sunday that explored his ties with the United States and other western countries. An orphan who grew up in a town along the Volga River, he dropped out of college and then emerged from the Red Army in the late 1980s just as the Soviet leader Mikhail Gorbachev was opening new opportunities for private enterprise. Abramovich, says the Times, thrived as a trader—of almost anything and everything, it would seem.
The big break for Abramovich came in the mid-1990s, when he and a partner persuaded the Russian government to sell them a state-run oil company for $200 million. In 2005, he sold his stake back to that government for $11.9 billion.
His holdings include the Chelsea soccer team in London, which he bought in 2003 and which he was frantically trying to sell last week before the UK sanctions. The sanctions prohibit the club from selling tickets to matches.
The Times said leaders of cultural, educational and medical institutions, along with a chief rabbi, had sent a letter urging the United States not to impose sanctions on Abramovich, a major donor to Jewish and other causes.
A request to the American ambassador to Israel “reflects the extraordinary effort Mr. Abramovich, 55, has made over the last two decades to parlay his Russian fortune into elite standing in the West,” said the Times, going on to describe his houses, his art works, his yachts, his private 787 jet, and more.
That includes real estate in Colorado’s most elite resort community. The Aspen Times on March 1 explained that Abramovich has owned two houses in Snowmass Village since 2008. One 12,859-square-foot house has 11 bedrooms and 13 bathrooms and sits on 200 acres of land. The smaller 5,492-square-foot house sits on 1.8 acres of land.
Abramovich’s name is also prominent in Aspen, reported Rick Carroll of the Aspen Times. Lettering on the outside of a synagogue on Main Street in Aspen suggests Abramovich and his now ex-wife Dasha were major donors.
Russia’s oligarchs have “used their ill-gotten gains to try to launder their reputations in the West,” Thomas Graham, a Russian scholar from the Council on Foreign Relations, told the New York Times. “But the message of these sanctions is, that is not going to protect you.”
Michael McFaul, an American ambassador to Moscow during the Obama administration, described disingenuous behavior on several sides. He told the Times that while Putin’s government claimed to despise the United States and its allies, his foreign ministry was constantly trying to help the oligarchs around him, including Abramovich, obtain visas so they could ingratiate themselves with the Western elite.
“On our side, we have been playing right along,” he said, overlooking ties of the oligarchs to Putin and welcoming them and their money.
Sources also told the Times that the relationship that Abramovich and other oligarchs enjoyed with Putin cut both ways. After Putin was inaugurated president in 2000, he quickly moved to dominate the billionaires who had profited from privatization, sending a message by jailing the richest and most powerful oligarch. Abramovich is one of the few early elites who remained in Putin’s circle.
Putin’s display of force, however, also gave oligarchs freedom to establish ties in the West—as potential places to land.
As for Pueblo, it’s had ups and downs in the last 141 years it has been making steel. The mill was a consequence of Pueblo having rail connections, water, and proximity to coal, iron ore, and limestone. Coal mines at Crested Butte, Redstone, and elsewhere supplied the smoke-belching mill that was then called Colorado Fuel & Iron.
Much of the old CF&I plant at Pueblo remains standing even as a new long-rail mill goes up. Photos/Allen Best
CF&I was owned by American-born oligarchs of their day. A smaller figure was John Cleveland Osgood and the larger names were John Rockefeller Jr. and Jay Gould.
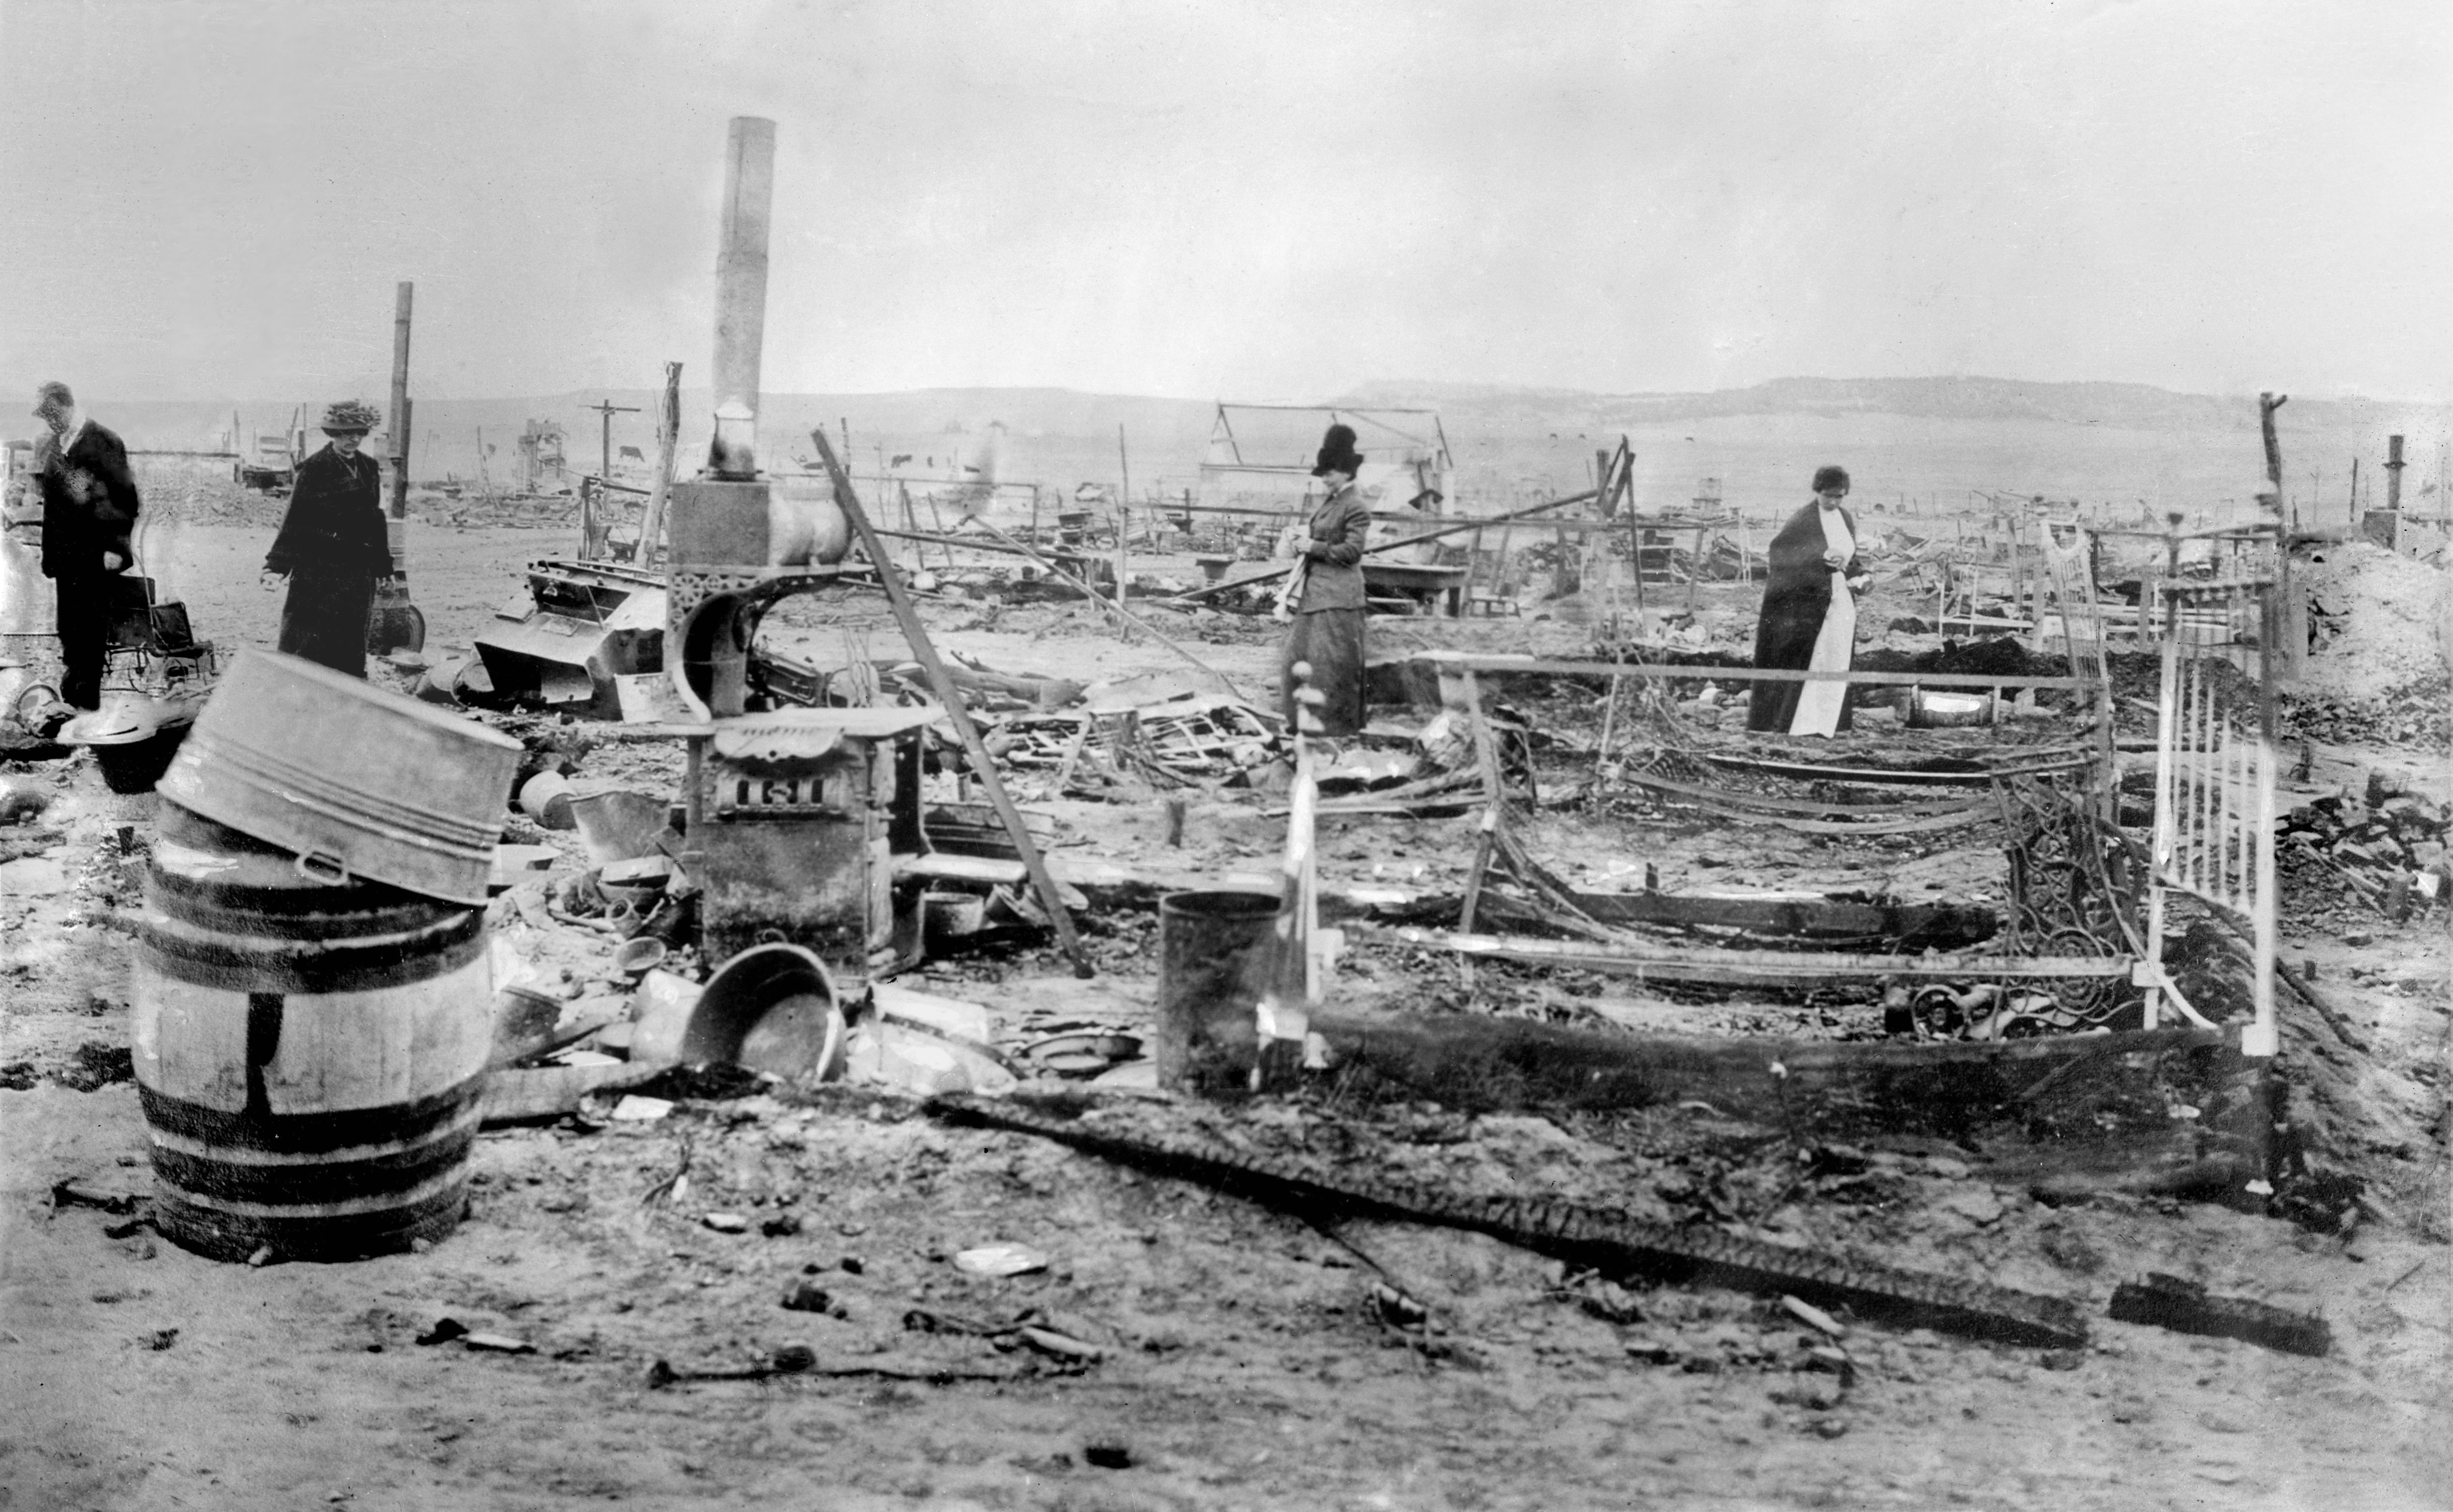
Ruins of the Ludlow Colony near Trinidad, Colorado, following an attack by the Colorado National Guard. Forms part of the George Grantham Bain Collection at the Library of Congress. By Bain News Service – This image is available from the United States Library of Congress’s Prints and Photographs divisionunder the digital ID ggbain.15859.This tag does not indicate the copyright status of the attached work. A normal copyright tag is still required. See Commons:Licensing for more information., Public Domain, https://commons.wikimedia.org/w/index.php?curid=10277066
There have been downsides for Pueblo, too, including a bloody strike in the coalfields south of Pueblo in 1913-1914. The strike culminated in the deaths of 21 miners and their families, including 2 women and 11 children in what is remembered as the Ludlow Massacre. In 1921, a flood killed at least 78 and likely many more while swamping the downtown district and other low-lying areas.
The steel mill at one time employed 12,000 people and, by the 1970s, paid handsomely and gave months-long vacations to employees with greater seniority. Going into 1990, CF&I teetered into bankruptcy. It was acquired by Oregon Steel in 1993 and the name was changed to Rocky Mountain Steel Mills. In 2007, it and other Oregon Steel holdings were acquired by Evraz for $2.3 billion.
Two photos associated with Lauren’s tag “1883 El Niño after effects”.
Cavitation at the Glen Canyon Dam, the cause of the emergency in 1983 via Flow Science.
During the 1983 Colorado River flood, described by some as an example of a “black swan” event, sheets of plywood (visible just above the steel barrier) were installed to prevent Glen Canyon Dam from overflowing. Source: Bureau of Reclamation
The Lees Ferry streamgage then and now.
September 21, 1923, 9:00 a.m. — Colorado River at Lees Ferry. From right bank on line with Klohr’s house and gage house. Old “Dugway” or inclined gage shows to left of gage house. Gage height 11.05′, discharge 27,000 cfs. Lens 16, time =1/25, camera supported. Photo by G.C. Stevens of the USGS. Source: 1921-1937 Surface Water Records File, Colorado R. @ Lees Ferry, Laguna Niguel Federal Records Center, Accession No. 57-78-0006, Box 2 of 2 , Location No. MB053635.
Lees Ferry streamgage and cableway downstream on the Colorado River, Arizona. (Public domain.)
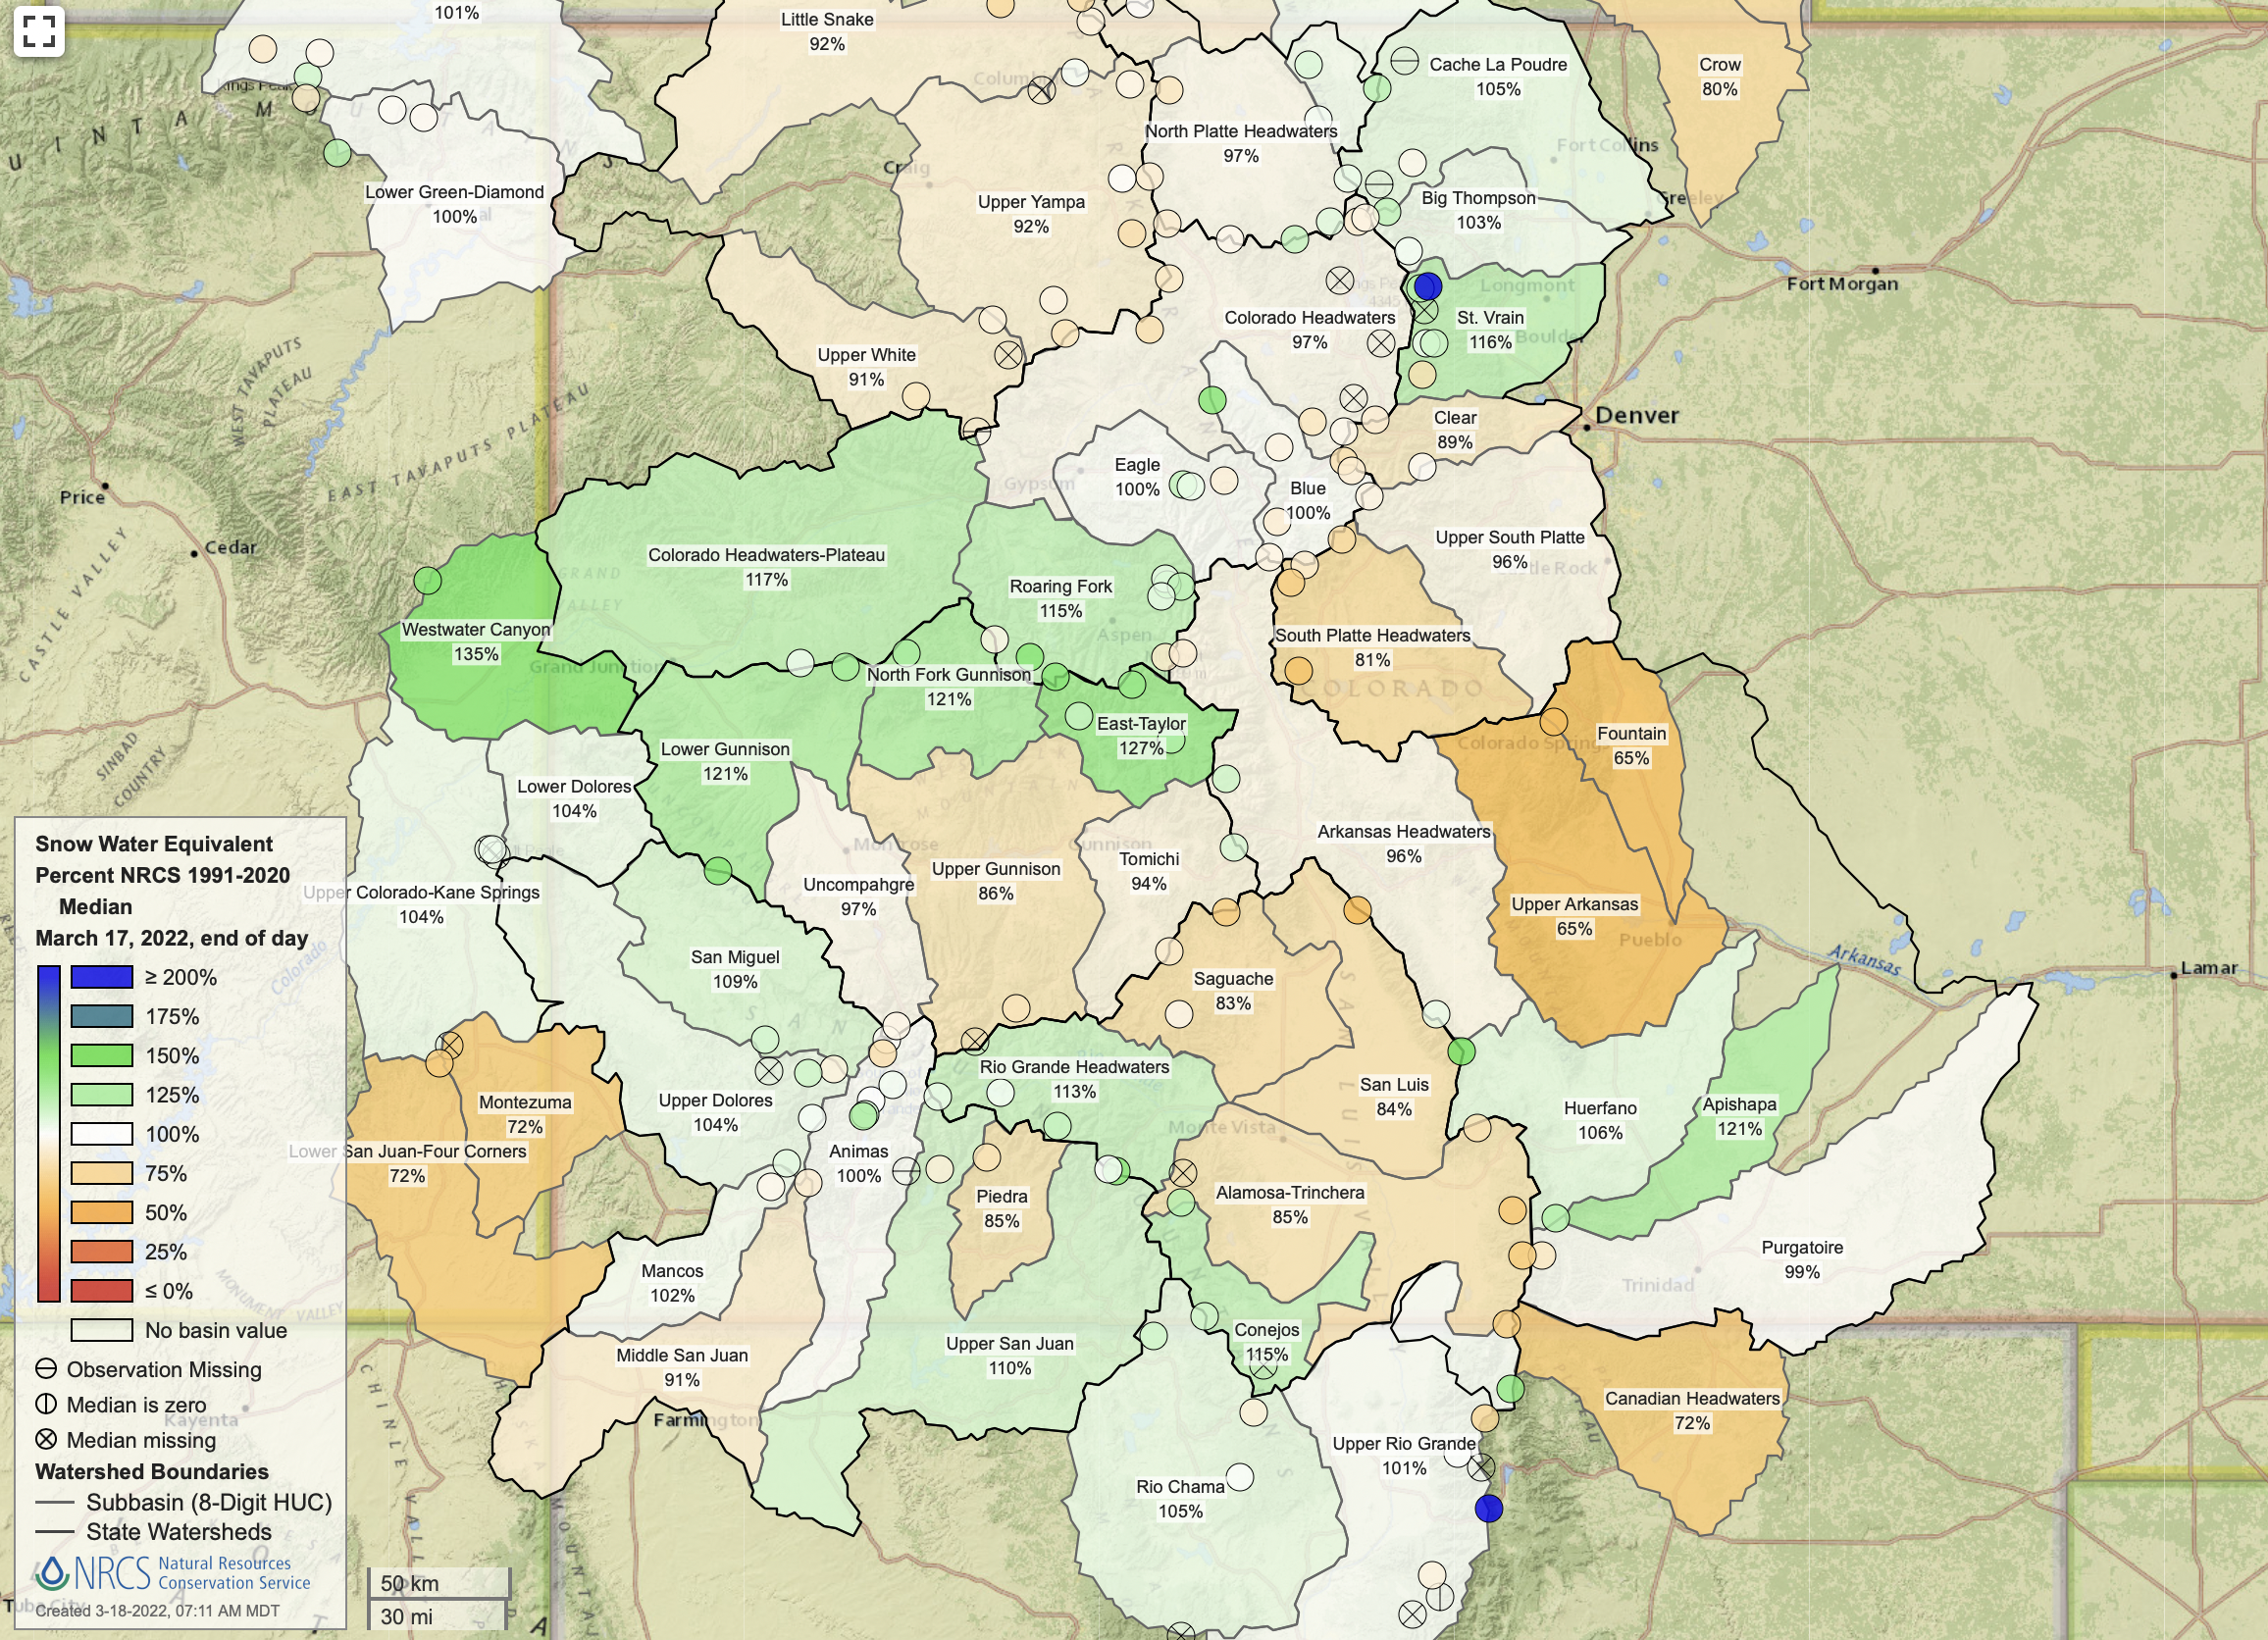
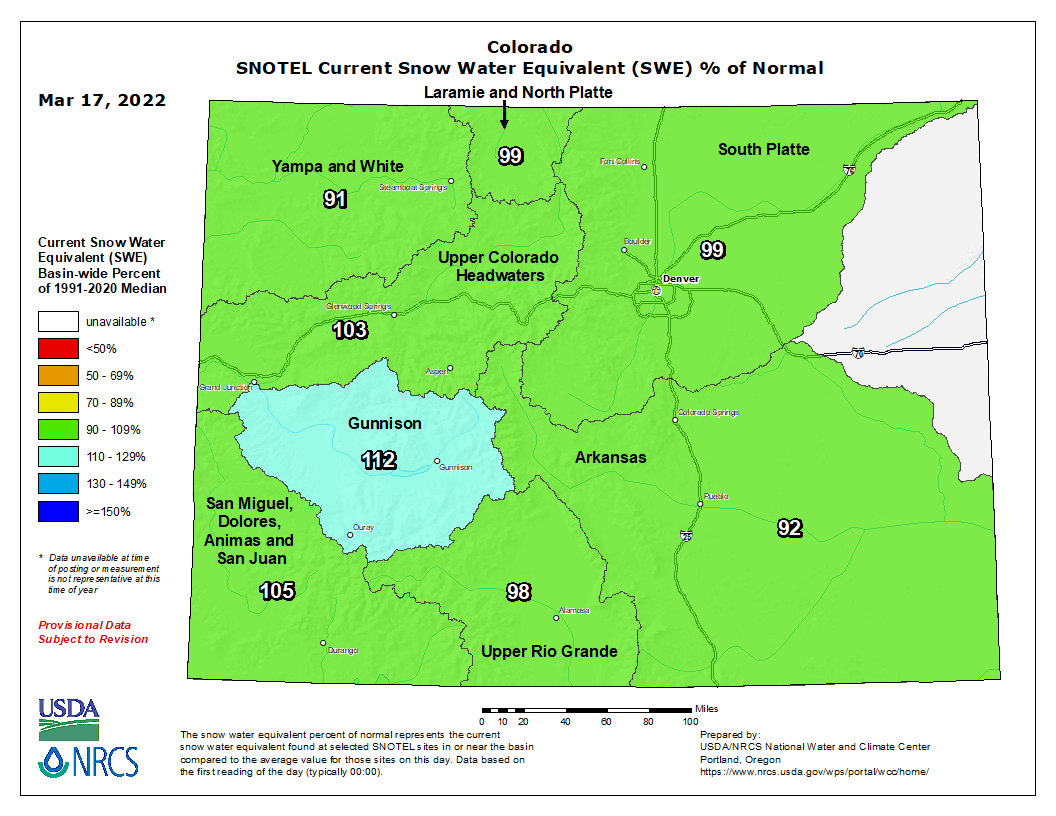
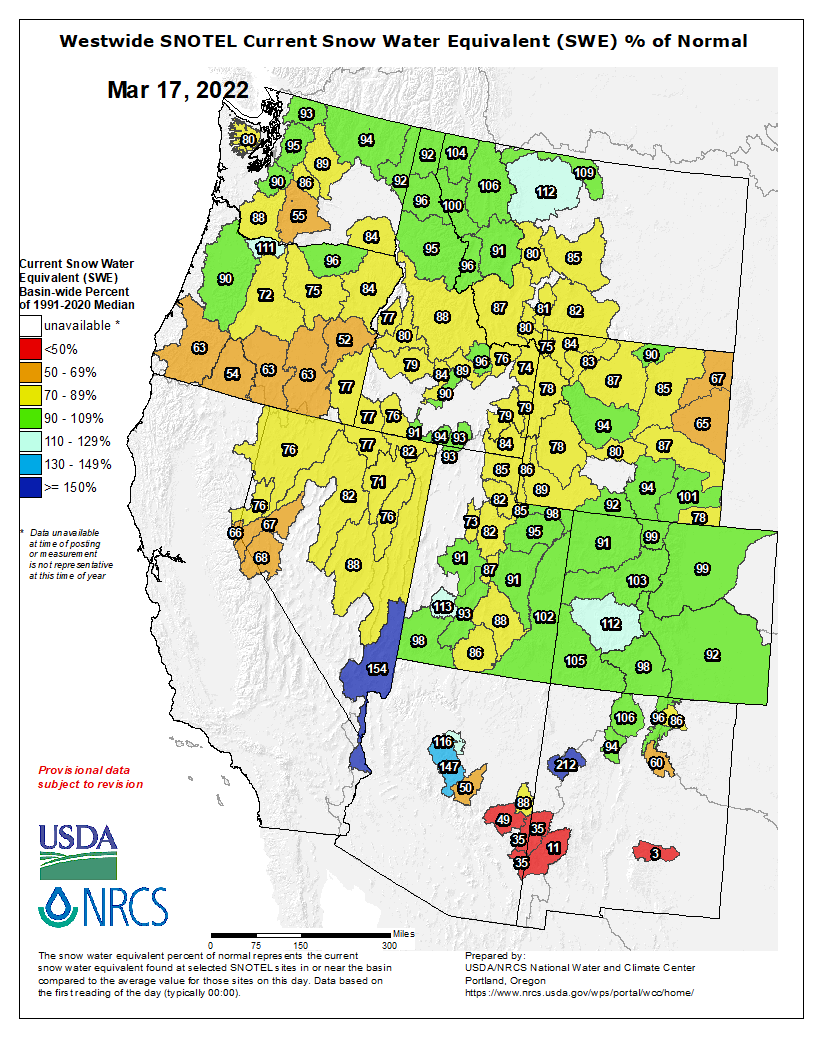
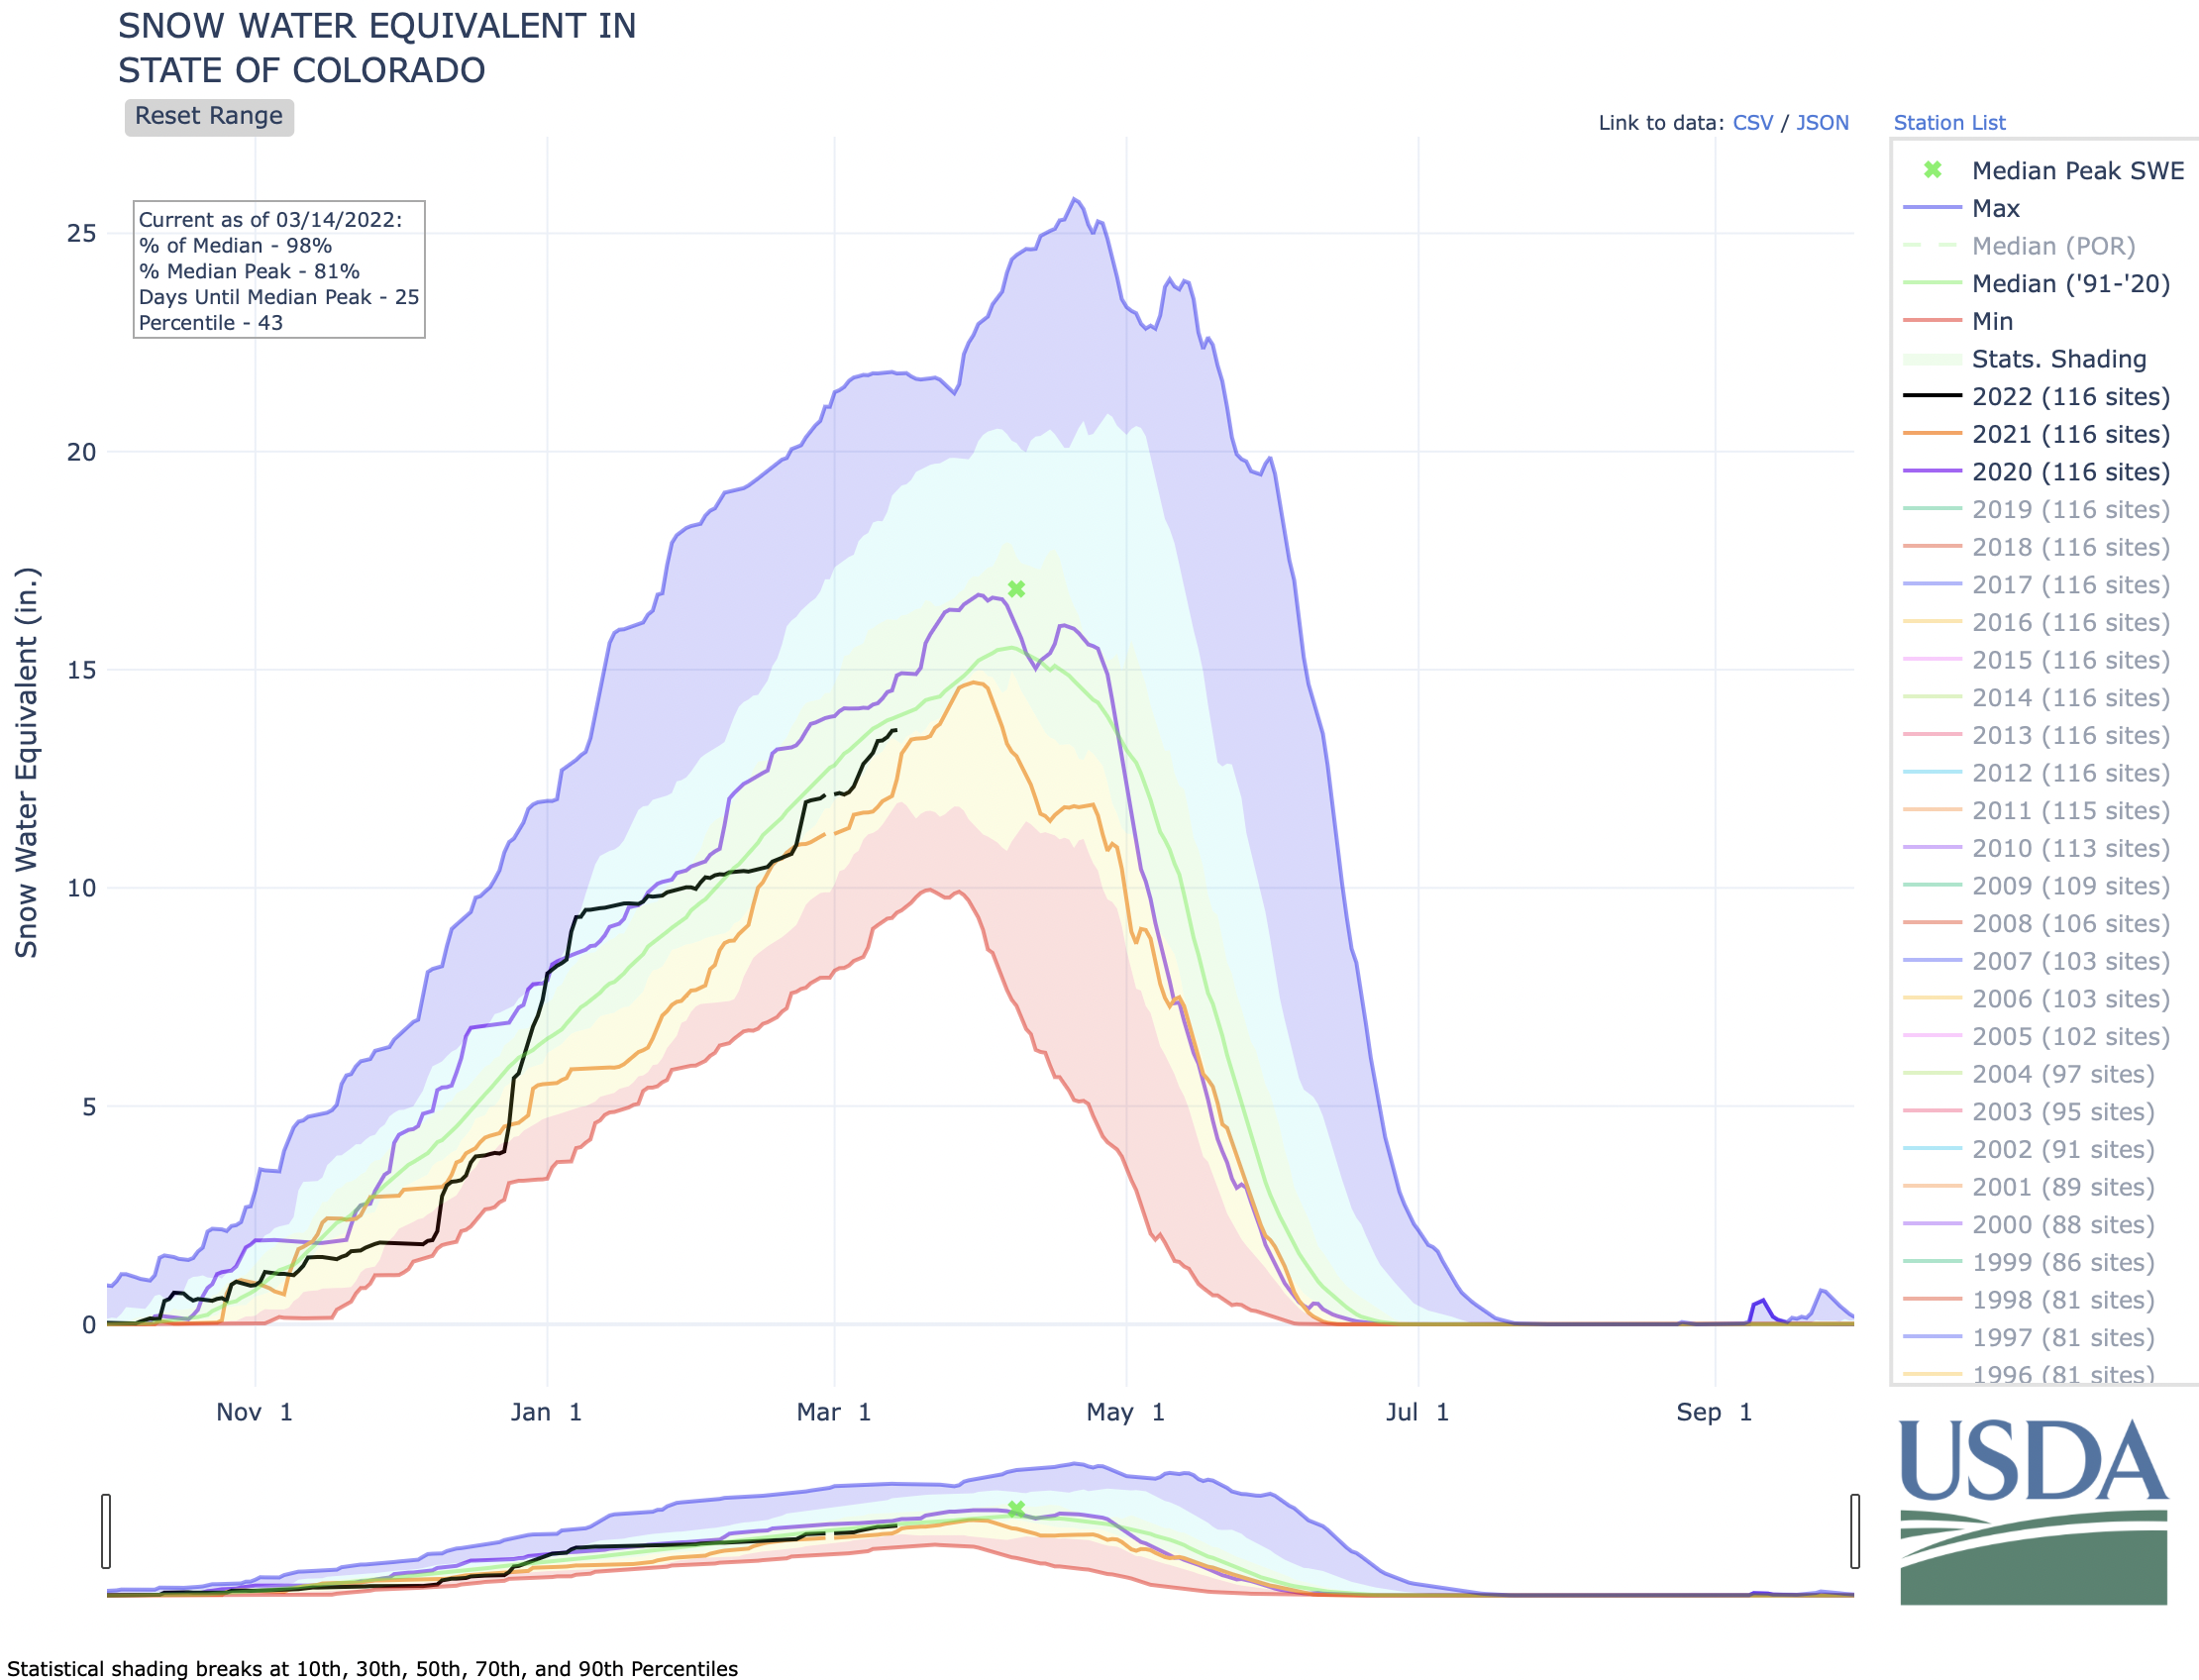
Colorado Snowpack 8-digit HUC view March 17, 2022 via the NRCS. (Click to enlarge)Colorado Snowpack basin-filled map March 17, 2022 via the NRCS.Westwide SNOTEL basin-filled map March 17, 2022 via the NRCS.
A herd of elk graze on Crystal River Ranch outside of Carbondale in spring 2020. The ranch is applying for a new stock watering water right. CREDIT: Brent Gardner-Smith/Aspen Journalism.
Click the link to read the newsletter on the Aspen Journalism website (Heather Sackett). Here’s an excerpt:
Crystal River Ranch
Crystal River Ranch, the huge expanse of irrigated land just west of Carbondale owned by Sue Anschutz-Rogers, a member of one of Colorado’s wealthiest families, is applying for another water right. This time, the ranch is asking for 5 cfs of water from the Crystal River for stockwatering. The majority of the 5 cfs would be to keep the water in the ditch ice-free so the cattle can drink from it in the winter. CRR pulls water from the Crystal via the Sweet Jessup Canal, and although it’s the first major agricultural diversion out of the lower Crystal, the land it irrigates is several miles downstream. The Sweet Jessup is also one of the biggest diversions on the Crystal and one of the oldest, with a water right dating to 1905. Its three water rights can pull a combined 74 cfs from the river. The Colorado Water Conservation Board and the city of Aurora have both filed statements of opposition to the application. In 2020, Crystal River Ranch filed to maintain a conditional water right for dams and reservoirs on the property, which a water court later granted.
ERIC Harmon is the type of person Douglas County says it wants to listen to.
He’s a hydrogeologist with expertise on the San Luis Valley aquifers of the Upper Rio Grande Basin. In fact, his team completed the groundwater component of the Rio Grande Decision Support System, which is generally described in state water court documents as “an interactive computer-based system that utilizes data and computer models to help decision makers solve unstructured problems.” The RGDSS is what the state relies on to determine the impact of groundwater pumping.
Harmon is also retired and hasn’t been part of any of the presentations that the three Douglas County commissioners have heard on Renewable Water Resources and its pitch to Douglas County to partner on exporting from the San Luis Valley.
What does Harmon’s experience and expertise say about the RWR proposal? He wrote a letter to the Douglas County commissioners outlining his concerns and recommendation that Douglas County reject the RWR proposal. He has yet to hear back from the commissioners. Alamosa Citizen also asked Douglas County for a response to Harmon’s letter.
Hydrogeologist Eric J. Harmon
“The Renewable Water Resources (RWR) proposal to Douglas County to use ARPA funds should be rejected in favor of less risky projects,” Harmon told the commissioners. “RWR’s project would place undue risks on San Luis Valley (SLV) water users and ratepayers (water customers) in Douglas County. Why? For that, we need to get down into the weeds on the SLV aquifers.”
Harmon said he has given expert testimony in the Division 3 Water Court (San Luis Valley) in the AWDI case (1991), the Confined Aquifer New Use Rules case (2006), the Great Sand Dunes In-Place Groundwater Right case (2008) and the Groundwater Rules case (2018).
“Confined aquifer tests in the SLV by my testing team were done as part of Colorado’s Rio Grande Decision Support System (RGDSS) in the early 2000s,” he said to the commissioners. “Our tests showed repeatedly that pumping impacts move outward from a confined aquifer well very rapidly, often causing drawdown (water level decline) up to ½ mile away within one day of pump startup. At several locations, pumping a deep well caused measurable drawdown in layers much shallower than the pumping zone. This is how confined aquifers work: drawdown spreads out very far, very fast. The SLV confined aquifer is ‘leaky.’”
After he sent along his letter to AlamosaCitizen.com for publishing, we asked him a few additional questions. The exchange is below:
AC: What concerns or thoughts, if any, can you share on the drought the San Luis Valley has been experiencing going back to 2002?
EH: Conditions are never static in hydrology. The dynamic nature of water, weather patterns, and the hydrologic cycle means that conditions are always changing. But where there is a long-term drought, the job of scientists and engineers becomes harder. It means that any predictions we are asked to make may be less reliable than we would like, because we don’t always have similar historic conditions we can look back on to compare to.
AC: The streamflow measurements documented by Davis Engineering for the Rio Grande Water Conservation District demonstrate troubling patterns. Have you recently looked at those streamflow measurements? In your view what type of impact is drought, climate change having on the basin and should that be a concern with the RWR proposal?
EH: I have tried to keep up with the general hydrologic trends in the Valley, including snowpack and streamflow. I have also kept up with the trends of Unconfined Aquifer storage change that Davis Engineering has done for RGWCD for many years. It is clear that even after a number of years of self-imposed pumping reductions in the Subdistricts, there is still too little water available to meet the irrigation demand, and to replenish the groundwater storage deficit in the Unconfined Aquifer in the Closed Basin. If drought or climate change persist in the future, as appears likely, then these impacts should be of concern in any new appropriation of water, whether by RWR or anyone else.
AC: Would the change in conditions, drought persistence, declining snow melt, particularly along the Sangre de Cristo range factor into a water court proceeding?
EH: Declining snowpack, earlier and faster runoff, and drought persistence certainly are of concern in the Sangre de Cristos, as they are in the San Juans. Valley-wide, the water supply from the Sangres is considerably less than it is from the San Juans. Smaller drainage areas, the “rain shadow” effect of the San Juans before the snowstorms get to the Sangres, and differences in topography and geology between the two ranges all are factors. If asked, I would advise the water court to look very hard at all of these factors. If groundwater recharge is less in the future than is predicted, it would almost certainly have an impact on the question of injury.
AC: Commissioner Teal said at the last meeting (March 8) that Douglas County has heard repeatedly that there is a “million acre feet” of water in the SLV aquifer. How does one address that notion?
EH: I can’t find any reference to a “million acre feet” in RWR’s proposal or in the presentations to Douglas County. RWR has stated that 22,000 acre-feet per year, the amount they intend to pump, is 2.5% of the aquifer’s annual recharge. So RWR’s number for annual recharge is 880,000 acre-feet. I do not know if this is what Commissioner Teal is referring to. The important thing, however, is not the annual groundwater recharge or the volume of groundwater in storage in the aquifer. The important thing is that the Valley’s water resources are over-appropriated. As Colorado Division of Water Resources officials have pointed out, this means there is no water available for appropriation and full (“1 for 1”) replacement is required under the Rules.
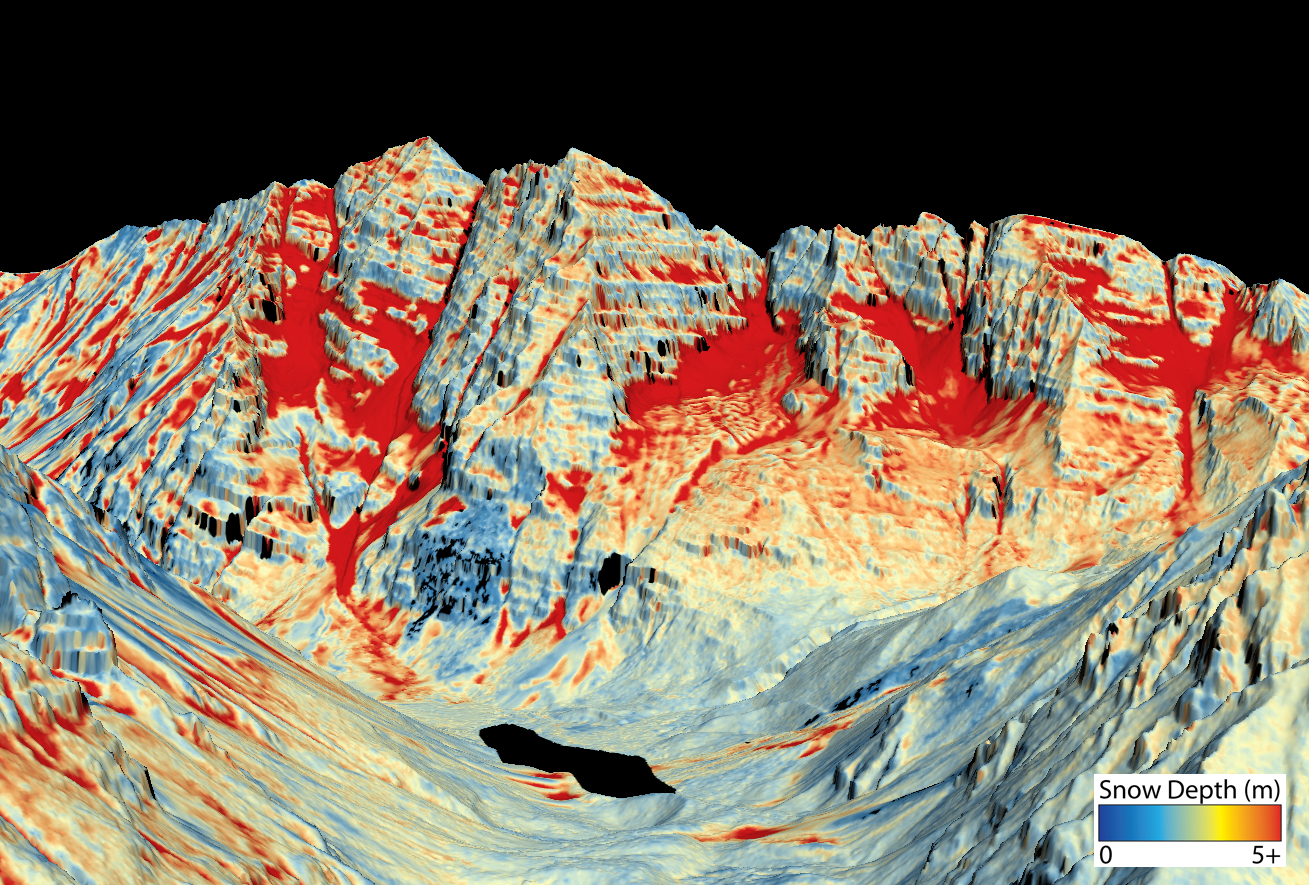
Colorado and othehr Western states are hoping to increase the use of Aerial Snowborne Observatories to better measure the water content in moutain snowpacks. Credit: NASA Hydrological Services
Colorado has approved a $1.9 million snow measuring initiative based on NASA technology that will help communities across the state better measure and forecast how much water each winter’s mountain snowpack is likely to generate, using planes equipped with sophisticated measuring devices.
The Colorado Water Conservation Board (CWCB) has been testing the accuracy of the flight-based data measuring work since 2015, according to Erik Skeie, who oversees the program for the CWCB. The board approved funding for the new $1.9 million initiative at its March 16 board meeting.
The new collective, known as Colorado Airborne Snow Measurement group, includes utilities, irrigation districts and environmental groups, including Northern Water, Denver Water and the Dolores Water Conservancy District, among others. In all, 37 water-related groups wrote letters in support of the grant and the measuring program, Skeie said.
Northern Water, which supplies more than 1 million residential, commercial and farm customers on the Northern Front Range, is hopeful the grant will help create an annual monitoring and measurement effort.
”I think it’s a really good program if we can make it sustainable into the future,” said Emily Carbone, water resources specialist at Northern Water.
This map shows the snowpack depth of the Maroon Bells in spring 2019. The map was created with information from NASA’s Airborne Snow Observatory, which will help water managers make more accurate streamflow predictions. Jeffrey Deems/ASO, National Snow and Ice Data Center
Airborne Snow Observatory technology uses planes equipped with LiDAR, a pulsing radar, to develop a grid that contains a deeply detailed picture of the ground when it isn’t covered by snow. Then, during the winter months, those planes fly the same terrain once or more each month when it is covered with snow. In this way, the instruments are able to measure snow depth and snow reflectivity. These data, combined with computer-based models, allow the ASO to generate precise readings on when the snow will actually melt and how much water the snowpack in different regions actually contains.
Traditional forecasts can be off by as much as 40%, and sometimes more. But ASO forecasts have been shown to have accuracy rates of 98%.
As the megadrought in the Colorado River Basin has intensified, and climate change has altered snowfall and traditional patterns of snowmelt, finding better ways to measure the water content of snow has become critical, said Taylor Winchell, a climate adaptation specialist at Denver Water who is overseeing the utility’s flight data program.
A flight from NASA’s Airborne Snow Observatory gathers data about the snowpack above Dillon Reservoir on a flight. Information gathered from the flight helped Denver Water manage reservoir operations. Photo courtesy of Quantum Spatial
Denver Water began using the technology in 2019.
“As the snowpack is changing, the more accurate measurements that we can have help us adapt our operations to a new water future and it helps us make the most of every drop in the system,” Winchell said.
Since the early 1930s, snowpacks have been measured manually and via remote ground-sensing by the federal Natural Resources Conservation Service. Colorado and other Western states use a network of dozens of snotel sites to collect on-the-ground data, but forecasts can change dramatically if the weather becomes volatile, as has been the case more often in recent years.
That volatility and the ongoing drought have made water forecasting even more critical for water agencies. If water supplies come in lower than forecasts indicated, cities and irrigation districts can come up short of water, causing disruptions in deliveries, among other problems.
But ASO technology is expensive. Denver Water spends about $145,000 for two flights, a cost that includes subsequent modeling as well. But the forecasts have proved to be so accurate that the utility is committed to its ongoing use.
California is spending roughly $7 million annually and that cost could grow to more than $20 million if the golden state opts to expand the geographic reach of its ASO program, according to Tom Painter, a former NASA scientist who helped develop the ASO technology and who is now the CEO of Airborne Snow Observatories Inc., the NASA spinoff that is commercializing the technology.
A similar program in Colorado, one expansive enough to cover all the critical mountain watersheds, could cost as much as $15 million annually, Painter said.
The work would include flying some 10 flights per year per river basin during January, February, March and April, with additional flights in late spring as the snow begins to melt. Then flight data would be incorporated into forecast models.
Predicting snowmelt and its water content as warm weather arrives has been a tricky issue for researchers and water utilities because it becomes highly variable.
“That’s when traditional models start to fall apart,” Painter said. “They can’t hold onto the snowpack well enough. So having the data from ASO is nice to keep the forecast accurate. It’s like looking at your checking account balance a couple of times a month.”
Skeie, of the CWCB, said the new approach to measuring what’s known as snow water equivalent, or the amount of water contained in the snow, will take much of the guess work out of annual water forecasts.
And he’s hopeful that the multi-million price tag can be covered by an array of agencies, including the water utilities, the U.S. Bureau of Reclamation and state governments, among others.
“It’s going to take all of that to make it sustainable,” Skeie said. And with the backing of the Colorado Airborne Snow Measurement group, it’s more likely to occur than it has been before.
Using ASO, in combination with snotel data, “is the difference between having someone describe a picture to you, and being able to see it in 4D,” he said. “It’s incredibly useful.”
Jerd Smith is editor of Fresh Water News. She can be reached at 720-398-6474, via email at jerd@wateredco.org or @jerd_smith.
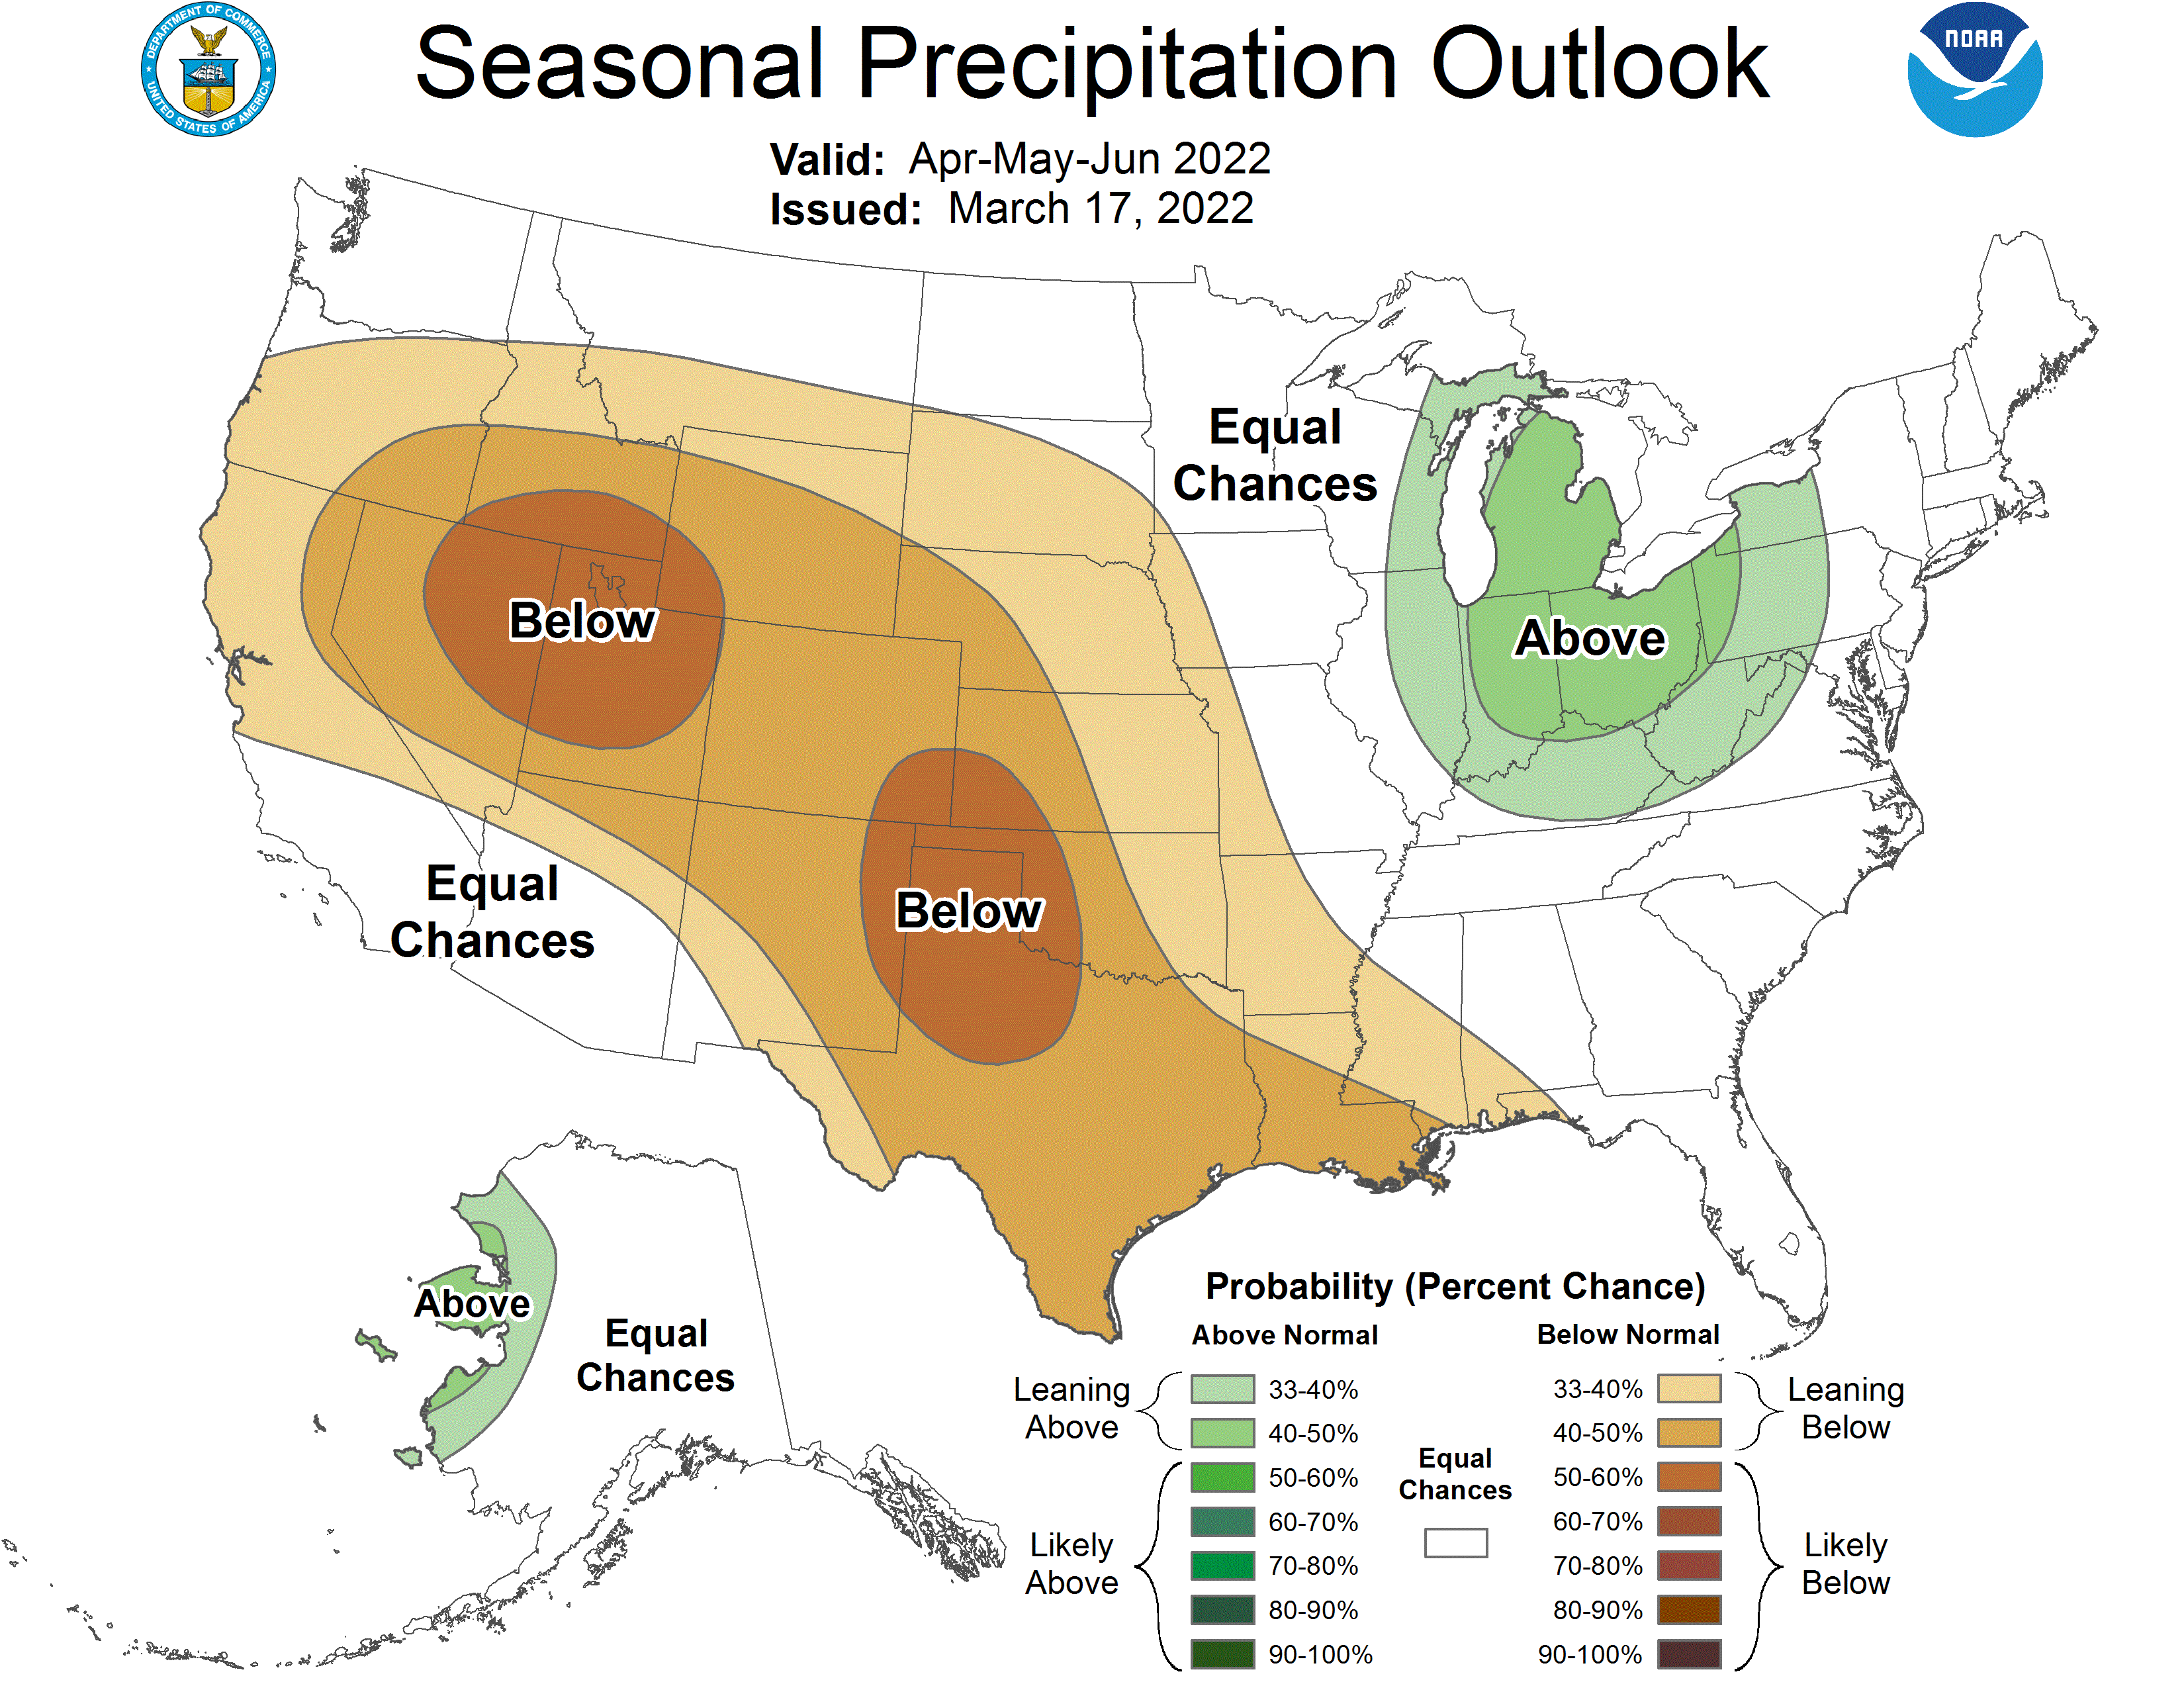
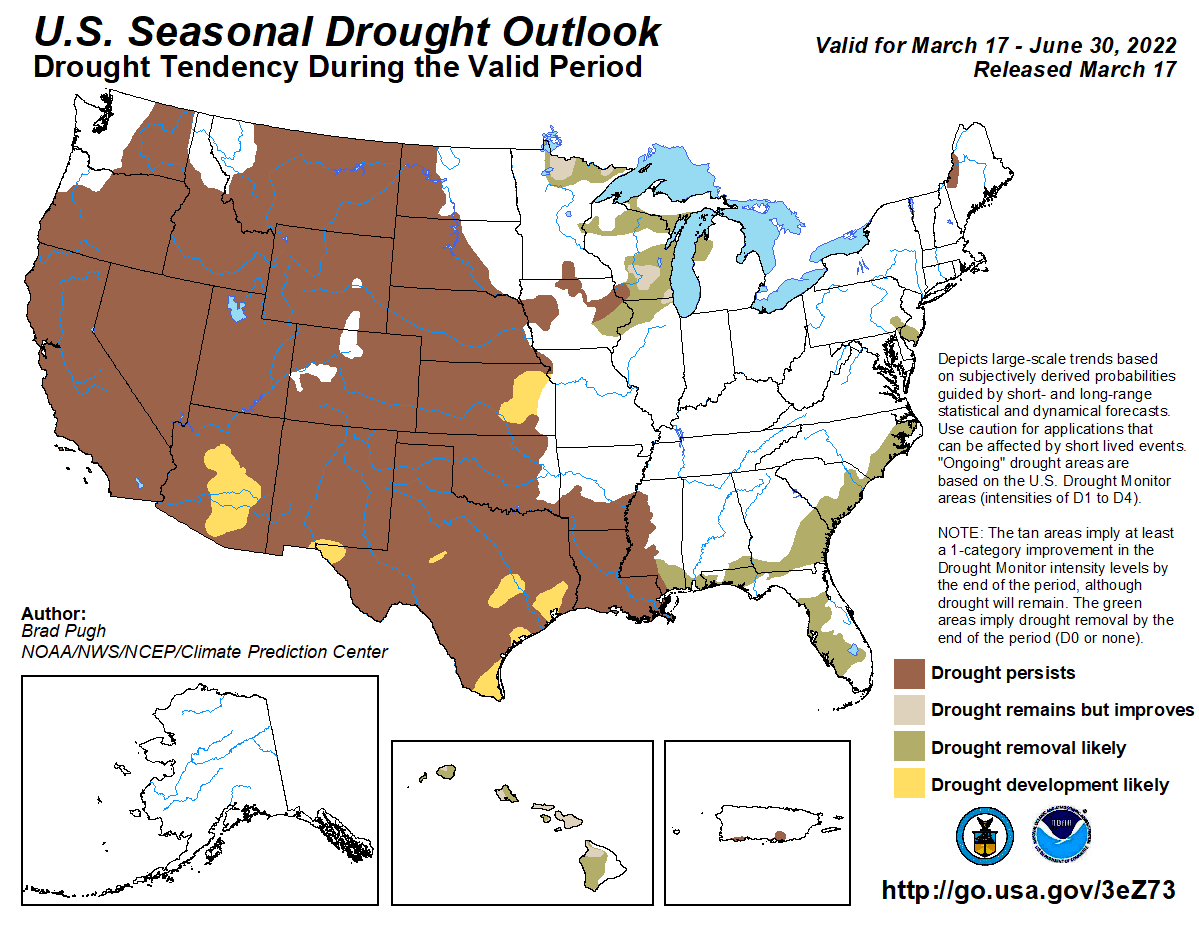
High pressure dominated across much of the central U.S. this week, bringing much below-normal temperatures (more than 10°F below-normal) to the Eastern Rockies, Great Plains, and parts of the Mississippi Valley. Much of the north-central U.S. remained below freezing last week. However, where daytime high temperatures did average above the freezing mark, below-normal precipitation and high winds resulted in some drought degradation across parts of the Great Plains. A series of low pressure systems moving across the southern and eastern U.S throughout this week brought heavy rainfall to parts of the Gulf Coast states and Eastern Seaboard, leading to drought improvements. Northern Florida received the greatest rainfall amounts, with several areas picking up anywhere from 5 to 10 inches of rain through Saturday. The strongest of these storm systems also brought snowfall to the Appalachians and interior areas of the Mid-Atlantic and Northeast Friday into Saturday. In the Pacific Northwest, a series of storms brought some drought improvements to parts of the central Cascades and interior northern Rockies. Farther south across California, drought intensified this week due to mounting deficits since the beginning of the year…
Although the High Plains region experienced widespread much below-normal temperatures this week (10°F to 15°F below-normal; even exceeding 15°F below-normal in the High Plains and Eastern Rockies), several areas saw continued deterioration of drought conditions. This was particularly true across parts eastern Nebraska and central Kansas, where high winds and below-normal 7-day precipitation only exacerbated ongoing short-term dryness brought about by a very dry winter season. Several of these areas have received only 5 to 20 percent of normal precipitation over the past 120 days and the fire risk has rapidly increased as a result. Shallow soil moisture is ranking below the 5th percentile of the climatological distribution, according to NASA SPoRT, and average stream flows are continuing to decline. Parts of southeastern Colorado, which is experiencing short to long-term drought, also experienced degradation this week from severe (D2) to extreme (D3) drought, supported by Keetch-Byram Drought Indices and short-term precipitation deficits (25 to 50 percent of normal precipitation over the past 90 days). Parts of northwestern Wyoming also experienced deteriorating drought conditions, due to depleted groundwater and year-to-date precipitation deficits that are now on the order of 5 to 10 inches. Conversely, there were targeted improvements across central Wyoming and northern Colorado, based on where positive weekly precipitation anomalies were observed, precipitation amounts are above-normal for the water year (since October 1, 2021), and NASA SPoRT soil moisture and USGS 7-day average stream flows are near and above-normal locally…
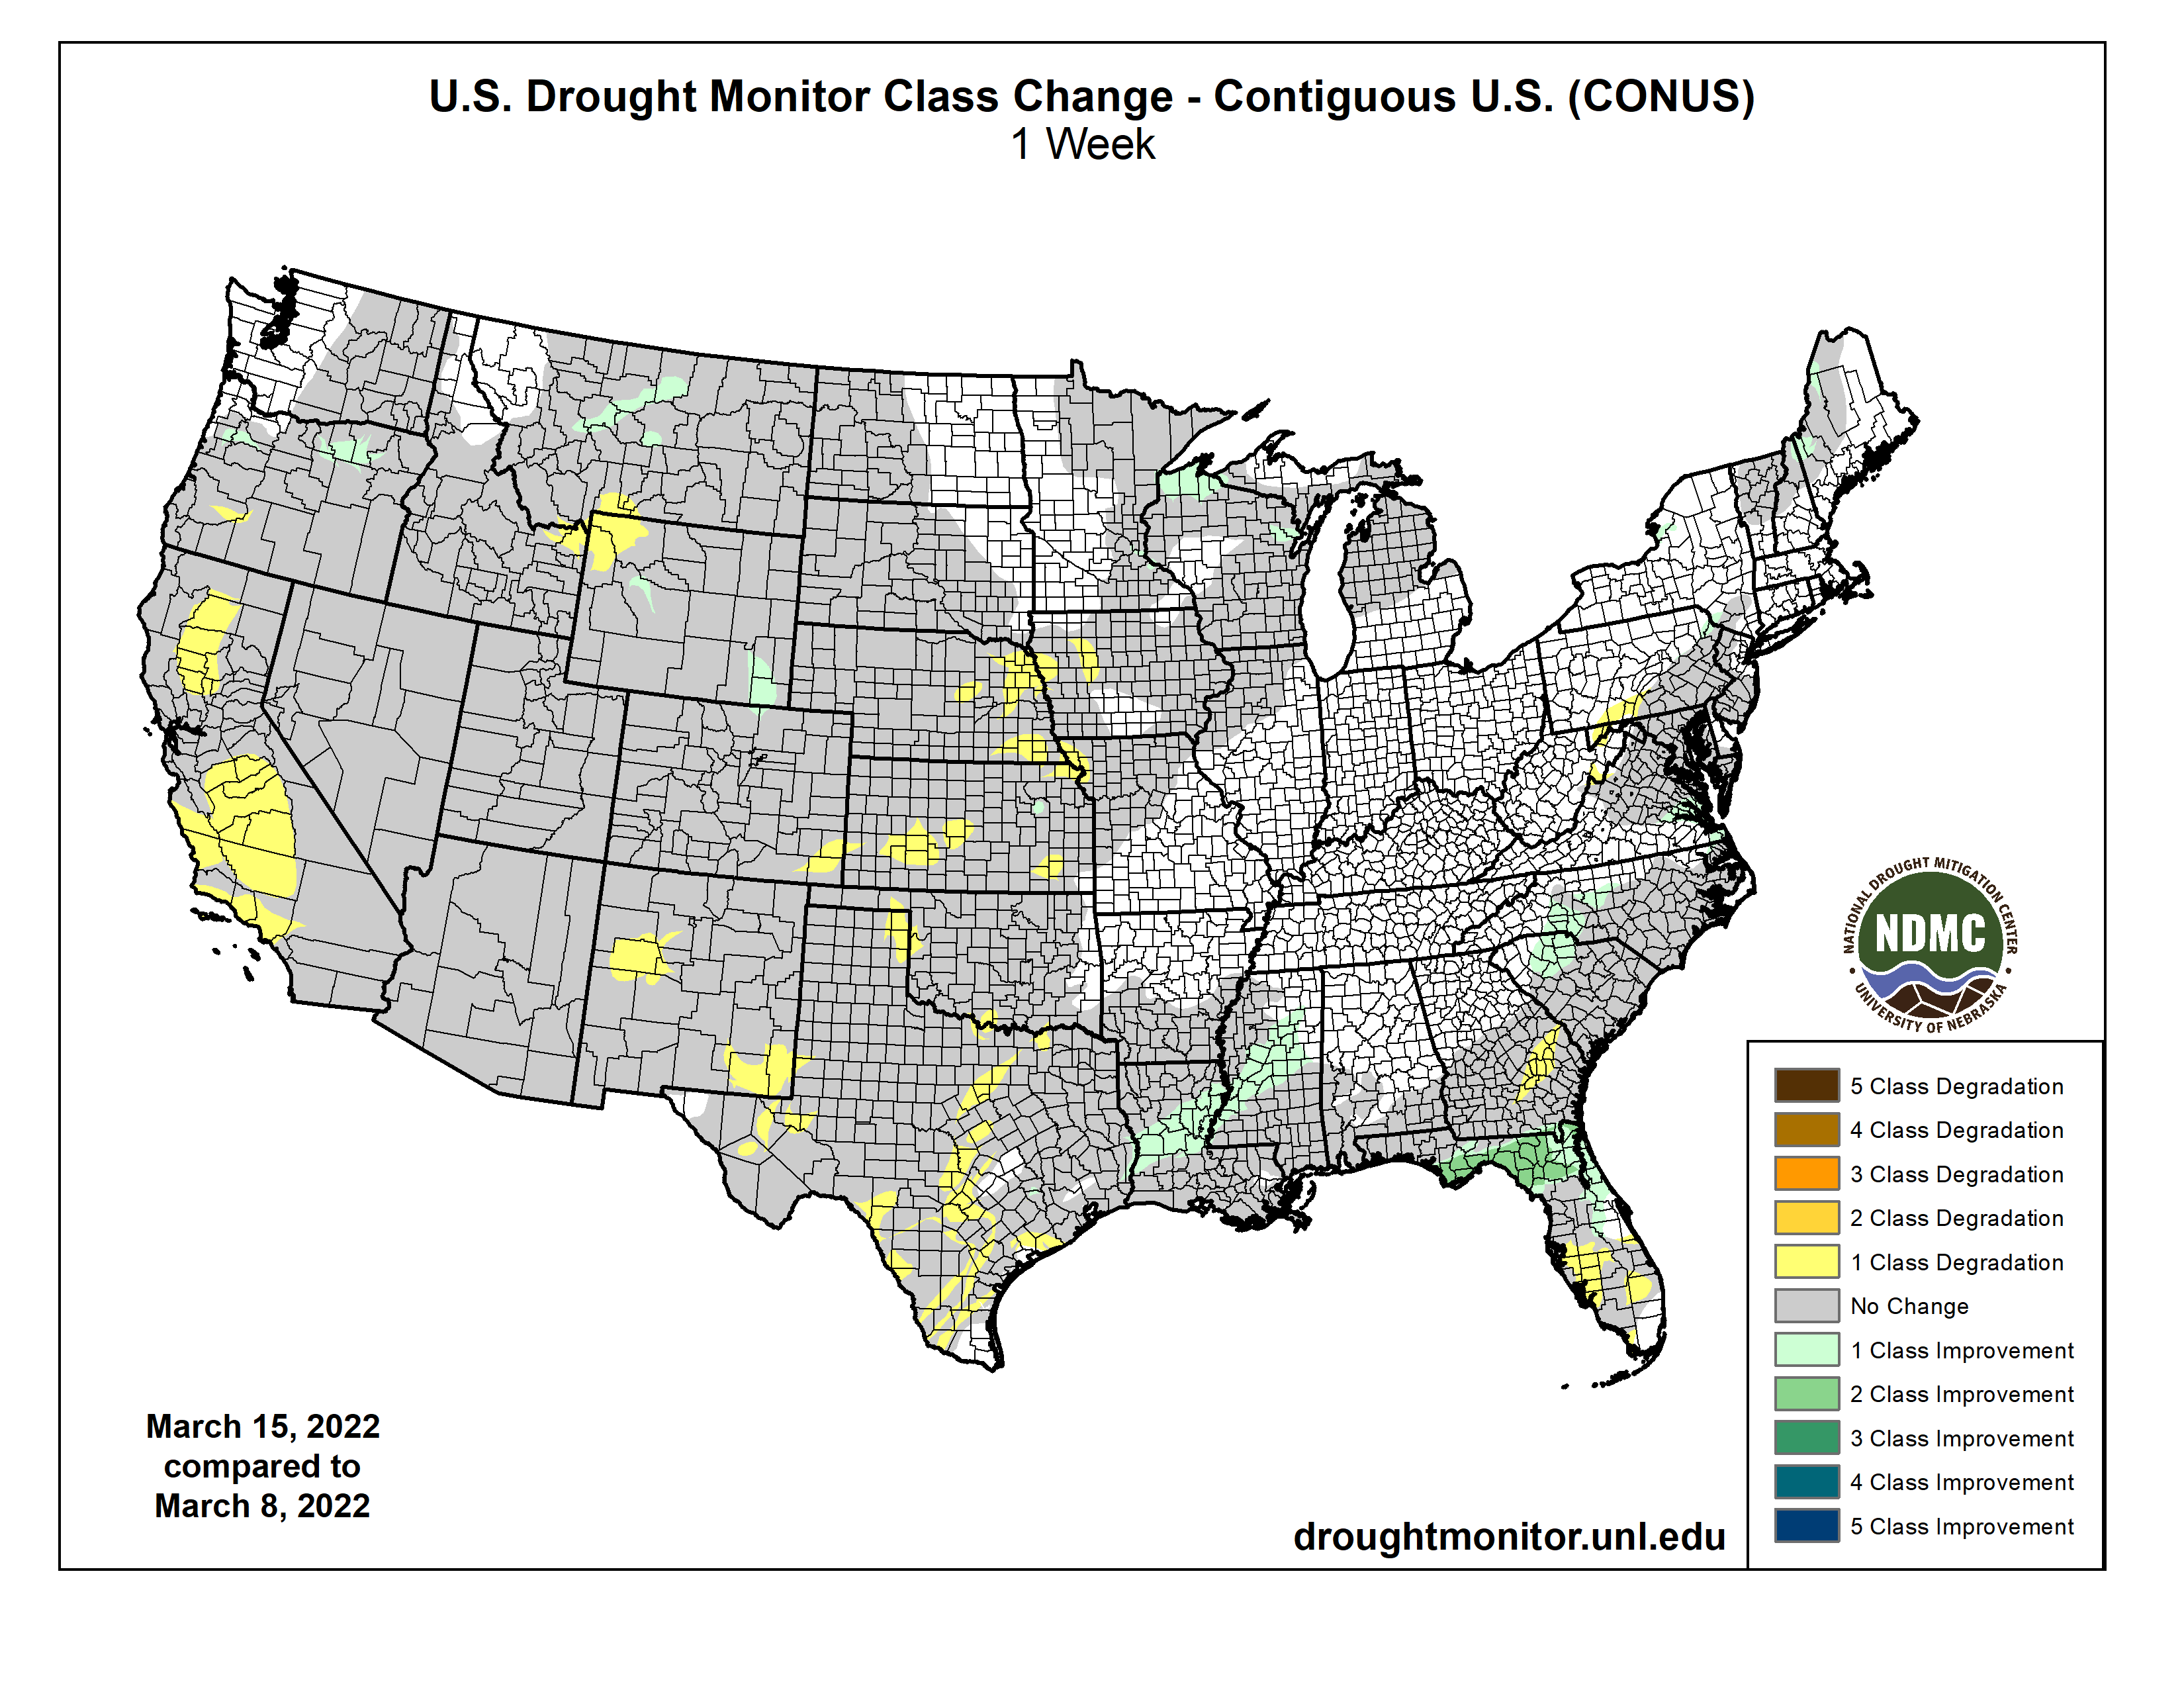
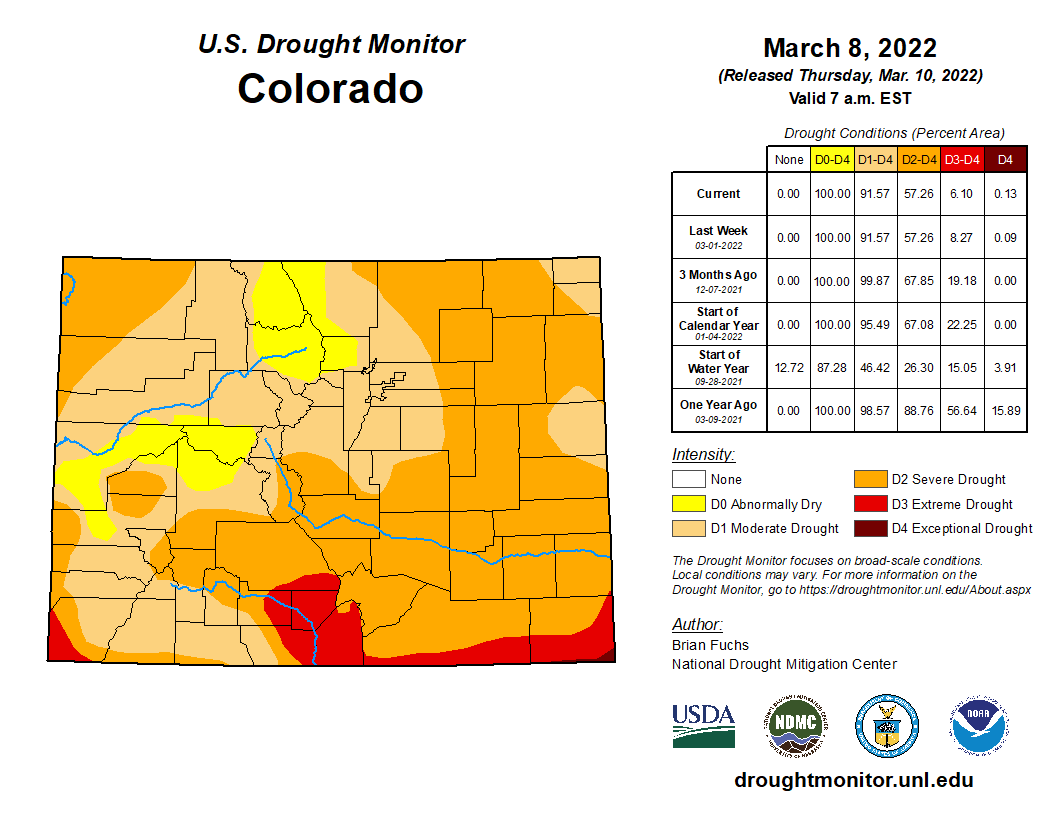
Colorado Drought Monitor one week change map ending March 15, 2022.
Following a very wet December 2021 (in some cases a record wet December) for many areas in the West, a very dry pattern has persisted since the start of 2022, mainly from southern Oregon southward. Average snow water equivalent (SWE) values have continued to decline across many basins in the West and are now below-normal since the start of the water year (October 1, 2021). Despite, the drying trend leading up to this week across many areas, a stormy pattern brought above-normal precipitation to parts of the Pacific Northwest and Northern Rockies this week, leading to targeted improvements in the central Cascades, northeastern Oregon, and central Montana, where short-term SPEIs and average stream flows are improving, basin SWE values are near 100% of normal, and precipitation is above-normal for the water year. Conversely, farther south in California, widespread deterioration was warranted across parts of the San Joaquin and Sacramento Valleys and the Central Coast. Many of these areas have experienced record dryness since the start of 2022, which has driven some reservoirs to record low levels and resulted in widespread stream flows and soil moisture ranking below the 2nd percentile. Water availability is a real concern as allocation from the Central Valley Project is likely to be either much reduced or non-existent for many farmers in California’s Central Valley, according to the U.S. Bureau of Reclamation…
A series of low pressure systems, tracking across the Gulf Coast states throughout this week, resulted in heavy rainfall across parts of eastern Texas and the Lower Mississippi Valley, leading to broad 1-category improvements where the heaviest rains fell. Some parts of central Louisiana and west-central Mississippi received more than 5 inches of rainfall. Despite year-to-date rainfall deficits being reduced to near zero for several locations and USGS average stream flow running near-normal, soil moisture still ranks between the 5th and 10th percentile of the climatological distribution. This indicates that drought is still firmly entrenched across the Lower Mississippi Valley and that more rainfall will be needed to continue to see meaningful improvements. Farther west across central Texas and parts of Oklahoma, drought continued to intensify. Conversely, high winds and below-normal precipitation prevailed across central Texas and western Oklahoma this week, leading to continued drought degradation. Fire risk remains a concern across many of these areas…
Looking Ahead
A storm system will exit the Rockies Thursday, bringing the potential for snowfall to the Eastern Rockies and Front Range. This system is forecast to intensify and move eastward across the lower 48, bringing an increased potential for precipitation of various types to many areas across the eastern U.S. before exiting the Eastern Seaboard by late Sunday into early Monday. As this system exits the eastern U.S., another low pressure system is forecast to track across the western U.S. and intensify over the Great Plains leading up to Tuesday. In the West, much of the heavier precipitation is forecast across parts of the Pacific Northwest, associated with the storm system later in the week. There are also increased chances of precipitation and high elevation snowfall across much of the West as this system tracks across the Rockies. The heaviest 7-day precipitation amounts are likely to be focused across parts of the Central and Southern Plains eastward to the Middle and Lower Mississippi Valley, with amounts accumulating from both storm systems.
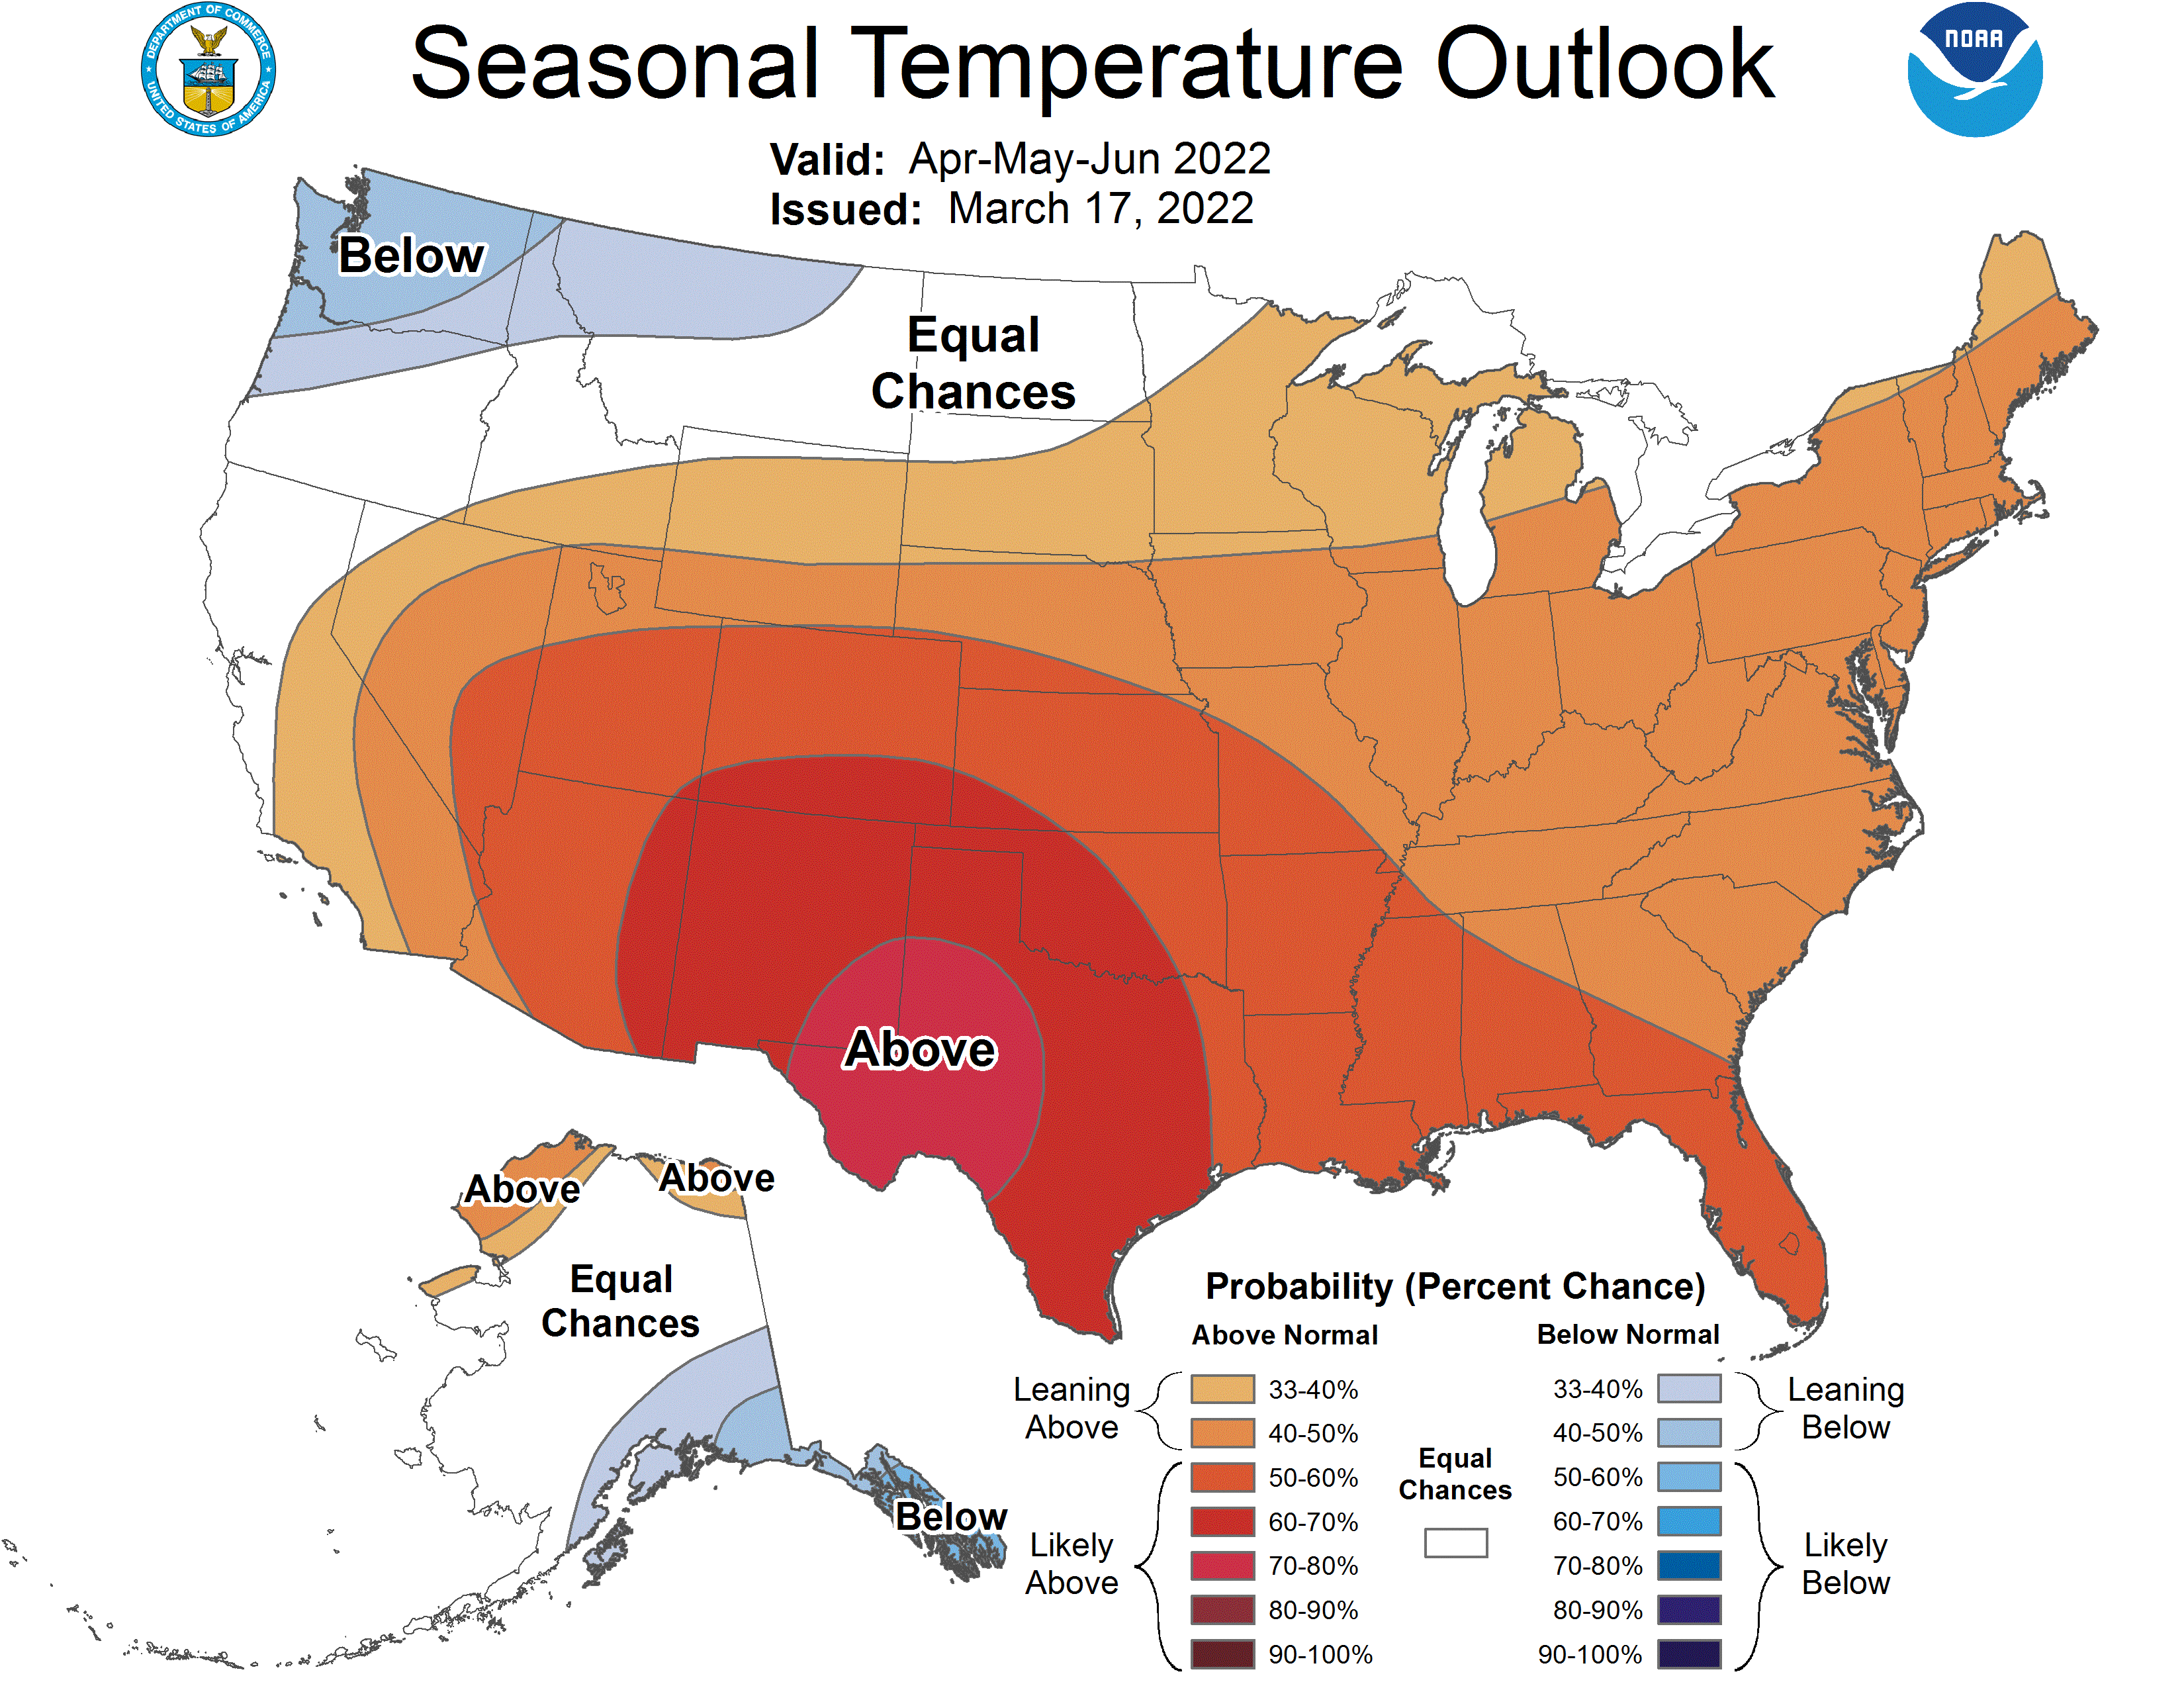
The Climate Prediction Center’s 6-10 day outlook (valid March 22-26, 2022) favors above-normal temperatures across much of the western and eastern contiguous U.S. (CONUS) and the Northern Plains. In the central CONUS, near and below-normal temperatures are forecast for many locations, associated with a mean trough of low pressure. Below-normal precipitation is favored for much of the western third of the CONUS, underneath a mean ridge of high pressure. Conversely, above-normal precipitation is favored for the eastern two-thirds of the CONUS, associated with mean southerly flow from the Gulf of Mexico enhancing precipitation chances, particularly across the Southeast.
US Drought Monitor one week change map ending March 15, 2022.
Seven Western states and their leaders — all depending on water from the Colorado River — remain divided.
September 21, 1923, 9:00 a.m. — Colorado River at Lees Ferry. From right bank on line with Klohr’s house and gage house. Old “Dugway” or inclined gage shows to left of gage house. Gage height 11.05′, discharge 27,000 cfs. Lens 16, time =1/25, camera supported. Photo by G.C. Stevens of the USGS. Source: 1921-1937 Surface Water Records File, Colorado R. @ Lees Ferry, Laguna Niguel Federal Records Center, Accession No. 57-78-0006, Box 2 of 2 , Location No. MB053635.
Split into basins by an imaginary border at Lees Ferry, Arizona, each state can share blame for the rapid depletion of reservoirs that once held over four years’ flow of the Colorado River. But now, Lake Powell and Lake Mead edge closer to empty. With water savings gone, the Lower Basin has been trying to cope, though the Upper Basin carries on business as usual. Meanwhile, 40 millions Americans depend on flows from this over-diverted river.
So far, leaders in the Upper Basin states of Colorado, New Mexico, Utah and Wyoming appear to be hoping that their counterparts will agree to use less water. This is hardly a useful strategy and seems a lot like a dangerous game of chicken.
The brunt of low flows has been borne by the Lower Basin states of Arizona, Nevada and California. Thanks to a series of agreements between 2007 and 2021, by the end of this year the three states will curtail their river use by more than 1 million acre-feet — 325 billion gallons. But it’s likely these cuts won’t change much.
Federal data released last month predict that Lake Mead, the largest reservoir in the nation and the Lower Basin’s water savings account, will continue to lose water for years to come. Lake Powell, the Upper Basin’s savings account, is also vulnerable. But that raises the obvious question: What are Colorado, Wyoming, Utah and New Mexico doing to limit their water use and conserve? The answer is not much.
In the Upper Basin’s four states there are no self-imposed curtailments of Colorado River allocations — no blockbuster, big-city conservation initiatives, no real signs that leaders are convinced that climate change is not only happening but also a major threat to the region.
More discouraging is that in 2016, the interstate collective of Upper Basin officials, known as the Upper Colorado River Commission, officially decided to take more water out of the river. That decision stands today.
Lake Powell Pipeline map via the Washington County Water Conservancy District, October 25, 2020.
Some of the largest projects on the Upper Basin’s wish list include the Lake Powell Pipeline, Green River Block Exchange, Wolf Creek Reservoir, and the Fontenelle Dam expansion…
Does anyone think that extra water exists?
The Bureau of Reclamation, which manages the Colorado River’s infrastructure, released a report in mid-February that predicts Lake Mead will drop another 30 feet by the end of 2023 –– leaving the reservoir 160 feet lower than in the year 2000. It also predicts more cuts for Nevada’s and Arizona’s shares of the river, as well as for California.
In the Upper Basin, where the Colorado River begins, no cuts are proposed. And according to a new report from the Utah River’s Council, a nonprofit fiscal and water watchdog, most of the Upper Basin states continue to use more than their share of the river, even though drought and aridity have reduced river flows.
While the three Lower Basin states use more water than the drought-stricken Colorado can deliver annually, leaders in Arizona, Nevada and California share a spirit of sacrifice when it comes to limiting water use. From my experience running a nonprofit river-protection group, I know that collaboration toward these efforts represents a resolve to act.
The Lower Basin states, for example, are working to fund a water-recycling facility near Los Angeles. The plant would reduce California’s reliance on the Colorado River and give Nevada and Arizona some of that river water in return for their joint funding. Collaborations like this need to start happening in the Upper Basin, but where are the examples?
Water managers in both basins tell folks they are doing their best to deal with the river’s decline, but only the Lower Basin’s actions can be quantified. It’s time for the Upper Basin to blink in this game of chicken and ensure equitable and prudent uses of the river. The lines dividing the states are invisible, but bathtub rings on Lake Powell and Lake Mead are all too visible.
Kyle Roerink via Writers on the range.
Kyle Roerink is a contributor to Writers on the Range, http://writersontherange.org, a nonprofit dedicated to spurring lively conversation about the West. He is the executive director of the Great Basin Water Network, a nonprofit that defends water supplies from undue political and corporate influence in the nation’s two driest states, Nevada and Utah.
Click the link to read the article on the 9News.com website (Wilson Beese). Here’s an excerpt:
The town said its water treatment facilities have been restored, and the system has been flushed through the distribution network after suffering damage during the wildfire…
Reservoir ash removal
The fire deposited ash on the town’s raw water storage at Terminal Reservoir. A firm has been contracted to remove ash from the banks of the reservoir, which will prevent deposited ash from going into the reservoir. The process should be completed in early April.
Chlorine dioxide
Superior installed chlorine dioxide within water treatment plant operations to assist with the oxidation and breakdown of compounds causing the taste and odor issues. Complaints from residents continued after the system was installed, and its use was discontinued.
Granular Activated Carbon (GAC)
The town ordered a GAC system to remove compounds causing the taste and odor issues. It will take four to six weeks for delivery and an additional two weeks for installation.
“This is a significant process revision and will require extensive modifications to the plant,” the town said in a release. “Our team is diligently working, including collaborating with other utilities, on procuring all the equipment required to bring this system online as fast as possible.”
Reservoir draining
Superior will soon begin releasing water from the reservoir into the parks irrigation system, which might help replenish the reservoir with water free of compounds causing the taste and odor issues.
Home filtration systems
The town said that home water filtration systems, especially those that use activated carbon, “may effectively remove” the compounds responsible for the taste and odor issues.
Aerial image of entrenched meanders of the San Juan River within Goosenecks State Park. Located in San Juan County, southeastern Utah (U.S.). Credits Constructed from county topographic map DRG mosaic for San Juan County from USDA/NRCS – National Cartography & Geospatial Center using Global Mapper 12.0 and Adobe Illustrator. Latitude 33° 31′ 49.52″ N., Longitude 111° 37′ 48.02″ W. USDA/FSA, Public domain, via Wikimedia Commons
From email from Reclamation (Susan Novak Behery):
In response to increasing flows in the critical habitat reach, the Bureau of Reclamation has scheduled a decrease in the release from Navajo Dam from 400 cubic feet per second (cfs) to 350 cfs for Thursday, March 17th, at 4:00 AM.
Releases are made for the authorized purposes of the Navajo Unit, and to attempt to maintain a target base flow through the endangered fish critical habitat reach of the San Juan River (Farmington to Lake Powell). This release change is calculated as the minimum required to maintain the target baseflow.
The San Juan River Basin Recovery Implementation Program recommends a target base flow of between 500 cfs and 1,000 cfs through the critical habitat area. The target base flow is calculated as the weekly average of gaged flows throughout the critical habitat area from Farmington to Lake Powell.
Lake Powell just north of Glen Canyon Dam. January 2022. Jonathan P. Thompson photo.
Click the link to read the article on the Land Desk website (Jonathan Thompson):
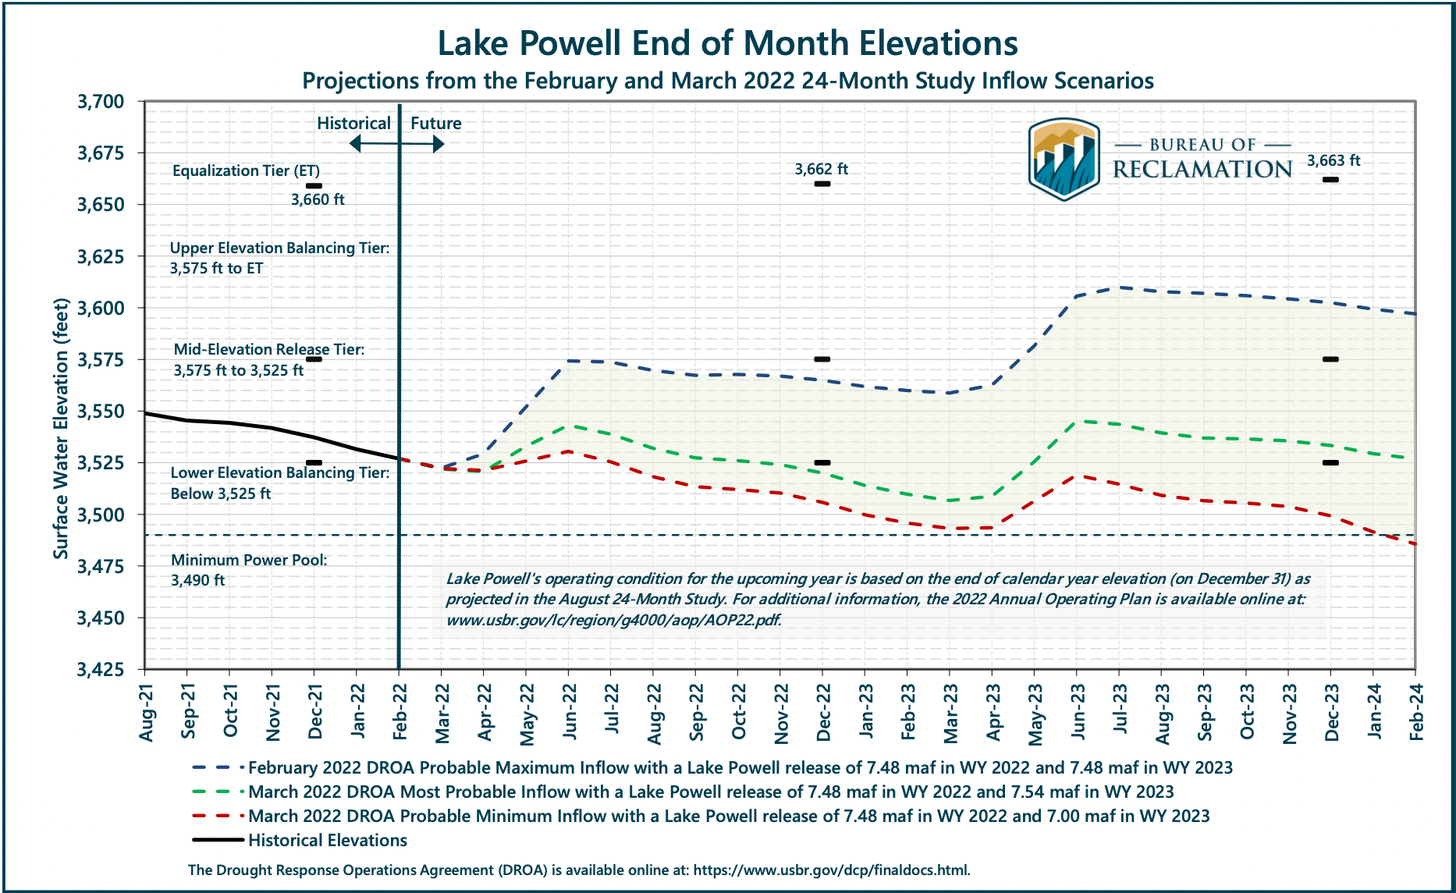
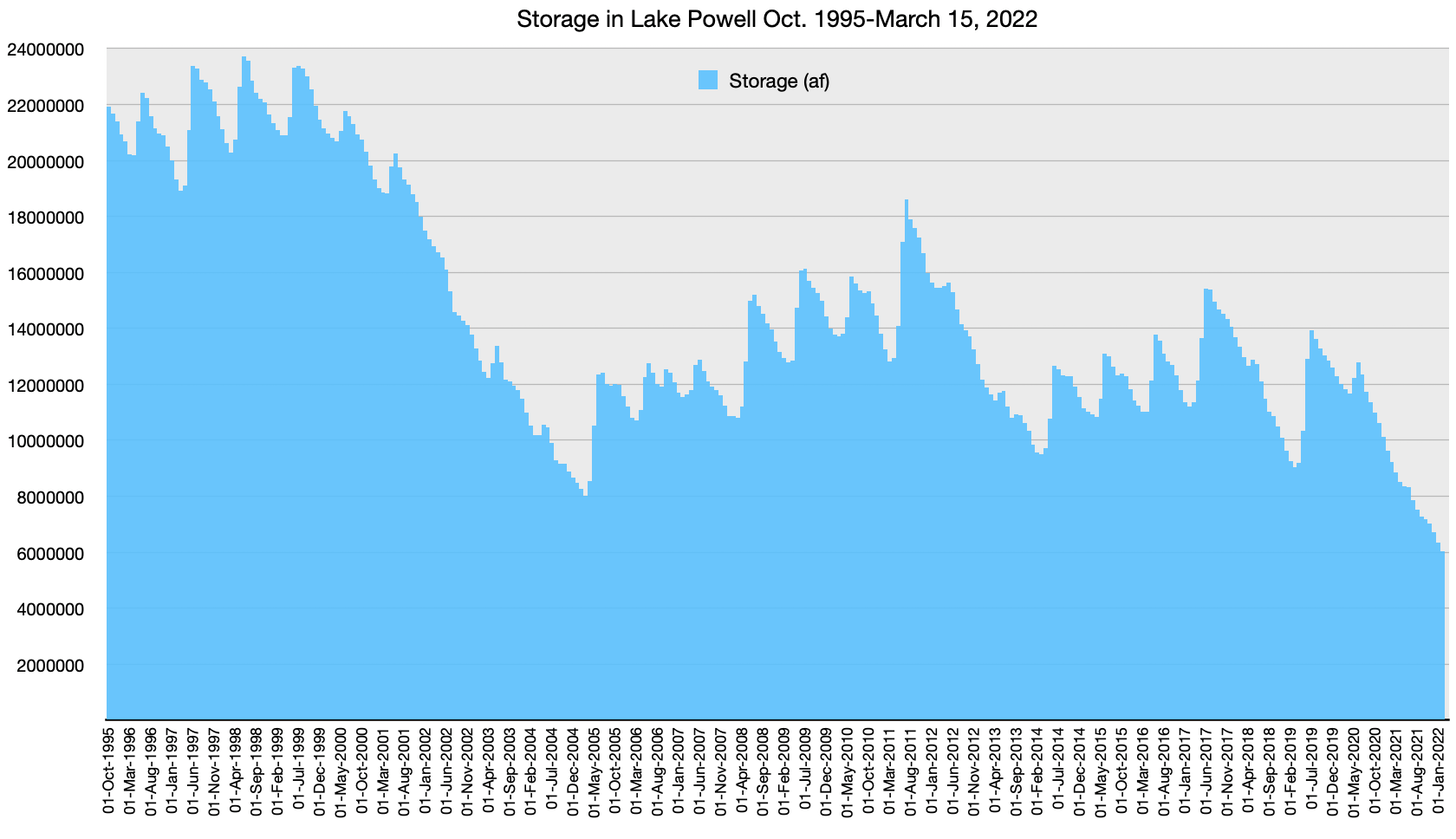
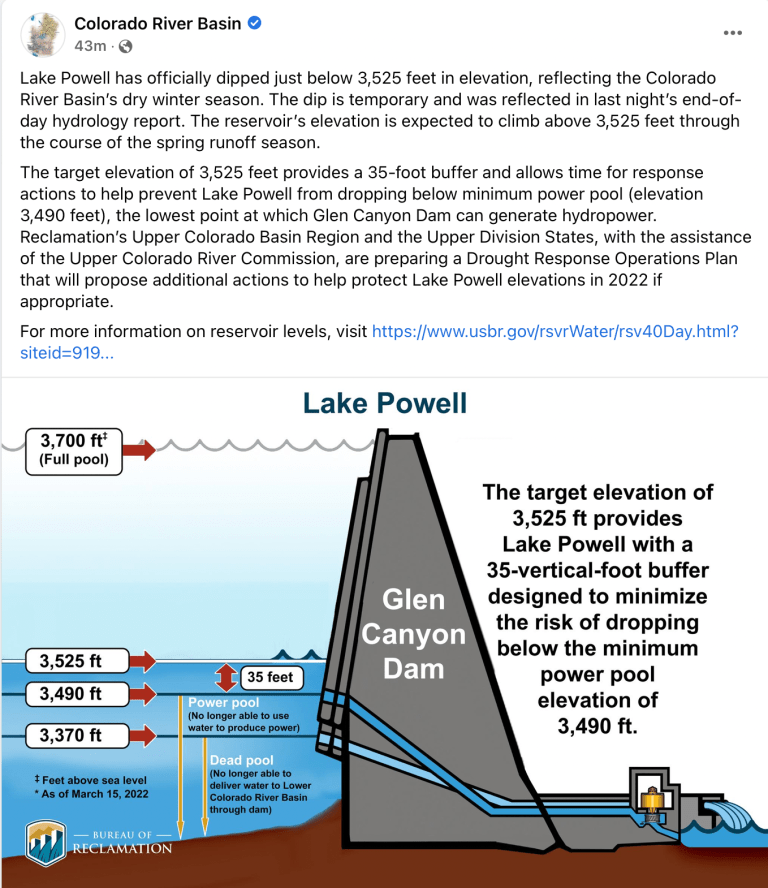
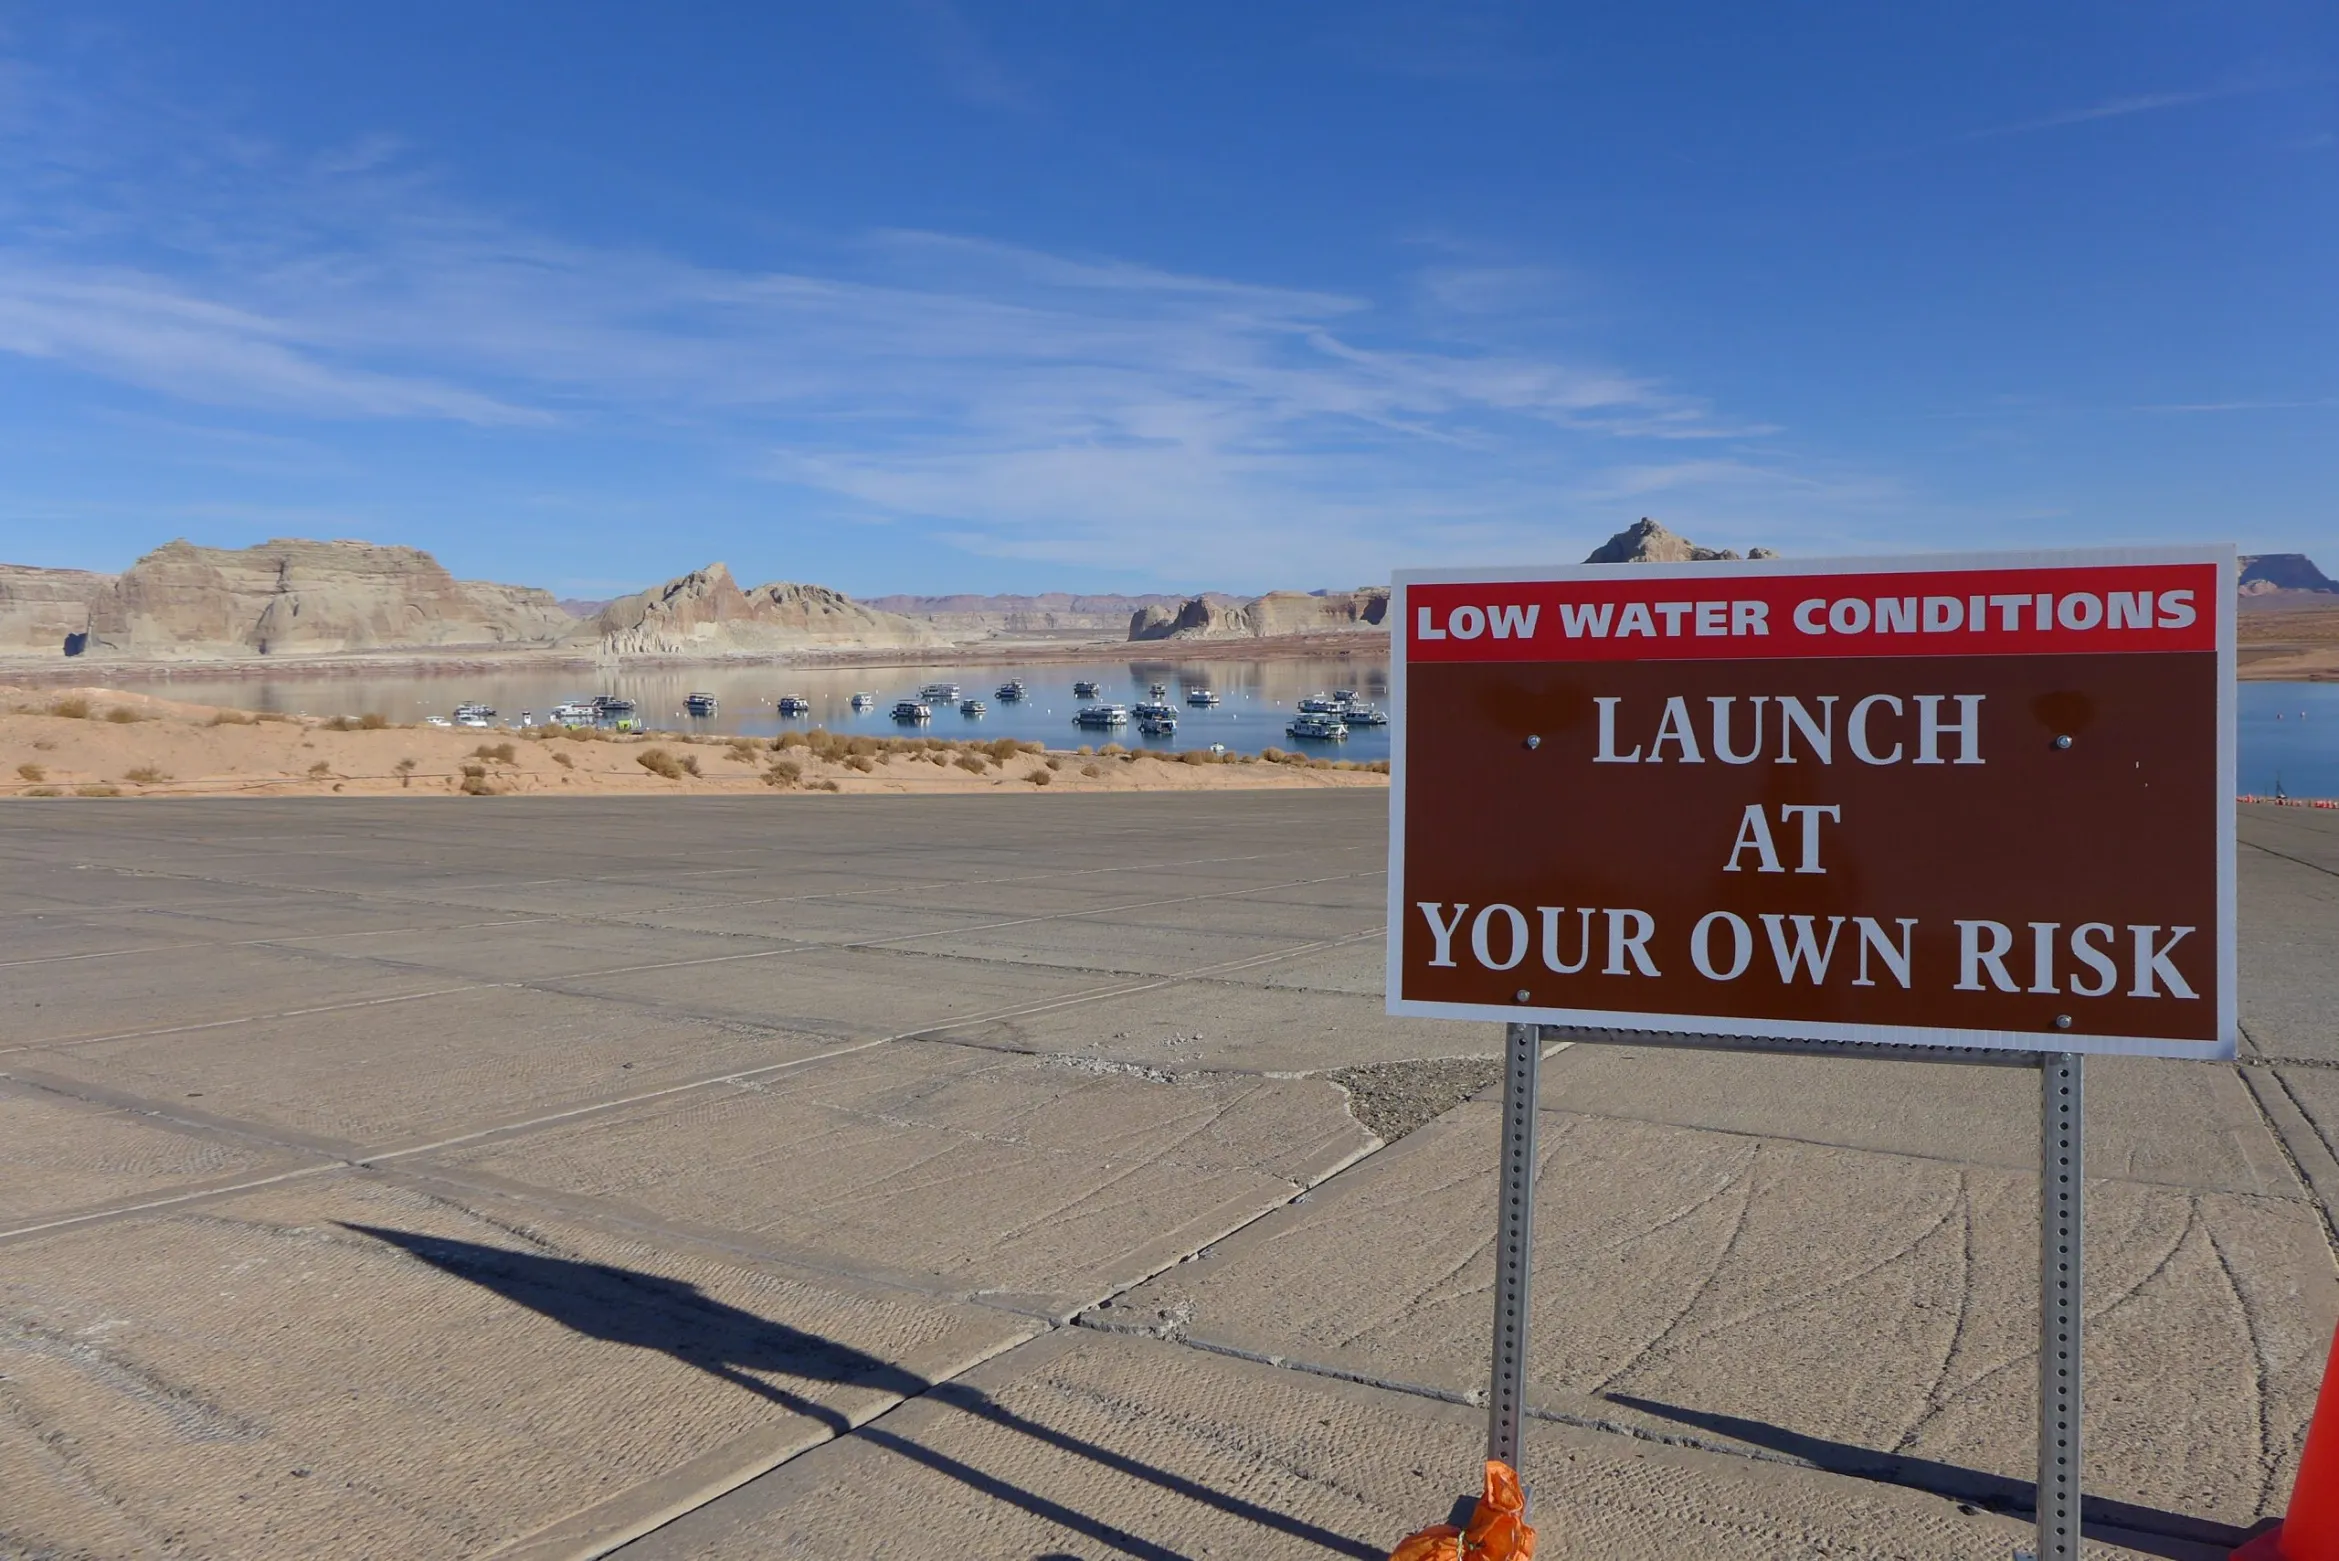
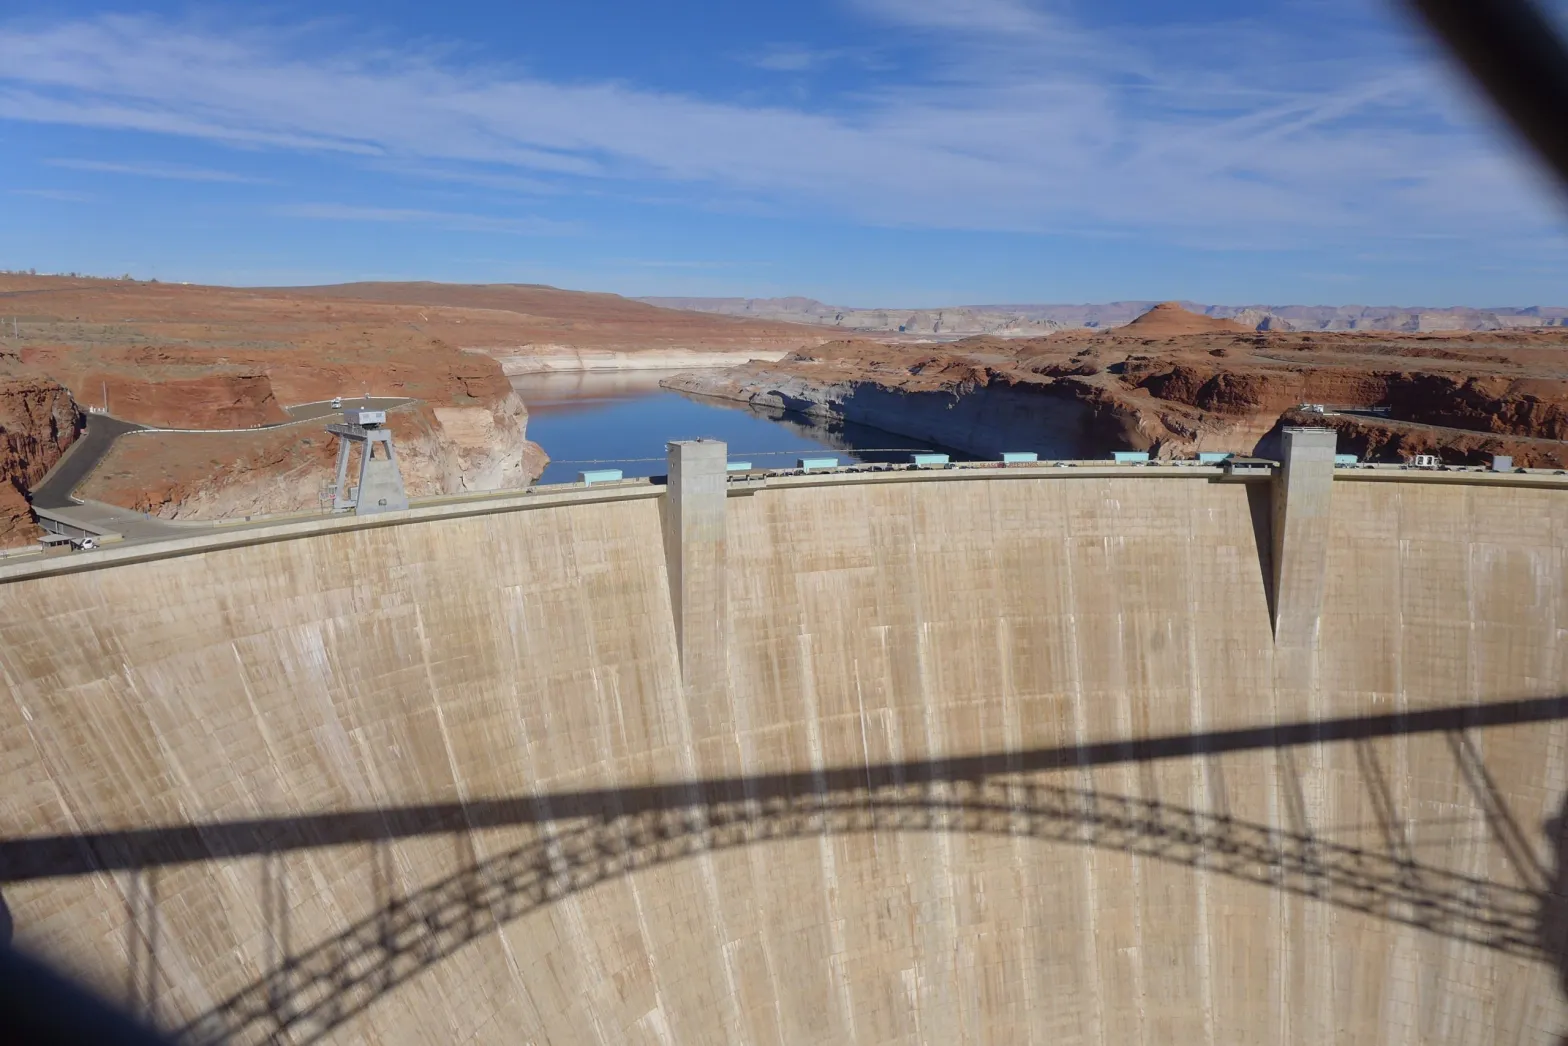
Lake Powell surface level dropped below the critical 3,525-foot mark sometime on the Ides of March. You’ve probably already read that somewhere, since the national media can’t seem to get enough of the slow motion desiccation of one of the nation’s largest reservoirs. And what’s so critical about 3,525 feet?
Nothing, really.
The real critical number is 3,490 feet, otherwise known as the “minimum power pool.” When Lake Powell sinks below that elevation, Glen Canyon Dam can no longer produce hydropower. That’s a big deal because Lake Powell really only serves two purposes these days: recreation and hydropower generation (the water storage component becomes somewhat irrelevant when Lake Mead is as low as it is now). Not only are the dam’s turbines a significant source of power for the Western Grid, but they also provide resilience for the grid in a way that other generators cannot.
Lake Powell has officially dipped just below 3,525 feet in elevation, reflecting the Colorado River Basin’s dry winter season. The elevation is expected to climb back above 3,525 feet over the course of spring runoff. More info: https://t.co/IobOBURhqH#drought#coloradoriver
Water managers had hoped to keep the level at least 35 feet above minimum power pool, i.e. above 3,525 feet, so they’d have a bit of a buffer to work with. Now the level is inside the buffer zone, which is reason for concern but not immediate alarm. While the rate of decline has prompted officials to issue a more pessimistic outlook for the reservoir, they don’t expect a loss of hydropower anytime soon. Snowpack levels in the watersheds that feed Lake Powell are slightly below average for this time of year, but are tracking about 7 percent ahead of last year’s levels. Spring runoff will soon begin, inflows will increase, and the lake should begin rising again, staving off the turbine shutdown—for now.
Let’s get to the data:
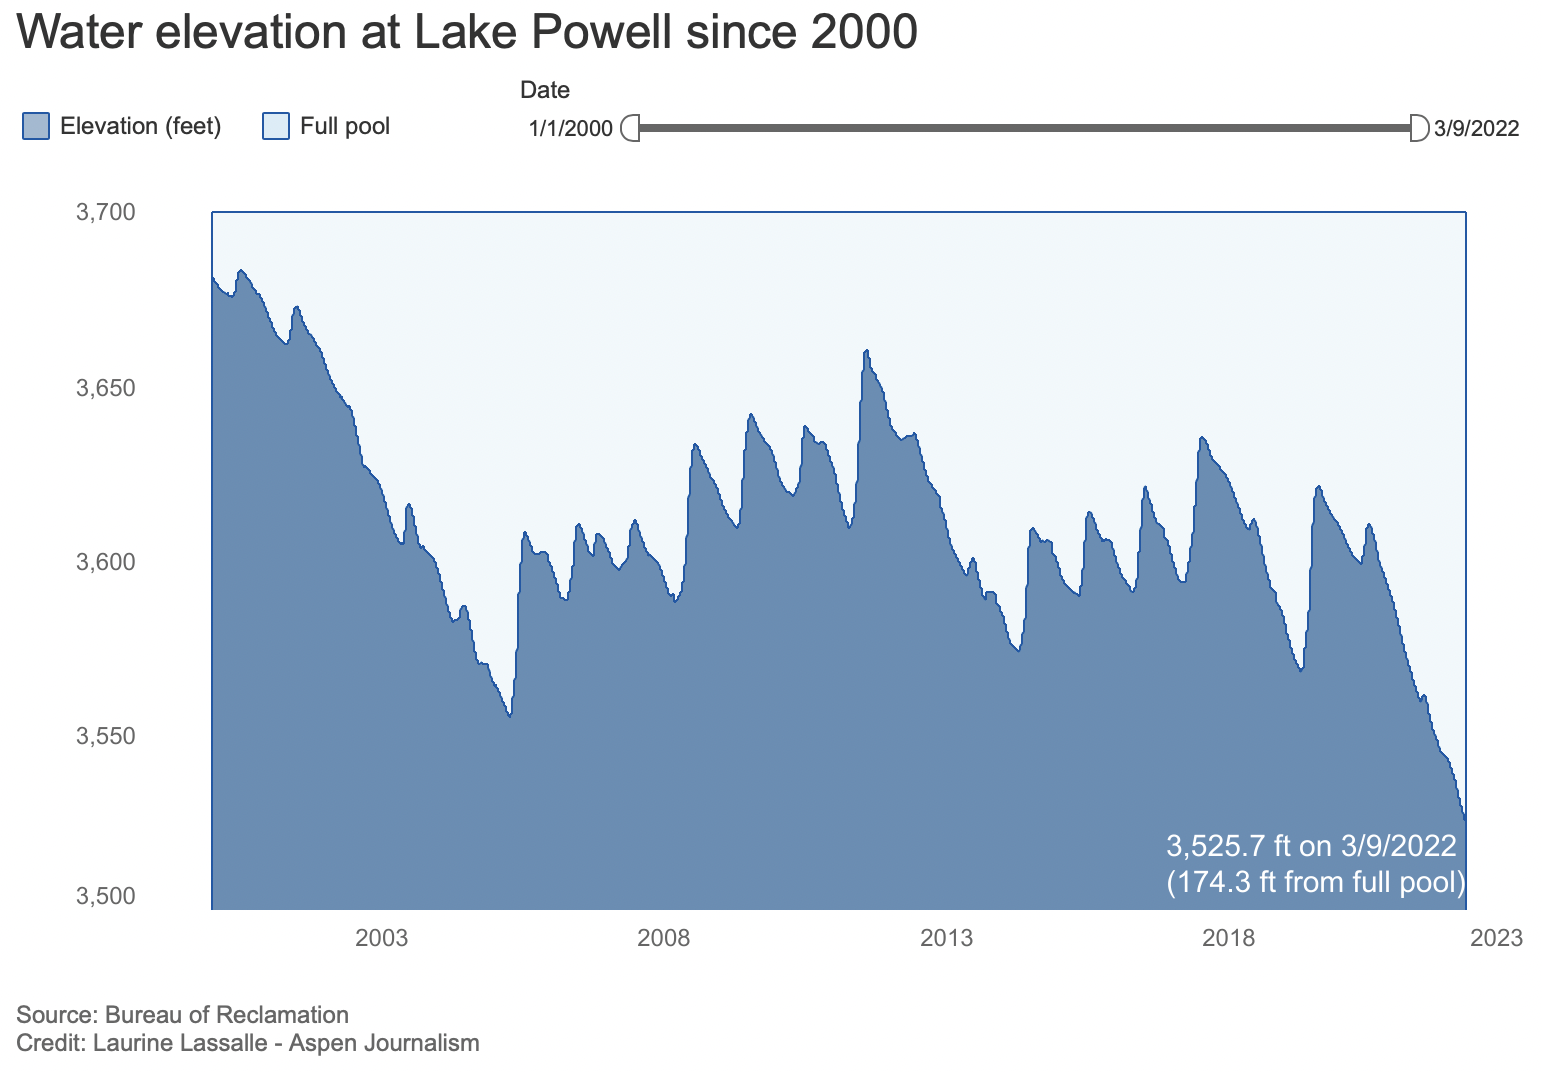
3,569 feet above sea level: Lake Powell’s surface level on March 9, 2021.
3,524.9 feet: Level on March 15, 2021.
-44 feet: Twelve-month change.
3,490 feet: Level at which Glen Canyon Dam stops producing hydropower.
384 billion gallons: Amount by which Lake Powell’s storage has declined since November 2021.
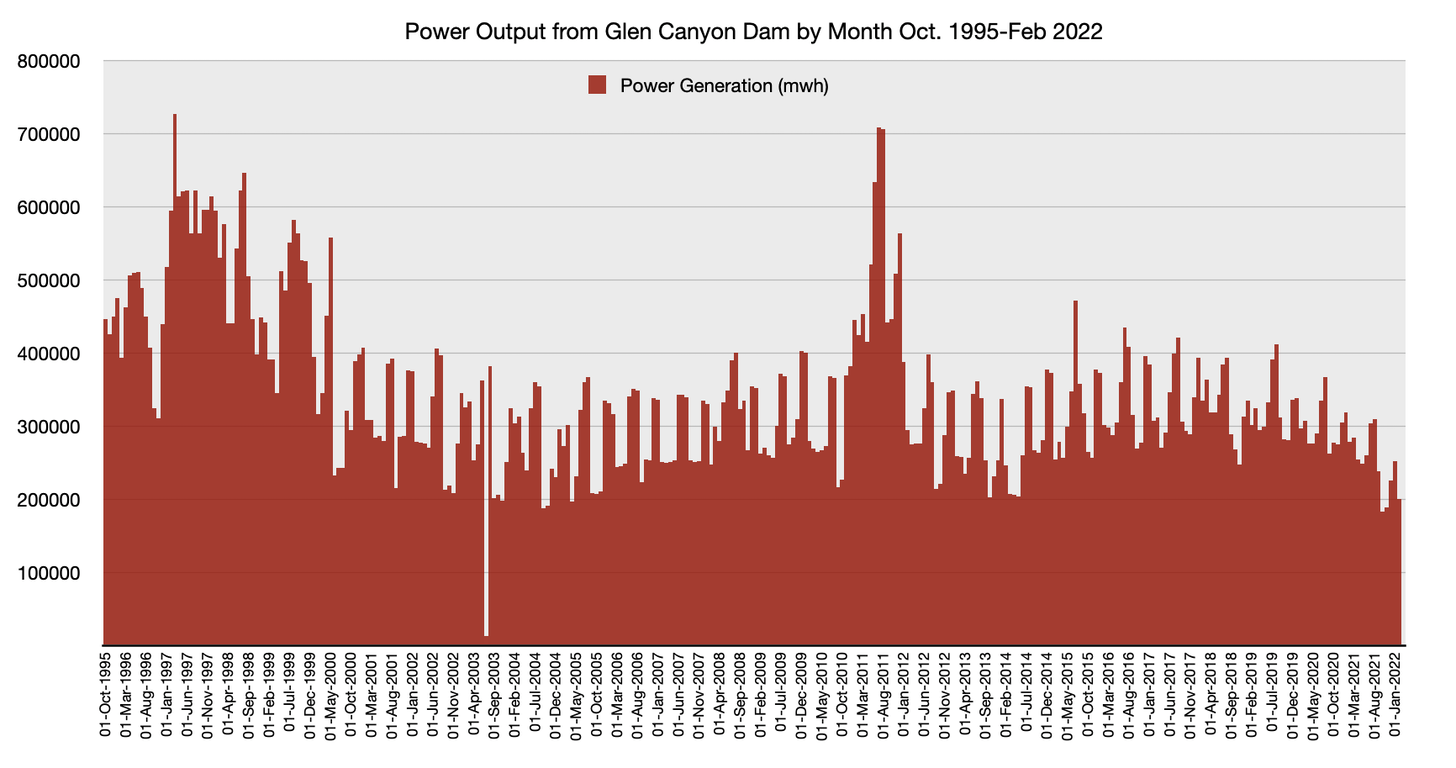
855,656 megawatt hours: August 2021 output of Four Corners Power Plant.
309,640 megawatt hours: August 2021 output of Glen Canyon Dam
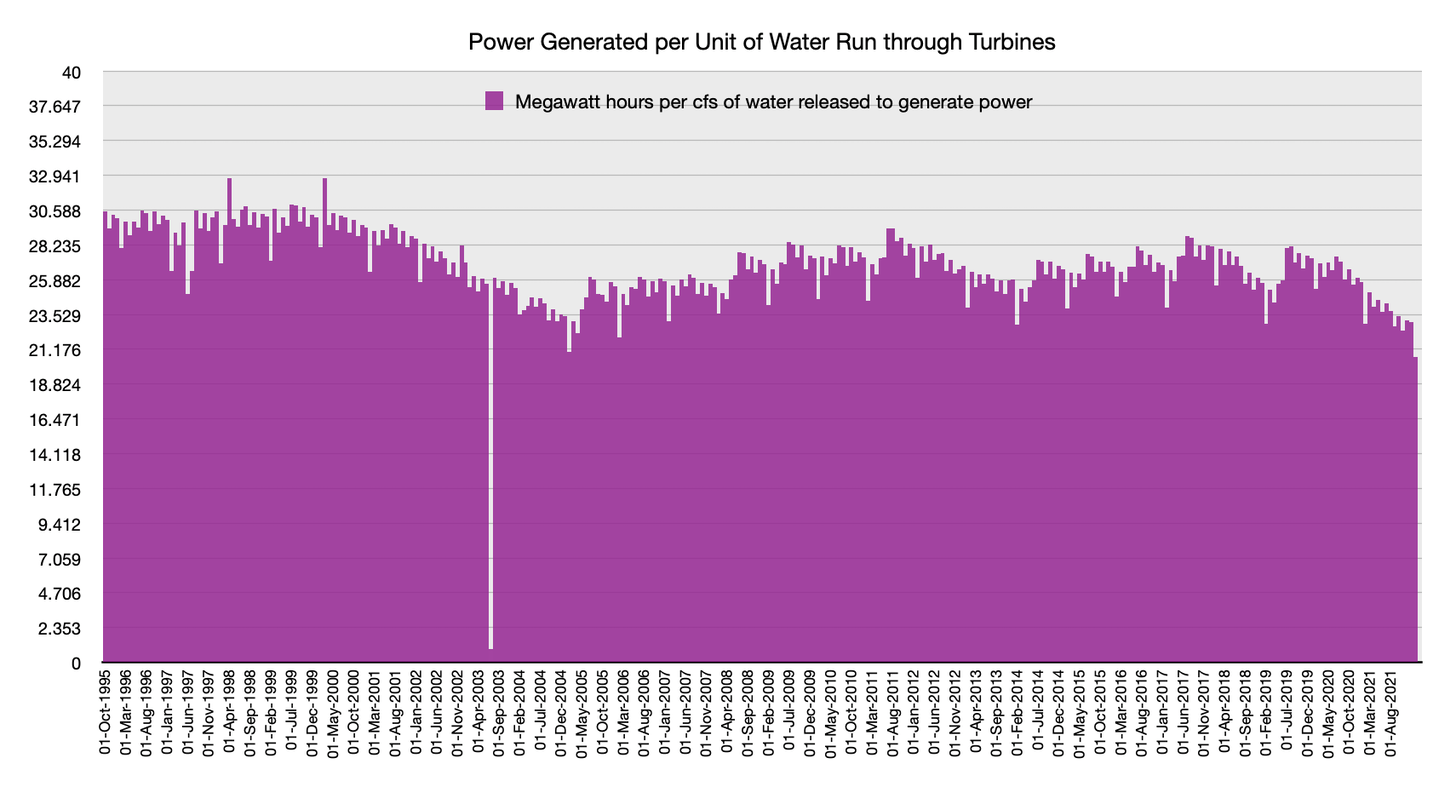
Lake Powell storage in acre-feet. 1 acre-foot = 325,851 gallons. USBR.Glen Canyon Dam’s power output roughly correlates with storage levels, but also varies month to month according to demand. USBR.As water levels drop there is less pressure to turn the dam’s turbines, so less power is generated per unit of water released.
Glen Canyon Dam, January 2022. Jonathan P. Thompson photo.
Click the link to read the article “Lake Powell hits historic low, raising hydropower concerns” on the Associated Press website (Sam Metz and Felicia Fonseca). Here’s an excerpt:
Lake Powell’s fall to below 3,525 feet (1,075 meters) puts it at its lowest level since the lake filled after the federal government dammed the Colorado River at Glen Canyon more than a half century ago — a record marking yet another sobering realization of the impacts of climate change and megadrought. It comes as hotter temperatures and less precipitation leave a smaller amount flowing through the over-tapped Colorado River. Though water scarcity is hardly new in the region, hydropower concerns at Glen Canyon Dam in Arizona reflect that a future western states assumed was years away is approaching — and fast.
“We clearly weren’t sufficiently prepared for the need to move this quickly,” said John Fleck, director of the University of New Mexico’s Water Resources Program.
Federal officials are confident water levels will rise in the coming months once snow melts in the Rockies. But they warn that more may need to be done to ensure Glen Canyon Dam can keep producing hydropower in the years ahead…About 5 million customers in seven states — Arizona, Colorado, Nebraska, Nevada, New Mexico, Utah and Wyoming — buy power generated at Glen Canyon Dam. The government provides it at a cheaper rate than energy sold on the wholesale market, which can be wind, solar, coal or natural gas. For the cities, rural electric cooperatives and tribes that rely on its hydropower, less water flowing through Glen Canyon Dam can therefore increase total energy costs. Customers bear the brunt…
Nick Williams, the bureau’s Upper Colorado Basin power manager, said many variables, including precipitation and heat, will determine the extent to which Lake Powell rebounds in the coming months. Regardless, hydrology modeling suggests there’s roughly a 1 in 4 chance it won’t be able to produce power by 2024.
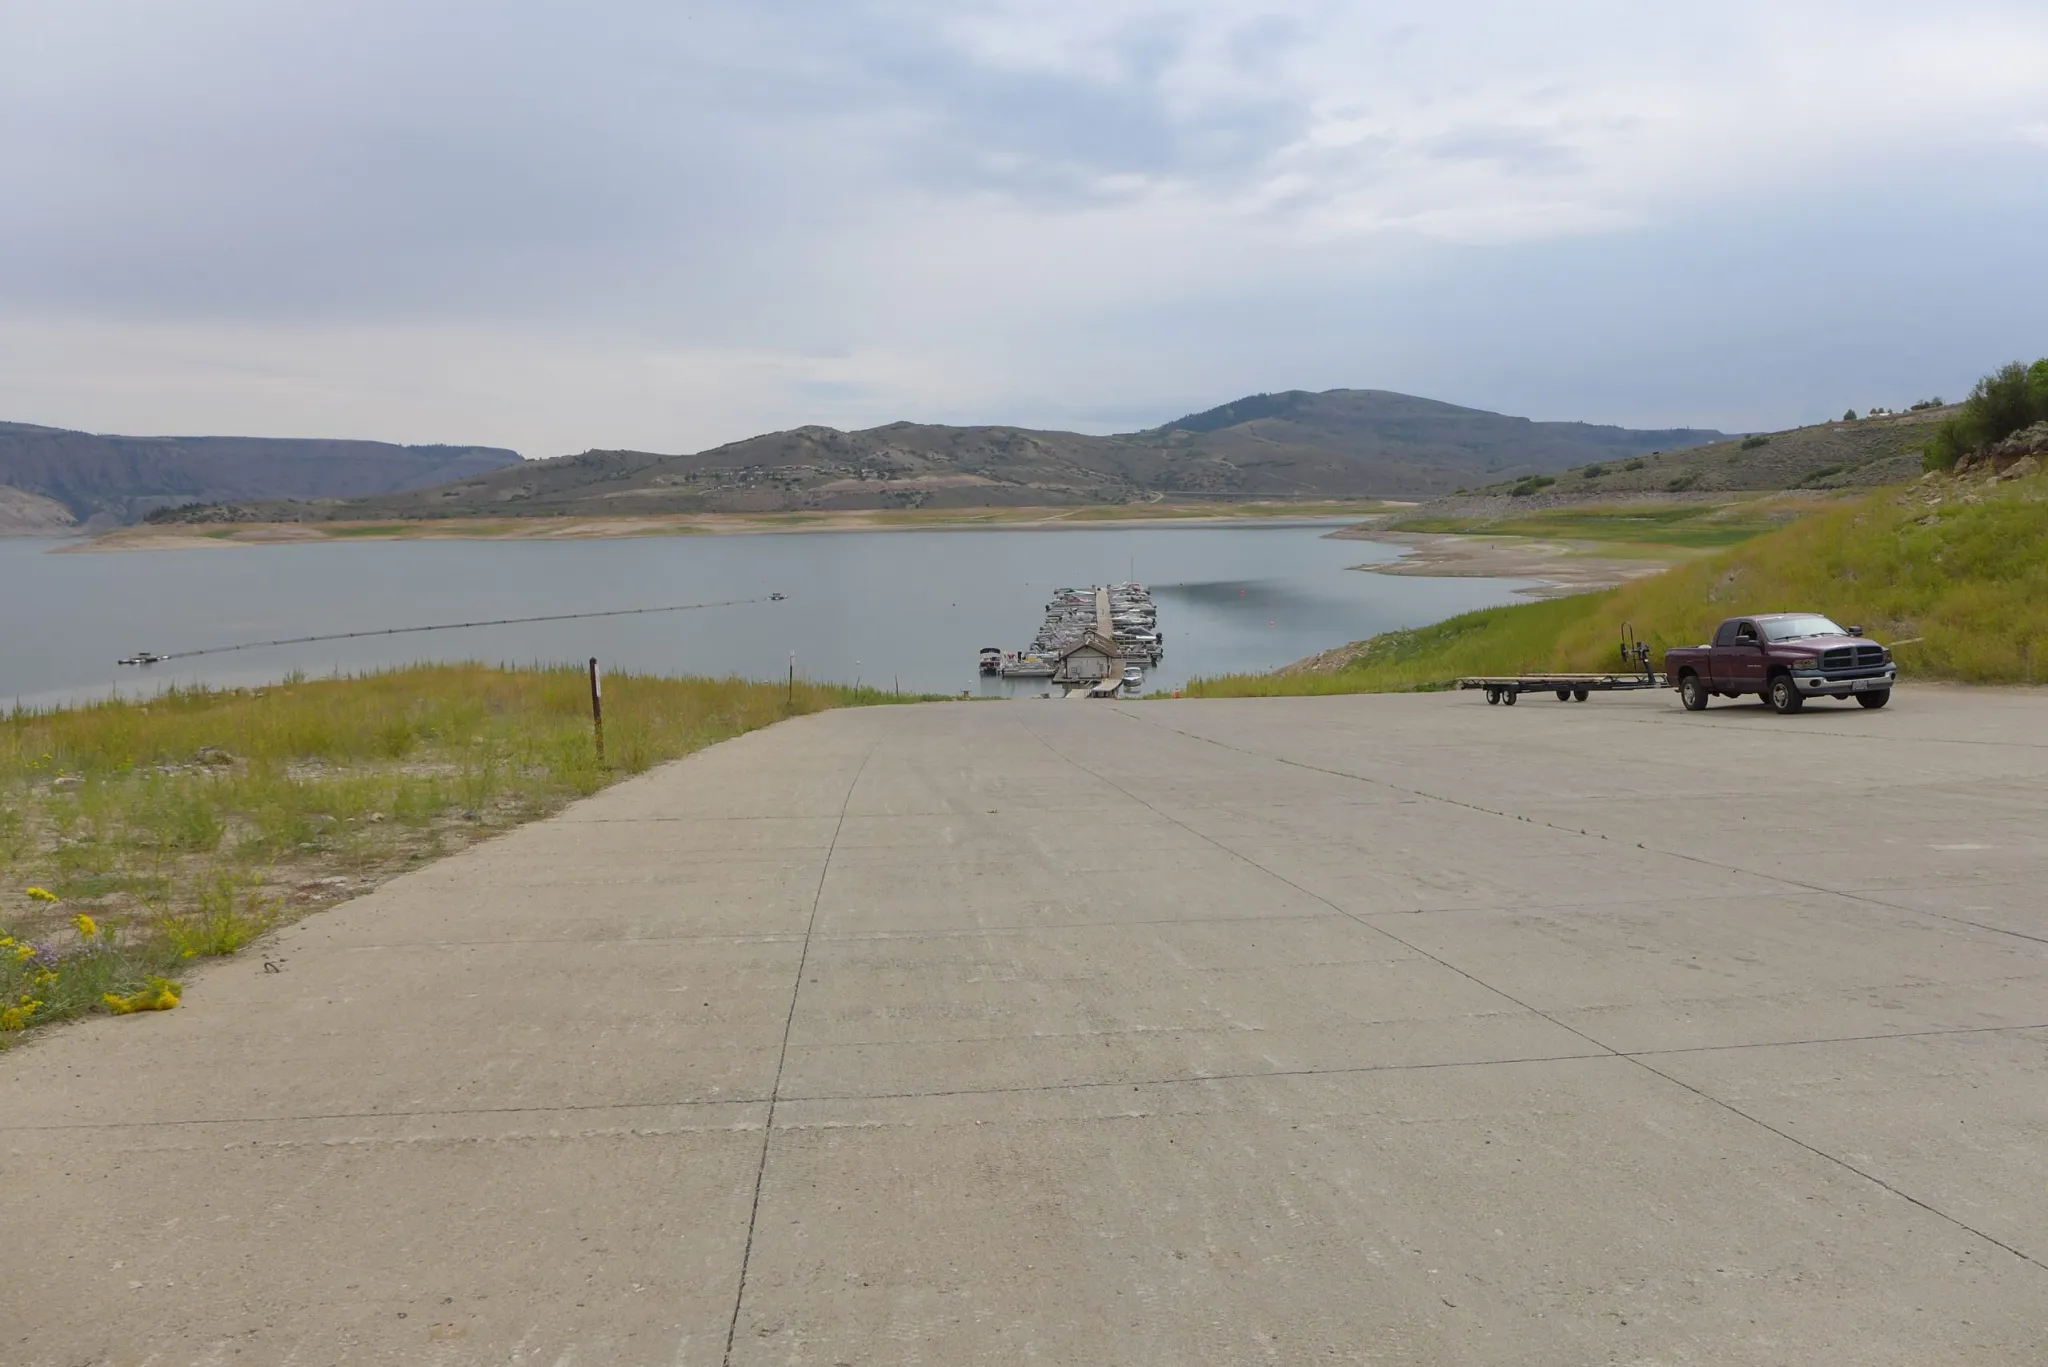
The boat ramp at the Lake Fork Marina closed for the season on Sept. 2 due to declining reservoir levels. The Bureau of Reclamation is making emergency releases out of Blue Mesa Reservoir to prop up levels in Lake Powell and preserve the ability to make hydropower. CREDIT: HEATHER SACKETT/ASPEN JOURNALISM
Click the link to read “Lake Powell drops below critical threshold for the first time despite attempts to avoid it” on the Colorado Public Radio website (Michael Elizabeth Sakas). Here’s an excerpt:
The reservoir is the second-largest in the U.S., and it’s a key piece of the Colorado River storage and supply system. Powell is fed mostly by snowmelt that collects in Colorado’s Rocky Mountains. A 20-year megadrought and a hotter climate, fueled primarily by greenhouse gas emissions from fossil fuels, has contributed to Powell’s levels dropping to all-time lows…
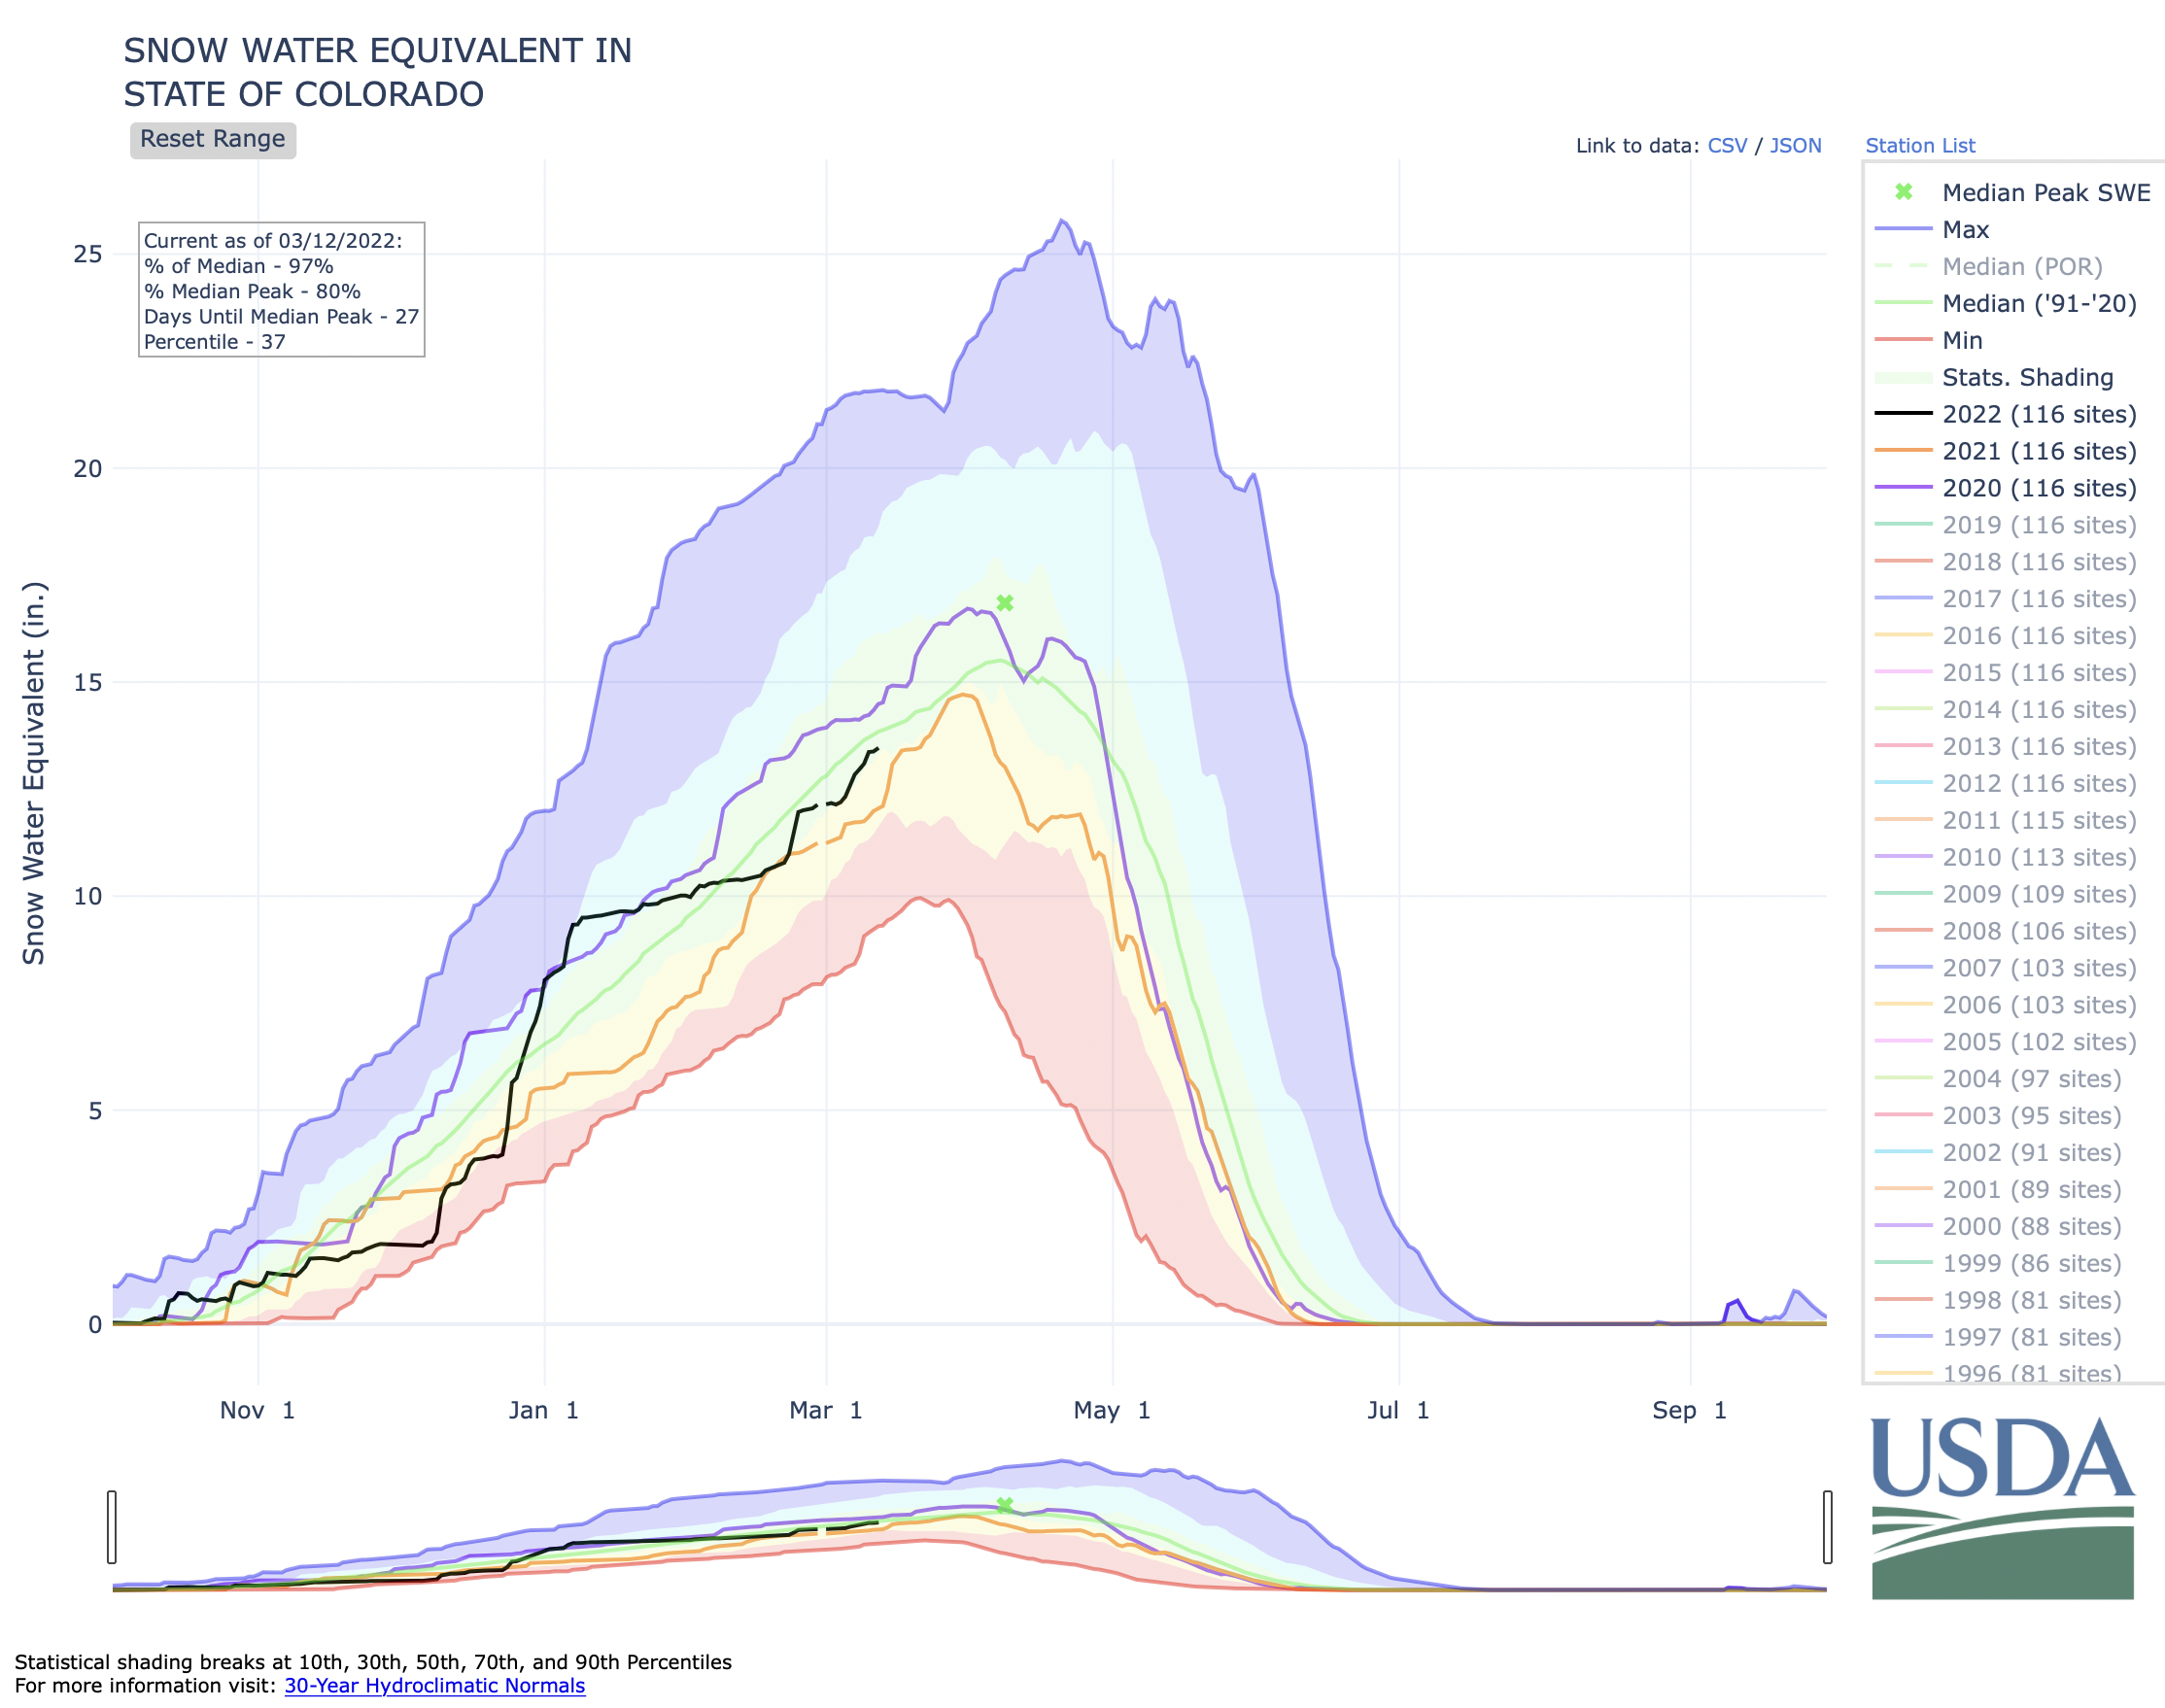
Colorado and the other states that share the Colorado River agreed to work together to keep Powell above this critical threshold with the Congressionally approved 2019 Drought Contingency Plan. That agreement creates a 35-foot buffer of water before the reservoir hits “dead pool,” when reservoir levels are so low, the hydroelectric generators can no longer produce energy. Water levels in Powell quickly started to drop after years of back-to-back drought. In response, the federal government in 2021 took emergency action and sent water from reservoirs in Colorado and other states to prop up supplies in Powell. Blue Mesa Reservoir outside of Gunnison lost eight feet of water as a result. Ultimately, those releases did not prevent water levels from dropping below the critical threshold. But U.S. Bureau of Reclamation hydraulic engineer Heather Patno said the additional release did add about six feet of water to Powell, and any extra buffer helps protect Powell’s ability to produce energy. Patno said the drop should be temporary as the snow in the mountains starts to melt and recharge the river and reservoirs. She said 2021 was the second-driest year on record for the Colorado River basin, and a very dry first few months of 2022 eroded the snowpack collecting in the mountains…
New research suggests there might be even less Colorado River water in the future than what’s forecasted.
A recent report from the Center for Colorado River Studies found that the U.S. Bureau of Reclamation’s projections can be too optimistic, partly because it’s based on the average water inflow into Powell from 1991-2020, a period that includes an abnormal decade in the 90s that was much wetter than the last 20 years. Patno said those findings are important, and it and other studies should be considered when federal and state governments decide how to adapt their water operations to drought. She said Powell projections did improve when the bureau recently switched to using the last 30-year average, but that Powell forecasts rely on models that have a level of risk and uncertainty.
Powell’s worst-case projections show its level could drop below 3,525 feet again as early as August of this year. Patno said emergency water releases from Blue Mesa and other reservoirs might be needed again as one of the tools to keep Powell propped up, especially as the current snowpack continues to decline. Inflow forecasts into Powell expect about 69 percent of average. The ongoing drought also means dry soil will soak up a lot of that water before it reaches rivers and lakes, Patno said.
Commissioner Mitchell (CWCB) Statement on Lake Powell Elevation 3525′:
As of March 15, Lake Powell, a major reservoir that feeds water to the Lower Colorado River Basin, fell below elevation 3525 feet. This is the target elevation identified within the Drought Contingency Plan that provides a buffer to hydropower.
The decline in Lake Powell was caused by over 20 years of low inflows in the Colorado River System, coupled with depletions that exceeded supplies. The imbalance between depletions and available River flows has historically been compensated by taking water from storage in Lake Powell and Lake Mead to provide for downstream depletions, thus causing declines in reservoir elevations.
Below is a statement from Colorado River Commissioner Becky Mitchell:
“Lake Powell hit elevation 3525 feet this week, which is a direct result of depletions from our major reservoirs over the last 20 years coupled with low flows into Lake Powell. As Lake Powell and Lake Mead have declined, water users in the Upper Colorado River Basin have been living on the front lines of climate change. The Upper Basin states of Colorado, New Mexico, Utah, and Wyoming have been taking water cuts for 20 years due to prolonged drought, while continuing to meet our Compact obligations. On top of this, water has been provided from Flaming Gorge and Blue Mesa Reservoirs in an effort to protect Lake Powell. Going forward, all who rely on the Colorado River System must learn to live with what the River provides and adapt to variability of water supply.”
For more information and updates, visit the Commissioner’s Corner on the Colorado Water Conservation Board website.
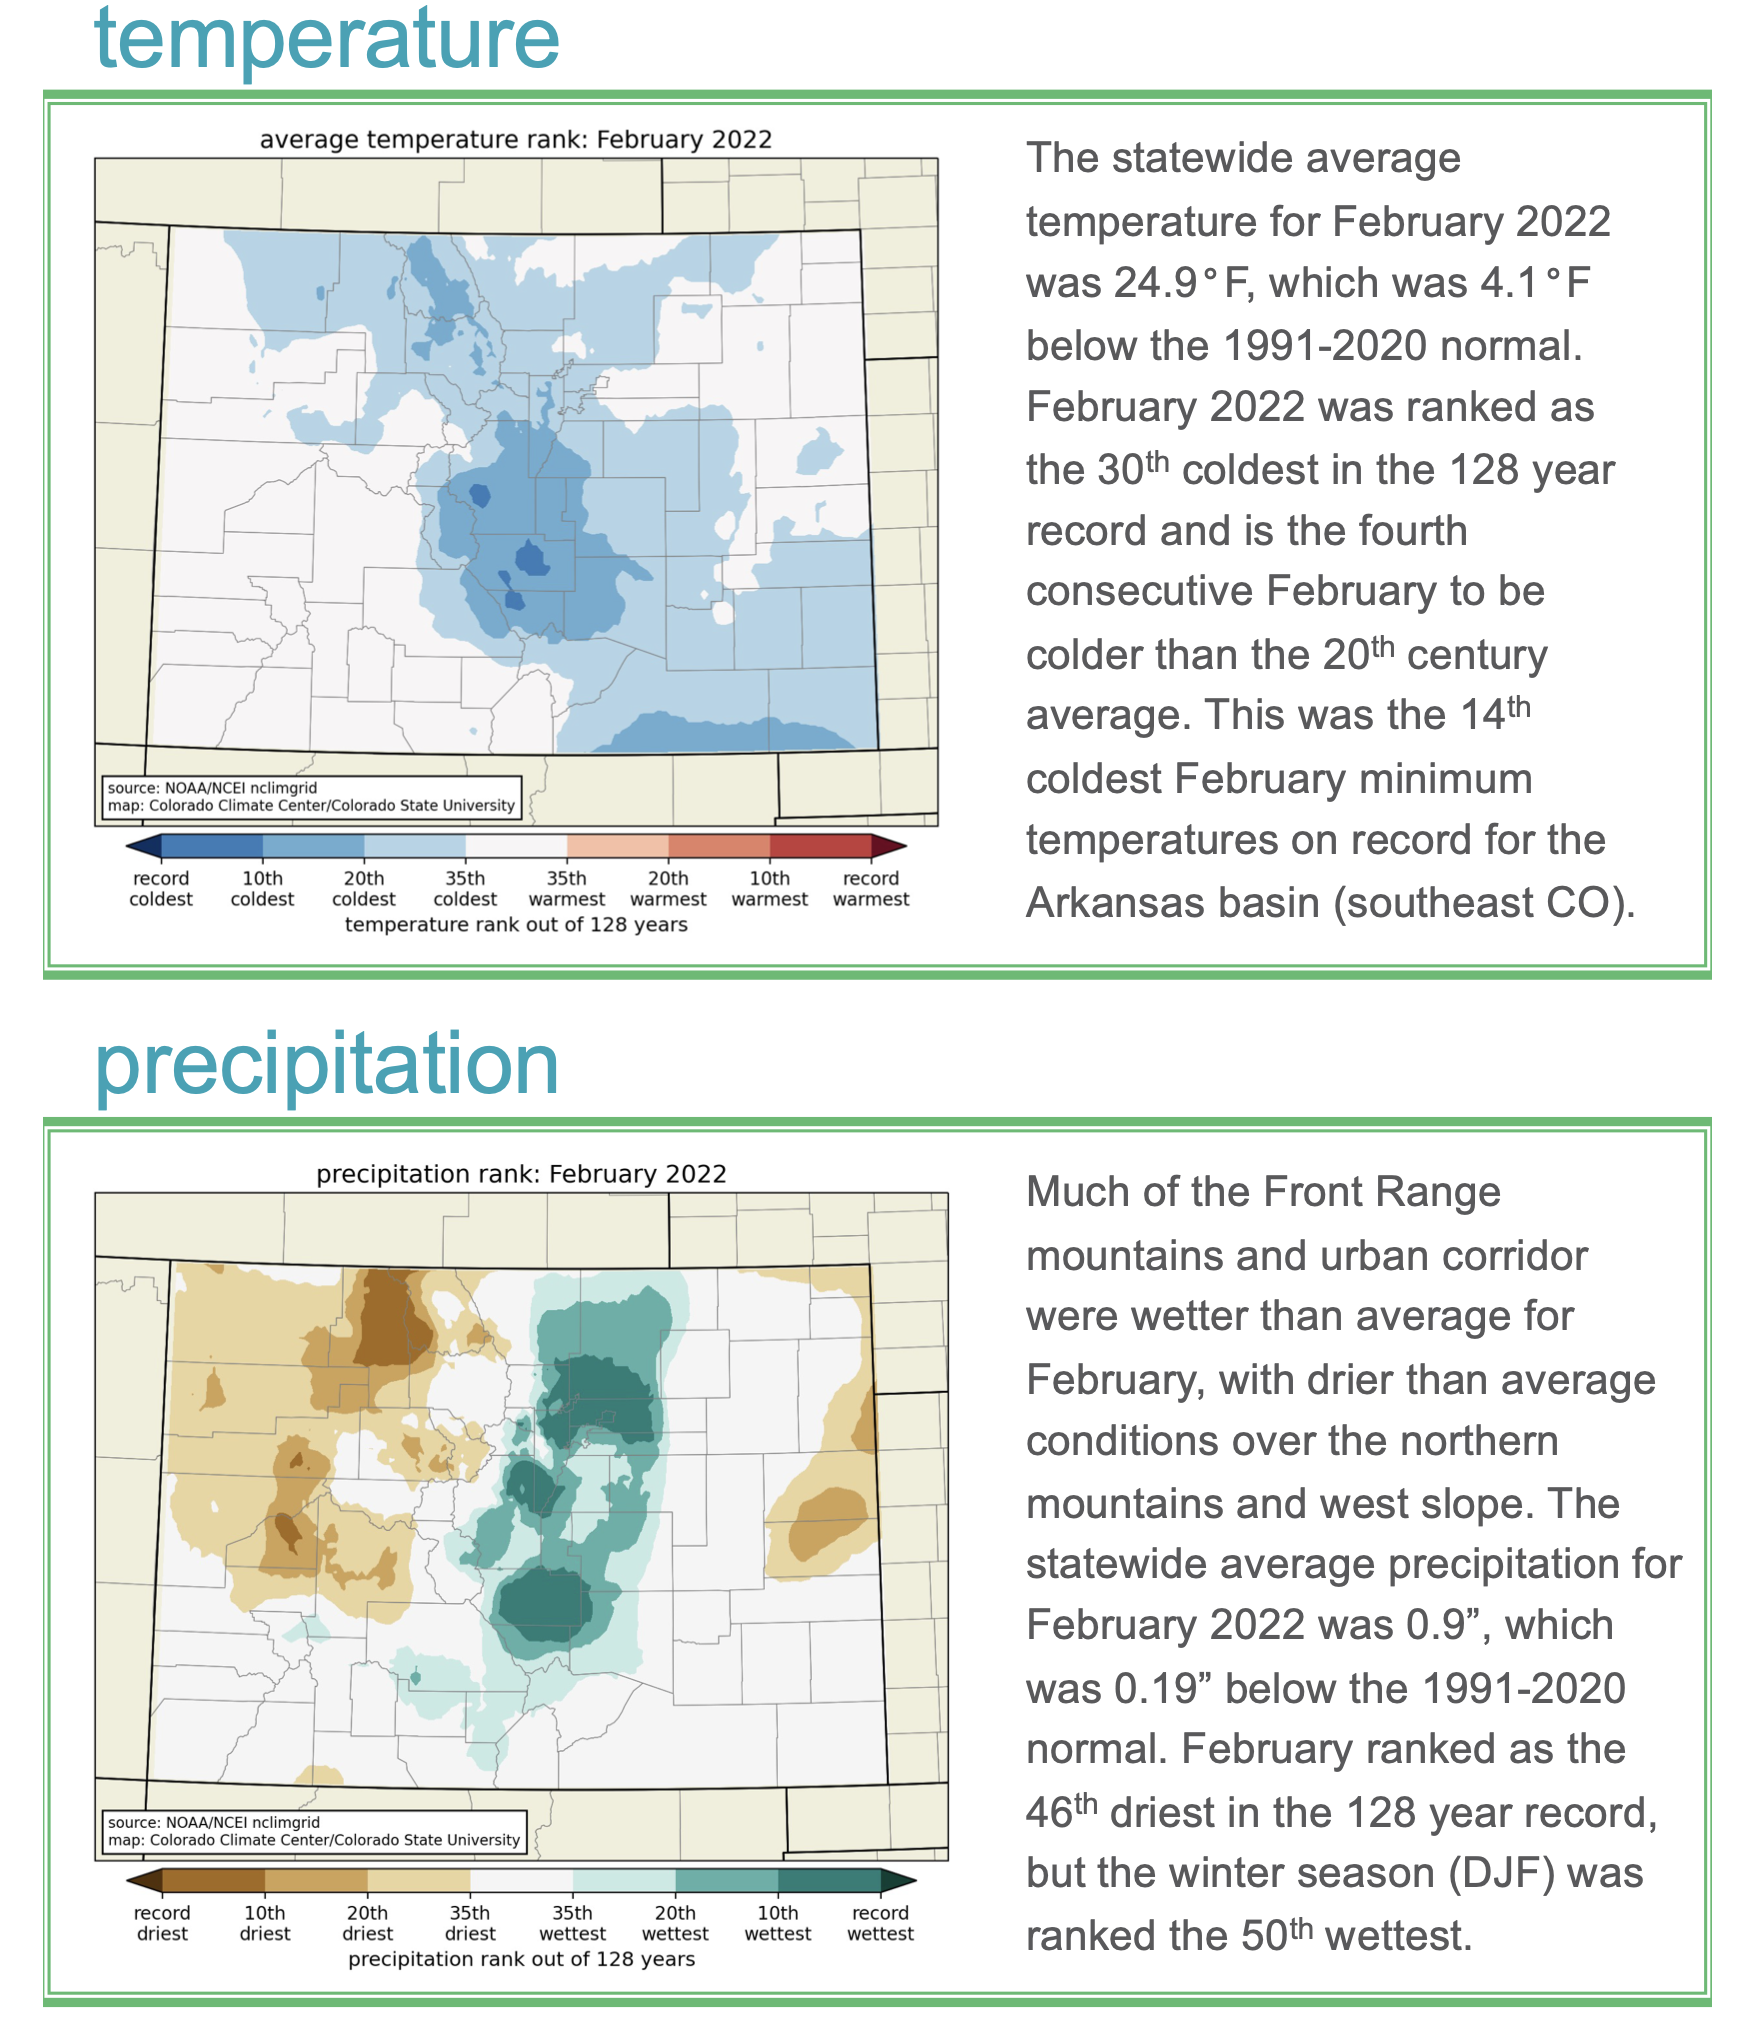
Click the link to read the assessment on the NOAA website:
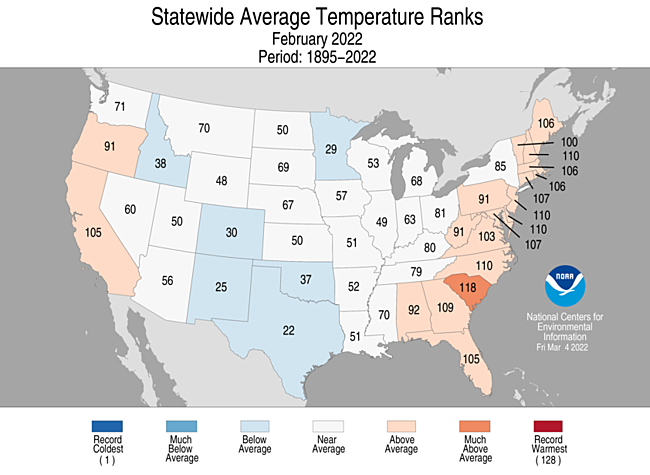
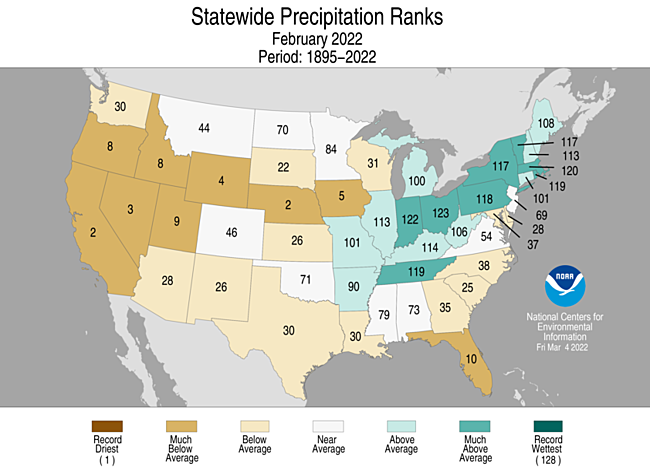
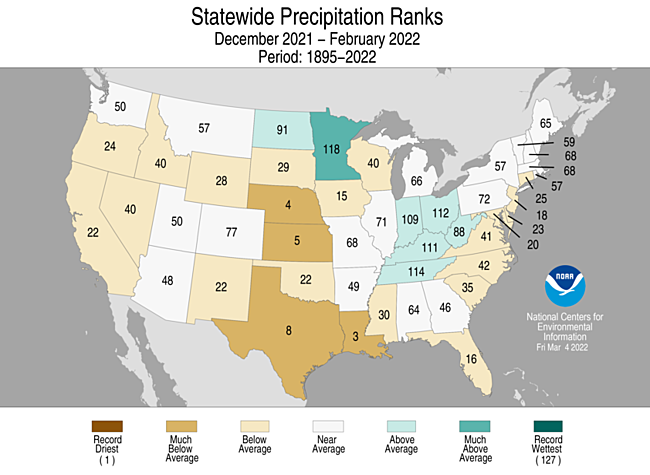
Globally, February 2022 was the seventh-warmest February in the 143-year NOAA record. The year-to-date (January-February) global surface temperature was the sixth highest on record. According to NCEI’s Global Annual Temperature Rankings Outlook, it is virtually certain (> 99.0%) that 2022 will rank among the 10 warmest years on record.
This monthly summary, developed by scientists at NOAA’s National Centers for Environmental Information, is part of the suite of climate services NOAA provides to government, business, academia and the public to support informed decision-making.
Monthly Global Temperature
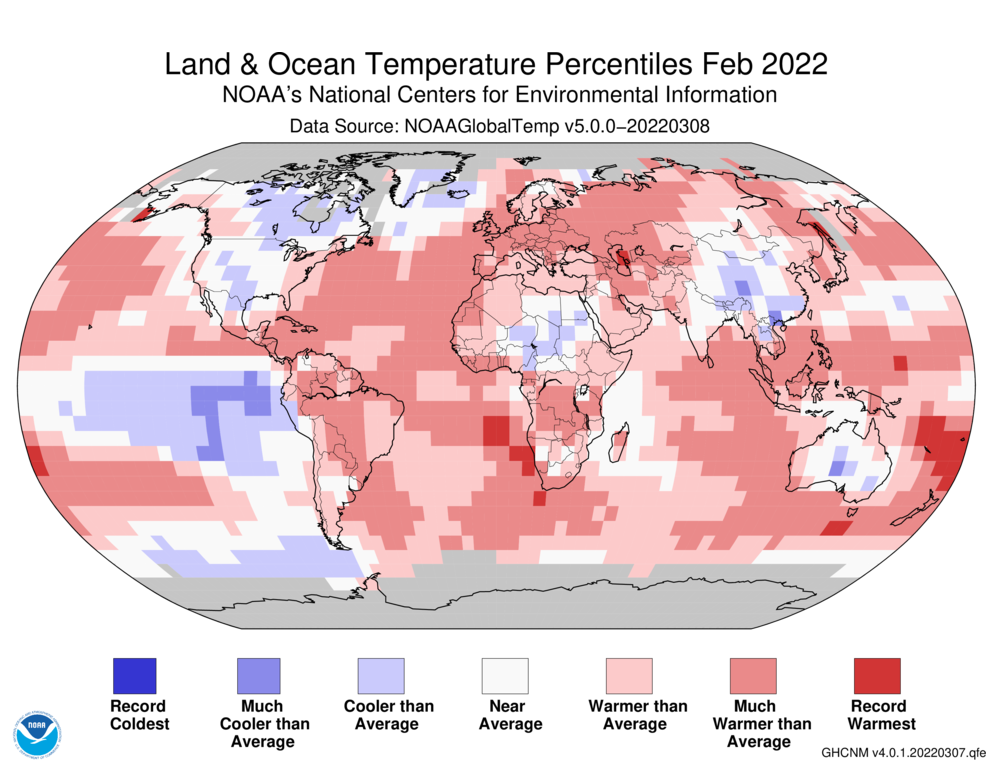
The February 2022 global surface temperature was 1.46°F (0.81°C) above the 20th-century average of 53.9°F (12.1°C), the seventh-warmest February in the 143-year record. February 2022 also marked the 46th consecutive February and the 446th consecutive month with temperatures, at least nominally, above the 20th-century average.
The month of February was characterized by cooler-than-average temperatures across North America, Greenland and its surrounding northern Atlantic Ocean, as well as parts of northern Africa, central and southern Asia, Australia, and the central/eastern tropical and southeastern Pacific Ocean. Meanwhile, temperatures were much above average across Europe, western/northern Russia, the Atlantic, eastern Indian, and northern/western Pacific oceans, as well as parts of Central and South America, and southern Africa.
Regionally, South America, Europe, and Asia had a temperature departure that ranked among their eight-warmest Februaries on record. North America was the only continent to have a below-average February temperature.
Sea Ice and Snow Cover
According to data from NOAA and analysis by the Rutgers Global Snow Lab, the Northern Hemisphere snow cover extent during February was near-normal at 17.68 million square miles. Eurasia had an above-average February snow cover extent, while the North American snow cover extent was below average.
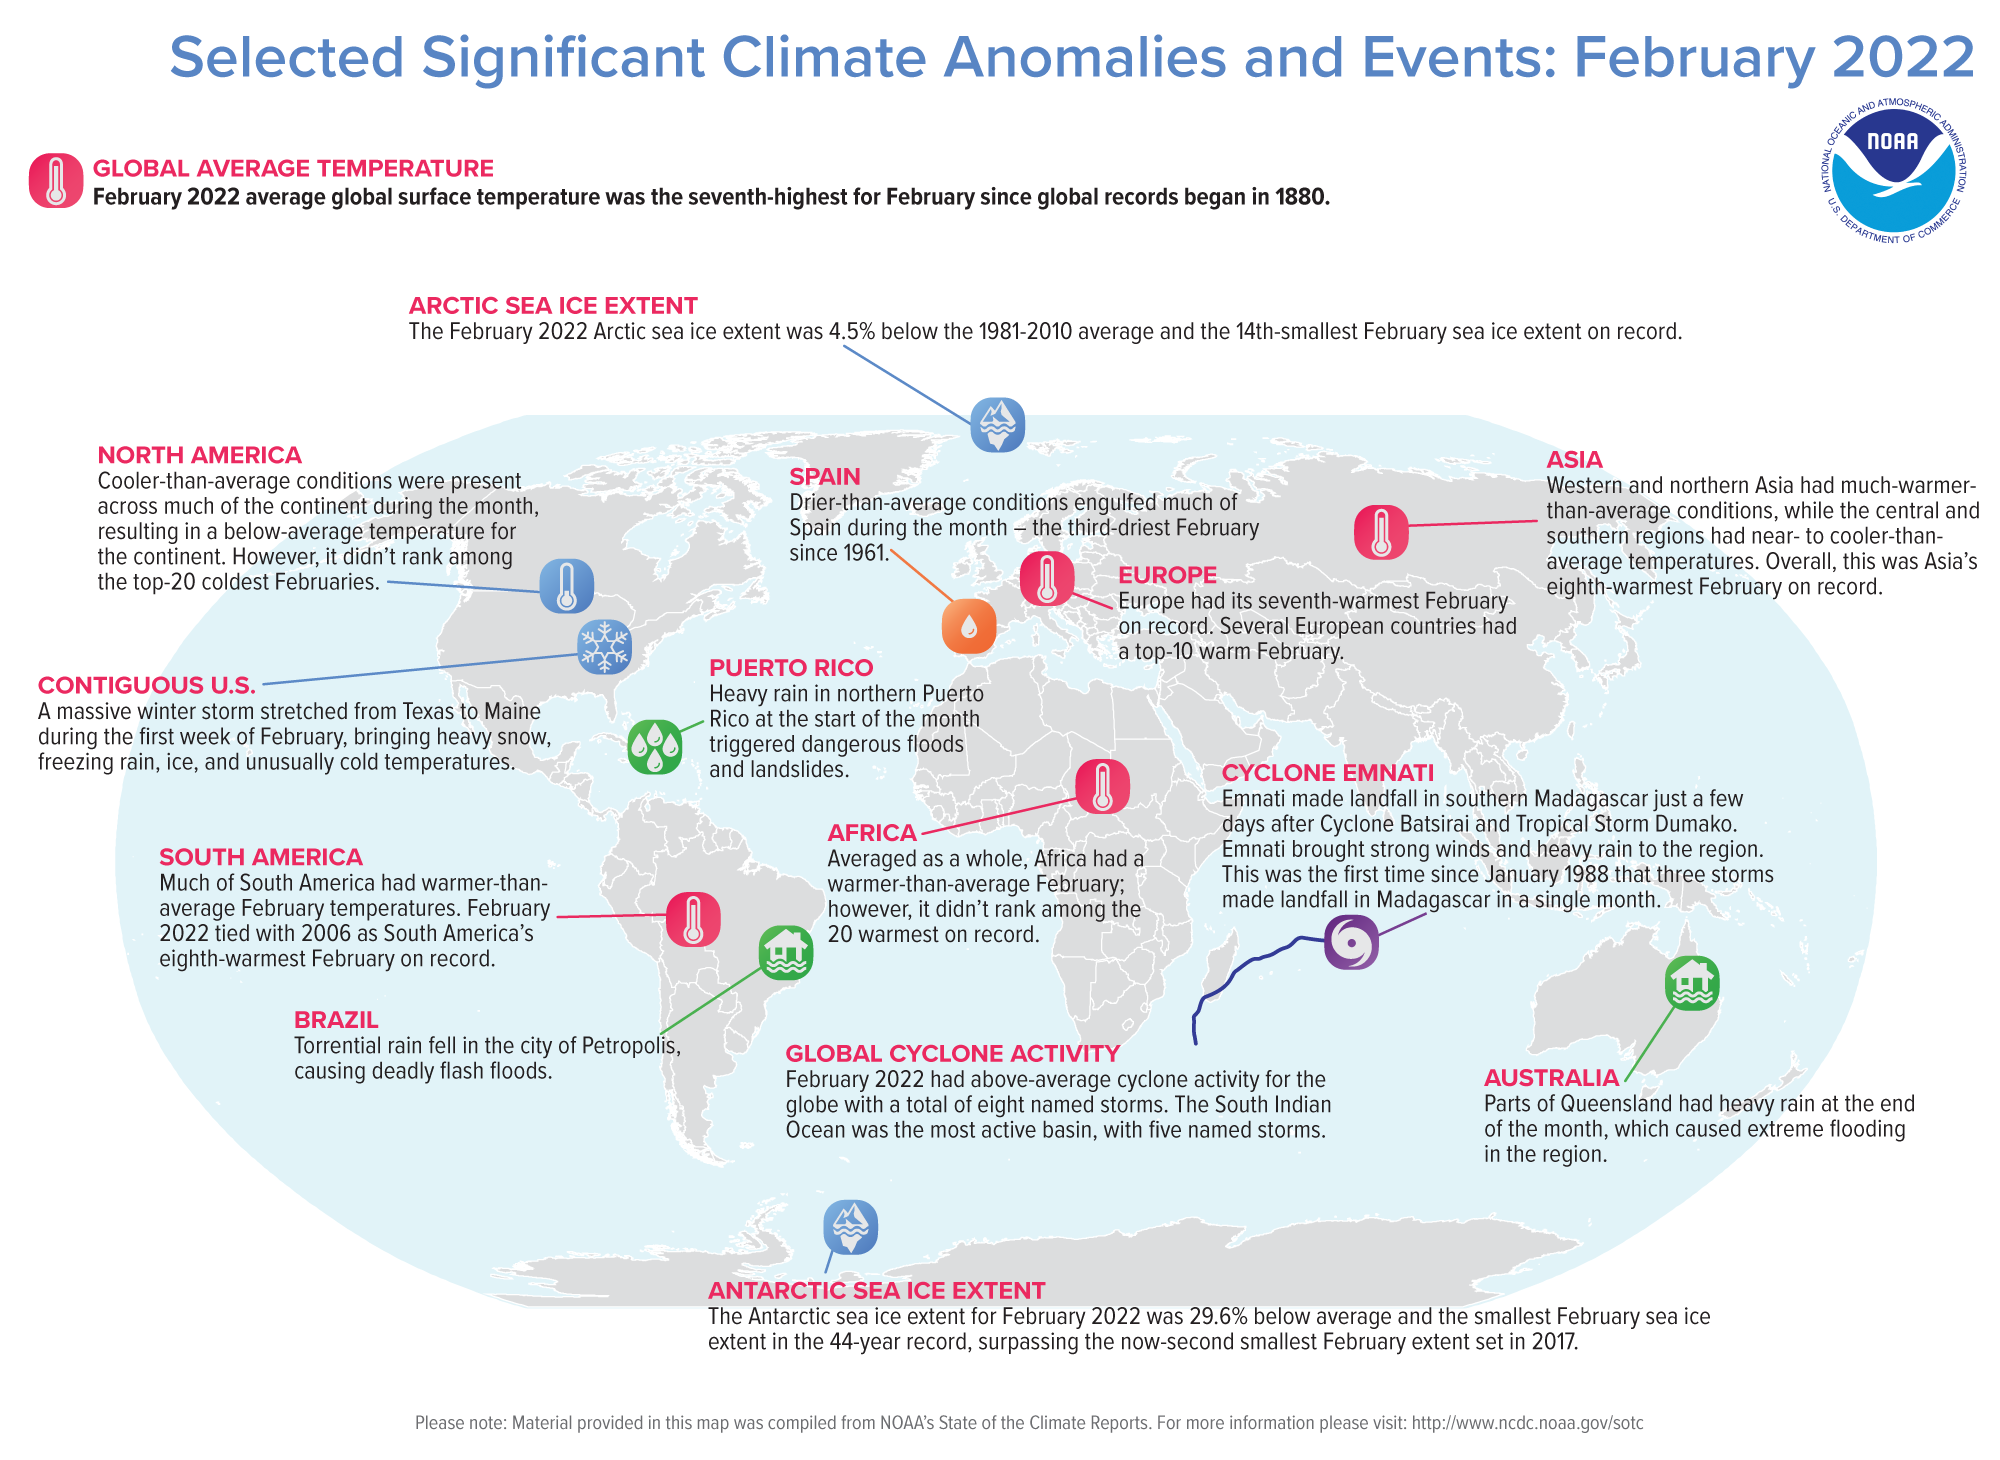
The February 2022 Arctic sea ice extent averaged 5.64 million square miles, which is 4.5% below the 1981-2010 average and the 14th-smallest February extent in the 44-year record, according to an analysis by the National Snow and Ice Data Center (NSIDC) using data from NOAA and NASA.
The Antarctic sea ice extent for February 2022 was the smallest on record at 830,000 square miles, 29.6% below average. This record-low value surpassed the now-second smallest February extent set in 2017 (25.0% below average).
Global Tropical Cyclones
February 2022 had above-average cyclone activity for the globe with a total of eight named storms, four of which intensified to become hurricanes (also known as cyclones or typhoons in parts of the eastern hemisphere). The Northern Hemisphere had no tropical cyclone activity during the month, which is not unusual. The South Indian Ocean was the most active basin with five named storms, tying with the Februaries of 2000 and 2007 for the most named storms since 1981.
Seasonal Global Temperature
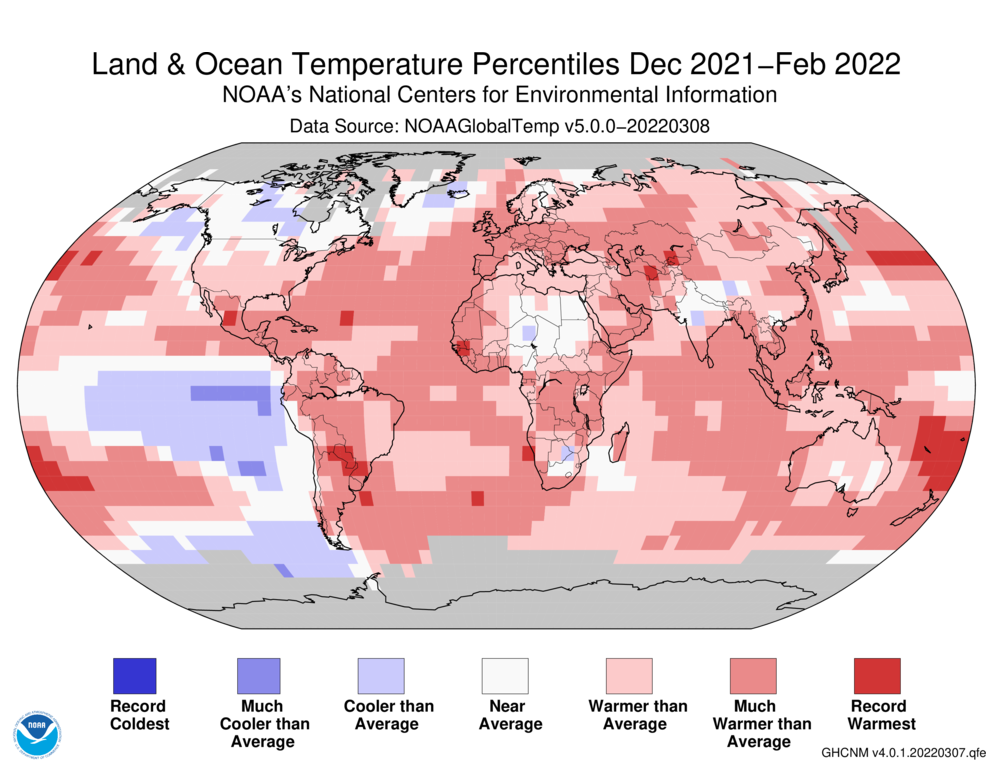
The December 2021-February 2022 global surface temperature was 1.51°F (0.84°C) above the 20th-century average of 53.8°F (12.1°C) and tied with 2015 as the fifth-warmest December-February period in the 143-year record.
The December-February period is defined as the Northern Hemisphere’s meteorological winter and the Southern Hemisphere’s meteorological summer. The Northern Hemisphere winter 2022 temperature departure made it the sixth-highest winter on record. Meanwhile, the Southern Hemisphere summer temperature made it the seventh-highest summer on record.
Regionally, South America, Europe and Asia had a seasonal temperature departure that ranked among the sixth highest on record. Even though North America and Africa had warmer-than-normal seasonal temperatures, each had their coldest December-February period since 2014 and 2015, respectively.
During December-February, temperatures were much above average across Central and South America, Europe, the Atlantic, Indian, northern and western Pacific oceans, as well as parts of western and southern Africa and western Asia. In contrast, Canada, the northern Atlantic Ocean and central/eastern tropical and southeastern Pacific Ocean had cooler-than-average December-February temperatures.
Arkansas Valley Conduit map via the Southeastern Colorado Water Conservancy District (Chris Woodka) June 2021.
Click the link to read the article on the Pueblo Chieftain website (Tracy Harmon). Here’s an excerpt:
Rural Pueblo County residents are expected to see improvements to their drinking water in the next few years, thanks to $12.7 million in federal American Rescue Plan Act Funds being disbursed by Pueblo County Commissioners…Projects receiving funding include the Southeastern Colorado Water Conservancy District, which is working to deliver drinking water to Avondale and Boone as part of the U.S. Bureau of Reclamation’s Arkansas Valley Conduit project, said Chris Woodka, issues management coordinator for the district. It will receive $1.2 million to build delivery lines out of the bureau’s trunk line in eastern Pueblo County. That will bring water to about 1,600 Avondale residents and 230 Boone residents. Avondale Water District also will receive $3.2 million and the town of Boone’s water project will get $1.5 million…
The communities’ water will come out of the Pueblo Reservoir. Once the water arrives in the eastern Pueblo communities, water managers will only have to re-chlorinate it before getting it to their customers, Woodka said…
Of the remainder of the $12 million water infrastructure funds, Beulah Water Works and Colorado City Metro will get more than $3 million. Last July, the Colorado City Metropolitan District dealt with a low water pressure crisis caused by an internet outage at the district’s water treatment plants.
Click the link to access the report on the Lincoln Land Trust website (James N. Levitt and Chandni Navalkha):
As communities worldwide make protecting the climate a priority, land trusts and conservancies of all sizes and capacities are seeking greater clarity in how to address climate change through land conservation and stewardship. Policy makers and decision makers are considering how to address climate-related impacts in communities, states, and regions. Funders and donors are seeking to invest in projects and initiatives which offer durable, lasting solutions for reducing carbon emissions and improving climate resilience.
This report—written by James Levitt, a global expert and educator in land conservation, and Chandni Navalkha, an international leader in sustainable management of land and water resources—offers numerous case examples of successful initiatives along with the following guidance for stakeholders in the private and public sectors looking to boost the potential of civic organizations to implement natural climate solutions:
Empower civic-sector initiatives that are creative and ambitious in scope and scale.
Invest in initiatives with clear strategies and measurable impact.
Aim for broad collaborations.
Share advanced science, technologies, and financial engineering techniques.
Support initiatives that are built to last, able to adapt, and ready to replicate.
About the Authors
James N. Levitt is the Director of the International Land Conservation Network and leads the Sustainably Managed Land and Water Resources goal area’s Cambridge-based team at the Lincoln Institute of Land Policy in Cambridge, Massachusetts. He is also a Fellow at the Harvard Forest, Harvard University, in Petersham, Massachusetts. In addition, he holds an ongoing Fellowship at Highstead, a non-profit organization advancing land conservation in New England. Levitt focuses on landmark innovations in the field of land and biodiversity conservation, both present-day and historic, that are characterized by five traits: novelty and creativity in conception; strategic significance; measurable effectiveness; international transferability; and the ability to endure. He has written and edited dozens of articles and four books on land and biodiversity conservation. He has also lectured widely on the topic in venues ranging from Santiago, Chile to Stockholm, Sweden. Among his current efforts, Levitt plays an instrumental role in the effort to advance the mission of the International Land Conservation Network (ILCN), which is to connect organizations around the world that are accelerating voluntary private and civic sector action to protect and steward land and water resources. Levitt is a graduate of Yale College and the Yale School of Management (Yale SOM). He was named a Donaldson Fellow by Yale SOM for career achievements that “exemplify the mission of the School.”
Chandni Navalkha is the Program Manager for Land Conservation Programs within the Department of Planning and Urban Form, where she works on projects to advance and accelerate the enduring protection of land and water resources worldwide. Prior to joining the Lincoln Institute, Chandni was a fellow with the Sri Lanka Program for Forest Conservation, conducting research on the impacts of conservation on local livelihoods near the Sinharaja World Heritage Site. Chandni has worked for organizations in North America, Latin America, and South Asia supporting urban, peri-urban, and rural communities involved in voluntary land and resource conservation, and earlier in her career worked in change management for private and public sector organizations as a consultant with Accenture.
Click the link to read the article on the NOAA website (Michelle L’Heureux):
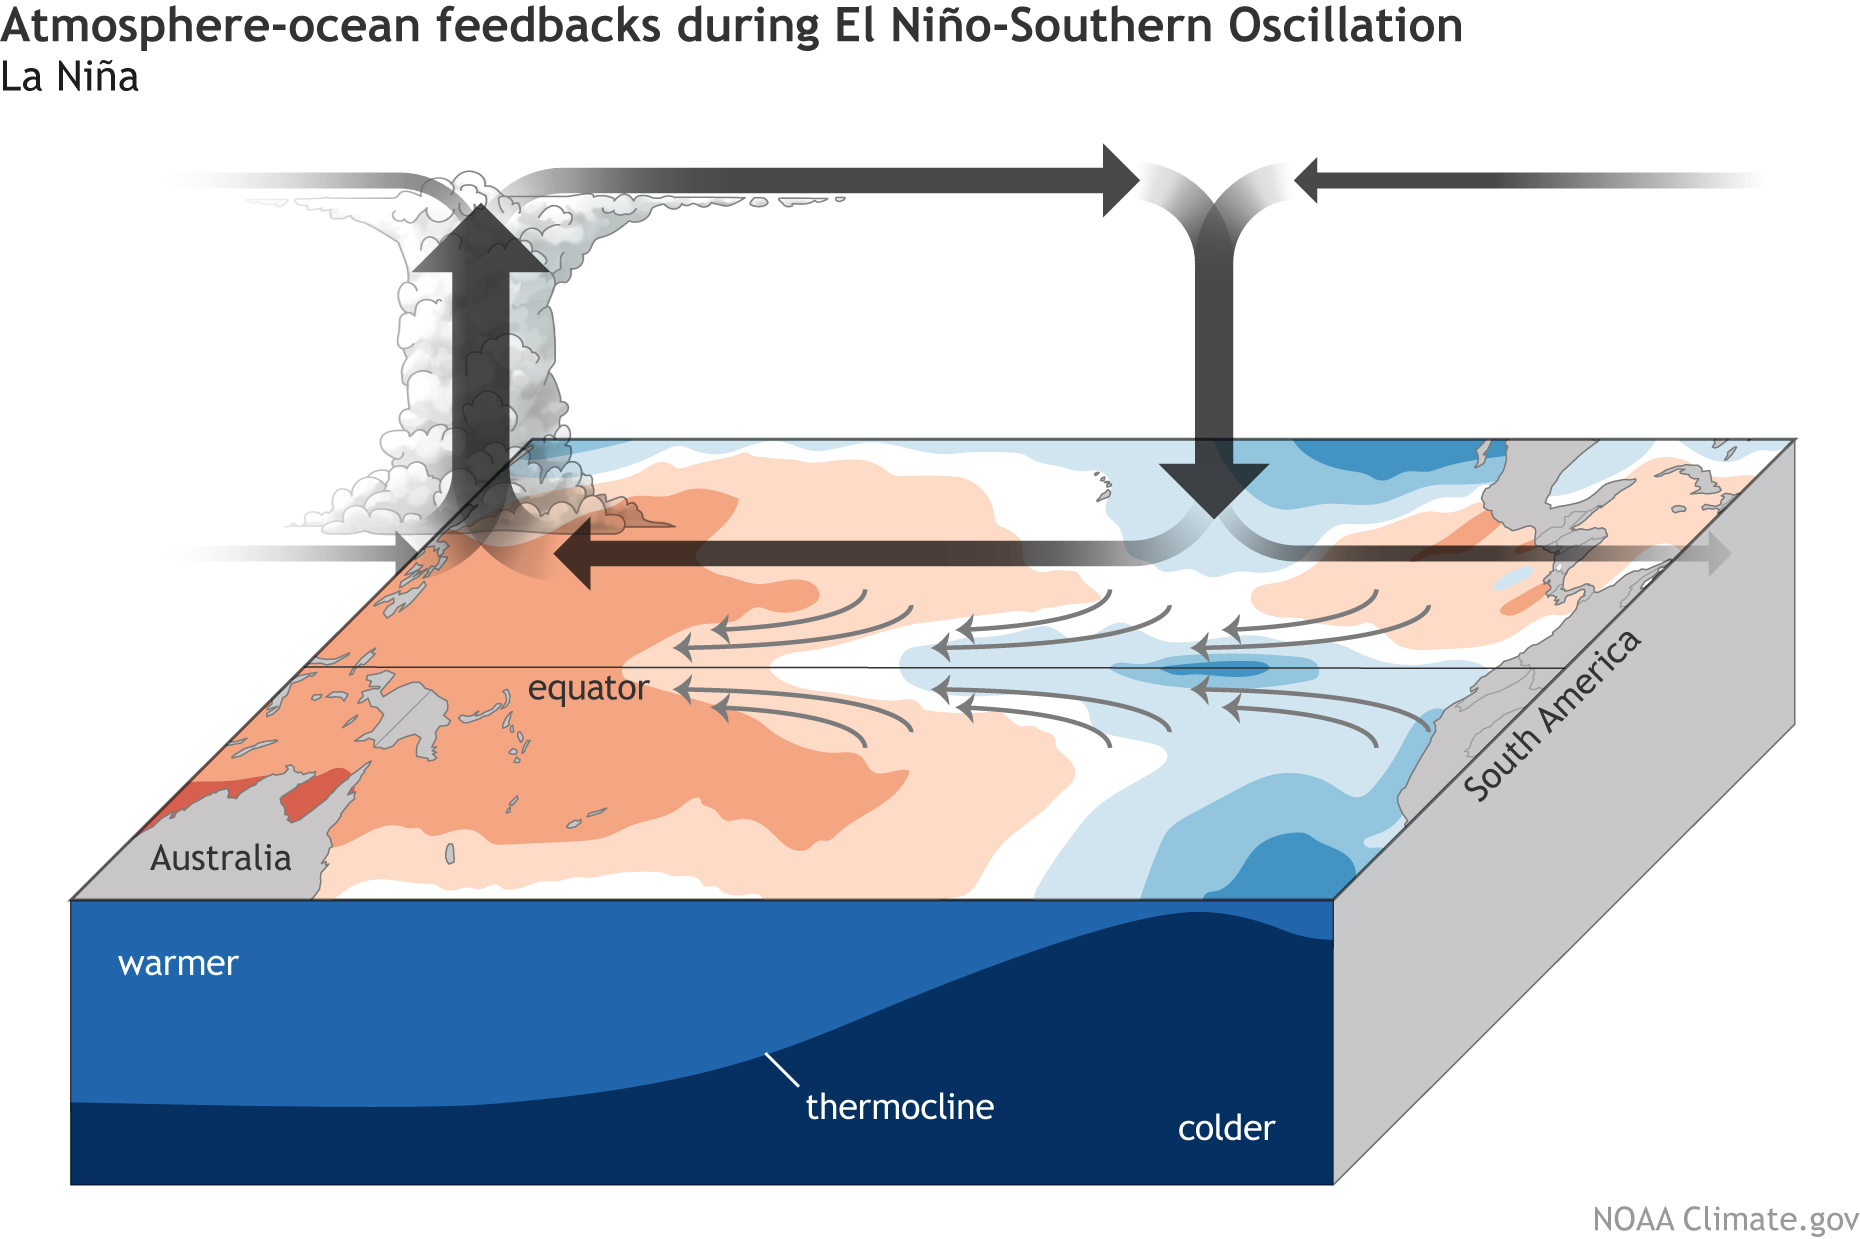
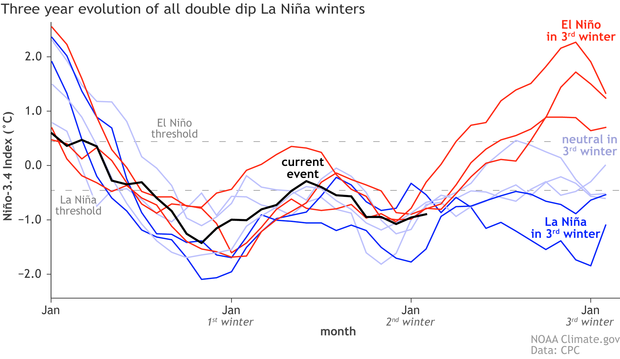
Three-bean salads are a blend of sweet-sour tastiness, implying all good things come in threes. Well, depending on your opinion of La Niña, maybe not all good things, as La Niña—the cool phase of the El Niño-Southern Oscillation climate pattern—reasserted itself in the tropical Pacific this past month with some of the strongest atmosphere-ocean coupling of our double-dip La Niñas so far (winters of 2020-21 and 2021-22). La Niña is now favored to continue into the Northern Hemisphere summer 2022, with nearly equal chances of ENSO-neutral or La Niña thereafter. Is a La Niña three-peat in the offing?
Three-dimensional
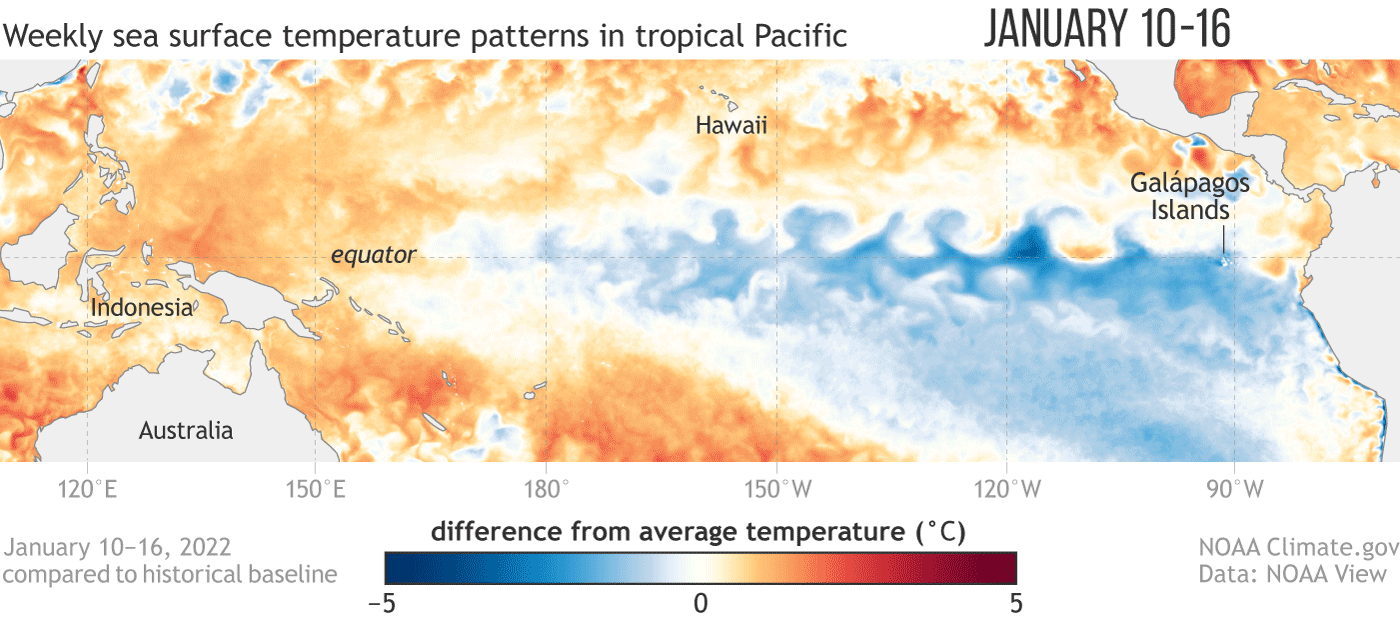
Back up, La Niña strengthened in February? It did, despite the fact that sea surface temperatures in the key monitoring region of the tropical Pacific, the Niño-3.4 region, appear to have bottomed out in December, with a monthly value of -1.1°C (ERSSTv5 data set). Since then, the monthly values have warmed slightly, though February 2022 remained chilly at -0.9 °C. However, the February average smoothed out some notable variability: the weekly average Niño-3.4 index was -0.6 °C at the beginning of February and then decreased to -1.1 °C in the past week. Quite a dive!
Sea surface temperatures in the tropical Pacific Ocean from mid-January through February 2022 compared to the long-term average. East of the International Dateline (180˚), waters remained cooler than average, a sign of La Niña. Graphic by Climate.gov, based on data from NOAA’s Environmental Visualization Lab. Description of historical baseline period here.
Confused by all the numbers for presumably the same Niño-3.4 sea surface temperature index? Don’t be– averages for shorter time spans can fluctuate around a lot more than longer averaging periods. This is the difference between weather and climate. Day-to-day or week-to-week weather can change a lot relative to monthly and longer seasonal climate averages, which do not vary as much. Even as the weekly and monthly values have jumped around, the Oceanic Niño Index (ONI), NOAA’s official measure of ENSO, has remained constant at -1.0°C for the third, overlapping season in a row.
One of the major challenges in ENSO prediction is trying to untangle meaningful seasonal swings in the tropical climate from the shorter-term noise of tropical weather. In February, along with cooling off of sea surface temperatures, we saw a stronger Pacific Walker circulation: a strengthening of trade winds along the surface of the equator (blowing from east-to-west), stronger winds in the upper tropical atmosphere (that blow from west to east), significant drying over the Date Line, and increased rainfall anomalies over the Maritime Continent. All of these features are consistent with a healthy La Niña.
La Niña feedbacks between the ocean and atmosphere. Climate.gov schematic by Emily Eng and inspired by NOAA PMEL.
In fact, by some of our atmospheric measures—the Equatorial Southern Oscillation Index and Central Pacific Outgoing Longwave Radiation index (a measure of equatorial rainfall)—we saw some of the largest monthly values dating back to the start of the first La Niña event in the autumn of 2020! The Pacific Walker circulation was clearly juiced up in the past month and is probably why we saw weekly Niño-3.4 sea surface temperatures take a tumble.
With that said, one month doesn’t make an entire season, and it may have been a short-term swerve on the road to the dissipation of La Niña, as it typically does, through the spring and summer. It’s enough to have at least slowed down La Niña’s exit from the global climate stage, but does it portend more meaningful change going forward? We’ll get back to that later.
Three-legged race
What does the continuation of La Niña mean for impacts during the March-May season over the contiguous United States? As regular blog readers know, the two biggest drivers of seasonal climate outlooks are ENSO and climate trends. The images below show the average March-May temperature and precipitation patterns we’d expect based on the combination of historical La Niña patterns and recent (10-15 year) climate trends.
March-May average temperature (top) and precipitation (bottom) compared to the long-term average for the combination of historical La Niña events and climate trends. Data is based on the CPC ENSO composites and modified by Climate.gov.
As one might expect, NOAA CPC’s official seasonal outlooks for March-May 2022 resemble the patterns above with some exceptions. In general, above-average temperatures are favored over a large part of the contiguous U.S., with the exception of the northwestern U.S., where below-average temperatures are more likely. Above-median precipitation is expected over the northwestern U.S. and the Ohio and Tennessee valleys. Below-median precipitation is favored over most of the southern U.S., extending northward into Utah, Colorado, and parts of the western Great Plains (footnote #1).
In addition to these potential temperature and precipitation anomalies, it is also worth checking out a previous article by Mike Tippett and Chiara Lepore on ENSO and Tornadoes. During La Niña, springtime severe weather can be more active in parts of the southern/southeastern United States (though not a guarantee as John Allen explained to us after the 2020-21 La Niña).
Three’s a crowd
Despite a few forecast models suggesting otherwise, below-average sea surface temperature patterns are likely to weaken across the tropical Pacific as we go through the spring, but it’s still an open question how much they will weaken. Will they weaken enough to eventually return to ENSO-neutral (near average conditions across the tropical Pacific)? And when would that happen?
This month the crystal ball became blurrier, with a 54% chance that La Niña persists into June-August 2022. And, after that, it’s pretty much a split between ENSO-neutral and La Niña through the fall, with neither outcome exceeding a 50% probability (and El Niño still has a 10-15% chance!). Thus, reading between the lines, odds for a La Niña three-peat have gone up (Emily first blogged about this possibility in November 2021), but nowhere near certainty. Keep in mind, the accuracy of ENSO forecasts made this time of year are, well…not so great.
Also, La Niña three-peats (triple dips?) are very rare—only two exist in our more reliable historical record going back to 1950 and both occurred after major El Niño events, which our current event did not. The time evolution of the Niño-3.4 index for the two La Niña three-peats is featured in the darker blue lines in the image below. It is also interesting that out of the eight double-dip La Niñas in our historical record, three ended up evolving into an El Niño for the third winter (red lines) and the remaining three ended up on the cooler side, close to La Niña thresholds, but were ultimately classified as ENSO-neutral winters.
Three-year history of sea surface temperatures in the Niño-3.4 region of the tropical Pacific for 8 previous double-dip La Niña events. The color of the line indicates the state of ENSO for the third winter (red: El Niño, darker blue: La Niña, lighter blue: neutral). The black line shows the current event. Monthly Niño-3.4 index is from CPC using ERSSTv5. Time series comparison was created by Michelle L’Heureux, and modified by Climate.gov.
To get to a third consecutive La Niña winter we would need to see ongoing, enhanced easterly trade winds and, also, the replenishment of below-average temperature “fuel” in the subsurface equatorial Pacific Ocean. In February, at least, we saw some trends in this direction.
So, is this two steps forward, one step back? Or three steps forward? Stay tuned next month when Emily returns from vacation. If we’re lucky maybe she’ll include some pretty tropical photos. Maybe three of them.
Chimney Hollow Reservoir construction site September 2021. Photo credit: Northern Water
Alex Hager takes a look at Chimney Hollow Reservoir in this article on the KUNC website.Click through to read the whole article, here’s an excerpt:
Right now, Chimney Hollow is a project site teeming with activity. Building a reservoir involves far more than just digging a hole in the ground. At this particular spot, it requires the construction of a massive dam – the tallest built in the United States in 25 years…To build something at this scale, machines are moving a volume of earth that’s hard to wrap your head around.
“We’re filling 100-ton trucks,” said Joe Donnelly, Chimney Hollow’s project manager. “We need a whole load of rock placed on the dam every two minutes, five days a week, for two and a half years.”
[…]
[Jeff] Stahla said additional water storage will help water providers gain some certainty and more smoothly supply homes across the fluctuation of wet years and dry years — a practice baked into water projects for centuries…
“If we’re going to be able to exist and offer the same opportunities to our children and grandchildren on the Front Range,” said Jeff Stahla with Northern Water, “We should consider — and we’re doing it here — capturing the water when it’s available so that we have flexibility in those years when we don’t have it.”
A Pi Day pie from Reilly’s Bakery in Biddeford at Biddeford High School in Biddeford, ME on Friday, March 13, 2015. (Photo by Whitney Hayward/Portland Press Herald via Getty Images)
Click the link to read the article on the KOAA website (Bill Folsom). Here’s an excerpt:
The current string of storms bringing snow to Colorado is a boost to snowpack. “Typically, March and April are the wettest months,” said Jennifer Kemp with Colorado Springs Utilities. It is important for the state’s water supply.
Reservoir levels are currently where they need to be for this time of year with more than a two-year supply. Snowpack depends on the river basin. Levels vary from 85 up to 95 percent of average…
there is more to the water supply equation. You must consider the extended drought trend in the west. On the U.S. drought map most of southern Colorado is in severe drought. Dry conditions can suck up water in the snowpack. “For example, how thirsty are the soils? So that when we get that run-off, will much be absorbed into the ground or actually come down into our streams and rivers,” said Kemp.
Click the link to read the article on the Mountain Mail website (D.J. DeJong). Here’s an excerpt:
Colorado river basins remain near normal in precipitation for the water year to date despite below-normal precipitation in January and February, according to the National Resources Conservation Service. Southern Colorado basins fared better than other parts of Colorado. The Arkansas River Basin received 112 percent of median precipitation in February…
Snowpack for the Arkansas River Basin stood at 90 percent of median as of March 1. Current statewide streamflow projections are 88 percent of normal…
The current projection for the Arkansas Basin is 81 percent of median streamflow.
Statewide reservoir storage has remained below average this water year. The Arkansas Basin stands at 89 percent of median storage as of March 1. The NRSC states more precipitation is needed through the remainder of winter to increase reservoir storage in addition to improving drought conditions in the state…
Colorado Drought Monitor map March 8, 2022.
As of Thursday, the National Drought Mitigation Center at University of Nebraska Lincoln, reports Chaffee County remains in moderate drought conditions in the western part of the county with severe drought conditions in the eastern half.
After the 2013 flood did massive damage in Loveland, the city led efforts to do repairs to public infrastructure, spending $37 million over the next six years. But city staff members, briefing the Loveland City Council on Tuesday on the Big Thompson River Financial Plan, said there’s much more that needs to be done to make the city resilient when future floods occur…Stormwater engineer Kevin Gingery said records of flooding on the Big Thompson River go back to 1906, and show historically the river has flooded on average every eight years — 12 damaging floods in a century…Since 1987, the river has flooded twice, in 1999 and the massive flood in 2013. Both of those floods and one in 1951 are considered of a 100-year magnitude or greater, according to the Federal Emergency Management Agency (FEMA) Flood Insurance Rate Study…
The new mapping effects future development of the 402 corridor, all bridge crossings of the river, and implementation of the Big Thompson River Corridor Master Plan, city officials said…Many of the bridges on the river are undersized, and sometimes silt builds up under them. The plan calls for removing the excess silt so more water can pass under the bridges.
Other problems include large trees that block river flow, and logs that fall into the river can create a safety hazard for river users.
Carlson pointed to the bridge on South Lincoln Avenue. Crews repaired damage there from the 2013 flood, but the bridge needs to be substantially bigger to withstand future floods, he said. Before the flood, the highest discharge recorded there was 19,000 cubic feet per second; the new 100-year discharge level is 20,429 cfs, so city staff wants to build a larger bridge that can handle a greater flow. Work also is needed in Fairgrounds Park and Barnes Park to better channel flood waters under the bridge, something that could help property owners in the floodplain in that area, Carlson said.
Marshall Fire December 30, 2021. Photo credit: Boulder County
Click the link to read the article on the Pueblo Chieftain website (Sophie Potts). Here’s an excerpt:
Over the past decade, the number of wildfires Colorado has experienced fluctuates, but the amount of damage each one does is steadily increasing. Until 2002, Colorado had never seen a wildfire burn over 100,000 acres, in 2020 we saw our first 200,000 acre fire. On the eve of 2022, we saw the most destructive forest fire in Colorado history destroy nearly 1,000 homes in the Boulder area. It is no coincidence that these numbers are becoming more and more terrifying. And, as so many dire issues do, the whole thing boils down to climate change. As global temperatures rise and climate patterns change, drier summers and warmer temperatures provide the ideal conditions for destructive and powerful wildfires…
We call this phenomenon global warming. But that label is an oversimplification. Climate change can also manifest as new weather patterns or even a dip in temperature. While the issue of global warming has been highly politicized in the American media, its effects are unequivocal and universal. While the most obvious negative impact of wildfires is the physical devastation they wreak on both the natural and man-made landscape, there are more subtle long term effects of wildfires that must also be acknowledged…
Ash and silt pollute the Cache la Poudre River after the High Park Fire September 2012
Wildfires have been found to contribute to the contamination of our water supply. When large rain storms follow a wildfire event, as is common in Colorado, the rainfall funnels particulate matter high in nitrate and manganese into the water supply, making it dangerous for human consumption and aquatic life…
I want to end on a positive note, to leave you with a glimmer of hope or a light at the end of the tunnel. But I can’t do that. Humanity is not taking enough action against the climate crisis. Instead we waste our time squabbling about a multitude of details about how to reduce carbon emissions, who pays for it, objections from those benefiting financially, and on and on. I worry that there will come a day when we look up and realize that everything that makes our planet the beautiful and unique place it is has been destroyed and we have little left to protect or argue about. It is our own inaction that is obscuring hope. So the light at the end of the tunnel is not mine to offer, but rather yours to create.
Imagine trying to count hundreds of thousands of birds in a matter of seconds. This is what Andy Caven does every spring… from a plane. In March, upwards of a million sandhill cranes pass through Nebraska’s central Platte River Valley. For the past 20 years, the Crane Trust has conducted aerial surveys of sandhill crane roosts to get an accurate count of the number of birds that pass through.
We are happy to announce, “Counting Cranes” is now available! PBT’s Mariah Lundgren produced this short film alongside Grant Reiner and Sidney Parks in partnership with the Crane Trust.
In this film, Andy and his team take us behind the scenes to show us how the aerial surveys are done, what they have learned, and why it’s important.
Once again we are pleased to present the Water Law in a Nutshell course. A great opportunity to learn with Aaron Clay in an online setting about all aspects of the law related to water rights and ditch rights as applied in Colorado. Subject matter includes the appropriation, perfection, use, limitations, attributes, abandonment and enforcement of various types of water rights. Additional subject matter will include special rules for groundwater, public rights in appropriated water, interstate compacts and more.
From his 26 years as a water referee at the Colorado Water Court, Clay brings his wealth of knowledge that earned him a reputation as one of the top experts in water law to this “Water in a Nutshell” course.
Providing sufficient, safe, and reliable drinking water is a growing challenge as water supplies become more scarce and uncertain. Meanwhile, water utilities in the United States lose approximately 17% of their delivered water to leaks each year. Using data from over 800 utilities across four U.S. states, California, Georgia, Tennessee, and Texas, we characterize the heterogeneity in water losses across the U.S., develop a model to assess the economically efficient level of losses, and use this model to compare the net benefits of several proposed water loss regulations and modeling approaches. Combining economic and engineering principles, our model shows that for the median utility, it is economically efficient to reduce water losses by 34.7%, or 100 acre-feet (AF) per year. The median cost of water savings from leak management is $277/AF, which falls well below the cost of traditional water management tools. However, the optimal level of water losses strongly depends on utility-specific characteristics, leading to large differences in the potential for cost-effective leak reduction across utilities. We show that water loss management can lead to water savings that generate net economic benefits, but only if management approaches incorporate economic and engineering principles.
Renewable energy skeptics argue that because of their variability, wind and solar cannot be the foundation of a dependable electricity grid. But the expansion of renewables and new methods of energy management and storage can lead to a grid that is reliable and clean.
As wind and solar power have become dramatically cheaper, and their share of electricity generation grows, skeptics of these technologies are propagating several myths about renewable energy and the electrical grid. The myths boil down to this: Relying on renewable sources of energy will make the electricity supply undependable.
Last summer, some commentators argued that blackouts in California were due to the “intermittency” of renewable energy sources, when in fact the chief causes were a combination of an extreme heat wave probably induced by climate change, faulty planning, and the lack of flexible generation sources and sufficient electricity storage. During a brutal Texas cold snap last winter, Gov. Greg Abbott wrongly blamed wind and solar power for the state’s massive grid failure, which was vastly larger than California’s. In fact, renewables outperformed the grid operator’s forecast during 90 percent of the blackout, and in the rest, fell short by at most one-fifteenth as much as gas plants. Instead, other causes — such as inadequately weatherized power plants and natural gas shutting down because of frozen equipment — led to most of the state’s electricity shortages.
In Europe, the usual target is Germany, in part because of its Energiewende (energy transformation) policies shifting from fossil fuels and nuclear energy to efficient use and renewables. The newly elected German government plans to accelerate the former and complete the latter, but some critics have warned that Germany is running “up against the limits of renewables.”
In reality, it is entirely possible to sustain a reliable electricity system based on renewable energy sources plus a combination of other means, including improved methods of energy management and storage. A clearer understanding of how to dependably manage electricity supply is vital because climate threats require a rapid shift to renewable sources like solar and wind power. This transition has been sped by plummeting costs —Bloomberg New Energy Finance estimates that solar and wind are the cheapest source for 91 percent of the world’s electricity — but is being held back by misinformation and myths.
Myth No. 1: A grid that increasingly relies on renewable energy is an unreliable grid.
Going by the cliché, “In God we trust; all others bring data,” it’s worth looking at the statistics on grid reliability in countries with high levels of renewables. The indicator most often used to describe grid reliability is the average power outage duration experienced by each customer in a year, a metric known by the tongue-tying name of “System Average Interruption Duration Index” (SAIDI). Based on this metric, Germany — where renewables supply nearly half of the country’s electricity — boasts a grid that is one of the most reliable in Europe and the world. In 2020, SAIDI was just 0.25 hours in Germany. Only Liechtenstein (0.08 hours), and Finland and Switzerland (0.2 hours), did better in Europe, where 2020 electricity generation was 38 percent renewable (ahead of the world’s 29 percent). Countries like France (0.35 hours) and Sweden (0.61 hours) — both far more reliant on nuclear power — did worse, for various reasons.
The Bungala Solar Farm for is at this point the nation’s largest operation solar PV plant. Image: Enel Green Power
Thus all sources of power will be unavailable sometime or other. Managing a grid has to deal with that reality, just as much as with fluctuating demand. The influx of larger amounts of renewable energy does not change that reality, even if the ways they deal with variability and uncertainty are changing. Modern grid operators emphasize diversity and flexibility rather than nominally steady but less flexible “baseload” generation sources. Diversified renewable portfolios don’t fail as massively, lastingly, or unpredictably as big thermal power stations.
The purpose of an electric grid is not just to transmit and distribute electricity as demand fluctuates, but also to back up non-functional plants with working plants: that is, to manage the intermittency of traditional fossil and nuclear plants. In the same way, but more easily and often at lower cost, the grid can rapidly back up wind and solar photovoltaics’ predictable variations with other renewables, of other kinds or in other places or both.This has become easier with today’s far more accurate forecasting of weather and wind speeds, thus allowing better prediction of the output of variable renewables. Local or onsite renewables are even more resilient because they largely or wholly bypass the grid, where nearly all power failures begin. And modern power electronics have reliably run the billion-watt South Australian grid on just sun and wind for days on end, with no coal, no hydro, no nuclear, and at most the 4.4-percent natural-gas generation currently required by the grid regulator.
Most discussions of renewables focus on batteries and other electric storage technologies to mitigate variability. This is not surprising because batteries are rapidly becoming cheaper and widely deployed. At the same time, new storage technologies with diverse attributes continue to emerge; the U.S. Department of Energy Global Energy Storage Database lists 30 kinds already deployed or under construction. Meanwhile, many other and less expensive carbon-free ways exist to deal with variable renewables besides giant batteries.
The first and foremost is energy efficiency, which reduces demand, especially during periods of peak use. Buildings that are more efficient need less heating or cooling and change their temperature more slowly, so they can coast longer on their own thermal capacity and thus sustain comfort with less energy, especially during peak-load periods.
A second option is demand flexibility or demand response, wherein utilities compensate electricity customers that lower their use when asked — often automatically and imperceptibly — helping balance supply and demand. One recent study found that the U.S. has 200 gigawatts of cost-effective load flexibility potential that could be realized by 2030 if effective demand response is actively pursued. Indeed, the biggest lesson from recent shortages in California might be the greater appreciation of the need for demand response. Following the challenges of the past two summers, the California Public Utilities Commission has instituted the Emergency Load Reduction Program to build on earlier demand response efforts.
Some evidence suggests an even larger potential: An hourly simulation of the 2050 Texas grid found that eight types of demand response could eliminate the steep ramp of early-evening power demand as solar output wanes and household loads spike. For example, currently available ice-storage technology freezes water using lower-cost electricity and cooler air, usually at night, and then uses the ice to cool buildings during hot days. This reduces electricity demand from air conditioning, and saves money, partly because storage capacity for heating or cooling is far cheaper than storing electricity to deliver them. Likewise, without changing driving patterns, many electric vehicles can be intelligently charged when electricity is more abundant, affordable, and renewable.
The top graph shows daily solar power output (yellow line) and demand from various household uses. The bottom graph shows how to align demand with supply, running devices in the middle of the day when solar output is highest. ROCKY MOUNTAIN INSTITUTE
A third option for stabilizing the grid as renewable energy generation increases is diversity, both of geography and of technology — onshore wind, offshore wind, solar panels, solar thermal power, geothermal, hydropower, burning municipal or industrial or agricultural wastes. The idea is simple: If one of these sources, at one location, is not generating electricity at a given time, odds are that some others will be.
Finally, some forms of storage, such as electric vehicle batteries, are already economical today. Simulations show that ice-storage air conditioning in buildings, plus smart charging to and from the grid of electric cars, which are parked 96 percent of the time, could enable Texas in 2050 to use 100 percent renewable electricity without needing giant batteries.
To pick a much tougher case, the “dark doldrums” of European winters are often claimed to need many months of battery storage for an all-renewable electrical grid. Yet top German and Belgian grid operators find Europe would need only one to two weeks of renewably derived backup fuel, providing just 6 percent of winter output — not a huge challenge.
The bottom line is simple. Electrical grids can deal with much larger fractions of renewable energy at zero or modest cost, and this has been known for quite a while. Some European countries with little or no hydropower already get about half to three-fourths of their electricity from renewables with grid reliability better than in the U.S. It is time to get past the myths.
Amory B. Lovins is an adjunct professor of civil and environmental engineering at Stanford University, and co-founder and chairman emeritus of Rocky Mountain Institute. M. V. Ramana is the Simons Chair in Disarmament, Global and Human Security and director of the Liu Institute for Global Issues at the School of Public Policy and Global Affairs at the University of British Columbia in Vancouver, Canada.
At a special meeting of the Pagosa Area Water and Sanita- tion District (PAWSD) Board of Directors on March 3, the board unanimously voted to cancel the upcoming district election.
According to District Manager and Engineer Justin Ramsey, the board had three openings and three candidates for board posi- tions after a fourth candidate withdrew…
The three candidates declared elected after the cancellation of the election are Drew Mackey and current board member Blake Brueckner for three-year terms and Bill Hudson for a one-year term.
Click the link to read the release on the FEMA website:
Updates to Archuleta County’s flood insurance rate maps are nearing completion. The new maps will provide Archuleta County with more accurate flood risk information that can help local officials and residents make informed decisions about reducing flood risks and purchasing flood insurance.
The mapping project is a joint effort between Archuleta County, the Colorado Water Conservation Board, and FEMA. It is part of a nationwide effort led by FEMA to increase local knowledge of flood risks and support actions to address and reduce those risks.
Before new flood insurance rate maps become effective, there is a 90-day appeal period during which local residents and business owners can provide additional data for consideration before the maps are final. This appeal period starts on March 10, 2022.
Officials encourage residents and business owners to review the proposed flood insurance rate maps to learn about local flood risks, potential future flood insurance requirements, and any concerns or questions about the information provided.
Appeal packages may be submitted during the 90-day appeal period. The sole basis of the appeal must include the possession of knowledge or information indicating that the proposed flood hazard determinations are scientifically and/or technically incorrect.
According to the U.S. Department of Agriculture (USDA) National Water and Climate Center’s snowpack report, the Wolf Creek summit, at 11,000 feet of elevation, had 31.8 inches of snow water equivalent as of 11 a.m. on Wednesday, March. 2. That amount is up 2 inches from the snow water equivalent depth of 29.8 inches reported Wednesday, March 9. The Wolf Creek summit is at 126
percent of the March 9 snowpack median.
The San Miguel, Dolores, Animas and San Juan river basins were at 101 percent of the March 9 median in terms of snowpack.
WEP’s work to leverage the knowledge it has accumulated is reflected in the organization’s two ongoing stream enhancement projects.
[Al] Pfister explained that stream enhancement involves “enhancing channel stability [and] doing some reworking of the river so that you have a low stream channel instead of flat stream bed.”
WEP’s current stream enhancement projects focus on enhancements to the San Juan River both near the proposed Yamaguchi Park South and upstream from Pagosa for 2.5 miles from near Bob’s LP. Pfister stated that both of these projects build off of prior work undertaken by the Town of Pagosa Springs and its partners to enhance the section of the San Juan River that flows through downtown Pagosa.
Yamaguchi South Planning Project site layout via the City of Pagosa Springs.
Yamaguchi South project
The planned stream enhancements in Yamaguchi Park South involve both modifications to the river itself and enhancements to the recreational resources along its banks. Pfister explained that, in terms of river modifications, “There’s going to be one whitewater feature in there, but then also enhancing the stream morphology. Pfister stated that these changes are aimed at providing healthier fish habitat and promoting the health of the riparian corridor for all its users, including birds, mammals and insects. He also suggested that the stream modifications required for conservation synergize with the needs of recreational users by promoting healthy fish populations for fisher people. They also provide deep stream channels and shallow bank pools that benefit boating and riverside recreation. On the banks, the project will involve the creation of a new boat put in and take out in Yamaguchi Park South to replace the current put in at the south end of Yamaguchi Park.
Pfister commented that this will improve “access for people so there’s not the conflict that currently exists down there at the end of Yamaguchi Park now.”
Pfister elaborated, saying, “The county and town both use that as a location to fill their water trucks. So … it can create some challenges.”
Pfister explained that the new boat take out will include a gravel road to the new take out location, in contrast to the dirt road currently used to access the take out, and a larger area for taking out and launch- ing boats. Pfister said that the goal was “to have more of a permanent thing, whereas now it’s a dirt road, and having the put in or take out such that it doesn’t have negative impacts on the stream morphology/hydrology.”
Pagosa gateway project
WEP’s second major stream enhancement project is the Pagosa gateway project, which involves enhancements to the San Juan River for approximately 2.5 miles north of Bob’s LP. This project will involve similar stream improvements to the Yamaguchi South project as well as the removal of several car bodies that are currently deposited in the river upstream from Pagosa. Pfister highlighted that the removal of these car bodies is “a big issue as far as river recreationists are concerned, and it’s not healthy for the river.”
Both the Pagosa gateway and South Yamaguchi projects are await- ing the completion of final steps, including pieces of grant funding and private landowner permissions. However, Pfister expressed optimism that both projects would begin to break ground in the “next couple years.”
Click the link to read the report on the NOAA website:
National Overview
February Highlights
February Temperature
The average contiguous U.S. temperature during February was 33.8°F, 0.1°F below the 20th-century average, ranking in the middle third of the 128-year period of record.
Temperatures were below average across portions of the Upper Mississippi Valley as well as from the central Rockies to the Gulf Coast. Temperatures were above average across portions of the West Coast and from the Southeast to New England.
The Alaska statewide February temperature was 8.6°F, 3.8°F above the long-term average. This ranked among the middle one-third of the 98-year period of record for the state.
Temperatures were below average across parts of the North Slope while above-average temperatures were observed across the southern third of the state. King Salmon ranked fifth-warmest while Anchorage and Kodiak each had their sixth-warmest February on record.
Bering Sea ice extent in February was the highest value observed since 2013, but fell rapidly the last 10 days of the month and was slightly below the 1991-2020 median by March 2.
The contiguous U.S. average maximum (daytime) temperature during February was 46.3°F, 1.5°F above the 20th-century average, ranking in the middle third of the historical record. Above-average maximum temperatures were observed across parts of the West, northern and central Plains and from Florida to New England. Below-average daytime temperatures occurred across portions of the Rockies, South and Great Lakes. California ranked 10th warmest on record for maximum temperature.
The contiguous U.S. average minimum (nighttime) temperature during February was 21.2°F, 1.6°F below the 20th-century average, ranking in the coldest third of the record. Above-average minimum temperatures were observed across portions of the East Coast. Below-average minimum temperatures dominated across much of the West, Plains, Midwest and Great Lakes. Texas ranked 11th coldest for nighttime temperatures during February.
As of March 8, there were 3,165 record warm daily high (1,867) and low (1,298) temperature records in February, which was about 65 percent of the 4,870 record cold daily high (2,423) and low (2,447) temperature records observed during February.
Based on NOAA’s Residential Energy Demand Temperature Index (REDTI), the contiguous U.S. temperature-related energy demand during February was 20 percent below average and the 39th-lowest value in the 128-year period of record.
February Precipitation
The February precipitation total for the contiguous U.S. was 1.73 inches, 0.40 inch below average, and ranked in the driest third of the historical period of record.
Precipitation was above average from the Mid-Mississippi Valley to New England. Ohio had its sixth-wettest February. Precipitation was below average across most of the West and portions of the Plains, Southeast and Mid-Atlantic. California and Nebraska each had their second-driest February with Nevada ranking third driest.
A Category 4 atmospheric river event brought significant rainfall, flooding and avalanche concerns to portions of Oregon and Washington during February 27-28.
The state of Alaska, as a whole, ranked as the wettest February in the 98-year record. Juneau had its wettest February following its wettest January on record. King Salmon also experienced its wettest February on record, while Anchorage ranked second-wettest. Snowpack was above normal across most of the state.
According to the March 1 U.S. Drought Monitor report, 59.2 percent of the contiguous U.S. was in drought, up nearly 4 percent from the beginning of February. Drought conditions expanded or intensified across portions of the northern and central Plains, as well as across parts of the West, Midwest, Great Lakes and from Florida to the Carolina coast. Drought contracted on the Big Island of Hawaii, but expanded across the islands of Kauai and O’ahu. Drought severity lessened across portions of the southern Plains and across Puerto Rico.
Winter Highlights
December-February Temperature
The winter (December-February) average contiguous U.S. temperature was 34.8°F, 2.5°F above average, ranking in the warmest third of the winter record.
Winter temperatures were above average across much of the Lower 48 with Georgia and South Carolina each experiencing their seventh-warmest winter on record. Temperatures ranked near average from the Pacific Northwest to the western Great Lakes with no states ranking below average for the winter season.
The Alaska December-February temperature was 6.3°F, 2.7°F above the long-term average, ranking among the middle one-third of the 97-year record. Above-average temperatures were observed across the Aleutians, Bristol Bay, Cook Inlet and the southern half of the West Coast, Central Interior and Southeast Interior regions. Temperatures were below average across portions of the North Slope and the southern Panhandle.
The contiguous U.S. average maximum (daytime) temperature during December-February was 46.4°F, 3.7°F above the 20th-century average, ranking eighth warmest in the historical record. Above-average temperatures were observed across most of the Lower 48 with Oklahoma ranking second warmest and Arkansas, third warmest on record. No states across the Lower 48 ranked below average for the winter season.
The contiguous U.S. average minimum (nighttime) temperature during December-February was 23.1°F, 1.4°F above the 20th-century average, ranking in the warmest third of the record. Above-average temperatures were observed across parts of the West and from the Gulf Coast to the Northeast. Nighttime temperatures were below average across parts of the Upper Mississippi Valley and central Plains.
Based on NOAA’s Residential Energy Demand Temperature Index (REDTI), the contiguous U.S. temperature-related energy demand during the winter season was 45 percent of average and the 15th-lowest value in the 127-year period of record.
December-February Precipitation
The winter precipitation total for the contiguous U.S. was 5.76 inches, 1.03 inches below average, and ranked as the 12th-driest winter in the 127-year period of record.
Precipitation was above average across parts of the Upper Mississippi, Ohio, and Tennessee valleys. Minnesota had its 10th-wettest winter. Precipitation was below average across portions of the West, central and southern Plains, Gulf Coast and across parts of the Southeast and Mid-Atlantic. Louisiana had its third-driest winter on record with Nebraska ranking fourth driest and Kansas, fifth driest.
Climatologically speaking, winter is the wet season across much of the western U.S. If the dry conditions experienced in January and February across portions of the West were to continue into March and April, insufficient water resources may result during the dry season (summer), as well as an increased potential for drought intensification and wildfires in the fall.
Lake Powell, the second-largest reservoir in the U.S., is nearing its lowest water level since it was filled more than 50 years ago. By mid-March, the water level is expected to drop below 3,525 feet above sea level, threatening the region’s water supply and ability to generate hydropower.
Five regions in Alaska — Bristol Bay, West Coast, North Slope, Northeast Interior and Southeast Interior — ranked wettest on record for the winter season, contributing to a record-wet winter for the state of Alaska, eclipsing the previous record set in 1928-29. Nome experienced its wettest winter since 1943-44 and King Salmon had its wettest winter on record.
Extremes
The U.S. Climate Extremes Index (USCEI) for the winter season was 26 percent above average and ranked in the middle third of the 113-year period of record. Extremes in warm maximum temperatures, dry PDSI values and extremes in 1-day precipitation each contributed to this elevated CEI value for this season. The USCEI is an index that tracks extremes (falling in the upper or lower 10 percent of the record) in temperature, precipitation and drought across the contiguous United States.
On the regional scale, the Northwest and Southeast regions had CEI composite values that were above average for the winter season. Across the Northwest, extremes in dry PDSI across the eastern portion of the region were juxtaposed with elevated extremes in 1-day precipitation along the Pacific Coast. In the Southeast, extremes in warm maximum temperature as well as extremes in 1-day precipitation were elevated.
The main boat ramp at Wahweap Marina at Lake Powell was unusable in December 2021 due to low water. Lake Powell is set to dip below the target elevation of 3,525 feet between March 11 and 15. CREDIT: HEATHER SACKETT/ASPEN JOURNALISM
Despite emergency releases from three upper basin reservoirs last summer and fall aimed at propping up Lake Powell, levels in the reservoir are projected to dip below a critical threshold in the coming days.
The second largest reservoir on the Colorado River is predicted to fall below the target elevation of 3,525 feet between March 11 and 15, according to Becki Bryant, public affairs officer with the U.S. Bureau of Reclamation. The dip is temporary and levels are expected to rise above the threshold again in May when snowpack runoff gets underway. As of March 10, Lake Powell was at 3,525.66 feet.
The 3,525 feet number is important because that was the elevation set in the 2019 Drought Response Operations Agreement (DROA). That number gives water managers a 35-foot buffer in which to take action before water levels reach the minimum level needed to generate hydropower for millions of people in the southwest: 3,490 feet.
“All of us sort of picked 3,525 as a cushion to give us some maneuvering room in case the negotiations took time or the forecasts were off,” said Eric Kuhn, author and former general manager of the Glenwood Springs-based Colorado River Water Conservation District and one of the crafters of the Drought Contingency Plan. “If you’re going to preserve power pool a year from now, you need a number of months to get that job done.”
Last summer and fall the Bureau of Reclamation released 161,000 acre-feet from the upper basin reservoirs to prop up Powell, including 36,000 acre-feet from Blue Mesa Reservoir in Gunnison County, 125,000 acre-feet from Flaming Gorge and 20,000 acre-feet from Navajo Reservoir. The releases were expected to boost Powell by about 3 feet.
Some Colorado water managers criticized the move for what they said was a lack of advanced notice, which cut short the summer recreation season on Blue Mesa. Some also questioned the timing of the releases. Hot, dry weather in late summer and fall means more transit losses because plants and soils will pick up more of the additional water, with fewer acre-feet making it all the way to Lake Powell.
“I think that is a valid criticism,” said Dave Kanzer, an engineer with the River District. “We have concerns about the timing of the release.”
According to Bryant, without the releases — plus a second DROA action of holding back 350,000 acre-feet in Powell to be released later this spring — Powell levels would be 8.5 to 9 feet lower than they are now.
“Those two actions combined have prevented the drop in elevation from being deeper and longer in duration,” she said.
But the releases came at the cost of depleting Blue Mesa, which on March 9 sat at 29% full, down from 48.5% on March 9, 2021. As this angered some in Colorado, and the amount of water is proving to be the proverbial drop in the bucket, questions of the impact of the releases and were they worth it generate debate.
“That’s a difficult question,” said Rebecca Mitchell, director of the Colorado Water Conservation Board. “You have to look at the past few years and what the future will hold for us. So that’s going to be a difficult question.”
Director of the Upper Colorado River Commission Chuck Cullom said criticism of the reservoir releases is fair, but that in the end, they did what they were intended to do: Prop up Powell to give water managers time to hammer out an annual operating plan.
“I think the data supports that the 2021 actions, although imperfect, were beneficial to prop Lake Powell up,” he said.
New framework coming for emergency releases
Representatives from the upper basin states — Colorado, Utah, Wyoming and New Mexico — along with Bureau of Reclamation officials are working on an annual framework for sending water to Powell that would avoid a repeat of 2021’s emergency releases.
“As early as May we will have completed the DROA plan for May through April of 2023 releases with the same intent: to keep Lake Powell above 3,525 if we can, but certainly to keep it above power pool of 3,490,” Cullom said.
Mitchell said water managers coming together to figure out a path forward with annual drought operations, which came about as a result of the federal government stepping in with last year’s emergency releases, is valuable.
“That includes a full analysis of potential options and implications of the various options, so we have an opportunity now to fully consider timing impacts and any other matters,” Mitchell said. “I think that’s going to be helpful.”
Glen Canyon Dam in Page, Ariz., forms Lake Powell. Water levels in Powell are declining and projected to hit a critical threshold in the coming days, just 35 feet above the elevation needed to maintain hydropower production. CREDIT: HEATHER SACKETT/ASPEN JOURNALISM
DROA public comments
Glen Canyon Dam is what’s known as a “cash register” dam. The power it produces is used to repay the cost of building the project and provide power to millions of people in the southwest, including Colorado. Lake Powell is also a strategic bucket for the states of the upper basin — Colorado, New Mexico, Utah and Wyoming — which allows them to meet their water delivery obligations to the lower basin under the Colorado River Compact. Water managers have many good reasons for wanting to preserve this system.
But during the public comment period for the DROA plan framework, which closed on Feb. 17, some questioned the wisdom of trying to preserve Powell at all, especially in the face of the worsening impacts of climate change. William Lipscomb, a climate scientist with the National Center for Atmospheric Research in Boulder, said the DROA draft does not adequately address the long-term challenges posed by climate change. As hotter temperatures and drought continue to rob the river of flows, lakes Powell and Mead are at less than one-third full, their lowest levels since filling.
“Given that Lake Powell is approaching dead pool, I hope you will consider the eventual phasing out of Lake Powell as a reservoir,” he wrote in a comment letter. “Storage could be consolidated in Lake Mead, opening more of Glen Canyon for restoration.”
Sixty-one comments, 55 of them form letters, shared this sentiment, urging federal officials to consolidate storage in Lake Mead or remove Lake Powell.
But the vast majority of comments — 698 — came from people asking Reclamation officials to fill Lake Powell. Nearly all of these were form letters and said the target elevation of 3,525 is too low for recreation. Some recounted fond family boating experiences on the human-made lake. The low water levels have led to the closure of marinas and boat ramps in recent months.
“While maintaining Lake Powell at higher elevation levels will require tradeoffs elsewhere in the Colorado Basin, Lake Powell should be given preferential treatment,” read one form letter from Hannah Cook. “It is a national treasure for outdoor recreation, vitally important for local economies, the reservoir and dam provide clean energy and water certainty for downstream users.”
A single comment from a southern Utah resident and boatman on the Green and Colorado rivers named Phoebe Brown argued that decision makers should value the long-term ecological implications over economic needs or power generation.
“Thinking about my life and my future, the only hope I see in the West is maintaining the ecological integrity of river corridors, and I want to see Lake Powell managed for sedimentation and making sure there is healthy water and a livable future for young Westerners like myself,” she wrote.
Aspen Journalism covers water and rivers in collaboration with The Aspen Times.
Click the link to read the article on the Out There Colorado website (Spencer McKee). Here’s an excerpt:
[Snowpack] is now at about 97 percent of the to-date median statewide following this week’s round of precipitation. The median peak snowpack is still 28 days away, so the next few weeks could be very telling as to where Colorado’s snowpack will end up this winter. If Colorado were to get no more snow for the rest of the year, it would be at 79 percent of the median peak snowpack…
Colorado Drought Monitor map March 8, 2022.
In terms of how this winter’s snowfall has impacted Colorado’s persistent drought issue, it’s still bad, but it’s not as bad as last year. According to data valid as of March 8 and released on March 10, about 92 percent of the state is under some level of drought. Obviously, that’s a lot, but three months ago, that number was 99.87 percent and last year, it was 98.57. Really, where the good news lies is in the level of more severe drought found around the state. One a four-level system, just six percent of Colorado falls under the two most severe stages of drought. This compares to 19 percent three months ago and 57 percent a year ago. There has been a very slight uptick in the most severe level of drought over the past week, but this is limited to 0.13 percent of the state, specifically in a slim portion of the southeast corner.
Photo shows Tennessee Creek near the confluence of the East Fork Arkansas River in winter with snow on the Continental Divide of the Americas. The report evaluates current and emerging snow measurement technologies for the Western United States. Photo: Reclamation
Click the link to read the release on the Reclamation website (Peter Soeth):
The Bureau of Reclamation released The Emerging Technologies in Snow Monitoring report as part of Reclamation’s new Snow Water Supply Forecasting Program. The program aims to improve accuracy of water supply forecasts and the report evaluates current and emerging snow measurement technologies for the Western United States.
“Snow provides important water storage for the west by slowly releasing water through the late spring and summer,” said Chief Engineer David Raff. “A changing climate and an increasing population are stressing water supplies and making it more important to know how much water the snowpack contains.”
Findings
The report identified several under-utilized emerging technologies in snow measurement. These emerging technologies have the potential to enhance water supply forecasts in the near term.
Additional findings include:
Existing snow measurement stations and tools remain invaluable in monitoring how much water is in snow and in verifying new technologies.
No single snow monitoring technology currently provides complete snow condition information throughout the west.
Improvements in weather forecasting for temperature and precipitation complement enhanced snow monitoring to provide a more complete picture of future water supplies.
Several snow monitoring technologies are in the research and development phase and showing promise for substantial future benefits.
A commitment from federal, state and local agencies is needed to allow emerging technologies to be incorporated into common use for snow monitoring and water supply forecasting.
About the Report
The report was authorized in the Snow Water Supply Forecasting Program Authorization Act of 2020 (P.L. 260-116, Sec.1111). The act placed the program responsibility within the U.S. Department of the Interior. Reclamation is implementing the program on behalf of the Secretary of the Interior.
SOUND UP for today's moment of Zen. Hear the trumpet of Sandhill cranes arriving by the 1000s for stopover @COParksWildlife's @JohnMartinSP near Lamar. DYK CO gets mostly Greater sandhill cranes EXCEPT on SE plains where subspecies Lesser SCs migrate & breed? 📸= Sami Covlin pic.twitter.com/3YaF5nycHP
Biochar and compost both have the potential to increase crop productivity in the short term and improve resilience by retaining soil moisture and nutrients in the long-term. As an added benefit, biochar also sequesters carbon for long periods of time because biochar is primarily elemental carbon that is not easily converted to CO2 by soil microorganisms.
The first year’s experiment focuses on short term benefits. It took place at two locations, each with four subplots planted with the same vegetables – Ace Bell Peppers, Charger Peppers, Asian Eggplant and Curly-leafed Kale. The four subplots had different soil amendments – compost plus 20% biochar, compost plus 10% biochar, compost-only, and none.
The table below presents summary statistics of the weight of each crop in each subplot and a comparison of the subplots to the control subplot 4. The subplot with the greatest harvest weight relative to subplot 4 is bolded; the amended subplots with values less than subplot 4 are red.
Summary Statistics- Production Quantity by crop and subplot. Notes: Plot 1 is compost + 20% biochar, Plot 2 is compost + 10% biochar, Plot 3 is compost only, Plot 4 is no amendment.
In all cases, the harvest weight from at least one of the amended plots, was greater than from subplot 4 (no amendment – the control). Subplot 2, which contained 10 percent biochar, yielded the largest produce weight for two of the four crops at Lobato Farms but none of the sub plots at the Santa Fe HOA. Subplot 1, which contained 20 percent biochar, yielded the greatest harvest weight for kale at Lobato Farms. The mixture of 20 percent biochar for both chili pepper and kale yielded the highest weight at the Santa Fe HOA.
Using estimates of the market value of the crops, it is possible to assess the relative value of adding the different soil amendments (see table below). For both locations, using the amendments generated higher yields and the potential for more revenue. The sub plots containing biochar (1 and 2) also had higher value of output than the compost-only plot 3 at the Lobato Farm. Plot 3 did slightly better overall at Santa Fe than plot 2. The results for individual crops differ somewhat from the overall results. But only in one case (kale at Lobato’s) did plot 4 (no amendments) do better than an amended plot (plot 3). These results provide some initial confirmation of the value of using compost with biochar added.
Estimated value of production per crop and subplot USD ($). Note: Prices used for value calculation reflect wholesale value in September 2021. Kale, $8 per lb. Other crops, $1 per lb.
On Thursday, CCA issued a final report on its first-year study on the effects of implementing biochar into local agriculture at the Mesa County Public Library. The result: biochar-compost combinations have the potential to increase crop productivity in the short-term with the possibility of improving resilience by retaining soil moisture and nutrients in the long-term. Biochar also sequesters carbon for long periods of time because biochar is not easily biodegraded, reducing the carbon that’s released into the atmosphere. Biochar is a charcoal-like material made by heating plant matter to 600 to 800 degrees in a low-oxygen or oxygen-absent environment…
To the naked eye, biochar is simply shiny, black material, but under a microscopic view, the heating causes pores to develop, exhausting everything except remaining carbon from the material. Those pores can then be used to hold healthier elements for long periods of time. For instance, because those pores can store water, any farm that implements biochar can operate as normal without using as much water. If materials such as field stubble, tree trimmings and yard waste can be turned into biochar in a properly operated kiln, the waste can be used to help reduce smoke pollution in the valley instead of being burned in tall, smoky piles.
The study included growing four plots of bell peppers, chili peppers, eggplants and kale at Lobato Farms. The plots included 20% biochar and compost, 10% biochar and compost, compost only and a plot with no soil amendments. The 10% biochar-compost plot proved to produce the healthiest, most valuable crops, followed by the 20% biochar-compost plot.
How biochar works. Graphic credit: The High Country News
The Metro District Board is set to meet at 5 p.m. Monday, March 14, to vote on a possible extension of the temporary pause on permit sales until April 12. The board initially voted to pause the sales in January and had hoped to resume them this month…
According to a report from Alan Leak at RESPEC Engineering, Pueblo West could support the sale of 14,000 total water taps “without a significant reduction in water stored in Pueblo West’s accounts in Pueblo Reservoir and Twin Lakes over the next 5 years.”
Pueblo West currently has about 33,000 residents, so total growth could be about 47,000 people. The district’s 1972 service plan called for growth to 39,000 residents…The halt on water tap sales came after a standing- room-only crowd of residents urged the board to stop explosive growth at the Nov. 8 meeting, making it clear they don’t want to see skyrocketing water and sewer rates….
Data provided by the district’s consulting groups will be available for residents to review prior to Monday’s meeting at http://pueblowestmetro.com/waterstudy.
Women in Prescribed Fire Training Exchange participants practice different controlled burning ignition patterns. Photo courtesy Lenya Quinn-Davidson, Fire Adapted Communities Learning Network via USDA
Click the link to read the article on the Associated Press website (Brittany Peterson and Matthew Brown). Here’s an excerpt:
[Controlled burn] operations are a central piece of the Biden administration’s $50 billion plan to reduce the density of western forests that have been exploding into firestorms as climate change bakes the region. But the same warming trends that worsen wildfires will also challenge the administration’s attempts to guard against them. Increasingly erratic weather means snow is not always there when needed to safely burn off tall debris piles like those on Colorado’s Pike-San Isabel National Forest. And that seriously complicates the job of exhausted firefighters, now forced into service year-round…Western wildfires have become more volatile as climate change dries forests already thick with vegetation from years of intensive fire suppression. And the window for controlled burns is shrinking.
“It’s been a little bit harder just because of shorter winters,” said David Needham, a U.S. Forest Service ranger who led the Colorado burn operation in late February when the thermometer hovered around zero degrees Fahrenheit (minus 18 Celsius). Surrounding hillsides showed barren scars from past wildfires, including a 2002 blaze that destroyed 133 homes and at the time was the largest in state history.
Aerial view from the south of Hayman Fire June 30, 2002. Road traversing from left to right is U.S. Highway 24. Town of Manitou Springs is in lower part of photo, Colorado Springs to the right. Garden of the Gods park defined by three upright orange rock formations in right center just below smoke line. Creative Commons Attribution-Share Alike 4.0 International license.
Click the link to read the article on TheDenverChannel.com website (Via the Associated press: Grant Schulte). Here’s an excerpt:
State lawmakers gave initial approval to a bill that would allow Nebraska’s Department of Natural Resources to lay the groundwork for the estimated $500 million canal…The measure advanced, 36-3, through the first of three required votes in the Legislature despite skepticism from some lawmakers about whether the canal is necessary.