Click the link to read the article on The Denver Post website (Elise Schmelzer). Here’s an excerpt:
March 3, 2024
For decades, farmers in the Republican River basin have pumped water from the underground Ogallala Aquifer to grow wheat, beans, corn, potatoes, and feed for cattle and hogs. But the water is running out. Flows in the Republican River system are shrinking as the aquifer depletes, making it harder for Colorado to send enough water downstream to the east to fulfill its agreements with Kansas and Nebraska. To meet its obligations, Colorado is legally required to stop irrigating 25,000 acres in the southern part of the basin by the end of 2029 — more than a quarter of all irrigated acreage in that area. If the mandate is not met, state water officials say they will turn off wells for all 540,000 irrigated acres in the broader swath of the state that’s in the river basin, a move that would devastate the region’s economy and way of life…
With wells cut off, farms wouldn’t be able to grow crucial crops that feed Colorado and the wider region. The companies that sell farming supplies, such as seed, tractors and sprinklers, would lose massive amounts of business…Less local income would mean fewer meals at local restaurants in the plains towns and trips to the movie theater or bowling alley. Tax revenue would fall, potentially impacting schools and emergency and social services. Without irrigation, land values would drop — giving farmers less collateral for the loans they depend on to begin each season.
“What’s frightening about it is that it’s really an existential issue for those living in that region,” said Jordan Suter, a Colorado State University professor tasked with examining the economic fallout from that scenario. “With good reason. If irrigated production goes away, the area can’t really support a large population.”
Groundwater from the aquifer makes irrigated farming possible across a large part of Colorado’s Eastern Plains that spans about 7,000 square miles across eight counties — an area the size of New Jersey. In 2022, the counties produced more than $2.6 billion worth of agricultural products, according to the U.S. Department of Agriculture’s farm census. The state has made some progress, but even if it meets the 25,000-acre goal, the aquifer’s water level is still declining.
Kansas Geological Survey at the University of Kansas is embarking on a two-year study of playas that hold water during wet periods in Scott County and elsewhere to better understand their role in recharge of the underground Ogallala aquifer. (Bill Johnson/Kansas Geological Survey)
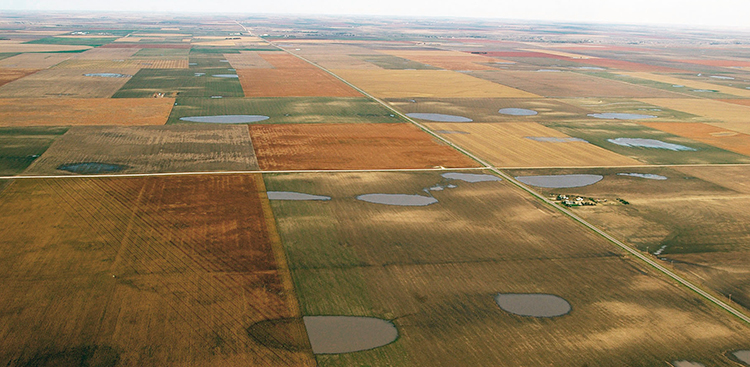
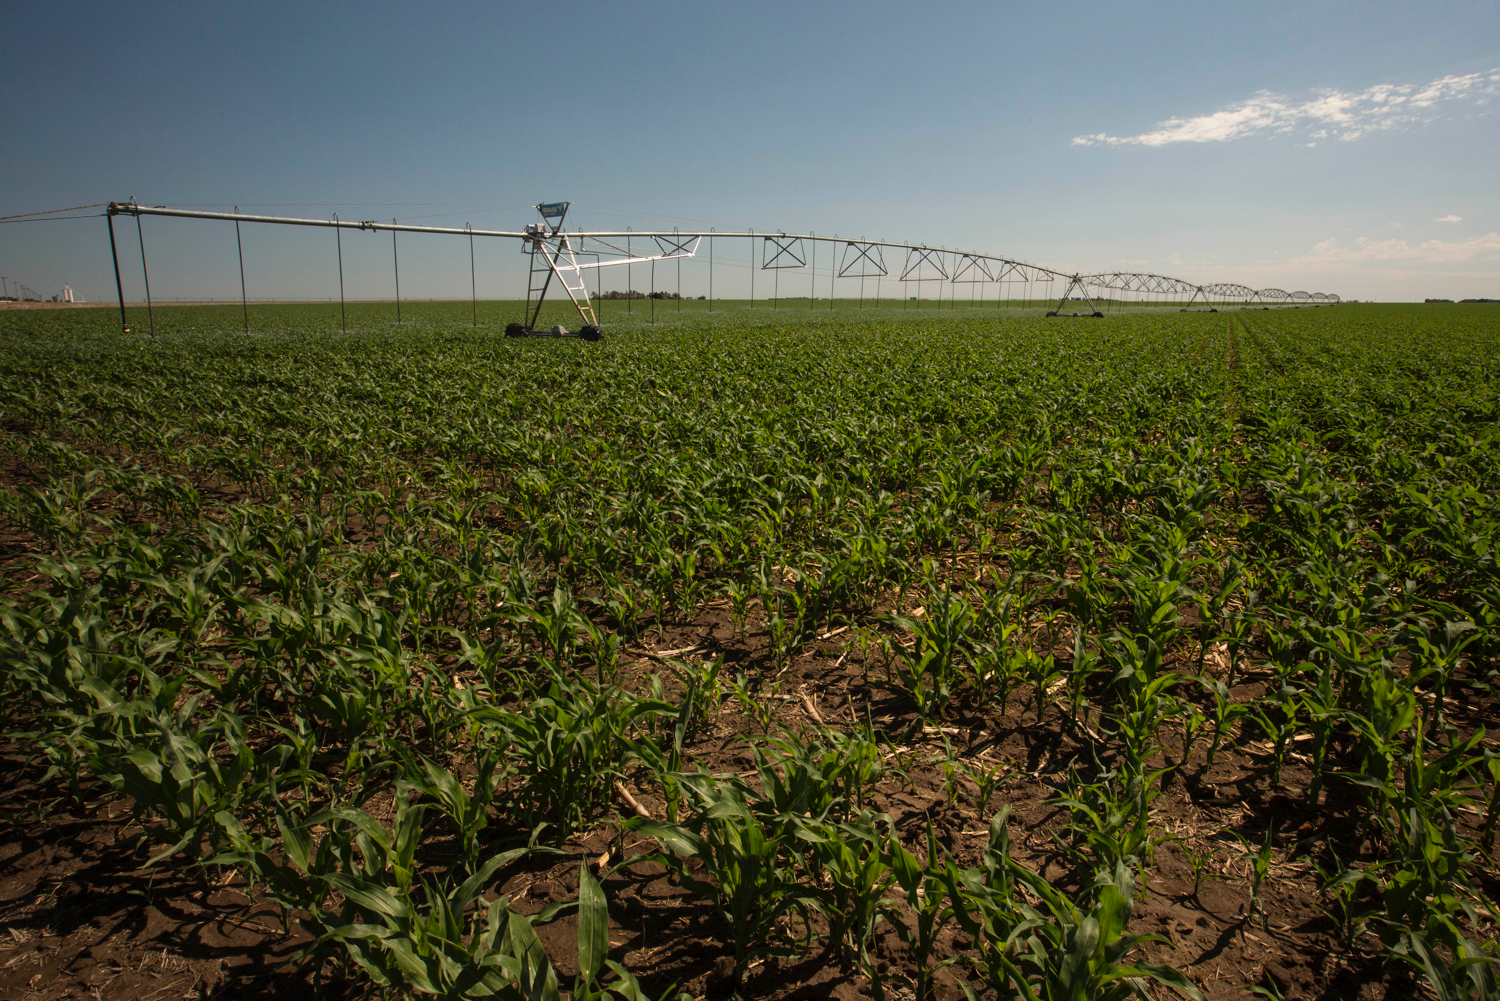
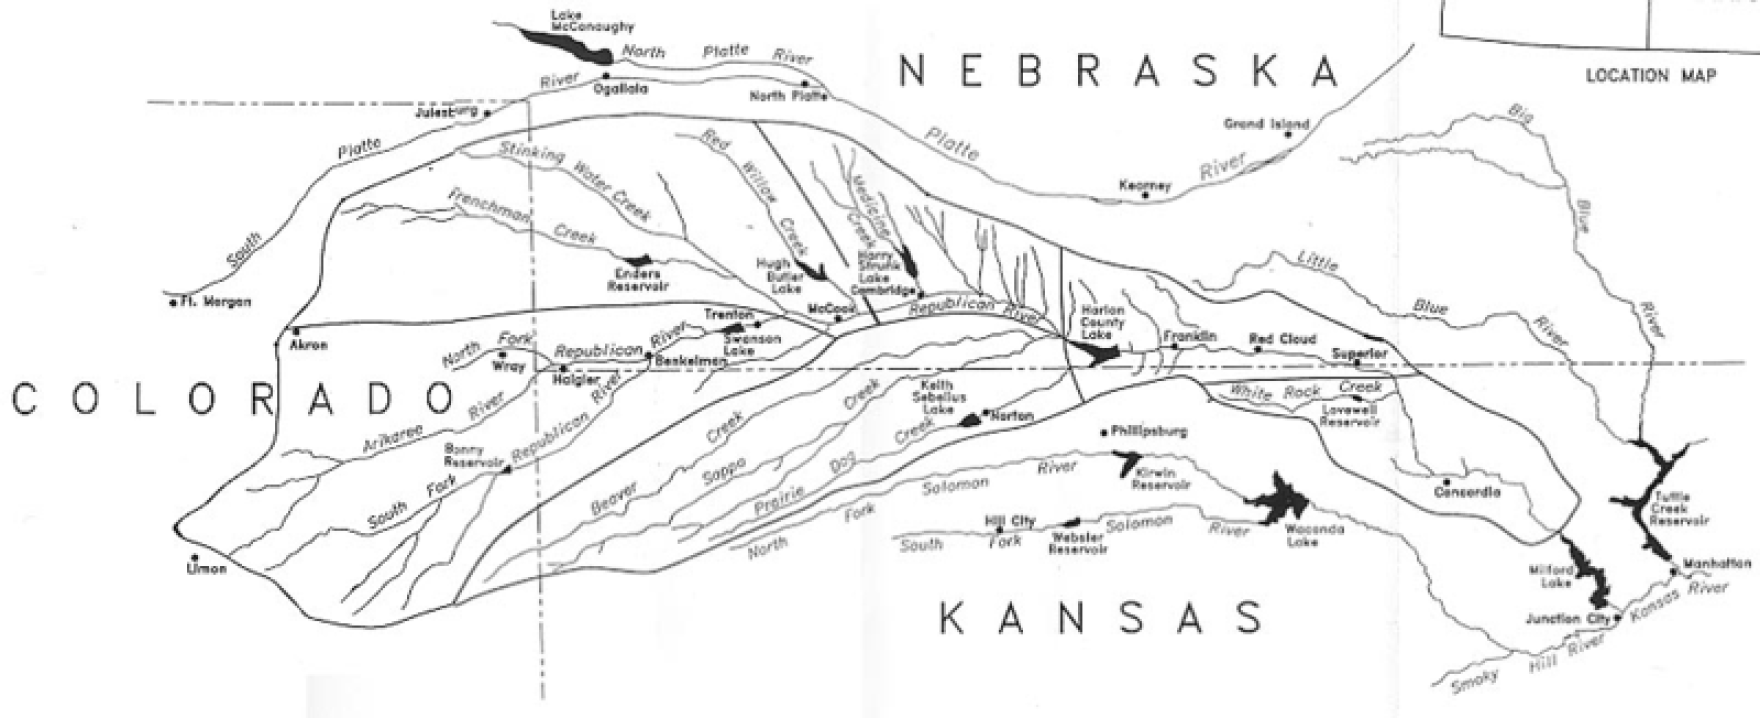
Aerial view of irrigated and non-irrigated fields in eastern Colorado. Photo by Bill Cotton, Colorado State UniversityOgallala Aquifer. Credit: Big PivotsRepublican River Basin overlaying the Ogallala Aquifer. Graphic credit: Deb Daniel/RRWCDThe Ogallala aquifer, also referred to as the High Plains aquifer. Source: National Oceanic and Atmospheric AdminstrationCenter pivot sprinklers in the Arikaree River basin to irrigate corn. Each sprinkler is supplied by deep wells drilled into the High Plains (Ogallala) aquifer.Kansas Aqueduct route via Circle of BluePlots of land in Finney County, Kansas, utilize irrigation water from the High Plains Aquifer. Credit: NASA via the University of KansasHistoric photo of the High Plains in Haskell County, Kansas, showing a treeless semi-arid grassland and a buffalo wallow or circular depression in the level surface. (Photo by W.D. Johnson, 1897) High Plains in eastern Colorado. Photo credit Bob Berwyn.Republican River in Colorado January 2023 near the Nebraska border. Photo credit: Allen Best/Big PivotsThe Republican River basin. The North Fork, South Fork and Arikaree all flow through Yuma County before crossing state lines. Credit: USBR/DOIKansas River Basin including the Republican River watershed. Map credit: By Kmusser – Self-made, based on USGS data., CC BY-SA 3.0, https://commons.wikimedia.org/w/index.php?curid=4390886The Republican River’s South Fork near Hale, Colorado, with the region’s seemingly endless fields. Credit: Wikimedia Commons/Jeffrey BeallSouth Fork of the Republican RiverNorth Fork Republican River via the National Science Foundation.Republican River Basin by District
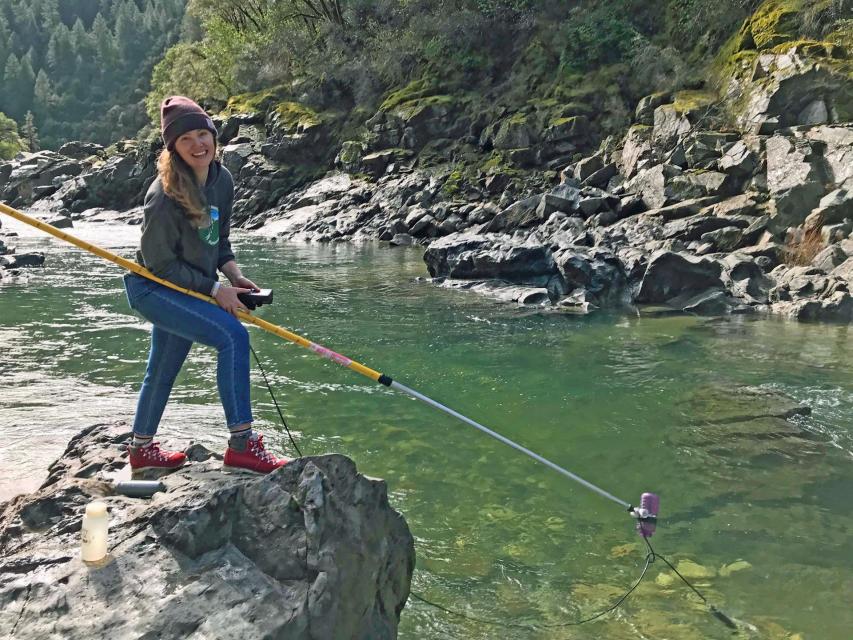
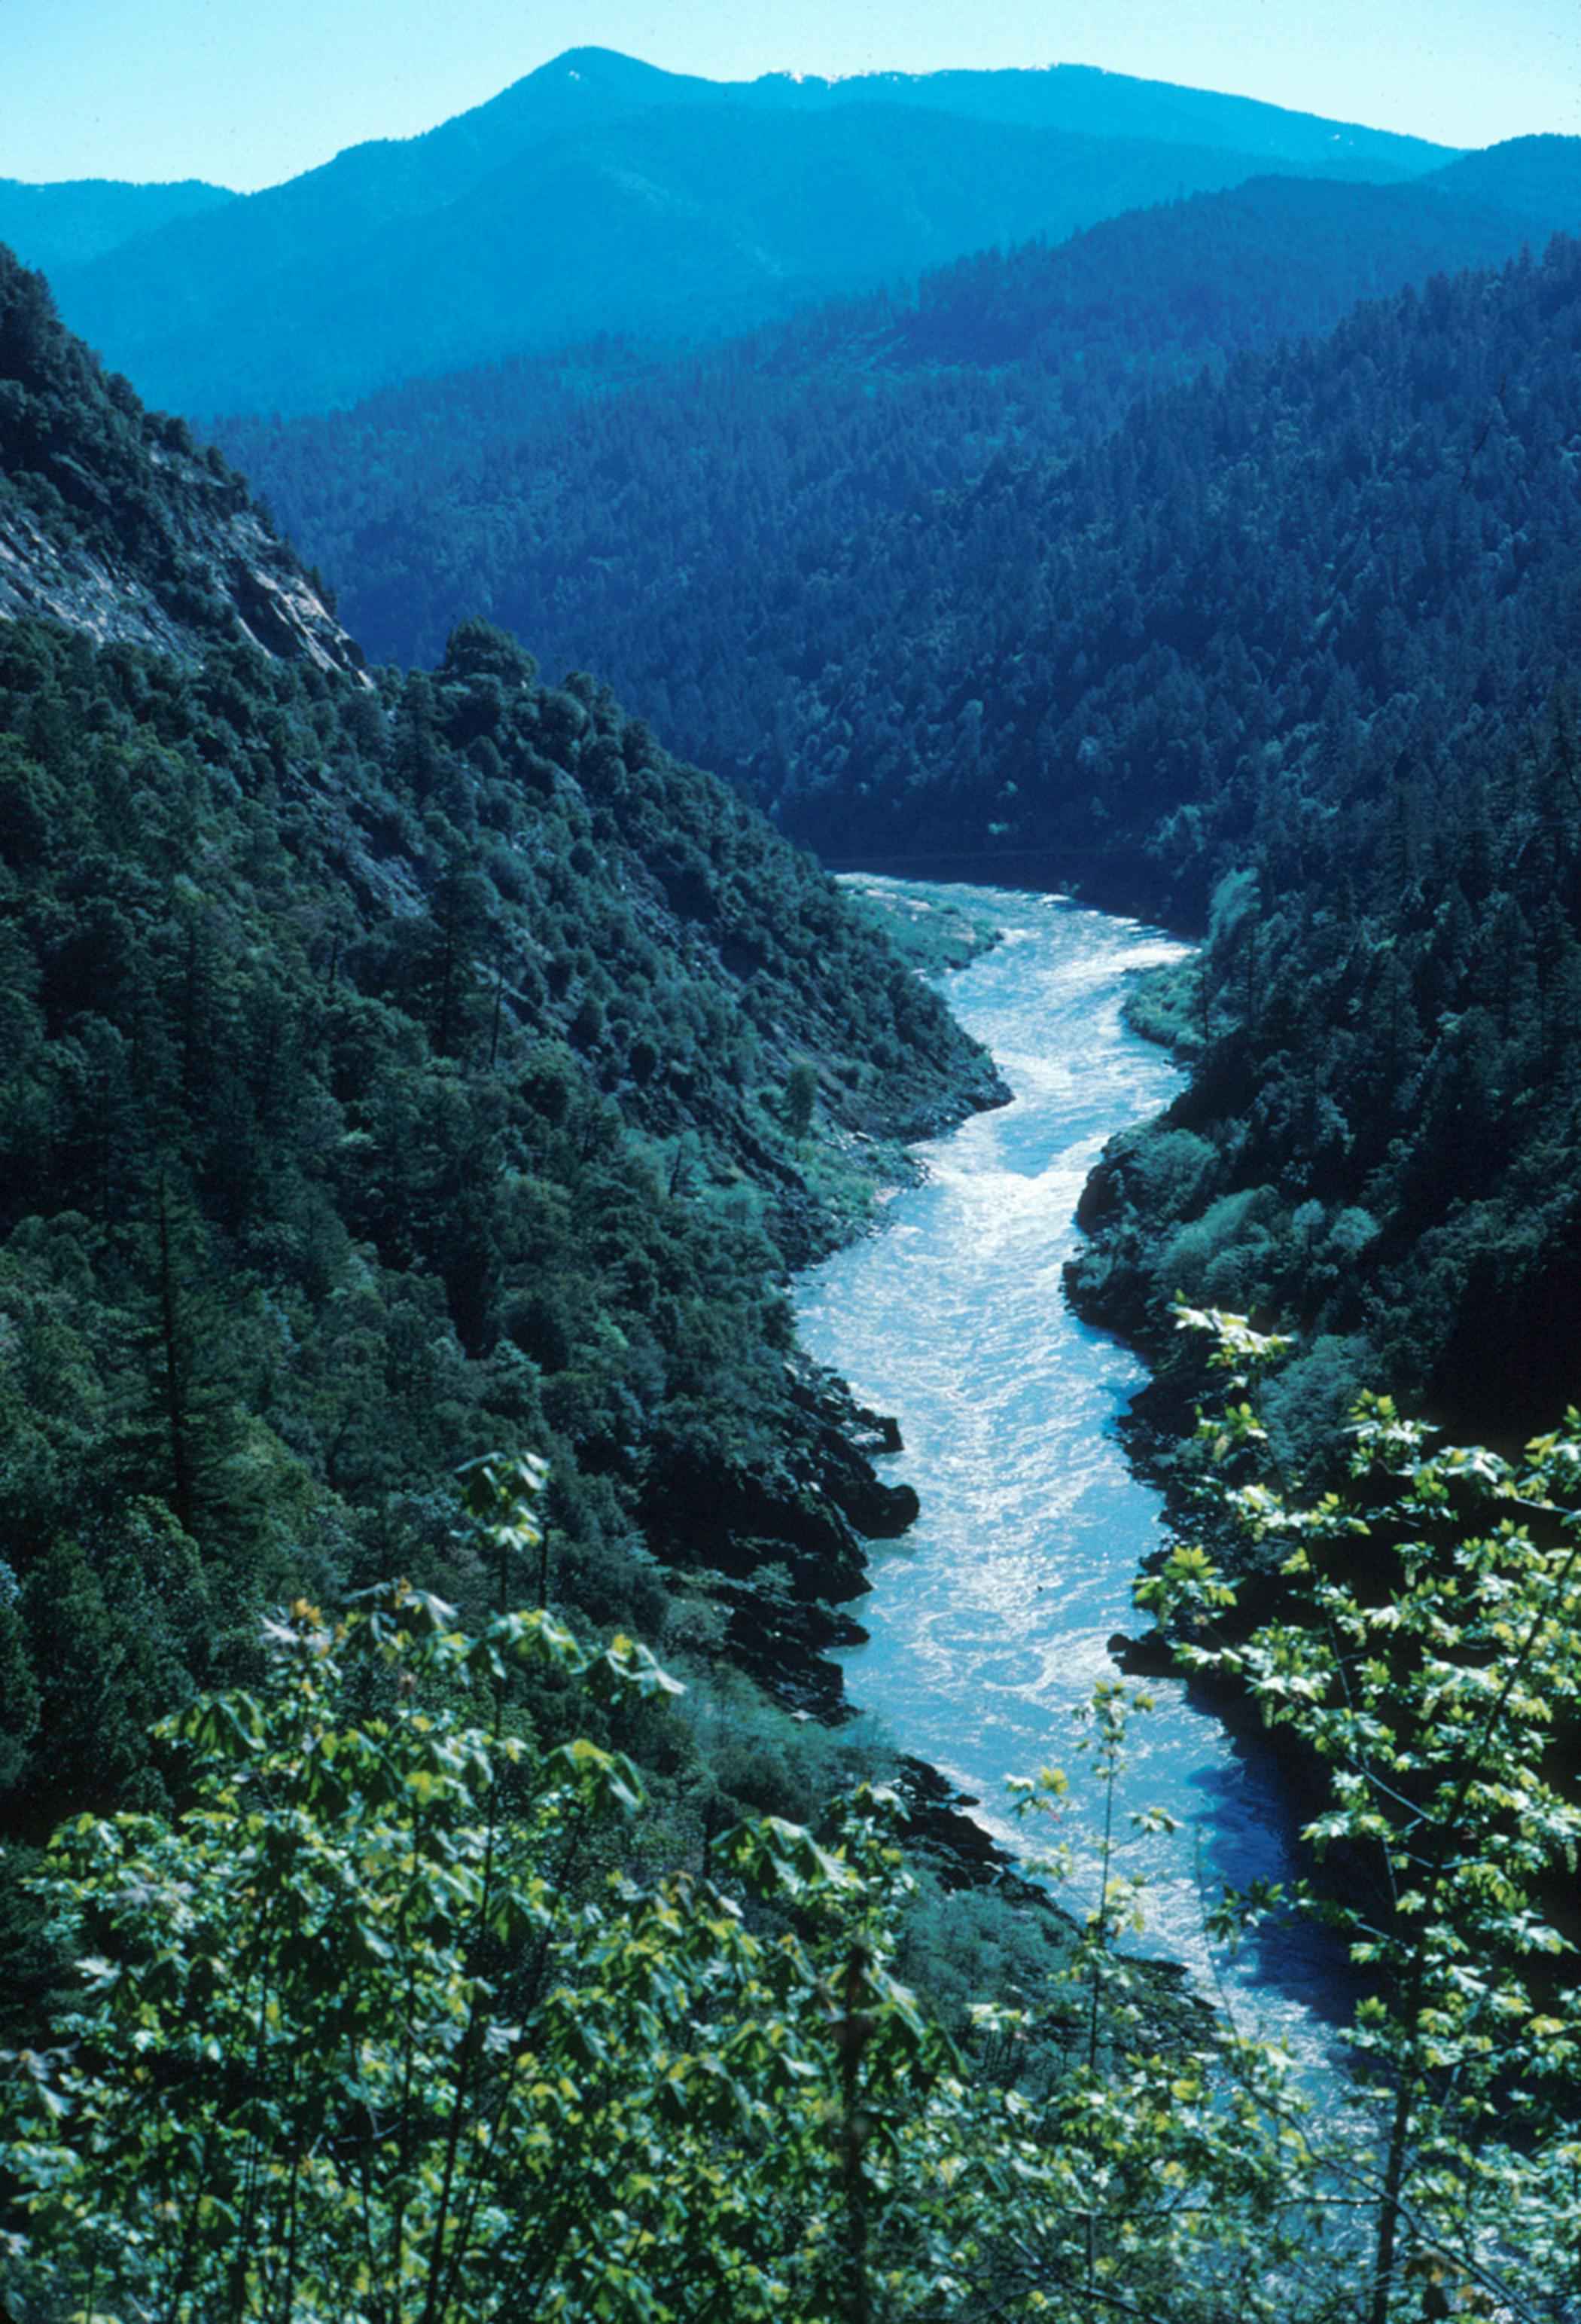
A volunteer with the South Yuba River Citizens League tests the water quality and temperature of the river in the Sierra foothills northeast of Sacramento. Source: South Yuba River Citizens League
When residents of the Yuba River watershed northeast of Sacramento saw a stretch of the emerald-green river suddenly turn an alarming reddish-brown on a recent winter day, they knew immediately who to call.
Though water quality concerns are the purview of federal, state and county environmental agencies, they alerted the local South Yuba River Citizens League, confident its volunteers could get to the scene quicker and investigate the discoloration faster than any regulator.
Sure enough, the group found the likely culprit within hours. One of its trained river monitors took samples at the site near the Gold Rush-era town of Nevada City, ran a series of tests, then compared the results with those from samples volunteers had routinely collected for more than 20 years – from the same section of river and the same time of year.
“Our baseline data allows us to look back on how the river has behaved at certain points in time, and lets us quickly identify anomalies,” said Aaron Zettler-Mann, the league’s executive director, who develops stream-sampling tools for volunteers as part of his post-doctorate research in geography. “We worked backward and determined it was probably just a small landslide.”
The league is among dozens of volunteer organizations that monitor the health of their local waterways and native fish populations across California and the West.
As new threats emerge, the community stream stewards bring their data and observations to the attention of environmental enforcement agencies. Colorado takes the relationship a step further by formally partnering with streamkeepers and using their data to inform decision-making.
Often referred to as “streamkeepers,” the grassroots groups are meticulous chroniclers of river conditions – the Yuba league alone records water temperature, pH, dissolved oxygen and turbidity at 37 sites across 40 river miles – and are often the first to detect problematic trends.
Information from streamkeeper groups has influenced California policymakers in setting minimum stream flow requirements for native fish, establishing water quality standards for treated wastewater disposed in streams and designating stretches of rivers “wild and scenic” to keep them free of dams and diversions.
“These groups get the data from the ground level and make it real,” said Felicia Marcus, former chair of California’s State Water Resources Control Board, which polices water quality. “Their stories can be really important and powerful in the public policy arena.”
Versatile Volunteers
Andrew Rypel
Some larger groups like Los Angeles Waterkeeper have fundraising and public relations staff and are linked to larger networks while many of the smaller, more grassroots organizations like the Friends of the Shasta River monitor waterways in more remote areas.
Native American tribes are no less active in protecting their watersheds. Several tribes are the driving force behind the ongoing removal of four hydroelectric dams on the Klamath River. At Clear Lake, just north of Napa Valley’s wineries, the Big Valley Band of Pomo Indians and the Elem Indian Colony are taking the lead on spotting toxic algal blooms that harm fish and taint water supplies.
Streamkeeper groups share similar core goals: reduce pollution, monitor stream conditions and gather data that can help officials make informed water policy decisions.
Mostly comprised of trained volunteers, the groups lead river clean-ups, survey locations for habitat restoration, conduct routine water quality testing and educate the public on the importance of healthy watersheds. Retired biologists, ecologists, conservationists and former employees of natural resource agencies are common in the ranks of volunteers as are riverside property owners.
Andrew Rypel, director of the Center for Watershed Sciences at the University of California, Davis and former member of a streamkeeper group in Alabama, cast these volunteers as the “ultimate transdisciplinary water professional.”
“They tend to know something about science, ecology, agriculture, the people who live along the waterbody and the economics of the situation,” he said. “They’re in the middle of everything.”
Punching Above Their Weight
Some California streamkeepers wield their local knowledge to spur regulatory changes.
One of the preeminent streamkeeper success stories comes from Putah Creek, an 85-mile-long stream that winds through parts of Northern California’s wine country before draining into the Sacramento River.
Having a permanent, paid stream keeper has aided the ecological recovery of Utah Creek below Monticello Dam in Northern California’s wine county. Eight miles down a smaller dam divers much of the water south to Solano County cities, farms and industry. Source: UC Davis
In 1990, the volunteer-led Putah Creek Council sued the Solano Irrigation District and Solano County Water Agency to release more water from a dam to sustain chinook salmon and other native fish species downstream. The city of Davis and UC Davis later joined the council as plaintiffs.
After a protracted legal fight, a state judge ordered a new flow schedule for the creek that requires the water agency to provide more water when certain species are spawning or migrating out to the ocean. As part of a settlement over the lawsuit, the water agency agreed to create a permanent streamkeeper position on staff.
Having a dedicated, long-term funding source for the streamkeeper position has been key to the creek’s recovery, said Max Stevenson, who assumed the full-time job in December 2021. He added that some of his most important work is done off-stream, engaging with interest groups.
“Long-term relationship building is the key,” Stevenson said. “All the users – landowners, regulatory agencies, the public and cities – they have to get along.”
The lower Putah Creek, which commonly ran dry during drought and was a haven for illegal dumping, has seen a resurgence in its salmon and steelhead trout populations thanks to consistent flows and habitat restoration, according to UC Davis researchers.
A similar effort is underway in the San Joaquin Valley, where local streamkeeper groups are among those pressing the city of Bakersfield to keep more water in the lower Kern River for fish. A state judge has ordered the parties to come up with a plan that ensures “public trust flows” to benefit fish while the case is pending.
Los Angeles Waterkeeper has routinely filed lawsuits over the past 30 years, forcing the state and local governments to curb sewage spills and reduce the flow of toxic urban runoff into streams and along the Pacific coast.
“While no one likes to go to court, a lawsuit is often the only way to get polluters and regulators to do the right thing,” said Kelly Shannon McNeill, the Los Angeles group’s associate director.
Streamkeepers are also known for rallying against new dams.
The Yuba league was hatched in the 1980s primarily to fight proposals for more dams on the river. It swayed local politicians to fight against the projects and — after nearly 20 years of lobbying — state lawmakers gave the Yuba wild and scenic status, permanently banning new dams and diversions on nearly 40 river miles. The group now has about 3,500 members.
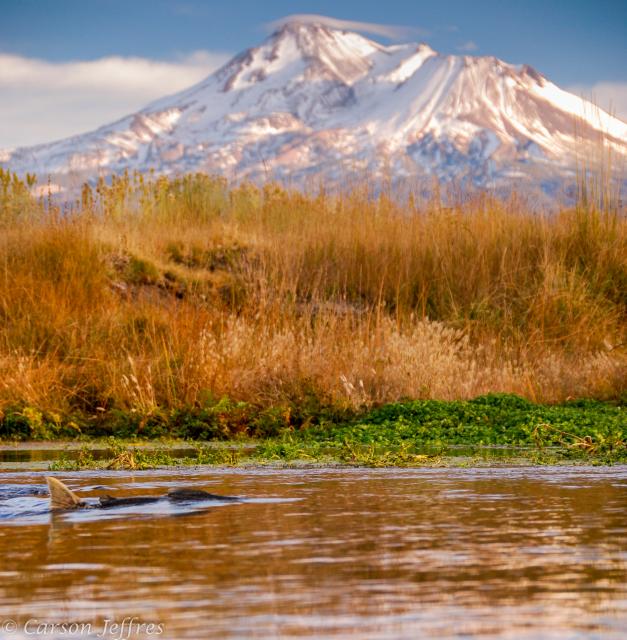
A chinook salmon prepares to spawn in the Shasta River below Mount Shasta. Petitions files by Friends of the Shasta River and other groups prompted state water officials to temporarily limit diversion ton the stream. Photo courtesy of Carson Jeffres.
Since then, stretches of several other rivers have been added to the state’s wild and scenic list, most recently a portion of the Mokelumne River in 2018.
Near the California-Oregon border, Friends of the Shasta River has had recent success in protecting salmon and other native species on a key Klamath River tributary.
The group formed in 2019 out of frustration over the lack of streamflow protections for a river that historically produced about 50 percent of the chinook salmon in the Klamath River basin. The group, comprised of local scientists, retired natural resource professionals and riverside property owners, documents water conditions and promotes the river’s values in rural Siskiyou County.
“The Shasta River is tiny, more of a creek running through a desert, but arguably for its size it was probably the most productive salmon-bearing stream on the face of the earth,” said David Webb, a Friends of the Shasta River board member.
The Shasta streamkeepers, the Karuk Tribe and other salmon activists filed petitions that prompted the state water board to temporarily limit water diversions during the last three years on the Shasta and nearby Scott River. Regulators are currently gathering scientific data and considering whether to adopt permanent minimum flow requirements to ensure the rivers don’t run dry during critical periods for native fish.
“We’ve waited long enough; we need permanent instream flows so that public trust resources are protected,” Webb said.
A River Turns Orange
For more than three decades, Colorado has relied on a virtual army of volunteers to track the health of the state’s more than 150 rivers.
Before 1989, conditions on most of the state’s 770,000 miles of river weren’t monitored. Important water decisions were made without reliable data. To better inform decision-makers, the state created a program that enlists streamkeepers, teachers and students to gather water quality data.
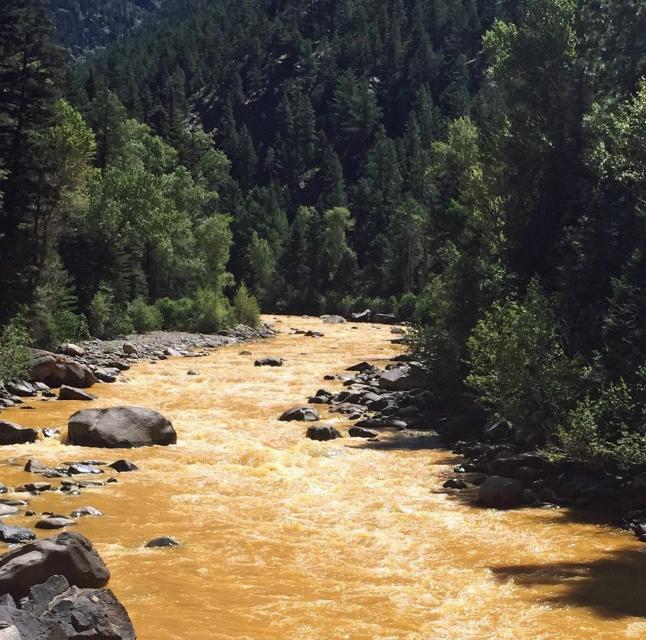
A reach of the Animas River in Southwestern Colorado turns orange following a wastewater spill from Gold King Mine in 2015. State officials used volunteers’ baseline data to track progress on the river cleanup. Source: Wikimedia Commons
Today, the River Watch program managed by Colorado Parks and Wildlife and the nonprofit River Science has about 100 volunteer groups that monitor hundreds of streams. Revenue from the state lottery helps pay for the program.
Megan McConville, who manages the program for the state, says the thousands of volunteers serve as eyes and ears for Colorado’s streams, spotting trends unseen by environmental regulators.
“These students, these volunteers, they know their rivers better than I ever will,” McConville said. “What I love about this program is that I can call a volunteer and ask them ‘Hey, could you expand your monitoring to include two more locations? We want to figure out whether a culvert is introducing zinc into a waterway.’”
Streamkeepers came in particularly handy in 2015 when 3 million gallons of orange sludge spilled from an abandoned mine and tainted the Animas River, a Colorado River tributary. The state used the volunteers’ baseline data to track its progress on the river cleanup.
‘They Can Have Your Flank’
While streamkeepers have had legal fights with water suppliers and regulators, partnerships between them are becoming more common in California.
Both the South Yuba River Citizens League and the Yuba Water Agency are working with a broader coalition to restore 275,000 acres of forest in the river’s upper Sierra watershed. They are also cooperating on habitat restoration projects and a proposal to create a channel that will allow threatened green sturgeon to get around a dam on the Yuba.
Willie Whittlesey, Yuba Water Agency general manager, credited the 2008 Yuba Accord for fostering ongoing partnerships on the Yuba.
“This is a new way of doing things,” Whittlesey said of the series of agreements among the agency, environmental groups, farmers and hydroelectric producers.
Meanwhile, in California’s capital city, streamkeepers are becoming effective advocates. Marcus, the former head of the state water board, said grassroots groups have figured out creative ways to draw attention to problems in ways that regulators can’t.
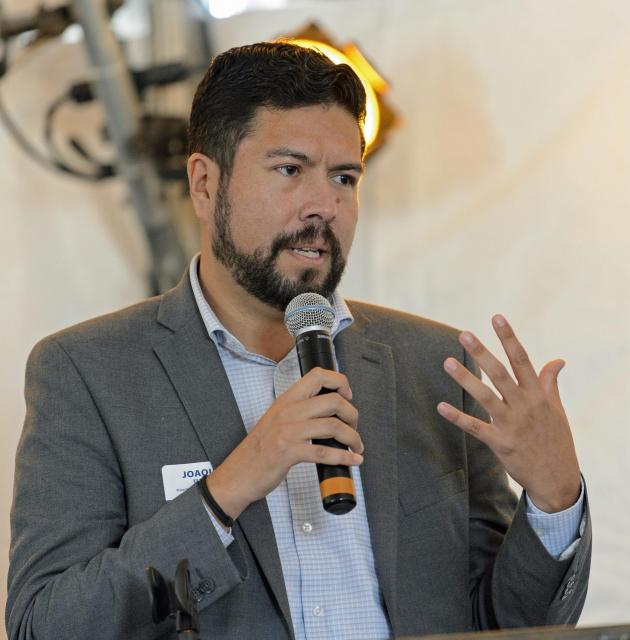
Joaquin Esquivel
She credited groups, such as those that brought jars of tainted drinking water to public hearings and press conferences, for winning legislative support for more water board staff and resources to regulate rural drinking water systems.
“They can have your flank,” said Marcus, who in 1985 co-founded the grassroots Heal the Bay group to fight pollution in Santa Monica Bay and elsewhere along Southern California’s coast. “Sometimes they highlight a problem and then the agency can get the resources needed to address it.”
Streamkeepers can also aid regulators by carefully reviewing pending orders and rules. During her stint as state water board chair, Marcus said the California Coastkeeper Alliance was particularly adept at articulating the pros and cons of draft documents and then working with the regulator on useful changes. “It makes it easier for you as a regulator,” she said.
Joaquin Esquivel, the current board chair, said volunteer groups have been submitting critical water quality data to the board’s citizen monitoring program for years. The program helps streamkeepers choose monitoring techniques, perform quality control and find funding sources.
“Their concern is genuine,” Esquivel said. “Collecting and bringing in data helps us see that a watershed or stream is impaired.”
Back on the south Yuba, Zettler-Mann and his group have started monitoring the watershed for signs of emerging threats, including long-lived synthetic compounds known as PFAS and a rubber preservative in tires that federal regulators are examining for potential harm to salmon.
UC Davis’ Rypel, a professor of coldwater fish ecology who advocates “a streamkeeper for every stream,” said having passionate volunteers filling data gaps and looking out for emerging threats to streams like the Yuba and Putah can inspire neighboring watersheds to do the same.
“Of all the different management things I’ve seen tried,” he said, ”the streamkeeper thing might be the one that’s worked best.”
Know someone who wants to stay connected to water in the West? Encourage them to sign up for Western Water and follow us on Twitter, LinkedIn, Facebook and Instagram.
Hello, and welcome to meteorological spring (March-May). The month of February just ended, and frankly, this winter felt different. The northern Front Range of Colorado has just been through a bizarre meteorological winter. For Fort Collins, this was the second warmest and second least snowy meteorological winter since the beginning of the 21st century, and certainly warmer and less snowy than the historical past. At the same time, precipitation (the combined accumulation of rain and melted liquid from snow/ice) has been well above average this winter. The official Fort Collins Weather Station winter precipitation total of 2.42” is the 8th wettest winter on record, and ranks only behind 2007 and 2016 in the last 30 years. Boulder also recorded its 8th wettest winter in over 100 years while remaining only 0.6” above the 1991-2020 average snowfall mark. Our neighbors at the University of Northern Colorado in Greeley recorded their 3rd warmest winter, but with 151% of normal precipitation. On top of this, winter 2024 has also been speckled with rain only events, freezing drizzle, and a very heavy, spring-like rain snow mix. Is this a sign of things to come? Will rainy, drizzly, sloppy winters replace the fine, snowy powder of our past? Let’s dig into the numbers and the literature to find out.
Winter Rain Only Events
Rainfall events during the winter months on the northern Front Range of Colorado are perhaps more common than some realize. Since 1951 there have been 80 rainfall events with no measurable snow for Fort Collins, and 95 for Boulder. That is an average of 1.0-1.5 rain only events/meteorological winter. Fort Collins and Greeley had three such events this year (Boulder only one). There is no statistically significant trend in winter rain events over this time. If somebody says “it never rains in northern Colorado during winter” be skeptical.
One reason we may be inclined to believe winter rain is rare in Colorado is these events generally aren’t memorable. Precipitation accumulations are almost always small. 80-90% of rain-only winter events tally less than one tenth of an inch of precipitation. Fort Collins, Greeley, and Boulder have never seen a rain event greater than half an inch during winter. The largest rain only value occurred in Boulder on January 18th, 1974 (0.43”).
Freezing Rain/Drizzle
We also experienced a freezing drizzle event this winter on February 16th, 2024. This is not the only winter freezing drizzle events in recent years: Northern Colorado also saw freezing drizzle on January 24th, 2017, January 19th, 2022, and March 7th, 2014 (though this last date falls just outside the scope of “meteorological winter”). Anecdotally, it feels as though these events are becoming more frequent. A couple notes on freezing rain and freezing drizzle: 1. While freezing drizzle is obviously possible for northern Colorado, true freezing rain is nearly impossible. 2. Freezing drizzle is not well archived historically. One possible source of freezing drizzle records is the Automated Surface Observing System (ASOS), a network of weather stations designed to aid aviation endeavors. Some ASOS stations do mark the occurrence of freezing drizzle, but not all, and existing records are spotty. All this to say, it is unclear whether or not freezing drizzle is becoming more likely for northern Colorado.
February 3rd, 2024 (A Spring Storm in the Middle of Winter)
February 3rd was a special day on the northern Front Range of Colorado. The official Fort Collins weather station received 1.66” of precipitation between 7:00 PM on the 2nd, and 7:00 PM on the 3rd (7:00 is the official weather station daily observation time). Boulder and Greeley received 1.74” and 0.74” of precipitation respectively. This was a top ten wettest storm for Greeley and a record setter for Boulder. In Fort Collins, 1.66” of precipitation is not only a record amount of moisture for any day in February (135 years of record), it single-handedly made February 2024 the wettest February Fort Collins has ever experienced. Furthermore, Greeley’s all-time wettest February storm also occurred in 2024 just one week later, but as heavy snowfall.
Northern Colorado locals have seen these types of rain/snow events before, but they are more of a calling card of spring. Typically, in February, the air is too cold and dry to support such accumulations. The weather pattern on this day was unique in a couple key ways allowing this event to happen. For one, the storm tapped into a corridor of tropical moisture extending all the way from the central tropical Pacific Ocean to the western United States, greatly increasing the potential for high moisture totals. These events are often called “atmospheric river events,” and are more common in coastal settings like California, Oregon, and Washington. Secondly, we experienced a split polar jet stream pattern with Colorado lying in the middle of the two currents. The southern flank of the split polar jet brought the atmospheric river to our doorstep while a high pressure airmass in the middle of the two flanks deflected the moist air back against the eastern side of the Rocky Mountains, and blocked cold arctic air from sweeping this storm out over the plains (figure 1). Both factors were important for producing such spring-like storm conditions.
Figure 1: Upper air map of Contiguous United States from the morning of February 3rd, 2024 (250 hectopascal pressure level). Wind speeds measured in knots (kts) from National Weather Service Soundings. Wind speeds contoured in 25kt intervals. 1 flag = 50 kts. Long bars = 10 kts. Short bars = 5kts. Green arrow shows position of jet stream. The “H” and “L” mark locations of high and low pressure.
Winter Precipitation and Climate Change
Our office teamed up with Jeff Lukas of Lukas Consulting to synthesize what the academic literature says about how Colorado’s climate may change over the remainder of the 21st century. This resource can be accessed here. If you have not had a chance to scan this document, I highly recommend it. We can use this document to get a glimpse into the future of winter precipitation, snowfall, and winter storms for Colorado.
Colorado has warmed, and continues to warm, significantly in all seasons due to increasing greenhouse gas concentrations in the atmosphere. Atmospheric physics tell us that warmer air can hold more water vapor, meaning there is potential for higher precipitation measurements from each individual storm under a warmer climate. We do see evidence that meteorological winters are getting wetter. Since 1950 we have seen a 3% increase in statewide wintertime precipitation. This trend is actually higher for the northern Front Range +14%, but somewhat offset by marginal decreases in western Colorado. Most climate models do suggest further increases in wintertime precipitation are likely. One experiment from our report shows an average of 6% more winter precipitation across Colorado by mid-Century with nearly 90% of the 36 global climate models used agreeing on the sign of the trend. Further increases are possible by the end of this century, and under high carbon emissions scenarios.
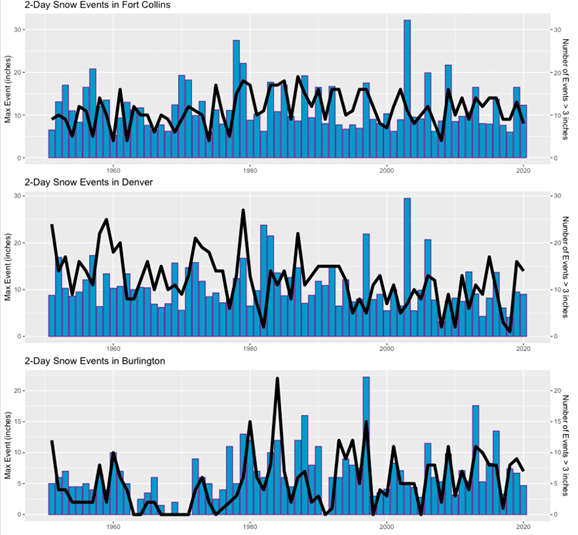
Accurately assessing trends in snowfall is more complicated. Snow measurement protocols have changed over time, muddying the waters of snowfall trend analysis. We do know average high elevation snowpack has decreased over time in Colorado, but 3”+ snowstorms on the Front Range have not. Annual maximum snowfall event totals have not fallen yet either (Figure 2). We also know that extreme cold outbreaks, which often follow winter snowstorms, are likely to continue decreasing in frequency and intensity, but will not disappear.
Figure 2: Maximum 2-day snow event per year in inches (blue bar) and total number of 2-day snow accumulations greater than 3 inches per year (black line) for Fort Collins (top), Denver Central-Park (middle), and Burlington (bottom), 1951-2020. Source: climatechange.colostate.edu
Winter storms are complex, and can be measured in a number of ways. For instance, just in recent years, we have seen the northern Front Range covered with 20-30” of snow (March 2021), a new lowest central pressure record from a winter storm (March 2019), and one of the most intense cold fronts in decades (December 2022). We have high confidence that winter will continue to get warmer on average across Colorado over the coming years and decades, but snow, extreme cold, and wildly varying conditions will not be out of the offing anytime soon.
Based on the evidence we have about climate change in Colorado, it is reasonable to hypothesize that our warming trend made this event more likely. Even so, climate models do not suggest that events like February 3rd, 2024 will become commonplace by the end of the century, even under high emissions scenarios.
A newly published study from the U.S. Geological Survey explains how salinity in the Upper Colorado River Basin has changed over the past few decades and shows how climate, irrigation and flow of groundwater contribute to salinity in the watershed. The study correlates overall salinity declines in the river basin since the 1980s with a transition from wet to dry conditions.
High salinity can limit water available for agriculture, drinking water, aquatic life and infrastructure, with significant impacts to the economy and human health. Salt occurs naturally in water, but salt loads are influenced by irrigated agriculture, geology, land cover, land-use practices and precipitation. Salinity can exacerbate corrosion of lead pipes and increase lead levels in drinking water and mobilize other metals or pollutants as well. High salinity levels in the Colorado River reduce agricultural yield, damage infrastructure and are estimated to cause $348 million per year in damage to infrastructure and crop production.
Sources/Usage: Public Domain. Salt deposits along the Paria River, UT. (Olivia Miller, USGS)
“This study shows us how irrigation and climate work together to influence salts going into streams,” said USGS hydrologist Olivia Miller, lead author on the study. “Future climate change in the Southwest, combined with changes in irrigation, may affect stream water quality, but we don’t yet understand how these interactions will play out, so our next step is developing a model to test scenarios of future climate change.”
Wet periods have higher salinity loads because increased runoff from rain and melting snow and increased groundwater movement bring more salts into rivers. In contrast, drier periods have lower salinity loads. Irrigation also plays an important role, contributing salts to the river more efficiently than any other source.
“Salt loading to the Upper Colorado River and tributaries is a significant economic and environmental concern which limits the utility of the Colorado River and creates economic damages to downstream water users,” said Don A. Barnett, Executive Director, Colorado River Basin Salinity Control Forum.
For the new study, USGS scientists created a dynamic model that simulates the flow of water and salts throughout the whole Upper Colorado Basin between 1986 and 2017, allowing them to estimate salinity in the river and identify its sources for every year over that time.
The study confirmed previous findings that salts come primarily from groundwater (66-82%), with smaller portions attributed to runoff and springs. The salts in groundwater may initially come from infiltration of irrigation water, but once dissolved in groundwater, tracing the source is difficult. Groundwater is stored for long periods underground, meaning that there can be a time lag between when the salts enter the groundwater and when they end up in the river. As a result, while salinity management efforts focused on surface runoff processes may produce small results in the short term, larger impacts may take longer to work through the groundwater system.
“The Upper Colorado River Basin States are taking actions to reduce salinity in the Colorado River for the benefit of the 40 million people who use the River’s water,” said Paul Kehmeier, Salinity Program Coordinator, Colorado Department of Agriculture. “This study helps clarify that the sources of salt vary over time and it will help inform managers on strategies to continue improving the quality of water in the Basin.”
The historic flume hanging from a cliff above the Dolores River in western Colorado. This stretch would likely be included in a proposed national monument. Jonathan P. Thompson photo.
An effort is blossoming to protect a stretch of western Colorado’s Dolores River and its tributaries with a national monument designation. While the proposed boundaries haven’t been nailed down yet, the monument likely would include the river corridor in Montrose and Mesa Counties in Colorado, downstream of a proposed national conservation area that is still working its way through Congress. A designation would withdraw the canyons — many of which have remained relatively pristine despite being in the middle of the Uravan uranium belt — from future mining claims and oil and gas leases, while not affecting existing valid claims or private land.
Unfortunately, a mis-informed movement has emerged aimed at nipping the national monument concept in the bud.
Last week, someone named Sean Pond started an online petition (and an accompanying Facebook page) aimed at halting “the designation of the Dolores River National Monument.” He claims the petition is “born out of a deeply personal concern for the residents of Gateway, Paradox, Bedrock, Nucla and Naturita,” and claims a monument would “impose severe economic hardships” on those communities by leading “to an immediate cessation of mining activities that many local families depend on for their income.” He goes on to say that hunting and grazing would be outlawed and the freedom to enjoy outdoor activities curtailed.
If all that were true, then Pond’s petition might make sense. But it’s not true. Which is to say that the petition is using disinformation to incite fear and build opposition.
To clear things up, let’s do a little fact-check:
A national monument designation would have zero effect on: existing, valid mining claims1; patented claims (i.e. private land); or active Department of Energy uranium leases. This means that a national monument would not affect existing mining activities, and would not in any way lead to a “cessation of mining activities.” If you don’t believe me, just take a look at the Baaj Nwaavjo I’tah Kukveni-Ancestral Footprints of the Grand Canyon National Monumentdesignated by President Biden last year. The controversial Pinyon Plains mine lies within the boundaries of the monument, and Energy Fuels is currently ramping it up for production.
And even if it were to affect existing mining activities (again, it won’t), the notion that “many local families” depend on mining in that area is a bit of a stretch, since the uranium industry has been in a zombified state since the 1980s. The primary mining activity lately has been reclamation work — which is great! — but even that’s stalling out and, again, it won’t be affected by a national monument.
Every national monument has its own set of rules, but most national monuments overseen by the Bureau of Land Management allow cattle grazing and have maintained the same number of permitted cattle as before designation, e.g.: Grand Staircase-Escalante, Canyon of the Ancients, and Bears Ears National Monuments. They also allow hunting. They also allow motorized travel on thousands of miles of designated routes. National monuments do not inherently curtail outdoor recreation any more than other federal land designations.
If a monument has any economic impact on the area’s communities it likely will be a positive one, since a monument will draw tourists who will spend money in area businesses.
A national monument only affects land that is already managed by the federal government. It is not a “land grab.” It is not an effort by the government to seize control of something it doesn’t already control.
I know, sometimes I sound like a damned broken record with these sorts of things. But I guess I hope that if I repeat myself enough times, folks might hear the facts. It’s not the opposition to the national monument that bothers me; there are legitimate reasons to be wary of such things. It’s the fact that the campaign to quash the proposal is based on lies.
On the coast, the Yurok Tribe’s ancestral territory stretches from the Little River in Humboldt County to Damnation Creek in Del Norte County. The tribe’s territory extends for 44 miles up the Klamath River to its confluence with the Trinity River. The Klamath and Trinity rivers are the lifeline of Yurok people, as the rivers provide the majority of the food supply including ney-puy (salmon), Kaa-ka (sturgeon), and kwor-ror (candlefish). Today, the tribe is the largest in California with more than 6,400 enrolled members. The Yurok Tribe was a signatory to the Amended Klamath Hydroelectric Settlement Agreement, which ultimately led to dam removal. The Yurok Tribe has played a pivotal role in every single aspect of Klamath River Dam Removal and restoration efforts.
The Yurok Fisheries Department and Yurok Tribe Construction Corporation are all at the forefront of these projects. The Yurok Fisheries Department collected a substantial volume of the approximately 20 billion native seeds that will be used to restore the 2,000-acre reservoir reach in between the four dams. Yurok Fisheries crews, RES and many project partners are now hand-sowing the seeds throughout the empty reservoirs. The Yurok Tribe is working on large-scale river restoration projects in other parts of California too. Informed by Traditional Ecological Knowledge and western science, the Yurok Fisheries Department and Yurok Tribe Construction Corporation transform severely degraded aquatic ecosystems into highly productive habitat for salmon as well as many other native fish and wildlife species. The Yurok Tribe has completed numerous projects on the Klamath and Sacramento Rivers and many smaller streams.
The Karuk Tribe lives in its ancestral homelands along the middle part of the Klamath River, between Weitchpec and Seiad, California. The Karuk Tribe was a signatory to the Klamath Hydroelectric Settlement Agreement, which ultimately led to dam removal.
As Karuk Tribal Chairman Russell “Buster” Attebery stated in a video shared by KRRC, “Having the dams come out and having the almost 400 miles of salmon spawning grounds, and better water quality, is going to be imperative to life along the Klamath River. I was born and raised along the Klamath River and the fish, the river, and the clean water provides a perfect way of life. We are looking forward to the opportunity to have clean water again, and spawning grounds so our children can again experience the opportunities to fish and provide a food source for their families. It will be a great benefit to everyone who lives along the Klamath River.
The Klamath Justice Coalition was founded by grassroots Indigenous leaders more than two decades ago. They created what is now known as the “Un-dam the Klamath Campaign”. The refrain “Undam the Klamath, bring the salmon home” was heard from fishing boats on the river all the way to Berkshire Hathaway’s shareholder meeting in Omaha, Nebraska. As one of the co-founders Molli Myers (Karuk) states, “this was a movement of the people”.
Berkshire Hathaway is the parent company of PacifiCorp, which owned and operated the four Klamath River dams. In 2020, Berkshire Hathaway played a pivotal role in securing the final dam removal accord: the company agreed to transfer operating licenses of the dams to the states of Oregon and California, and the Klamath River Renewal Corporation. Berkshire also agreed to share the burden of any cost overruns.
Ridges to Riffles is advancing Indigenous-led restoration efforts on the Klamath and other rivers. R2R works in partnership with Indigenous Peoples to advance their cultural and natural resource interests through legal and policy advocacy. In partnership with the Yurok Tribe, R2R is working on Klamath dam removal, habitat restoration, instream flows, and personhood rights for the Klamath River.
The Klamath River Renewal Corporation (KRRC) is a nonprofit organization formed by signatories of the amended Klamath Hydroelectric Settlement Agreement, to take ownership and oversee removal of the four hydroelectric dams on the river. Managing the biggest dam removal and river restoration project in history is no small feat. KRRC’s team has prioritized safety, community engagement, and helping the people of the basin take steps toward a shared, sustainable future.
Klamath River Basin. Map credit: American Rivers
States of Oregon and California
Bipartisan support was key to success on the Klamath: elected leaders from both parties saw the value of a restored Klamath River, with California Governor Schwarzenegger and Oregon Governor Kulongoski signing the original agreement to remove the dams in 2010. A decade later, California Governor Newsom and Oregon Governor Brown took a vital step, joining the Klamath River Renewal Corporation as a co-licensee, allowing PacifiCorp to relinquish the operating license for the dams. California Proposition 1 water bond funds combined with PacifiCorp ratepayer funds to make the project possible. Never before has a state contributed this much funding to a dam removal project.
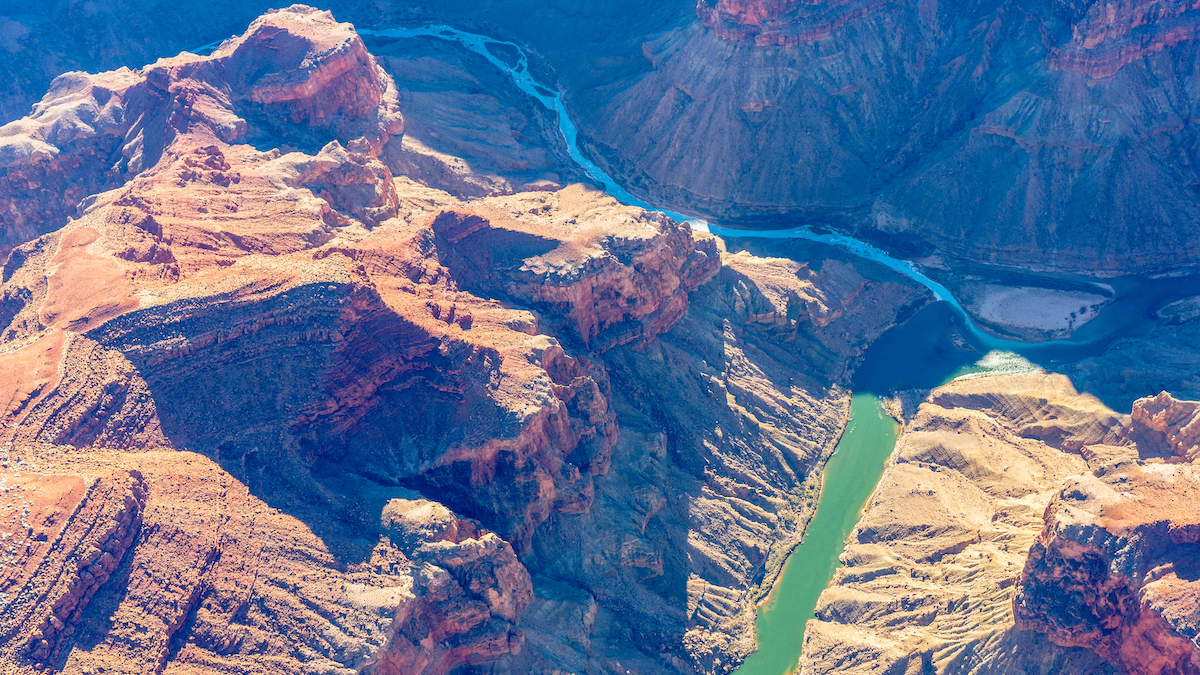
Confluence of the Little Colorado River and the Colorado River. Climate change is affecting western streams by diminishing snowpack and accelerating evaporation. The Colorado River’s flows and reservoirs are being impacted by climate change, and environmental groups are concerned about the status of the native fish in the river. Photo credit: DMY at Hebrew Wikipedia [Public domain]
For the past 60 years, Navajo leaders have worked to settle water claims in Arizona. The aim of the Northeastern Arizona Indian Water Rights Settlement Agreement is to affirm and quantify the nation’s rights to water in the state and to secure funding to build much needed water delivery infrastructure to homes on the Navajo Nation, according to a summary of the agreement.
“When we took office last year there was a huge push for us to start talking about our water rights, our water claims,” Navajo Nation Speaker Crystalyne Curley told The Arizona Republic. “It’s been far too long, going through COVID, climate change, drought that we are facing every year, we had to take into account of what we want to secure for the next 100 years.”
The U.S. Supreme Court held last summer that the United States did not have an affirmative treaty or trust obligation to identify and account for Navajo Nation water rights on the Colorado River. Curley said that ruling was a pivotal moment that led the Navajo Nation and its water rights negotiation team to focus on completing on the settlement…
The Coconino Aquifer. The fundamental law of the Navajo (Dine) people believes water to be one of the four sacred elements that was put forth by Diyin dine’e’ (Deities) as a source of life. Water is part of prayer in the Hozho ceremonies for healing. All human and all life on Nahasdzaan (Mother Earth) have a degree of water in their system. Water is precious to native people – it is life. Credit: Dine’e’ C.A.R.E.
The agreement will settle all of the Navajo Nation, Hopi Tribe and San Juan Southern Paiute water rights for the upper and lower basins of the Colorado River, the Little Colorado River basin, the Gila River Basin (including Big Boquillas Ranch) and claims to groundwater in the Navajo Aquifer, the Coconino Aquifer and other alluvial aquifers.
Click the link to access the report on the Science website (Hong Wang, Junguo Liu, Megan Klaar, Aifang Chen, Luka Gudmundsson, and Joseph Holden). Here’s the editor’s summary:
February 27, 2024
Editor’s summary
Patterns of river flow vary seasonally, which has important effects on the occurrence of floods and droughts, degrees of water security, and ecology. What is anthropogenic climate change doing to these seasonal cycles? Wang et al. used in situ observations of monthly average river flow from 1965 to 2014, combined with modeling, to show that human effects on climate have already caused a reduction of river flow seasonality at latitudes above 50° N. Understanding these changes is necessary for ensuring that freshwater ecosystems maintain their essential functions, for securing sustainable water resources, and for determining allocations for irrigation or hydropower generation. —H. Jesse Smith
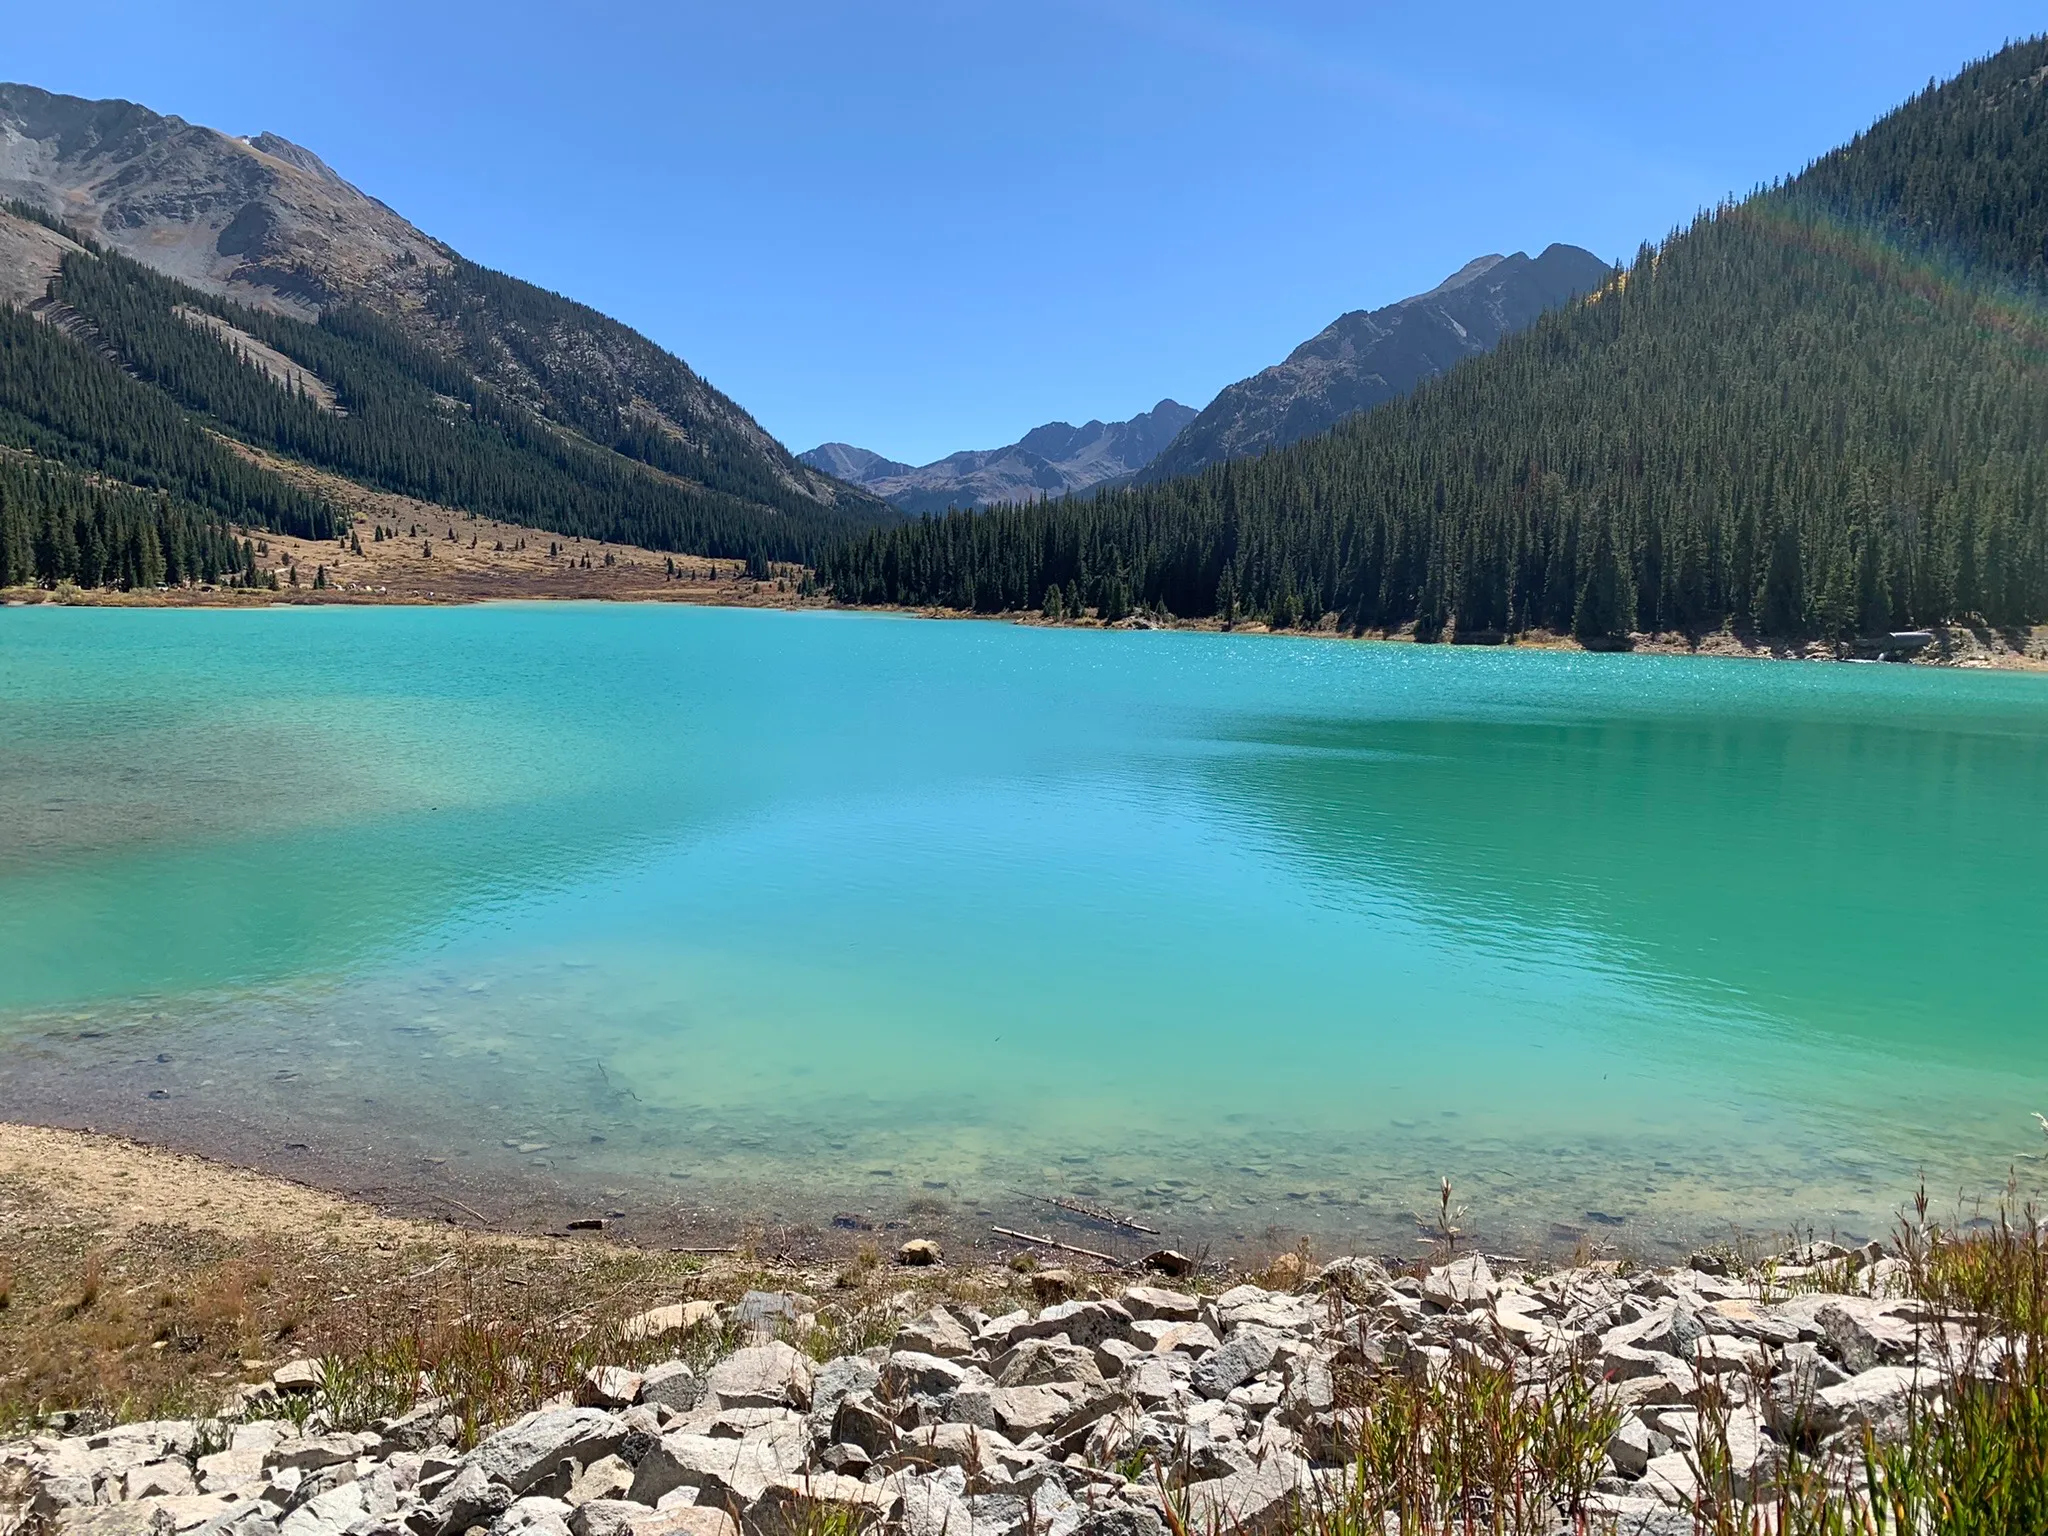
Grizzly Reservoir was a bright shade of turquoise in September 2022. The man-made alpine lake has high concentrations of metals that are toxic to fish, according to a report from the Environmental Protection Agency.
CREDIT: HEATHER SACKETT/ASPEN JOURNALISM
Presenters at a public meeting Thursday [February 1, 2024] about contamination on Lincoln Creek hosted by agencies that oversee water quality offered a lot of information, but few solutions yet to the problem.
The meeting, held at the Rocky Mountain Institute in Basalt, featured the results of water quality sampling and presentations from a panel of experts from agencies including Environmental Protection Agency, Colorado Parks and Wildlife, U.S. Fish and Wildlife Service, Colorado Department of Public Health and Environment, the U.S. Forest Service, Colorado Division of Reclamation, Mining and Safety, the U.S. Geological Survey, environmental group Trout Unlimited and Pitkin County Environmental Health.
“We have a lot of questions,” said Kurt Dahl, Pitkin County environmental health manager. “Is (the contamination) going to continue to increase? What does it mean for the Roaring Fork? For my office? For human health? … There’s also this question around mitigation. I think we want to get our arms around, is this a possibility? What does this look like? What are the costs? Can we afford it?”
A report released in November by the EPA based on water-quality samples from 2022 found that Lincoln Creek in the four miles between the Ruby Mine and Grizzly Reservoir exceeds state water quality standards for aquatic life for aluminum, cadmium, copper, iron, lead, manganese and zinc. Aluminum and copper concentrations were especially high.
Water quality issues on Lincoln Creek have been a concern for years, with the creek above the reservoir often running a yellowish color, and Grizzly Reservoir often a bright turquoise. In September 2022, Lincoln Creek below the reservoir turned a milky-green color, and white and yellow sediment settled on the streambed, prompting water quality testing in the fall of 2022 and the EPA report. These conditions in 2022 could be seen downstream at the confluence with the Roaring Fork River, sparking concern for local residents and organizations.
And the problem has gotten worse in recent years. The high concentrations of aluminum and copper are toxic to fish, and Lincoln Creek and Grizzly Reservoir experienced a fish die-off in 2021. In fall of 2023, there was a fish kill downstream in the Roaring Fork in the North Star Nature Preserve, which experts say was probably due to a combination of high metals concentrations and too-warm water.
The EPA report also found that the main source of contamination is not drainage from the Ruby Mine, but is naturally occurring from a “mineralized tributary” just downstream from the mine.
During the Q&A portion of the meeting, attendees asked whether the Ruby Mine, where turn-of-the-20th-century prospectors dug for gold and silver, could really be the source of contamination. Mindi May, water quality program director with CPW, said she initially shared the audience’s skepticism that the mine wasn’t the main source of contamination, but after visiting the site she agrees with geologists’ findings that it’s naturally occurring.
“You could just see the water from the mineralized trib just seeping out of the ground,” she said. “So at this point I am convinced … that the mineralized trib and the Ruby are separate and that the mineralized trib is natural and that it really is the problem.”
The fact that the contamination of the creek is naturally occurring creates a question about who’s responsible for cleaning it up. The EPA is authorized to address elevated metals concentrations only from human-caused sources, not contamination from natural sources.
Primarily an ecological problem
Panelists addressed the potential human health impacts from the contaminated water in the creek and at Grizzly Reservoir, a popular spot for summer camping, hiking and fishing. The U.S. Forest Service manages the seven-site Portal Campground near the reservoir.
Mike Carney, a toxicologist with U.S. Fish and Wildlife Service, said his agency is primarily concerned with arsenic and lead, which have health risks but aren’t the main contaminants in Lincoln Creek. He said there’s not much risk associated with someone’s skin coming into contact with the copper and aluminum-laden water. As for drinking the water, backpacking filters are unlikely to filter out all the contamination and gastrointestinal distress could result. But would-be guzzlers of the orange-tinted water would probably be turned off by the taste.
“At those concentrations, that water would likely not be palatable because it would taste very bad,” Carney said. “This is primarily an ecological problem here.”
Carney said they did not find worrisome concentrations of metals accumulating in the tissue of fish sampled from Grizzly Reservoir. CPW restocks the fish every summer so they may not spend enough time living in the reservoir to build up metals concentrations before they die or are caught and eaten by anglers.
Twin Lakes collection system
Lincoln Creek feeds into the Twin Lakes Reservoir and Canal Company’s transmountain diversion system, in which Grizzly Reservoir is used as a collection pool before sending water through the Twin Lakes Tunnel to the Arkansas River basin, where it is used primarily in Front Range cities, including for drinking water. Colorado Springs Utilities owns the majority of the water in the Twin Lakes system.
The November EPA report said the substantial mixing, the distance that the water travels to the Front Range and the water-treatment process limit the impacts to Colorado Springs’ drinking water.
Twin Lakes is planning to drain Grizzly Reservoir this summer so it can do a rehabilitation project, including installing a membrane over the steel face of the dam, replacing the gates that control the flow of water into the Twin Lakes Tunnel and repairing the outlet works that release water down Lincoln Creek.
Repairs to fix damage after a log got caught in the outlet works in 2015 resulted in the release of a slug of contaminated water and sediment from the reservoir that quickly boosted flows in the Roaring Fork near Aspen and turned it yellow, alarming residents. Twin Lakes board president Alan Ward said that wouldn’t happen with this summer’s planned draw-down.
“The company was very embarrassed by that, we do not want that to happen again,” he said. “We talked with our contractor about a drawdown plan and we need to make sure that as we get to those sediments, that we’re moving slowly and have a lot of sediment control in place so that we’re not putting that in the creek.”
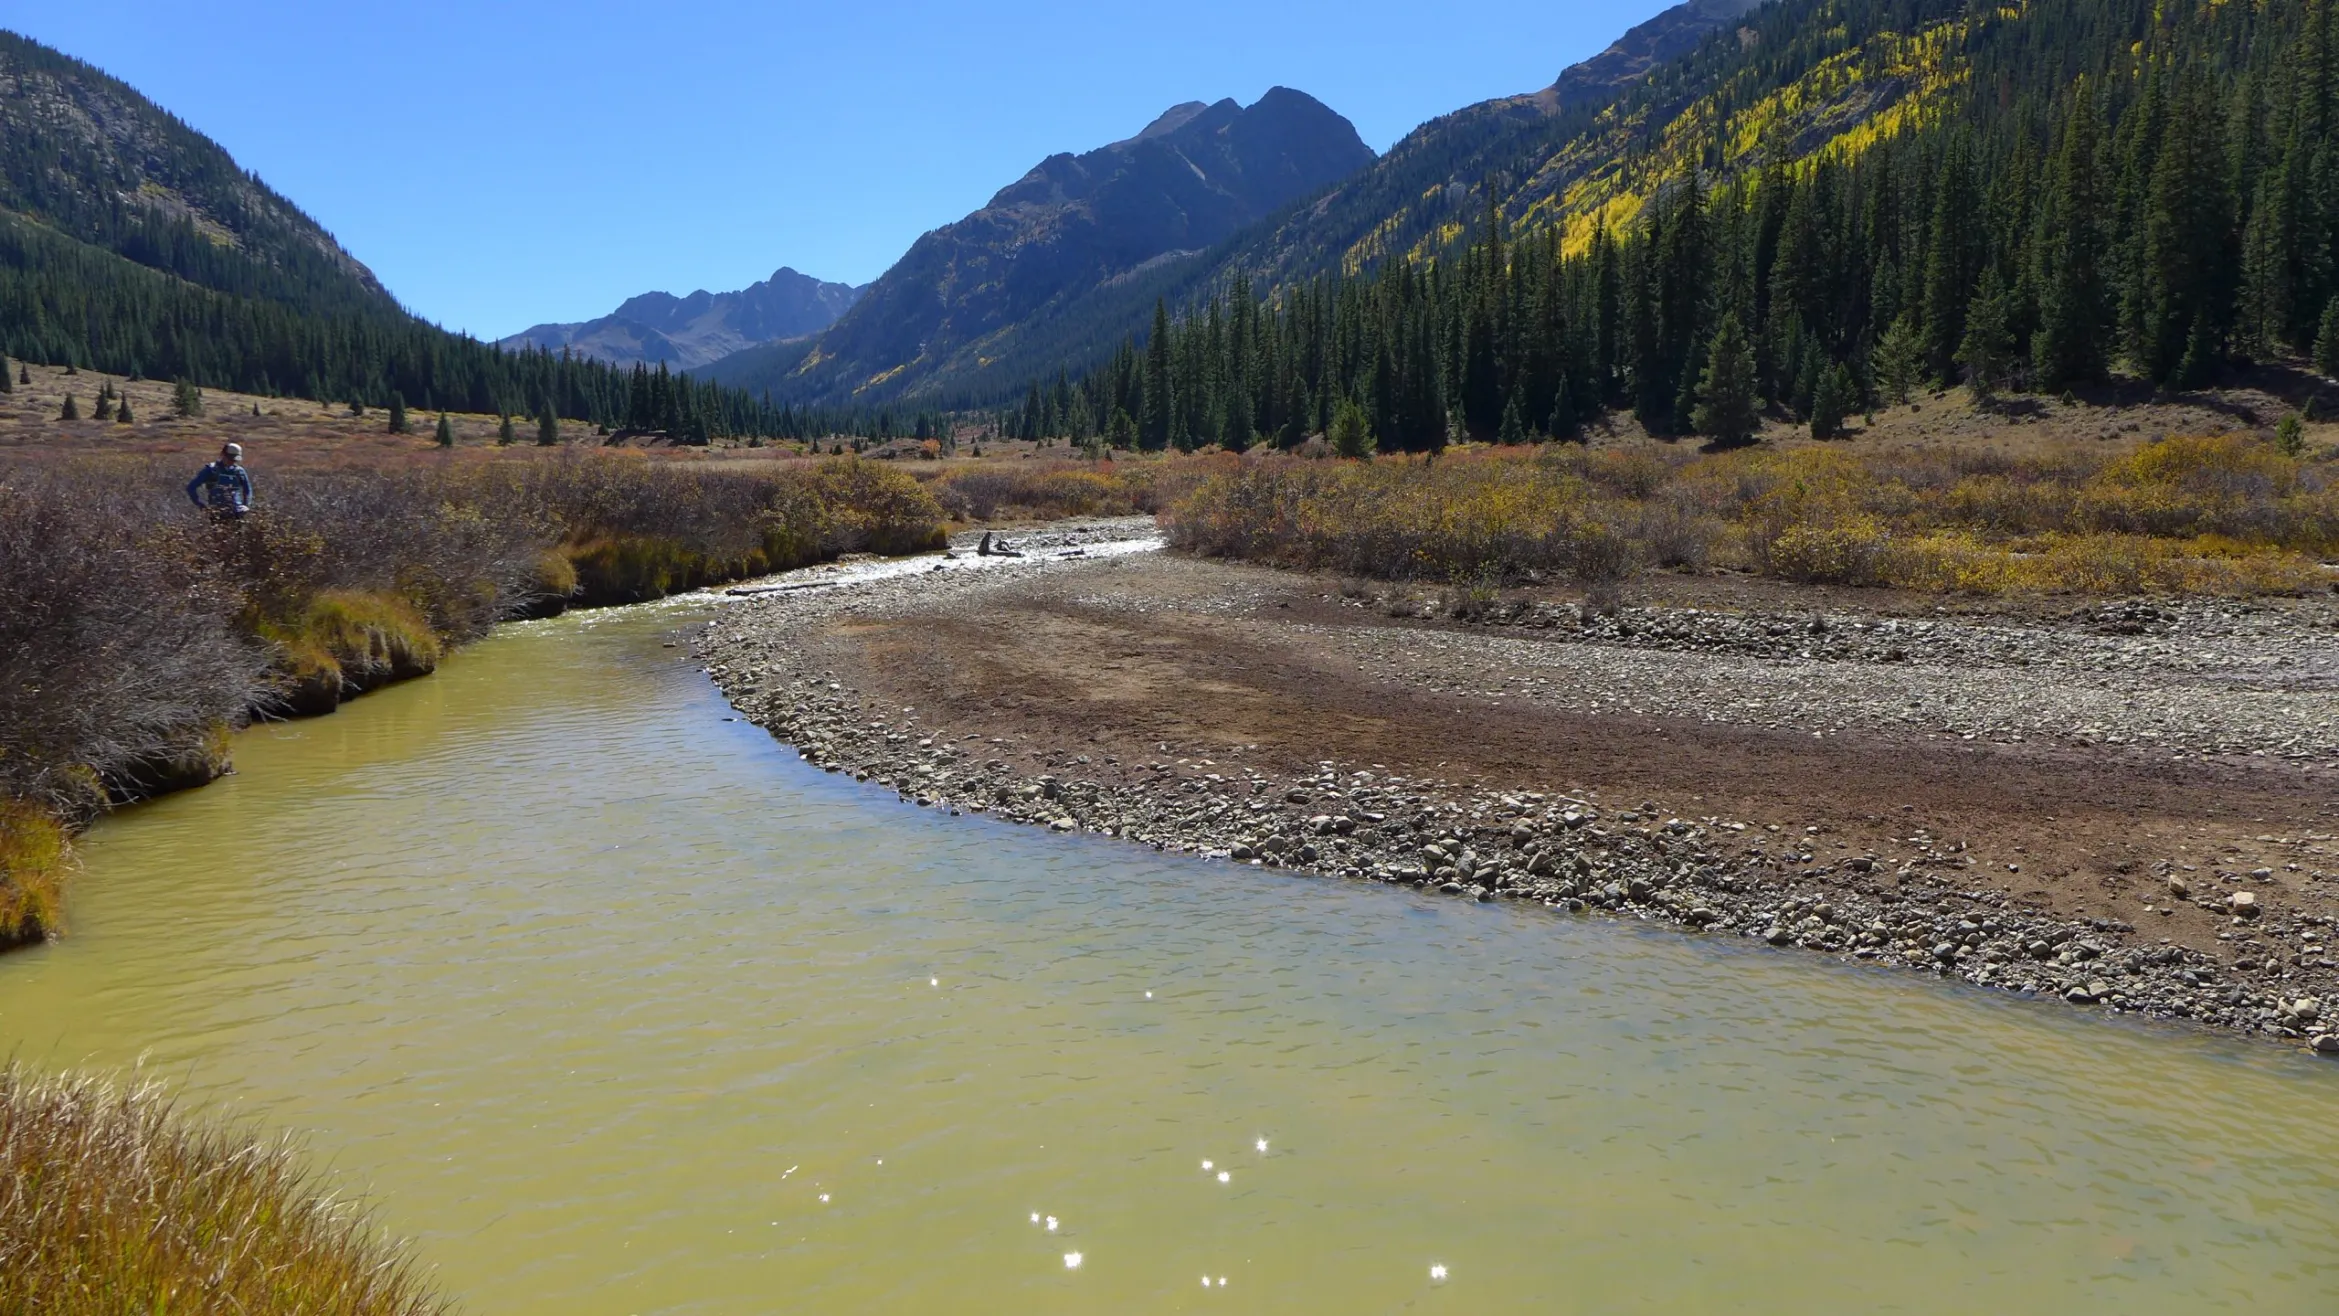
Lincoln Creek is one of several drainages that flow into Grizzly Reservoir, a collection pool for Twin Lakes Reservoir and Canal Company. Drainage from defunct upstream mines may be partly responsible for the water’s yellow color. Photo credit: Heather Sackett/Aspen Journalism
Leaching metals and climate change
When water and oxygen come into contact with pyrite-rich rock, it reacts to form sulfuric acid and causes the leaching of metals from the rock. One take-away from Thursday’s presentations is that this type of metals contamination of Colorado waterways is increasing with climate change.
Thomas Chapin, a research chemist with USGS, said drought and climate change have reduced the volume of streamflows, meaning metals concentrations will be higher even if the overall amount of metal leaching stays the same. But melting ice and ground that was once frozen also allow water and oxygen to come into contact with rock that used to be inaccessible to the leaching process.
Prior to mining, snowmelt and rain seep into natural cracks and fractures, eventually emerging as a freshwater spring (usually). Graphic credit: Jonathan Thompson
“The combination of the decrease in flow coming down, so less dilution, and the lowering of the water table and exposing more material to acid rock drainage, it’s a double whammy,” Chapin said.
Pitkin County isn’t the only place in Colorado where increasing metals concentrations is negatively impacting water quality. Chapin said a recent study looking at the Snake River, a tributary of the Blue River in Summit County, found a 100% to 400% increase in the amount of zinc concentrations over 30 years.
“We saw similar data with Lincoln Creek,” he said. “Those September values have gone up quite a bit.”
The recently released Climate Change in Colorado report found that temperatures have warmed more in fall than other seasons.
Dahl wrapped up the meeting, which ran 30 minutes past its scheduled time of 6 to 7:30 p.m., by saying that local water quality experts are talking about next steps and plan to hold another public meeting this spring.
“We recognize that there was a lot of information here without a lot of opportunity to ask questions,” he said. “We’ve already agreed that we need to have another public meeting.”
Click the link to read the article on the NOAA website (Amy Butler and Laura Ciasto):
February 29, 2024
We’ve talked about how the reversal of the west-to-east winds during a major sudden stratospheric warming sets up a feedback between large atmospheric waves and the winds, and how this results in the stratospheric wind changes being communicated down into the troposphere. But what does this mean for weather patterns down here after the polar vortex is disrupted?
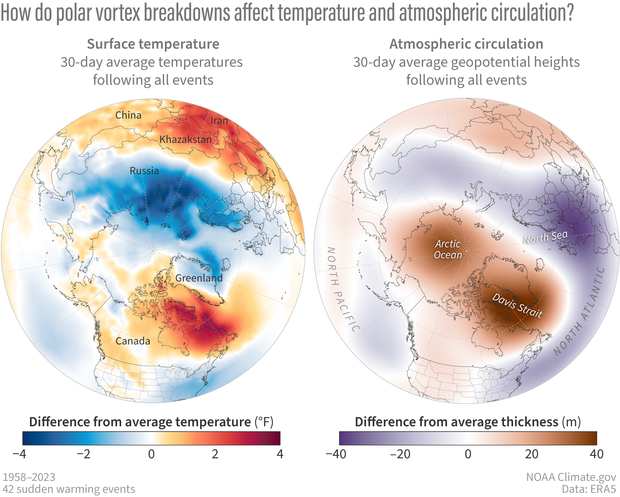
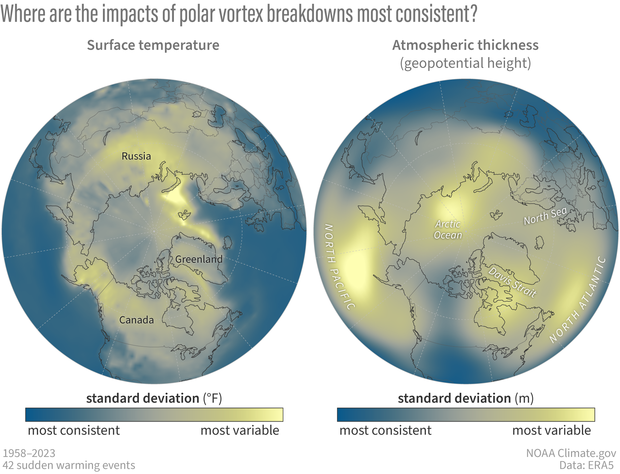
By taking the average of the surface temperature and atmospheric thickness for the 30 days after all the major sudden stratospheric warmings in the observational record, we can average out day-to-day variations in the weather and see more clearly what weather patterns related to major warmings look like.
Average changes in (left) surface temperature and (right) atmospheric thickness (at the 500-hectoPascal pressure level) for the 30 days after the 42 observed major sudden stratospheric warmings from 1958-2023. NOAA Climate.gov image based on ERA5 reanalysis data provided by Amy Butler.
From a stratospheric hot mess to a tropospheric cold brew
Sudden stratospheric warmings (and sometimes just the phrase “polar vortex”) are often associated with cold and snowy weather; and indeed, anomalous cold is evident over some regions like northern Europe and Asia and the eastern United States after these events. How does a warming of the stratosphere cause widespread cold at the surface?
During major warmings, the atmospheric thickness increases over the pole, which shows up on these maps as a positive anomaly in tropospheric geopotential height over the Arctic, particularly Greenland. This increase in atmospheric thickness in the troposphere is linked to the build-up of air over the pole during the sudden warming: it can act like a rock dropped in a bucket, pushing down on the troposphere such that the cold Arctic air “sloshes” out into lower latitudes. An alternative way to think about it is that the increased atmospheric thickness over the Arctic induces changes in tropospheric winds that push cold air from the Arctic farther south in some regions and pull warm air from the south into the Arctic in other regions.
But… it’s not cold everywhere
Not all regions need to bring out snow shovels and gloves when a polar vortex breakdown is on the menu. The map shows that there are also large areas with generally warmer than normal surface temperatures after major warmings. These regions include eastern Canada and much of subtropical Africa and Asia. This is one reason why, even though we might care most about what happens where we live, we shouldn’t equate polar vortex disruptions with cold air outbreaks.
Weather effects are strongly regional
Another reason to not automatically assume that a major stratospheric warming means colder weather is that the magnitude of cold varies widely from place to place, with the strongest cold appearing over northern Europe and Asia, and more moderate to weak cold appearing over central Europe and the eastern United States. These regional differences arise because the changes in atmospheric thickness, and thus the effects on the tropospheric jet stream, are centered over the North Atlantic [footnote 1], and so the strongest associated temperature changes occur just upstream or downstream of this region.
An atmospheric gamble
It’s important to remember that the maps of “typical” surface impacts are not a forecast and do not represent the expected day-by-day weather when one of these events occurs. These maps show an average over many major warmings, each occurring in different years and with different global climate conditions (such as different phases of ENSO). These maps don’t give a sense of where the weather may vary substantially from one event to another.
Furthermore, they’re also an average over the 30-day period after one of these events, which means that from day to day or week to week after a major warming event, the weather could look vastly different in any given location than from what is shown here. What this type of map does is provide a sense of where changes in temperatures and pressures are most likely to occur in the month after a major warming, allowing us to assess the probabilistic risk of certain extremes. In other words, a major warming “loads the dice” for certain conditions, but by no means guarantees them.
Another way we can get a hint about which areas are most likely to follow the average pattern is to look at how much variability there is at a given location from event to event. That’s what the maps below show.
Where do the surface temperatures and atmospheric thickness (at the 500-hectoPascal pressure level) vary the most from one major warming event to another? These maps show where the standard deviation, a measure of the variability, is greatest across events (for the 30-day averaged period after the 42 observed major warmings in the 1958-2023 period). Surface temperatures (left) show high event-to-event variability across the central Arctic, Russia, and Alaska. The high variability over the central Arctic likely reflects changing sea ice conditions over this period. Atmospheric thickness (right) shows high event-to-event variability over Greenland and the North Atlantic, and the North Pacific. The high event-to-event variability over Alaska and the Pacific region likely reflects the varying El Nino-Southern Oscillation conditions that occurred during the 42 major warming events, which get averaged out in the first figure in this post. NOAA Climate.gov image based on ERA5 reanalysis data provided by Amy Butler.
Current polar vortex conditions: did it or didn’t it?
So did we see the second sudden stratospheric warming of the year? Well… it’s complicated. The stratospheric polar vortex did indeed rapidly weaken and warm as predicted, so physically-speaking, a sudden warming occurred around February 19, 2024.
However, whether it will be classified as a major or minor event is still unclear. This is because the way a major sudden warming is commonly defined [footnote 2] requires the daily-mean west-to-east winds, averaged around the 60N latitude circle and at the altitude corresponding to an atmospheric pressure of 10 mb, to fall below 0 m/s. In this case, the winds came very very close to that threshold (within +/- 1 m/s), so that some reanalysis data products [footnote 3] likely will show the winds falling below 0 m/s and others will not. This disagreement between data products has happened in the past and is one of the caveats of using a threshold-based definition of these events; there is some sensitivity to which events get “counted” as major warmings, even though a rapid weakening and warming of the polar vortex was observed.
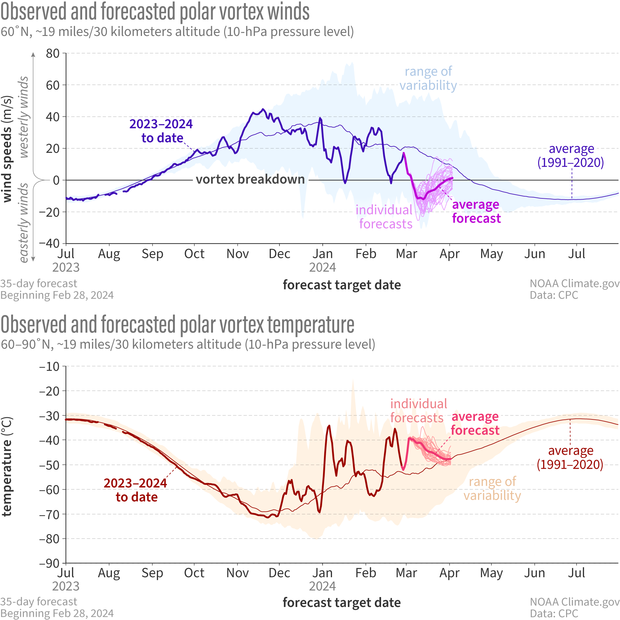
Observed and forecasted (NOAA GEFSv12) wind speed (top) and temperature (bottom) in the polar vortex compared to the natural range of variability (faint shading). For the GEFSv12 forecast issued on February 28, a reversal of the vortex winds is forecast to occur around March 5 (top, thick magenta line), accompanied by an increase in stratospheric temperature (bottom, thick pink line). While the polar vortex winds only barely fell below 0 m/s in January and hovered near 0 m/s in February, in March the winds are expected to stay reversed until almost April. NOAA Climate.gov image, adapted from original by Laura Ciasto.
Nonetheless, perhaps because the weakening of the vortex wasn’t substantial enough to significantly reverse the stratospheric winds (if at all), the winds have re-strengthened quickly. The continued west-to-east winds will allow further onslaught of the polar vortex by atmospheric wave activity. [Remember from our earlier post that only when the polar vortex is whipping along from west-to-east can waves from below penetrate and disrupt it.] Current forecasts show potential for a more substantial reversal of the stratospheric polar vortex than we’ve seen so far this entire winter taking place early next week. However, we are also heading into spring, which is when the stratospheric polar winds typically transition to an east-to-west summertime state. So it remains to be seen whether this upcoming reversal will essentially kill the polar vortex for the remainder of the season (the “final warming”), or whether the vortex will return to west-to-east flow in April for a brief period [footnote 4].
Footnotes
Why the North Atlantic jet stream appears more strongly affected than the Pacific region after major warmings is still not well understood.
Reanalysis products take multiple observational sources like satellite and balloon measurements and assimilate them into a model to create a product that is both temporally and spatially complete at each grid space of the model, and is constrained by observations. Because different data centers use different models and data assimilation techniques, and may assimilate different satellite and balloon records, reanalysis products can exhibit differences from one another. Note that because it can take some time for this data to be released, we often have to wait several weeks to determine if the major warming occurred in each dataset.
There are more technicalities to the major stratospheric warming definition that have implications for the final count of events this winter. In particular, because events must be separated by 20 consecutive days of west-to-east stratospheric winds, this upcoming wind reversal will not be counted separately from the February 19th event, if it occurred. Additionally, if it is a final warming, it will not be counted as a major warming which only includes “mid-winter” events. Ultimately, these details are all somewhat arbitrary and only matter for statistical purposes!
Confluence of the Little Colorado River and Colorado River; Credit: EcoFlight
Click the link to read the article on the Associated Press website (Felicia Fonseca and Suman Naishadham). Here’s an excerpt:
February 28, 2024
A Native American tribe with one of the largest outstanding claims to water in the Colorado River basin is closing in on a settlement with more than a dozen parties, putting it on a path to piping water to tens of thousands of tribal members in Arizona who still live without it. Negotiating terms outlined late Wednesday include water rights not only for the Navajo Nation but the neighboring Hopi and San Juan Southern Paiute tribes in the northeastern corner of the state. The water would come from a mix of sources: the Colorado River that serves seven western states, the Little Colorado River, and aquifers and washes on tribal lands. The agreement is decades in the making and would allow the tribes to avoid further litigation and court proceedings, which have been costly. Navajo officials said they expect to finalize the terms in the coming days. From there, it must be approved by the tribe’s governing bodies, the state of Arizona, the other parties and by Congress…
On Wednesday, the Navajo Nation cited climate change, cost, competition for water and the coronavirus pandemic as reasons to move toward a settlement. Arizona, in turn, would benefit by having certainty over the amount of water that is available to non-tribal users. The state has had to cut its use of Colorado River water in recent years because of drought and demand…
Arizona — situated in the Colorado River’s Lower Basin with California, Nevada and Mexico — is unique in that it also has an allocation in the Upper Basin. Under the settlement terms, Navajo and Hopi would get about 47,000 acre-feet in the Upper Basin — nearly the entire amount that was set aside for use at the Navajo Generating Station, a coal-fired power plant on the Navajo reservation that shut down in late 2019. The proposal also includes about 9,500 acre-feet per year of lower-priority water from the Lower Basin for both tribes. An acre-foot of water is roughly enough to serve two to three U.S. households annually. While the specific terms for the San Juan Southern Paiute Tribe remain under discussion, Congress could be asked to establish a small reservation for the tribe whose ancestral land lies in Utah and Arizona. The tribe’s president, Robbin Preston Jr., didn’t immediately respond to emailed questions from the AP.
Native America in the Colorado River Basin. Credit: USBR
On Wednesday [February 28, 2024], 96 Colorado-Big Thompson water shares and 154 acres of farmland from the Carlson Family Trust were auctioned for $5,473,600 and $990,000, respectively. It was the second such water auction in February. Earlier this month, Carol Oswald Yoakum sold her 90 shares of Colorado-Big Thompson water for an average of $52,481 per share...In recent years, around 95% of Colorado-Big Thompson shares that were transferred went from farms to municipalities and water districts, a Coloradoan analysis found…
When Colorado-Big Thompson water changes hands, it is recorded in the Northern Water Board’s monthly meetings agenda. The Coloradoan manually compiled every document available online, with records going back to June 2019, to understand this trend. The analysis focused on the transfers where there was a change in contract class. This excludes transfers where water is kept in the same use, like when shares are passed down in a family farm. Different contract classes allow for different water uses…During the time period covered by the analysis, the Coloradoan found 237 transfers, which moved 4,396 shares. The 10 biggest receivers, which were all water districts or municipalities, accounted for nine out of every 10 shares. However, that doesn’t necessarily mean most water is being used by cities…
“When we look at the data of where water is delivered, we see that on average it’s a little more than 50% that goes to municipal use, but municipal ownership is about 75%,” said Jeff Stahla, spokesperson for Northern Water, referring to water use from the Colorado-Big Thompson Project…Christopher Goemans, an associate professor in the Department of Agricultural and Resource Economics at Colorado State University, said “we’ve seen this shift in the ownership of rights from agricultural to municipal uses. And yet the vast majority of the water is still diverted and used in agriculture.”
[…]
On the other hand, the cost of acquiring water is driven in large part by the market for water rights. Wednesday’s auction averaged around $57,000 per Colorado-Big Thompson water share — several orders of magnitude higher than it cost when the project began. In 1960, three years after the project first started delivering water to users, the cost per share was $1.50.
Colorado-Big Thompson Project map. Courtesy of Northern Water.
A curriculum funded by the NMBCA combines taxonomy and traditional knowledge for Indigenous students from San Antonio del Chamí, Colombia. Photo: Andrés Estefan
Birds are everywhere at the school in Cañaveral, Colombia. Their songs fill the air. Their nests perch in flowerpots. And each Tuesday every classroom celebrates birds, from the short tales children write in Spanish class to science lessons about migratory journeys.
Since 2021 around 450 kids at 8 schools in Colombia’s coffee belt have been immersed in these lessons that seek to build support for conservation. “Kids now know about the worms that birds bring to their chicks and the birds’ scientific names,” says John Edison Martínez Delgado, academic coordinator at Cañaveral school. “They’re always drawing them in their notebooks.”
Audubon and a local university developed the curriculum for one of more than 700 projects funded through the U.S. Neotropical Migratory Bird Conservation Act (NMBCA), the only federal grant program dedicated to conserving birds across the Americas. Since 2002 it has pumped $89 million—$440 million, if you count matching funds—into habitat protection, research, and education in 43 countries. It has delivered three-quarters of that funding outside the United States to regions where some 390 long-distance migratory species spend much of their lives. And though the NMBCA is designed to benefit birdlife, advocates say it also supports people on the front lines of conservation, from Canada to Chile.
While the act’s geographic scale is vast, advocates say it needs more cash to help stem population declines driven by climate change, habitat destruction, and other threats. That’s why supporters are urging lawmakers to pass bipartisan legislation to increase funding and make it accessible to more communities. “It’s a perfect time to look back at this program, to work with Congress, and provide some options about how to address some of these steep declines,” says Erik Schneider, policy manager at Audubon.
Before Congress passed the NMBCA in 2000, wildlife managers across the Americas were alarmed by mounting evidence that development in migratory birds’ winter habitats was eroding populations. They saw the need for coordinated action—and for funding to make it happen.
To help foster that collaboration, the act required recipients to come up with $3 to match every $1 in U.S. government grants. As a result, organizations have banded together across borders to work with locals at key sites, says Ingrid Arias, development director at the nonprofit FUNDAECO. Using NMBCA funds, the group has partnered with the American Bird Conservancy (ABC) to purchase and protect more than 16,000 acres of forest habitat for Wood Thrush, Baltimore Oriole, and other species on Guatemala’s Caribbean Coast.
Setting aside protected areas, however, is not enough. Since many neotropical migrants winter on farms and other working lands that people rely on for their livelihoods, NMBCA projects also nurture connections with often remote communities, supporters say. Along with their work at schools in Colombia’s coffee belt, Audubon Americas and local partners have inked conservation agreements with growers there who commit to respect the biodiversity corridors running through their coffee farms. And in Guatemala, FUNDAECO and ABC have established native tree nurseries and bird-friendly cardamom farms run by community members.
The program also protects habitat in more urban areas. In Chile, Audubon Americas and nearly 80 partners used NMBCA funds to create the first conservation plan for a wetland, now being engulfed by the growing city of Concepción, where shorebirds like Baird’s Sandpiper and Hudsonian Godwit overwinter. Now another grant is helping to build support for the plan and to train locals as coastal stewards.
As effective as the act’s cost-share requirement has been at spurring teamwork, proponents argue that it could be lower and still serve that function—while opening the door to more partners. The proposed Migratory Birds of the Americas Conservation Enhancements Act would set the match at two-to-one, a change Arias says is especially needed today: “Since the pandemic, many environmental organizations’ fundraising ability has suffered a lot.”
What’s more, the bill would double the program’s annual budget to $10 million by 2028. That would be a big step, supporters say, toward the goal of making it a habitat-protecting force comparable to the North American Wetlands Conservation Act. That program has funded projects on more than 32 million acres, or nearly 10 times the scale of the NMBCA, and is widely credited with reversing declines in waterfowl populations. Other migratory birds desperately need—and could soon have a better shot at—a similar rebound.
This story originally ran in the Winter 2023 issue as “Ready for a Rebound.”
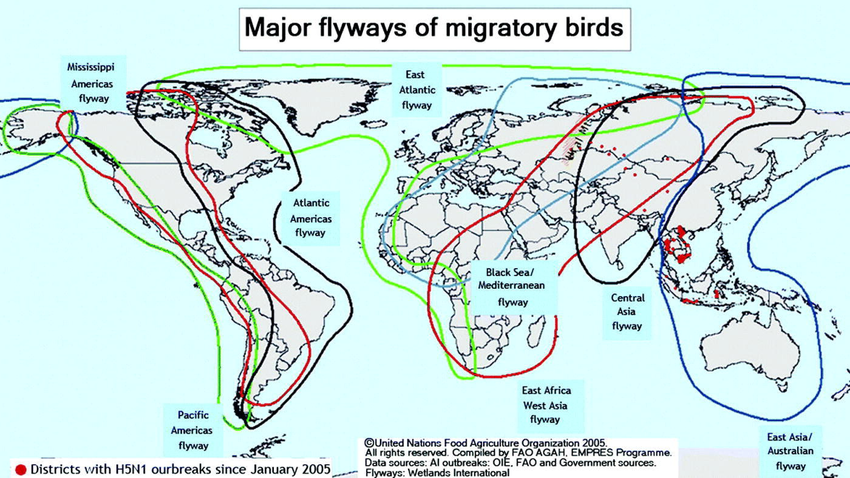
Map showing the global routes of migratory birds. Credit: John Lodewijk van Genderen via Reseachgate.net


