Click the link to read the article on the Big Pivots website (Allen Best):
June 16, 2024
Boulder and other Front Range communities get some real blasts. But unlike so much else with climate change, they’re not getting worse. Why?
It was a big, long blow. Wind whooshed, whipped and wailed through Boulder County for much of April’s first weekend. Pearl Street and other business districts went dark after Xcel Energy cut power midway through that Saturday afternoon with only a few hours of advance notice. Xcel has a public relations black eye that will last many months and maybe years, with other repercussions yet to be determined.
“An impressive April windstorm,” wrote Russ Schumacher, the state climatologist, on his blog a few days later. At the foot of the Flatirons, gusts at the National Center for Atmospheric Research (NCAR) Mesa Lab were measured at more than 95 miles per hour. Ditto for a recording station along Highway 93 at Rocky Flats.
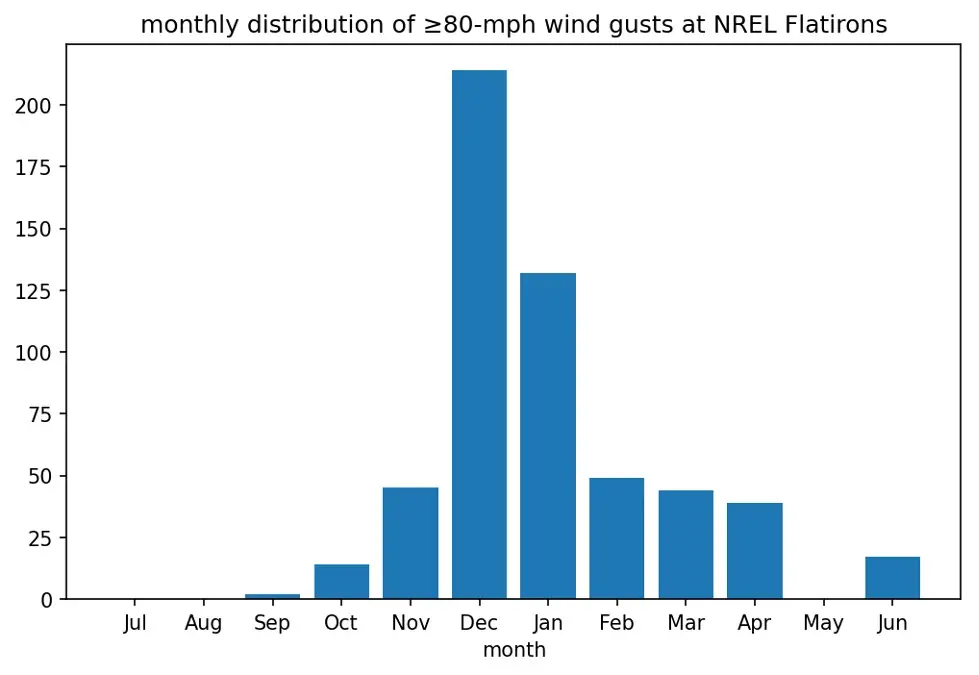
It was the worst April windstorm in at least the last 25 years, Schumacher wrote. These down-slope wind events, sometimes called mountain waves, usually occur from September to June. This one, though, had an intensity more typical of those during December and January, the peak months for winds along the Front Range.
Those who had never experienced a big Boulder blow before might have wondered what was going on. Could this be a ramification of the warming climate?
It’s a basic tenet of climate change theory that we will see more extremes in weather. Droughts will last longer and go deeper; hurricanes will grow more intense and rain — when it comes — will trend toward deluges. Already, evidence has arrived to support these predictions.
But the wind storms that have always racked the northern Front Range have actually diminished in severity and frequency since the 1990s. Research conducted by meteorologists at two national agencies based in Boulder has found that the good old days were windier and wilder yet.
“What I can say is that over the past 30 years, wind storms have become less frequent in the corridor from Golden to Boulder and Lyons, and their magnitudes have not been as strong,” says Paul Schlatter, science and operations officer at the National Weather Service in Boulder.
Thirty years ago, he explains, the Boulder area averaged 8.5 days a year of at least one gust hitting 75 mph. That has declined to 5.5 days per year.
“That is just a fascinating drop,” Schlatter says.
A dearth of records
Scientists have ideas about what’s happening. NCAR scientists are producing two research papers under the title of “Earth, Wind and Fire: Are Boulder’s Hurricane-Force Winds Changing?”
Making their work somewhat easier would be longer-term records. Precipitation is relatively easy to measure and across a broad area, says Schumacher. Temperature also presents a lesser challenge: “Even if you don’t have thermometers everywhere all the time, you can pretty robustly piece together data from where you do have thermometers to generate a good climate record,” he says.
With wind, it’s different.
“You need a lot more measurements to get a good sense of what’s happening with wind than with temperature, and we didn’t really have that until recent years,” Schumacher says. “We have had much denser networks of weather stations since the mid-1990s.”

The best, long-term records in the Boulder area began only in 1967, when an anemometer was installed atop NCAR’s then brand-new four-story laboratory at the foot of the Flatirons. Even there, the record is marginal. For several decades, the results were not saved: Official records have only been kept since 1996.
Pre-1990s, wind measurements were recorded at NCAR on strip charts. Typically, after a big wind event, a reporter from the Boulder Daily Camera would call to get a measurement, after which the charts were routinely discarded by the researchers.
When a team of scientists decided years later that a longer record would be useful, they turned to the Daily Camera archives to locate the maximum wind gusts of the ’60s, ’70s and ’80s. It’s a little bit like a chef going to a fast-food restaurant for tips on recipes.
A windy history
Anecdotal evidence of severe windstorms abounds. A slate-roof tower on Old Main, the first building on CU Boulder’s campus, was toppled by wind shortly after its construction, according to the 1999 book Boulder County: An Illustrated History. (The architect designed a sturdier brick structure with a lighter roof that opened two years later.)
In November 1869, Boulder County News reported that a large frame building being constructed on Pearl Street had been leveled. In what was likely the same 1869 wind storm, Golden had several roofs blown off and two houses destroyed.
Farther up Clear Creek, Georgetown experienced even worse. “An awful and destructive windstorm, with savage violence came plunging down the mountains about four o’clock this morning and continued to rage with unabated violence during most of the day,” said the Georgetown Miner. One small girl was killed when the timbers of a house fell, while others had legs and arms broken and dislocated.
A century later, an IBM employee who was a volunteer firefighter at the Cherryvale department was blown off a firetruck and to his death in a January 1969 wind event. The Daily Camera reported that the storm’s extreme gusts of up to 130 mph resulted in loss of electricity to 30% of the city’s 10,000 homes.
Maximum gusts of 115 mph were recorded later in the year, then again in January and February of 1970. In January 1972, an even stronger gust was recorded: 142 mph. One decade after that, a windstorm damaged an estimated 40% of the structures in Boulder. Two gusts of 137 mph were recorded, and many more of 120 mph.
Amid the mayhem of the late ’60s and early ’70s, Gerald Meehl began hanging out at NCAR as an undergraduate student assistant. Today, he’s a senior scientist there.
Meehl can remember windier times. The January 1982 windstorm stands out in his mind.
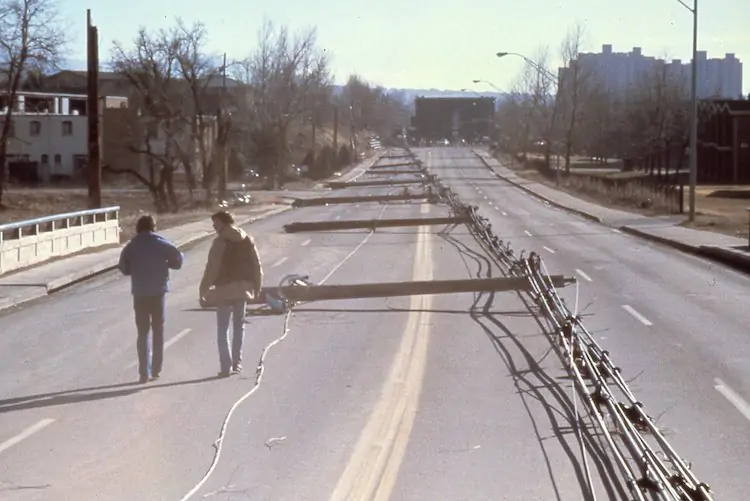
“I drove around the morning after that windstorm and took photos,” he says. “The damage was unbelievable. I mean, houses were blown apart, roofs were blown off. There was a lot of structural damage. Many trees were blown over, power lines blown down all along 30th Street, the poles snapped off and blocked traffic. It was a mess.”
Peter Pollock, who later became a planning director in Boulder, arrived in 1978, commuting to a job at the National Renewable Energy Laboratory in Golden. “I got a good feel for Boulder winds early,” he remembers. Driving Highway 93 across Rocky Flats was notoriously treacherous.
One evening, the wind sent an element of a chimney crashing through the picture window of his Boulder apartment, spewing glass across the carpet.
New record spurs research
NCAR’s current research was spurred by a report in February 2016. A new anemometer at Wolf Creek Pass, in the San Juan Mountains of southwestern Colorado, recorded a wind speed of 148 mph. That dubious superlative bested the 147 mph measurement at NCAR’s Mesa Lab in 1972. (A wind speed of 201 mph was recorded by temporary equipment on Longs Peak in 1981, but for unclear reasons, it is described as an unofficial record).
“That got us thinking: We just don’t seem to see those kinds of windstorms anymore” in Boulder, says Meehl. “And it turns out we were right.”
One possibility is that building codes have been beefed up, resulting in less damage than 50 years ago. Trees have become bigger, which may be blunting the blow.
“But the climate change piece is the interesting one,” says Meehl. “And it looks like the winds definitely have become weaker. If you look at anemometer reports of those up and down the Front Range, they don’t provide a continuous record before the ’90s. But they do show a decrease in the number of strong wind events just from those in Jefferson, Boulder and Larimer counties.”
Colorado’s dry, relatively warm downslope mountain winds are called foehn winds, and they occur on the lee (downwind) side of mountain ranges in the Alps, New Zealand and many other places in the world. In North America, we call them Chinooks, after the Indigenous people who lived near the Pacific Ocean along the lower Columbia River.
“Anywhere you have a north-south oriented mountain range where the prevailing wind is from the west,” says Meehl, “you’re going to get these down-slope winds.”

A general rule is that the steeper the slopes, the stronger the potential winds. Boulder lies closer to the high peaks than any other part of the Great Plains in Colorado. From North Arapaho Peak and others of the Indian Peaks, elevations drop 8,000 feet in just 18.5 miles.
How can the warming climate explain the lessened severity and frequency of Boulder’s winds? Winds higher up in the atmosphere have shifted. A layer of warmer air that used to sit at 15,000 to 20,000 feet has gone even higher. This cap of warm air is rising, like a window being opened. That leaves a wider gap: a raised window results in less of a hurry for the wind to come across the mountains and down the slopes to wreak havoc in Boulder.
Climate change has also made wind shear greater. Wind shear is the sudden change in wind speed, wind direction or both over a short distance in height above the ground. The strong winds in the atmosphere at 15,000 to 18,000 feet altitude have become stronger, while those closer to the Earth’s surface have not. Any increase in wind shear at that height above the Rocky Mountains west of Boulder means the formation of mountain waves — and thus strong downslope winds — are less likely to occur.
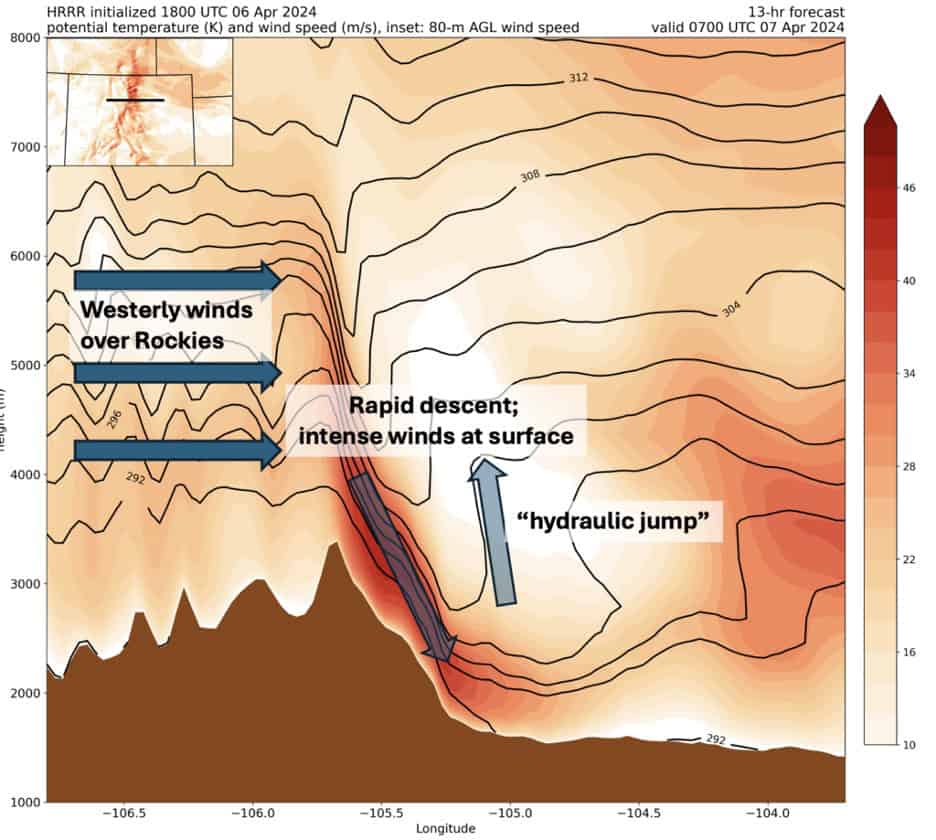
A mountain wave is essentially just like a wave of water, flowing over the top of a giant boulder. The water rises up over the boulder and accelerates quickly on the downstream side, forming a wave that breaks on top of itself. The atmosphere does the same thing: the Rocky Mountains are the boulder, or obstacle in the flow, and Boulder is where the wave of air crashes to the surface. That’s why the wind in Lafayette or Longmont — being farther from the mountains — is generally less strong.
Strong wind shear in the 15,000- to 18,000-foot layer prevents the mountain wave from ever forming, allowing the energy from the wind flowing over the Rockies to harmlessly dissipate in the middle and upper atmosphere, rather than the populated cities in the lee of the Rockies.
If this sounds complex, that’s because it is. Meehl says NCAR researchers continuine modeling work in an attempt to pin down more precisely the changes that would explain lesser winds.
Bottom line, says Schlatter of the National Weather Service, is that if the temperature inversions formed by the warm layer in the atmosphere aren’t as strong or located at the right altitudes, the conditions will be less favorable for the downslope winds that afflict Boulder. Increasing wind shear in the same area of the atmosphere also is likely reducing the frequency and severity of those high-wind events.
In terms of wind speeds, those that produced the Marshall Fire of December 2021 were stronger than those of the April 6-7 storm. But the duration of this year’s winds – about 30 h0ours — was truly impressive, says Schlatter.
Also unusual about this most recent bluster was the geographic spread of high winds. The strongest were, as usual, in and along the Front Range foothills. Anemometers at NCAR’s Mesa Lab and one along Highway 93 west of Arvada near the entrance to Coal Creek Canyon recorded gusts of above 95 mph. But the Fort Collins area had gusts of above 90 mph. And Sterling and Akron had gusts of more than 70 mph. Often, the Great Plains get wind when the Front Range does not but are spared the strong blasts.
Earth, wind and fire
In literature, wind has been described in many ways: as a cleansing force, as something of change. You talk to many people in Boulder County, though, and they describe something else.
“It jostles the inner workings of your being so much that staying present to your most basic needs is a challenge,” says Robert Castellino, a photographer who now lives in Lafayette. He was a resident of Boulder during the ’82 windstorm, and his recollections are powerful.
“You wanna duck, cover and run all at the same time,” he says. There is “nothing like the terror of 60-foot cottonwoods snapping on Boulder Creek nor the blowdown of telephone poles from Iris to Baseline on 30th.”
Terry Minger, who has spent most of the last 60 years in Boulder save for a decade as the town manager of Vail, admits to getting depressed by the relentless winds.
“Snowstorms, or other types of things, you kind of come to terms with them,” he says. “Wind takes the oxygen out of the room, dries everything out. It causes you to be a little bit on edge, a little grumpy.”