How Law Students Are Keeping a Historic Water Distribution Tradition Alive in Southern #Colorado — University of Colorado Boulder

San Luis People’s Ditch March 17, 2018. Photo credit: Greg Hobbs

Click the link to read the article on the University of Colorado Boulder website (Sarah Kuta):

March 4, 2024

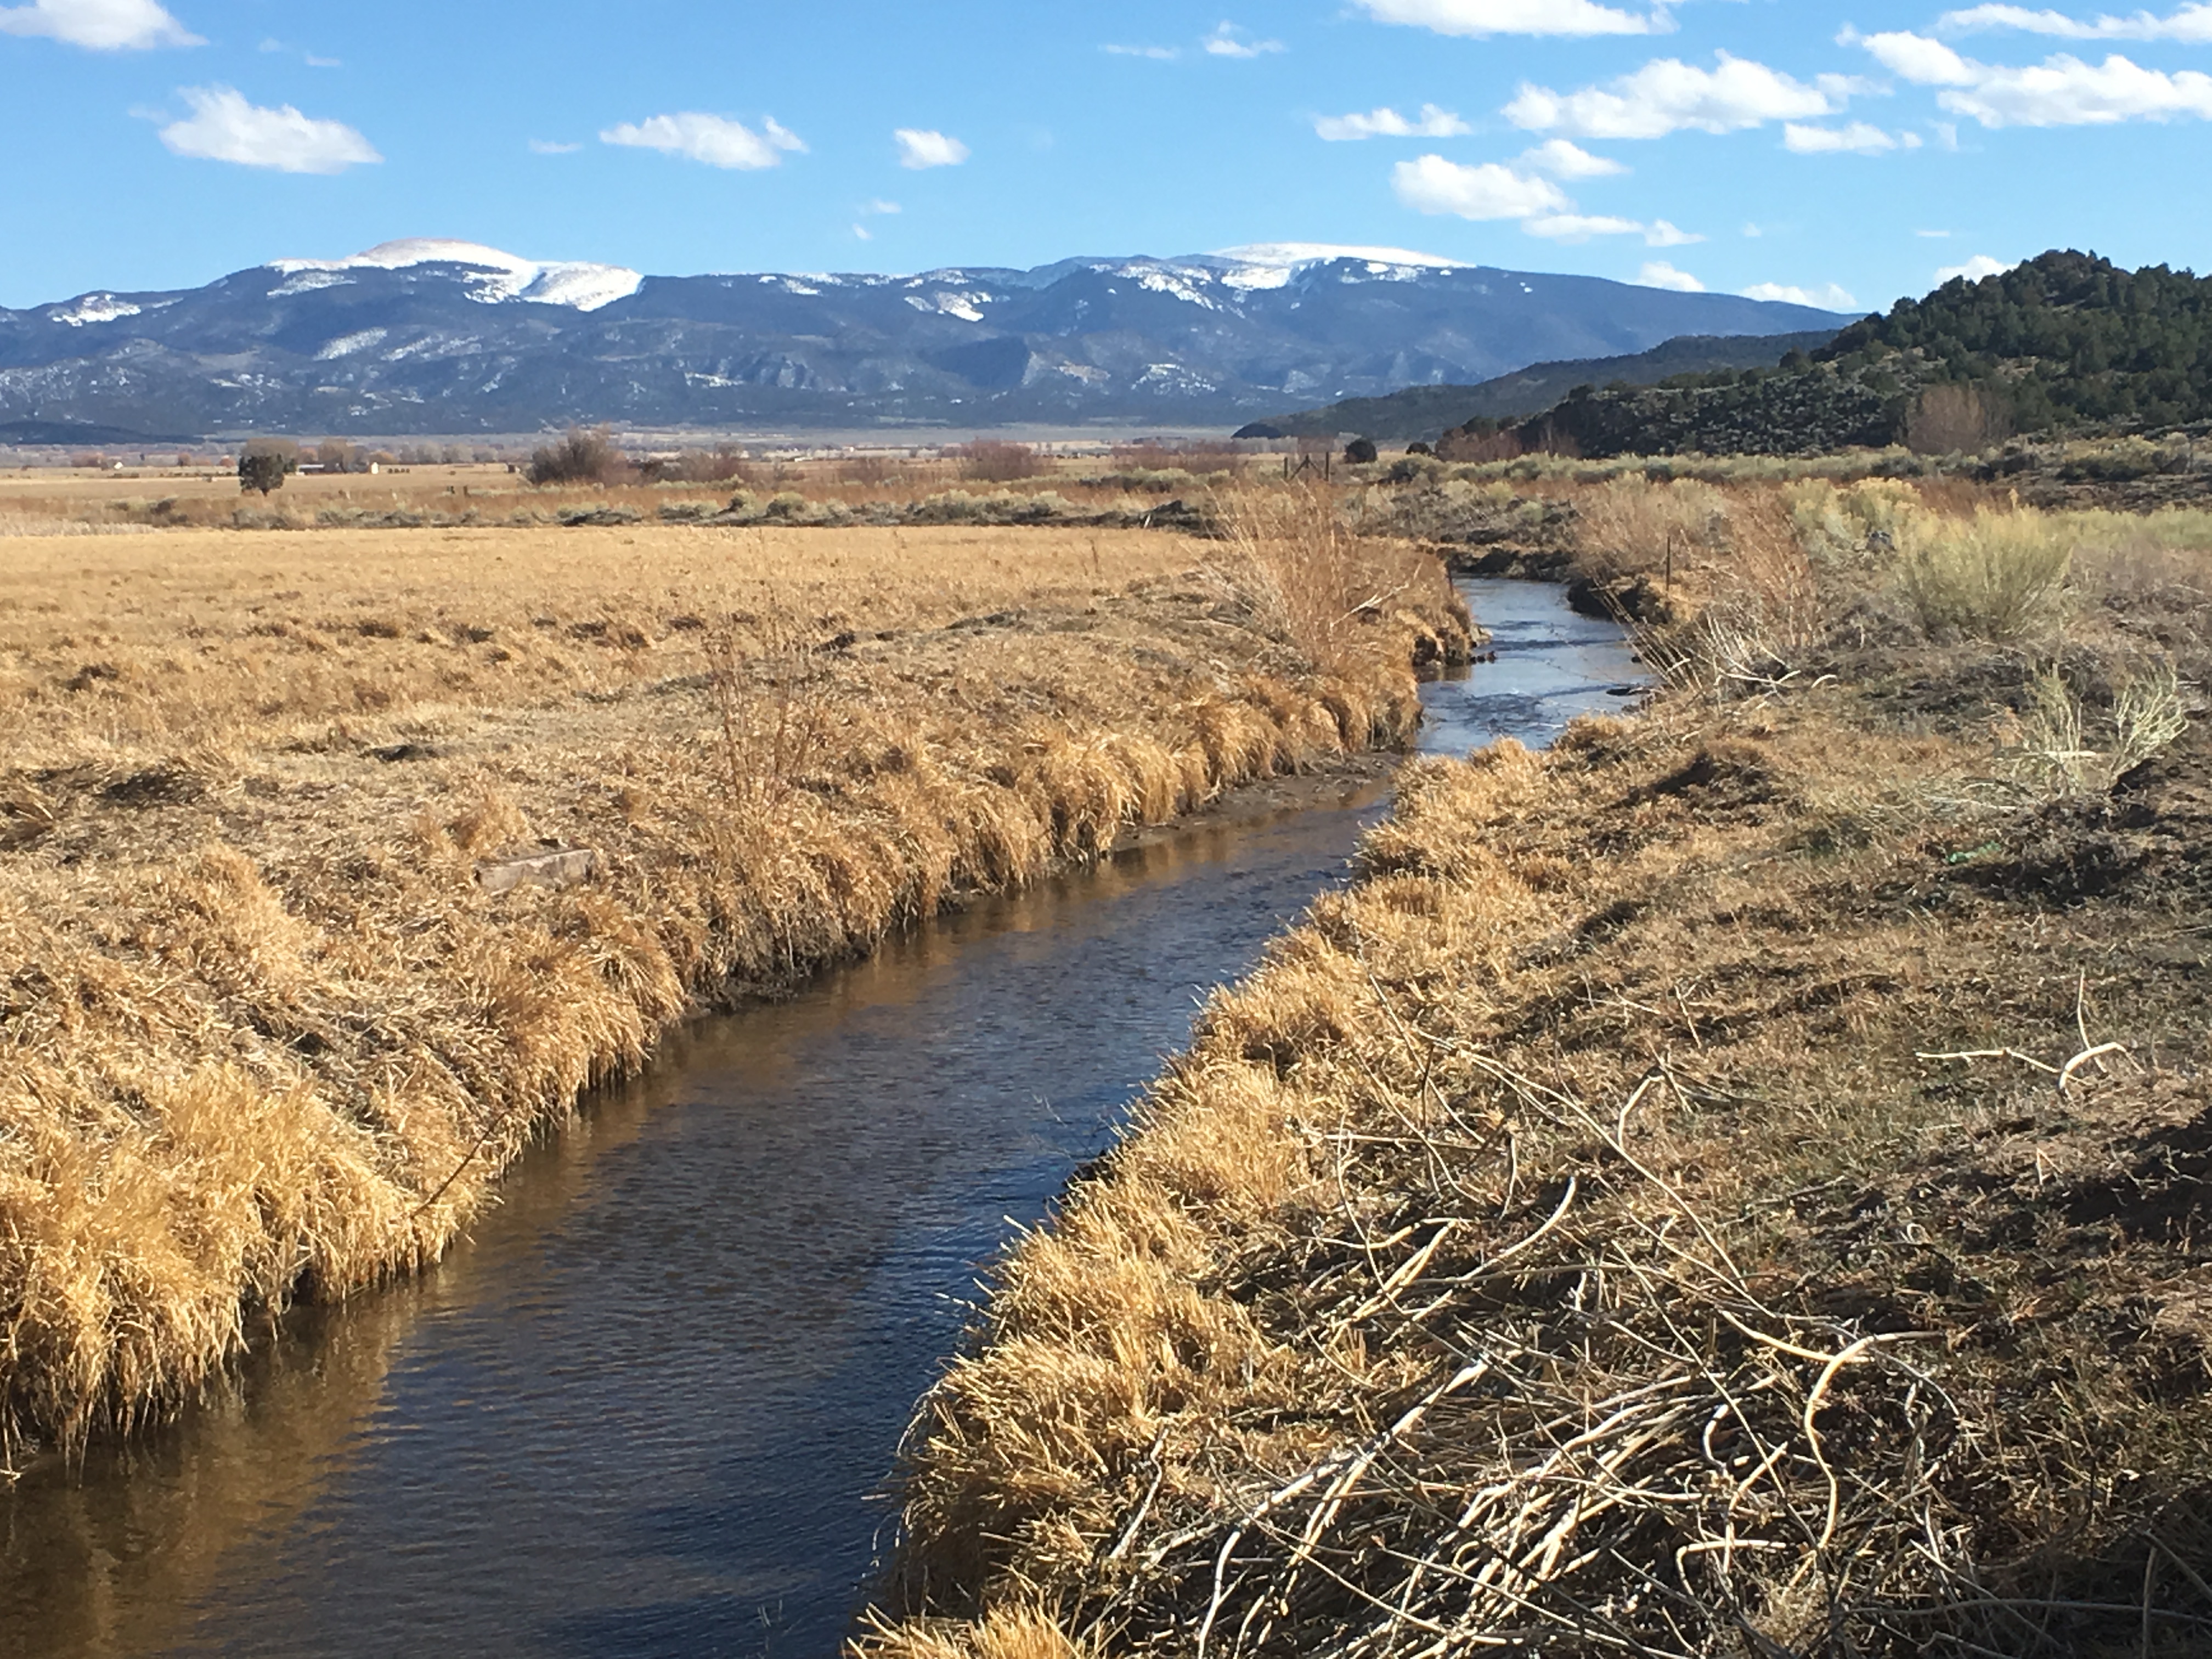
Water is vital for life in the West. In Colorado’s San Luis Valley, it’s so essential that, for generations, some communities — called acequias — have treated it as a communal resource that’s meant to be shared.

For the past decade, Colorado Law students have supported the legal needs of these communities through the Acequia Assistance Project. The initiative is a collaboration between CU Boulder’s Getches-Wilkinson Center for Natural Resources, Energy and the Environment with Colorado Open Lands, the Sangre de Cristo Acequia Association and several law firms in the state.

Through the project, law students work hand-in-hand with lawyers and professors to provide an estimated $300,000 worth of free legal services to the roughly 130 acequia communities in Colorado. 

Not only does this pro bono work help keep a historic water distribution philosophy alive, but it gives students a chance to put theory into practice — and experience how natural resources law can affect real people.

“Water in the West is at a critical point right now, where climate scientists are predicting increased aridication in Colorado, which will likely result in less water,” said Mary Slosson (Law’24), one of the project’s student deputy directors. “It’s one thing to study these problems from a legal standpoint in the classroom, but it’s entirely another thing to talk about climate change with a small family farmer while walking their land.”

Acequia means “water bearer” in Arabic. The practice — which centers on a network of irrigation channels — originated in Northern Africa, then spread to Europe during the Middle Ages. From there, the Spanish brought the concept to the New World, where it took hold in Mexico and what is present-day New Mexico and Colorado.

But an acequia represents much more than just the physical infrastructure: It’s a way of life. In acequia communities, water is divvied up as equitably as possible — and landowners pitch in to help maintain the ditches.

This philosophy stands in stark contrast to the way water is distributed elsewhere in Colorado. The state’s water laws are based on “prior appropriation,” which means that whoever has the oldest water rights gets first dibs on water, according to Gregor MacGregor (IntlAf’12; Law’19), who participated in the project as a law student and now serves as its director. In times of scarcity, this approach — also known as “first in time, first in right”— means there may not be enough water for those with the youngest water rights, he added.

“In an acequia system, there aren’t shares — it’s one landowner, one vote,” said MacGregor. “The way they allocate water is more personal and values-driven. People on the acequia system are tied to the water and the land.”

For more than a century, Colorado’s legal framework did not recognize acequias. But in 2009, the state legislature passed a law that allowed acequias to incorporate while continuing to operate in their traditional way. To help acequias take advantage of this new recognition, Peter Nichols (MPubAd’82; Law’01) launched the project with Colorado Law professor Sarah Krakoff in 2012. 

“The fact that we have this population that was more or less ignored for 150 years is a huge environmental justice issue,” said MacGregor. “This is a great way to use our very particular set of skills to right the wrongs of the past in a very meaningful way that empowers these communities to chart their own future.”

Law students help acequia communities by drafting bylaws and governance documents, representing them in water court and negotiating the sale of water rights. They also conduct extensive research to help acequias incorporate, as they did with the historic Montez Ditch in San Luis, Colorado.

“The Acequia Project has become part of our community,” said Charlie Jaquez, a former Montez Ditch commissioner whose ancestors were some of the original settlers of San Luis in 1851. “They have been very, very helpful — and very generous. Especially in areas like Conejos and Costilla counties, these communities just do not have a whole lot of money. The ditch would’ve just kept on going the way we did before, decade after decade, but now it’s been placed on solid legal footing.”

The U.S. #Drought Monitor is a critical tool for the arid West. Can it keep up with #ClimateChange? — The Los Angeles Times #aridification

Click the link to read the article on The Los Angeles Times website (Hayley Smith). Here’s an excerpt:

June 3, 2024

Backed by data on soil moisture, temperature, snow cover, meltwater runoff, reservoir levels and more, the map has become an essential instrument for determining the outlook of water supplies, declaring drought emergencies and deciding where and when government aid should be distributed, among other things.

But this critical diagnostic tool is also struggling to keep pace with climate change as longer and more persistent dry spells plague the American West and take an increasing toll on groundwater reserves and the Colorado River, according to a recent study published in the journal AGU Advances. One problem, researchers say, is that the monitor was launched just as one of the driest periods in the history of the Southwest began, and it has never been adjusted for the region’s growing aridity

“The product is essential, but it is also undoubtedly, in my opinion, being influenced by climate change,” said Justin Mankin, one of the study’s authors and an associate professor of geography at Dartmouth. “And we in the drought community need to have a conversation about what it looks like to think about drought monitoring in the context of an aridifying climate.”

US Drought Monitor map June 18, 2024.

The monitor does provide an accurate and reliable snapshot of what’s happening in the climate system at a given moment, including a mixture of global warming and La Niña conditions that contribute to drought conditions in the American Southwest, the study found. But its introduction happened to coincide with the start of a multi-decadal period of dryness in the West, including the region’s driest 22 years in at least the last 1,200 years, sometimes referred to as a megadrought. During that period, some parts of California experienced exceptional drought — the worst of five possible categories — nine times more often than they should have, according to the drought monitor’s probability. The areas were in that category 18% of the time — or for a period of nearly four years — compared with the normal benchmark of 2%, the study found. The findings raise questions about how the familiar assessment can best address long-term trends, and whether a product designed for periodic anomalies can accurately capture a much larger, slower-moving crisis.

2024’s violent tornado season has been one of the most active on record − a meteorologist explains the weather behind the outbreaks

Juana Landeros and her husband and 9-year-old son survived a deadly tornado in Valley View, Texas, on May 26, 2024. AP Photo/Julio Cortez

William Gallus, Iowa State University

Spring 2024 was unnerving for people across large parts of the U.S. as tornado warnings and sirens sent them scrambling for safety.

More than 1,100 tornadoes were reported through May − a preliminary number but nearly twice the 30-year average at that point and behind only 2011, when deadly tornado outbreaks tore across the southeastern U.S.

The U.S. experienced several multistate outbreaks in 2024. Tornadoes damaged homes from Texas to Minnesota and east to West Virginia and Georgia. They caused widespread destruction in several towns, including Greenfield, Iowa; Westmoreland, Kansas; and Bartlesville, Oklahoma. Barnsdall, Oklahoma, was hit twice in two months.

In May, at least one tornado occurred somewhere in the country almost every day. https://www.youtube.com/embed/ZSx73rlJh6E?wmode=transparent&start=0 Greenfield, Iowa, after a powerful EF4 tornado cut through the city on May 21, 2024, amid a deadly tornado outbreak.

What causes some years to have so many tornadoes? I’m a meteorologist who studies tornadoes and thunderstorms. Here’s what created the perfect conditions for these violent storms.

2 key tornado ingredients, on steroids

The hyperactive season has been due to an abundance of two key ingredients for tornadoes: wind shear and instability.

The jet stream − a band of strong upper-level winds that mostly blows west to east, flowing between warm air to its south and cool air to its north − plays an important role in how and where weather systems evolve, and in wind shear.

During April and May 2024, the jet stream often dipped southward in the western U.S. before turning back to the northeast across the Plains. That’s a pattern favorable for producing tornadoes in the central U.S.

A US map shows warm moist air rising from the Gulf of Mexico, the jet stream bending northward into the Great Plains, Tornado Alley from Texas to South Dakota and into Iowa, and cold air to the north and warm air to the south.
The region historically considered Tornado Alley and some of the influences that can fuel tornado weather. The red curved line indicates a warm front east of the jet stream. NOAA

In the area east of the jet stream’s southern dip, air rises. That creates a strong low-pressure system, which causes winds near the ground to blow from a different direction than winds higher up, contributing to wind shear.

Making this year even more active, persistent record heat waves were common over Mexico and Texas, while the Rockies and far northern United States stayed cool. The sharp temperature difference created a stronger jet stream than normal, leading to strong changes in wind speed with elevation. As a result, wind shear has been on steroids.

The change in wind speed with elevation can cause air to have a rolling motion. The rapidly rising air in a thunderstorm can then tilt the rolling motion to create a spinning thunderstorm that can concentrate the spin into a tornado.

The Gulf of Mexico was also much warmer than normal, producing abundant heat and moisture that could be transported northward to fuel thunderstorms. That creates atmospheric instability, the other key ingredient for tornadoes.

Chart shows 2024 tornado reports well above the 15-year mean and only below 2011. It's just above 2019 numbers.
National Weather Service

El Niño’s weakening was a warning

This perfect combination of ingredients for tornadoes wasn’t a complete surprise.

El Niño and La Niña – opposing climate patterns centered in the Pacific Ocean – can affect winds and weather around the world. A 2016 study found that when El Niño is shifting to La Niña, the number of tornadoes in the central Plains and Upper Midwest is often larger than normal.

That’s exactly what was happening in spring 2024. The tornadoes mostly occurred in the traditional Tornado Alley, from northern Texas to South Dakota, with an extension across the Corn Belt through Iowa and as far east as Ohio, matching the findings of that study. https://www.youtube.com/embed/nOZhWaKy0uw?wmode=transparent&start=0 How El Niño and La Niña influence tornado behavior.

How is tornado activity changing?

The active spring in the Great Plains was a bit unusual, however. Studies show a long-term trend of decreasing tornado numbers in this region and an increase in tornadoes farther east, near or just east of the Mississippi River.

That shift is consistent with what climate models suggest is likely to happen throughout the remainder of the century as global temperatures rise.

A U.S. map shows the greatest activity over the Southeast, particularly Louisiana and Alabama.
a map showing the average number of days per year with a tornado registering EF1 strength or greater within 25 miles of each point shows Tornado Alley’s shift eastward. The period covered in 1986 to 2015. NOAA Storm Prediction Center

The expected decline in the number of tornadoes in the Plains is likely related to increasing heat over the high ground of the desert Southwest and Mexico. That heat flows over the Great Plains a few thousand feet above ground, creating a cap, or lid. The cap lets heat and moisture build up until it punches through to form a thunderstorm. This hot, moist air is why the central U.S. is home to the most violent tornadoes on Earth.

One theory is that, with climate change, the cap will likely be harder to break through, reducing the number of tornadoes in the Plains. At the same time, increasing heat and moisture elsewhere will fuel more tornadoes in the East.

Long-term trends and climate model predictions also suggest that more tornadoes are occurring during the cooler months, particularly in the Southeast. Tornadoes are also occurring on fewer days each year, but on the days when they do form, there is more likely to be an outbreak with several tornadoes

William Gallus, Professor of Atmospheric Science, Iowa State University

This article is republished from The Conversation under a Creative Commons license. Read the original article.

During a year of extremes, carbon dioxide levels surge faster than ever: The two-year increase in Keeling Curve peak is the largest on record — NOAA

Atmospheric carbon dioxide measured at NOAA’s Mauna Loa Atmospheric Baseline Observatory peaked in May 2024 at a monthly average of 426.9 parts per million, establishing another high mark in the 66-year record of observations on the Hawaiian volcano. Credit: NOAA

Click the link to read the article on the NOAA website (Theo Stein):

June 6, 2024

Carbon dioxide is accumulating in the atmosphere faster than ever — accelerating on a steep rise to levels far above any experienced during human existence, scientists from NOAA and the Scripps Institution of Oceanographyoffsite link at the University of California San Diego announced today.

This graph shows the full record of monthly mean carbon dioxide measured at Mauna Loa Observatory, Hawaii. The carbon dioxide data on Mauna Loa constitute the longest record of direct measurements of CO2 in the atmosphere. They were started by C. David Keeling of the Scripps Institution of Oceanography in March of 1958 at the NOAA Weather Station on Mauna Loa volcano. NOAA started its own CO2 measurements in May of 1974, and they have run in parallel with those made by Scripps since. (Image credit: NOAA Global Monitoring Laboratory)
CO2 measurements sending ominous signs

Scientists at Scripps, the organization that initiated CO2 monitoring at Mauna Loa in 1958 and maintains an independent record, calculated a May monthly average of 426.7 ppm for 2024, an increase of 2.92 ppm over May 2023’s measurement of 423.78 ppm. For Scripps, the two-year jump tied a previous record set in 2020.

From January through April, NOAA and Scripps scientists said COconcentrations increased more rapidly than they have in the first four months of any other year. The surge has come even as one highly regarded international reportoffsite link has found that fossil fuel emissions, the main driver of climate change, have plateaued in recent years.

“Over the past year, we’ve experienced the hottest year on record, the hottest ocean temperatures on record and a seemingly endless string of heat waves, droughts, floods, wildfires and storms,” said NOAA Administrator Rick Spinrad, Ph.D. “Now we are finding that atmospheric CO2 levels are increasing faster than ever. We must recognize that these are clear signals of the damage carbon dioxide pollution is doing to the climate system, and take rapid action to cut fossil fuel use as quickly as we can.” 

Ralph Keeling, director of the Scripps COprogram that manages the institution’s 56-year-old measurement series, noted that year-to-year increase recorded in March 2024 was the highest for both Scripps and NOAA in Keeling Curve history. 

“Not only is CO2 now at the highest level in millions of years, it is also rising faster than ever,” said Keeling. “Each year achieves a higher maximum due to fossil-fuel burning, which releases pollution in the form of carbon dioxide into the atmosphere. Fossil fuel pollution just keeps building up, much like trash in a landfill.” 

These graphs compare the rise of atmospheric carbon dioxide (CO2) in Mauna Loa and global records.The decadal average rate of increase of CO2 in the graphs on the right are depicted by the black, horizontal lines. (Image credit: NOAA Global Monitoring Laboratory)
Like a giant heat-trapping blanket

Like other greenhouse gases, COacts like a blanket in the atmosphere, preventing heat radiating off of the planet’s surface from escaping into space. The warming atmosphere fuels extreme weather events, such as heat waves, drought and wildfires, as well as heavier precipitation and flooding. About half of the carbon dioxide humans release into the air stays in the atmosphere. The other half is absorbed at Earth’s surface, split roughly equally between land and ocean.

The record two-year growth rate observed from 2022 to 2024 is likely a result of sustained high fossil fuel emissions combined with El Nino conditions limiting the ability of global land ecosystems to absorb atmospheric CO2, said John Miller, a carbon cycle scientist with NOAA’s Global Monitoring Laboratory. The absorption of CO2 is changing the chemistry of the ocean, leading to ocean acidification and lower levels of dissolved oxygen, which interferes with the growth of some marine organisms.

A longstanding scientific partnership

For most of the past half century, continuous daily sampling by both NOAA and Scripps at Mauna Loa provided an ideal baseline for establishing long-term trends. In 2023, some of the measurements were obtained from a temporary sampling site atop the nearby Mauna Kea volcano, which was established after lava flows cut off access to the Mauna Loa Observatory in November 2022. With the access road still buried under lava, staff have been accessing the site once a week by helicopter to maintain the NOAA and Scripps in-situ CO2 analyzers that provide continuous CO2 measurements. 

Scripps geoscientist Charles David Keeling initiated on-site measurements of CO2 at NOAA’s Mauna Loa weather station in 1958. Keeling was the first to recognize that CO2 levels in the Northern Hemisphere fell during the growing season, and rose as plants died in the fall. He documented these CO2 fluctuations in a record that came to be known as the Keeling Curveoffsite link. He was also the first to recognize that, in addition to the seasonal fluctuation, CO2 levels rose every year. 

NOAA climate scientist Pieter Tans spearheaded the effort to begin NOAA’s own measurements in 1974, and the two research institutions have made complementary, independent observations ever since. 

While the Mauna Loa Observatory is considered the benchmark climate monitoring station for the northern hemisphere, it does not capture the changes of CO2 across the globe. NOAA’s globally distributed sampling network provides this broader picture, which is very consistent with the Mauna Loa results. 

The Mauna Loa data, together with measurements from sampling stations around the world, are incorporated into the Global Greenhouse Gas Reference Network, a foundational research dataset for international climate scientists and a benchmark for policymakers attempting to address the causes and impacts of climate change.

US Supreme Court will review nixing of #Utah oil-train project that drew #Colorado opposition — Colorado Newsline #ColoradoRiver #COriver #ActOnClimate

A train of tanker cars travels the tracks along the Colorado River near Cameo on May 16, 2023. (Chase Woodruff/Colorado Newsline)

Click the link to read the article on the Colorado Newsline website (Chase Woodruff):

June 24, 2024

The U.S. Supreme Court on Monday accepted a last-ditch appeal from the backers of a controversial oil-by-rail project in eastern Utah, agreeing to review a lower-court ruling that sided with a Colorado county and environmental groups who accused federal regulators of failing to adequately analyze the proposal’s downstream risks.

In an August 2023 ruling, the U.S. Court of Appeals for the D.C. Circuit found that the Surface Transportation Board’s approval of the 88-mile Uinta Basin Railway contained “numerous” and “significant” violations of the National Environmental Policy Act, and ordered the STB to correct deficiencies in the project’s environmental impact statement. The Seven County Infrastructure Coalition, a group of Utah county governments backing the project, appealed the ruling to the Supreme Court in March.

In a list of case orders released Monday morning, the court issued a so-called writ of certiorari and agreed to review the case. With the Supreme Court set to enter its summer recess next week, arguments in the case, Seven County Infrastructure Coalition v. Eagle County, will be heard during the court’s next term, which begins in October.

An ambitious multibillion-dollar scheme first formally proposed in 2019, the Uinta Basin Railway aims to connect Utah’s largest oil field to the national rail network, allowing drillers there to ship large volumes of the basin’s “waxy” crude oil to Gulf Coast refineries. At an estimated capacity of up to 350,000 barrels exported per day, it would rank among the largest sustained efforts to transport oil by rail ever undertaken in the U.S., singlehandedly more than doubling the nationwide total in 2022, and causing a tenfold increase in hazmat rail traffic through environmentally sensitive and densely populated areas in Colorado.

Colorado’s Eagle County joined five environmental groups in suing the STB over its 2021 approval of the project, arguing the agency’s analysis had violated NEPA. A three-judge Court of Appeals panel agreed, directing the STB to further scrutinize downstream risks of increased oil-train traffic in Colorado, wildfire hazards, impacts on communities along the Gulf Coast and more.

“It’s disappointing the Supreme Court took up this case but the appellate court’s decision on this destructive project is legally sound and should ultimately stand,” said Wendy Park, an attorney with the Center for Biological Diversity, one of the environmental groups that sued to block the project. “The proposal for the Uinta Basin Railway cut corners from the start but federal laws are now catching up with this climate and environmental catastrophe.”

In its March 4 petition to the Supreme Court, the Seven County Infrastructure Coalition argued that the lower court’s ruling conflicted with existing case law, and that analysis of such “distant effects” would exceed the STB’s authority.

“Agencies need a manageable line to guide their NEPA studies, and this Court is now the only place to find one,” the coalition wrote.

In a reply brief, Eagle County and the environmental groups wrote that the lower court “correctly concluded the Board has authority to consider the reasonably foreseeable effects of oil production and refining that the Railway would induce.”

Keith Heaton, the Seven County Infrastructure Coalition’s executive director, told a committee of Utah lawmakers in February that while he believed the project had “a very good case before the Supreme Court,” his organization was prepared for a do-over of the NEPA process if necessary. The project is a public-private partnership between Heaton’s group, the Rio Grande Pacific Corporation and the private equity firm Drexel Hamilton Infrastructure Partners.

“Worst case scenario is we can always go back and re-do the environmental impact statement,” Heaton said.

Even with federal approval, however, critics have expressed widespread doubts about the partnership’s chances of securing the billions in financing necessary to build and operate the rail line. Backers have signaled their intent to apply for $1.9 billion in special tax-exempt infrastructure bonds that must be approved by the Department of Transportation, a move that also drawn staunch opposition from Colorado lawmakers.

“The fossil fuel industry’s insistence on a doomed project at the expense of taxpayers underscores that it’s only interested in protecting its own bottom line,” said Luis Miranda, director of the Sierra Club’s Utah chapter. “The Uinta Basin Railway threatens public health, as well as treasured landscapes and waterways. A derailment would carry immeasurable harm.”