
Click the link to read the article on The Los Angeles Times website (Hayley Smith). Here’s an excerpt:
June 3, 2024
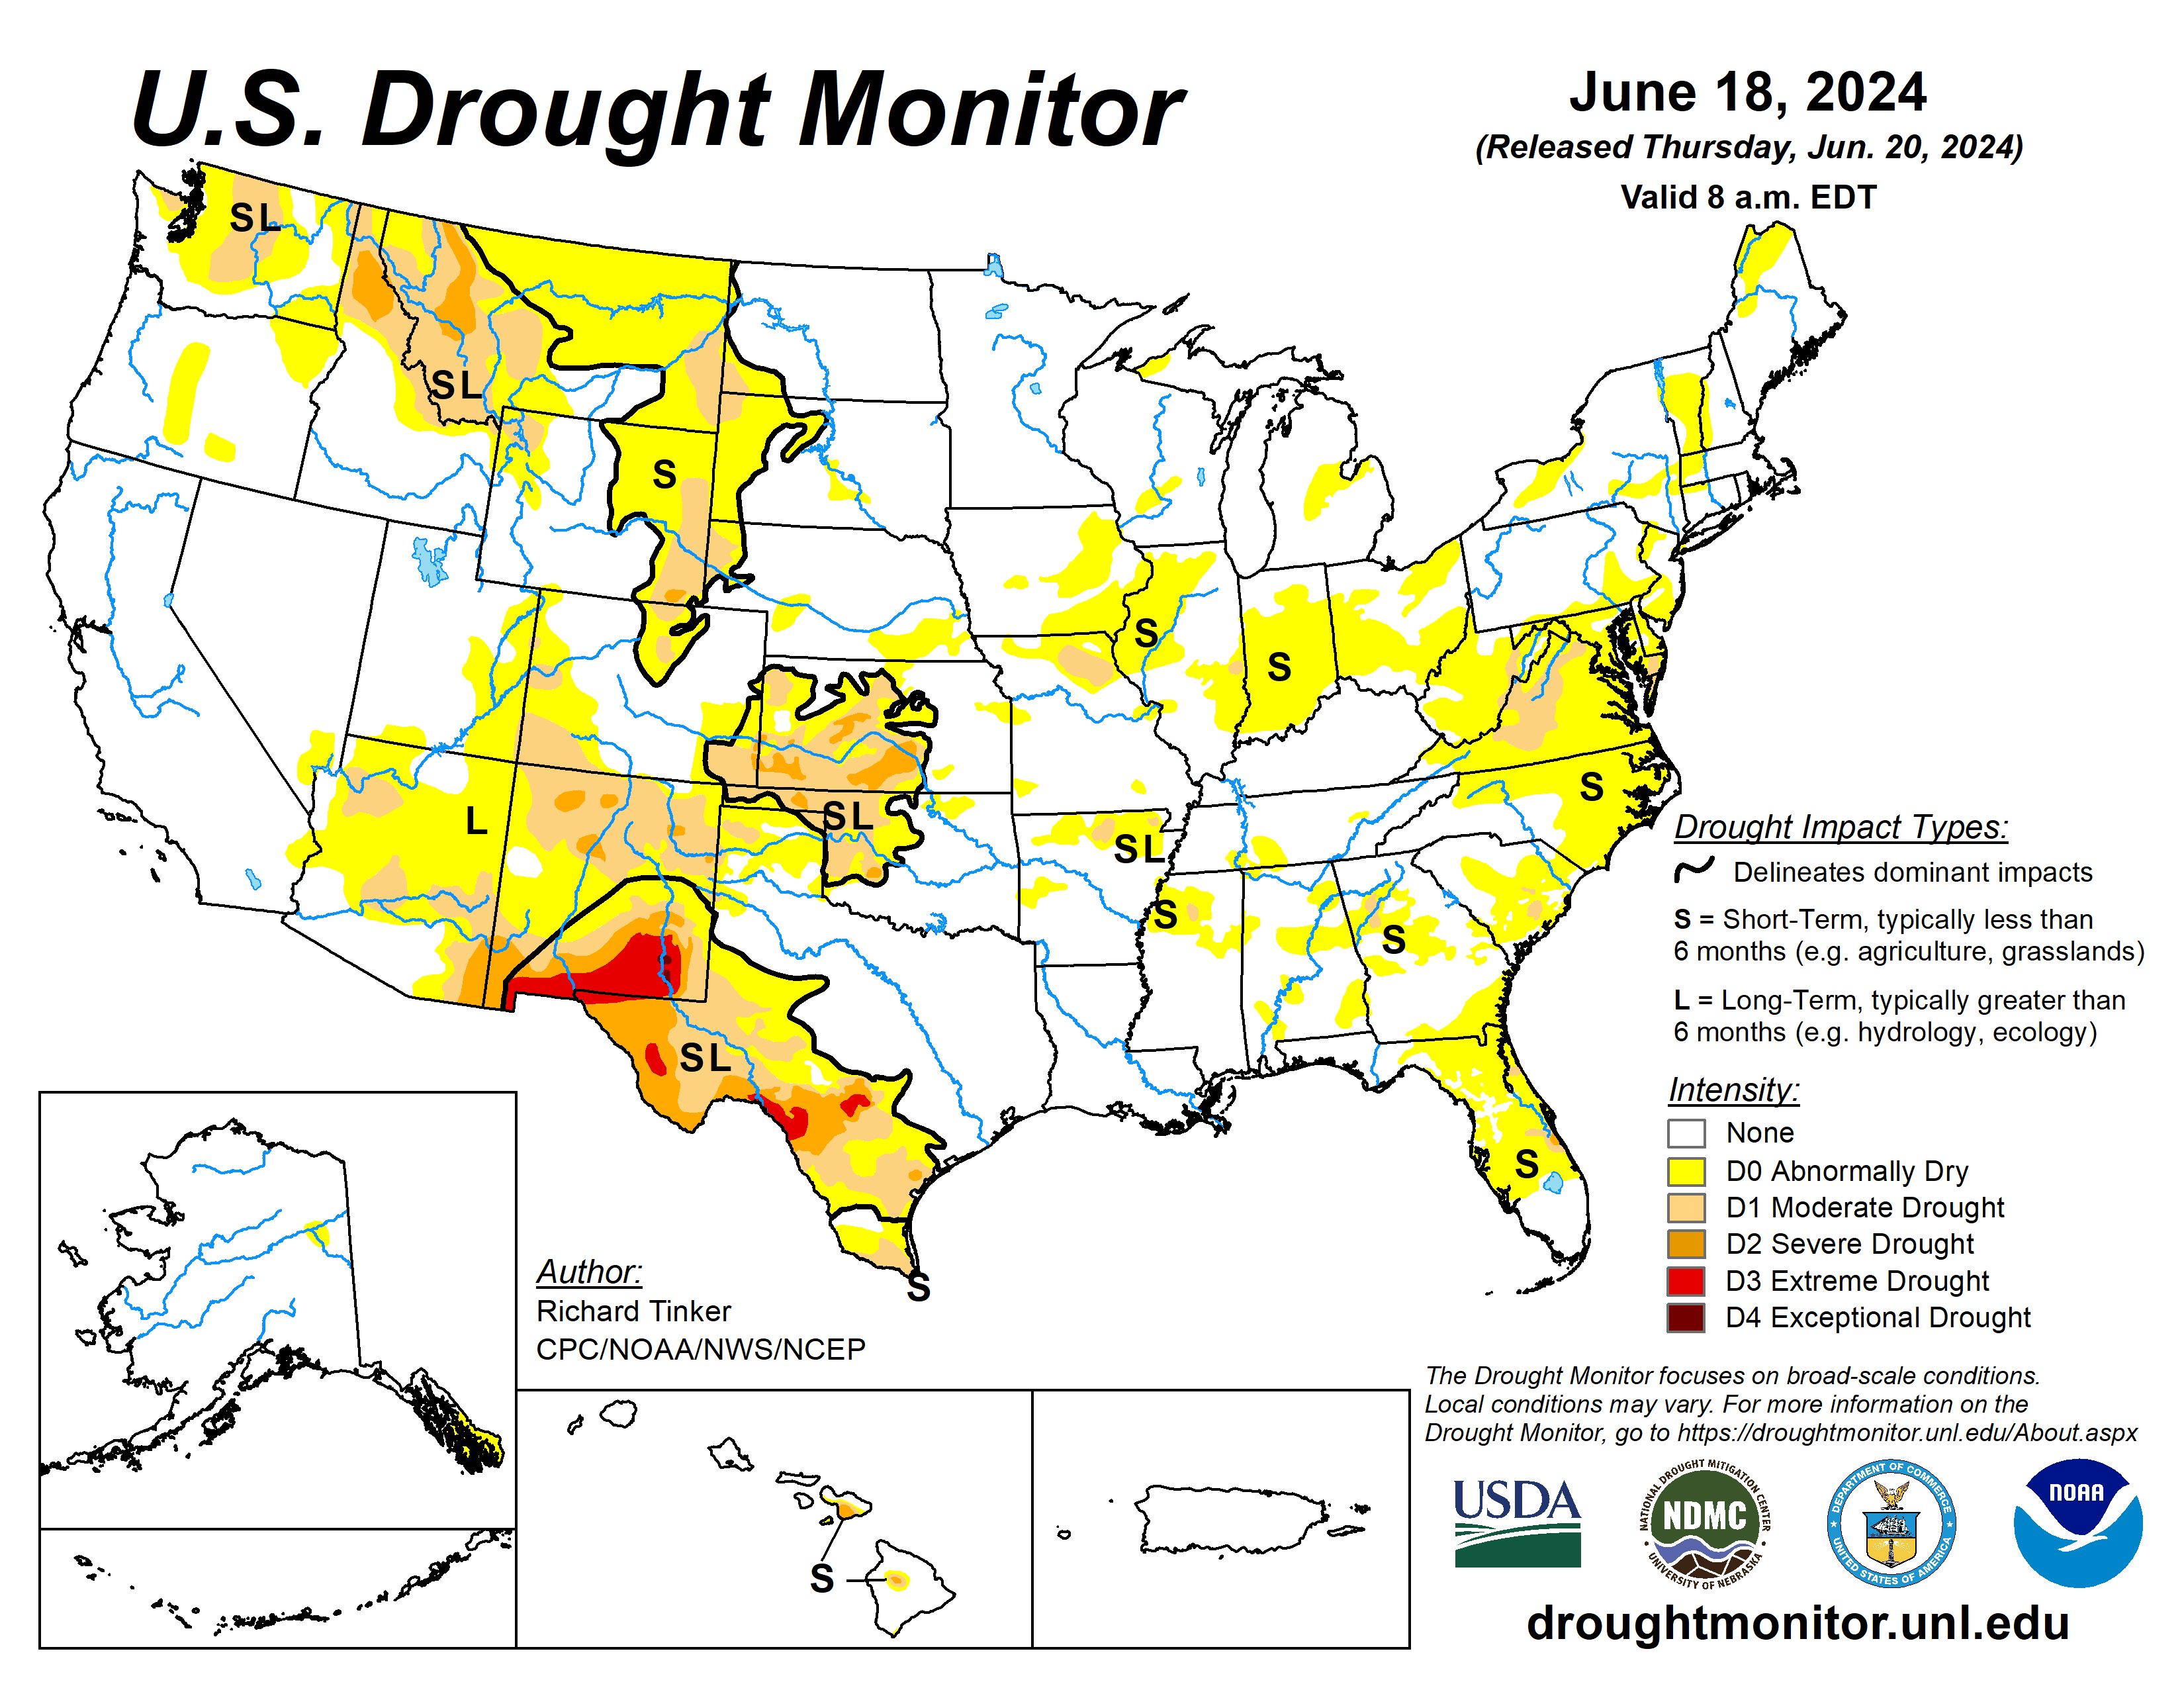
Backed by data on soil moisture, temperature, snow cover, meltwater runoff, reservoir levels and more, the map has become an essential instrument for determining the outlook of water supplies, declaring drought emergencies and deciding where and when government aid should be distributed, among other things.
But this critical diagnostic tool is also struggling to keep pace with climate change as longer and more persistent dry spells plague the American West and take an increasing toll on groundwater reserves and the Colorado River, according to a recent study published in the journal AGU Advances. One problem, researchers say, is that the monitor was launched just as one of the driest periods in the history of the Southwest began, and it has never been adjusted for the region’s growing aridity…
“The product is essential, but it is also undoubtedly, in my opinion, being influenced by climate change,” said Justin Mankin, one of the study’s authors and an associate professor of geography at Dartmouth. “And we in the drought community need to have a conversation about what it looks like to think about drought monitoring in the context of an aridifying climate.”
The monitor does provide an accurate and reliable snapshot of what’s happening in the climate system at a given moment, including a mixture of global warming and La Niña conditions that contribute to drought conditions in the American Southwest, the study found. But its introduction happened to coincide with the start of a multi-decadal period of dryness in the West, including the region’s driest 22 years in at least the last 1,200 years, sometimes referred to as a megadrought. During that period, some parts of California experienced exceptional drought — the worst of five possible categories — nine times more often than they should have, according to the drought monitor’s probability. The areas were in that category 18% of the time — or for a period of nearly four years — compared with the normal benchmark of 2%, the study found. The findings raise questions about how the familiar assessment can best address long-term trends, and whether a product designed for periodic anomalies can accurately capture a much larger, slower-moving crisis.