The health of our waters is the principal measure of how we live on the land — Luna Leopold
Global climate summary for May 2024 — NOAA
Click the link to read the article on the NOAA website:
Highlights
Temperatures were above average over much of the globe, while western North America, southern South America, and western Russia were cooler than average.
Sea surface temperatures were record warm for the 14th consecutive month.
Global tropical cyclone activity was above average, with five named storms.
May temperature
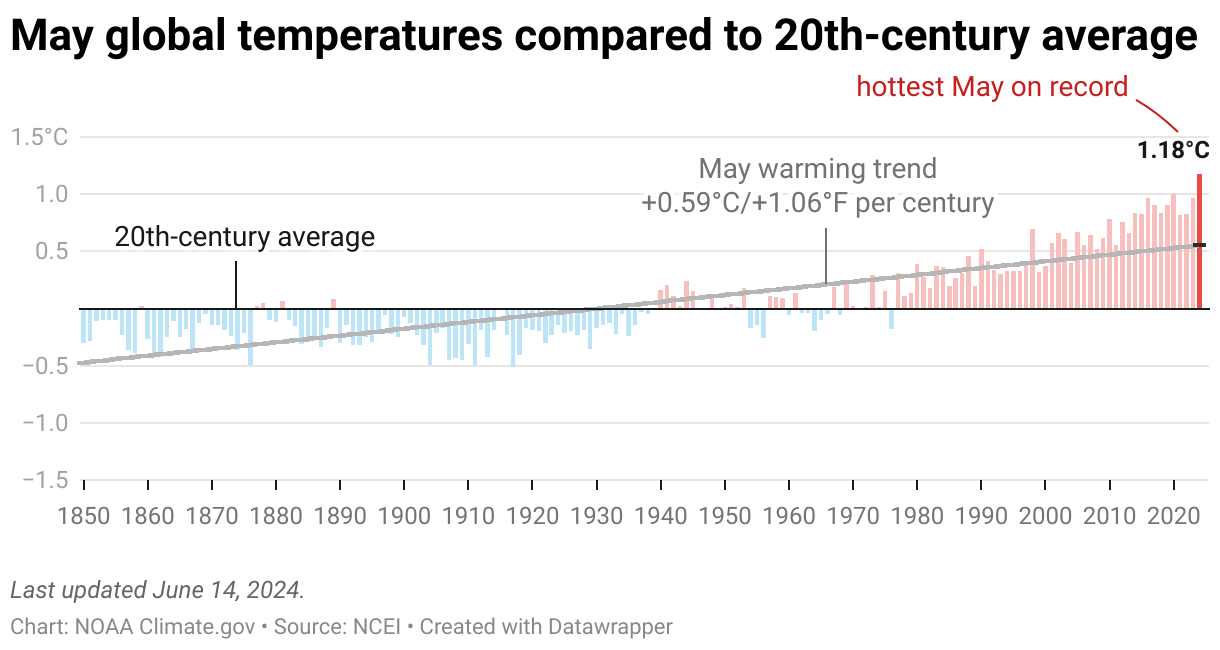
The May global surface temperature was 1.18°C (2.12°F) above the 20th-century average of 14.8°C (58.6°F), making it the warmest May on record. This was 0.18°C (0.32°F) above the previous record from May 2020. May 2024 marked the 48th consecutive May (since 1977) with temperatures at least nominally above the 20th-century average. May had a record-high monthly global ocean surface temperature for the 14th consecutive month.
Graph showing global temperature each May from 1850-2024 compared to the 20th-century average. Warmer-than-average years are red; cooler-than-average years are blue. Image by NOAA Climate.gov, based on data from NOAA National Centers for Environmental Information, created with Datawrapper.
The Northern Hemisphere also ranked as the warmest May on record at 1.44°C (2.59°F) above average. The Northern Hemisphere land temperature was also record warm in May (tied with 2020) and the ocean temperature was again record-high by a wide margin (0.25°C/0.45°F warmer than the previous record set in 2020). The Arctic region had its 11th warmest May on record.
May 2024 in the Southern Hemisphere also ranked warmest on record at 0.92°C (1.66°F) above average. The ocean-only temperature for May in the Southern Hemisphere ranked highest on record, while the land-only Southern Hemisphere temperature was 6th warmest on record. Meanwhile, the Antarctic region had its 23rd warmest May, 0.55°C (0.99°F) above average.
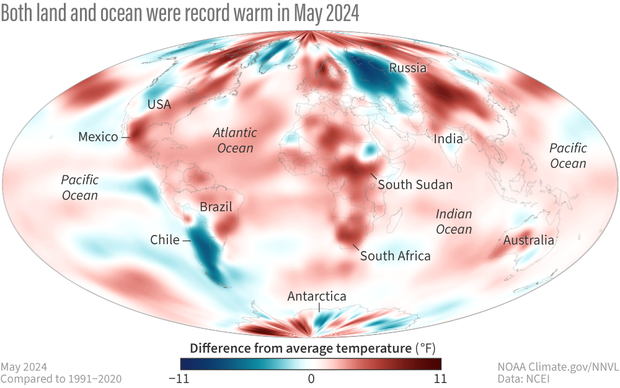
Temperatures in May 2024 compared to the 1991-2020 average. Places that were warmer than average are red; places that were cooler than average are blue. Image by NOAA Climate.gov, based on data from NOAA National Centers for Environmental Information.
Record warm temperatures covered large parts of the African continent, northern China and Mongolia, areas neighboring the North Sea, and many parts of a region stretching from southern Brazil northward through most of Mexico.
Temperatures were warmer to much-warmer-than-average across much of the Arctic, the eastern U.S. and large parts of Canada, western Europe, the eastern half of Russia, southeast Asia, and much of Australia. In northern and central India and Pakistan, where temperatures for the month as a whole were warmer to much-warmer-than-average, a severe and persistent heat wave struck during the last half of the month.
In contrast, cooler-than-average temperatures covered areas that included western parts of Russia and Kazahkstan, much of the western U.S. and Alaska, and large parts of Greenland. May temperatures were also cooler-than-average in Argentina and Chile, where a succession of polar air masses brought the strongest cold wave in more than 70 years to parts of Chile.
Across the global oceans, record warm sea surface temperatures covered much of the tropical Atlantic and large parts of the Indian Ocean and the equatorial western Pacific as well as parts of the southwest Pacific and Southern Ocean. Record warm temperatures also occurred in the North Sea and neighboring seas in the North Atlantic. Positive anomalies also covered large parts of the northern Pacific. Record-warm temperatures covered approximately 16.1% of the world’s surface this May, which was the highest percentage for May since the start of records in 1951, and 11.2% higher than the previous May record of 2016.
Near-average to cooler-than-average temperatures covered large parts of the southeast Pacific, the southwest Atlantic, areas of the southwest Indian Ocean, and parts of the Southern Ocean. Only 0.2% of the world’s surface had a record-cold May.
May precipitation from land-based stations
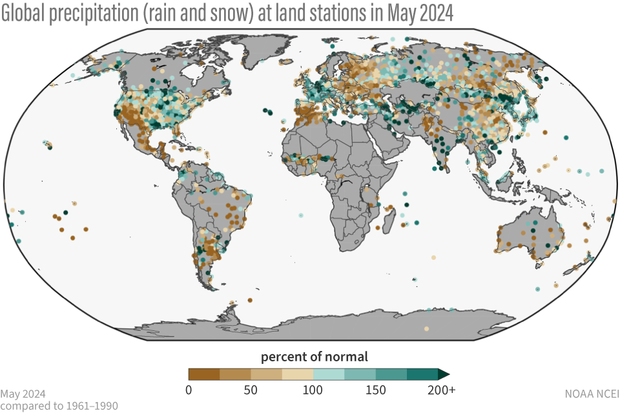
Above-average May precipitation occurred across large parts of western and central Europe, central Asia, far northeastern China, Korea, and Japan. Other wetter-than-average areas included the southern half of India, central Australia, and much of the Seychelles and Mauritius. Precipitation was below average in the southwestern U.S., Mexico, Central America, much of Brazil and Argentina, and much of eastern Europe. Other areas with widespread drier-than-average conditions included much of the United Kingdom, Spain and neighboring parts of Morocco and Algeria, northern India and neighboring Pakistan and Afghanistan, eastern China, southern and western areas of Australia, and many islands of the South Pacific.
Percent of normal precipitation for global land-based stations in May 2024 compared to a base line of 1961 to 1990. Places that received more precipitation than average are colored green; places that received less precipitation than average are colored brown. Gray areas represent missing data. Image by NOAA Climate.gov, based on data from NOAA National Centers for Environmental Information.
For information on 2024’s year-to-date temperature ranking, notable climate events, and separate statistics for Earth’s land and ocean areas see the full May 2024 monthly report from NOAA NCEI.
Satellite summary of global precipitation patterns
Headlines
The Niño 3.4 Index [the primary dataset for tracking the El Niño-Southern Oscillation climate pattern] decreased during the month to a near neutral value indicating continued transition from El Niño and this is reflected in observed anomaly patterns [depatures from average].
Tropical cyclones were active in both the North and South Indian Ocean and helped to produce the observed patterns.
North America was mainly wet in the east and dry in the west, with Mexico continuing in drought and parts of the southwest U.S. moving toward drier conditions.
Global precipitation remains high with this May setting the record high for this month of the year.