Streamflow of 2014: water year summary http://t.co/ugOL3DftrV pic.twitter.com/pcRiscgN97
— USGS (@USGS) March 31, 2015
More USGS coverage here.
Streamflow of 2014: water year summary http://t.co/ugOL3DftrV pic.twitter.com/pcRiscgN97
— USGS (@USGS) March 31, 2015
More USGS coverage here.
[FAQ] How are floods predicted? http://t.co/jc23760Cj5 pic.twitter.com/CLwj6n8gJC
— USGS (@USGS) March 23, 2015
USGS finds that endocrine-disrupting chemicals can travel far from their source: http://t.co/azqnSapfSw #GeoHealth pic.twitter.com/wa5o7amOad
— USGS (@USGS) March 16, 2015
Here’s the release from the United States Geological Survey:
Endocrine disrupting chemicals (EDCs) were transported 2 kilometers downstream of a wastewater treatment plant (WWTP) outfall in a coastal plain stream. EDCs persisted downstream of the outfall with little change in the numbers of EDCs and limited decreases in EDC concentrations.
U.S. Geological Survey (USGS) scientists measured concentrations of select EDCs approximately 10 times in water and sediment from 2009 to 2011, at five sites in the Spirit Creek watershed near Fort Gordon, Georgia, as part of an assessment of the effects of the closure of a WWTP on EDC persistence.
Sites included a control site upstream of the WWTP outfall and four other sites in the 2–kilometer reach extending downstream to Spirit Lake, into which Spirit Creek flows. A site located at the outfall of Spirit Lake was sampled once to assess the potential for EDC transport through the lake.
A modest decline (less than 20 percent in all cases) in surface-water detections of EDCs was observed with increasing distance downstream of the WWTP and was attributed to the chemicals attaching (partitioning) to the sediment. The EDCs focused on in this study included natural estrogens (estrone, 17β–estradiol, and estriol) and detergent metabolites, which exhibit estrogenic properties. Concentrations of estrogens and detergent metabolites downstream of the WWTP remained elevated above levels observed at the upstream control site, indicating that the WWTP was the prominent source of these chemicals to the stream. The mean estrogen concentrations observed downstream of the WWTP were 5 nanograms per liter and higher, a level indicative of the potential for endocrine disruption in native fish.
Estrogens were not detected in the outflow of Spirit Lake, indicating that they were diluted, partitioned to lake sediments, or were degraded within the lake through a combination of microbial processes and/or photolysis. However, detergent metabolites were detected in the outflow of Spirit Lake, indicating the potential for EDC transport downstream.
The ongoing post–closure assessment at the Fort Gordon WWTP will provide more insight into the environmental persistence of EDCs over time and the potential for stream and lake bed sediment to serve as a long–term source of EDCs in stream ecosystems.
The Fort Gordon Environmental and Natural Resources Management Office of the U.S. Army and the USGS Toxic Substances Hydrology Program provided the funding for this work.
More water pollution coverage here.
Wonder what this Magnolia Warbler sounds like? Listen to its song & 150+ others http://t.co/PYmqfe8Qxh #MusicMonday pic.twitter.com/m4IUkYWzpi
— USGS (@USGS) March 9, 2015
Certain wastewater management techniques can lead to more mercury in groundwater: http://t.co/Hr3eiswXrz #GeoHealth pic.twitter.com/WfvUwWwamj
— USGS (@USGS) March 5, 2015
Happy Birthday to us! Today, the USGS turns 136 years young. Here's the Conference Committee copy establishing USGS. pic.twitter.com/9MtSv36XPI
— USGS (@USGS) March 3, 2015

Fossil evidence for continental drift theory proposed over 100 yrs ago. http://t.co/qbrQuwwiAk #FossilFriday pic.twitter.com/FDPSPkzlsh
— USGS (@USGS) February 27, 2015
#WaterNews: New @USGS report says US ground #water polluted by farms & urban area http://t.co/vJSouavmnc @waltonwater pic.twitter.com/CJP4rA5y6R
— Circle of Blue (@circleofblue) February 12, 2015
Nat'l #Climate Change Viewer shows projected changes in climate by state, county, or HUC – http://t.co/zSYPyOz7Gd pic.twitter.com/ZX55CyWLwJ
— USGS (@USGS) February 9, 2015
Happy Birthday to William Embry Wrather (B 1883) 6th Director of the USGS 1943-1956 http://t.co/hAv6zpw9yZ pic.twitter.com/OEfkZpkGAt
— USGS (@USGS) January 20, 2015

Here’s the abstract (click through to read the report) from the United States Geological Survey:
During May–June, 2013, the U.S. Geological Survey, in cooperation with Park County, Colorado, drilled and installed four groundwater monitoring wells in areas identified as needing new wells to provide adequate spatial coverage for monitoring water quality in the South Park basin. Lithologic logs and well-construction reports were prepared for each well, and wells were developed after drilling to remove mud and foreign material to provide for good hydraulic connection between the well and aquifer. Slug tests were performed to estimate hydraulic-conductivity values for aquifer materials in the screened interval of each well, and groundwater samples were collected from each well for analysis of major inorganic constituents, trace metals, nutrients, dissolved organic carbon, volatile organic compounds, ethane, methane, and radon. Documentation of lithologic logs, well construction, well development, slug testing, and groundwater sampling are presented in this report.
Happy Birthday Clarence King! (1842) 1st Director of the USGS (1879-81) http://t.co/pOEYwVGdbB pic.twitter.com/fyroM1C8Ut
— USGS (@USGS) January 6, 2015
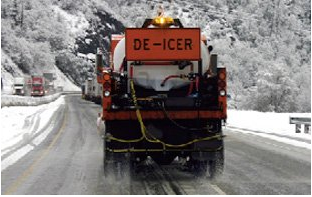
Here’s the release from the United States Geological Survey (Marisa Lubeck/Steve Corsi):
Average chloride concentrations often exceed toxic levels in many northern United States streams due to the use of salt to deice winter pavement, and the frequency of these occurrences nearly doubled in two decades.
Chloride levels increased substantially in 84 percent of urban streams analyzed, according to a U.S. Geological Survey study that began as early as 1960 at some sites and ended as late as 2011. Levels were highest during the winter, but increased during all seasons over time at the northern sites, including near Milwaukee, Wisconsin; Chicago, Illinois; Denver, Colorado; and other metropolitan areas. The report was published today in the journal Science of the Total Environment.
“Some freshwater organisms are sensitive to chloride, and the high concentrations that we found could negatively affect a significant number of species,” said Steve Corsi, USGS scientist and lead author of the study. “If urban development and road salt use continue to increase, chloride concentrations and associated toxicity are also likely to increase.”
The scientists analyzed water-quality data from 30 monitoring sites on 19 streams near cities in Wisconsin, Illinois, Colorado, Michigan, Ohio, Pennsylvania, Maryland, Texas and the District of Columbia. Key findings include:
- Twenty-nine percent of the sites exceeded the U.S. Environmental Protection Agency’s chronic water-quality criteria (230 milligrams per liter) by an average of more than 100 days per year from 2006 through 2011, which was almost double the amount of days from 1990 through 1994. This increase occurred at sites such as the Menomonee and Kinnickinnic Rivers near Milwaukee and Poplar Creek near Chicago.
- The lowest chloride concentrations were in watersheds that had little urban land use or cities without much snowfall, such as Dallas, Texas.
- In 16 of the streams, winter chloride concentrations increased over the study period.
- In 13 of the streams, chloride concentrations increased over the study period during non-deicing periods such as summer. This finding suggests that chloride infiltrates the groundwater system during the winter and is slowly released to the streams throughout the year.
- Chloride levels increased more rapidly than development of urban land near the study sites.
- The rapid chloride increases were likely caused by increased salt application rates, increased baseline conditions (the concentrations during summer low-flow periods) and greater snowfall in the Midwest during the latter part of the study.
“Deicing operations help to provide safe winter transportation conditions, which is very important,” Corsi said. “Findings from this study emphasize the need to consider deicer management options that minimize the use of road salt while still maintaining safe conditions.”
Road deicing by cities, counties and state agencies accounts for a significant portion of salt applications, but salt is also used by many public and private organizations and individuals to deice parking lots, walkways and driveways. All of these sources are likely to contribute to these increasing chloride trends.
Other major sources of salt to U.S. waters include wastewater treatment, septic systems, farming operations and natural geologic deposits. However, the new study found deicing activity to be the dominant source in urban areas of the northern U.S.
The USGS conducted this study in cooperation with the Milwaukee Metropolitan Sewerage District. For more information about winter runoff and water-quality, please visit the USGS Wisconsin Water Science Center website.
More water pollution coverage here.

From National Parks Traveler:
Having peaked on Thursday, high flows of the Colorado River through Grand Canyon National Park will taper back down to normal by Saturday, leaving behind replenished shores, improved fish habitat, and more space for campers. But the benefits will be lingering, according to the Glen Canyon Institute.
While the high-flow experiment, the third in six years, is being applauded by both the Institute and the National Parks Conservation Association, a news release put out by the Institute indicates the experiments are essentially useless in terms of the long-term health of the river as it flows through the national park.
”Once those sediments are redistributed from the channel to the banks, they are immediately attacked by a return to hydropower-driven, fluctuating flows,” said Dave Wegner, a former U.S. Bureau of Reclamation engineer quoted by the Institute. “The result is that instead of protecting and stabilizing the new beaches, the return to normal hydropower-defined operating patterns from the dam act like putting a hot knife into a stick of butter – the sand sloughs off quickly and right back into the river.”
The high-flow releases were to reach a peak volume of 37,500 cubic feet per second on Thursday, and taper back down to normal release rates of between 6,500 CFS and 9,000 CFS by Saturday afternoon. This is the third such experimental release since 2008. The United States Geological Survey estimates that the Colorado River below Glen Canyon Dam only has 6 percent of the sediment that it received before the Glen Canyon Dam was built in the 1960s. This sediment is vital to the health of the Grand Canyon ecosystem. While experimental high-releases provide some relief, the beaches – and consequently the ecosystem – of the Grand Canyon will continue to suffer until there is a systematic change in water management on the Colorado River that significantly increases the sediment flow in the canyon, according to the Institute.
In addition to the detrimental effect of normal releases from Glen Canyon Dam, as much as 95 percent of Colorado River sediment flows are trapped behind the Glen Canyon Dam, the Institute said. After 50 years of sediment trapping, the reality is that the beaches of the Grand Canyon are in a downward decline, it added.
”You can’t cut off 95 percent of the sediment source and expect a sustainable supply for the beaches,” said Eric Balken, program director of Glen Canyon Institute. “These high-flow releases give the public the impression that the Grand Canyon is doing OK. Make no mistake: the Grand Canyon is dying — it is starved of life-giving sediment.”
At NPCA, officials said the high-flow experiment serves as an important measure to support endangered fish and help other natural and cultural resources in Grand Canyon National Park.
“This specially timed ‘high flow’ mimics pre-dam floods and will bring in sediment to build up sandbars along the river’s bank,” said David Nimkin, Southwest regional director for NPCA. “It will provide spawning habitat for fish and other wildlife species, better recreational opportunities for Grand Canyon boaters and other visitors, and keep sacred Native American cultural sites protected from the elements.”
The Department of Interior, which operates Glen Canyon Dam upstream from the Grand Canyon, is releasing the water as part of an experimental protocol resulting from a 2012 environmental assessment. An NPCA release said the goal of the protocol is to continue to fulfill the mandate of the 1992 Grand Canyon Protection Act, which stipulates that Glen Canyon Dam operations adapt with strong scientific research, to better protect the natural, cultural, and recreational qualities of the river within Grand Canyon National Park.
“Grand Canyon National Park is a beloved national treasure, visited by nearly 5 million visitors last year, generating $467 million in economic benefit,” said Mr. Nimkin. “Managing the Colorado River to protect natural conditions in the Grand Canyon makes good ecological and good economic sense.”
Since it was built in 1963, Glen Canyon Dam has regulated the amount of water that flows in the Colorado for its 277-mile stretch through the Grand Canyon. The dam was built to provide an inexpensive source of power for Southwest cities and industry, provide flood control, and store water for farms and communities in the region. Prior to the 71-story dam being erected, the river’s seasonal peak floods averaged over 93,000 cubic feet per second. Since then, the flow of water through the dam’s generating turbines has typically fluctuated between 8,000-25,000 cfs, according to power demand.
Several decades of such highly restricted water flow dramatically altered the conditions of the Colorado River and the canyon itself, prompting Congress to act to protect Grand Canyon National Park.
According to NPCA, Interior Department staff will incorporate data from these experiments, as well as other recent research, in an upcoming management plan that aims to balance the municipal, industrial, agricultural, cultural, recreational, and environmental interests at stake in the Colorado River and the Grand Canyon in years ahead. A draft plan is anticipated to be released for public comment in early 2015.
From the Deseret News (Alex Cabrero):
When construction of the Glen Canyon Dam began in 1956 to store water and generate electricity, it affected the natural flow of the Colorado River through the area and into the Grand Canyon.
This “experimental high-flow release” — the third of its kind in the past three years — is meant to kick up sand and sediment on the bottom of the river and move them downstream.
Scientists with the United States Geological Survey and other agencies say the force from the water will rebuild sandbars, beaches, recreation areas and animal habitat that would have been part of the normal environment if Glen Canyon Dam were never built.
“I wouldn’t judge whether that’s responsible or not, but that it is that you have changed something,” Tucker said. “Experiments like this are ways to find a meaningful way to restore or preserve that ecosystem downstream.”
Fifteen-thousand cubic feet of water per second is flowing out of the dam into the Colorado River.
To put that in perspective, a basketball is about one cubic foot. That means roughly 15,000 basketballs are being released out of the dam every single second.
“It’s something that is very visually striking to see,” Tucker said.
Releasing so much water doesn’t impact drought conditions, he said.
“The same amount of water is going to be released from Glen Canyon Dam throughout the year, so since this is a higher-flow period, obviously with the experiment that is here, that will be compensated for in other months where there will be less water that will go through the dam,” Tucker said.
This is the third in a five-year plan to conduct experimental high-flow releases.
More Colorado River Basin coverage here.
Here’s the release from the United States Geological Survey (Ethan Alpern):
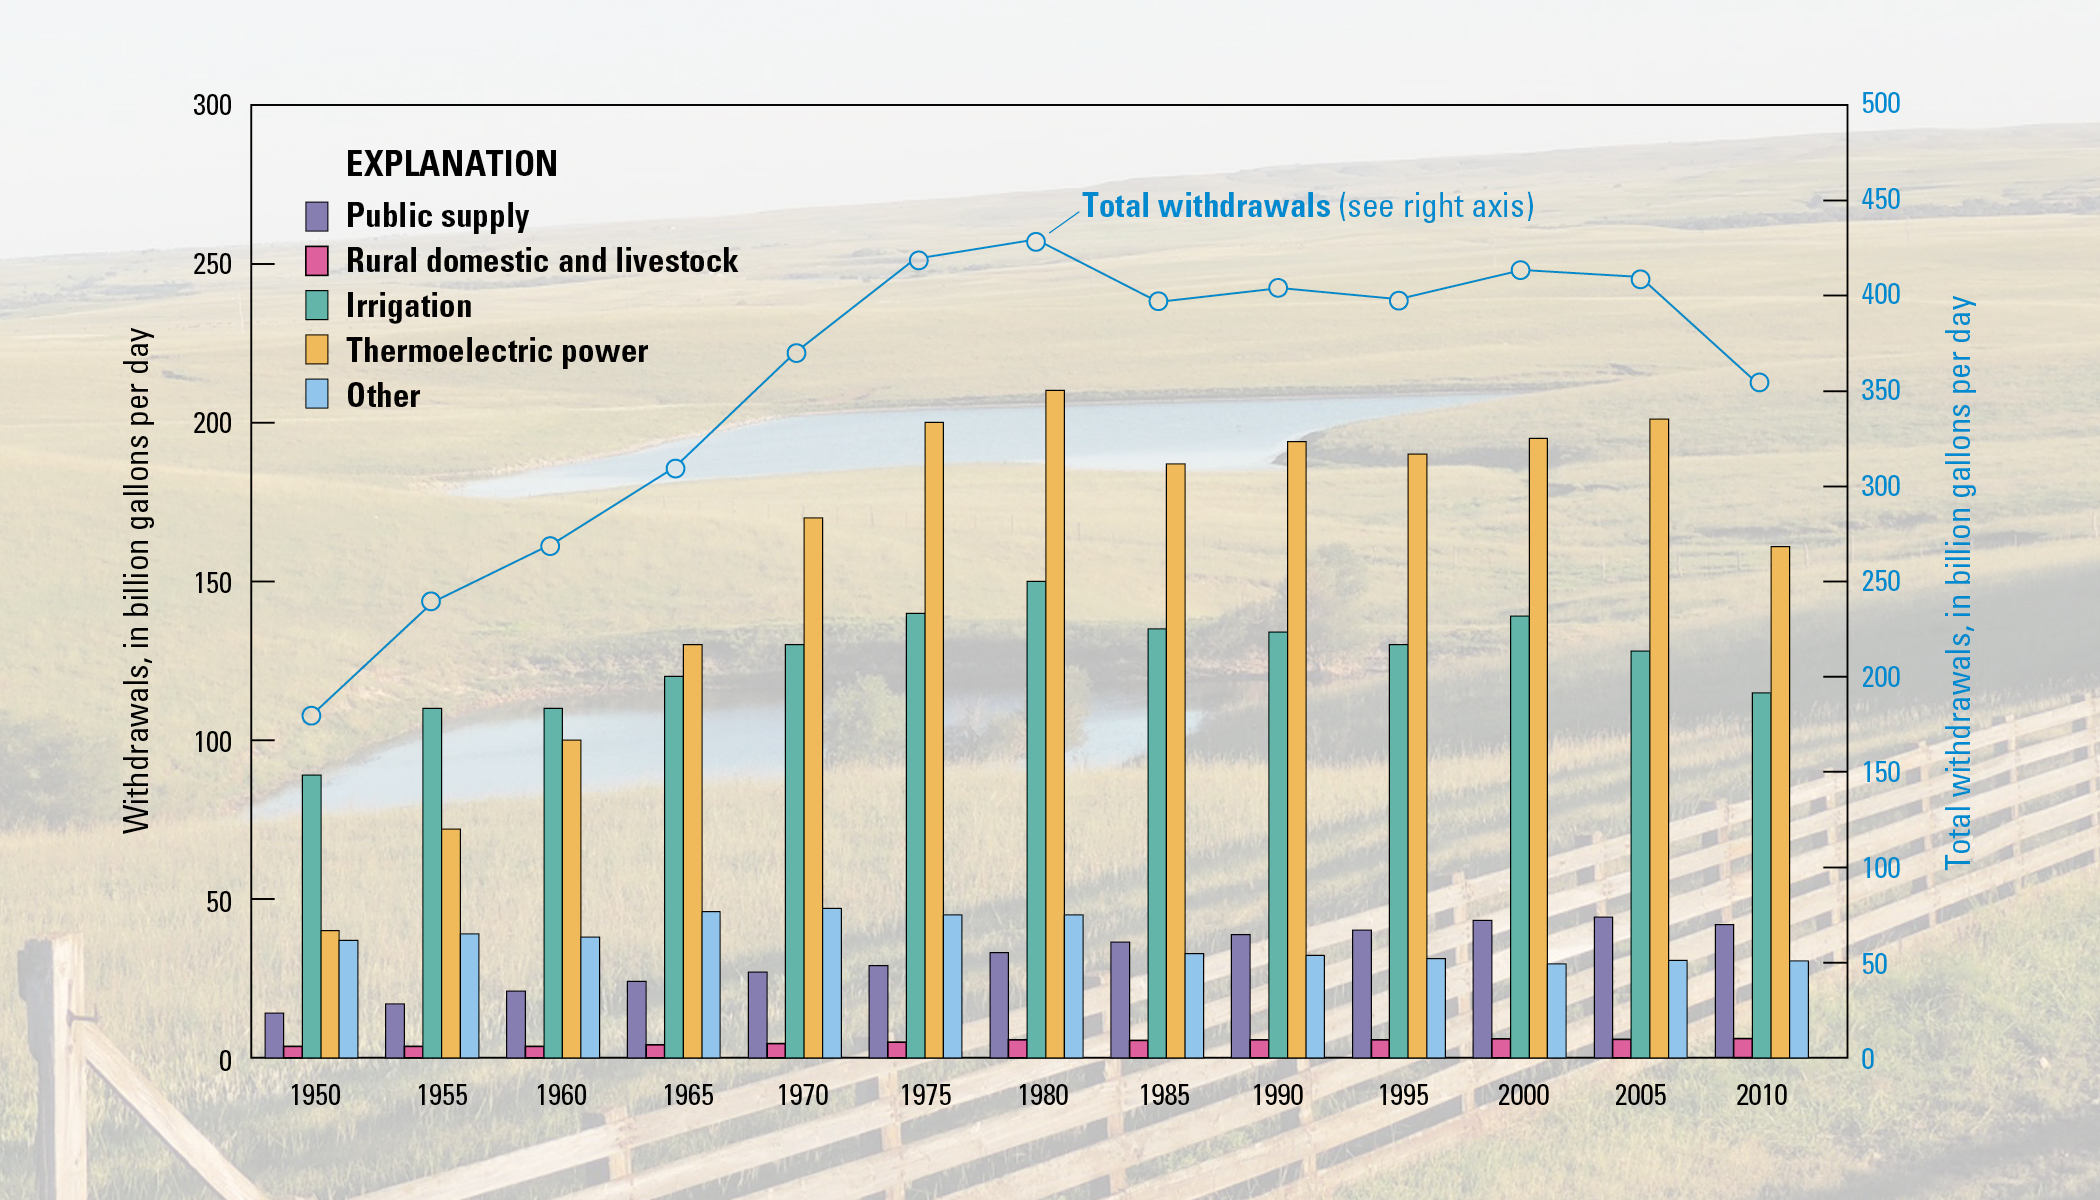
Water use across the country reached its lowest recorded level in nearly 45 years. According to a new USGS report, about 355 billion gallons of water per day (Bgal/d) were withdrawn for use in the entire United States during 2010. This represents a 13 percent reduction of water use from 2005 when about 410 Bgal/d were withdrawn and the lowest level since before 1970.
“Reaching this 45-year low shows the positive trends in conservation that stem from improvements in water-use technologies and management,” said Mike Connor, deputy secretary of the Interior. “Even as the U.S. population continues to grow, people are learning to be more water conscious and do their part to help sustain the limited freshwater resources in the country.”
In 2010, more than 50 percent of the total withdrawals in the United States were accounted for by 12 states in order of withdrawal amounts: California, Texas, Idaho, Florida, Illinois, North Carolina, Arkansas, Colorado, Michigan, New York, Alabama and Ohio.
California accounted for 11 percent of the total withdrawals for all categories and 10 percent of total freshwater withdrawals for all categories nationwide. Texas accounted for about 7 percent of total withdrawals for all categories, predominantly for thermoelectric power, irrigation and public supply.
Florida had the largest saline withdrawals, accounting for 18 percent of the total in the country, mostly saline surface-water withdrawals for thermoelectric power. Oklahoma and Texas accounted for about 70 percent of the total saline groundwater withdrawals in the United States, mostly for mining.
“Since 1950, the USGS has tracked the national water-use statistics,” said Suzette Kimball, acting USGS director. “By providing data down to the county level, we are able to ensure that water resource managers across the nation have the information necessary to make strong water-use and conservation decisions.”
Water withdrawn for thermoelectric power was the largest use nationally, with the other leading uses being irrigation, public supply and self-supplied industrial water, respectively. Withdrawals declined in each of these categories. Collectively, all of these uses represented 94 percent of total withdrawals from 2005-2010.
Thermoelectric power declined 20 percent, the largest percent decline. Irrigation withdrawals (all freshwater) declined 9 percent. Public-supply withdrawals declined 5 percent. Self-supplied industrial withdrawals declined 12 percent. A number of factors can be attributed to the 20 percent decline in thermoelectric-power withdrawals, including an increase in the number of power plants built or converted since the 1970’s that use more efficient cooling-system technologies, declines in withdrawals to protect aquatic habitat and environments, power plant closures and a decline in the use of coal to fuel power plants.
“Irrigation withdrawals in the United States continued to decline since 2005, and more croplands were reported as using higher-efficiency irrigation systems in 2010,” said Molly Maupin, USGS hydrologist. “Shifts toward more sprinkler and micro-irrigation systems nationally and declining withdrawals in the West have contributed to a drop in the national average application rate from 2.32 acre-feet per acre in 2005 to 2.07 acre-feet per acre in 2010.”
For the first time, withdrawals for public water supply declined between 2005 and 2010, despite a 4 percent increase in the nation’s total population. The number of people served by public-supply systems continued to increase and the public-supply per capita use declined to 89 gallons per day in 2010 from 100 gallons per day in 2005.
Declines in industrial withdrawals can be attributed to factors such as greater efficiencies in industrial processes, more emphasis on water reuse and recycling, and the 2008 U.S. recession, resulting in lower industrial production in major water-using industries.
In a separate report, USGS estimated thermoelectric-power withdrawals and consumptive use for 2010, based on linked heat- and water-budget models that integrated power plant characteristics, cooling system types and data on heat flows into and out of 1,290 power plants in the United States. These data include the first national estimates of consumptive use for thermoelectric power since 1995, and the models offer a new approach for nationally consistent estimates.
In August, USGS released the 2010 water-use estimates for California in advance of the national report. The estimates showed that in 2010, Californians withdrew an estimated total of 38 Bgal/day, compared with 46 Bgal/day in 2005. Surface water withdrawals in the state were down whereas groundwater withdrawals and freshwater withdrawals were up. Most freshwater withdrawals in California are for irrigation.
The USGS is the world’s largest provider of water data and the premier water research agency in the federal government.
More USGS coverage here.
US govt builds a home for water data, but construction will take patience http://t.co/wfM0TlJOh5
— Circle of Blue (@circleofblue) November 1, 2014
Water, it’s critical! We remember #LunaLeopold on his B-Day, Pioneer of Water Science, http://t.co/TOXqvCC9iv pic.twitter.com/U8ZD0eqpHs
— USGS (@USGS) October 8, 2014
From the United States Geological Survey:
In honor of Earth Science Week, October 14-20, 2012, the USGS is taking a look back into history at the scientists who laid the foundation for the innovative earth science research taking place today. Without the work conducted by these pioneers, much of the science used for decision making worldwide would not be possible.
“Water is the most critical resource issue of our lifetime and our children’s lifetime. The health of our waters is the principal measure of how we live on the land.”
–Luna B. Leopold, Former USGS Chief Hydrologist
Luna B. Leopold, son of famed conservationist Aldo Leopold, arrived at the USGS in 1950. For the next two decades, Leopold revolutionized hydrologic sciences within and outside the USGS. He is best known for his work in the field of geomorphology, the study of land features and the processes that create and change them. His work is often cited today by leading scientists in water research, both at the USGS and around the world.
Leopold had a lasting impact on the field of water science. He knew the broader importance of our water resources and that humans can have great impact on whether water is available, now and in the future. Our society depends on safe and reliable water supplies, as do the Earth’s diverse and valuable ecosystems. Today, our nation is faced with the challenge of balancing a finite freshwater supply between competing needs, such as agriculture, drinking water, energy production, and ecosystems.
Leopold recognized the fundamental value of science in making smart decisions about water resources and laid the groundwork for modern water science. During his tenure he transformed USGS water research into a professionally-recognized provider of water quality and availability information.
For six years, he served as a hydraulic engineer before becoming the first Chief Hydrologist in the history of the USGS, a position he held until 1966 when he stepped down to pursue his research. While at the USGS, he led the effort to restructure the water science programs to focus on viewing water as a single resource. For example, USGS continues to research the interactions between surface water and groundwater, because use of either of these resources affects the quantity and quality of the other.
Leopold also directed the agency to assist in developing hydrology education programs at universities across the country and promoted a future in which all hydrologic research organizations—both public and private—would come together to share information and advance their ideas.
“In effect, Luna turned the hydrologic division of the USGS into a premier research organization, contributing to the prominence the field now has,” said Bill Dietrich, a professor of earth and planetary science at the University of California, Berkeley, and a former colleague of Leopold’s.
Randall J. Hunt, USGS Research Hydrologist for Geology, and Curt Meine, the biographer of Aldo Leopold, have written an account of Luna Leopold’s contributions to the world of water science that will appear in the November/December issue of Ground Water and is currently online. In the article, “Luna B. Leopold – Pioneer Setting the Stage for Modern Hydrology,” they describe Leopold as a brilliant and humble researcher intrigued by the impact that human activities have on natural bodies of water.
“From the earliest steps in his career,” wrote Hunt and Meine, “Luna Leopold demonstrated a fascination with hydrology, an understanding of basic hydrological connectivity, and an appreciation of the role of science in informing resource management and stewardship.”
Not only did Leopold lead the transition to a more effective organization structure for the study of hydrology; he also changed the underlying philosophy behind the research.
“In 1957, newly minted USGS Chief Hydraulic Engineer Leopold brought with him a conviction that water on and beneath the Earth’s surface and the quality of both were interdependent parts of one water-resources system,” wrote Hunt and Meine. “Leopold believed, moreover, that the USGS and the field of hydrology had to change to reflect this reality. He also recognized that hydrologic research was critical in meeting the needs of water-resource planning…This approach became manifest within the USGS.”
Leopold’s contributions to the field of water science have been recognized by institutions throughout the United States. In 1967, just a year after completing his tenure as Chief Hydrologist, Leopold became the first hydrologist to be inducted into the National Academy of Sciences. In 1968 he won the Cullum Geographical Medal from the American Geographical Society, and in 1991 was awarded the National Medal of Science by President George H. Bush in a Rose Garden ceremony at the White House. During his career, he was elected as a Fellow of the American Academy of Arts and Sciences, the American Philosophical Society, the American Society of Civil Engineers, and the American Geophysical Union.


Coyote Gulch posts about Dr. Leopold (who is quoted at the top of the blog):
Luna Leopold: Pioneer of water science</>
Luna B. Leopold (scroll down)
Luna B. Leopold: Water, Rivers and Creeks
Click here to order a copy of the book from Tattered Cover in Denver.

Here’s the release from the United States Geological Service (Nancy J. Bauch, Lisa D. Miller, and Sharon Yacob):
Water quality of streams, reservoirs, and groundwater in the Blue River watershed in the central Rocky Mountains of Colorado has been affected by local geologic conditions, historical hard-rock metal mining, and recent urban development. With these considerations, the U.S. Geological Survey, in cooperation with the Summit Water Quality Committee, conducted a study to compile historical water-quality data and assess water-quality conditions in the watershed. To assess water-quality conditions, stream data were primarily analyzed from October 1995 through December 2006, groundwater data from May 1996 through September 2004, and reservoir data from May 1984 through November 2007. Stream data for the Snake River, upper Blue River, and Tenmile Creek subwatersheds upstream from Dillon Reservoir and the lower Blue River watershed downstream from Dillon Reservoir were analyzed separately. (The complete abstract is provided in the report)
Click here to read the report.
More USGS coverage here.
From National Geographic (Michelle Nijhuis):
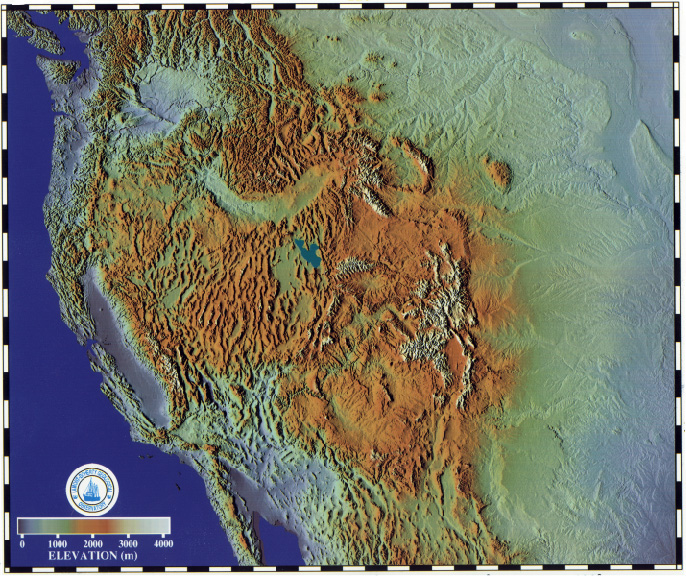
Throughout the western United States, a network of Global Positioning System (GPS) stations has been monitoring tiny movements in the Earth’s crust, collecting data that can warn of developing earthquakes.
To their surprise, researchers have discovered that the GPS network has also been recording an entirely different phenomenon: the massive drying of the landscape caused by the drought that has intensified over much of the region since last year.
Geophysicist Adrian Borsa of the Scripps Institution of Oceanography and his colleagues report in this week’s Science that, based on the GPS measurements, the loss of water from lakes, streams, snowpack, and groundwater totals some 240 billion metric tons—equivalent, they say, to a four-inch-deep layer of water covering the entire western U.S. from the Rockies to the Pacific. (Related: “Water’s Hidden Crisis”
The principle behind the new measurements is simple. The weight of surface water and groundwater deforms Earth’s elastic crust, much as a sleeper’s body deforms a mattress. Remove the water, and the crust rebounds.
As the amount of water varies cyclically with the seasons, the crust moves up and down imperceptibly, by fractions of an inch—but GPS can measure such small shifts.
Borsa knew all this when he started to study the GPS data. He wasn’t interested in the water cycle at first, and for him the seasonal fluctuations it produced in the data were just noise: They obscured the much longer-term geological changes he wanted to study, such as the rise of mountain ranges.
When he removed that noise from some recent station data, however, he noticed what he describes as a “tremendous uplift signal”—a distinct rise in the crust—since the beginning of 2013. He showed his findings to his Scripps colleague Duncan Agnew.
“I told him, ‘I think we’re looking at the effect of drought,'” Borsa remembers. “He didn’t believe me.”
But Borsa was right. As he, Agnew, and Daniel Cayan of Scripps report in Science, the recent uplift spike is consistent across the U.S. West, and consistent with recent declines in precipitation, streamflow, and groundwater levels. With a great weight of water removed, the crust is rebounding elastically across the whole region.
The median rise across all the western GPS stations has been four millimeters, just under a sixth of an inch. But the Sierra Nevada mountains, which have lost most of their snowpack, have risen 15 millimeters—nearly six-tenths of an inch.
Here’s the release from the United States Geological Survey (Parker Norton/Marisa Lubeck):
Video footage of an interview with lead USGS scientist Parker Norton is available online.
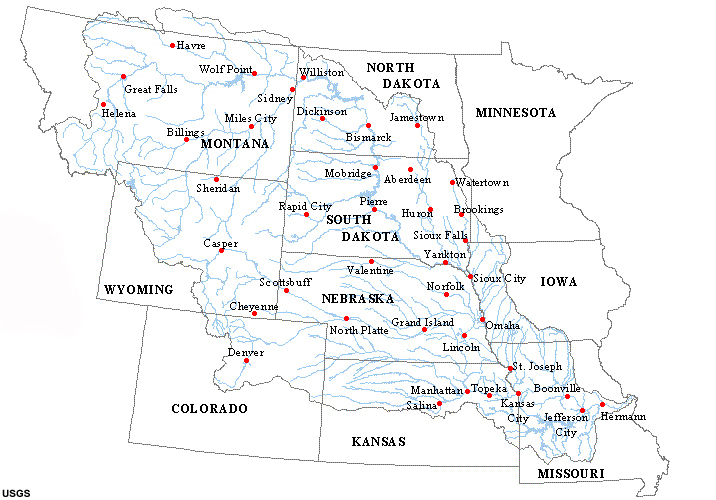
Streamflow in the eastern portions of the Missouri River watershed has increased over the past 52 years, whereas other parts have seen downward trends.
U.S. Geological Survey scientists recently studied data from 227 streamgages in the Missouri River watershed that had continuous records for 1960 through 2011. The scientists found that almost half of the streamgages showed either an upward or downward trend in mean annual flow since 1960, while the rest showed no trend.
The study is relevant on a large scale because the Missouri River is the longest river in the United States, with a watershed that includes mountainous to prairie topography in all or parts of 10 states and small parts of Alberta and Saskatchewan in Canada.
“The Missouri River and its tributaries are valuable for agriculture, energy, recreation and municipal water supplies,” said USGS hydrologist Parker Norton. “Understanding streamflow throughout the watershed can help guide management of these critical water resources.”
According to the study, streamflow has increased in the eastern part of the watershed, including eastern North Dakota, eastern South Dakota, western Iowa and eastern Nebraska. Annual flows have decreased in the western headwaters area of the Missouri River in Montana and Wyoming, and in the southern part of the basin associated with the Kansas River watershed.
Climate changes that affect how and where moisture is delivered to the continent may be causing some of these trends in the Missouri River Basin. Although the USGS scientists did not conduct a complete analysis of the causes, they noted that increased streamflow over broad regions occurred despite the increasing use of water. Decreased streamflow in some areas could also be related to climate change factors, or to groundwater pumping.
The USGS report can be accessed online.
More Missouri River Basin coverage here.
Donate to Bob’s crowd funded father-son journalism project here.
USGS Celebrates 50th Anniversary of Water Resources Research Act http://t.co/VMscwSYaxW #USGSnews
— USGS (@USGS) July 17, 2014
What lies beneath #Yellowstone? Magma chamber inferred by seismic waves: http://t.co/vGvMGtQPS8 pic.twitter.com/Qsa7O4Rlyo
— USGS (@USGS) July 11, 2014
More USGS coverage here.

From The Denver Post (Nancy Lofholm):
Trash trucks are once again picking up the garbage on West Salt Creek Road near Collbran — one of the best signs, residents say, that some sense of normalcy is returning to those living under the threat of more movement from a giant mudslide.
“We feel very comfortable now. We feel like there is so much intelligence coming in now and that they are really watching that mountain,” said Celia Eklund, who lives along lower West Salt Creek Road.
The residents there are still on alert from the Mesa County Sheriff’s Office since the mountain above them slid on May 25 and buried three local men who had gone up to check on a smaller slide that occurred earlier that day…
Dozens of experts from local, state and federal agencies have studied the slide that is now being called a “debris avalanche” or a “rapid earthflow” by geologists. They have used high-tech aerial imaging, GPS and water flow meters and have installed monitors that can detect even slight movements in the slide.
They now have a more accurate size on the slide, which is smaller than originally estimated.
The latest information from the U.S. Geological Survey shows that the slide stretches for 2.5 miles and covers 550 acres…
The slide contains a pool of water at the top behind a large block of earth that broke off from the Grand Mesa where the slide originated. Geologists now estimate that pool will hold about 245 acre feet of water before it could reach an outlet and spill over. A gauge has been installed by the USGS Colorado Water Science Center just below the toe of the landslide to measure any flow from the slide.
Heather Benjamin with the Mesa County Sheriff’s Office said the Army Corps of Engineers joined the geologists from the USGS and the Colorado Geological Survey this week. The entire group of geologists and emergency management personnel from the Colorado Department of Public Safety have been holding nightly briefings since the slide occurred.

Here’s the abstract from the United States Geological Survey (David W. Anning and Marilyn E. Flynn):
Recent studies have shown that excessive dissolved-solids concentrations in water can have adverse effects on the environment and on agricultural, domestic, municipal, and industrial water users. Such effects motivated the U.S. Geological Survey’s National Water Quality Assessment Program to develop a SPAtially-Referenced Regression on Watershed Attributes (SPARROW) model that has improved the understanding of sources, loads, yields, and concentrations of dissolved solids in streams of the conterminous United States.
Using the SPARROW model, long-term mean annual dissolved-solids loads from 2,560 water-quality monitoring stations were statistically related to several spatial datasets that are surrogates for dissolved-solids sources and land-to-water delivery processes. Specifically, sources in the model included variables representing geologic materials, road deicers, urban lands, cultivated lands, and pasture lands. Transport of dissolved solids from these sources was modulated by land-to-water delivery variables that represent precipitation, streamflow, soil, vegetation, terrain, population, irrigation, and artificial drainage characteristics. Where appropriate, the load estimates, source variables, and transport variables were statistically adjusted to represent conditions for the base year 2000. The nonlinear least-squares estimated SPARROW model was used to predict long-term mean annual conditions for dissolved-solids sources, loads, yields, and concentrations in a digital hydrologic network representing nearly 66,000 stream reaches and their corresponding incremental catchments that drain the Nation.
Nationwide, the predominant source of dissolved solids yielded from incremental catchments and delivered to local streams is geologic materials in 89 percent of the catchments, road deicers in 5 percent of the catchments, pasture lands in 3 percent of the catchments, urban lands in 2 percent of the catchments, and cultivated lands in 1 percent of the catchments. Whereas incremental catchments with dissolved solids that originated predominantly from geologic sources or from urban lands are found across much of the Nation, incremental catchments with dissolved solids yields that originated predominantly from road deicers are largely found in the Northeast, and incremental catchments with dissolved solids that originated predominantly from cultivated or pasture lands are largely found in the West. The total amount of dissolved solids delivered to the Nation’s streams is 271.9 million metric tons (Mt) annually, of which 194.2 million Mt (71.4%) come from geologic sources, 37.7 million Mt (13.9%) come from road deicers, 18.2 million Mt (6.7%) come from pasture lands, 13.9 million Mt (5.1%) come from urban lands, and 7.9 million Mt (2.9%) come from cultivated lands.
Nationwide, the median incremental-catchment yield delivered to local streams is 26 metric tons per year per square kilometer [(Mt/yr)/km2]. Ten percent of the incremental catchments yield less than 4 (Mt/yr)/km2, and 10 percent yield more than 90 (Mt/yr)/km2. Incremental-catchment yields greater than 50 (Mt/yr)/km2 mostly occur along the northern part of the West Coast and in a crescent shaped band south of the Great Lakes. For example, the median incremental-catchment yield is 81 (Mt/yr)/km2 for the Great Lakes, 78 (Mt/yr)/km2 for the Ohio, and 74 (Mt/yr)/km2 for the Upper Mississippi water-resources regions. Incremental-catchment yields less than 10 (Mt/yr)/km2 mostly occur in a wide band across the arid lowland of the interior West that excludes areas along the coast and the extensive, higher mountain ranges. For example, the median incremental-catchment yield is 3 (Mt/yr)/km2 for the Lower Colorado, 5 (Mt/yr)/km2 for the Rio Grande, and 8 (Mt/yr)/km2 for the Great Basin water-resources regions.
Predicted incremental loads were cascaded down through the reach network, with loads accumulating from reach to reach. For most stream reaches, the entire incremental load of dissolved solids delivered to the reach was transported to either the ocean or to one of the large streams flowing along the U.S. international boundary without losses occurring along the way. The exceptions to this include streams in the southwestern part of the country, such as the Colorado River, Rio Grande, and streams of internally drained drainages in the Great Basin, where dissolved-solids loads decreased through streamflow diversion for off-stream use, or by infiltration through the streambed.
Long-term mean annual flow-weighted concentrations were derived from the predicted accumulated-load and stream-discharge data. Widespread low concentrations, generally less than 100 milligrams per liter (mg/L), occur in many reaches of the New England, South Atlantic-Gulf, and Pacific Northwest water-resources regions as a result of moderate dissolved-solids yields and high runoff rates. Widespread moderate concentrations, generally between 100 and 500 mg/L, occur in many reaches of the Great Lakes, Ohio, and Upper Mississippi River water-resources regions. Whereas dissolved-solids yields are generally high in these regions, runoff rates are also high, which helps moderate concentrations in these regions. Widespread higher concentrations, generally greater than 500 mg/L, occur across a belt of reaches that extends almost continuously from Canada to Mexico in the Midwest, cutting through the Souris-Red-Rainy, Missouri, Arkansas-White-Red, Texas-Gulf, and Rio Grande water-resources regions. Although dissolved-solids yields are moderate to low in these areas, low runoff rates result in the high concentrations for these areas.
In 12.6 percent of the Nation’s stream reaches, predicted concentrations of dissolved solids exceed 500 mg/L, the U.S. Environmental Protection Agency’s secondary, nonenforceable drinking water standard. While this standard provides a metric for evaluating predicted concentrations in the context of drinking-water supplies, it should be noted that it only applies to drinking water actually served to customers by water utilities, and it does not apply to all stream reaches in the Nation nor does it apply during times when water is not being withdrawn for use. Exceedance of 500 mg/L is more pronounced in certain water-resources regions than others. For example, about half of the reaches in the Souris-Red-Rainy region have concentrations predicted to exceed 500 mg/L, and between 25 and 37 percent of the reaches in the Missouri, Arkansas-White-Red, Texas-Gulf, Rio Grande, and Lower Colorado regions are predicted to exceed 500 mg/L.
Development of stream-load data for use in the SPARROW model also provided long-term temporal trend information in dissolved-solids concentrations at the monitoring stations for their period of record, which was constrained between 1980 and 2009. For the 2,560 monitoring stations used in this study, long-term trends in flow-adjusted dissolved-solids concentrations increased over time at 23 percent of the stations, decreased at 18 percent of the stations, and did not change over time at 59 percent of the stations. Long-term trends show a strong regional spatial pattern where from the western parts of the Great Plains to the West Coast, concentrations mostly either did not change or decreased over time, and from the eastern parts of the Great Plains to the East Coast, concentrations mostly either did not change or increased over time.
Results from the trend analysis and from the SPARROW model indicate that, compared to monitoring stations with no trends or decreasing trends, stations with increasing trends are associated with a smaller percentage of the predicted dissolved-solids load originating from geologic sources, and a larger percentage originating from urban lands and road deicers. Conversely, compared to stations with increasing trends or no trends, stations with decreasing trends have a larger percentage of the predicted dissolved-solids load originating from geologic sources and a smaller percentage originating from urban lands and road deicers. Stations with decreasing trends also have larger percentages of predicted dissolved-solids load originating from cultivated lands and pasture lands, compared to stations with increasing trends or no trends.
More water pollution coverage here.
Where did all that water go? Check out current streamflow conditions nationwide & by state: http://t.co/Pli466lBRp pic.twitter.com/tZ6CLxZA7f
— USGS (@USGS) May 1, 2014

Click here to go to the Water Watch website for Colorado from the United States Geological Survey.
Click here to read the report. Here’s the abstract from the USGS (Collin A. Eagles-Smith/James J. Willacker Jr./Colleen M. Flanagan Pritz):
Mercury (Hg) is a global contaminant and human activities have increased atmospheric Hg concentrations 3- to 5-fold during the past 150 years. This increased release into the atmosphere has resulted in elevated loadings to aquatic habitats where biogeochemical processes promote the microbial conversion of inorganic Hg to methylmercury, the bioavailable form of Hg. The physicochemical properties of Hg and its complex environmental cycle have resulted in some of the most remote and protected areas of the world becoming contaminated with Hg concentrations that threaten ecosystem and human health. The national park network in the United States is comprised of some of the most pristine and sensitive wilderness in North America. There is concern that via global distribution, Hg contamination could threaten the ecological integrity of aquatic communities in the parks and the wildlife that depends on them. In this study, we examined Hg concentrations in non-migratory freshwater fish in 86 sites across 21 national parks in the Western United States. We report Hg concentrations of more than 1,400 fish collected in waters extending over a 4,000 kilometer distance, from Alaska to the arid Southwest. Across all parks, sites, and species, fish total Hg (THg) concentrations ranged from 9.9 to 1,109 nanograms per gram wet weight (ng/g ww) with a mean of 77.7 ng/g ww. We found substantial variation in fish THg concentrations among and within parks, suggesting that patterns of Hg risk are driven by processes occurring at a combination of scales. Additionally, variation (up to 20-fold) in site-specific fish THg concentrations within individual parks suggests that more intensive sampling in some parks will be required to effectively characterize Hg contamination in western national parks.
Across all fish sampled, only 5 percent had THg concentrations exceeding a benchmark (200 ng/g ww) associated with toxic responses within the fish themselves. However, Hg concentrations in 35 percent of fish sampled were above a benchmark for risk to highly sensitive avian consumers (90 ng/g ww), and THg concentrations in 68 percent of fish sampled were above exposure levels recommended by the Great Lakes Advisory Group (50 ng/g ww) for unlimited consumption by humans. Of the fish assessed for risk to human consumers (that is, species that are large enough to be consumed by recreational or subsistence anglers), only one individual fish from Yosemite National Park had a muscle Hg concentration exceeding the benchmark (950 ng/g ww) at which no human consumption is advised. Zion, Capital Reef, Wrangell-St. Elias, and Lake Clark National Parks all contained sites in which most fish exceeded benchmarks for the protection of human and wildlife health. This finding is particularly concerning in Zion and Capitol Reef National Parks because the fish from these parks were speckled dace, a small, invertebrate-feeding species, yet their Hg concentrations were as high or higher than those in the largest, long-lived predatory species, such as lake trout. Future targeted research and monitoring across park habitats would help identify patterns of Hg distribution across the landscape and facilitate management decisions aimed at reducing the ecological risk posed by Hg contamination in sensitive ecosystems protected by the National Park Service.
More water pollution coverage here.
Here’s the abstract from the USGS (Suzanne S. Paschke/Katherine Walton-Day/Jennifer A. Beck/Ank Webber/Jean A. Dupree)
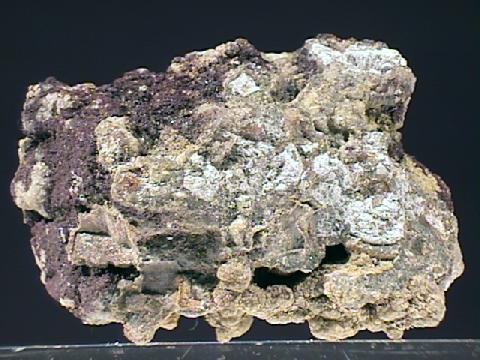
Toll Gate Creek, in the west-central part of the Denver Basin, is a perennial stream in which concentrations of dissolved selenium have consistently exceeded the Colorado aquatic-life standard of 4.6 micrograms per liter. Recent studies of selenium in Toll Gate Creek identified the Denver lignite zone of the non-marine Cretaceous to Tertiary-aged (Paleocene) Denver Formation underlying the watershed as the geologic source of dissolved selenium to shallow ground-water and surface water. Previous work led to this study by the U.S. Geological Survey, in cooperation with the City of Aurora Utilities Department, which investigated geologic sources of selenium and selenium concentrations in the watershed. This report documents the occurrence of selenium-bearing rocks and groundwater within the Cretaceous- to Tertiary-aged Denver Formation in the west-central part of the Denver Basin, including the Toll Gate Creek watershed. The report presents background information on geochemical processes controlling selenium concentrations in the aquatic environment and possible geologic sources of selenium; the hydrogeologic setting of the watershed; selenium results from groundwater-sampling programs; and chemical analyses of solids samples as evidence that weathering of the Denver Formation is a geologic source of selenium to groundwater and surface water in the west-central part of the Denver Basin, including Toll Gate Creek.
Analyses of water samples collected from 61 water-table wells in 2003 and from 19 water-table wells in 2007 indicate dissolved selenium concentrations in groundwater in the west-central Denver Basin frequently exceeded the Colorado aquatic-life standard and in some locations exceeded the primary drinking-water standard of 50 micrograms per liter. The greatest selenium concentrations were associated with oxidized groundwater samples from wells completed in bedrock materials. Selenium analysis of geologic core samples indicates that total selenium concentrations were greatest in samples containing indications of reducing conditions and organic matter (dark gray to black claystones and lignite horizons).
The Toll Gate Creek watershed is situated in a unique hydrogeologic setting in the west-central part of the Denver Basin such that weathering of Cretaceous- to Tertiary-aged, non-marine, selenium-bearing rocks releases selenium to groundwater and surface water under present-day semi-arid environmental conditions. The Denver Formation contains several known and suspected geologic sources of selenium including: (1) lignite deposits; (2) tonstein partings; (3) organic-rich bentonite claystones; (4) salts formed as secondary weathering products; and possibly (5) the Cretaceous-Tertiary boundary. Organically complexed selenium and/or selenium-bearing pyrite in the enclosing claystones are likely the primary mineral sources of selenium in the Denver Formation, and correlations between concentration of dissolved selenium and dissolved organic carbon in groundwater indicate weathering and dissolution of organically complexed selenium from organic-rich claystone is a primary process mobilizing selenium. Secondary salts accumulated along fractures and bedding planes in the weathered zone are another potential geologic source of selenium, although their composition was not specifically addressed by the solids analyses. Results from this and previous work indicate that shallow groundwater and streams similarly positioned over Denver Formation claystone units at other locations in the Denver Basin also may contain concentrations of dissolved selenium greater than the Colorado aquatic-life standard or the drinking- water standard.
More South Platte River Basin coverage here.

Here’s the abstract from the USGS (Michael S. Kohn/John W. Fulton/Cory A. Williams/Robert W. Stogner, Sr.)
The U.S. Geological Survey (USGS) in cooperation with the Fountain Creek Watershed, Flood Control and Greenway District assessed remediation scenarios to attenuate peak flows and reduce sediment loads in the Fountain Creek watershed. To evaluate these strategies, the U.S. Army Corps of Engineers Hydrologic Engineering Center (HEC) hydrologic and hydraulic models were employed.
The U.S. Army Corps of Engineers modeling system HEC-HMS (Hydrologic Modeling System) version 3.5 was used to simulate runoff in the Fountain Creek watershed, Colorado, associated with storms of varying magnitude and duration. Rain-gage precipitation data and radar-based precipitation data from the April 28–30, 1999, and September 14–15, 2011, storm events were used in the calibration process for the HEC-HMS model. The curve number and lag time for each subwatershed and Manning’s roughness coefficients for each channel reach were adjusted within an acceptable range so that the simulated and measured streamflow hydrographs for each of the 12 USGS streamgages approximated each other.
The U.S. Army Corps of Engineers modeling system HEC-RAS (River Analysis System) versions 4.1 and 4.2 were used to simulate streamflow and sediment transport, respectively, for the Fountain Creek watershed generated by a particular storm event. Data from 15 USGS streamgages were used for model calibration and 7 of those USGS streamgages were used for model validation. The calibration process consisted of comparing the simulated water-surface elevations and the cross-section-averaged velocities from the model with those surveyed in the field at the cross section at the corresponding 15 and 7 streamgages, respectively. The final Manning’s roughness coefficients were adjusted between –30 and 30 percent at the 15 calibration streamgages from the original left, right, and channel-averaged Manning’s roughness coefficients upon completion of calibration.
The U.S. Army Corps of Engineers modeling system HEC-RAS version 4.2 was used to simulate streamflow and sediment transport for the Fountain Creek watershed generated by a design-storm event. The Laursen-Copeland sediment-transport function was used in conjunction with the Exner 5 sorting method and the Ruby fall-velocity method to predict sediment transport. Six USGS streamgages equipped with suspended-sediment samplers were used to develop sediment-flow rating curves for the sediment-transport-model calibration. The critical Shields number in the Laursen-Copeland sediment-transport function and the volume of sediment available at a given cross section were adjusted during the HEC-RAS sediment-model calibration process.
HEC-RAS model simulations used to evaluate the 14 remediation scenarios were based on unsteady-state streamflows associated with a 24-hour, 1-percent annual exceedance probability (100-year) National Oceanic and Atmospheric Administration Type II precipitation event. Scenario 0 represents the baseline or current conditions in the watershed and was used to compare the remaining 13 scenarios. Scenarios 1–8 and 12 rely on side-detention facilities to reduce peak flows and sediment transport. Scenario 9 has a diversion channel, and scenario 10 has a reservoir. Scenarios 11 and 13 incorporate channel armoring and channel widening, respectively. Scenarios 8 and 10, the scenario with the most side-detention facilities, and the scenario with the reservoir, respectively, were the most effective at reducing sediment transport and peak flow at the Pueblo, Colorado, streamgage. Scenarios 8 and 10 altered the peak flow by –58.9 and –56.4 percent, respectively. In turn, scenarios 8 and 10 altered the sediment transport by –17.7 and –62.1 percent, respectively.
More Fountain Creek coverage here.

Click here to go to the Ecological Society of America website to download a copy of the report. Here’s the pitch:
The effects of aquatic contaminants are propagated across ecosystem boundaries by aquatic insects that export resources and contaminants to terrestrial food webs; however, the mechanisms driving these effects are poorly understood. We examined how emergence, contaminant concentration, and total contaminant flux by adult aquatic insects changed over a gradient of bioavailable metals in streams and how these changes affected riparian web-building spiders. Insect emergence decreased 97% over the metal gradient, whereas metal concentrations in adult insects changed relatively little. As a result, total metal exported by insects (flux) was lowest at the most contaminated streams, declining 96% among sites. Spiders were affected by the decrease in prey biomass, but not by metal exposure or metal flux to land in aquatic prey. Aquatic insects are increasingly thought to increase exposure of terrestrial consumers to aquatic contaminants, but stream metals reduce contaminant flux to riparian consumers by strongly impacting the resource linkage. Our results demonstrate the importance of understanding the contaminant-specific effects of aquatic pollutants on adult insect emergence and contaminant accumulation in adults to predict impacts on terrestrial food webs.
Credit: Johanna M. Kraus, Travis S. Schmidt, David M. Walters, Richard B. Wanty, Robert E. Zuellig, and Ruth E. Wolf
More USGS coverage here.

Here’s the abstract from the USGS (Cory A. Williams):
The Yampa River in northwestern Colorado is the largest, relatively unregulated river system in the upper Colorado River Basin. Water from the Yampa River Basin continues to be sought for a number of municipal, industrial, and energy uses. It is anticipated that future water development within the Yampa River Basin above the amount of water development identified under the Upper Colorado River Endangered Fish Recovery Implementation Program and the Programmatic Biological Opinion may require additional analysis in order to understand the effects on habitat and river function. Water development in the Yampa River Basin could alter the streamflow regime and, consequently, could lead to changes in the transport and storage of sediment in the Yampa River at Deerlodge Park. These changes could affect the physical form of the reach and may impact aquatic and riparian habitat in and downstream from Deerlodge Park.
The U.S. Geological Survey, in cooperation with the Colorado Water Conservation Board, began a study in 2011 to characterize the current hydrodynamic and sediment-transport conditions for a 2-kilometer reach of the Yampa River in Deerlodge Park. Characterization of channel conditions in the Deerlodge Park reach was completed through topographic surveying, grain-size analysis of streambed sediment, and characterization of streamflow properties. This characterization provides (1) a basis for comparisons of current stream functions (channel geometry, sediment transport, and stream hydraulics) to future conditions and (2) a dataset that can be used to assess channel response to streamflow alteration scenarios indicated from computer modeling of streamflow and sediment-transport conditions.
More USGS coverage here.
[PDF] #USGS Water Resources Internet Tools for your state http://t.co/npaJr0RNj3 #water pic.twitter.com/uVozk1keSr
— USGS (@USGS) January 2, 2014
#TBT John Wesley Powell at his desk—same desk used by the #USGS Director today. http://t.co/dlzFx1sJxh #science pic.twitter.com/8oG5ghSRbq
— USGS (@USGS) December 12, 2013

Click here to go to the USGS website with links to their publications about hydraulic fracturing since 2012.

From The Pueblo Chieftain (Chris Woodka):
Water rights and cost issues still must be decided, but a study of the effectiveness of dams in Fountain Creek should be finalized in January. The study’s release was delayed a month because of a federal government shutdown, but the results have been reported for months.
“There has been no study of costs and benefits,” David Mau, head of the Pueblo office of the U.S. Geological Survey told the Southeastern Colorado Water Conservancy District board Thursday. The USGS did the study in conjunction with the Fountain Creek Watershed Flood Control and Greenway District. The local share of funds for the $500,000 study was provided through $300,000 paid by Colorado Springs Utilities as part of its Pueblo County 1041 permit conditions for the Southern Delivery System.
The study looks at a 100-year storm centered over downtown Colorado Springs, and the effectiveness of dams or diversions at various locations along Fountain Creek. The most effective alternatives were a large dam on Fountain Creek or a series of detention ponds south of Colorado Springs. Mau said the number of ponds was not as important as the volume of water that could be stored.
There were some snickers in the room when Mau pointed out that roads and railroad tracks would have to be moved to build a large dam approximately 10 miles from the confluence of Fountain Creek. But it was pointed out that a large flood also could relocate roads, railroad tracks and utility lines, as was the case in Northern Colorado in September. Pueblo County lost the Pinon Bridge in the 1999 flood.
Mau said the amount of sediment trapped by a dam would amount to 2,500 truckloads, but said smaller ponds also would require extensive maintenance to remain effective.
Board member Vera Ortegon asked Mau which alternative he would recommend.
“We look at the science,” Mau said. “I could give you my personal opinion, but I won’t.”
Meanwhile property owners continue to chip away at the Fryingpn-Arkansas Project debt. Here’s a report from Chris Woodka writing for The Pueblo Chieftain:
Property owners in nine counties will continue to make a dent in the federal debt for the Fryingpan-Arkansas Project next year. The Southeastern Colorado Water Conservancy District, the agency in charge of repaying the debt, will collect another $6.5 million in property taxes next year, most of which goes toward reducing the debt. The board reviewed the budget Thursday and is expected to pass it on Dec. 5. The district began paying off $129 million in federal loans in 1982 on a 50-year loan. The amount represents the region’s share of the $585 million cost to build the Fryingpan- Arkansas Project. About $36 million of the debt will remain at the end of the year, Executive Director Jim Broderick told the board Thursday.
The district collects 0.944 mills in property taxes in parts of Bent, Chaffee, Crowley, El Paso, Fremont, Kiowa, Otero, Pueblo and Prowers counties. Of that, 0.9 mills goes toward federal repayment and the rest toward operating expenses.
It also will collect $5.3 million in pass-through revenues from El Paso County to repay the federal government for building the Fountain Valley Conduit.
The district also collects funds through sale of Fry-Ark water, fees and grants.
The district’s operating budget is $2.24 million next year, with an additional $1.07 million in capital projects planned.
The enterprise budget, paid mostly by user fees, totals $2.8 million, which includes $880,000 in capital projects.
The district is responsible for paying the Bureau of Reclamation to operate and maintain the project. The district also allocates water to cities and farms, and provides legal protection of FryArk water rights.
More Southeastern Colorado Water Conservancy District coverage here.

Click here to read a copy. Click here for the release. Here’s the abstract:
Fourteen monitoring wells were sampled by the U.S. Geological Survey, in cooperation with the Bureau of Land Management, to better understand the chemistry and age of groundwater in the Piceance structural basin in Rio Blanco County, Colorado, and how they may relate to the development of underlying natural-gas reservoirs. Natural gas extraction in the area has been ongoing since at least the 1950s, and the area contains about 960 producing, shut-in, and abandoned natural-gas wells.

Here’s the release from the USGS (Jon Campbell/Leonard Konikow):
A new U.S. Geological Survey study documents that the Nation’s aquifers are being drawn down at an accelerating rate.
Groundwater Depletion in the United States (1900-2008) comprehensively evaluates long-term cumulative depletion volumes in 40 separate aquifers (distinct underground water storage areas) in the United States, bringing together reliable information from previous references and from new analyses.
“Groundwater is one of the Nation’s most important natural resources. It provides drinking water in both rural and urban communities. It supports irrigation and industry, sustains the flow of streams and rivers, and maintains ecosystems,” said Suzette Kimball, acting USGS Director. “Because groundwater systems typically respond slowly to human actions, a long-term perspective is vital to manage this valuable resource in sustainable ways.”
To outline the scale of groundwater depletion across the country, here are two startling facts drawn from the study’s wealth of statistics. First, from 1900 to 2008, the Nation’s aquifers, the natural stocks of water found under the land, decreased (were depleted) by more than twice the volume of water found in Lake Erie. Second, groundwater depletion in the U.S. in the years 2000-2008 can explain more than 2 percent of the observed global sea-level rise during that period.
Since 1950, the use of groundwater resources for agricultural, industrial, and municipal purposes has greatly expanded in the United States. When groundwater is withdrawn from subsurface storage faster than it is recharged by precipitation or other water sources, the result is groundwater depletion. The depletion of groundwater has many negative consequences, including land subsidence, reduced well yields, and diminished spring and stream flows.
While the rate of groundwater depletion across the country has increased markedly since about 1950, the maximum rates have occurred during the most recent period of the study (2000–2008), when the depletion rate averaged almost 25 cubic kilometers per year. For comparison, 9.2 cubic kilometers per year is the historical average calculated over the 1900–2008 timespan of the study.
One of the best known and most investigated aquifers in the U.S. is the High Plains (or Ogallala) aquifer. It underlies more than 170,000 square miles of the Nation’s midsection and represents the principal source of water for irrigation and drinking in this major agricultural area. Substantial pumping of the High Plains aquifer for irrigation since the 1940s has resulted in large water-table declines that exceed 160 feet in places.
The study shows that, since 2000, depletion of the High Plains aquifer appears to be continuing at a high rate. The depletion during the last 8 years of record (2001–2008, inclusive) is about 32 percent of the cumulative depletion in this aquifer during the entire 20th century. The annual rate of depletion during this recent period averaged about 10.2 cubic kilometers, roughly 2 percent of the volume of water in Lake Erie.
More USGS coverage here.

From The Pueblo Chieftain (Chris Woodka):
Wells in the Arkansas Valley protected the agriculture economy in 2012, but reduced pumping levels this year are likely to hurt farming if weather conditions don’t improve. “Wells provided a one-year hedge against drought,” Water Division 2 Engineer Steve Witte told the Lower Arkansas Valley Water Conservancy District board Wednesday. “To quote Dale Mauch (a Lamar-area farmer quoted in The Pueblo Chieftain last summer): ‘If you’ve got a well, you’ve got a crop.’ ” This year, the situation is worse for farmers who rely on wells. Because of in-state shortfalls, pumping levels have been curtailed for most farmers. Unless farmers use their own surface rights to augment wells, pumping levels will be at only 10 to 30 percent of normal, with many farmers forced to shut off the pumps completely.
Last year, farmers pumped about 110,000 acrefeet of water (36 billion gallons), which was roughly three-fourths of the historical average prior to restrictions. The farm economy suffered much more, however, because of other factors.
During the drought of 2011-12, soil moisture plummeted, a trend that has continued since 2000. There also was less water available to surface ditches in both years.
Another problem for farmers will be increased transit loss as water from storage is released to headgates downstream. Normal loss from Pueblo Dam to the Rocky Ford area would be about 12 percent, but with river levels lower, it increases to 50 percent, Witte said.
One ray of hope offered at the meeting is a steadily increasing snowpack that is approaching nearly normal levels at a few sites in the mountains. Statewide, snowpack was about 82 percent of normal Wednesday, 73 percent in the Arkansas River basin, but 94 percent in the Upper Colorado basin, which provides supplemental water to Arkansas River users.
However, snowpack in the Purgatoire River basin, which helps farmers below John Martin Dam, is far below average.
Reservoir levels are well below 2012, and at 2003 levels for Turquoise and Twin Lakes. Lake Pueblo is at 88 percent of normal, better than it was in 2003, after drought had tapped out water supplies.
From The Pueblo Chieftain (Chris Woodka):
A water quality study spawned 10 years ago is focusing on finding causes for sedimentation and loading of harmful elements like selenium and uranium into the Arkansas River. “The real desire is to assist resource managers to find the source of a problem and attack it there, rather than put an ineffective plan in place,” said David Mau, head of the U.S. Geological Survey Pueblo office. He spoke at Wednesday’s meeting of the Lower Arkansas Valley Water Conservancy District.
The study began through a 2003 agreement among Aurora, the Southeastern Colorado Water Conservancy District and the Upper Arkansas Water Conservancy District.
The water resources group also includes Colorado Springs Utilities, the Pueblo Board of Water Works and the Lower Ark district. Aurora provided the initial funding.
The purpose of the study was to establish a water quality baseline before large projects like the Preferred Storage Options Plan, Southern Delivery System and Arkansas Valley Conduit went online. The USGS cataloged existing data on the river.
A 2009-11 study looked at two threatened reaches of the Arkansas River: from Canon City to Lake Pueblo, and from Lake Pueblo to La Junta. Loading of solids and uranium were found in both reaches, while heavy loading of selenium from Fountain Creek was prevalent downstream.
Mau said studies will continue to pinpoint sources of the pollution to help minimize the impact on water quality as projects continue.

Here’s Circular 1384 from the United States Geological Service. Here’s the introduction to the report (Alley, W.M./Evenson, E.J./Barber, N.L./Bruce, B.W./Dennehy, K.F./Freeman, M.C./Freeman, W.O./Fischer, J.M./Hughes, W.B./Kennen, J.G./Kiang, J.E./Maloney, K.O./Musgrove, MaryLynn/Ralston, Barbara/Tessler, Steven/Verdin, J.P):
Executive Summary
The Omnibus Public Land Management Act of 2009 (Public Law 111-11) was passed into law on March 30, 2009. Subtitle F, also known as the SECURE Water Act, calls for the establishment of a “national water availability and use assessment program” within the U.S. Geological Survey (USGS). A major driver for this recommendation was that national water availability and use have not been comprehensively assessed since 1978.
This report fulfills a requirement to report to Congress on progress in implementing the national water availability and use assessment program, also referred to as the National Water Census. The SECURE Water Act authorized $20 million for each of fiscal years (FY) 2009 through 2023 for assessment of national water availability and use. The first appropriation for this effort was $4 million in FY 2011, followed by an appropriation of $6 million in FY 2012.
The National Water Census synthesizes and reports information at the regional and national scales, with an emphasis on compiling and reporting the information in a way that is useful to states and others responsible for water management and natural-resource issues. The USGS works with Federal and non-Federal agencies, universities, and other organizations to ensure that the information can be aggregated with other types of water-availability and socioeconomic information, such as data on food and energy production. To maximize the utility of the information, the USGS coordinates the design and development of the effort through the Federal Advisory Committee on Water Information.
A National Water Census is a complex undertaking, particularly because there are major gaps in the information needed to conduct such an assessment. To maximize progress, the USGS engaged stakeholders in a discussion of priorities and leveraged existing studies and program activities to enhance efforts toward the development of a National Water Census.
From The Pueblo Chieftain (Chris Woodka):
The census is being developed by the U.S. Geological Survey and will provide additional tools for water planners to use in making projections. The survey will look at competing demands for water resources and supply scenarios.
Water planning of this type already is occurring in water-short areas.
The Bureau of Reclamation last year completed an assessment on the Colorado River. The Colorado Water Conservation Board has developed decision-support systems for the Colorado River and Rio Grande basins and is working on similar models for the South Platte and Arkansas river basins.

Here’s a report about the recent USGS assessment of water quality at Lake Mead, from Bob Berwyn writing for the Summit County Citizens Voice. Here’s an excerpt:
Overall, the U.S. Bureau of Reclamation said that Lake Mead’s water quality is good and that fish populations are holding their own. Lake Mead is even providing habitat for an increasing number of birds. But the report also acknowledges that invasive quagga mussels have become the dominant lake-bottom organism, posing significant threat to the Lake Mojave and Lake Mead ecosystems. The report also acknowledges the long-term threat of climate change, which will bring reduced water supplies to the entire Colorado River Basin.
“While the Lake Mead ecosystem is generally healthy and robust, the minor problems documented in the report are all being addressed by the appropriate agencies, and are showing substantial improvement since the mid 1990′s,” said U.S. Geological Survey hydrologist Michael Rosen.
Major findings detailed in the report include the following:
Basic water-quality parameters are within good ranges of Nevada and Arizona standards and EPA lake criteria. Potential problems with nutrient balance, algae, and dissolved oxygen can occur at times and in some areas of Lake Mead. The Lake Mead-wide scope of monitoring provides a solid baseline to characterize water quality now and in the future. Legacy contaminants are declining due to regulations and mitigation efforts in Las Vegas Wash. Emerging contaminants, including endocrine disrupting compounds, are present in low concentrations. While emerging contaminants, such as pharmaceuticals, personal care products, or plasticizers have been documented to cause a number of health effects to individual fish, they are not seen at concentrations currently known to pose a threat to human health. In comparison to other reservoirs studied by the U.S. Environmental Protection Agency, Lake Mead is well within the highest or ‘good’ category for recreation and aquatic health. Lake Mead and Lake Mohave continue to provide habitat conditions that support a rich diversity of species within the water, along shorelines, and in adjacent drainage areas, including organisms that are both native and non-native to the Colorado River drainage. Sport fish populations appear stable and have reached a balance with reservoir operations over the past 20 years and are sufficient to support important recreational fishing opportunities. Native fish populations within Lake Mohave are declining, but the small native fish populations in Lake Mead are, stable without any artificial replenishment. Lake Mead and Lake Mohave provide important migration and wintering habitat for birds. Trends include increasing numbers of wintering bald eagles and nesting peregrine falcons. Lake Mead water-level fluctuations have produced a variety of shorebird habitats, but songbird habitats are limited. Although some contaminants have been documented in birds and eggs in Las Vegas Wash, mitigation efforts are making a positive change. Invasive quagga mussels have become the dominant lake-bottom organism and are a significant threat to the ecosystems of Lake Mead and Lake Mohave because they have potential to alter water quality and food-web dynamics. Although they increase water clarity, they can degrade recreational settings. Climate models developed for the Colorado River watershed indicate a high probability for longer periods of reduced snowpack and therefore water availability for the Lake Mead in the future. Federal, state and local agencies, and individuals and organizations interested the future of the water supply and demand imbalance are working together to examine strategies to mitigate future conditions.
NEW! Amusing Water Cycle diagram for Kids of all ages http://t.co/h4nBpz8d #teachers #FAOnews pic.twitter.com/ylldl1Tb
— USGS (@USGS) January 3, 2013
Because kids can never have too many tools to use when teaching adults.
More USGS coverage here.
Can ground water withdrawal make the land subside? Yes, more than 28 feet as documented by this amazing photo. pic.twitter.com/0F2EQTvV
— USGS (@USGS) January 2, 2013
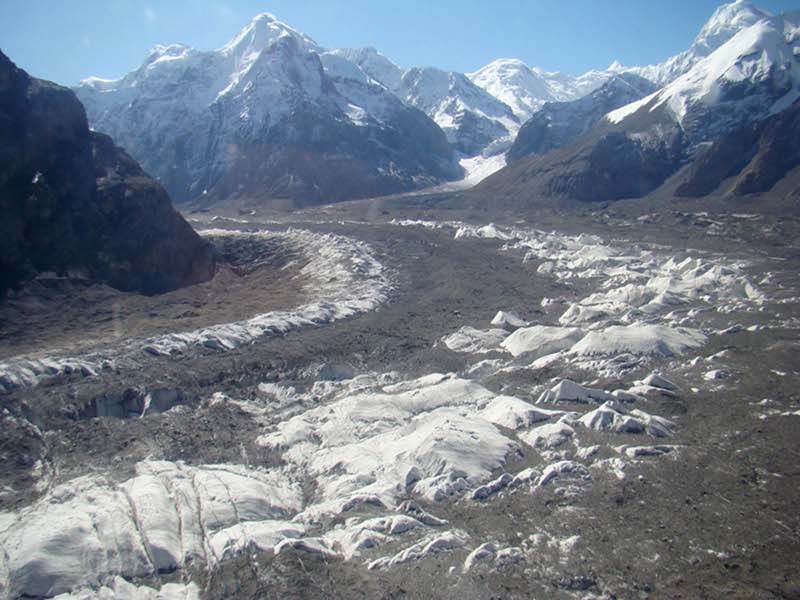
One measure of Climate Change — constantly shifting vegetation — is the subject of a new report from the United States Geological Service, the National Wildlife Service and Arizona State University. Here’s the release.
Plant and animal species are shifting their geographic ranges and the timing of their life events – such as flowering, laying eggs or migrating – at faster rates than researchers documented just a few years ago, according to a technical report on biodiversity and ecosystems used as scientific input for the 2013 Third National Climate Assessment.
The report, Impacts of Climate Change on Biodiversity, Ecosystems, and Ecosystem Services, synthesizes the
scientific understanding of the way climate change is affecting ecosystems, ecosystem services and the diversity of species, as well as what strategies might be used by natural resource practitioners to decrease current and future risks. More than 60 federal, academic and other scientists, including the lead authors from the U.S. Geological Survey, the National Wildlife Federation and Arizona State University in Tempe, authored the assessment.“These geographic range and timing changes are causing cascading effects that extend through ecosystems, bringing together species that haven’t previously interacted and creating mismatches between animals and their food sources,” said Nancy Grimm, a scientist at ASU and a lead author of the report.
Grimm explained that such mismatches in the availability and timing of natural resources can influence species’ survival; for example, if insects emerge well before the arrival of migrating birds that rely on them for food, it can adversely affect bird populations. Earlier thaw and shorter winters can extend growing seasons for insect pests such as bark beetles, having devastating consequences for the way ecosystems are structured and function. This can substantially alter the benefits people derive from ecosystems, such as clean water, wood products and food.
“The impact of climate change on ecosystems has important implications for people and communities,” said Amanda Staudt, a NWF climate scientist and a lead author on the report. “Shifting climate conditions are affecting valuable ecosystem services, such as the role that coastal habitats play in dampening storm surge or the ability of our forests to provide timber and help filter our drinking water.”
Another key finding is the mounting evidence that population declines and increased extinction risks for some plant and animal species can be directly attributed to climate change. The most vulnerable species are those already degraded by other human-caused stressors such as pollution or exploitation, unable to shift their geographic range or timing of key life events, or that have narrow environmental or ecological tolerance. For example, species that must live at high altitudes or live in cold water with a narrow temperature range, such as salmon, face an even greater risk due to climate change.
“The report clearly indicates that as climate change continues to impact ecological systems, a net loss of global species’ diversity, as well as major shifts in the provision of ecosystem services, are quite likely,” said Michelle Staudinger, a lead author of the report and a USGS and University of Missouri scientist.
For example, she added, climate change is already causing shifts in the abundance and geographic range of economically important marine fish. “These changes will almost certainly continue, resulting in some local fisheries declining or disappearing while others may grow and become more valuable if fishing communities can find socially and economically viable ways to adapt to these changes.”
Natural resource managers are already contending with what climate change means for the way they approach conservation. For example, the report stated, land managers are now more focused on the connectivity of protected habitats, which can improve a species’ ability to shift its geographic range to follow optimal conditions for survival.
“The conservation community is grappling with how we manage our natural resources in the face of climate change, so that we can help our ecosystems to continue meeting the needs of both people and wildlife,” said Bruce Stein, a lead author of the report and director of climate adaptation at the National Wildlife Federation.
Other key findings of the report include:
Changes in precipitation and extreme weather events can overwhelm the ability of natural systems to reduce or prevent harm to people from these events. For example, more frequent heavy rainfall events increase the movement of nutrients and pollutants to downstream ecosystems, likely resulting not only in ecosystem change, but also in adverse changes in the quality of drinking water and a greater risk of waterborne-disease outbreaks.
Changes in winter have big and surprising effects on ecosystems and their services. Changes in soil freezing, snow cover and air temperature affect the ability of ecosystems to store carbon, which, in turn, influences agricultural and forest production. Seasonally snow-covered regions are especially susceptible to climate change because small precipitation or temperature shifts can cause large ecosystem changes. Longer growing seasons and warmer winters are already increasing the likelihood of pest outbreaks, leading to tree mortality and more intense, extensive fires. Decreased or unreliable snowfall for winter sports and recreation will likely cause high future economic losses.
The ecosystem services provided by coastal habitats are especially vulnerable to sea-level rise and more severe storms. The Atlantic and Gulf of Mexico coasts are most vulnerable to the loss of coastal protection services provided by wetlands and coral reefs. Along the Pacific coast, long-term dune erosion caused by increasing wave heights is projected to cause problems for communities and for recreational beach activities. However, other kinds of recreation will probably improve due to better weather, with the net effect being that visitors and tourism dollars will shift away from some communities in favor of others.
Climate change adaptation strategies are vital for the conservation of diverse species and effective natural resource policy and management. As more adaptive management approaches are developed, resource managers can enhance the country’s ability to respond to the impacts of climate change through forward-looking and climate science-informed goals and actions.
Ecological monitoring needs to be improved and better coordinated among federal and state agencies to ensure the impacts of climate change are adequately monitored and to support ecological research, management, assessment and policy. Existing tracking networks in the United States will need to improve coverage through time and in geographic area to detect and track climate-induced shifts in ecosystems and species.
Background:
Federal law requires that the U.S. Global Change Research Program submit an assessment of climate change and its impacts to the President and the Congress once every four years. Technical reports, articles and books – such as this report — underpin the corresponding chapters of the Third U.S. National Climate Assessment, due out in 2013. This technical report is available at the USGCRP website, as are other completed technical reports. Additional lead authors of this report include Shawn Carter, USGS: F. Stuart Chapin III, University of Alaska, Fairbanks; Peter Kareiva, The Nature Conservancy; and Mary Ruckelshaus, Natural Capital Project.
From the Fort Collins Coloradoan (Bobby Magill):
A changing climate is stressing out plants, animals and the ecosystems they inhabit to a greater degree than at any other period in human history, according to a U.S. Geological Survey, National Wildlife Federation and University of Arizona report released Tuesday. The report will be part of the federal government’s 2013 National Climate Assessment.
Climate change is forcing plants and animals to shift where they live and grow more quickly than expected, the report concludes. Mountain species are moving upward in elevation at rates up to three times greater than scientists estimated because of a warming climate.
Biological diversity across the planet is expected to decline while extreme weather could mean heavy rains in places that aren’t accustomed to them.
More USGS coverage here.
What does 42,300 CFS look like? River-level view from this week's high-flow experiment at Glen Canyon Dam pic.twitter.com/fbqPzljt
— USGS (@USGS) November 20, 2012
Rec groups praises high flow release by @Interior at Glen Canyon- shows how all sides can win http://t.co/5JAlMn3Y pic.twitter.com/BKdOQL3Y
— Business for Water (@BWStewardship) November 19, 2012
Glen Canyon Dam 2012 High Flow Experimental Release Conducted http://t.co/UYk0254e pic.twitter.com/U9rbDyqa
— Bureau of Reclamation (@usbr) November 20, 2012
Here’s the release from Protect the Flows (Molly Mugglestone):
Today, the U.S. Department of the Interior triggered the first “high-flow experimental release” at Glen Canyon Dam since 2008.
According to Interior, the release, which will last nearly five days, is part of a new long-term protocol to meet water and power needs, allow better conservation of sediment downstream, and better control the non-native fish population from preying on other species. The high release flows are geared to mimic historical pre-dam spring floods and runoffs.
Protect the Flows member George Wendt, President and CEO of OARS Outdoor Adventure River Specialists, which has been providing Grand Canyon rafting experiences since 1969, made the following statement in response:
“The water released this week is the first in a long term plan that will help to build new camping beaches in the Grand Canyon, and ultimately, will improve the canyon experience for boaters supporting a $26 billion recreation economy that depends on the Colorado River. We applaud the Department of Interior for taking these important steps that take into consideration the long term use of the canyon by boaters. This release shows an attempt at good stewardship of the area and is an example of how the conservation community and those who love to recreate on the river worked together with the Department of Interior on a solution that both fish and rafters will benefit from for years to come.”
Here’s the release from the U.S. Department of Interior (Blake Androff/Lisa Iams):
Secretary of the Interior Ken Salazar today triggered the first “high-flow experimental release” at Glen Canyon Dam, under a new experimental long-term protocol to better distribute sediment to conserve downstream resources, while meeting water and power needs and allowing continued scientific experimentation, data collection, and monitoring on the Colorado River.
The new protocol calls for experimental releases from the dam through 2020 to send sediment downstream to rebuild sandbars, beaches, and backwaters. The rebuilt areas will provide key wildlife habitat, enhance the aquatic food base, protect archeological sites, and create additional camping opportunities in the canyon.
“This is truly an historic milestone for the Colorado River, Grand Canyon National Park, and the United States Bureau of Reclamation,” said Salazar. “It was an honor to open the door to a new era for Glen Canyon Dam operations and the ecology of Glen Canyon National Recreation Area and Grand Canyon National Park – a new era in which we realize that the goals of water storage, delivery and hydropower production are compatible with improving and protecting the resources of the Colorado River.”
The new protocol is built on more than 16 years of scientific research and experimentation conducted under the Glen Canyon Dam Adaptive Management Program. The Department translated the research into a flexible framework that enables scientists to determine, based on the best available science, when the conditions are right to conduct these releases to maximize the ecosystem benefits along the Colorado River corridor in Glen Canyon National Recreation Area and Grand Canyon National Park.
With the Glen Canyon Powerplant running at full capacity, Secretary Salazar opened the river outlet tubes at noon, releasing additional flows that will increase throughout the day until a maximum release of approximately 42,300 cubic-feet-per-second is reached. These releases will continue for nearly five days based on the parameters specified in the protocol and the volume of sediment deposited by the Paria River since late July, which scientists estimate is approximately 500,000 metric tons, enough to fill a football field 230 feet deep.
Through the foundation laid by the protocol, annual experiments can be conducted through 2020 to evaluate the effectiveness of multiple high flow experimental (HFE) releases in rebuilding and conserving sandbars, beaches, and associated backwater habitats that have been lost or depleted since the dam’s construction and operation. The protocol identifies the conditions under which a high flow release will likely yield the greatest conservation and beneficial use of sediment deposited by inflows from Colorado River tributaries as a result of rainstorms, monsoons, and snowmelt.
“Favorable sediment conditions in the system only occur periodically, so the ability to respond quickly and make the best use of those deposits when the time is right is essential,” said Anne Castle, Assistant Secretary of the Interior for Water and Science. “Today’s experimental release under the new protocol represents a significant milestone in our collective ability to be nimble and responsive to on-the-ground conditions for the benefit of downstream resources.”
HFE releases simulate natural flood conditions that suspend and redeposit sand stored in the river channel to provide key wildlife habitat—including habitat for the endangered humpback chub, protect archaeological sites, enhance riparian vegetation, maintain or increase recreation opportunities, and improve the wilderness experience along the Colorado River in Glen and Grand canyons. Single experimental releases were conducted in 1996, 2004, and 2008, and included extensive scientific research, monitoring, and data collection by the U.S. Geological Survey’s Grand Canyon Monitoring and Research Center, the Bureau of Reclamation, the National Park Service, and the U.S Fish and Wildlife Service.
“These high-flow releases, a new paradigm in water management, recognize that there are hugely beneficial impacts to river ecology from releasing the requisite water needed downstream in large pulses, rather than uniformly throughout the year,” said USGS Director Marcia McNutt. “In the arid West, non-uniform flow better mimics the natural environment in which the plants and animals flourished.”
This scientific process will continue and the knowledge gained from today’s experimental high flow will be used to make further refinements in determining the optimal timing, duration, frequency, and conditions for future releases as well as to inform other management actions on the river.
“As the 1992 Grand Canyon Protection Act emphasizes, the resources of the Grand Canyon are fragile, and conservation of those resources can only be achieved through wise management by today’s leaders,” said National Park Service Director Jonathan B. Jarvis. “Today’s event marks the beginning of the next generation of wisdom for managing this special place. We have only one Grand Canyon. We want to thank the Secretary for his leadership and conservation of this special place now and into the future.”
The protocol represents one of two important milestones in the history of the Colorado River. The second, a program to control non-native fish species, provides a framework for actions and research to protect native endangered fish in the river downstream of the dam. The finalization of both efforts involved extensive government-to-government consultation with Native American tribes to ensure implementation of the programs in a manner that respects tribal perspectives.
“The Bureau of Indian Affairs supports the cooperating tribes’ active involvement in the Glen Canyon Dam Adaptive Management Program,” said Assistant Secretary for Indian Affairs Kevin Washburn. “Many of their insights were incorporated into the process leading to the HFE event. Their strong connections to the Grand Canyon, including their cultural, historic and religious ties, give them a unique perspective on this national treasure. I want to thank the tribes for their long stewardship and their full participation in this important effort to conserve and protect the Colorado River ecosystem.”
The additional water released as part of the HFE is part of the annual water delivery to the Lake Mead. “The volume of water we are releasing during this high flow experiment does not change the overall volume of water delivery in the 2013 water year,” said Reclamation Commissioner Michael L. Connor. “The current operations plan based on forecast data calls for releasing 8.23 million acre-feet of water from the dam to meet delivery obligations to the Lower Colorado River Basin and Mexico. The experimental flows are included in that total annual volume and will be offset by adjustments to the monthly release volumes throughout the rest of the water year.”
“This new protocol developed by Reclamation will protect both the Grand Canyon and the delivery of water for communities, agriculture and industry,” Salazar noted. “We are taking a practical approach. If, for any reason, the new high-flow experiments do not yield the positive results we anticipate, we have the ability to change and adjust future flows.”
In addition to the opportunities for HFE releases made possible under the protocol, Secretary Salazar has initiated the first comprehensive analysis of Glen Canyon Dam operations since 1996. The Glen Canyon Dam Long-Term Experimental and Management Plan Environmental Impact Statement will build on information obtained through the Adaptive Management Program and activities conducted under the protocol to analyze a broad scope of dam operations and other related activities. The goal is to determine specific alternatives that could be implemented to improve and protect downstream resources while adhering to applicable laws. Reclamation and the National Park Service are jointly developing the LTEMP EIS, which will ultimately integrate and further refine actions conducted under the protocol.
Here’s a technical description of what the USGS hopes to accomplish (Jack Schmidt/Barbara Wilcox). Here’s an excerpt:
“Throughout summer and fall 2012, the USGS research team developed, and continually revised, estimates of the total amount of sand and of mud delivered by the Paria River, as well as estimating the fate of that fine sediment as it was transported further downstream through the Grand Canyon,” said Jack Schmidt, chief of the USGS Grand Canyon Monitoring and Research Center. “These data are the scientific foundation on which the planned high-flow experiment is based. Without the estimates of the amount of sand and mud delivered from tributaries, it would not have been possible to implement the Protocol for these high flow experiments. The entire program of utilizing small controlled floods to rehabilitate the Grand Canyon ecosystem depends on state-of-the-science monitoring efforts by the USGS to measure sediment transport rates in real time and to provide those data to the Bureau of Reclamation and to other agencies.
“The USGS program of measuring and reporting sand and mud transport in real time and in such a challenging environment is unprecedented in the scientific management of rivers,” Schmidt said.
USGS data show that the Paria River delivered at least 593,000 tons of sand to the Colorado River between late July and the end of October 2012 – enough to fill a building the size of a 100-yard NFL football field about 24 stories high. Long-term measurements show that this amount is about 26 percent less than delivered by the Paria in an average year, but is still sufficient to trigger a small controlled flood intended to rehabilitate the downstream ecosystem.
From the Associated Press via Las Vegas Review-Journal:
Interior Secretary Ken Salazar opened the river outlet tubes at noon and called it “an historic milestone” and “a new era in which we realize that the goals of water storage, delivery and hydropower production are compatible with improving and protecting the resources of the Colorado River.” The peak flow will last 24 hours from Monday night into Tuesday, and the river will run high for five days…
The experiment could hurt next year’s fishing – and complicate hydropower production and water storage – in the name of a more environmentally correct river…
Previous experiments in 1996, 2004 and 2008 were one-time fact-finding missions instead of fundamental shifts in river management.
“This (Obama) administration can be patted on the back and thanked for doing what we’ve been trying to do, seriously, for 15 years,” Lash added.
The previous experiments yielded mixed results, partly because a return to up-and-down flows timed partly to regional summer hydropower needs wiped out many of the new beaches and sandbars.
Advocates hope the effects will be longer lasting if these floods come more regularly and if a longer-term Interior Department planning effort leads to steadier flows through the summers.
But critics say that there’s little environmental benefit and that it comes at a cost.
In comments submitted to the Interior Department before the decision to go forward with regular flushes, the Colorado River Energy Distributors Association, a group of nonprofit energy utilities, noted that previous springtime flood experiments helped boost the population of non-native trout that feed on the endangered humpback chub.

It’s no surprise that people settle near surface water. Here’s the release from the United States Geological Service (James Coles/Kara Capelli):
The loss of sensitive species in streams begins to occur at the initial stages of urban development, according to a new study by the USGS. The study found that streams are more sensitive to development than previously understood.
“We tend not to think of waterways as fragile organisms, and yet that is exactly what the results of this scientific investigation appear to be telling us,” said USGS Director Marcia McNutt. “Streams are more than water, but rather communities of interdependent aquatic life, the most sensitive of which are easily disrupted by urbanization.”
Contaminants, habitat destruction, and increasing streamflow flashiness resulting from urban development can degrade stream ecosystems and cause degradation downstream with adverse effects on biological communities and on economically valuable resources, such as fisheries and tourism.
For example, by the time urban development had approached 20 percent in watersheds in the New England area, the aquatic invertebrate community had undergone a change in species composition of about 25 percent.
The study also found that the health of highly-degraded streams can be improved by implementing management actions that are designed to reduce specific stressors.
“Biological communities were not resistant to even low levels of urban development. In the study sensitive invertebrate species were being lost over the initial stages of development in relatively undisturbed watersheds,” said Dr. Gerard McMahon, lead scientist on the study. “Understanding how stream ecosystems are impacted by urban development can assist in the development of management actions to protect and rehabilitate urban stream ecosystems.”
Multiple streams in nine metropolitan areas across the continental U.S. were sampled to assess the effects of urban development on stream ecosystems. Study areas include Atlanta, Ga., Birmingham, Ala., Boston, Mass., Dallas, Texas, Denver, Colo., Milwaukee, Wis., Portland, Ore., Raleigh, N.C., and Salt Lake City, Utah.
The study also found that the effects of urbanization on the biological community vary geographically depending on the predominant land cover and the health of the community prior to urban development. In the study, the greatest loss of sensitive species occurred in Boston, Portland, Salt Lake City, Birmingham, Atlanta, and Raleigh metropolitan areas, where the predominant land cover was forested prior to urban development. The smallest loss of sensitive species occurred in Denver, Dallas, and Milwaukee metropolitan areas where land cover was primarily agriculture before urban development.
“The reason for this difference was not because biological communities in the Denver, Dallas, and Milwaukee areas are more resilient to stressors from urban development, but because the biological communities had already lost sensitive species to stressors from pre-urban agricultural land use activities,” said McMahon.
Although urban development creates multiple stressors, such as an increase in concentrations of insecticides, chlorides, and nutrients, that can degrade stream health—no single factor was universally important in explaining the effects of urban development on stream ecosystems. The USGS developed an innovative modeling tool to predict how different combinations of urban-related stressors affect stream health. This tool, initially developed for the New England area, can provide insights on how watershed management actions to improve one or more of these stressors may increase the likelihood of obtaining a desired biological condition.
The effects of urbanization on streams, including information about this and past studies, as well as graphics and maps, and videos can be online.
Results of this nationwide study and details about the effects of urbanization on the nine metropolitan areas can be found in a new USGS publication titled, “Effects of urban development on stream ecosystems in nine metropolitan study areas across the United States.”
Management strategies used throughout the U.S. to reduce the impacts of urban development on stream ecosystems are described in a new USGS report written in partnership with the Center for Watershed Protection in Maryland titled, “Strategies for Managing the Effects of Urban Development on Streams.”
This study was done by the USGS National Water-Quality Assessment Program, which conducts regional and national assessments of the nation’s water quality to provide an understanding of water-quality conditions, whether conditions are getting better or worse over time, and how natural features and human activities affect those conditions.
More USGS coverage here.

Here’s the release the United States Geological Survey (Heidi Koontz/Jim Scott):
Warmer air temperatures since the 1980s may explain significant increases in zinc and other metal concentrations of ecological concern in a Rocky Mountain watershed, according to a new study published in the journal Environmental Science and Technology, led by the U.S. Geological Survey and the University of Colorado, Boulder.
Rising concentrations of zinc and other metals in the upper Snake River just west of the Continental Divide near Keystone, Colo., may be the result of falling water tables, melting permafrost, and accelerating mineral weathering rates, all driven by warmer air temperatures in the watershed. Researchers observed a fourfold increase in dissolved zinc over the last 30 years during the month of September.“This study provides another fascinating, and troubling, example of a cascading impact from climate warming as the rate of temperature-dependent chemical reactions accelerate in the environment, leaching metals into streams,” said USGS Director Marcia McNutt. “The same concentration of metals in the mountains that drew prospectors to the Rockies more than a century ago are now the source of toxic trace elements that are harming the environment as the planet warms.”
Increases in metals were seen in other months as well, with lesser increases seen during the high-flow snowmelt period. During the study period, local mean annual and mean summer air temperatures increased at a rate of 0.2-1.2 degrees Celsius per decade.
Generally, high concentrations of dissolved metals in the upper Snake River watershed are the result of acid rock drainage, or ARD, formed by natural weathering of pyrite and other metal-rich sulfide minerals in the bedrock. Weathering of pyrite forms sulfuric acid through a series of chemical reactions, and mobilizes metals like zinc from minerals in the rock and carries these metals into streams.
Increased sulfate and calcium concentrations observed over the study period lend weight to the hypothesis that the increased zinc concentrations are due to acceleration of pyrite weathering. The potential for comparable increases in metals in similar Western watersheds is a concern because of impacts on water resources, fisheries and stream ecosystems. Trout populations in the lower Snake River, for example, appear to be limited by the metal concentrations in the water, said USGS scientist Andrew Todd, lead researcher on the project.
“Acid rock drainage is a significant water quality problem facing much of the Western United States,” Todd said. “It is now clear that we need to better understand the relationship between climate and ARD as we consider the management of these watersheds moving forward.”
In cases where ARD is linked directly with past and present mining activities it is called acid mine drainage, or AMD. Another Snake River tributary, Peru Creek, is largely devoid of life due to AMD generated from the abandoned Pennsylvania Mine and smaller mines upstream, and has become a target for potential remediation efforts.
The Colorado Division of Reclamation Mining and Safety, in conjunction with other local, state and federal partners, is conducting underground exploration work at the mine to investigate the sources of heavy metals-laden water draining from the adit. The study conducted by Todd and colleagues has implications in such efforts because it suggests that establishing attainable clean-up objectives could be difficult if natural background metal concentrations are a “moving target.”
Collaborators include USGS, CU Boulder and the Institute of Arctic and Alpine Research (INSTAAR). The data analyzed for the study came from INSTAAR, the USGS and the U.S. Environmental Protection Agency.
From the Summit Daily News (Paige Blankenbuehler):
Rising concentrations of zinc and other metals in the upper Snake River west of the Continental Divide near Keystone may be the result of falling water tables, melting permafrost and accelerating mineral- weathering rates — all driven by warmer air temperatures in the watershed…
High concentrations of dissolved metals in the upper Snake River watershed are the result of acid rock drainage, according to the research. The drainage is a result from past and present mining activities.
More water pollution coverage here.

Here’s the release from the United States Geological Survey (Keelin R. Schaffrath):
Elevated levels of dissolved solids in water (salinity) can result in numerous and costly issues for agricultural, industrial, and municipal water users. The Colorado River Basin Salinity Control Act of 1974 (Public Law 93–320) authorized planning and construction of salinity-control projects in the Colorado River Basin. One of the first projects was the Lower Gunnison Unit, a project to mitigate salinity in the Lower Gunnison and Uncompahgre River Basins.
In cooperation with the Bureau of Reclamation (USBR), the U.S. Geological Survey conducted a study to quantify changes in salinity in the Gunnison River Basin. Trends in salinity concentration and load during the period water years (WY) 1989 through 2004 (1989–2004) were determined for 15 selected streamflow-gaging stations in the Gunnison River Basin. Additionally, trends in salinity concentration and load during the period WY1989 through 2007 (1989–2007) were determined for 5 of the 15 sites for which sufficient data were available. Trend results also were used to identify regions in the Lower Gunnison River Basin (downstream from the Gunnison Tunnel) where the largest changes in salinity loads occur. Additional sources of salinity, including residential development (urbanization), changes in land cover, and natural sources, were estimated within the context of the trend results. The trend results and salinity loads estimated from trends testing also were compared to USBR and Natural Resources Conservation Service (NRCS) estimates of off-farm and on-farm salinity reduction from salinity-control projects in the basin. Finally, salinity from six additional sites in basins that are not affected by irrigated agriculture or urbanization was monitored from WY 2008 to 2010 to quantify what portion of salinity may be from nonagricultural or natural sources.
In the Upper Gunnison area, which refers to Gunnison River Basin above the site located on the Gunnison River below the Gunnison Tunnel, estimated mean annual salinity load was 110,000 tons during WY 1989–2004. Analysis of both study periods (WY 1989–2004 and WY 1989–2007) showed an initial decrease in salinity load with a minimum in 1997. The net change over either study period was only significant during WY 1989–2007. Salinity load significantly decreased at the Gunnison River near Delta by 179,000 tons during WY 1989–2004. Just downstream, the Uncompahgre River enters the Gunnison River where there also was a highly significant decrease in salinity load of 55,500 tons. The site that is located at the mouth of the study area is the Gunnison River near Grand Junction where the decrease was the largest. Salinity loads decreased by 247,000 tons during WY 1989–2004 at this site though the decrease attenuated by 2007 and the net change was a decrease of 207,000 tons.
The trend results presented in this study indicate that the effect of urbanization on salinity loads is difficult to discern from the effects of irrigated agriculture and that natural sources contribute a fraction of the total salinity load for the entire basin. Based on the calculated yields and geology, 23–63 percent of the estimated annual salinity load was from natural sources at the Gunnison River near Grand Junction during WY 1989–2007. The largest changes in salinity load occurred at the Gunnison River near Grand Junction as well as the two sites located in Delta: the Gunnison River at Delta and the Uncompahgre River at Delta. Those three sites, especially the two sites at Delta, were the most affected by irrigated agriculture, which was observed in the estimated mean annual loads. Irrigated acreage, especially acreage underlain by Mancos Shale, is the target of salinity-control projects intended to decrease salinity loads.
The NRCS and the USBR have done the majority of salinity control work in the Lower Gunnison area of the Gunnison River Basin, and the focus has been in the Uncompahgre River Basin and in portions of the Lower Gunnison River Basin (downstream from the Gunnison Tunnel). According to the estimates from the USBR and NRCS, salinity-control projects may be responsible for a reduction of 117,300 tons of salinity as of 2004 and 142,000 tons as of 2007 at the Gunnison River near Grand Junction, Colo. (streamflow-gaging station 09152500). USBR and NRCS estimates account for all but 130,000 tons in 2004 and 65,000 tons in 2007 of salinity load reduction. The additional reduction could be a reduction in natural salt loading to the streams because of land-cover changes during the study period. It is possible also that the USBR and NRCS have underestimated changes in salinity loads as a result of the implementation of salinity-control projects.
Click here to download the report.