Top-5 Takeaways from Water Year 2026 — Allie Mazurek (#Colorado #Climate Center)

Click the link to read the article on the Colorado Climate Center website (Allie Mazurek):

October 22, 2026

On Tuesday [October 20, 2026], we released our Water Year 2026 report (available as an ArcGIS Storymap or PDF), and it’s one we won’t be forgetting about anytime soon. Record-warm temperatures were a key theme of the last 12 months, though there are plenty of other items worth remembering: from snowpack (or lack thereof) to drought and wildfires.

Here, we summarize five characteristics about Water Year 2026 that stood out to our team, and we encourage you to check out the full summary for much more!

Water Year 2026 at a glance. The top graph shows statewide WY2026 daily average temperatures compared to the 1991-2020 average. The second row shows monthly temperature anomalies and rankings for WY2026. The graph below that and the final row of panels shows the same as the two aforementioned rows, but for precipitation. Data from nClimGrid.

1. It was the warmest water year on record… by a lot.

Water Year 2026 had a number of temperature superlatives, and we’ll begin with an impressive list of statewide records. Considering data since 1895, Water Year 2026 featured the:

  • Warmest December
  • Warmest February
  • Warmest March
  • Warmest August
  • Warmest winter
  • Warmest spring
  • Warmest summer

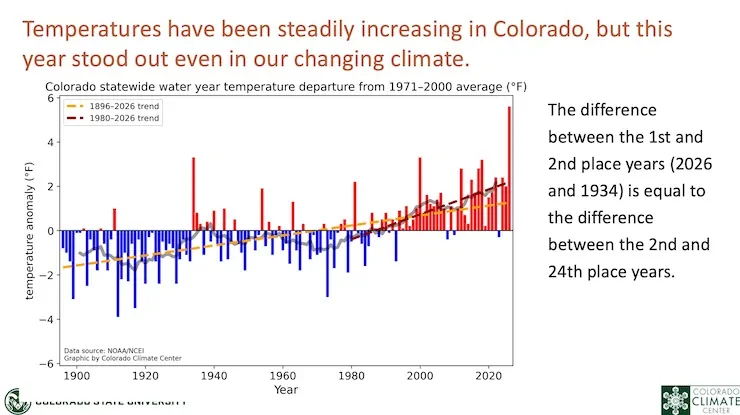
Statewide average temperatures for the 2026 Water Year were 4.5°F above the 1991-2020 average and over 2°F above the previous warmest water year on record (1934). Some of Colorado’s lower elevations set their new record water year-average temperature by an even wider margin:
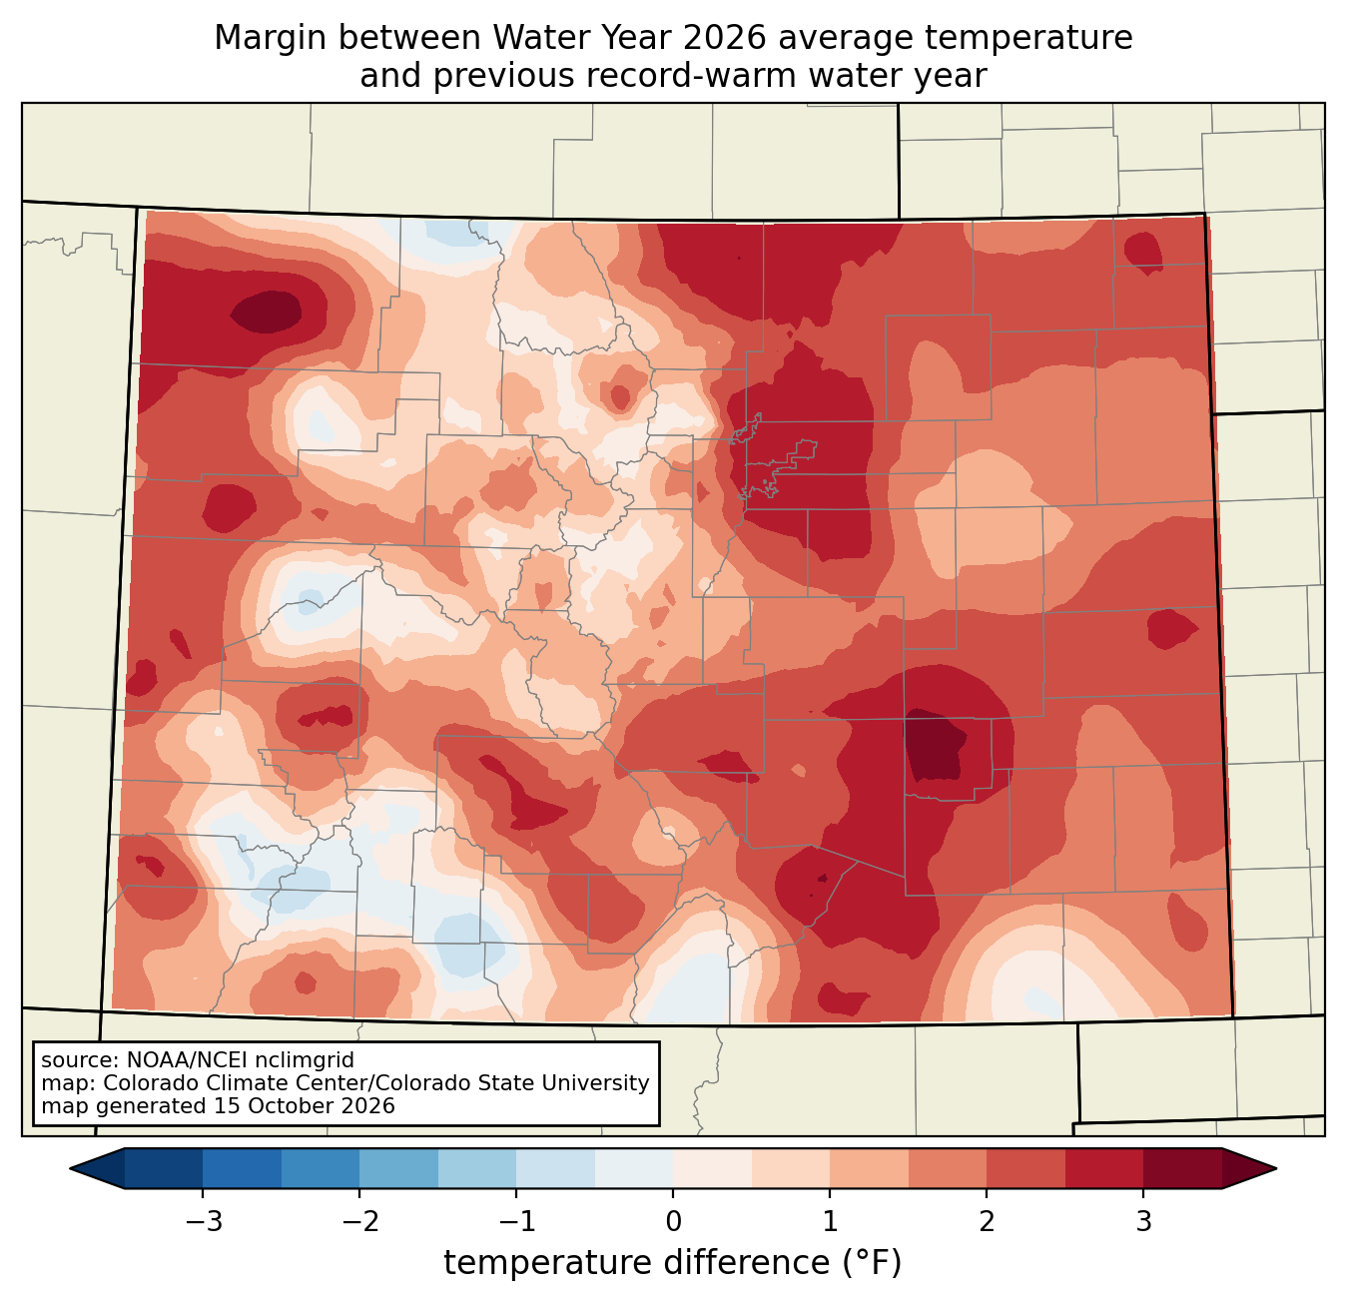
Temperature difference between Water Year 2026 and the previous warmest water year on record. Records date back to 1895. Data from nClimGrid.

Individual days throughout the water year were consistently warm. Statewide, 286 of our days (equating nearly 9.5 months!) were above average, meaning only 79 days were below average. 75 days (~2.5 months) were at least 10°F warmer than average, while only 13 days were at least 10°F below average.

New temperature records set in Water Year 2026 also leaned substantially warm rather than cool. Warm records (record highs and record warm lows) outweighed cool records (record lows and record cool highs) by ~21:1.

2. Colorado saw its lowest mountain snowpack on record.

Warm temperatures were a key contributor to our low mountain snowpack this year. Statewide, snowpack peaked at only ~51% of average, surpassing other well-known bad snow years (1977, 1981, 2002 and 2012). The snow drought was consistent across all of Colorado’s major river basins. According to snow course data (manual snow measurements), 60 of Colorado’s 64 sites with 50+ year records reported record-low snow water equivalent on April 1 (see map below). Though snowpack typically reaches its maximum in early April, most locations were already past peak, as ridiculously warm March temperatures (more on that below) began chipping away at our supply.
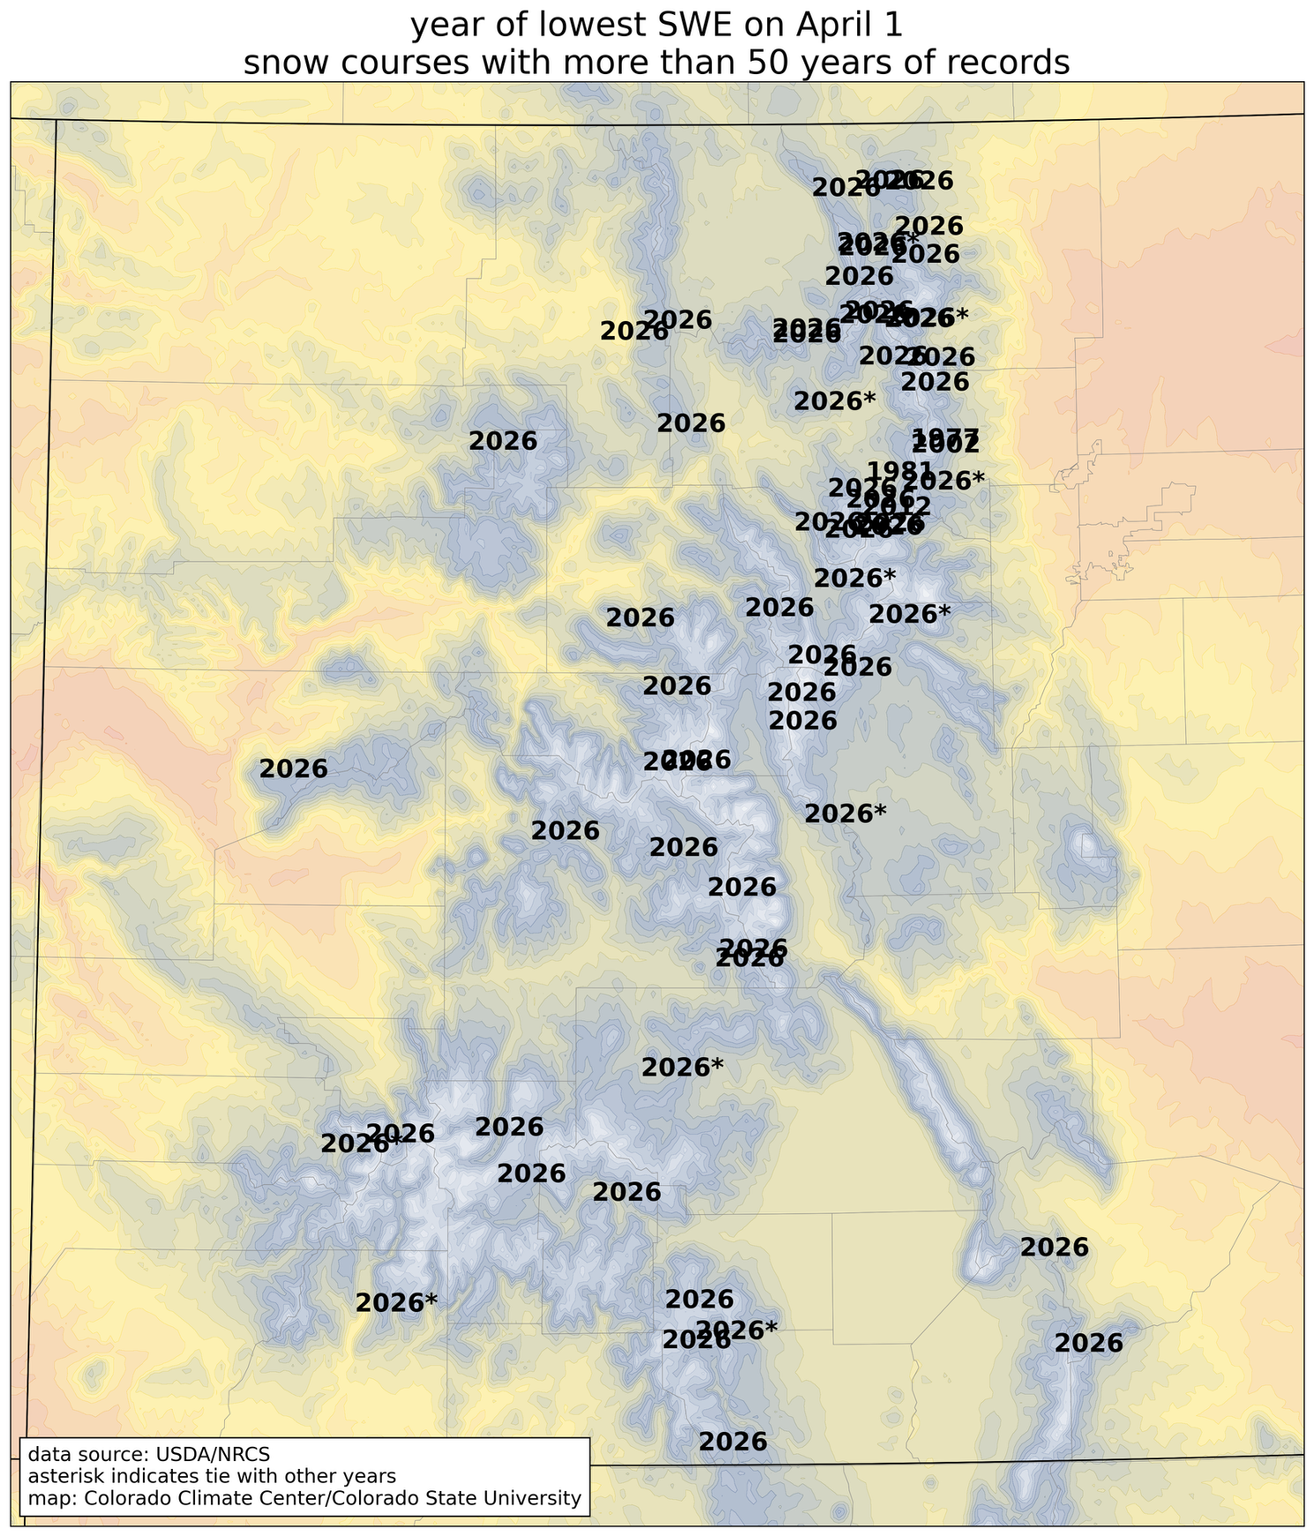
Year with the lowest snow water equivalent on April 1, for snow course sites with at least 50 years of data. Data from NRCS.

3. Warm temperatures, lack of precipitation, and low snowpack fostered widespread drought and limited our water supply.

Before the winter was even over, concerns quickly grew about what the low snowpack would mean for water supply and drought. In addition to being absurdly warm, March was the 3rd-driest on record statewide, and April brought additional major precipitation deficits to eastern Colorado. Unsurprisingly, drought conditions quickly deteriorated as a result. By the end of April, more than half of the state was seeing extreme or exceptional drought (the two most severe categories of drought in the USDM).

US Drought Monitor for Colorado valid April 28, 2026. At this point in the water year, ~59% of the state was experiencing extreme or exceptional drought conditions. Data produced by USDA/NDMC/NOAA/NASA.

Record-low snowpack predictably led to very low streamflows throughout the state. All of the state’s major rivers saw streamflows well below-normal. The map below shows that most streamgauge sites reported water year-averaged streamflow percentiles in the single digits. The poor runoff and warm temperatures also led to very low reservoir levels both in the state (such as Blue Mesa) and downstream (such as Lake Powell).
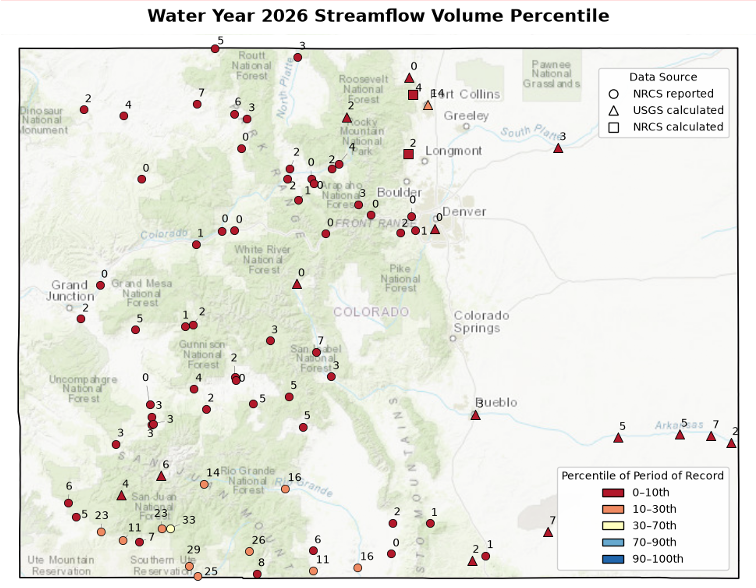
2026 WY-averaged streamflow percentiles for USGS and NRCS streamgauge sites. Data from USGS/NRCS.

4. The March heatwave was truly outlandish.

In late March, a significant heat dome over the western US brought record-smashing temperatures to the region. The statewide-average temperature for March was nearly 10°F above the 1991-2020 average. Monthly temperature records were obliterated, with some stations seeing values that exceeded monthly maxima for April. The heat was long-lasting: some areas of Colorado recorded a week’s worth of temperatures that were warmer than any other March day in the past 75 years (see the map below).

This remarkable heat wave took a tremendous toll on mountain snowpack, causing rapid meltoff that had never been recorded so early in the season. While numbers were already running way below-average heading into the spring, and the March heat took matters from bad to worse, solidifying that Water Year 2026 would record the lowest snowpack on record.
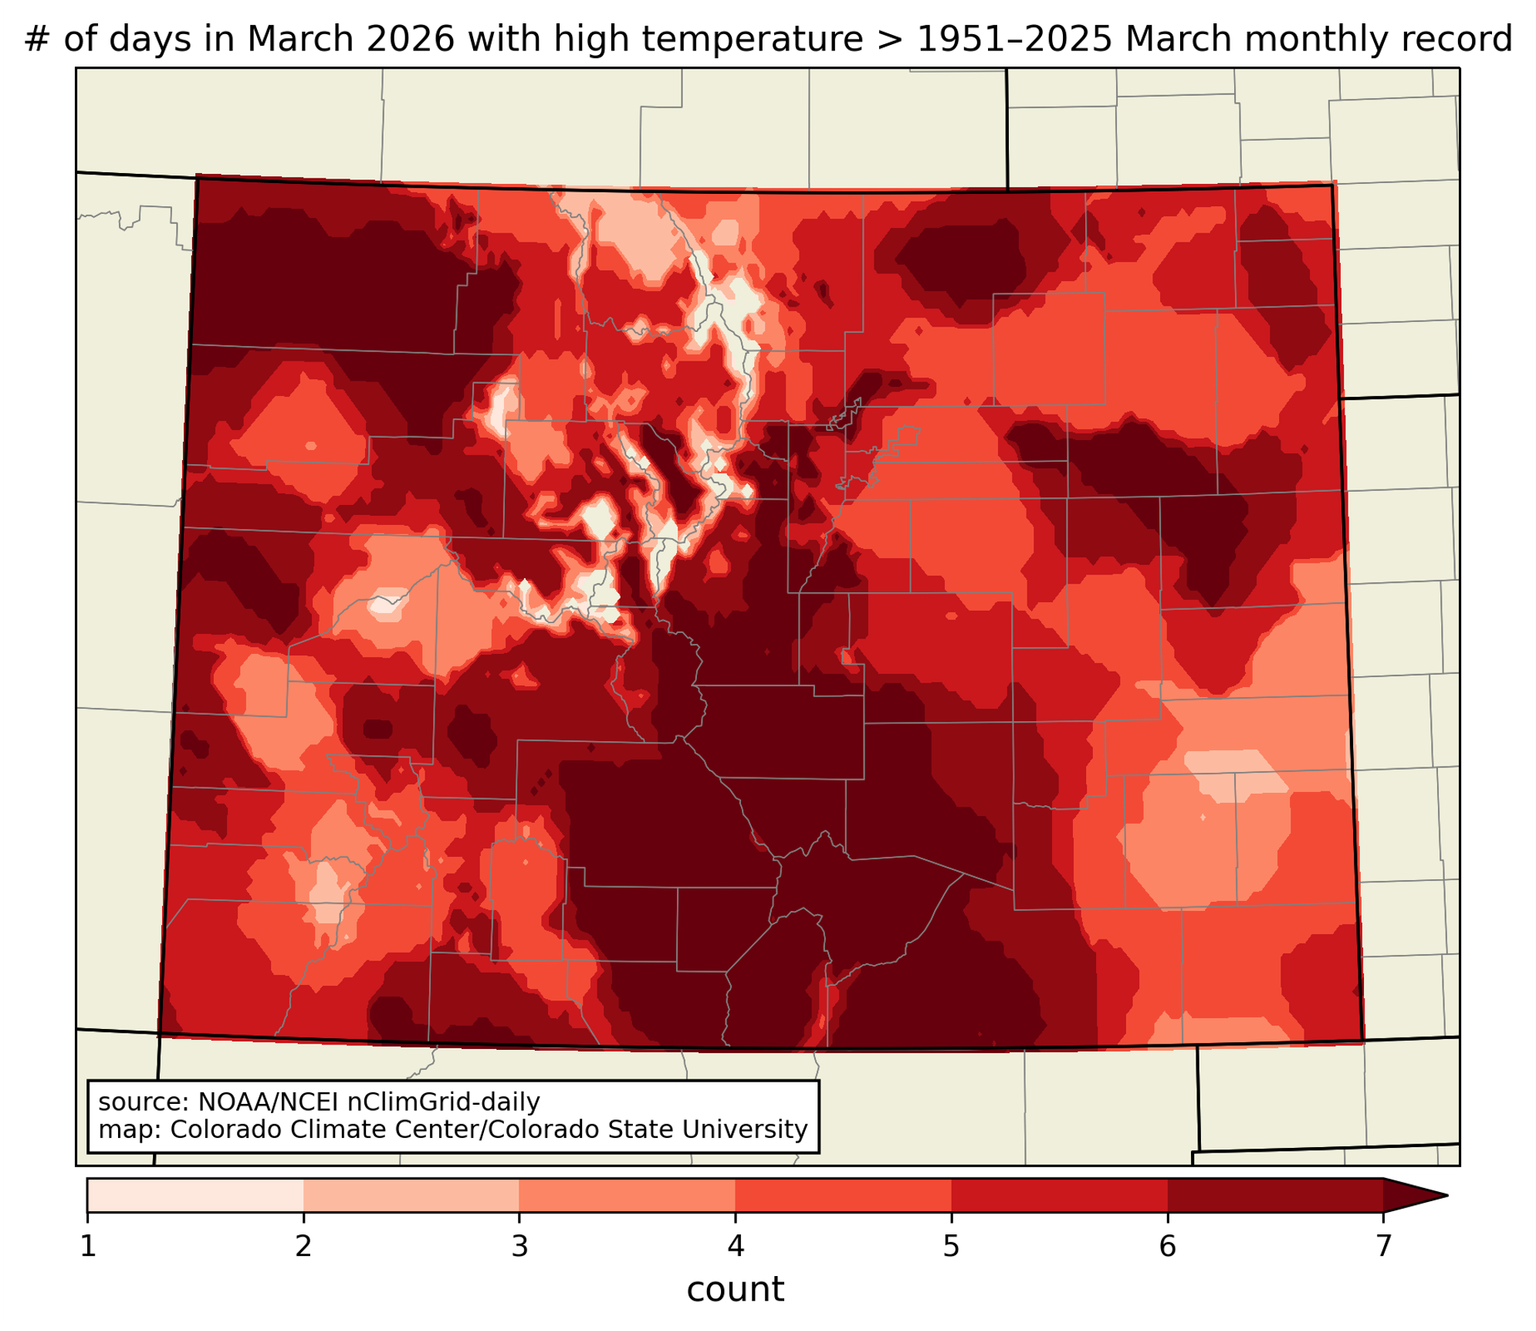
Number of March 2026 days that were warmer than any other March day in the last 75 years. Data from nClimGrid-daily.

5. Two of this year’s wildfires ranked as top-10 as far as acres burned.

Persistent well above-average temperatures and widespread drought created favorable conditions for wildfire development, and late June and July brought explosive wildfire growth. For example, the Aspen Acres Fire grew to 35,000 acres in just the first two days that it was burning. That fire, as well as the Ferris Fire, would go on to become two of Colorado’s largest wildfires on record by acres burned (ranking #7 and #10 respectively). As heavy precipitation returned later in the year, flash flooding was reported across some of the recent burn scar areas.

5000+ acre wildfires in 2026. Data from USDA, NIFC WFIGS, InFORM, and Interagency Wildland Fire Perimeter History.

Don’t forget to check out our full summary!

Here’s that link to the StoryMap again!

#LakePowell rose five feet in a week. #LakeMead is still at the bottom. What the Four Corners flood did, and did not do, for the #ColoradoRiver — The Kiowa County Press #COriver #aridification

Click the link to read the article on the Kiowa County Press website. Here’s an excerpt:

October 25, 2026

Three Pacific storms in five weeks have soaked the Southwest, and the third one, the remnants of Hurricane Trudy, turned into the flood that tore through southwest Colorado and northwest New Mexico on October 22 and 23. The water is now arriving in the Colorado River’s two great reservoirs, or rather in one of them. Lake Powell stood at 3,525 feet on October 23, up five feet in a week and eight and a half feet above the record low it set September 15. Lake Mead set a new record low of its own on October 22…For the river, the difference between the three storms is where the rain fell. Polo and Rachel mostly rained below Glen Canyon Dam, or on country that drains to Lake Mead through the tributaries between the two lakes. Trudy rained on the San Juan, the Animas, the Piedra and the Dolores, which feed Lake Powell. The Piedra ran at twice its previous record, the San Juan at Four Corners at nearly four times its record, and Navajo Reservoir, which catches the upper San Juan, gained about 215,000 acre-feet between October 12 and October 24, going from 50 percent full to 62. Vallecito Reservoir above Durango went from 55 percent full on October 12 to 86 percent, and Lemon Reservoir from 59 to 83. Lake Powell took in about 56,000 acre-feet on October 21, 104,000 on October 22 and 81,000 on October 23, against a Glen Canyon Dam release of about 13,000 acre-feet a day. Since October 12 the lake has gained about 340,000 acre-feet. It holds 5.5 million acre-feet, 24 percent of capacity. Reclamation’s weekly update of October 18, written before the flood, already had the Upper Basin at 214 percent of normal precipitation for the water year that began October 1. Lake Mead’s level has little to do with any of it. It depends on how much Glen Canyon Dam lets through and how much Hoover Dam sends on to Arizona, California, Nevada and Mexico. Glen Canyon has released a steady 6,600 cubic feet per second all month. Hoover was releasing 8,000 to 10,000 until October 23, when it dropped to about 5,600, according to Reclamation’s daily river report. The lake reached 1,037.16 feet on October 22, its lowest since it first filled, according to the agency’s Lake Mead elevation records, and rose half a foot by October 24 only because less water was leaving. It holds 6.8 million acre-feet, 26 percent of capacity.

How did last week’s #AnimasRiver flows compare with historical records? River peaked at 11,200 cubic feet per second Friday, less than half its all-time recorded high — The #Durango Herald

Durango flood of 1911 river scene. Photo credit Center of Southwest Studies, Fort Lewis College.

Click the link to read the article on The Durango Herald website (Shane Benjamin). Here’s an excerpt:

October 25, 2026

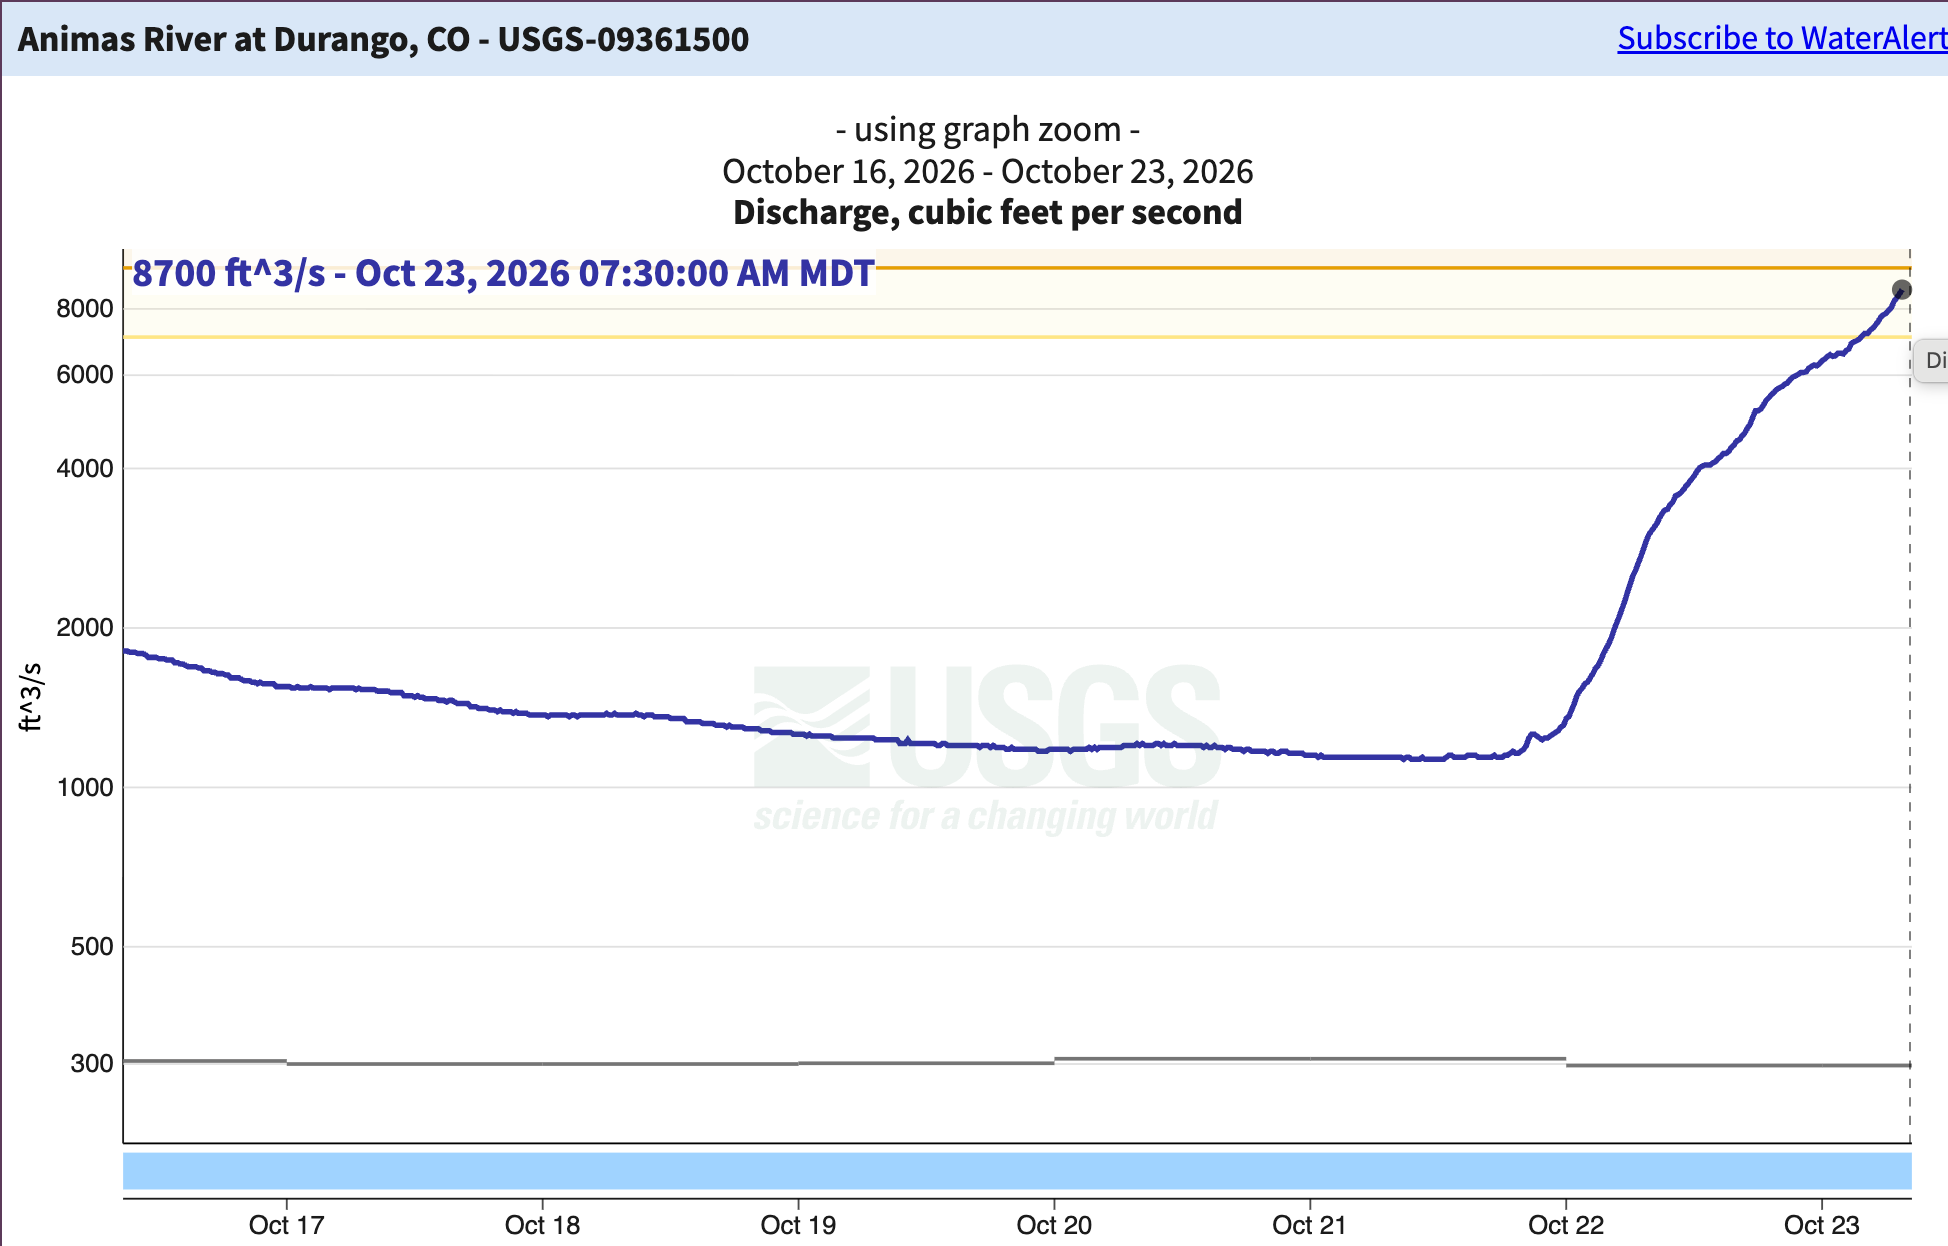
Heavy rain from the remnants of Hurricane Trudy that dumped 3 to 5 inches of rain across Southwest Colorado in about 24 hours Thursday caused the Animas River to overflow its banks and reminded residents of the risk of living in a 100-year flood plain. The swollen river reached a flow of 11,200 cubic feet per second at 2 p.m. Friday in Durango. That was nearly eight times the previous 2026 peak of 1,450 cfs, recorded May 15…Still, Friday’s surge was less than half the river’s highest recorded flow. On Oct. 5, 1911, the Animas River reached an estimated 25,000 cfs. And not far behind: On June 29, 1927, it reached an estimated 20,000 cfs.

The Animas River in Durango reached 8,700 feet and rising as of 7:30 a.m. on Friday. That’s the highest it has been since the flood of 1970 (11,600 cfs) and the 11th highest since consistent measurements began in 1911 (though it’s likely to move into 10th place later today). Further downstream, the Cedar Hill gage near the New Mexico-Colorado line was reading 10,800 cfs on Friday morning, and will likely continue to rise, with the potential for downstream flooding (it will also add to the San Juan River’s considerable flows).

October floods: ‘This is a legendary event’. Heavy rains feed record river flows, close roads and force evacuations along the #RioGrande from South Fork into Conejos County as emergency managers assess the damage — Owen Woods and Chris Lopez (AlamosaCitizen.com)

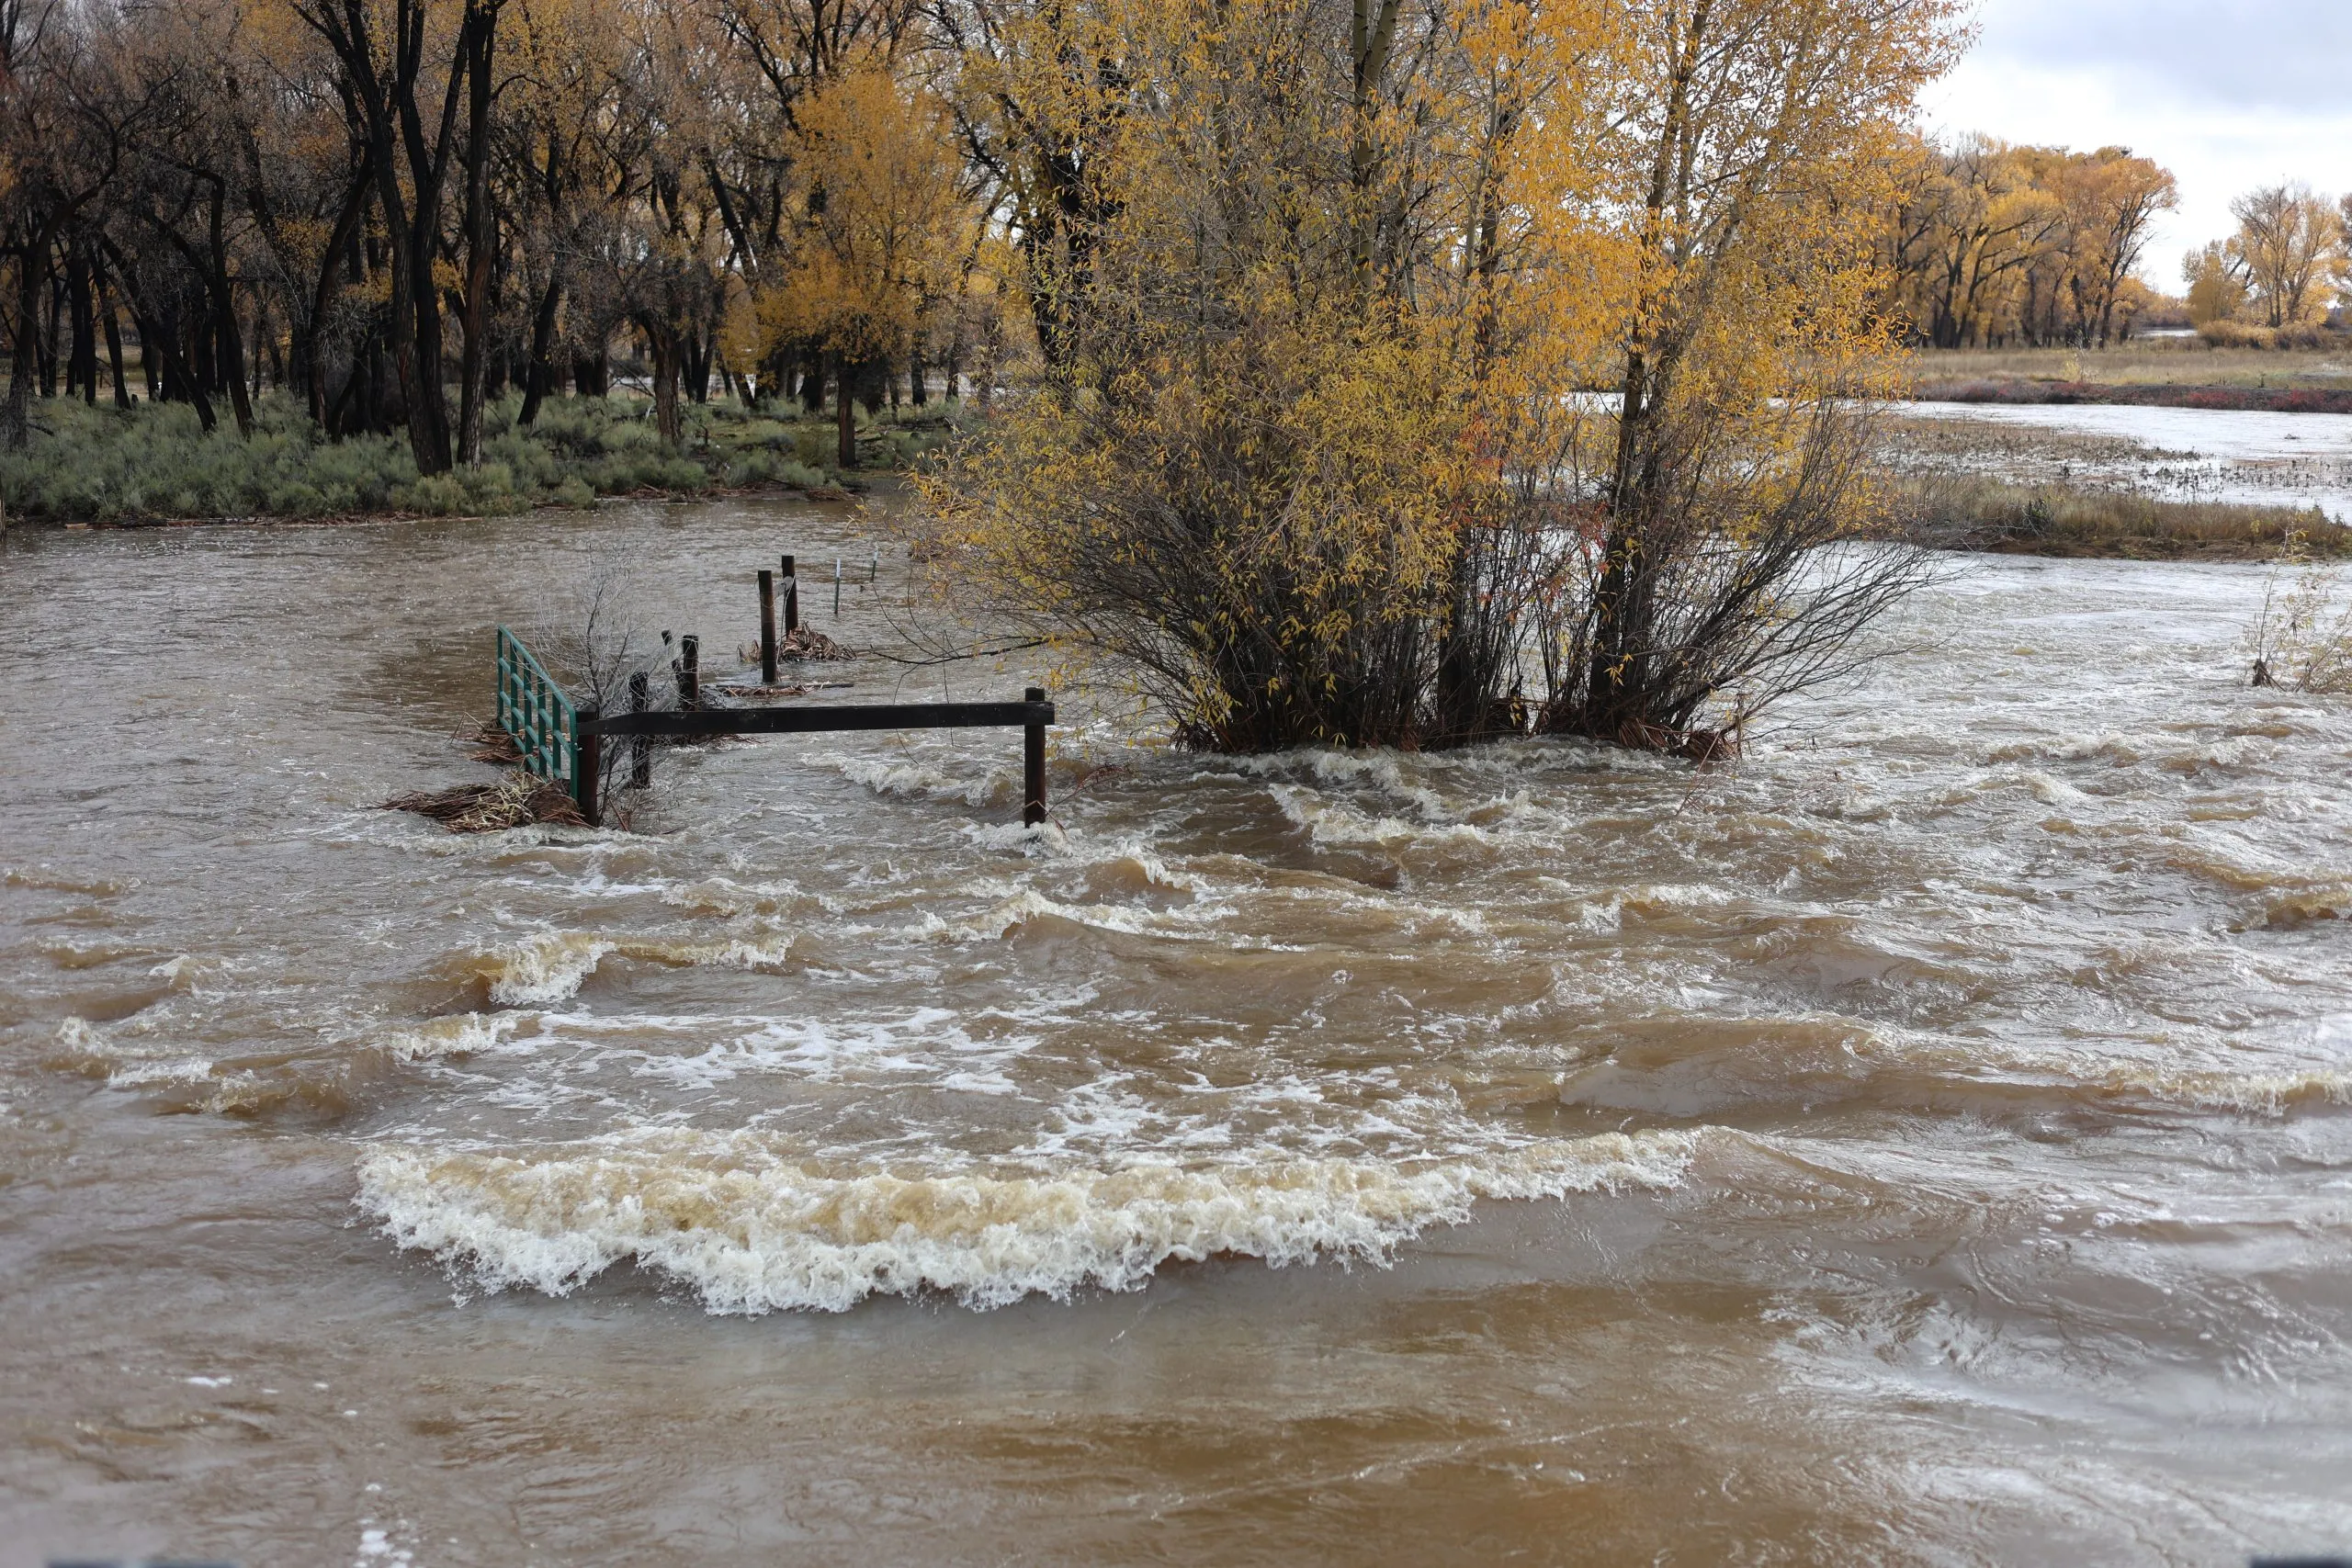
The Rio Grande on Sunday at the Alamosa/Rio Grande county line. Credit: Owen Woods

Click the link to read the article on the Alamosa Citizen website (Owen Woods and Chris Lopez):

October 25, 2026

he Rio Grande grew to its highest level in nearly 80 years over the El Niño storm weekend, forcing evacuations even south in Conejos County and shutting down Highways 112 and 285 into Sunday.

“Legendary,” said Pat McDermott, a longtime observer of the Valley’s river systems and recent retiree of the Colorado Division of the Water Resources in the San Luis Valley.

“Basically a free river. Anybody that wanted it could take (water),” said Greg Higel, a rancher along the Rio Grande and chair of the Rio Grande Water Conservation District.

Heroic work by managers of the Valley’s canal systems helped keep communities along the Rio Grande from flooding even more than they did. The ditch riders did similar work in October 2025 when the Valley also saw historic rains.

“They all responded to try to take this top off the river,” said McDermott, noting the work of managers for the Prairie Ditch, Farmers Union, Rio Grande, Empire and Monte Vista canals.

Colorado Division of Water Resources monitoring measured a peak flow of 11,000 csf Friday at Hanna Lane in Rio Grande County, which exceeded a record reading of 9,700 cfs from 1949. The water moved south and overwhelmed Los Pinos, San Antonio and Conejos rivers to force the evacuation of the town of Manassa on Saturday evening.

“It’s phenomenal. It’s legendary,” McDermott said. “There’s going to be damage. The river got out of its banks above Del Norte. This is a legendary event.”

Colorado National Guard members went door-to-door as the town underwent an evacuation order. Around 18 residents left for a shelter set up at the Knights of Columbus Hall in La Jara, according to emergency managers.

Emergency responders made a plea for visitors, particularly hunters, to avoid the Valley due to moderate flooding across the six counties. Second rifle season hunting began on Saturday.

Jade Network set up more than 9,000 free WiFi hotspots to help first responders coordinate search and rescue operations and to help residents stay connected, said co-CEO Jordan Wehe.

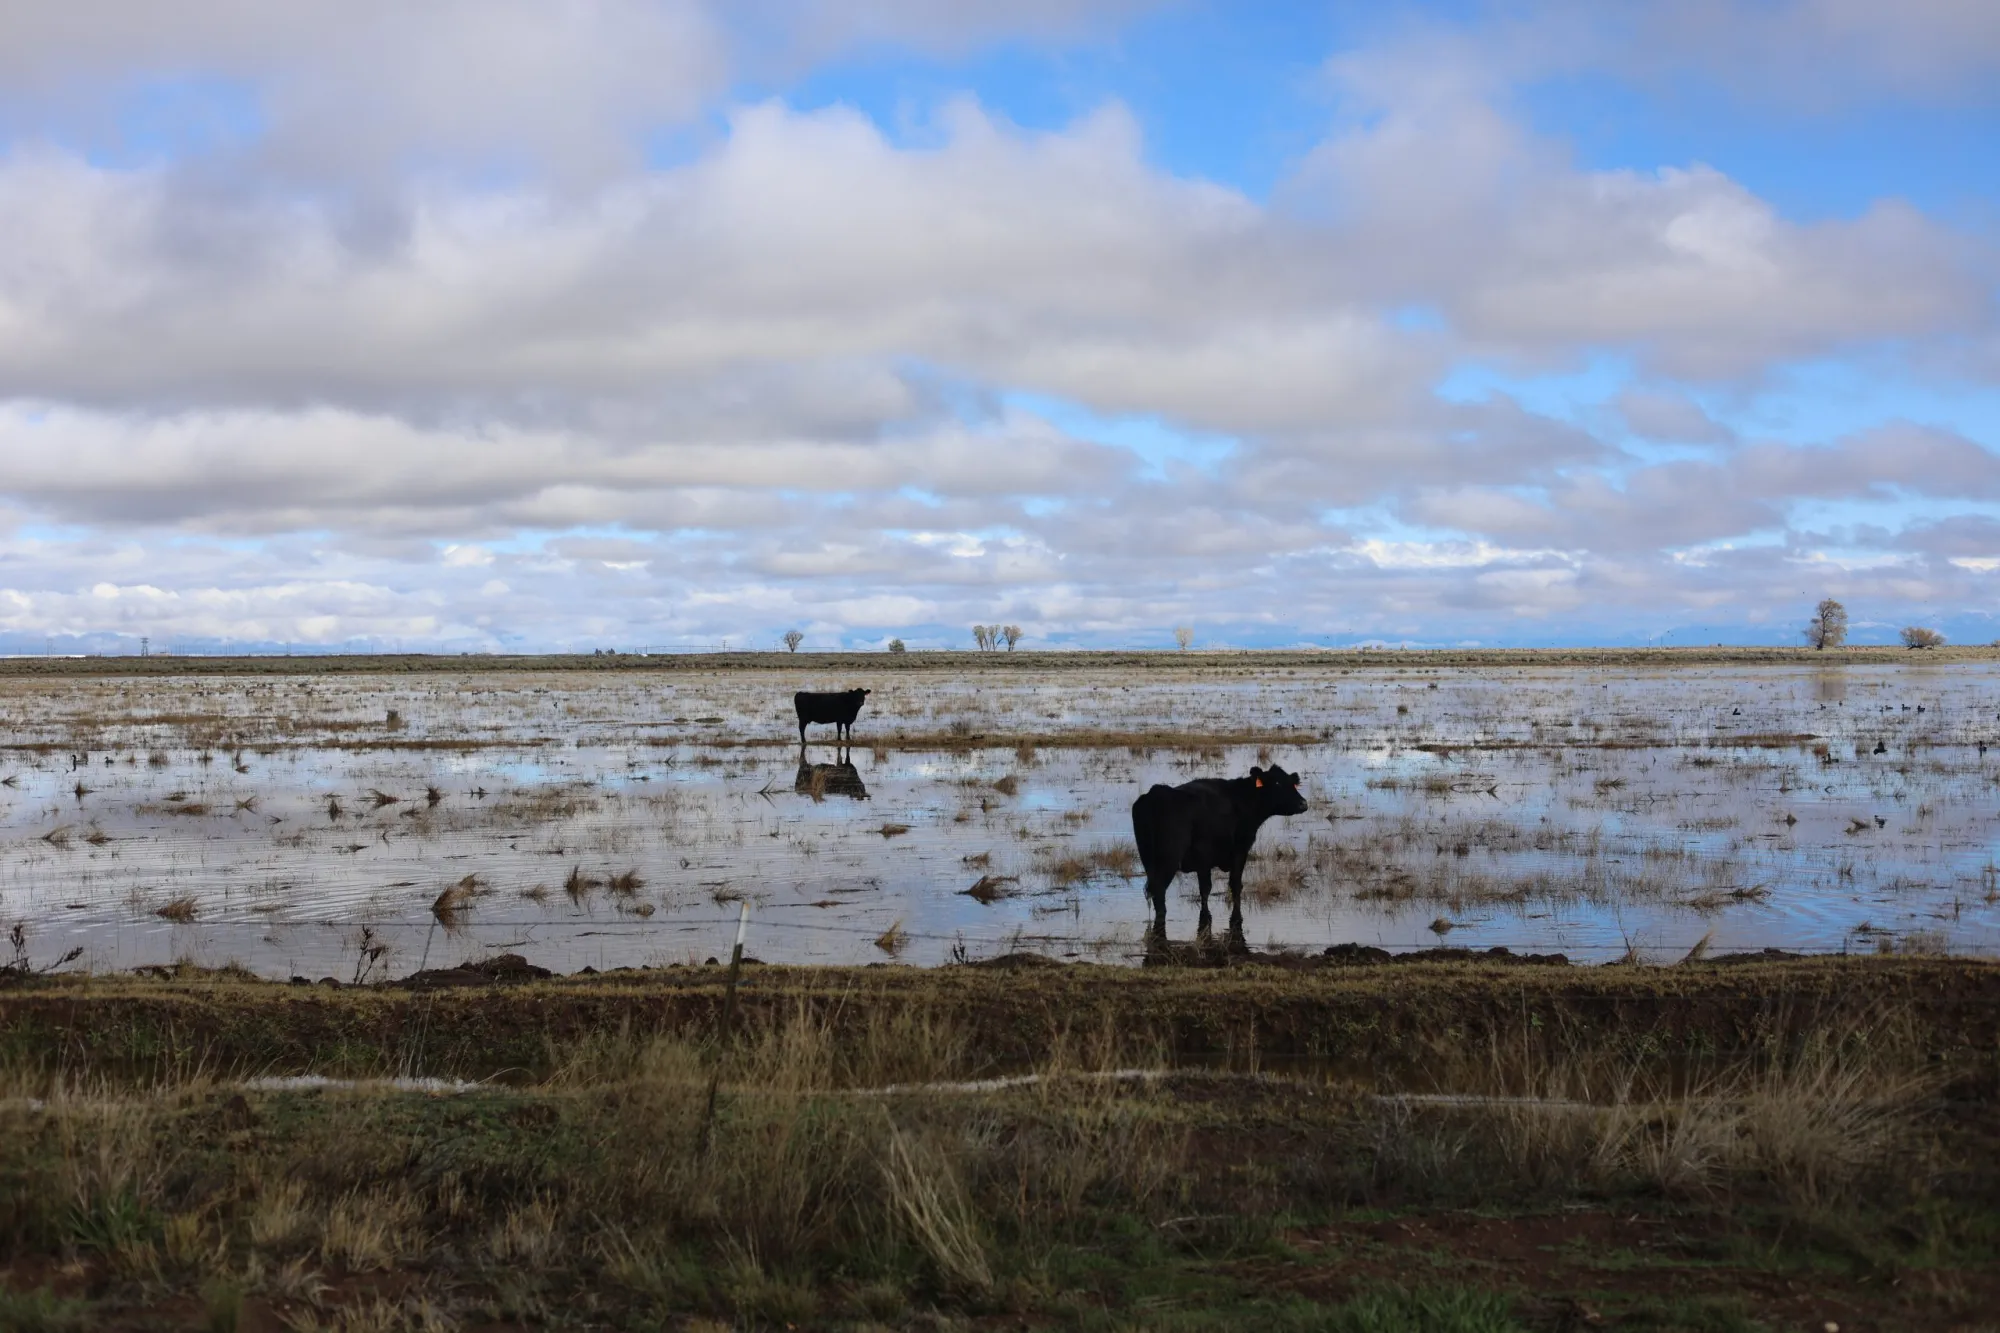
A flooded field on the Stanley Road on Sunday. Credit: Owen Woods

Alamosa was under flood watch coming into Sunday, with fears the water flowing in from Del Norte would overwhelm the levee through the town. More rain was anticipated Sunday evening into Monday which kept flood concerns in place.

The city and county governments in Alamosa have just started discussions with the Army Corps of Engineers on the required rebuilding of the Alamosa levees after decades of a deteriorating levee system through the town.

Even on the east side of the Valley, the Sangre de Cristos have been covered in thick clouds all weekend and Medano Creek has surged at the Great Sand Dunes National Park. Medano Creek typically flows in late spring.

The village of Guadalupe was inundated and evacuated along with parts of Manassa. Conejos County and Rio Grande County are bearing much of the brunt of the downpour.

“That area is the pinch point for Los Pinos, San Antonio and Conejos River converging,” McDermott said of Manassa. “Towns built too low for this type of weather event. The river gets out of the banks and it’s going to flow where it needs to flow.”

The Knights of Columbus in La Jara is serving as the evacuation shelter and the La Jara Arena, located at 17705 US-285, is accepting small animals and livestock. The Conejos County Health Department said if anyone has animals that need sheltering to contact Mystie Hoyt at 719-298-1099. The arena cannot take household pets.

The Conejos County Sheriff’s Office is taking donations of non-perishable foods as well as cleaning supplies needed for the shelter. Donations can be taken to the Conejos County Sheriff’s Office, located at 4044 County Rd G.5 in Antonito. Be sure to buzz the front door to check in the donations’ do not leave them unattended.

All this water is creating problems for roads, with some roads being washed out or flooded, creating impasses.

San Luis Valley emergency managers have been working to assess the damage and create safe evacuation spaces for people and animals.

A concern among water and emergency managers Sunday morning was whether the Alamosa levees would hold the water coming through from Del Norte.

The Rio Grande at the county line gauge was at 5,000 cfs early Sunday morning, but by around 8 a.m., it had lowered to around 3,500 cfs. All that water is headed to Alamosa.

“That’s what I’m worried about. How is our levee system going to hold 4,000 cfs?” McDermott said.

As of noon Sunday, the gauge in Alamosa was reading 1,560 cfs.

In the 1980s, McDermott noted, the Rio Grande at Del Norte routinely flowed at 8,000 cfs and sustained those flows in the years of 1985, 1986, 1987.

In those years, the river never reached the peak flows this storm created.

The Valley’s canals have taken on much of the water between South Fork and Alamosa. Similar to October 2025’s precipitation, the canals are diverting as much as they can.

Things are easing up in South Fork, but South Fork Fire Rescue said Sunday morning workers will begin the process of transition from response to recovery efforts in South Fork, Del Norte and Monte Vista.

Residents are advised to not return home until all mandatory evacuation orders have been lifted.

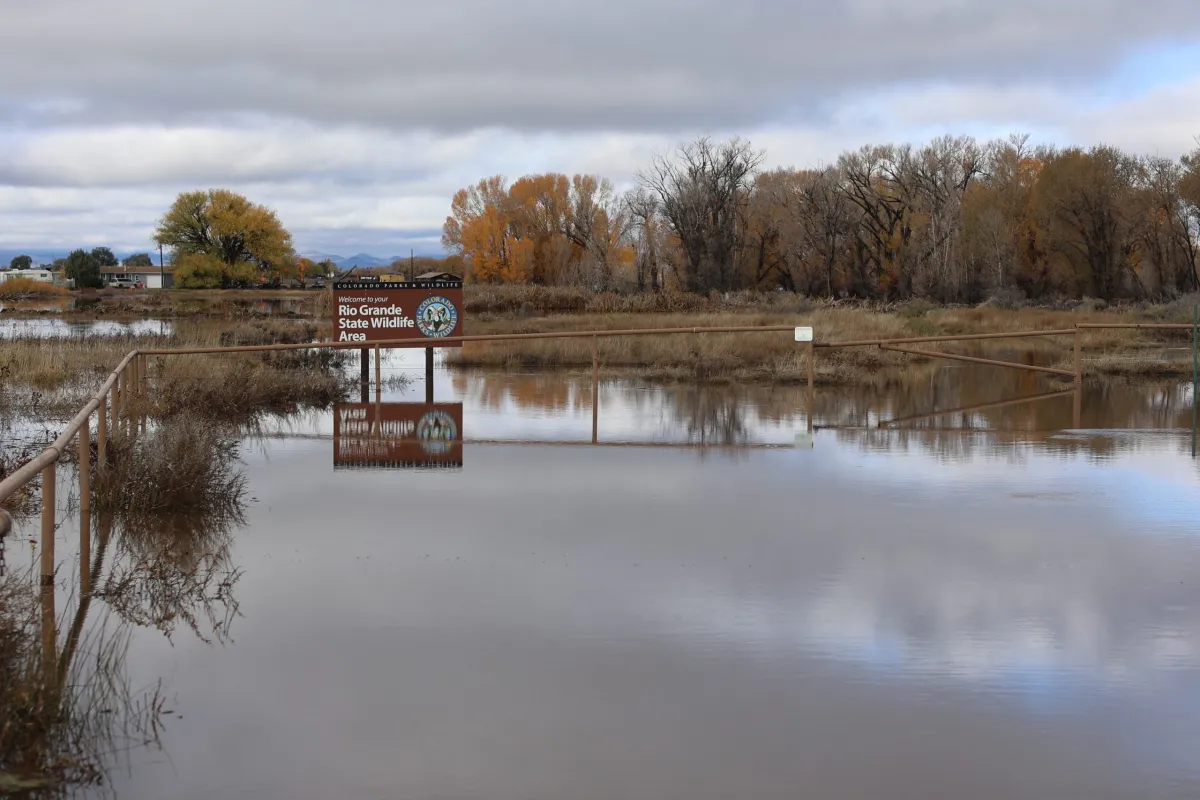
Rio Grande State Wildlife Area near Monte Vista on Sunday. Credit: Owen Woods

A community meeting is scheduled for Monday, Oct. 26, at 6 p.m. at the New Hope Church at 25258 US Highway 160 in South Fork.

Del Norte’s drinking water remains safe to drink and no boil orders have been issued. The South Fork Community Building still has resources for those impacted by the flooding, including drinking water and food.

The Upper Rio Grande School district announced that schools in Del Norte and South Fork would be closed on Monday.

Evacuations remain in place for the following areas:

  • South Fork of the Rio Grande: From the Wolf Creek Tunnel to Fun Valley and from County Road 20 to the confluence of the Rio Grande.
  • Rio Grande: From the confluence of the River Green Subdivision to the Shaw Creek Rest Area.

Beaver Mountain Estate residents are advised to shelter in place or evacuate via Skyline Drive North past the forest gate, following that until Park Drive then downhill past South Fork Fire Rescue on Mall Street.

Current Road Closures:

  • Highway 160 over Wolf Creek Pass–closed in both directions
  • Highway 285 from Monte Vista to Center Junction
  • Highway 112 from Del Norte to Center
  • Rio Grande County Road 18 Bridge to County Road 15
  • Escondida Bridge over the South Fork of the Rio Grande
  • Park Road closed to Forest Service Road 380–Park Creed Bridge is washed out
  • Park Creek to Summitville

In Del Norte, street closures include:

  • 3rd Street from Spruce Street to Hermosa Street
  • Spruce Street from 2nd Street to Front Street
  • First Street from Oak Street to Pine Street
  • Front Street from Spruce Street to Pine Street
  • 3rd Street and Cherry Street to 2nd Street
Rio Grande and Pecos River basins. Map credit: By Kmusser – Own work, Elevation data from SRTM, drainage basin from GTOPO [1], U.S. stream from the National Atlas [2], all other features from Vector Map., CC BY-SA 3.0, https://commons.wikimedia.org/w/index.php?curid=11218868

Floods strand families, force rescues as #SanJuanRiver nears major flood stage — The Navajo Times

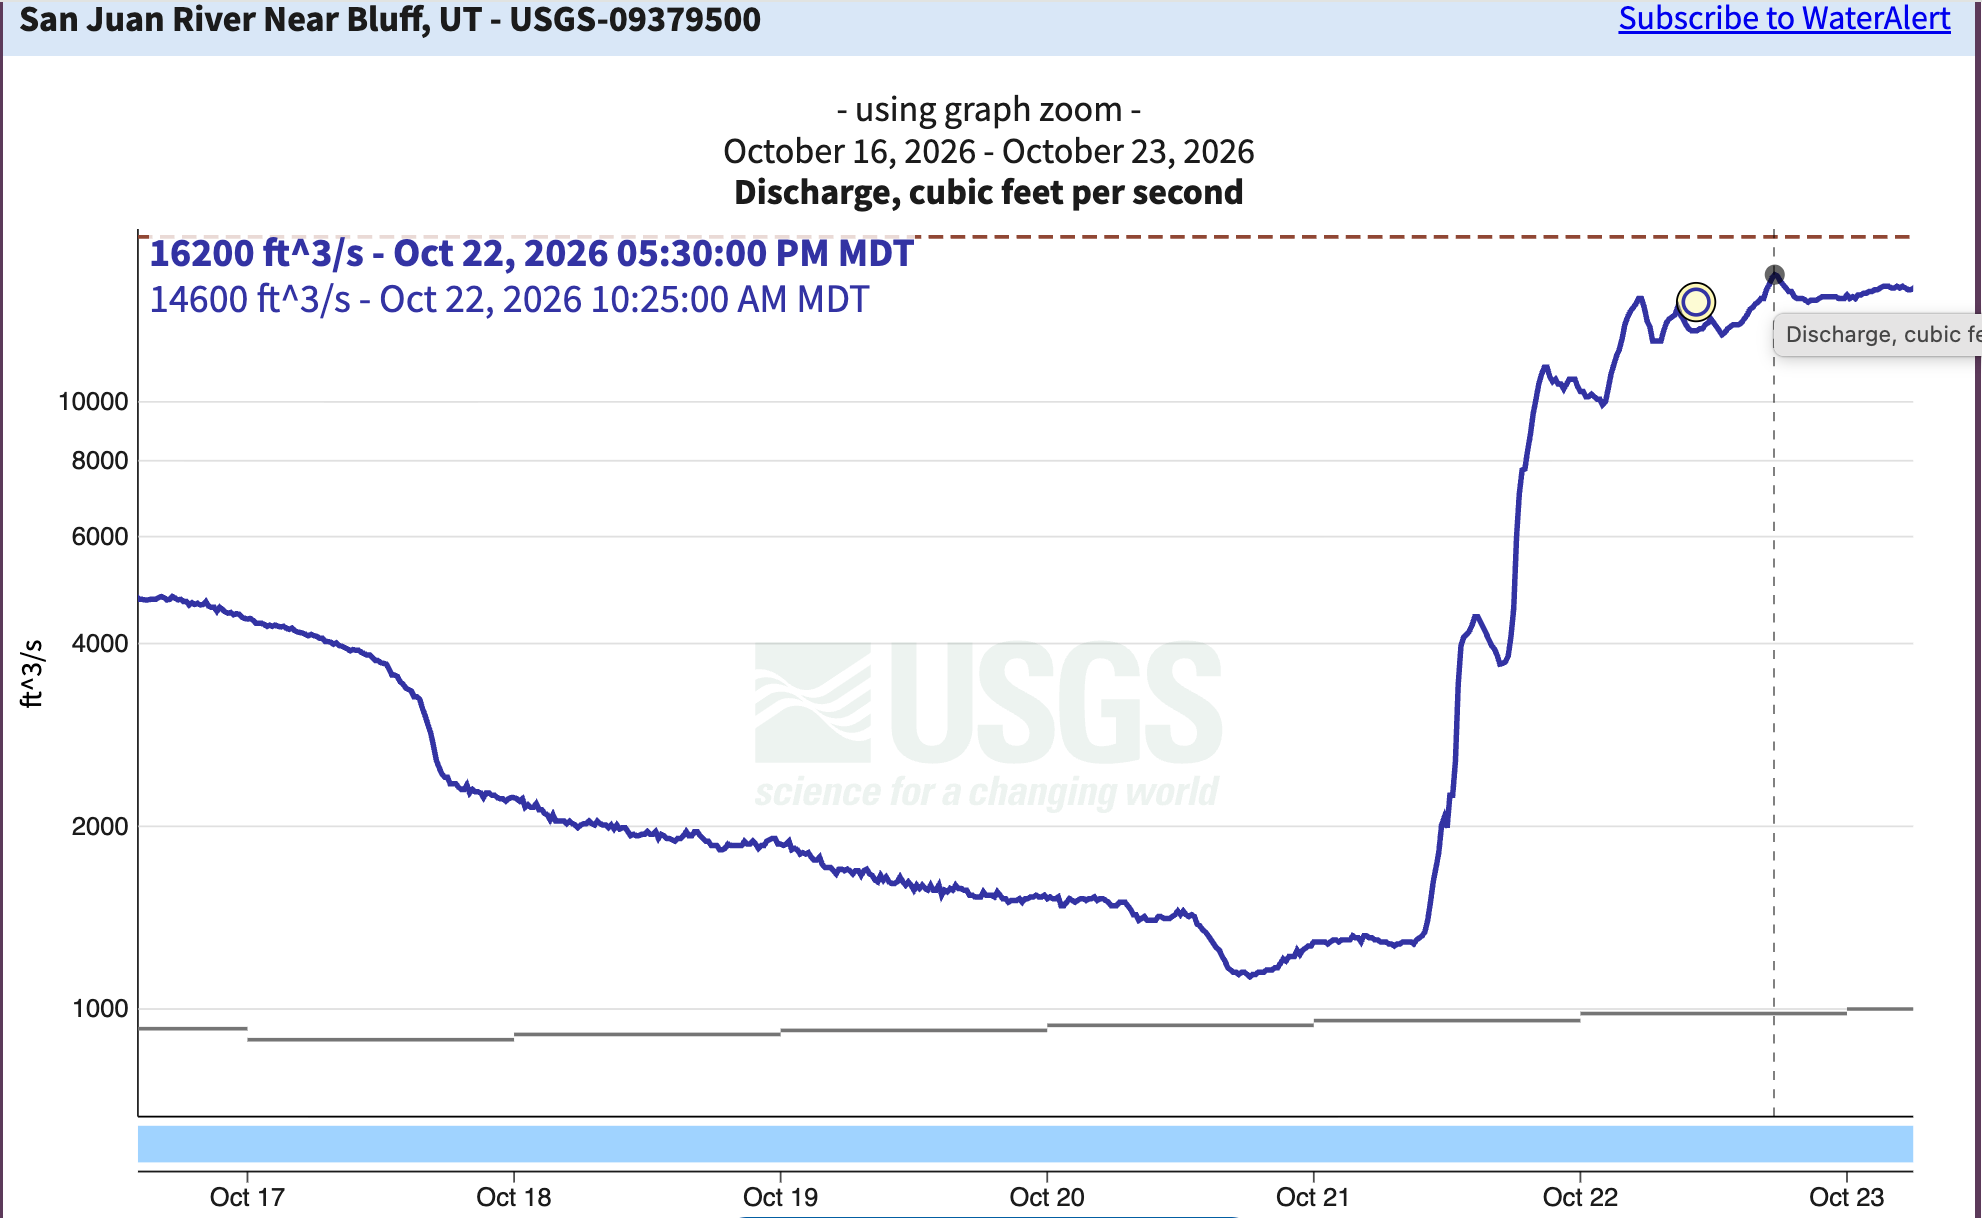
Further downstream, the San Juan River near Bluff, Utah (actually, the gage is located closer to Mexican Hat, and is just below the confluences with Chinle and Comb washes) reached 16,200 cfs on Thursday afternoon. Navajo Dam sits between the high flows in Pagosa and this streamflow gage, so that will keep the upstream high water from increasing levels downstream even more.

Click the link to read the article on The Navajo Times website (Donovan Quintero). Here’s an excerpt:

A surge on the San Juan River moved toward Shiprock on Friday after two days of storms flooded homes, stranded families and forced rescues throughout the Navajo Nation. The San Juan River at Shiprock reached 17.3 feet Friday night, above the 15.5-foot flood stage, according to the National Weather Service. Forecasters expected the river to reach 20.7 feet late Saturday morning, just above major flood stage of 20.5 feet. Upstream in Farmington, the river reached 14.1 feet Friday, surpassing the previous record of 12.3 feet set in 1909. By late afternoon, the river had spread over its floodplain beside the U.S. Highway 64 bridges in Shiprock…At an earlier San Juan County briefing Friday, Navajo Police Deputy Chief Donnie Kee said the highest water was expected to reach Shiprock late Friday night or early Saturday…Police warned families along the river from Farmington west through Upper Fruitland, Nenahnezad, San Juan Chapter, Hogback and Shiprock to Montezuma Creek, Utah. Navajo Nation President Buu Nygren and Shiprock Chapter Vice President Debra Yazzie issued an evacuation alert for families near the river…The floodwater also carried raw sewage after rising water inundated the Bloomfield wastewater treatment plant upstream of Navajo communities, sending untreated wastewater into the river.

Map of the San Juan River, a tributary of the Colorado River, in Arizona, Colorado, New Mexico and Utah, USA. Made using USGS National Map data. By Shannon1 – Own work, CC BY-SA 4.0, https://commons.wikimedia.org/w/index.php?curid=47456307

South Platte River Basin #climate for the week ending October 26, 2026 #SouthPlatteRiver

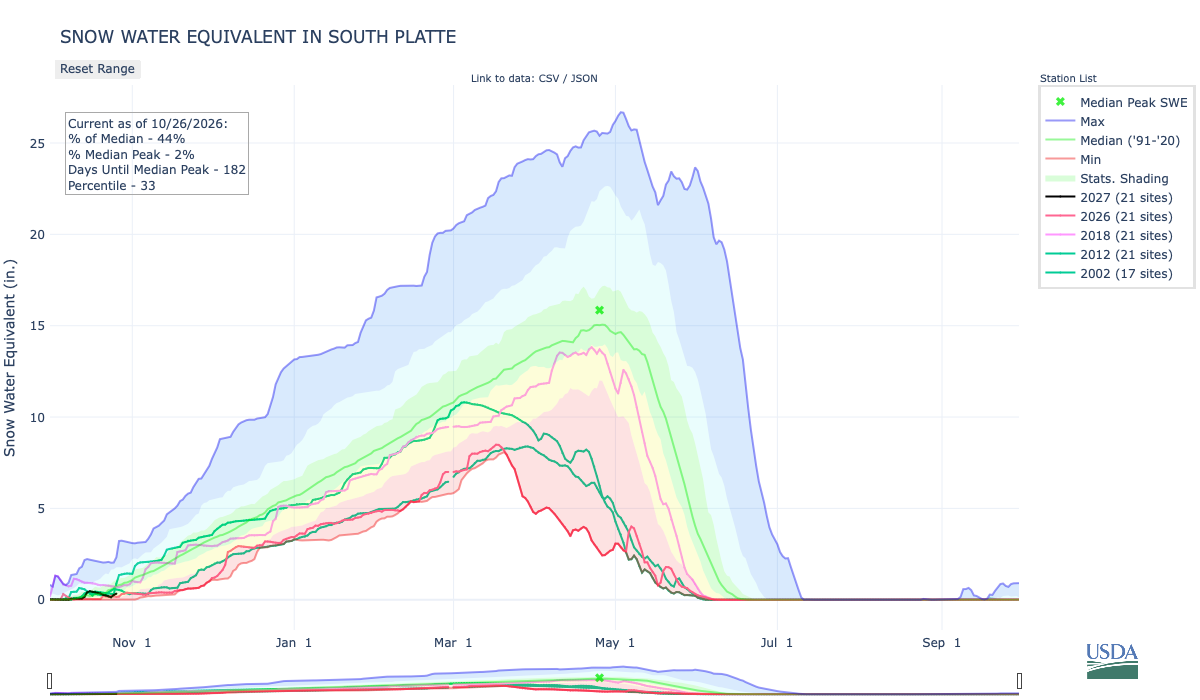
Below is the Snow Water Equivalent in South Platte graph from the NRCS for October 26, 2026. Snowpack is 44% of the median (down 92% one week, wild swings this time of the accumulation season) and 4% of the median peak (up 1% one week). There are 181 days until the median peak. I’ve added the lines for 2026, 2018, 2012, and 2002 since the statewide drought is still very pronounced.

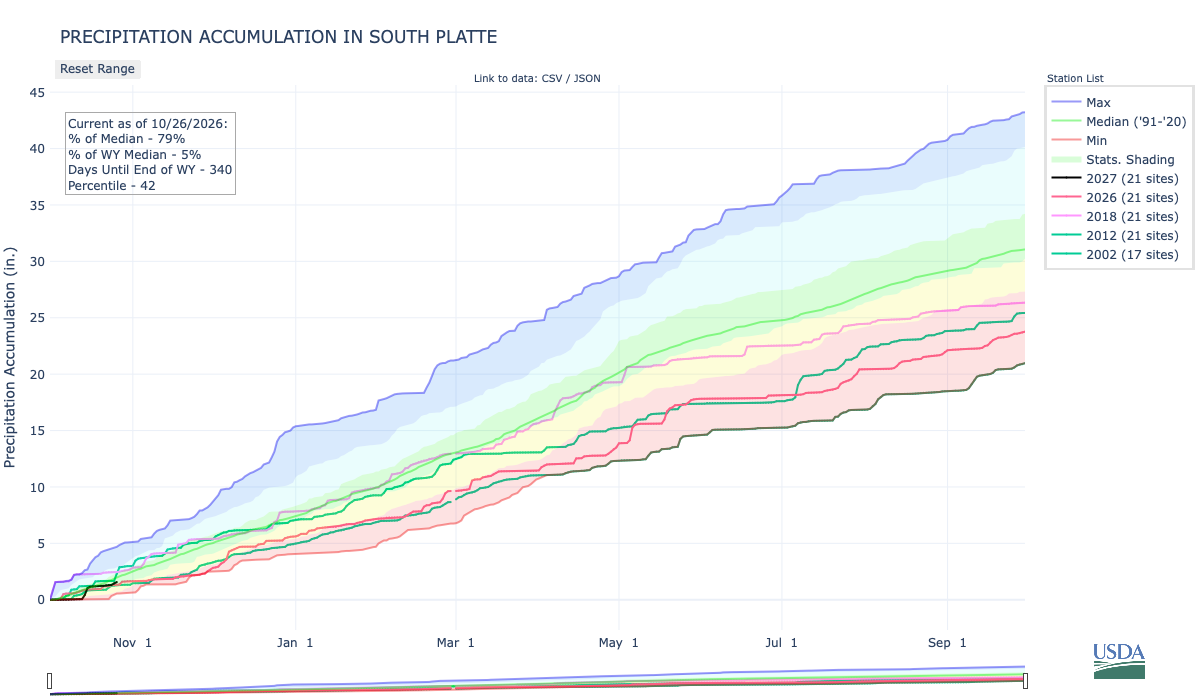
Below is the Precipitation Accumulation in South Platte graph from the NRCS for October 26, 2026. This morning precipitation, at the SNOTEL stations, is at 79% of the median (down 15% one week), and 5% of the water year median (up 1% one week), There are 340 days left in the water year. I’ve added the lines for 2026, 2018, 2012, and 2002 since the statewide drought is still very pronounced.

There is a slight chance for snow showers Saturday and a chance for rain and snow showers Sunday in the central mountains. There is a slight chance for showers Saturday and a chance for showers Sunday in the northern mountains. There is a chance for showers Saturday and Sunday, down here, about 439 miles from the Four Corners National Monument near where the San Juan River is raging out of its banks flooding the Navajo Nation downstream to Lake Powell which has risen 10 feet from all the water. From Wikipedia:

The Four Corners Monument marks the quadripoint in the Southwestern United States where the states of Arizona, Colorado, New Mexico, and Utah meet. It is the only point in the United States shared by four states, leading to the area being named the Four Corners region. The monument also marks the boundary between two sovereign Native American governments, the Navajo Nation, which maintains the monument as a tourist attraction, and the Ute Mountain Ute Tribe Reservation. The origins of the state boundaries marked by the monument occurred just prior to, and during, the American Civil War, when the United States Congress acted to form governments in the area to combat the spread of slavery to the region.

The current marker at the exact Four Corners point, placed in 1992. By Christian David – Own work, CC BY-SA 4.0, https://commons.wikimedia.org/w/index.php?curid=196924538

This is an insane amount of water heading toward Montezuma Creek, Bluff, and Mexican Hat.

— Jonathan Thompson at the Land Desk (@landdesk.bsky.social) 2026-10-25T15:33:39.840Z

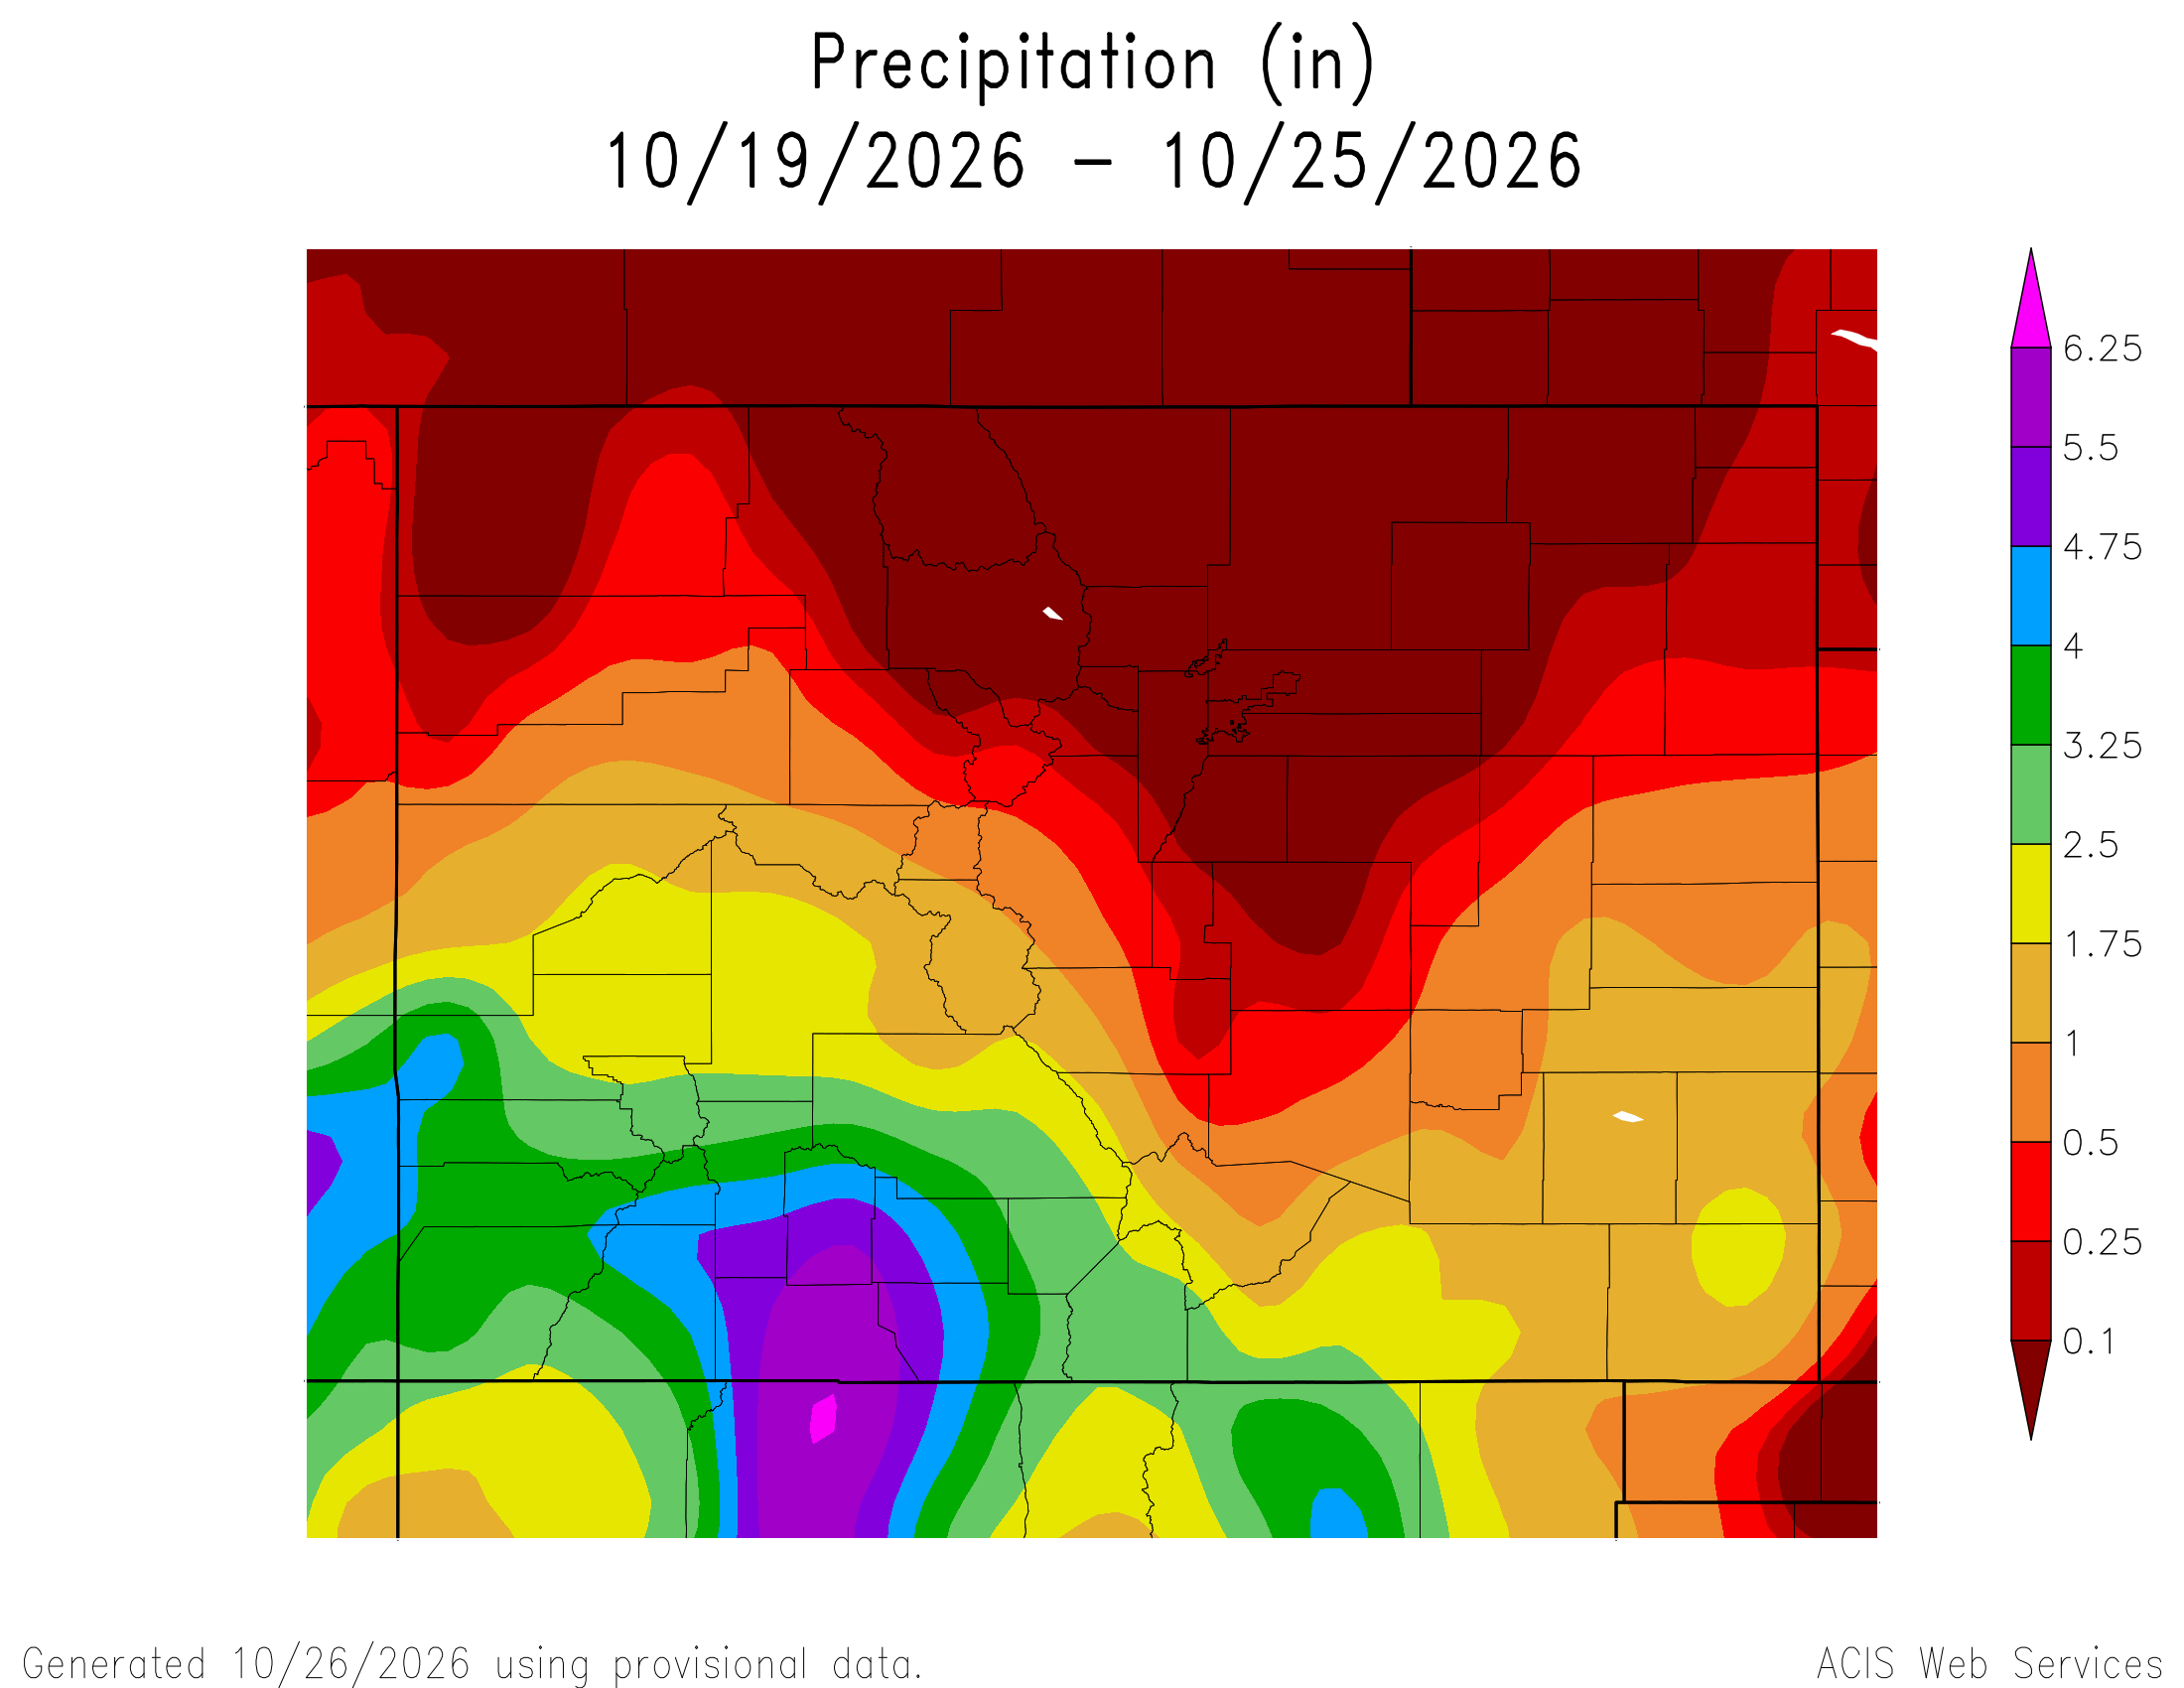
Here’s a look at the Colorado 7-Day precipitation map through October 25, 2026 from the High Plains Regional Climate Center. Precipitation in the South Platte Basin along the Continental Divide of the Americas ranged from 0.00” to 1.75″.

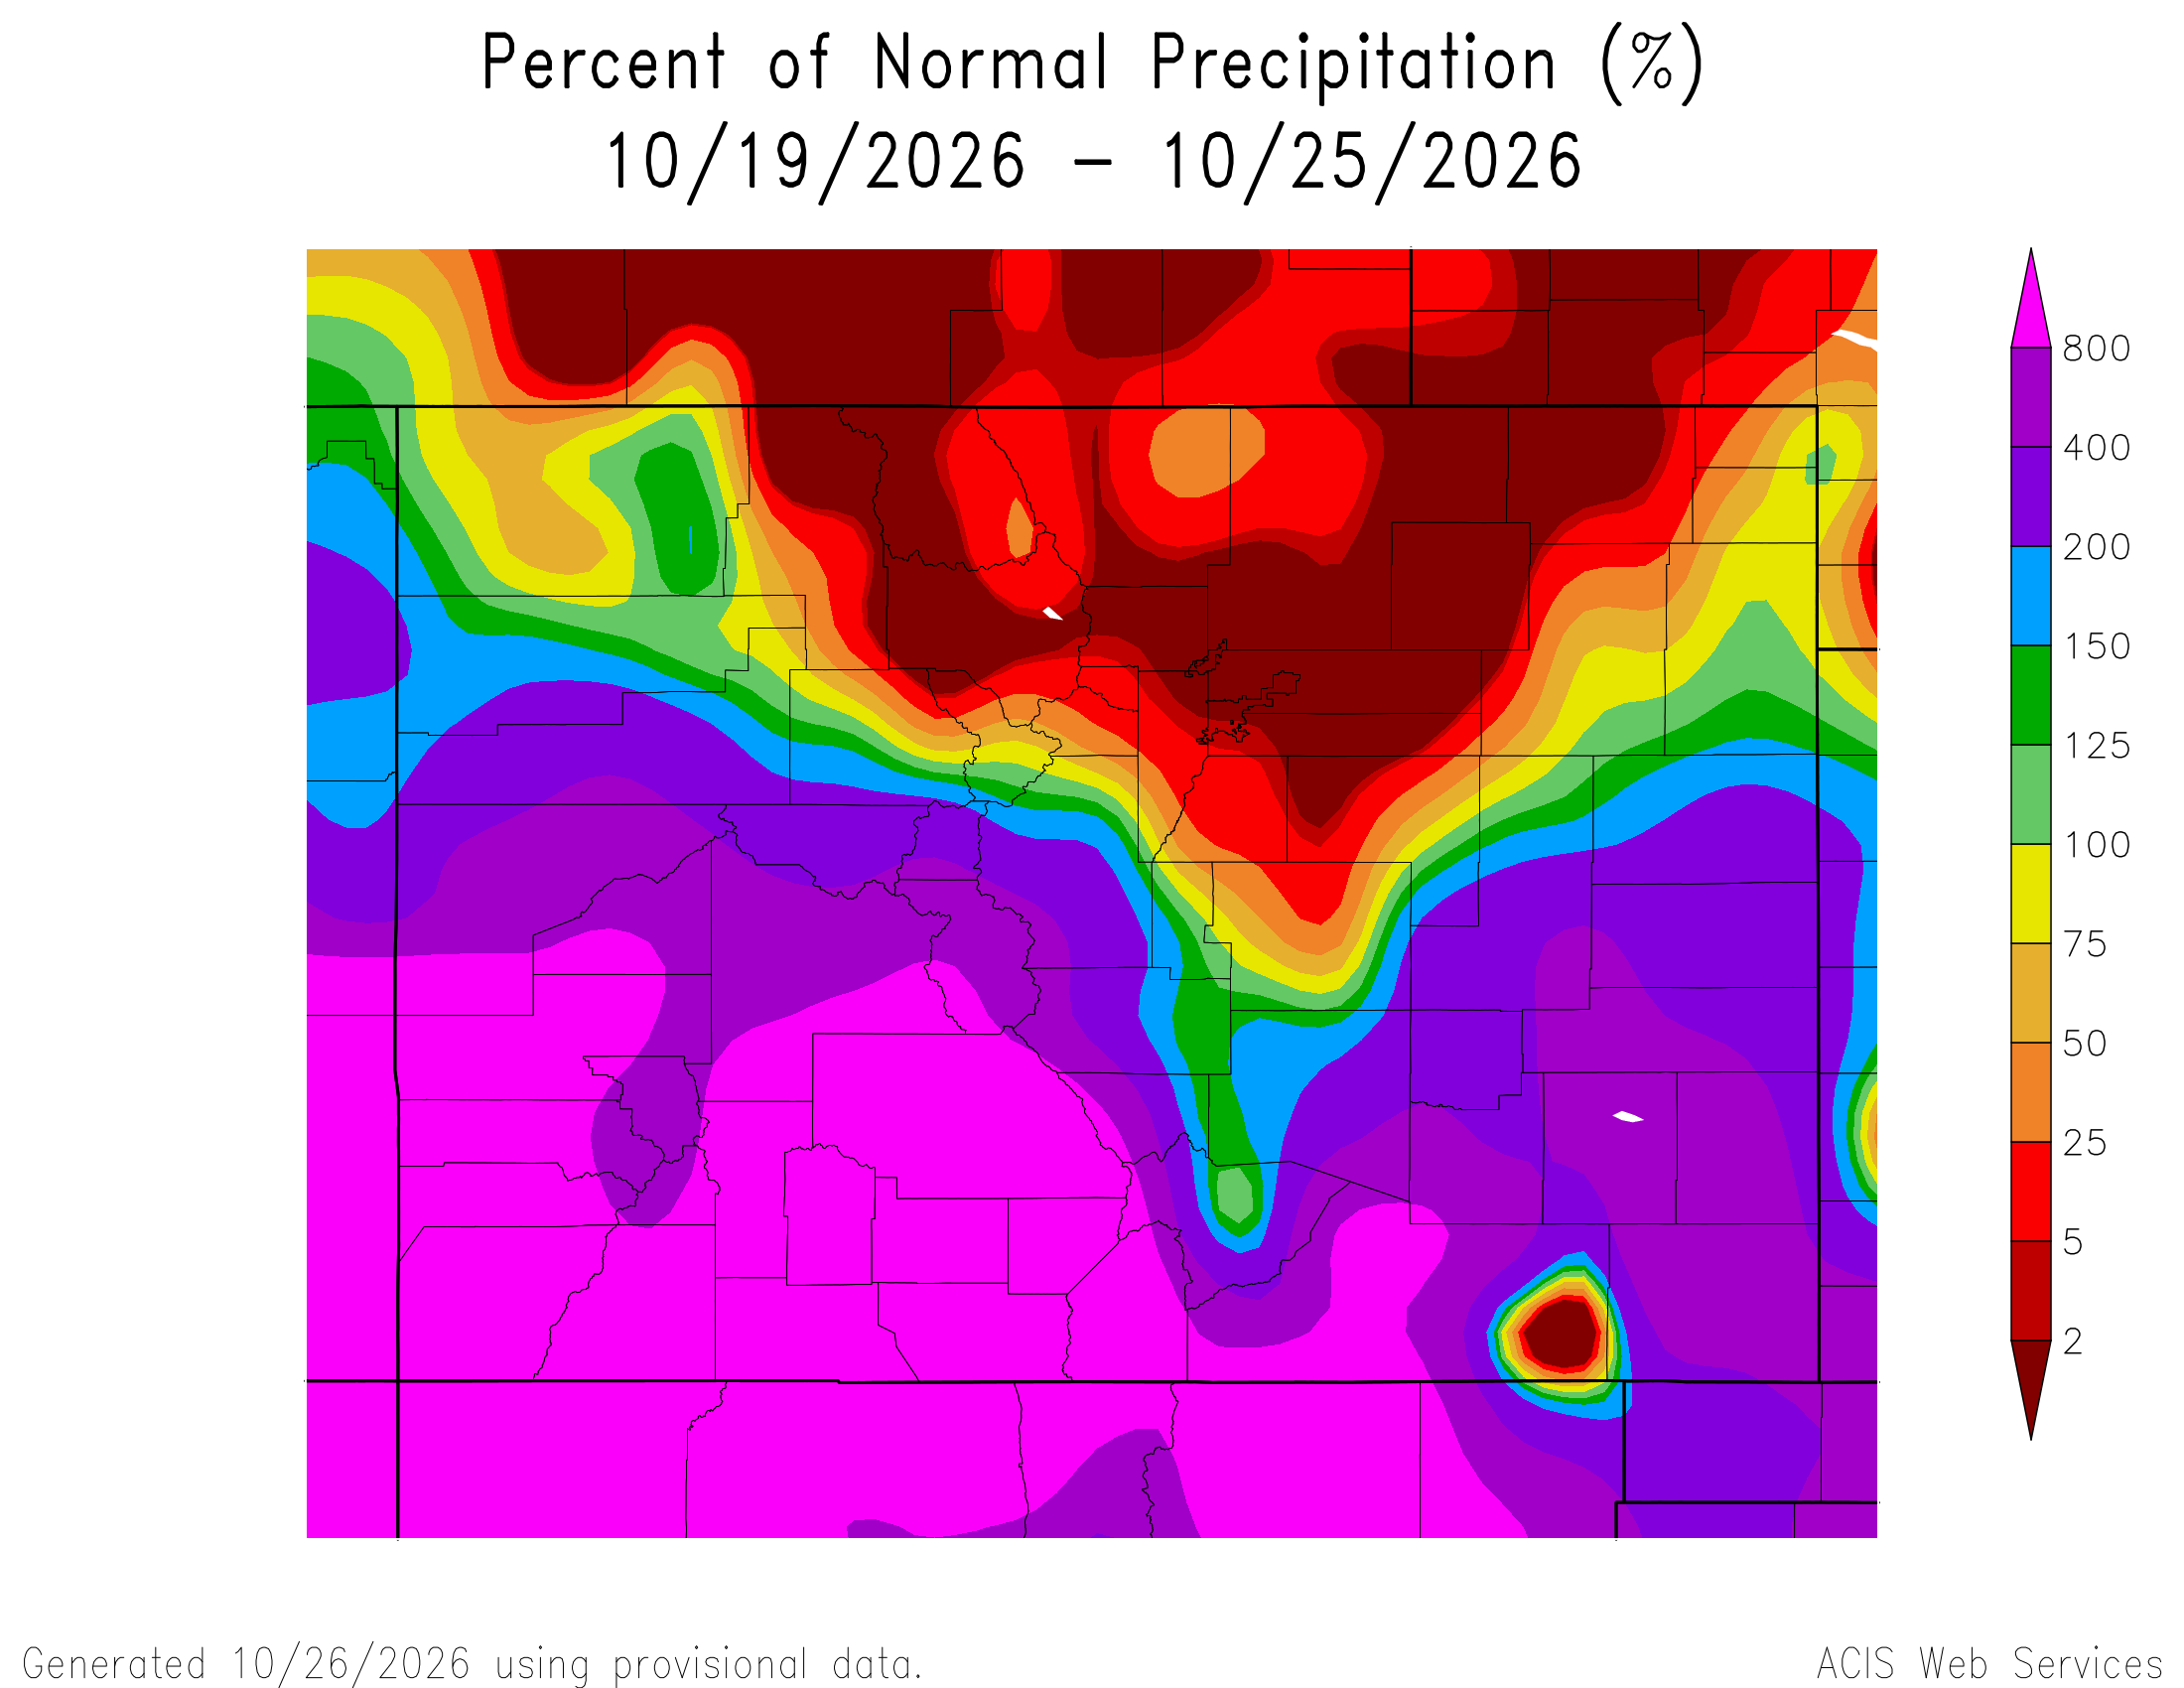
Here’s the Colorado 7-Day percent of normal precipitation map through October 25, 2026 from the High Plains Regional Climate Center. Precipitation in the South Platte River Basin along the Continental Divide of the Americas ranged from 0% to 800% of normal.

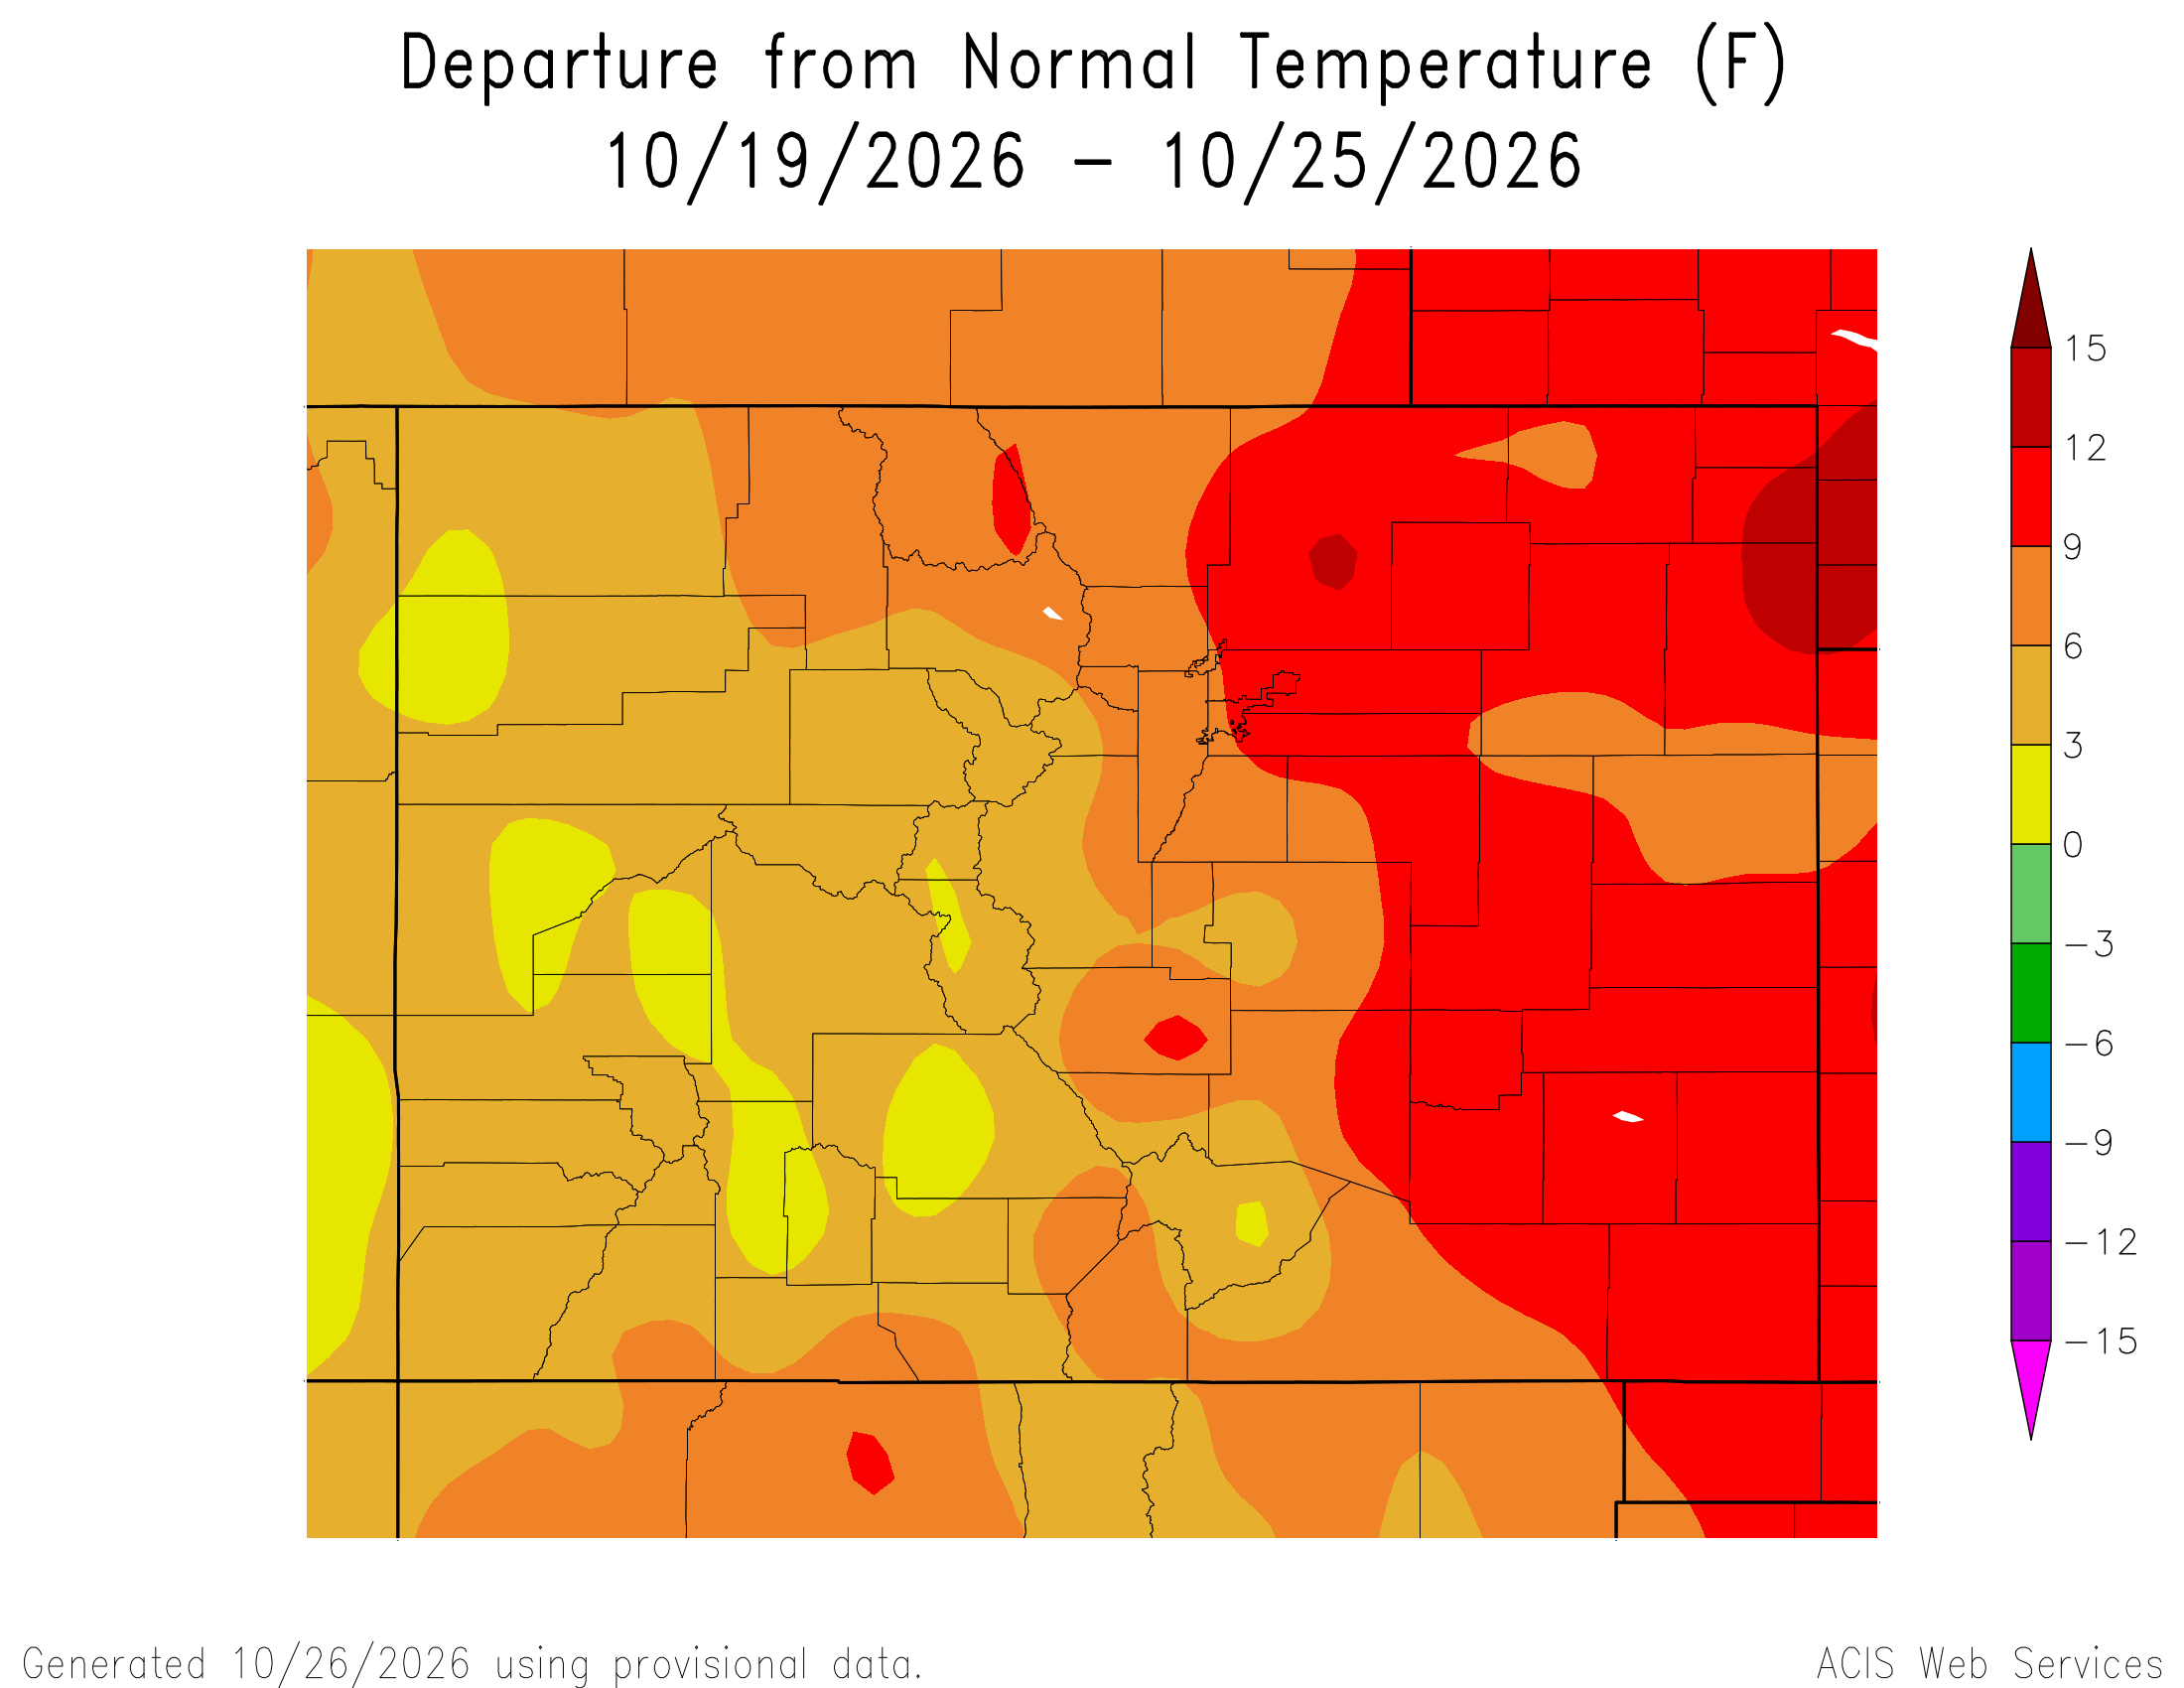
Here’s the most recent 7-Day Departure from Normal Temperature (F) for Colorado through October 25, 2026 from the High Plains Regional Climate Center.

Below is the 7-day Quantitative Precipitation Forecast for the week of October 26, 2026. Precipitation is anticipated for the mountains of the South Platte River Basin and may total up to 0.10″

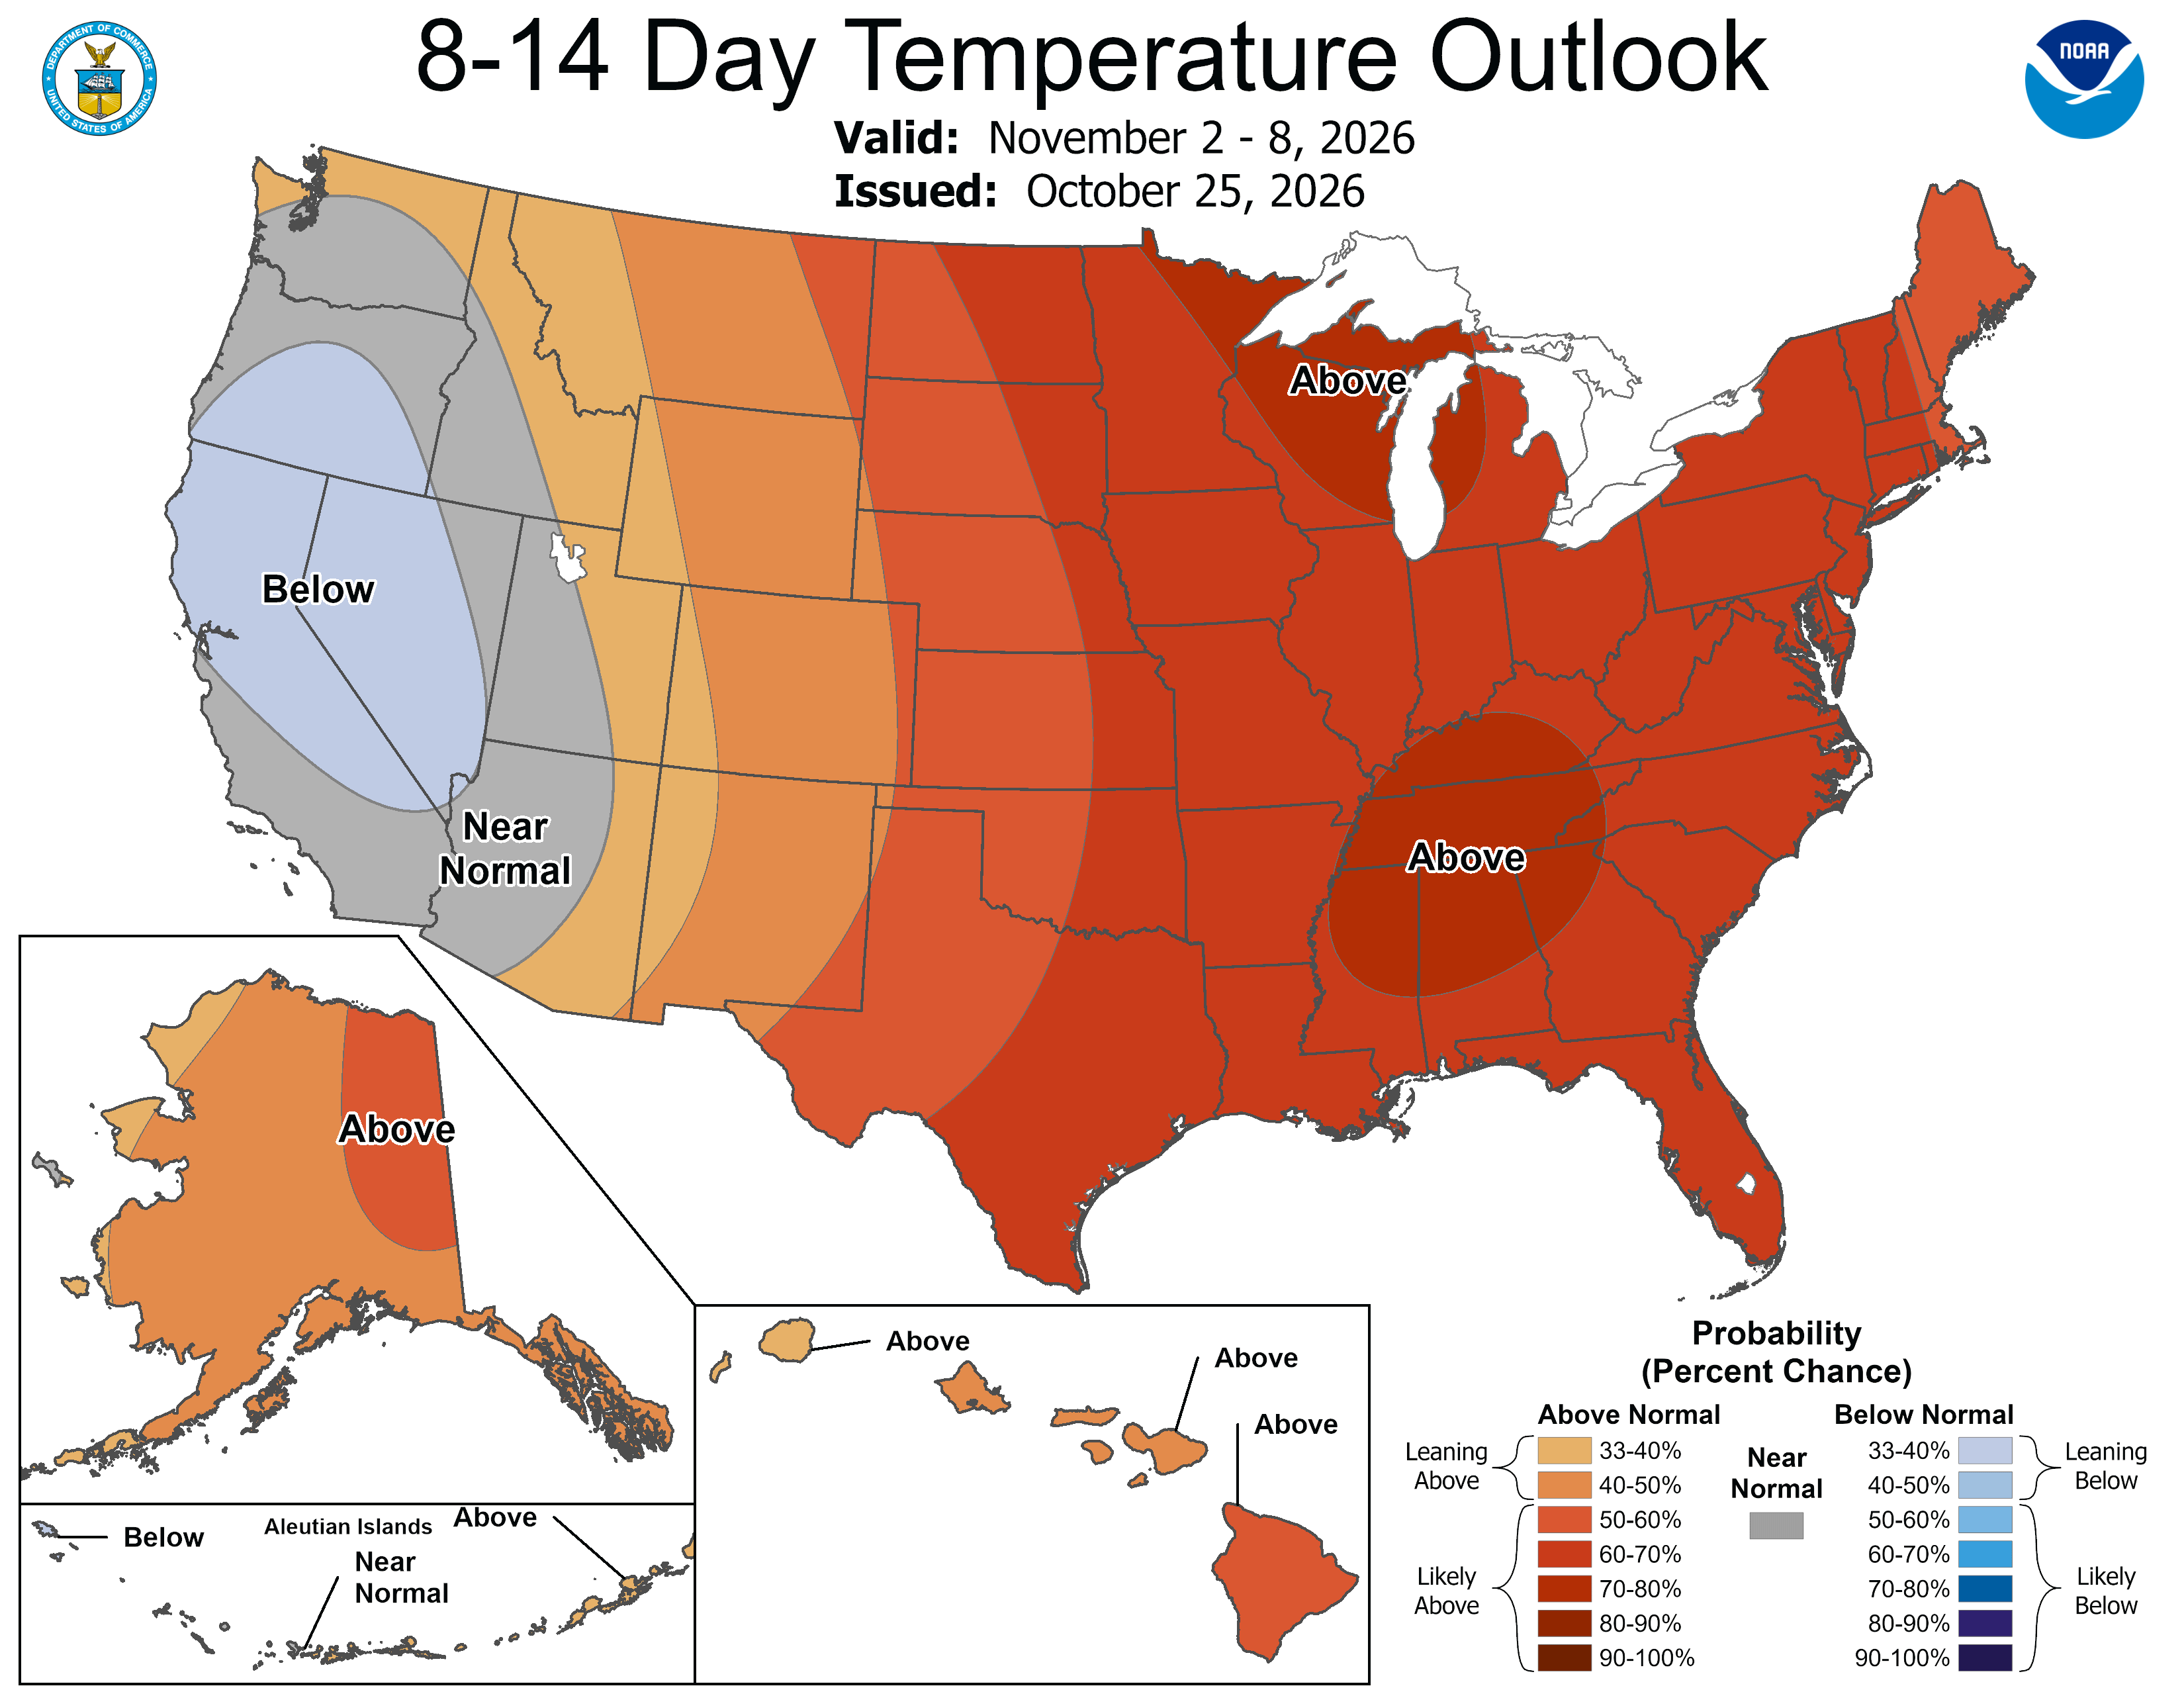
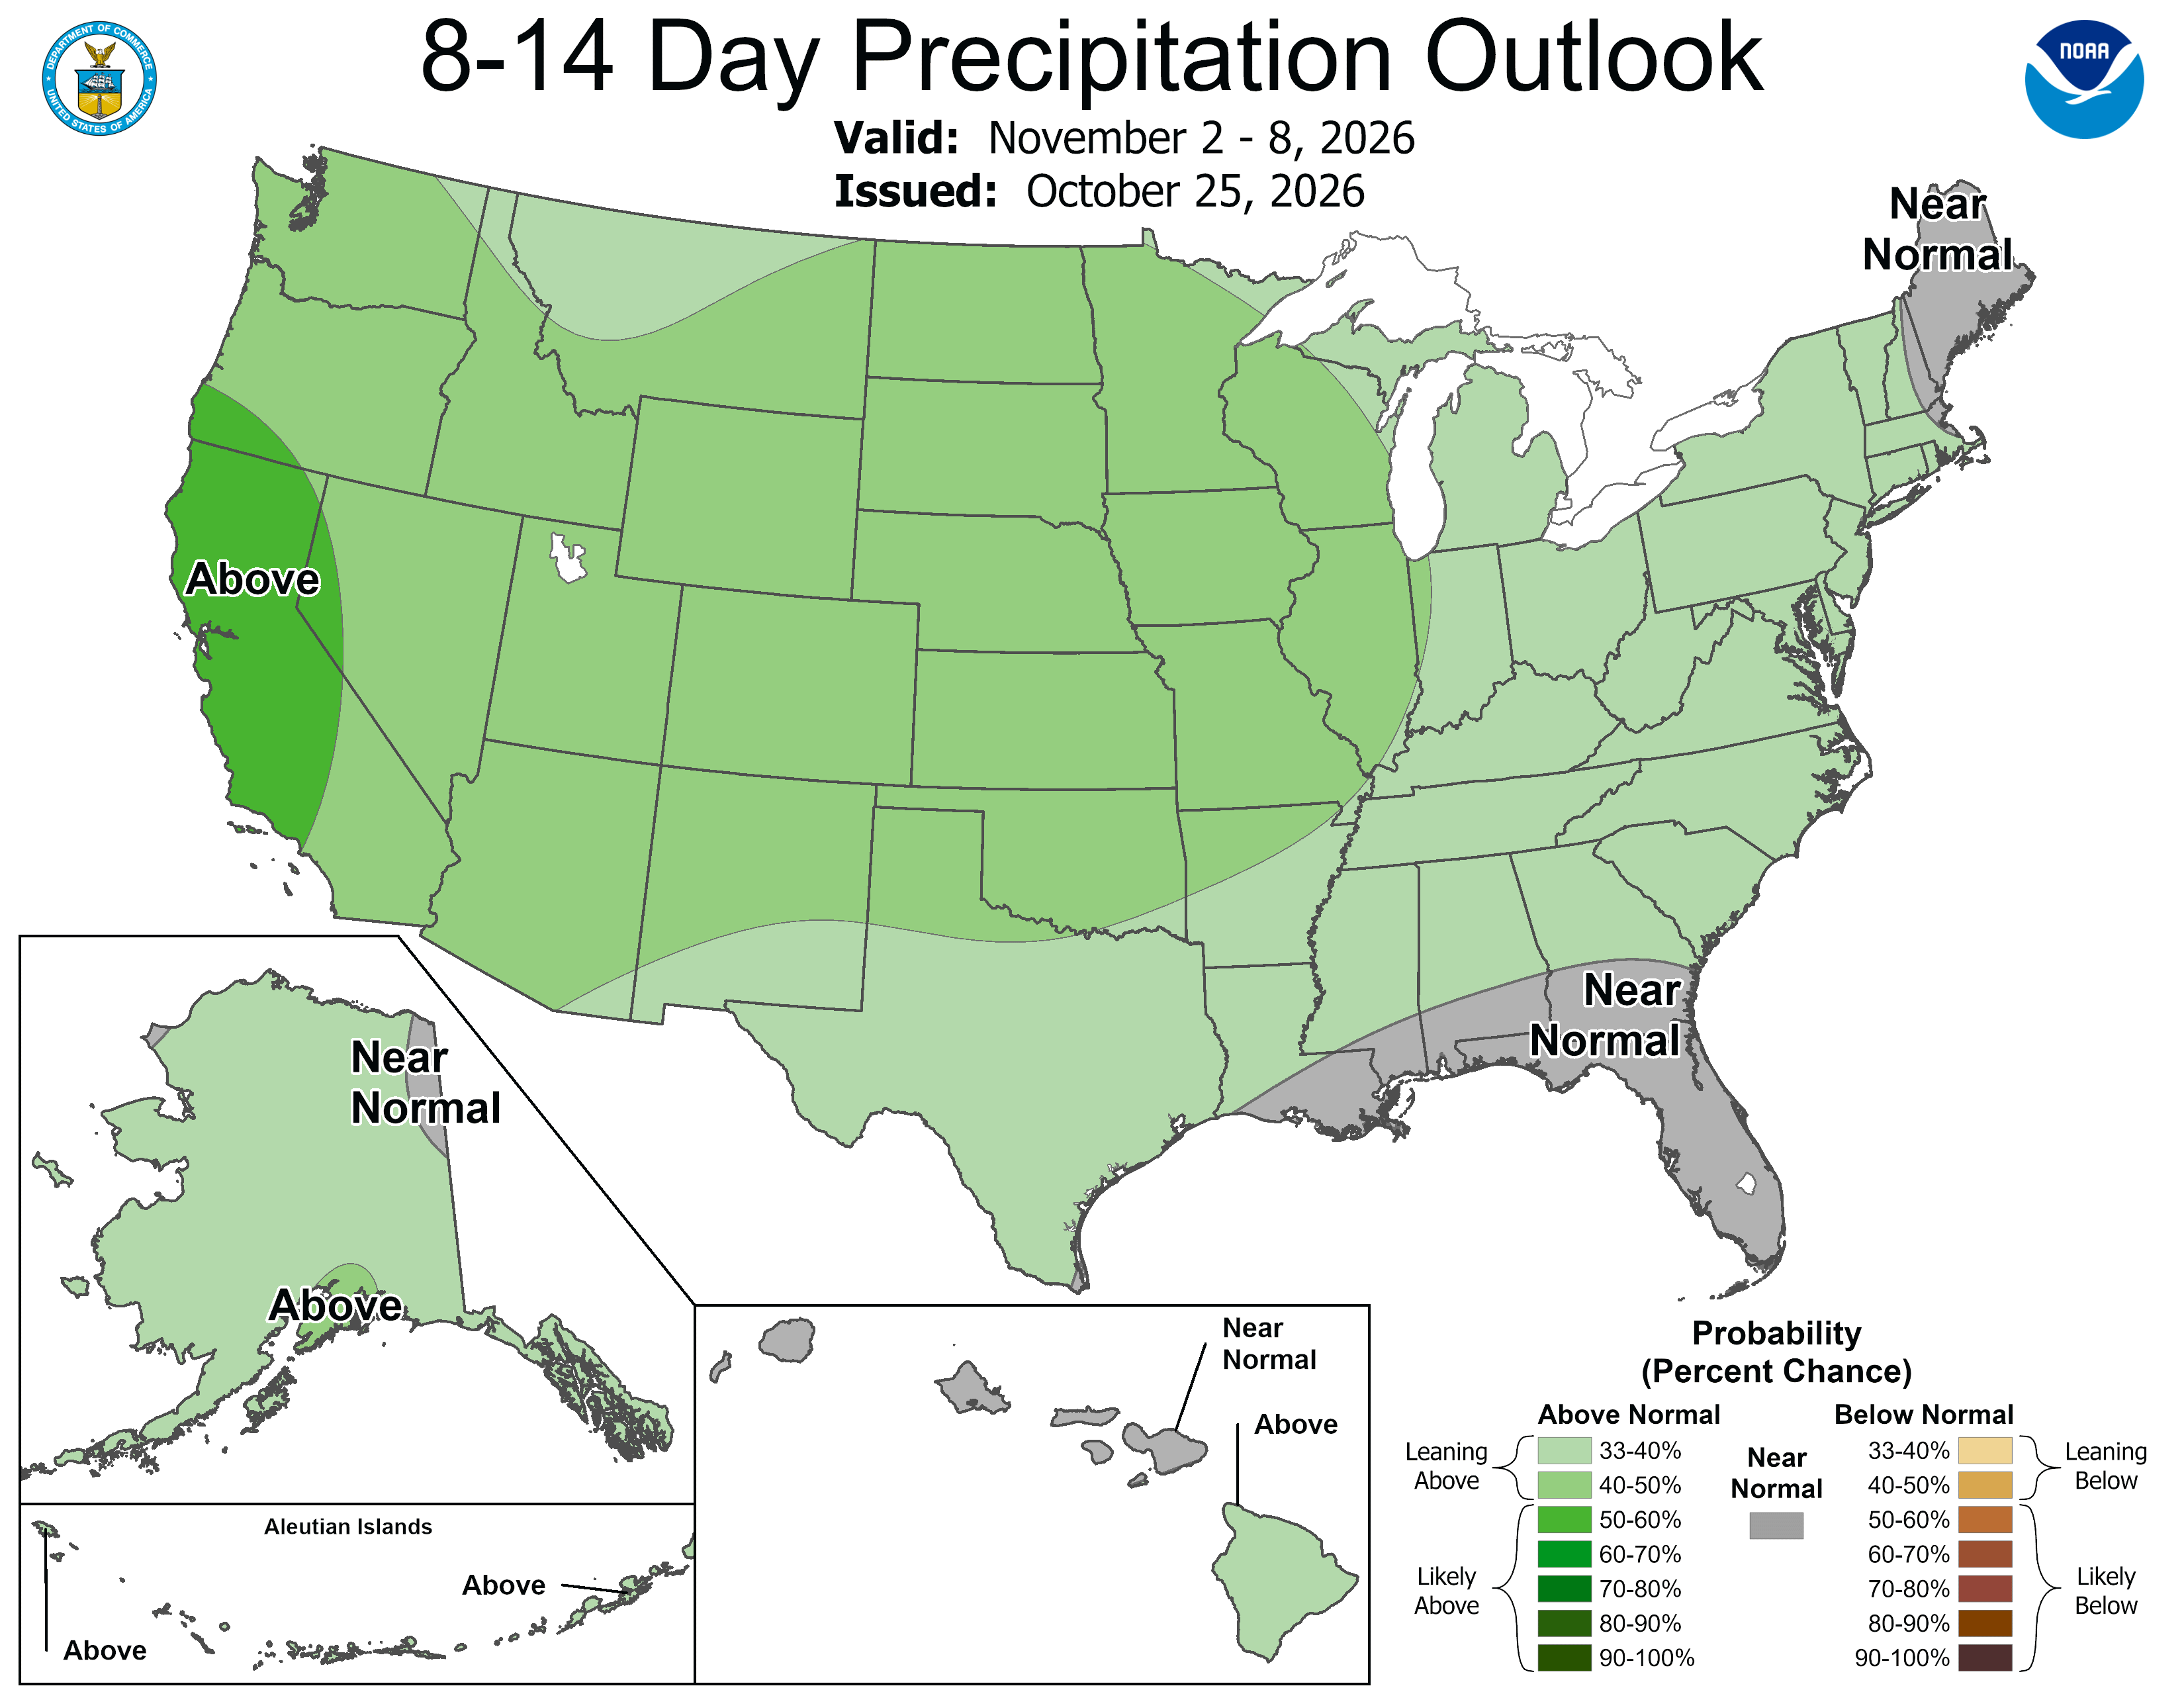
Below are the 8-14 day outlooks from the Climate Prediction Center, issued October 25, 2026, for temperature and precipitation, for the week starting November 2, 2026. The CPC expects above normal temperatures and above normal precipitation for the mountains of the South Platte River Basin.

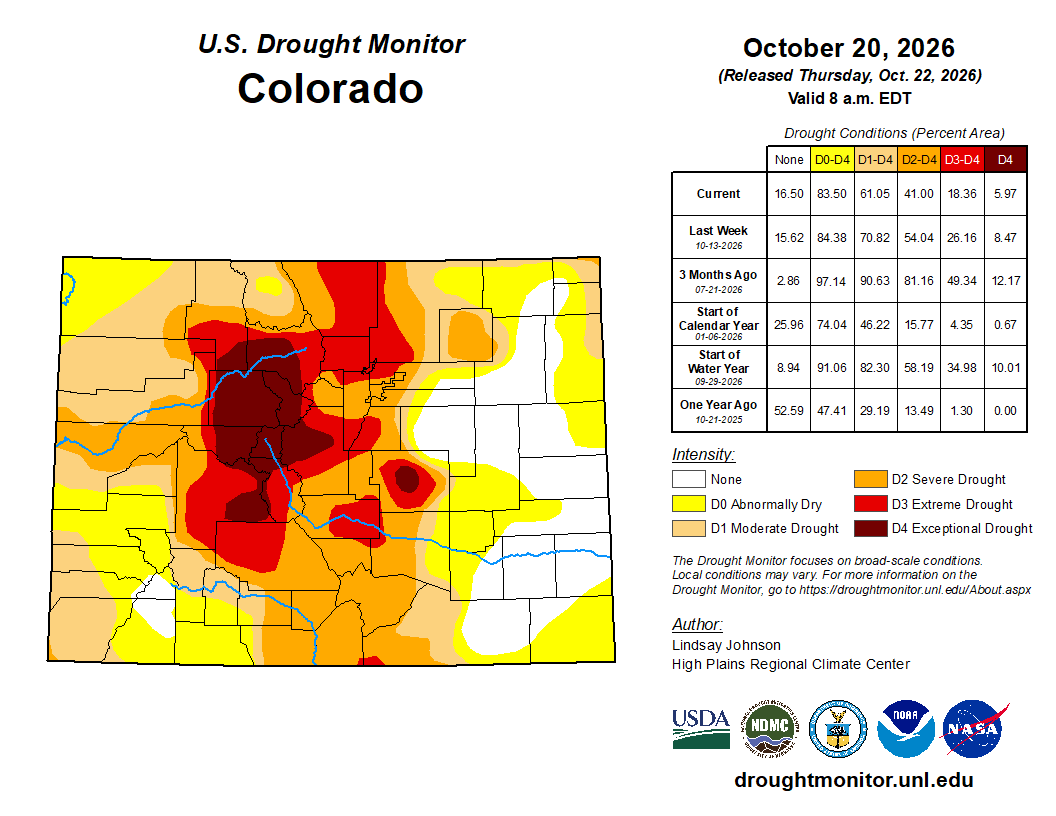
Below is the Colorado Drought Monitor map from October 20, 2026. There were one category improvments in Larimer, Weld, Boulder, Broomfiled, and Adams counties in the South Platte River Basin. There were one category degradations in Morgan County in the basin. Drought and abnormal dryness covers 83.50% of Colorado. The South Platte Basin is experiencing Abnormally Dry, Moderate, Severe, Extreme, and Exceptional drought conditions.

Below is the Colorado Drought Monitor one week change map ending October 20, 2026.

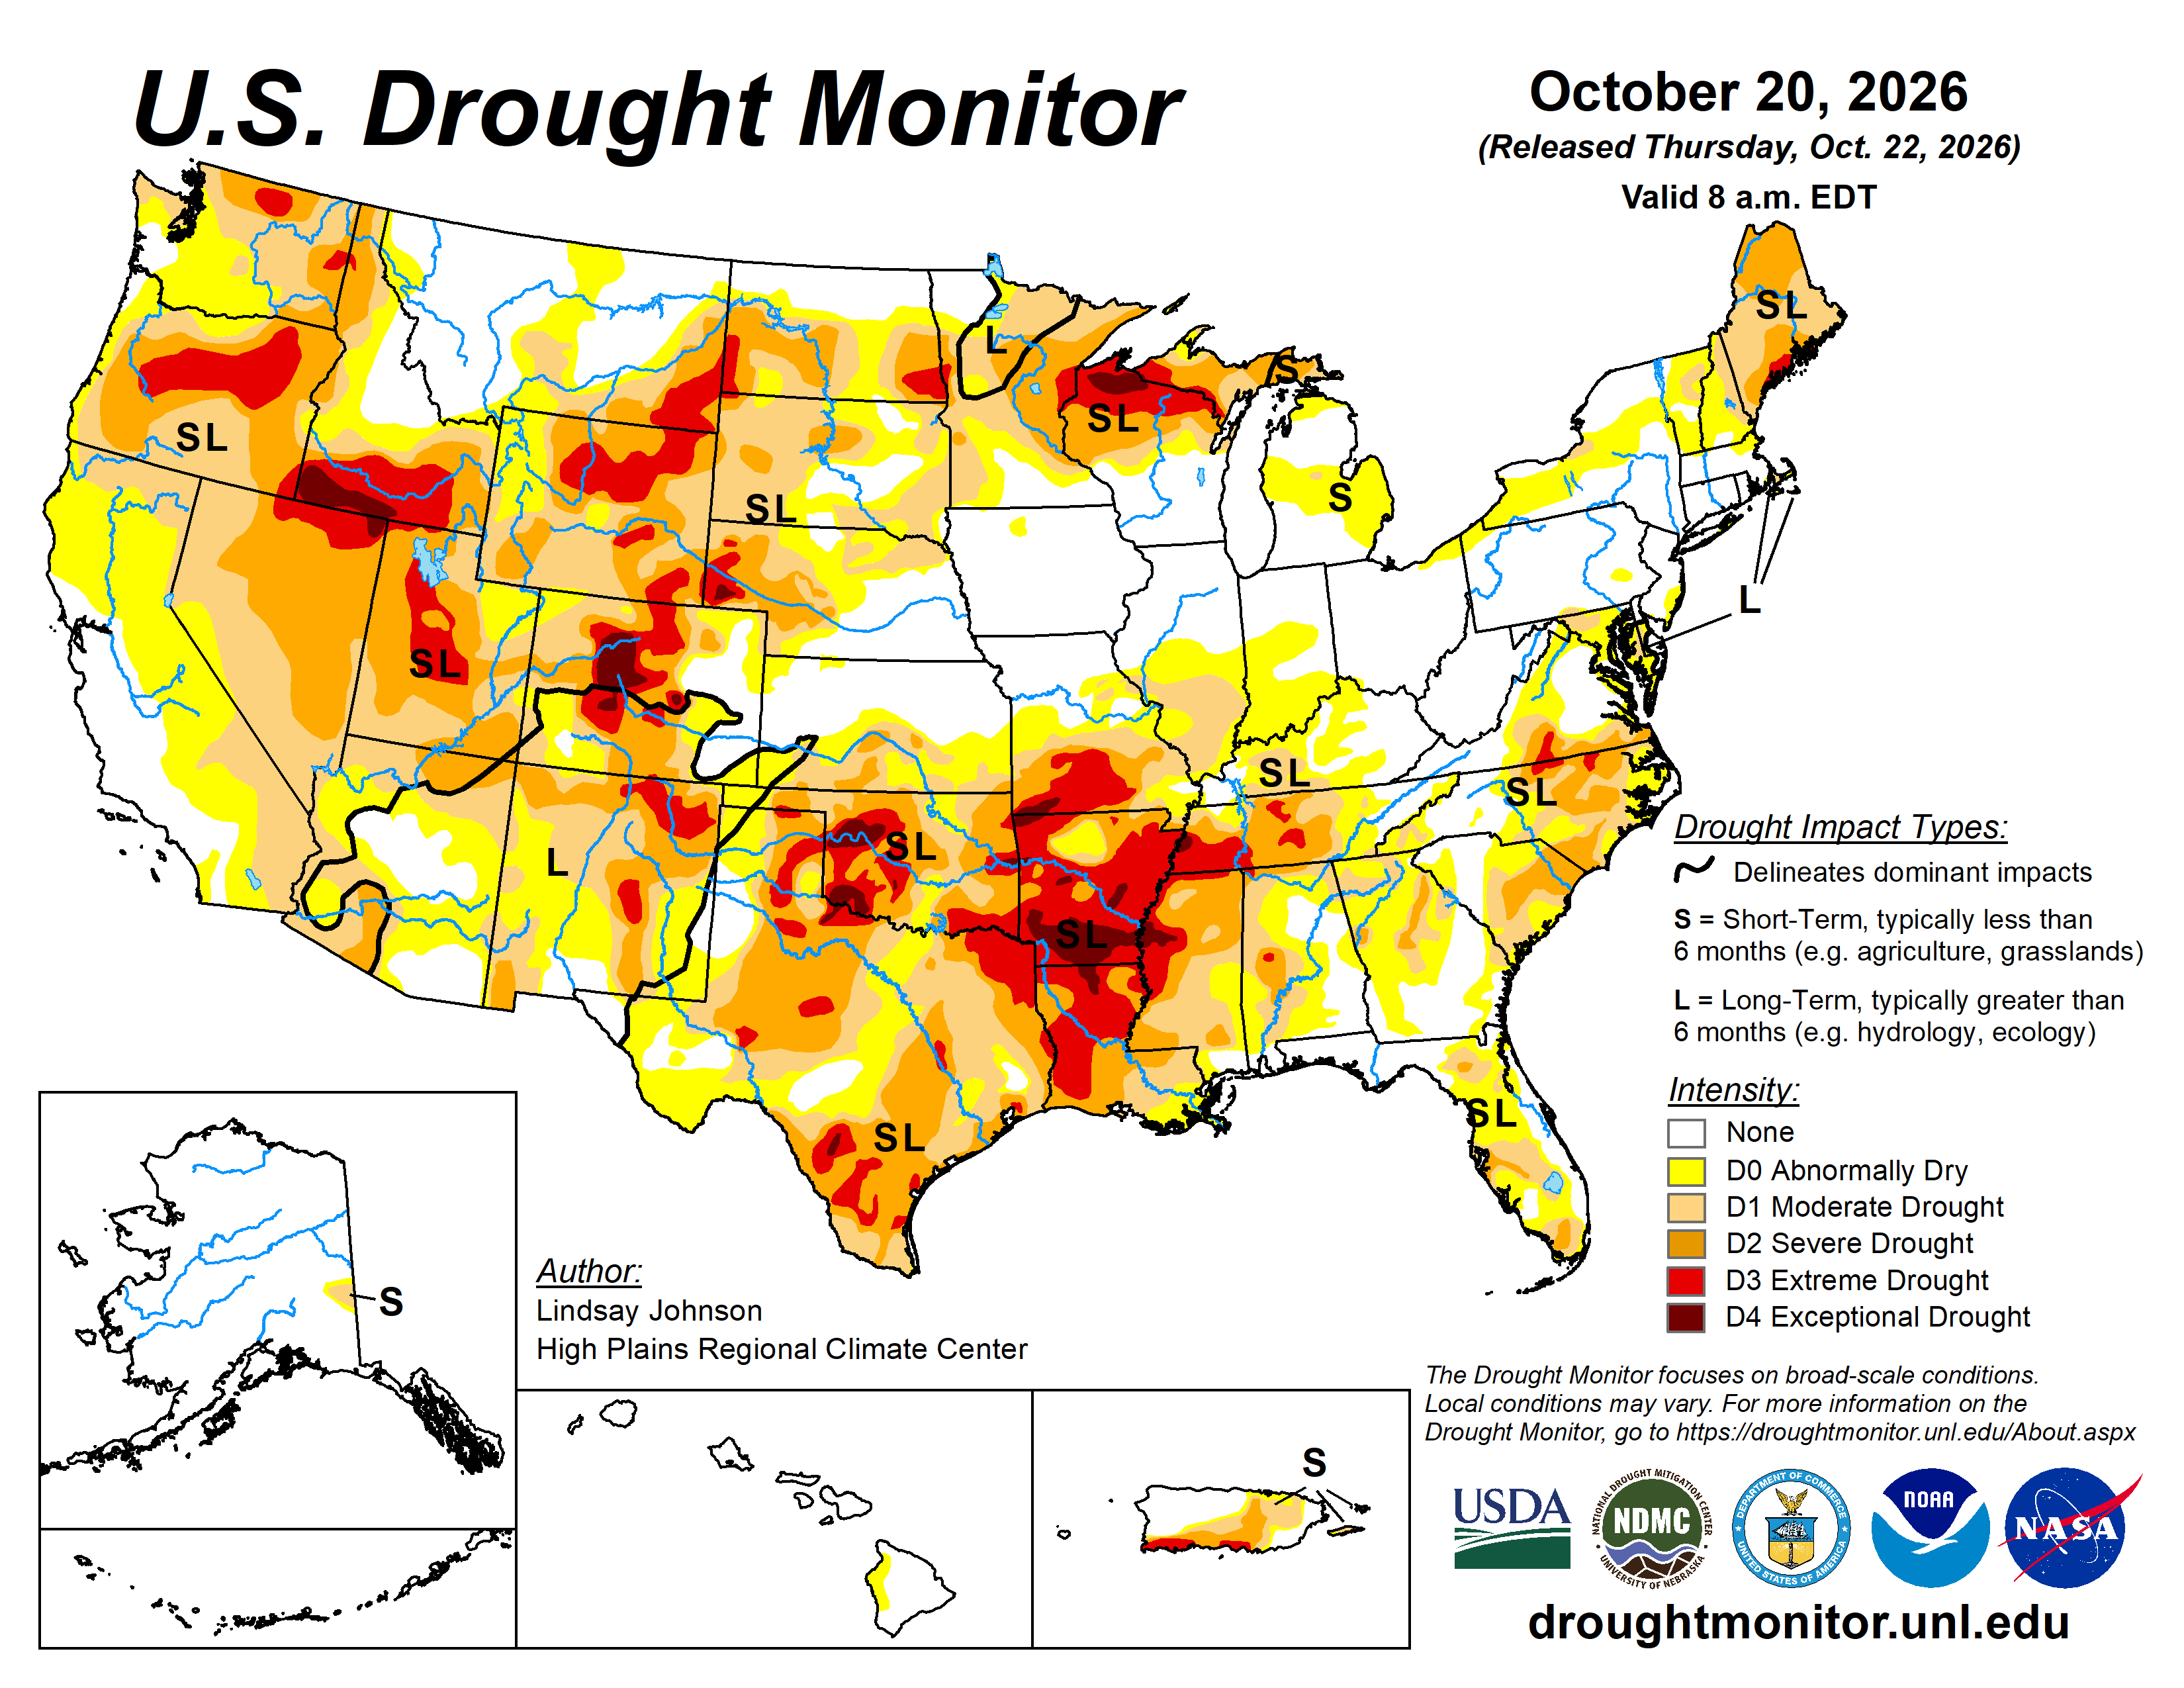
Here’s the US Drought Monitor Map from last week along with the one week U.S. change map.

Finally, Allen Best reports on the An astonishing year for heat in Colorado: Heat across state surpassed old record set in 1934 by two degrees. And, of course, snowpack was worst ever, too at Big Pivots:

“Holy crap,” said one of my acquaintances in Colorado when I passed along the news that Colorado, during the last water year, had an average temperature of 2 degrees Fahrenheit above the previous record year of 1934. For me, it wasn’t a great surprise. I remember all too well trying to write stories in 95 degree heat during summer in my former home/office. But it was a sucker punch nonetheless…This, many have said, is clear evidence that the current warming is just part of a phase. But this new report from Colorado State University researchers speaks to just how extraordinary these times are. The report comes after the conclusion of the 2025-26 water year, which starts in October and ends in September.

“Water year 2026 was one for the record books in Colorado,” the report says. “It was our warmest on record by a substantial margin, and it was also one of our driest.”

The mountain snowpack, the lowest ever, had implications across many sectors, from agriculture and wildfire to human health and recreation, the report continues. Once again, the temperatures continue to amaze. Colorado had four months — December and January, March and August — that were warmest ever. But 11 of the 12 months ranked among the top-15 warmest of those months on record. The researchers found that, statewide, temperatures were 4.5 degrees Fahrenheit above the averages seen between 1991-2020.