Fresh as the microplastic-laden Sierra snow: Scientists quantify exact amounts, types of plastics in snowfall — Jules Bernstein (University of #California, Riverside)

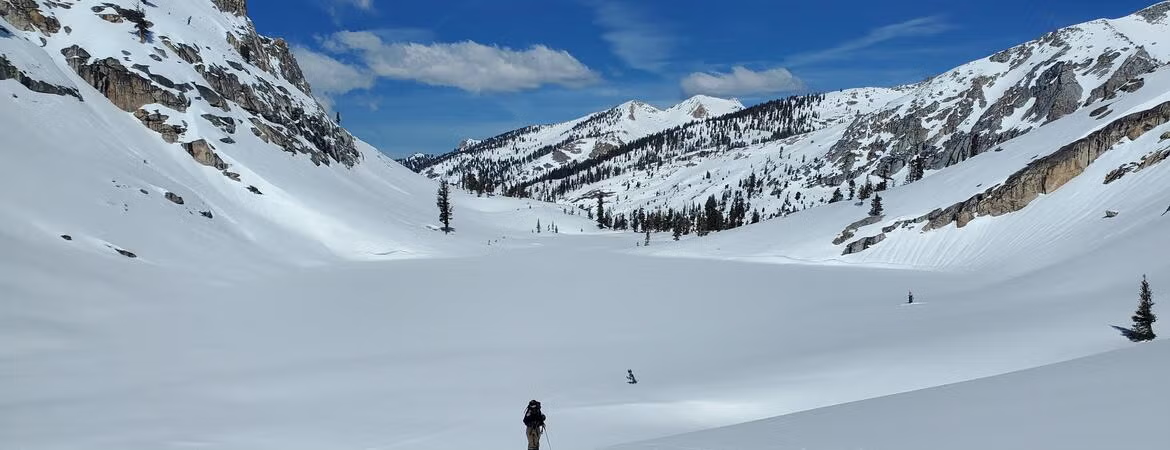
Photo credit: Sonya Maple/CDFW

Click the link to read the release on the UC Riverside website (Jules Bernstein):

October 28, 2026

For the first time, UC Riverside scientists have measured how much microplastic pollution falls on the Sierra Nevada during snowstorms and were surprised to find significant amounts even in the most remote locations.
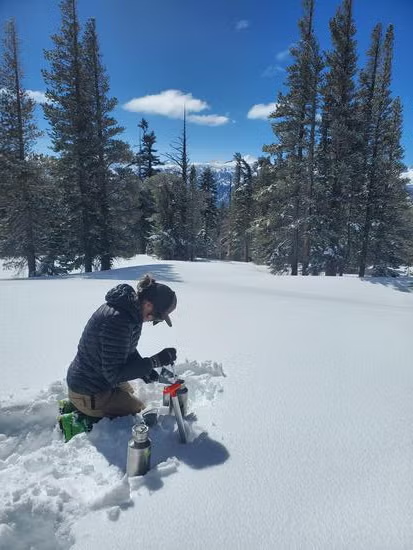
Toxicologist Aleksandra Karapetrova sampling snow in the Sierra Nevada, measuring microplastics. (Sonya Maple/CDFW)

Lead researcher Aleksandra Karapetrova, a UCR environmental toxicologist, could not access any of the snowfall collection sites by car or even on foot. She expected plastic to be harder to find or even nonexistent in at least a few of these locations, given their distance from human activity.

“One site was accessed by chairlift. I had to ski to the rest of the remote sites. That’s how isolated they are,” Karapetrova said. “But no matter how far out the site, I always found microplastics there.”

Details about the particles, the seven locations at which they were collected, and the method used to verify their chemical properties are described in the journal Environmental Science and Technology.

Though the study did not determine how much plastic ultimately reaches drinking water, the findings have significance beyond the mountain, as the Sierra Nevada snowpack supplies about 30% of California’s freshwater.

The study also describes how snow scavenges airborne plastic from the atmosphere and carries it to the ground, far from population centers and places where the plastic is produced or used.

Microplastics enter the air when plastic products shed fibers or wear down into small fragments. Clothing can emit fibers directly into the atmosphere, including through dryer vents or just daily wear, while wind lifts particles from the ground and transports them elsewhere.

As snowflakes fall, they collect some of these tiny plastic particles suspended in the air. This process, called scavenging, helps explain why researchers measured substantially more plastic arriving with the falling snow than during dry weather.
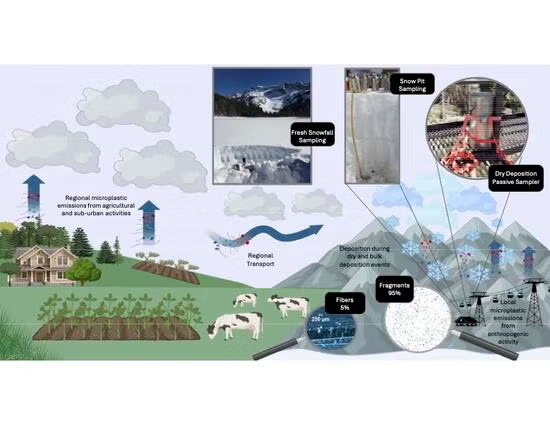
Flow chart depicting the process by which microplastics get into the atmosphere and snowfall. (Aleksandra Karapetrova/UCR)

“We are at a point where microplastics are in our atmosphere, not just the ocean, not just rivers. It comes down with the snowfall, making its way to places humans typically don’t go,” Karapetrova said.

At remote sampling locations, during the height of the storm, the snow deposited between 270 and 3,200 plastic particles per square meter, per day. At one site in the Mammoth Mountain ski area, the amount of pollution was roughly three times that found in remote sites. Between 2,600 and 7,500 particles per square meter per day there deposited in the snow. Nearby human activity and greater snowfall accumulation there are possible explanations.

“I didn’t think the plastics would stay suspended so much in the town,” Karapetrova said.

Even the large particle counts at Mammoth represent small amounts of material. At the highest estimated rate, snowfall over an acre would deliver about 1.5 grams of plastic per day.

To explore where the plastics may have originated, the researchers traced masses of air that ushered in the storms sampled in the study. Most of the storm air passed over Fresno and Madera counties, suggesting the Central Valley may be a region contributing these particles.

Computer models could not identify exact sources or exclude plastic arriving in the Sierra from even farther away.

The snow appears pristine, but analysis paints a different picture. (Sonya Maple/CDFW)

Earlier research had already established that microplastics occur in Western U.S. snow. This study examined how much is being deposited on the ground during individual storms, allowing researchers to connect measurements with particular weather events.

Confirming the particles’ identities required more than looking through a microscope. Researchers used infrared light to read chemical signatures, then compared those signatures with a reference library to distinguish plastic from soil and plant material.

Most commonly, the researchers found polyethylene, polypropylene, and polyester/PET, which are plastics commonly used in clothing and packaging. The team also found cellulose derivatives, a group of chemically modified, plant-based materials used in consumer products.

This study did not assess health effects of microplastics in the environment. However, some chemicals used in plastics have documented health effects including hormone disruption, inflammation, and cellular damage.

The particles’ familiar ingredients point to the reach of everyday plastic use far beyond the products themselves.

“We’ve reached a point where plastic pollution is falling out of the sky every day, across this entire region, even when it isn’t snowing,” Karapetrova said.

Shaded relief map of the US via Learner.org

Most Wells Around the Grand Canyon With High Arsenic Levels Are at #Uranium Mine, New Analysis Shows — Wyatt Myskow (InsideClimateNews.org)

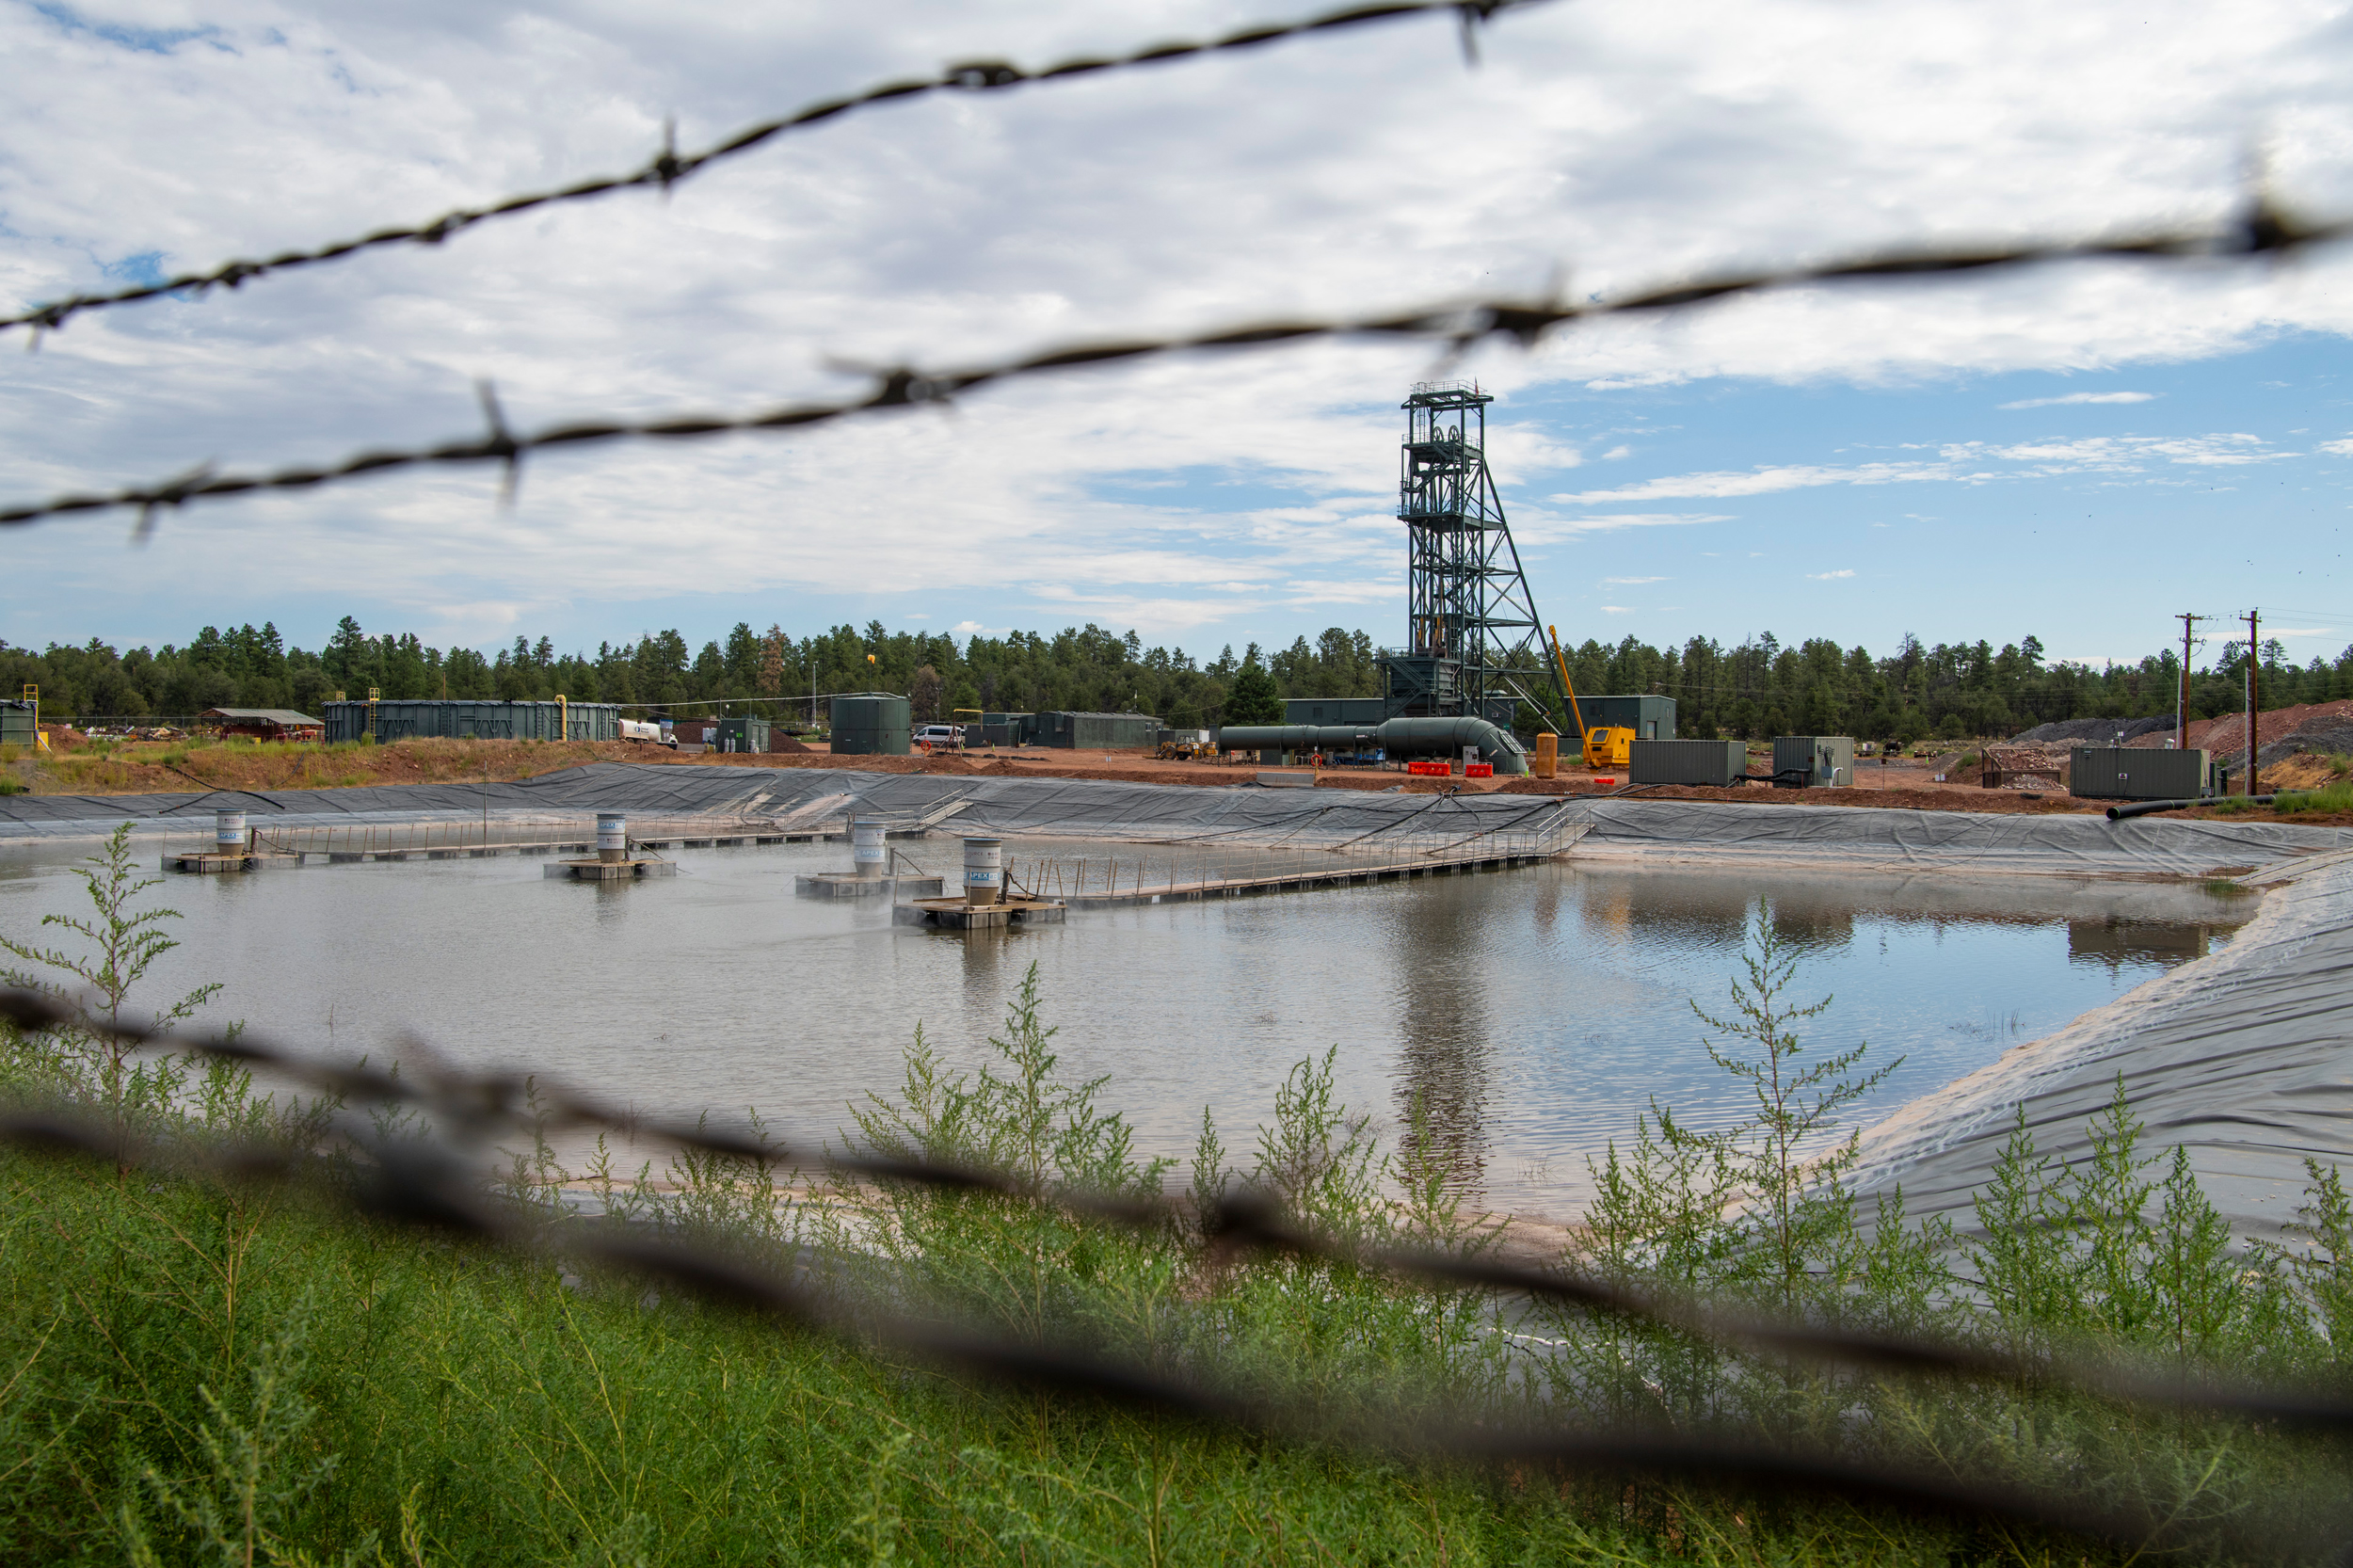
The evaporation pond at the Pinyon Plain Mine in Arizona. Credit: Blake McCord

Click the link to read the article on the Inside Climate News website (Wyatt Myskow):

October 28, 2026

Pinyon Plain Mine representatives argue that the toxic metal is naturally occurring, not contamination from the mining operation.

Three of four wells across the Grand Canyon region that have average arsenic levels above the Environmental Protection Agency’s standard for safe drinking water are at the site of a controversial uranium mine, a new analysis of groundwater sampling shows.

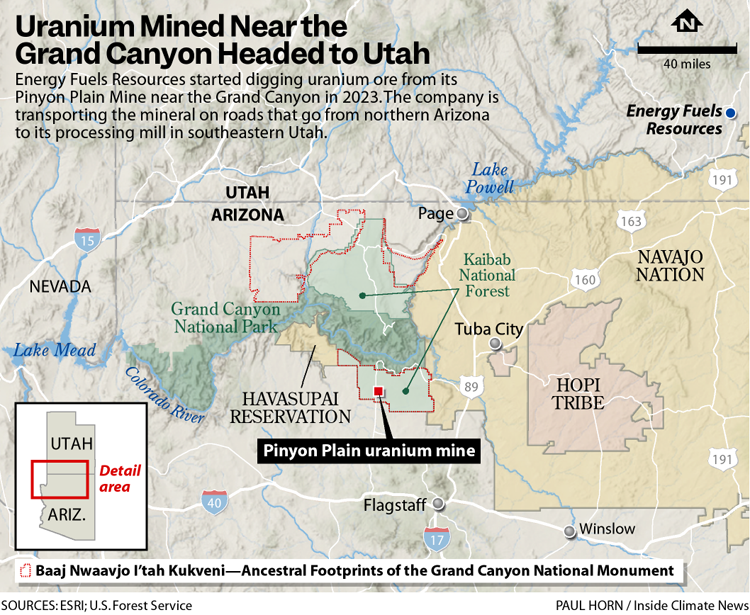
The analysis from the Grand Canyon Trust, a nonprofit advocating for protection of the canyon and the Colorado Plateau, relied on 32 years of groundwater sampling across 40 sites from the U.S. Geological Survey and the Arizona Department of Environmental Quality. The Pinyon Plain Mine, where the contaminated wells are located, lies within a national monument just nine miles away from the South Rim of the Grand Canyon.

The heightened arsenic levels at the mine site are not a coincidence, Misael Cabrera, senior vice president of environment, safety and sustainability for the mining company, Energy Fuels Resources Inc., said, as arsenic is found in highly mineralized areas, like at the Pinyon Plain Mine site.

“We don’t get to choose where we put a mine,” he said. “Nature puts the minerals in certain locations, and then if we want to harvest those minerals, we have to go to those locations.”

Cabrera was the director of the Arizona Department of Environmental Quality when the mine was being permitted.

It is the latest dispute in a months-long debate over the rising arsenic levels, what is increasing them and whether the contaminant is at risk of spreading throughout the region. Pinyon Plain mine—located within the Baaj Nwaavjo I’tah Kukveni—Ancestral Footprints of the Grand Canyon National Monument, is one of the country’s first new uranium minesdriven by a resurgence of interest in nuclear energy.

The analysis comes after ADEQ permitted Energy Fuels to raise the levels of arsenic at one of the mine’s monitoring wells that require the company to issue an alert about the contamination. That decision prompted outcry from local communities and researchers.

“Our opposition is not based on fear or politics,” said Havasupai Tribal Chairwoman Melinda Yaiva at a press conference announcing the findings. “It is based on our responsibility as a sovereign tribal nation to protect our people, our homeland and the water that makes life in Supai (the tribe’s village in the Grand Canyon) possible. Today, the immediate issue is arsenic.”

For years, the mine’s opponents have expressed concern it would contaminate the region’s groundwater. Research from hydrologists found the shallow groundwater aquifer the mine drills into is connected to the deeper, regional aquifer. Reviews by the U.S. Geological Survey and the Environmental Protection Agency followed and found more research is needed to understand if the mine site poses a threat to the region’s water quality.

Cabrera said no data shows there is a risk for the mine’s water to spread.

“Despite all of the evidence that we have on record, despite all of the regulatory approvals, despite the multiple court cases, we are still being assumed to be guilty before proven innocent,” he said. “We really need to reflect on that as a country if we want to be able to produce our own energy without relying so heavily on foreign sources.”

He likened the current situation to looking at a traffic map of Arizona, where major cities like Phoenix would have the most congestion. “In the same vein, you are going to have higher levels of minerals” like arsenic at mine sites.

Laura Crossey, an emeritus professor of earth science at the University of New Mexico, who for decades has researched the hydrogeology of the Grand Canyon, has a traffic analogy as well. Dismissing data showing the aquifers are connected and that contamination can spread is “like studying the traffic pattern of Phoenix by only looking at the side streets and ignoring the interstates that move through, that are carrying much higher volumes, much higher speeds.”

One monitoring well at Energy Fuels’ Pinyon Plain Mine exceeded permitted alert levels for arsenic four times since 2025, before the company applied to amend its permit to allow for higher levels of arsenic. The groundwater in the mine’s sump is over 3,000 times the limit for arsenic in drinking water. At the mine’s monitoring wells, the water is nearly two, three and six times the safe drinking water levels of arsenic, respectively.

“This is a kind of a failure in the monitoring program and the regulatory process, because at the present time, we don’t really know why the arsenic is rising, because it hasn’t been thoroughly investigated,” said Brad Esser, a retired environmental radiochemistry researcher at Lawrence Livermore National Laboratory.

If the mine’s evaporation pond is leaking, it can be patched. If the groundwater pumping is changing the hydrologic flow, then limits can be placed on the pumping. But without a definitive study and answer to what’s causing the increasing levels of arsenic, a mitigation plan can’t be put in place, he said.

Image Source: Michigan State University Extension, Water Quality Bulletin # 35, August 1991

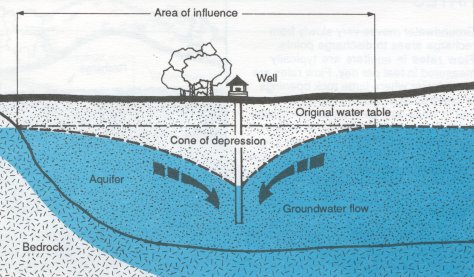
ADEQ and the company have claimed the arsenic issue is natural, and not due to mining. They attribute the rising arsenic levels to its groundwater pumping causing a “cone of depression” around the well that is drawing in water with more naturally occurring arsenic from further reaches of the aquifer.

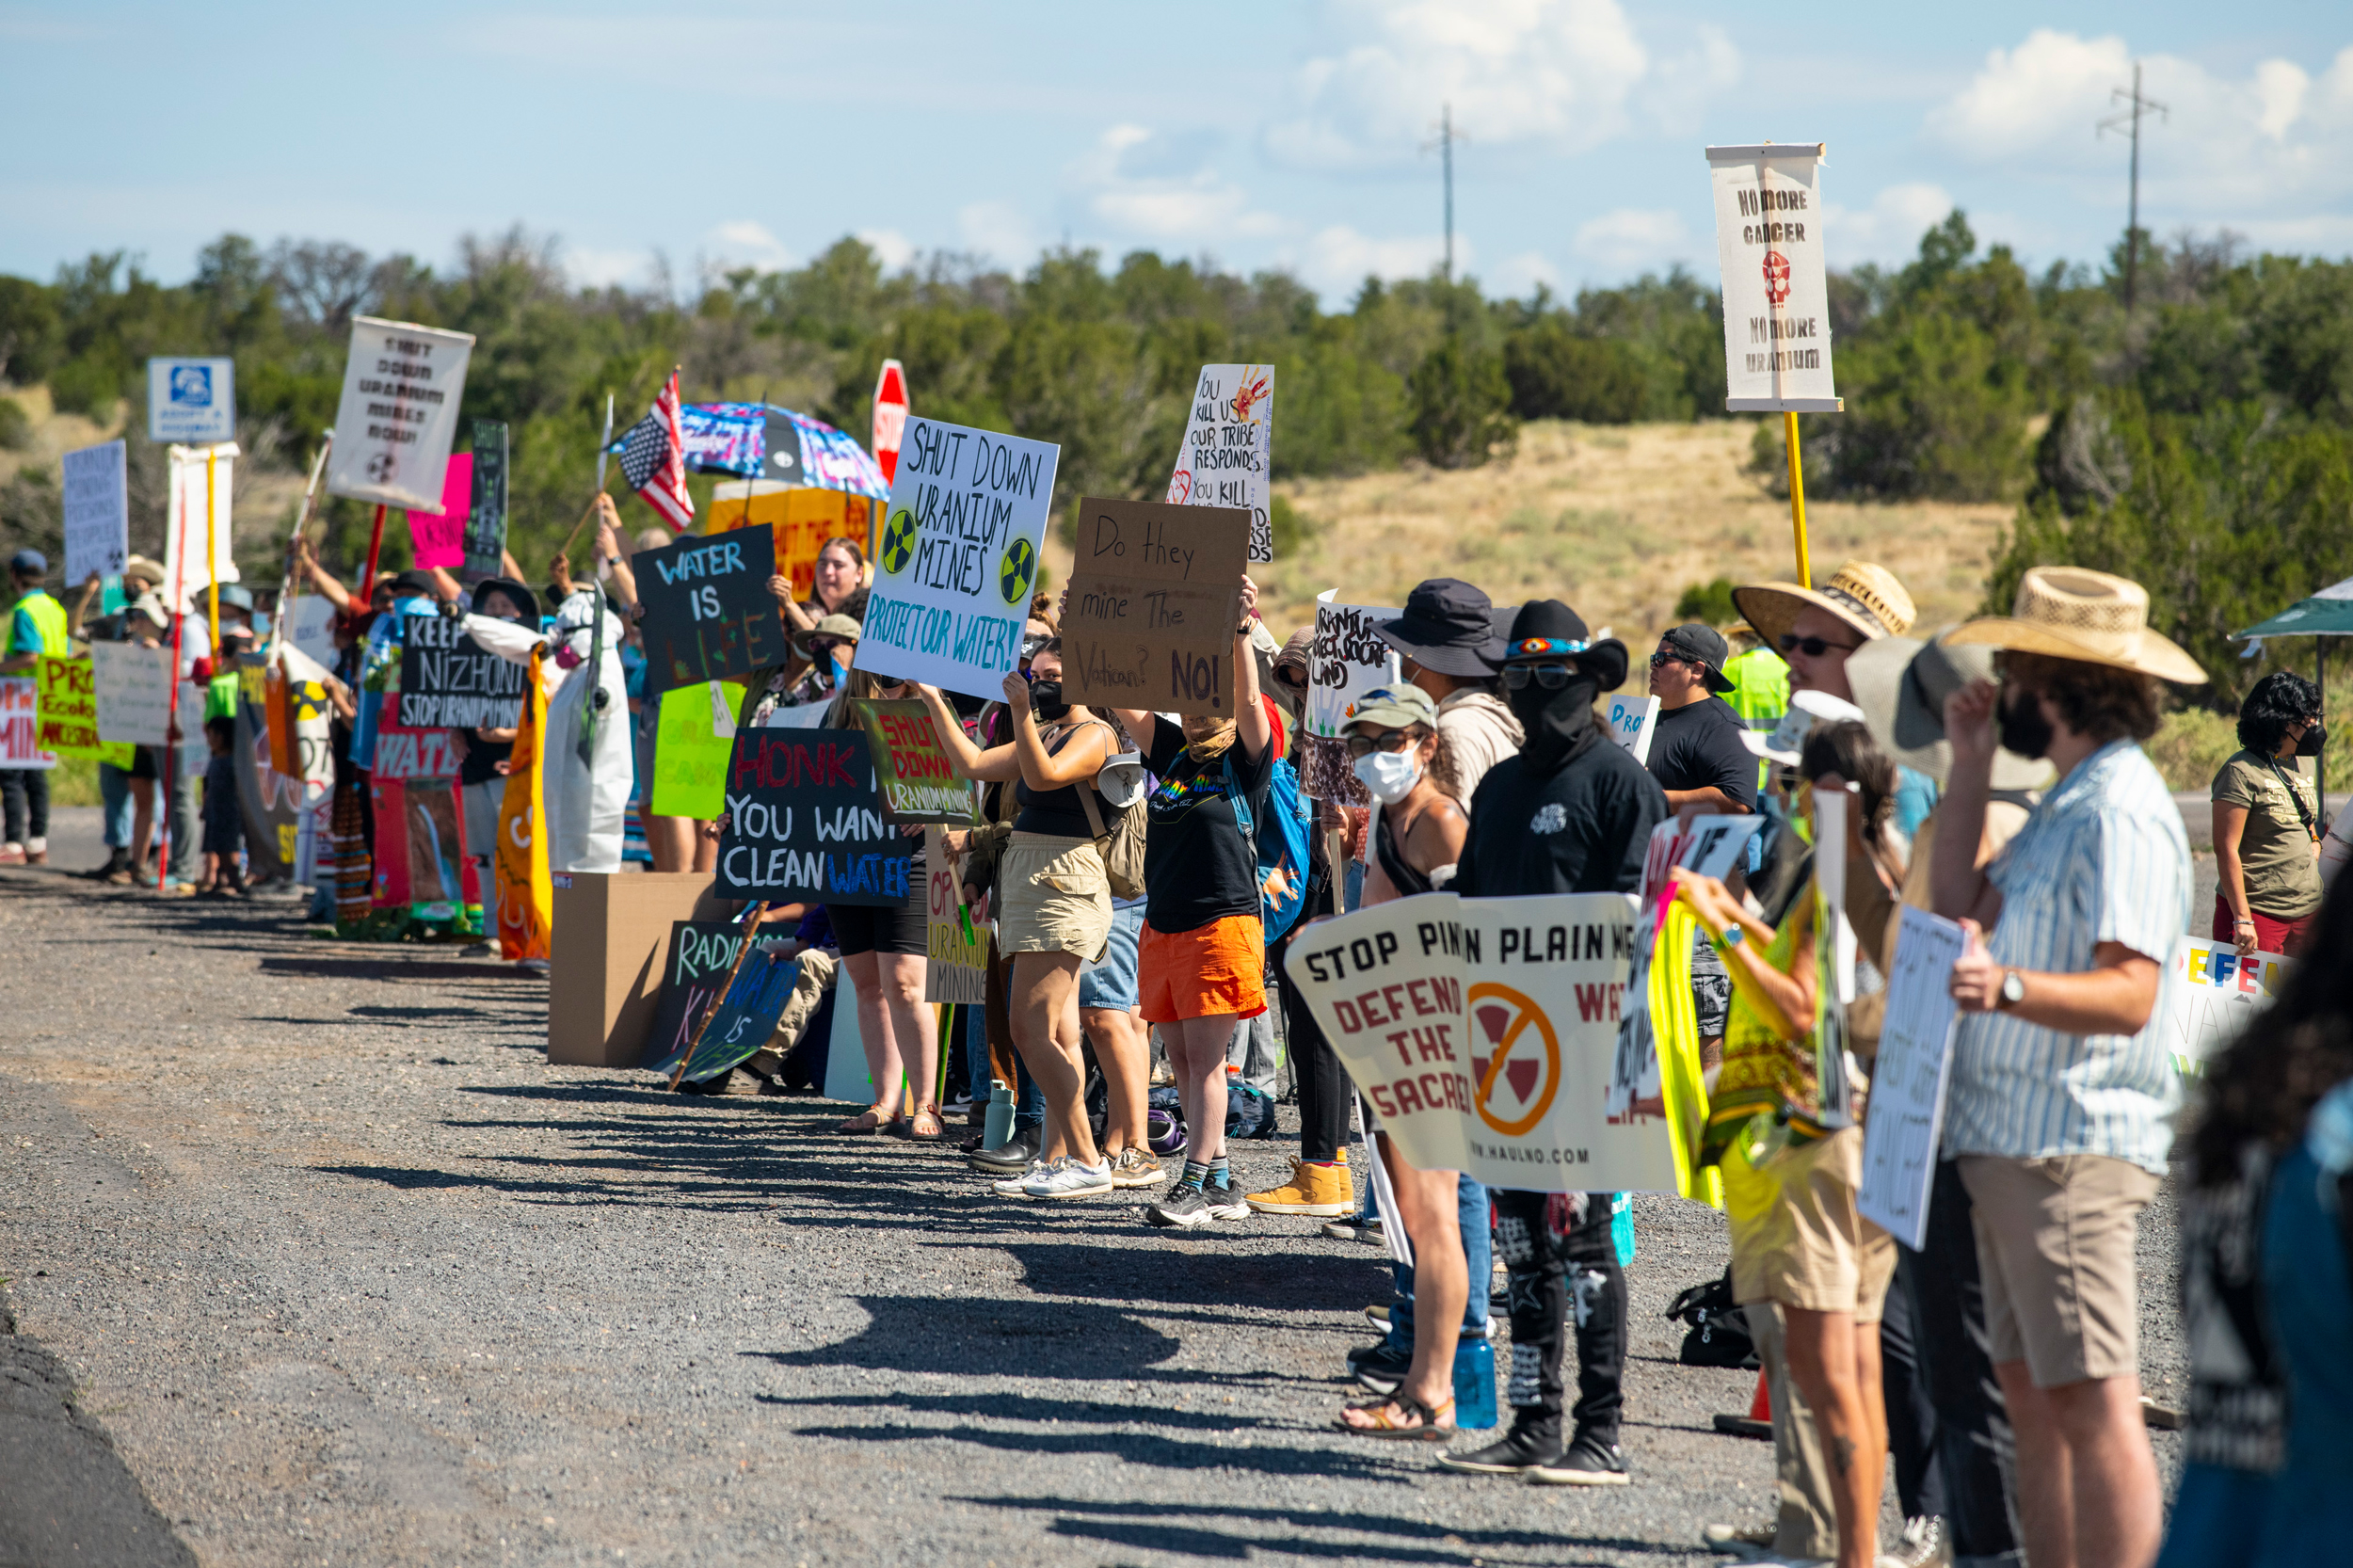
Protesters voice their opposition to uranium hauling from the Pinyon Plain Mine in Arizona. Credit: Blake McCord

Critics have questioned that claim and said more data was needed to prove it before permitting higher arsenic alert levels. The analysis of regional arsenic levels in groundwater, they say, shows the company and ADEQ’s hypothesis is wrong.

“If arsenic concentrations in groundwater outside the mine are lower than inside, how can drawing low concentration outside increase the already high and increasing arsenic concentrations inside the property,” asked Dave Kreamer, emeritus professor of hydrology at the University of Nevada, Las Vegas. “You would think that adding cleaner water, groundwater from outside, shouldn’t it dilute the high concentrations inside? I’ve been asking this question of ADEQ monthly since June 1, and have not got an answer yet.”

Most at risk is the Havasupai Tribe, whose reservation is in the Grand Canyon. Its only source of water is Havasu Creek, which is directly fed by the regional Redwall-Mauv aquifer—the deeper regional groundwater supply.

The tribe has objected to ADEQ raising the allowable arsenic levels at the mine site, and appealed the decision. That appeal was dismissed by the agency’s appeals board, which concluded the tribe lacked standing. Yaiva said the tribe is considering what other options it has, including legal ones.

Something Havasupai children are taught at birth, Yaiva said, is that water is sacred. Havasu Creek, located on the tribe’s reservation and famed for its vibrant blue-green waters, is not just a beautiful place, she said. “It is the lifeblood of our homeland.”

“Our people drink this water,” she said. “We cook with it. We grow food with it. We care for our animals with it, and depend on it every day. It is also part of our ceremonies, our traditions, and our culture, and our identity as Havasupai people. Our relationship with this water goes back generations, long before the state of Arizona existed, long before the federal government approved the uranium mining near our homeland.”

In addition to supporting the Havasupai people, the waters in Havasu Canyon give life to an array of animals and plants. Photo credit: Amy S. Martin via The Grand Canyon Trust

Research Article: Catalytic reactive-hydrogen membranes for rapid capture and hydrodefluorination of six #PFAS of regulatory concern — Min Long, Ai-Shi Wang, Weldon C. Elias, and Bruce E. Rittmann (PNAS.org)

Click the link to read the article on the PNAS website (Min Long, Ai-Shi Wang, Weldon C. Elias, and Bruce E. Rittmann). Here’s the abstract:

October 19, 2026

Significance

Per- and polyfluoroalkyl substances (PFAS) are notoriously difficult to destroy in ambient conditions, and the catalytic principles needed for low-energy defluorination remain an unachieved goal. This study identifies a previously unrecognized dual-hydrogen mechanism in catalytic membranes, in which surface hydrogen captures PFAS while subsurface hydrogen, stored as β-PdHx, drives C–F bond cleavage. By linking hydrogen generation, storage, and reactivity within a membrane platform, this work advances a mechanistic framework for destructive PFAS treatment rather than simple contaminant separation. The results establish both a mechanistic foundation for hydrogen-enabled defluorination and a scalable membrane-based strategy for continuous, low-energy PFAS destruction in water.

Abstract

Per- and polyfluoroalkyl substances (PFAS) persist in aquatic environments due to their ultrastable C–F bonds and poor susceptibility to conventional treatment. Here, we report an H2-based catalytic-film membrane that enables PFAS destruction in ambient conditions by generating highly reactive surface (Hads*) and subsurface hydrogen (Hsub*), the latter stored as β-phase palladium hydride (β-PdHx). Solid-state analyses evidenced β-PdHx formation and related lattice expansion with elevated H2 chemical potential, revealing a structural mechanism that links hydrogen storage to catalytic defluorination. Mechanistically, the two hydrogen species play complementary roles: Hads*-rich Pd0 surface enabled PFAS capture through parallel adsorption to maximize interfacial contact with active H, whereas sustained Hsub* supplied the energetic driving force for stepwise hydrodefluorination consistent with sequential C–F scission. As a result, across six PFAS of regulatory concern—PFOA, PFOS, PFNA, PFHxS, PFBS, and GenX—the catalytic membrane converted all contaminants toward fully defluorinated products. Long-chain PFAS were removed and defluorinated more rapidly than short-chain analogs, while GenX showed greater recalcitrance due to its ether linkage, weaker adsorption, and higher average C–F bond dissociation energy; nonetheless, GenX still exhibited removal and defluorination, with the production of 2-propoxypropanoic acid. The system also enabled continuous coremoval of all six PFAS in ambient conditions, with up to 96% removal and 83% defluorination over 58 d. These findings provide a mechanistic framework for how active hydrogen is generated, stored, and deployed in catalytic membranes, and identify engineered H2-catalytic membranes as a promising low-energy technology for destructive PFAS treatment.

Per- and polyfluoroalkyl substances (PFAS), the so-called “forever chemicals,” have become a class of global contaminants of regulatory concern. Decades of extensive deployment of PFAS in firefighting foams, oil- and water-repellent surfaces, non-stick cookware, and food-contact materials have created diffuse, chronic inputs into watersheds and drinking-water supplies (1). Their amphiphilic architectures combine perfluorinated chains with polar headgroups, a molecular design that underpins their commercial success, but also drives rapid aqueous dispersion, sustained mobility, and environmental persistence (2–4).

Monitoring campaigns increasingly reveal co-occurrence of multiple PFAS of regulatory concern in raw and treated waters, with mixtures of perfluorooctane sulfonate (PFOS), perfluorooctanoic acid (PFOA), hexafluoropropylene oxide dimer acid (GenX), perfluorobutanesulfonic acid (PFBS), perfluorononanoic acid (PFNA), and perfluorohexanesulfonic acid (PFHxS) frequently detected at summed concentrations approaching or exceeding 1,000 ng/L; hot spots have reported raw water levels up to 11,000 ng/L and finished water still containing >1,000 ng/L (5, 6). Parallel epidemiological and toxicological evidence links PFAS exposure to immunomodulation, developmental and metabolic disruption, cardiovascular risk elevation, and carcinogenicity (1, 7). In response to these growing risks, in 2024, the United States Environmental Protection Agency finalized Maximum Contaminant Levels of 4 ng/L (4 ppt) for PFOA and PFOS individually and 10 ng/L for PFNA, PFHxS, and GenX, together with a Hazard Index of 1 for mixtures containing two or more of PFNA, PFHxS, GenX, and PFBS. In May 2026, the EPA proposed retaining the PFOA and PFOS limits while rescinding the standards for other PFAS. These ongoing regulatory developments, particularly the growing concern over the cumulative risks of PFAS mixtures, expose a wide technology gap between current treatment performance and mandated outcomes.

The resistance of PFAS to conventional treatment stems in large part from the exceptional strength of the C–F bond, and the low bond polarizability of the electron cloud for F contributes to the physicochemical inertness of the C–F bond, which limits oxidative, photolytic, and biological reactivities (8, 9). Today, utilities must rely on separation technologies (granular or powdered activated carbon, ion exchange, nanofiltration, reverse osmosis) to meet interim goals (10, 11). These approaches sequester rather than destroy PFAS, generating secondary wastes (spent sorbents, brines, concentrates) and increasing costs for handling, regeneration, or disposal. Furthermore, the shorter-chain and ether-containing species exhibit early breakthrough. Destructive processes capable of C–F scission include photochemical, electrochemical, thermal, plasma, or advanced-reduction methods. Although some achieve high defluorination, quantitative benchmarking shows that they commonly require aggressive operating conditions, entail high energy inputs, and exhibit limited selectivity, all of which complicate scale-up and sustainability (SI Appendix, Table S1) (12). Still lacking are treatment systems that operate at ambient conditions and achieve high-affinity capture with in situ defluorination.

Hydrogen-driven hydrodefluorination offers a direct reductive route under comparatively mild conditions (13). Palladium nanoparticles (Pd0NPs) activate H2 efficiently, transiently incorporate hydrogen into near-surface lattice sites, and can mediate sequential C–F bond cleavage along perfluoroalkyl chains. Hydrogen-based membrane catalyst-film reactors (H2-MCfRs) feature in situ–deposited metallic Pd0 nanoparticles, enabling direct gas-to-solid hydrogen transfer and demonstrating documented PFOA removal via hydrodefluorination (14). This success warrants studies to identify the underlying mechanisms by which Pd0NPs destroy PFAS with diverse structural features.

Here, we investigate six priority PFAS (PFOS, PFOA, PFBS, PFNA, PFHxS, GenX) using membrane-supported, in situ formed Pd0 nanoparticles that couple removal with reductive defluorination at ambient conditions. Using well-controlled batch systems, we resolve how perfluoroalkyl chain length and functional headgroup govern PFAS removal and C–F bond cleavage. By distinguishing between outer-surface-adsorbed H and in-lattice-adsorbed H, we identify mechanisms that relate H location with sequential hydrodefluorination. Calculations using density functional theory (DFT) explain experimentally observed adsorption hierarchies and defluorination trends by quantifying interfacial energetics. We also conduct a long-term continuous test for sustainable defluorination of a mixture of 6 PFAS for practical application. Together, the integrated experimental-plus-computational framework clarifies structure–reactivity relationships delineate design principles for hydrogen-based catalytic membranes aimed at minimizing secondary waste while advancing toward emerging ultra-low regulatory thresholds.

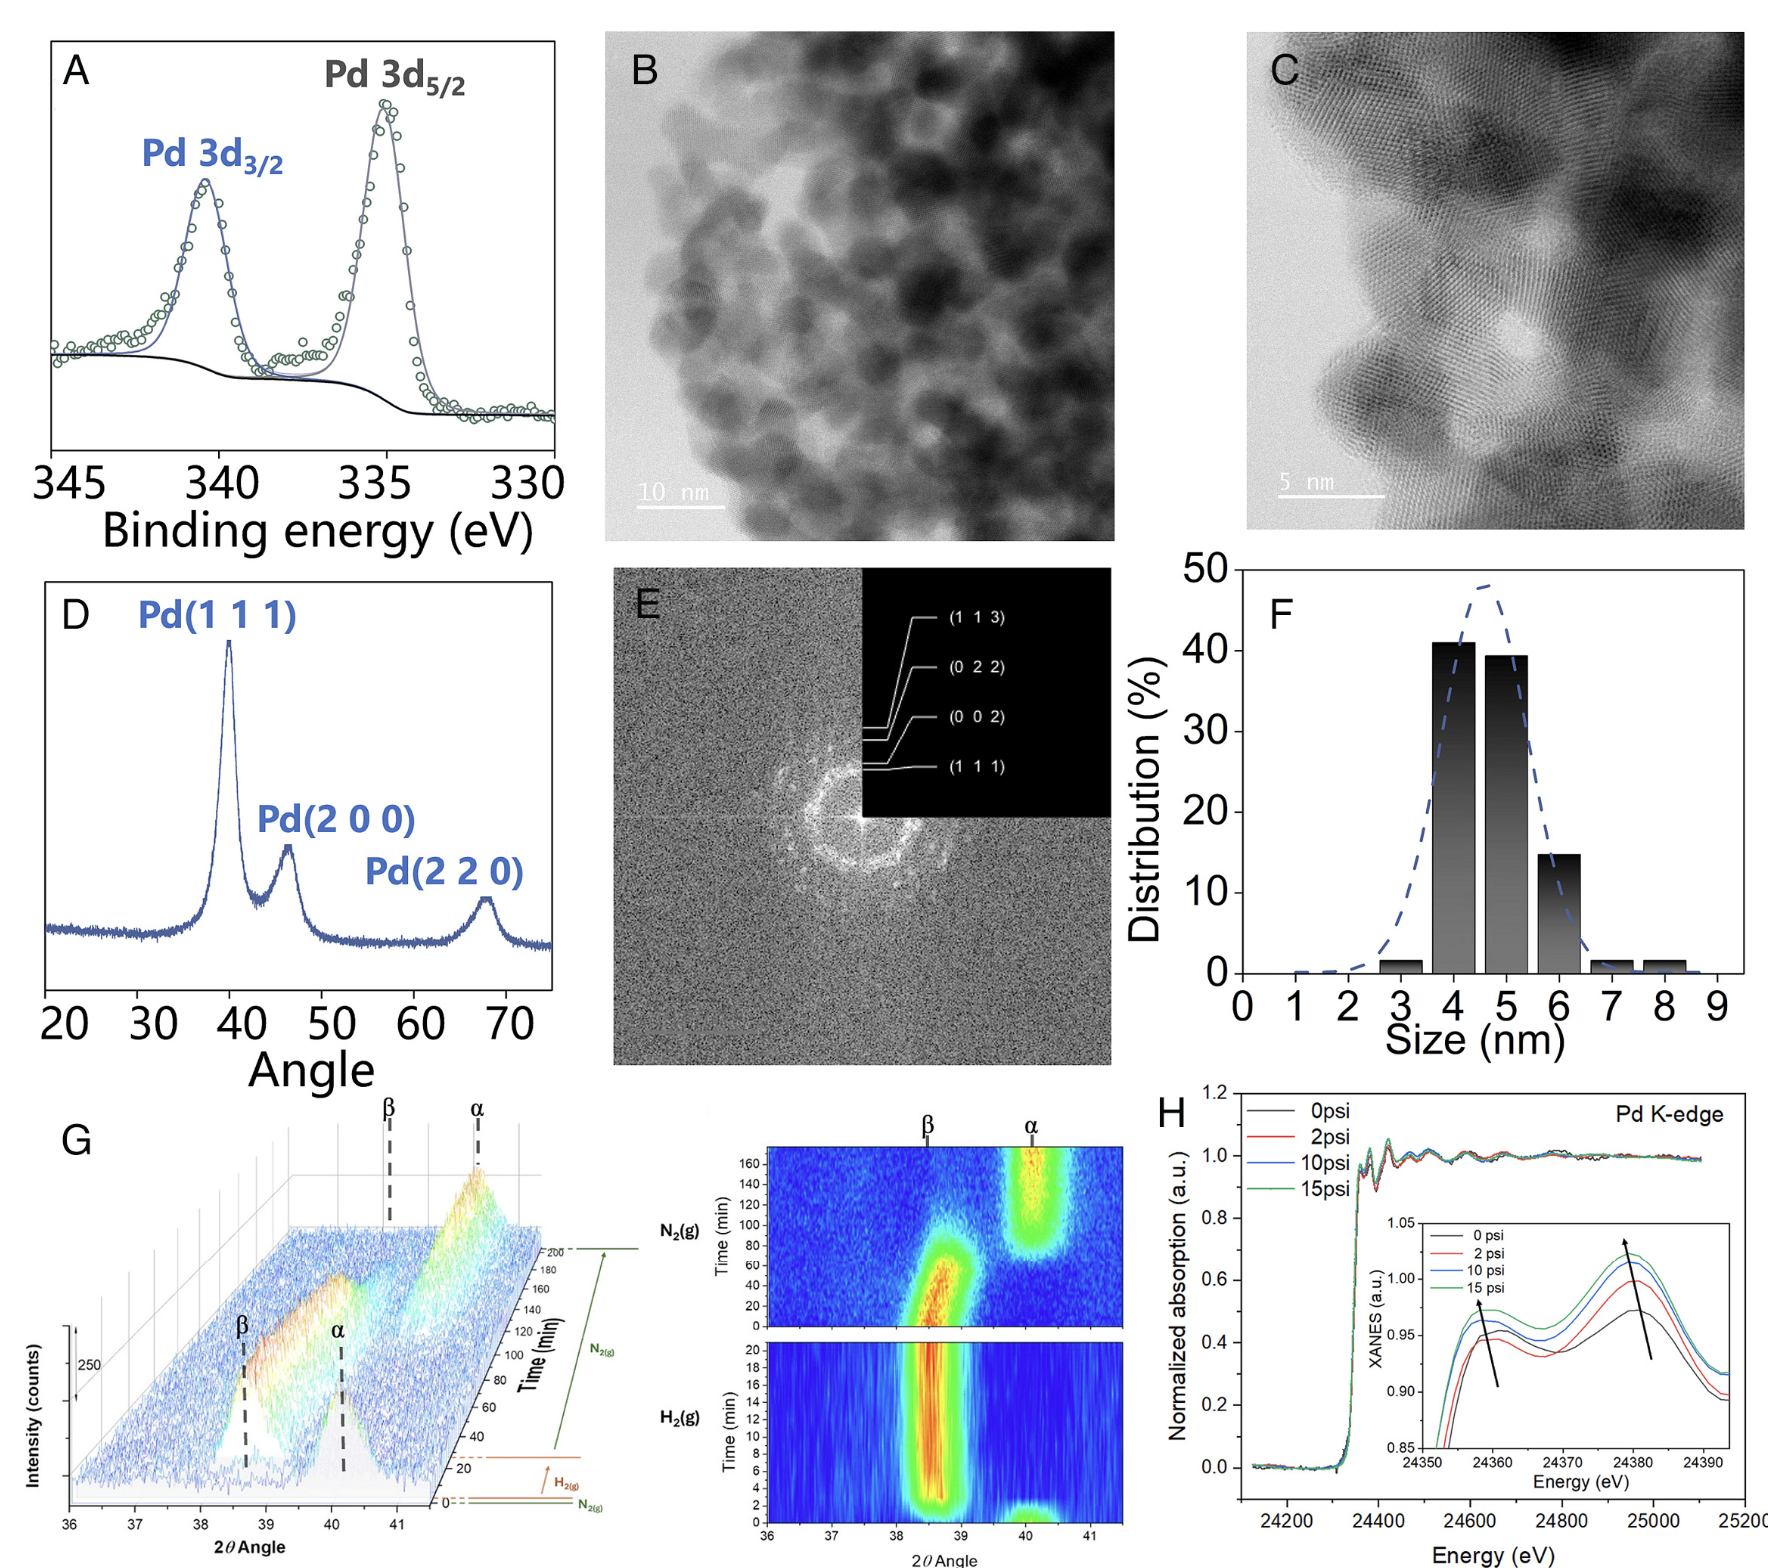
Fig. 1. Solid- state morphology of Pd0 nanoparticles (Pd0NP) on the fiber film. (A) XPS spectra revealing the valence states of Pd (B) STEM imaging showing the boundary of the Pd0NP. (C) Lattice fingers of Pd0NP. (D) XRD spectra of the planes of Pd crystals. (E) Diffraction patterns of Pd0NP. (F) Size distribution of Pd nanoparticles on the fiber film. (G) In situ XRD spectra in 3D plotting and contour map showing the Pd0NP on the fiber film when exposed to N2 and H2. (H) XANES spectra collected in situ under hydrogen, with different H2 delivery rates through the lumen.

One of the most extreme rainstorms in state records — Russ Schumacher (#Colorado #Climate Center)

Click the link to read the article on the Colorado Climate Center website (Russ Schumacher):

October 30, 2026

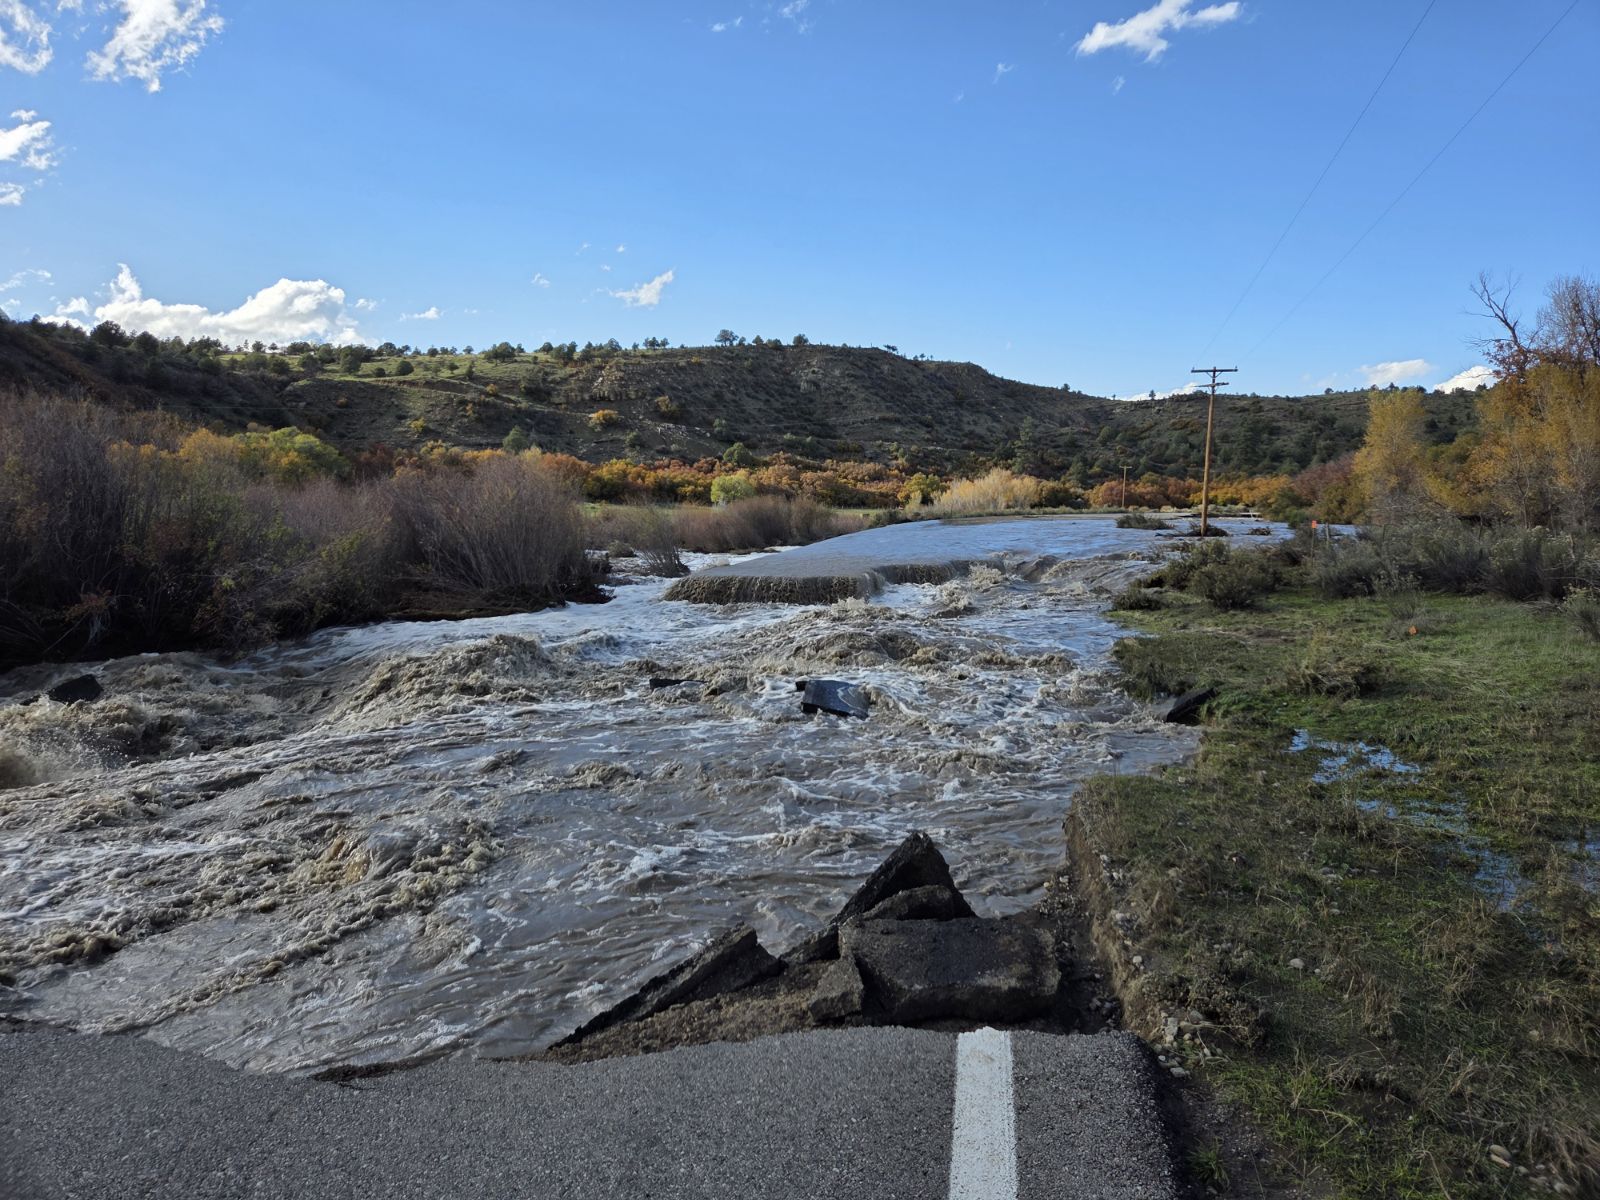
Last week, from Wednesday, October 21 into Sunday, October 25, southern Colorado—along with neighboring areas of New Mexico, Utah, and Arizona—received widespread heavy rainfall. Thankfully, as of this writing no fatalities or significant injuries have been reported from the resulting flooding, but the destruction has been immense. Roads have been washed out throughout the region, homes have been damaged, water rescues were needed, and recreation areas have been affected. [The Colorado Sun has been doing great reporting on the flood impacts, as has the Navajo Times for areas downstream on the San Juan River. Jonathan Thompson at the Land Desk summarized where the streamflow ranked on various rivers.] Here, we’ll look at the rainfall that led to the flooding, and make the case that this rainstorm wasn’t just unusual for this part of Colorado, but should be considered among the most extreme storms in state history.

Colorado Highway 151 washed out, between Pagosa Springs and Ignacio. Photo courtesy of the Colorado Department of Transportation.

Extreme rainfall and floods in southern Colorado

There is a history of heavy rainstorms in the fall in southern Colorado, typically with a connection to the remnants of tropical systems in the eastern Pacific Ocean. The “Sonora hurricane” of October 1911 was one such storm, which led to the flood of record on the San Juan River and other rivers in the region. Just last year (2025), a similar weather system produced major flooding in southwestern Colorado. That event, which we covered in a couple of blogposts last October, was a one-two punch of moisture from a pair tropical cyclones. Even earlier this fall, the remnants of Tropical Storm Polo moved through the southwestern US and brought heavy rainfall and flooding. But by at least some metrics, the recent late-October storm appears to have topped all of these, especially in the lower-and middle elevation areas of southern Colorado.

The meteorological setup for this event was slightly different from those past cases, which had a more direct influence from the remnant tropical cyclones. The late-October event did have some influence from Tropical Storm Trudy, which formed and moved northward toward the west coast of Mexico in mid-October. Trudy then dissipated and never continued on into the US. However, some of the moisture associated with Trudy, along with generally increased atmospheric moisture in the Pacific related to El Niño (more on that later), was transported northward by a very strong trough of low pressure that approached the US West Coast. So even without a direct influence from a tropical cyclone, a sustained “firehose” of water vapor was aimed at southern Colorado.

How much rain fell, and where?

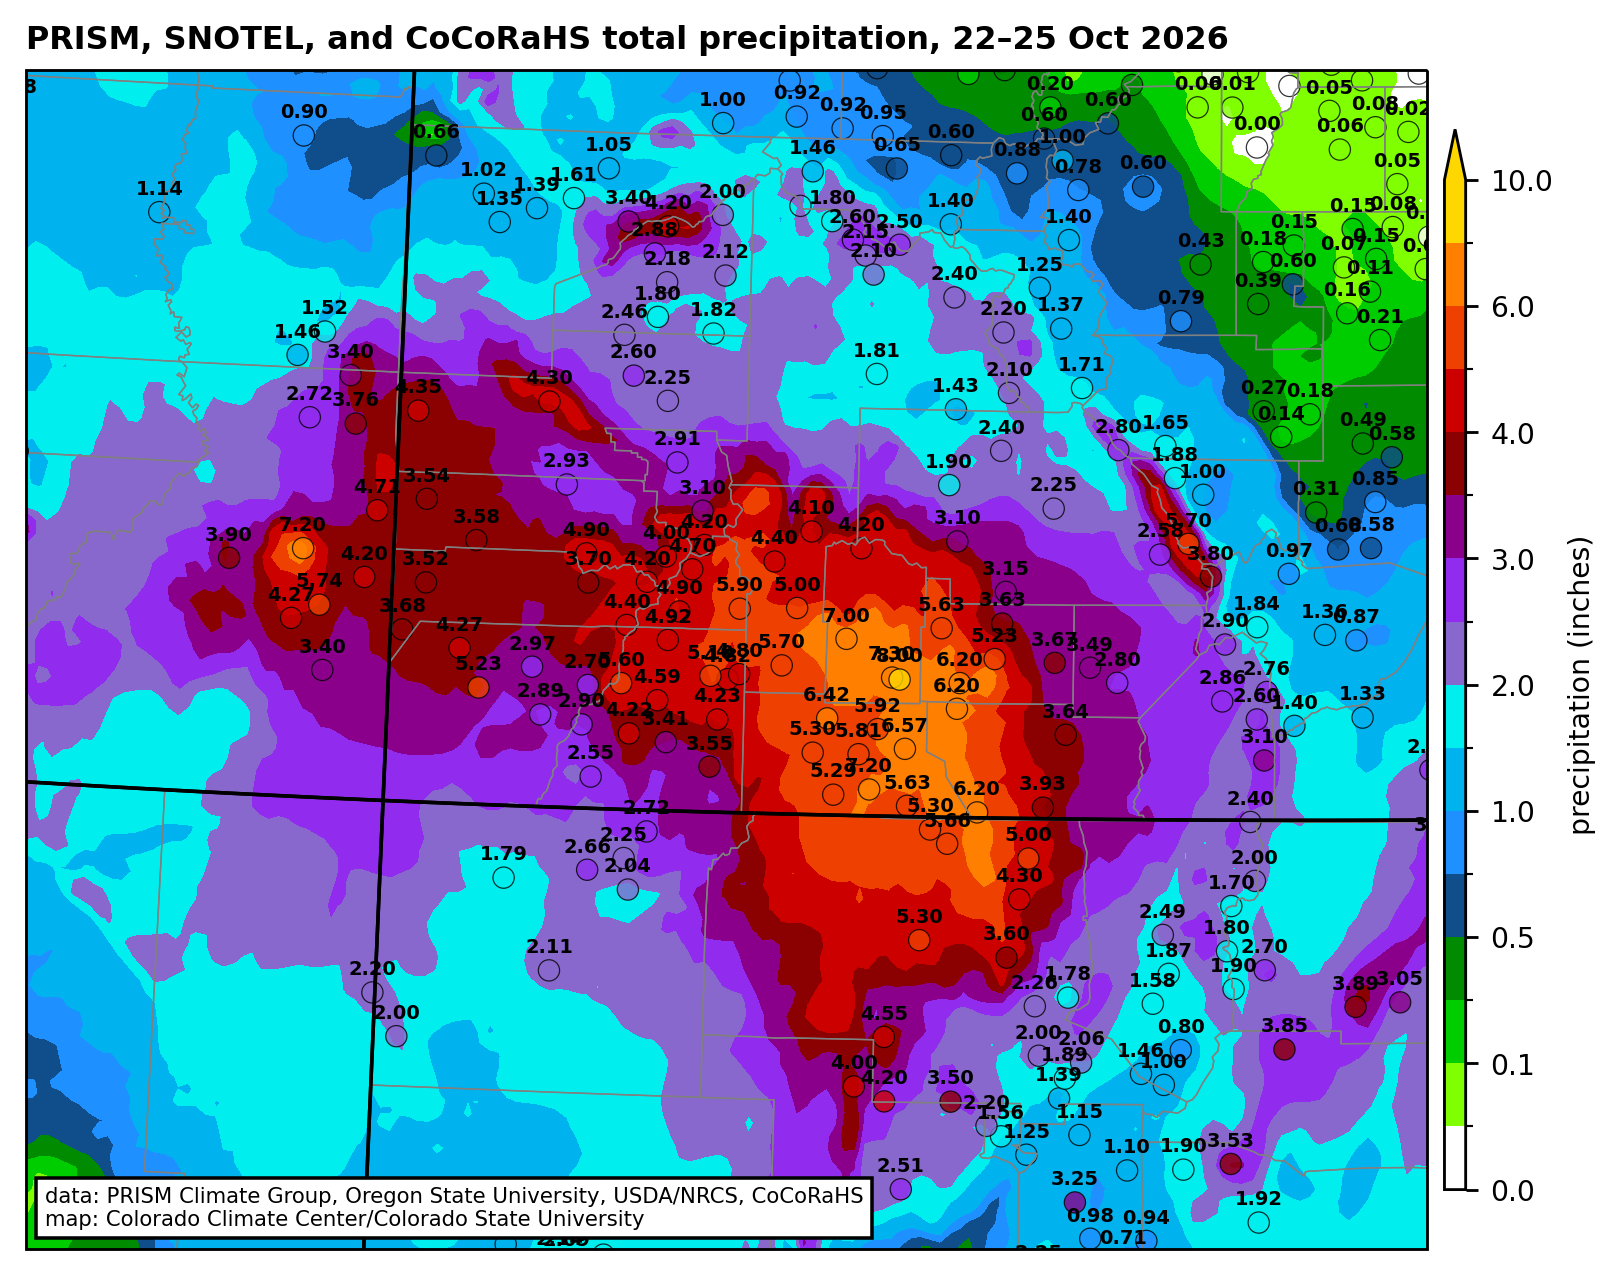
In terms of the total rainfall accumulation, the highest amounts were observed around the San Juan Mountains in Colorado and New Mexico, and the Abajo Mountains in southeastern Utah. Up to 8 inches of rain fell in four days at high elevations, with widespread observations of 4-6″ at lower elevations (first map below). Where the rain amounts were most unusual, however, was in the San Luis Valley. Remember that the San Luis Valley is a very dry place: the average annualprecipitation is only 7-9″, and getting more than an inch of rain in a single storm is extremely rare. The San Juan Mountains to the west intercept any moisture that heads toward the valley, making a very effective rain shadow. The second map below shows that the entire San Luis Valley received more than 4 times their usual October precipitation in four days. The amounts may not look big (2-4 inches), but this type of rainstorm just doesn’t tend to happen!

Total precipitation (inches) from 22-25 October 2026 with gridded data from the PRISM Climate Group and observations from SNOTEL stations and the Community Collaborative Rain, Hail, and Snow (CoCoRaHS) network.

Percent of the average October precipitation that fell in this four-day period. The San Juan River and Rio Grande are also shown in blue.

Several stations in the San Luis Valley with climate records extending back 100 years or more had their wettest two-day period on record, including Alamosa, Monte Vista, and Del Norte. (Alamosa and Monte Vista also had their wettest 3-day period.) One way to illustrate how rare a rain event is for a given area is through precipitation frequency analysis, which estimates the probability of a given amount of rain falling in any year. These are often converted to average recurrence intervals (ARIs), so that a storm with a 1% chance of happening in any year is referred to as a “100-year” storm. That terminology can be misleading, because it doesn’t mean that such a storm can’t happen again for another 100 years: it’s just an average. We’ll use that terminology here because it’s simpler, but keep this caveat in mind1.

We see below that for the two-day period from Wednesday morning (21st) to Friday morning (23rd), 2-6 inches of rain fell across southern Colorado. For much of the region (light red shading on the right map below), these two-day totals represented at least a 10-year rainstorm; in parts of Archuleta County and much of the San Luis Valley it was a 100-year rainstorm, and in several parts of the SLV it was more than a 1000-year storm.

Left) Precipitation estimate from NOAA’s Stage IV analysis for the 48-hour period ending the morning of October 23, 2026. (Right) Locations with 48-hour precipitation with less than a 1 in 10 chance (light red shading), less than a 1 in 100 chance (red shading), and less than a 1 in 1000 year (brown shading) of being exceeded in any given year. (Or in other terms, rainfall exceeding a 1 in 10 year average return period in light red, 1 in 100 year in red, and 1 in 1000 year in brown. Average recurrence interval estimates from NOAA Atlas 14.

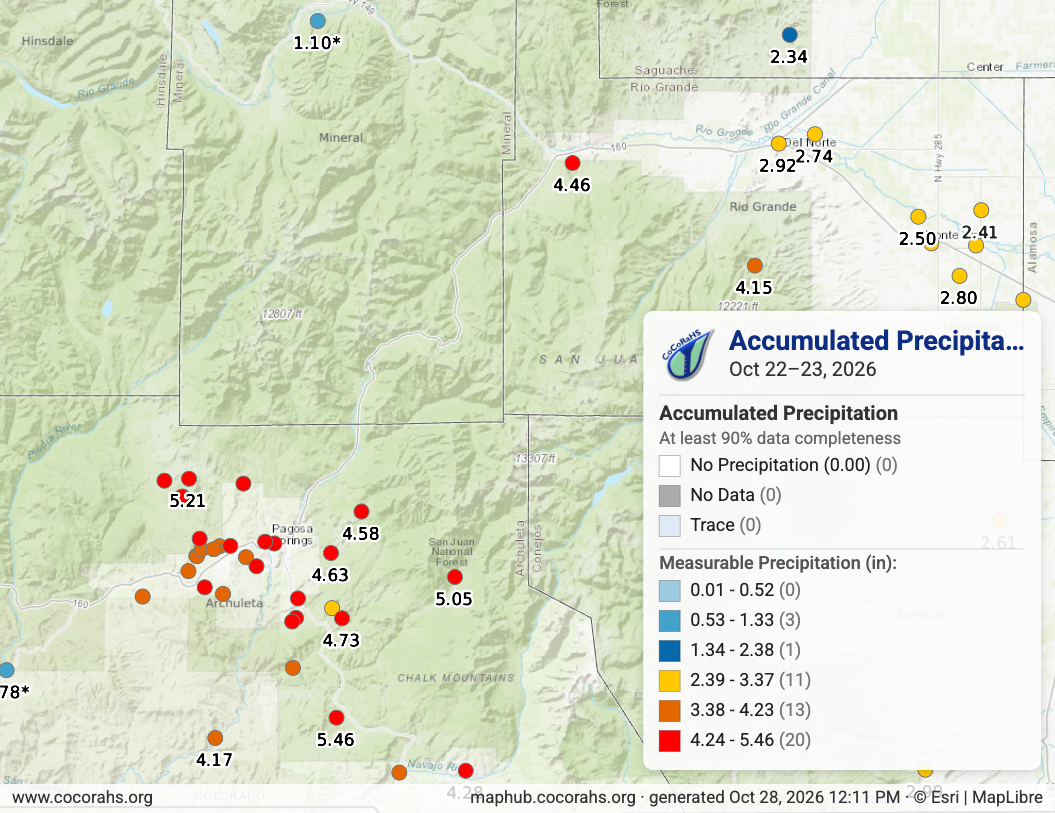
I want to highlight one observation in particular, from South Fork, Colorado, where the South Fork of the Rio Grande merges with the main stem of that river. A CoCoRaHS volunteer observer reported 4.46″ of rain in two days, which is an astonishing amount of rain for that location, with less than a 1 in 1000 chance of happening in any given year, based on available statistics. Unfortunately, the flood damage in South Fork was significant, including at the Fun Valley Family Resort. That observer recorded another 1.15″ of rain on the 25th, for a 4-day rainfall total of 5.64″

CoCoRaHS rainfall observations for October 22-23, 2026, in southwestern Colorado.

[I want to take a moment to give a word of huge appreciation to the CoCoRaHS volunteer observers throughout the region, and to particularly point out the observers around Pagosa Springs. That community has now seen two major floods in two years, and the incredible volunteer network, many of them recruited by the Pagosa Weather team, has collected a remarkable dataset documenting the details of both of those storms.]

How did the rainfall compare to last October’s storms?

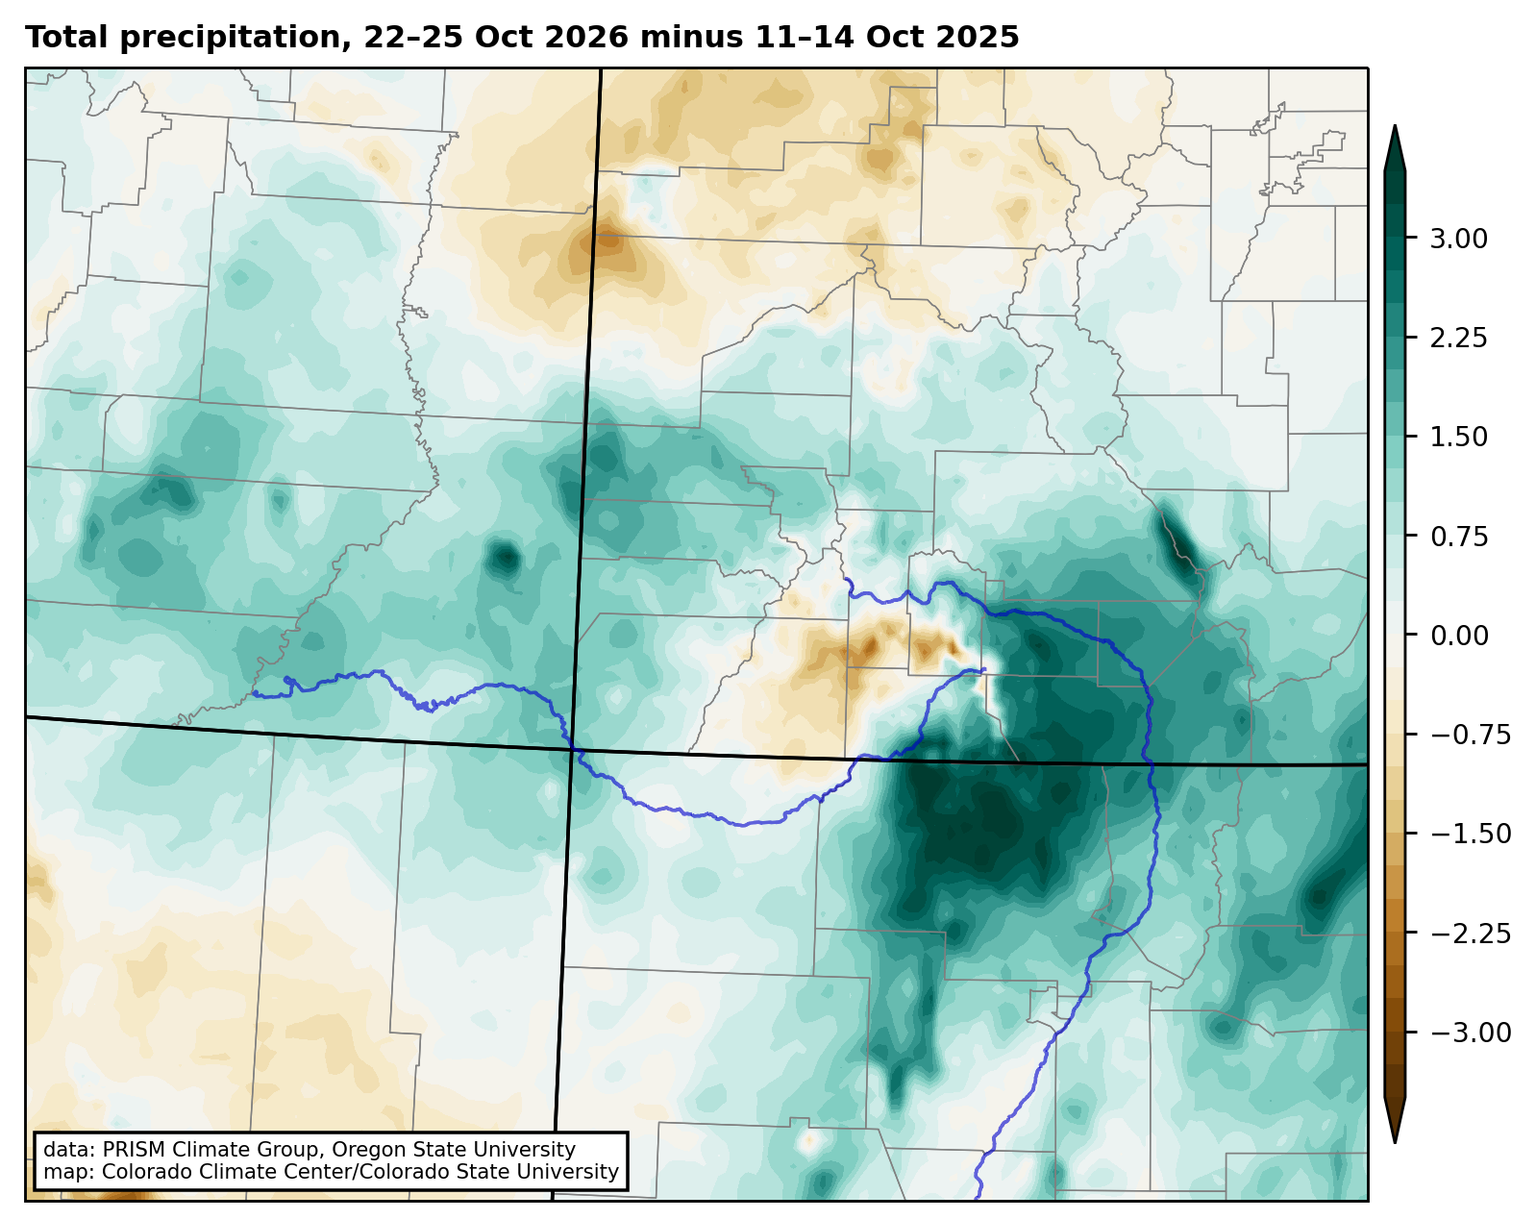
The map below compares the 4-day total rainfall from the recent event to the totals from the wettest 4-day period in the storms last October. In the San Juan and Rio Grande watersheds, this year’s event had considerably more precipitation. In the San Luis Valley and extending into Archuleta County and northern New Mexico, 2-4″ more rain fell in this year’s storm. The exception was at the highest elevations of the San Juans and in La Plata County, where the October 2025 storm had more precipitation. At least part of this was because last year’s event was effectively all rain, whereas the high peaks were getting snow in this year’s storm. The flood peak on the San Juan River at Pagosa Springs was more than 2 feet higher in October 2026 than in the 2025 flood.

Total precipitation from 22-25 October 2026 minus 11-14 October 2025. With the exception of the high elevations of the San Juan Mountains, the October 2026 storm brought more precipitation across southern Colorado.

If we compare the “1000-year rainfall” in the October 2026 storm to past events like the September 2013 Front Range floods, this year’s storm remarkably had even greater coverage of very rare rainfall amounts. Although the total amount of rainfall may not have been as great, considering the records broken and the spatial coverage of rainfall that was extremely rare for the locations where it fell, the October 2026 storm in southern Colorado should clearly be added to the list of the most extreme rainstorms in Colorado history. Trying to rank those storms would be very difficult, but such a list would surely include the October 1911 “Sonora hurricane” rainfall, the June 1921 storm that flooded Penrose and Pueblo, the June 1965 storms in both northern and southeastern Colorado, the 1976 Big Thompson storm, the September 2013 “Great Colorado flood“, and now the October 2026 event in southern Colorado and neighboring states.

What did the storm mean for the drought?

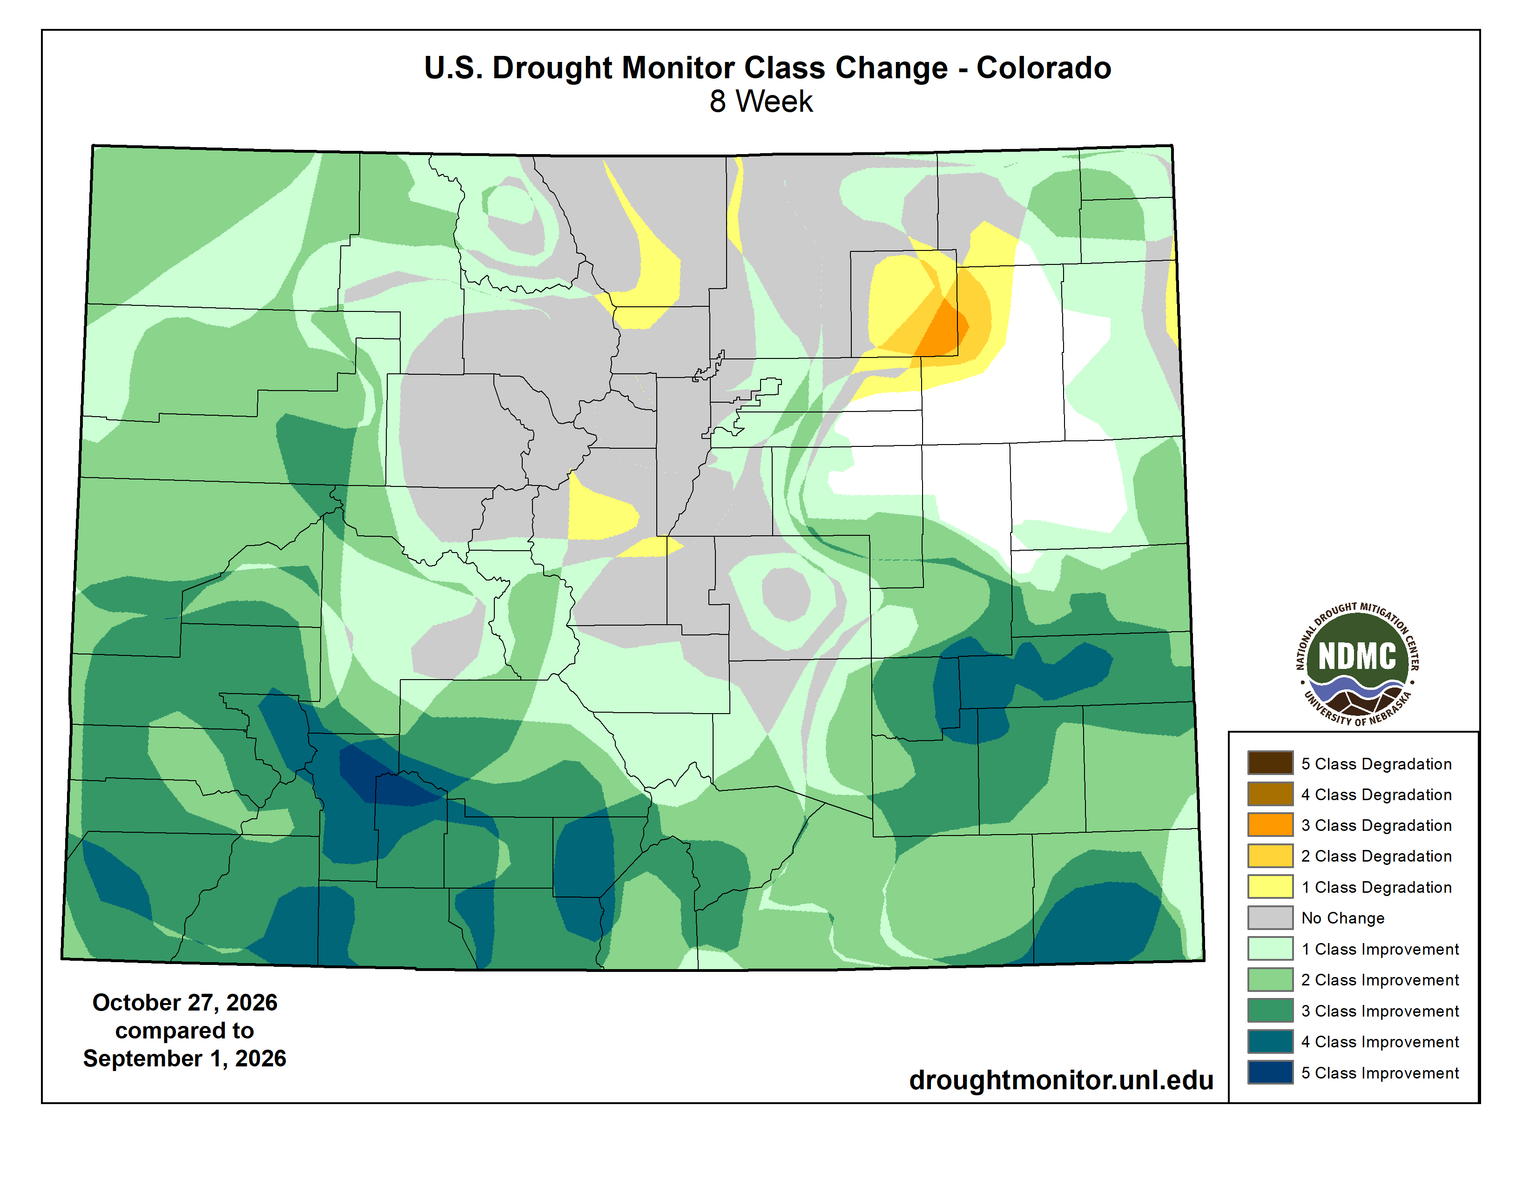
The flip side to all of the flood damage is the benefit to the drought and water supply situation. Going back to the beginning of September, much of southern Colorado has had record-high precipitation, after a brutal snow season and a hot, dry summer. The persistent heavy rain has led to major improvements in drought. Much of southwestern Colorado is now drought-free on the US Drought Monitor, with 3 to 5 category improvements over the last two months.

Eight-week change in the US Drought Monitor, showing 2-5 class improvements across southern Colorado. From https://droughtmonitor.unl.edu/Maps/ChangeMaps.aspx

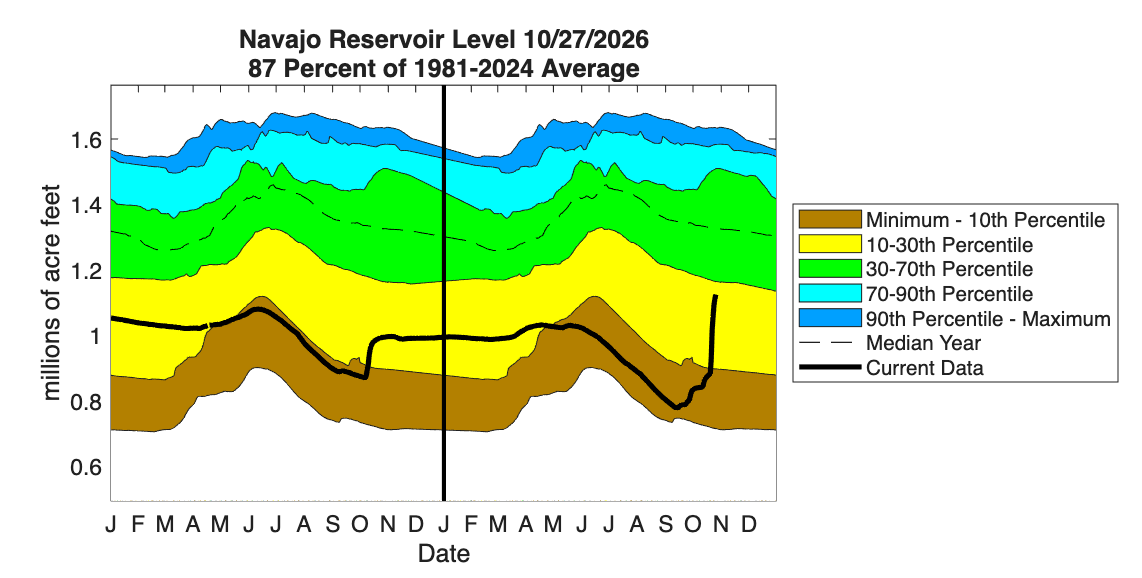
Rivers in southern Colorado that were near record-low flows in the summer are now near record high flows for the fall. Some reservoirs have seen significant increases in storage as well, particularly Navajo Reservoir on the San Juan River, just across the border in New Mexico. That reservoir saw essentially no increase from snowmelt in the spring and summer, and was nearing record low levels as of early September; the recent storms gave it a huge and much-needed boost. My colleague here at the CCC Peter Goble calculated that from October 22 to 25, approximately 884,000 acre-feet of water fell just in Mineral, Hinsdale, and Archuleta Counties. And going back to the start of the rains in early September, that number would be even bigger.

Time series of storage in Navajo Reservoir, as of October 27, 2026. From https://climate.colostate.edu/drought/#reservoirs

Farther downstream on the Colorado River, Lake Powell has also seen a noticeable boost in storage, such that it is no longer at a record low. But this is important perspective to keep in mind: even with all the rain, it just gets Powell storage to “not quite record low”. Other important Colorado reservoirs farther north, like Granby and Blue Mesa saw much less precipitation and very little increase in storage from recent storms. Going straight from flood to drought to flood might look something like “average” precipitation, but it isn’t the preferred pathway to get that water. And having a lot of rain in the fall doesn’t undo the damage that was done from the drought earlier in the year (impacts to recreation, agriculture, wildfires, and on and on). So, the drought relief is substantial and welcome now, but we still need a good mountain snow season to improve the situation across Colorado and the southwestern US as a whole.

Where does El Niño fit in to this story, and what’s coming next?

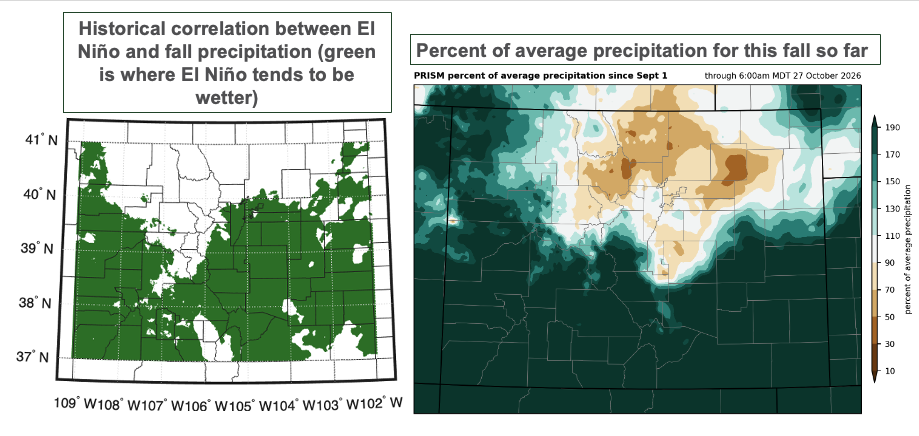
As Peter outlined in this post, the fall season is when we see some of the most robust connections between El Niño and precipitation in Colorado, with falls tending to be wetter than average in southern Colorado during El Niño. It is quite remarkable how closely this fall’s precipitation patterns thus far match the historical correlations: on the figure below, look at how similar the green shading in the map on the left is to the areas that have seen above-average precipitation this fall!

(left) Map showing the historical correlation between El Niño-Southern Oscillation (ENSO) and fall precipitation in Colorado, with areas shaded in green showing where fall tends to be wetter during El Niño. (right) Percent of average precipitation from September 1 through October 27.

El Niño years, with warm ocean temperatures in the eastern Pacific, tend to allow for more moisture to be transported into southern Colorado in the fall. El Niño years also tend to have more hurricanes in the eastern Pacific (this has very much been the case this year), which increase the chances for extreme rainstorms like the ones we’ve seen this fall. So there’s a pretty clear fingerprint of El Niño on this fall season. And, for both better and worse, it’s not going to slow down: another storm will affect southern Colorado this weekend, bringing more water for drought relief, but also more flood risk to the areas that have already been hard-hit. (Sunday, November 1 will see the greatest risk of more heavy rain and flooding, as well as snow at the high elevations.)

Unfortunately, the picture gets murkier as we look beyond that into the main mountain snow season. Although the fall (and spring) seasons tend to be wetter during El Niño years, the signal in the core of winter is not as strong. A big snow year is certainly one possible outcome, but is by no means guaranteed.


1 Another caveat is that the rarer the precipitation amount, the less certain the recurrence interval estimates are. NOAA’s Atlas 14 and the Colorado-New Mexico Regional Extreme Precipitation Study provide uncertainty estimates around the calculations. Here we’re using the ‘most likely’ value from those calculations. ↩︎