USGS: Streamflow of 2011—Water Year Summary

wateryear2011streamflowusgs.jpg

Remember all the way back to water year 2011 when Colorado’s reservoirs mostly filled to the brim? Here’s the Streamflow of 2011 — Water Year Summary from the United States Geological Survey (Xiaodong Jian/David M. Wolock/Harry F. Lins/Steve Brady).

For you numbers junkies the document should be a great read to take along next time you’re sitting under the cottonwoods by your favorite stream.

Here’s the introduction:

The maps and graph in this summary describe streamflow conditions for water year 2011 (October 1, 2010, to September 30, 2011) in the context of the 82-year period from 1930 through 2011, unless otherwise noted. The illustrations are based on observed data from the U.S. Geological Survey’s (USGS) National Streamflow Information Program (http://water.usgs.gov/nsip/). The period 1930–2010 was used because, prior to 1930, the number of streamgages was too small to provide representative data for computing statistics for most regions of the country.

In the summary, reference is made to the term “runoff,” which is the depth to which a river basin, State, or other geographic area would be covered with water if all the streamflow within the area during a single year was uniformly distributed upon it. Runoff quantifies the magnitude of water flowing through the Nation’s rivers and streams in measurement units that can be compared from one area to another. Each of the maps and graphs can be expanded to a larger view by clicking on the image. In all of the graphics, a rank of 1 indicates the highest flow of all years analyzed.

More USGS coverage here.

USGS: Nutrients pollution

South Platte River Basin: New stream flow and river call map from United Water and Sanitation

southplatterivercallsunitedwaterandsanitation.jpg

Update: It was early this morning when I first posted this and I neglected to point out that they have mapped selected stream gages as well.

Sometimes it’s nice to look at the calls on the river graphically. Thanks to the United Water and Sanitation District you don’t have to haul out your straight line diagram for the South Platte Basin. They’ve built an online map with current river calls.

Click on the thumbnail graphic for a screen shot of this morning’s map.

Here’s the release from United Water and Sanitation:

United Water and Sanitation District has unveiled a first-of-its-kind South Platte River Basin map that allows water users and providers throughout the Front Range to get real-time, visual information about the status of the South Platte River and its tributaries.

The map (http://map.unitedwaterdistrict.com/”>) aggregates hourly data from a variety of sources, including the United States Geological Survey (USGS) and the Colorado Division of Water Resources, providing comprehensive streamflow information from the South Platte River Basin. Map users can scroll over dozens of river locations to get valuable and timely information, including:

– River height (ft)
– Streamflow rates in cubic feet per second(cfs)
– Active calls on the river
– Apparent dry-up points

“This map allows users to see the supply side along with the demand side of the river basin as conditions change,” said Josh Shipman, asset manager for United Water and Sanitation District. “We have taken a tremendous amount of data and put it in a visual, interactive format, making it easier for water users and providers to quickly and easily get information. It now only takes a few seconds to get information on the river that previously took hours to compile and compare.”

With numerous water rights and supply interests along the South Platte River basin, United Water anticipates a variety of interest in the map – from ditch companies and water districts to farmers and municipalities – particularly in a dry year like one we are currently experiencing.

“Ultimately this map allows any interested party to monitor real time, stream conditions to ensure they are receiving the full allocation of their call on the river,” said Ron von Lembke, chief of staff at United Water and Sanitation District. “But it can also be useful for water recreationalists such as kayakers and fishermen who are interested in water conditions related to their activities.”

The map encompasses all of the South Platte River basin – including each of the 16 Districts included in Water Division 1 of the Colorado Division of Water Resources(http://water.state.co.us/DWRIPub/DWR Maps/ColoradoRiverBasins.pdf) While there is potential to expand the map to other divisions throughout the state, United Water’s immediate focus will be on adding streamflow monitoring stations and select weather stations in these districts to further enhance its current functionality.

More South Platte River Basin coverage here and here.

Drought news: Keep up on the drought in your area using Water Watch from the USGS #CODrought

usgscoloradodroughtwatch07192012.jpg

Here’s the link to the Colorado Map. Click on the thumbnail graphic for today’s map.

More USGS coverage here.

USGS: William Holmes’ 130 year old sketch of the Grand Canyon available online #CORiver

More Colorado River basin coverage here and here.

USGS: Effects of Urban Stormwater-Management Strategies on Stream-Water Quantity and Quality

detentionpond.jpg

Here’s the release from the United States Geological Survey (J.V. Loperfido/D.M. Hogan):

Urbanization results in elevated stormwater runoff, greater and more intense streamflow, and increased delivery of pollutants to local streams and downstream aquatic systems such as the Chesapeake Bay. Stormwater Best Management Practices (BMPs) are used to mitigate these effects of urban land use by retaining large volumes of stormwater runoff (water quantity) and removing pollutants in the runoff (water quality). Current USGS research aims to understand how the spatial pattern and connectivity of stormwater BMPs affect water quantity and water quality in urban areas.

More stormwater coverage here.

USGS: What Water Worries Will Climate Change Bring?

yampariverbasin.jpg

The United States Geological Service is modeling the effects of climate change on various basins around the U.S. Here’s a release from the agency (Kara Capelli):

“We are unlikely to see a ‘water-as-usual’ future.” – Marcia McNutt, USGS Director

Arguably, the most important impacts of climate change – including those to ecosystems, agriculture, energy, and industry – will be tied to changes in water availability, especially as the world becomes increasingly water-stressed. It’s crucial that water managers understand the likely impacts of climate change, so that they can plan for new conditions and challenges.

How will your water be affected?

Understanding the impacts that climate change will have on water availability in specific regions and communities is a mammoth task. Water availability in every region, basin, and watershed will be affected differently, depending on the specific precipitation and hydrologic conditions in that area.

Also, for all of the models and technology we have available at our 21st century finger tips, weather patterns are still notoriously unpredictable. Forecasting future precipitation conditions is even more difficult, especially under new climate scenarios, and changes to weather patterns will vary across the country.

Complicating water availability predictions further, each basin has its own unique set of hydrologic and geologic features that affect how much water is available, where that water comes from, and how it flows through a system.

Little by little, though, scientists are beginning to build the information and tools to understand the nuanced effects of climate change to the Nation’s water resources.

USGS predicting changes to water availability in 14 basins across the Nation

In a first-of-its-kind study, scientists from the USGS have predicted changes to water resources for 14 different basins across the country.

First, the scientists downscaled vast climate models, in order to understand changes in temperature and precipitation specific to the 14 study basins. They then used USGS hydrologic models and streamgage information to project how water resources will be impacted by the changing weather patterns, taking into account specific hydrologic and geologic features in each basin, such as snowpack, drought, and groundwater conditions.

For example, the USGS models project that changes to snowpack in the Sprague River Basin in Oregon could cause annual peak streamflows to occur earlier in the spring as overall basin storage decreases. This means that managers may be forced to modify storage operation and reprioritize water delivery for environmental and human needs.

In many areas the biggest impacts to water resources will be a factor of reduced snowpack. For example snowpack in the headwaters of the Colorado River could affect the amount and timing of streamflow to the Colorado River and also impact important recreation areas.

Portions of Maine may see higher streamflows, which could affect populations of endangered Atlantic salmon. On the other hand, areas of the already drought-stressed Flint River Basin, one of Atlanta’s primary drinking water supplies, are projected to become even drier.

More USGS coverage here.

Routt County, et al., are teaming with the USGS to monitor water quality in the upper Yampa River basin

yampariverbasin.jpg

From Steamboat Today (Tom Ross):

Joining the county and Steamboat Springs in the local funding are the Upper Yampa Water Conservancy District, Mount Werner Water District and Morrison Creek Water and Sanitation District. Like the county, the city and the Conservancy District will contribute $9,071. Mount Werner Water and Morrison Creek Water each will contribute $2,268.

The new water-quality monitoring sites are in addition to the water-quality measuring site maintained by the Colorado Department of Health and Environment at the Fifth Street Bridge in downtown Steamboat since 2007. Now, samples at five sites will be tested for chemical content, nutrients, E. coli and alkalinity, among other properties…

[Routt County Environmental Health Director Mike Zopf] added that he expects to receive recommendations in the near future from the U.S. Geological Survey about a program to monitor water quality in aquifers in the valley, which could lead to monitoring groundwater quality, as well as surface-water quality.

More Yampa River basin coverage here and here.

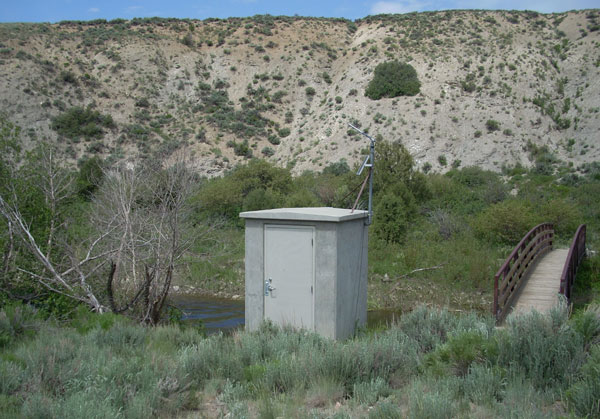
USGS: How Does a U.S. Geological Survey Streamgage Work?

typicalstreamgageinstallationusgs.jpg

Click here for the publication from the United States Geological Survey. Here’s an excerpt:

The most common method used by the USGS for mea- suring velocity is with a current meter. However, a variety of advanced equipment can also be used to sense stage and measure streamflow. In the simplest method, a current meter turns with the flow of the river or stream. The current meter is used to measure water velocity at predetermined points (sub- sections) along a marked line, suspended cableway, or bridge across a river or stream. The depth of the water is also measured at each point. These velocity and depth measurements are used to compute the total volume of water flowing past the line dur- ing a specific interval of time. Usually a river or stream will be measured at 25 to 30 regularly spaced locations across the river or stream.

Here’s the link to the USGS Water Watch website.

More USGS coverage here.

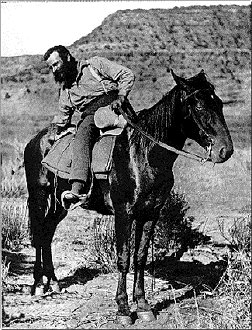
The United States Geological Survey: 1879-1989

johnwesleypowell.jpg

Here’s a nice concise history of the USGS (Mary C. Rabbitt). Click through for the whole series of articles, cool drawings and photographs. Here’s the announcement:

The United States Geological Survey was established on March 3, 1879, just a few hours before the mandatory close of the final session of the 45th Congress, when President Rutherford B. Hayes signed the bill appropriating money for sundry civil expenses of the Federal Government for the fiscal year beginning July 1, 1879. The sundry civil expenses bill included a brief section establishing a new agency, the United States Geological Survey, placing it in the Department of the Interior, and charging it with a unique combination of responsibilities: “classification of the public lands, and examination of the geological structure, mineral resources, and products of the national domain.” The legislation stemmed from a report of the National Academy of Sciences, which in June 1878 had been asked by Congress to provide a plan for surveying the Territories of the United States that would secure the best possible results at the least possible cost. Its roots, however, went far back into the Nation’s history.

The first duty enjoined upon the Geological Survey by the Congress, the classification of the public lands, originated in the Land Ordinance of 1785. The original public lands were the lands west of the Allegheny Mountains claimed by some of the colonies, which became a source of contention in writing the Articles of Confederation until 1781 when the States agreed to cede their western lands to Congress. The extent of the public lands was enormously increased by the Louisiana Purchase in 1803 and later territorial acquisitions.

At the beginning of Confederation, the decision was made not to hold the public lands as a capital asset, but to dispose of them for revenue and to encourage settlement. The Land Ordinance of 1785 provided the method of surveying and a plan for disposal of the lands, but also reserved “one-third part of all gold, silver, lead, and copper mines to be sold or otherwise disposed of, as Congress shall thereafter direct,” thus implicitly requiring classification of the lands into mineral and nonmineral. Mapping of the public lands was begun under the direction of the Surveyor-General, but no special provision was made for classification of the public lands, and it thus became the responsibility of the surveyor. There was,of course, no thought in 1785 or for many years thereafter of employing geologists to make the classification of the mineral lands, for geology was then only in its infancy.

More USGS coverage here.

Colorado Water 2012: Hydrography — The science of measuring streamflow

riograndeatembudonewmexicohydrograph.jpg

Here’s the latest installment in their Water 2012 series from the Valley Courier. Click through and read the whole thing. Here’s an excerpt:

For the Rio Grande Compact, seven streamflow gaging stations are operated in the San Luis Valley to account for the water originating in the Conejos and Rio Grande systems and the water delivered from these systems to New Mexico. The Hydrographic Branch of the Colorado Division of Water Resources operates these seven gaging stations along with 73 other gaging stations across the San Luis Valley.

In addition to the Compact gages, stations are operated on natural streams and creeks to help water commissioners allocate the available water to water users, maintain a historic record of water in the stream, account for trans-mountain water brought into the basin, record water diverted at critical diversion structures, and provide valuable information to recreational enthusiasts such as kayakers and fishermen.

The data from these sites may be later used for water supply planning, flood warning, environmental studies, and basin modeling, such as the Rio Grande Decision Support System (RGDSS).

Meanwhile, USGS streamflow gages are facing funding cuts. Here’s a report from Bob Berwyn writing for the Summit County Citizens Voice. From the article:

…for years, ranchers, town planners and even angler and kayakers have relied on a huge network of streamflow gages maintained by the U.S. Geological Survey to help monitor water quality, measure and predict peak spring runoff and flooding potential, or even just the best time run some whitewater or to go fishing. In some places, the streamflow information is critical to helping protect endangered species.

But that network is shrinking, due mainly to budget constraints that already forced the USGS to shut down stations around the country. Just in the past few years, the agency stopped operating 133 water quality stations, many in New Mexico and Florida.

More Colorado Water 2012 coverage here.

USGS: New Study Lends Insight to Decreasing Denver Basin Groundwater Availability

denverbasinaquifersandconfiningunitsandsprings.jpg

Here’s the release from the United States Geological Service (Heidi Koontz):

A newly released U.S. Geological Survey study of decreasing groundwater resources in the Denver Basin aquifer provides information on water movement within the system and how it responds to changes in climatic and human activities.

The 3-D computer model of groundwater flow in the Denver Basin aquifer system was constructed to quantify and offer a “big picture” view of the hydrologic system. It will serve as a useful tool for analyzing past and present groundwater conditions, predicting future aquifer response to continued development, and guiding hydrologic monitoring and assessment in the Front Range urban corridor of Colorado.

The Denver Basin aquifer system is an essential water resource for growing municipal, industrial, and domestic uses. Continued population growth along the Front Range and the resulting increase in pumping for additional water supplies has resulted in water-level declines and storage depletion in the aquifer system.

“The Denver Basin aquifers are a critical, but declining, drinking water resource for tens of thousands of residents along the Front Range in Colorado,” said Anne Castle, Assistant Secretary for Water and Science at the U.S. Department of the Interior. “This model and the associated data sets are essential tools for local governments and water suppliers to achieve sustainable water supplies in the future.”

Developed by scientists at the USGS, the groundwater flow model will provide a better understanding about the effects of continued pumping and climate variability on groundwater availability and storage depletion in the Denver Basin. A professional paper detailing the Denver Basin groundwater flow model and study results, “Groundwater Availability of the Denver basin aquifer system, Colorado,” is available online.

“Many communities rely on groundwater resources for municipal, industrial, and agricultural water supplies, and yet unlike the situation with streams and reservoirs, citizens cannot readily assess for themselves whether they are unsustainably depleting this valuable resource,” said USGS Director Marcia McNutt. “Studies such as this by the USGS provide important information on the current status of the groundwater aquifer and its future potential so that communities can plan for their long-term water needs.”

To develop the model, scientists compiled information on aquifer geometry, aquifer properties, land use, pumping history, and climate from 1880 through 2003. Among their findings:

For predevelopment (pre-1880) conditions, recharge, or water entering the aquifer, from precipitation and agricultural irrigation return flows was the primary source of water (94 percent of inflow) to the Denver Basin bedrock aquifers, and evapotranspiration was the primary component of groundwater discharge from the bedrock aquifers (72 percent of outflow). Flow between the bedrock aquifers, the alluvial aquifer, and streams accounted for the remaining components of the predevelopment water budget.

Changes in land and water use have altered the groundwater flow system compared to predevelopment conditions. The expansion of urban/suburban land use and/or irrigated agriculture since the 1950s has increased water use on the landscape, which has increased recharge, evapotranspiration, and streamflow in connection with shallow parts of the aquifer system.

Groundwater pumping was estimated for the period 1880-2003 on the basis of permitted wells using previously published methods. About 55,000 permitted pumping wells were included in the analysis, of which about 44,000 wells were completed in the bedrock aquifers and about 8,000 wells were completed in the alluvial aquifer.

Groundwater pumping from the bedrock aquifers has increased steadily since the 1950’s, primarily in response to increased municipal water-supply needs, which has reduced natural discharge from the aquifer, lowered water levels in the bedrock aquifers, and removed water from aquifer storage.

The model developed by this study is a necessary tool for evaluation of groundwater resources in the Denver Basin. The results provide quantitative estimates of system changes through time consistent with a conceptual model of limited groundwater resources. However, ongoing monitoring and updates to the model are considered necessary for continued assessment of groundwater availability

The report was funded by the USGS Groundwater Resources Program, and information derived from this and future studies of more than 30 regional aquifers will provide a collective assessment of U.S. groundwater availability.

Here’s the abstract from the report:

The Denver Basin aquifer system is a critical water resource for growing municipal, industrial, and domestic uses along the semiarid Front Range urban corridor of Colorado. The confined bedrock aquifer system is located along the eastern edge of the Rocky Mountain Front Range where the mountains meet the Great Plains physiographic province. Continued population growth and the resulting need for additional water supplies in the Denver Basin and throughout the western United States emphasize the need to continually monitor and reassess the availability of groundwater resources.

In 2004, the U.S. Geological Survey initiated large-scale regional studies to provide updated groundwater-availability assessments of important principal aquifers across the United States, including the Denver Basin. This study of the Denver Basin aquifer system evaluates the hydrologic effects of continued pumping and documents an updated groundwater flow model useful for appraisal of hydrologic conditions.

More Denver Basin Aquifer System coverage here and here.

The Fountain Creek Master Plan was the topic of discussion at Friday’s meeting of the Fountain Creek Watershed Flood Control and Greenway District

fountaincreek.jpg

Here’s a in-depth report from Chris Woodka writing for The Pueblo Chieftain. Click through and read the whole article. Here’s an excerpt:

A corridor master plan Friday was combed over by the citizens advisory group to the Fountain Creek Watershed Flood Control and Greenway District board. The panel could not agree on whether a dam or series of dams is needed to protect projects that beautify the creek with trails and parks on Fountain Creek, a normally gentle stream prone to occasional violent floods. There also was no consensus on whether water quality should be improved before or after people are encouraged to enjoy the water…

The corridor plan addresses just the area in the flood plain between Pueblo and Colorado Springs, and is aimed at projects that will fit within the $50 million the district expects to receive five years from now. The district also needs to have projects that could convince voters to approve a mill levy when the time comes, said Larry Small, general manager of the district…

A dam on Fountain Creek could require moving railroad tracks and Interstate 25 or acquiring private land. A series of dams could be built on any of 21 tributaries along Fountain Creek and would be easier to clear as they periodically filled with sediment, Ready said. “You need a greenway so the creek can meander to slow down the water,” [Tom Ready, a Pueblo member of the committee] said. “You need to keep construction away from the creek. But no big dam will ever work.”[…]

[Larry Howe-Kerr of Better Pueblo] questioned the wisdom of drawing people to the creek if the water quality remains impaired. Small, Ready and others on the committee said the corridor plan does recommend actions that would improve water quality. They said recreation on the creek would get people to care about it, and does not necessarily mean coming in contact with the water…

The district is awaiting information from a U.S. Geological Survey study of the impact dams would have on Fountain Creek. In addition, Colorado Springs is developing a stormwater criteria manual which the district wants other communities to consider as well. It won’t be finalized until 2013. A white paper that looks at a comprehensive stormwater plan for El Paso County communities also is being drafted and should be presented to the district in the near future.

Meanwhile, two technical advisory committee meetings are on the horizon to discuss dam proposals and water rights issues on the creek, according to Chris Woodka writing for The Pueblo Chieftain. From the article:

The technical advisory committee of the Fountain Creek Watershed Flood Control and Greenway District will discuss the U.S. Geological Survey study of Fountain Creek dams at 10 a.m. Nov. 30 at the Pikes Peak Area Council of Governments office, 15 S. Seventh St., Colorado Springs.

The committee will have a panel discussion of water rights by experts from various organizations at 1 p.m. Dec. 7 at Fountain City Hall.

The USGS study is looking at the impacts of putting dams at various points along Fountain Creek to control floods. The study would not design or recommend dams, but is designed to measure the effectiveness of single projects or combinations of projects. The study is expected to be ready for review late next year and completed in 2013. The study is funded, in part, by $300,000 from Colorado Springs Utilities as a condition of the Pueblo County 1041 permit for the Southern Delivery System.

The water rights discussion is needed as the district and its partners develop demonstration projects for Fountain Creek, said Dennis Maroney, chairman of the technical committee.

More Fountain Creek coverage here and here.

USGS: Hydrogeologic Setting and Simulation of Groundwater Flow near the Canterbury and Leadville Mine Drainage Tunnels, Leadville, Colorado

leadvilleminedrainagetunnel.jpg

Here’s the release from the U.S. Geological Survey (Wellman, T.P./Paschke, S.S./Minsley, Burke/Dupree, J.A.):

The Leadville mining district is historically one of the most heavily mined regions in the world producing large quantities of gold, silver, lead, zinc, copper, and manganese since the 1860s. A multidisciplinary investigation was conducted by the U.S. Geological Survey, in cooperation with the Colorado Department of Public Health and Environment, to characterize large-scale groundwater flow in a 13 square-kilometer region encompassing the Canterbury Tunnel and the Leadville Mine Drainage Tunnel near Leadville, Colorado. The primary objective of the investigation was to evaluate whether a substantial hydraulic connection is present between the Canterbury Tunnel and Leadville Mine Drainage Tunnel for current (2008) hydrologic conditions.

Altitude in the Leadville area ranges from about 3,018 m (9,900 ft) along the Arkansas River valley to about 4,270 m (14,000 ft) along the Continental Divide east of Leadville, and the high altitude of the area results in a moderate subpolar climate. Winter precipitation as snow was about three times greater than summer precipitation as rain, and in general, both winter and summer precipitation were greatest at higher altitudes. Winter and summer precipitation have increased since 2002 coinciding with the observed water-level rise near the Leadville Mine Drainage Tunnel that began in 2003. The weather patterns and hydrology exhibit strong seasonality with an annual cycle of cold winters with large snowfall, followed by spring snowmelt, runoff, and recharge (high-flow) conditions, and then base-flow (low-flow) conditions in the fall prior to the next winter. Groundwater occurs in the Paleozoic and Precambrian fractured-rock aquifers and in a Quaternary alluvial aquifer along the East Fork Arkansas River, and groundwater levels also exhibit seasonal, although delayed, patterns in response to the annual hydrologic cycle.

A three-dimensional digital representation of the extensively faulted bedrock was developed and a geophysical direct-current resistivity field survey was performed to evaluate the geologic structure of the study area. The results show that the Canterbury Tunnel is located in a downthrown structural block that is not in direct physical connection with the Leadville Mine Drainage Tunnel. The presence of this structural discontinuity implies there is no direct groundwater pathway between the tunnels along a laterally continuous bedrock unit.

Water-quality results for pH and major-ion concentrations near the Canterbury Tunnel showed that acid mine drainage has not affected groundwater quality. Stable-isotope ratios of hydrogen and oxygen in water indicate that snowmelt is the primary source of groundwater recharge. On the basis of chlorofluorocarbon and tritium concentrations and mixing ratios for groundwater samples, young groundwater (groundwater recharged after 1953) was indicated at well locations upgradient from and in a fault block separate from the Canterbury Tunnel. Samples from sites downgradient from the Canterbury Tunnel were mixtures of young and old (pre-1953) groundwater and likely represent snowmelt recharge mixed with older regional groundwater that discharges from the bedrock units to the Arkansas River valley. Discharge from the Canterbury Tunnel contained the greatest percentage of old (pre-1953) groundwater with a mixture of about 25 percent young water and about 75 percent old water.

A calibrated three-dimensional groundwater model representing high-flow conditions was used to evaluate large-scale flow characteristics of the groundwater and to assess whether a substantial hydraulic connection was present between the Canterbury Tunnel and Leadville Mine Drainage Tunnel. As simulated, the faults restrict local flow in many areas, but the fracture-damage zones adjacent to the faults allow groundwater to move along faults. Water-budget results indicate that groundwater flow across the lateral edges of the model controlled the majority of flow in and out of the aquifer (79 percent and 63 percent of the total water budget, respectively). The largest contributions to the water budget were groundwater entering from the upper reaches of the watershed and the hydrologic interaction of the groundwater with the East Fork Arkansas River. Potentiometric surface maps of the simulated model results were generated for depths of 50, 100, and 250 m. The surfaces revealed a positive trend in hydraulic head with land-surface altitude and evidence of increased control on fluid movement by the fault network structure at progressively greater depths in the aquifer.

Results of advective particle-tracking simulations indicate that the sets of simulated flow paths for the Canterbury Tunnel and the Leadville Mine Drainage Tunnel were mutually exclusive of one another, which also suggested that no major hydraulic connection was present between the tunnels. Particle-tracking simulations also revealed that although the fault network generally restricted groundwater movement locally, hydrologic conditions were such that groundwater did cross the fault network at many locations. This cross-fault movement indicates that the fault network controls regional groundwater flow to some degree but is not a complete barrier to flow. The cumulative distributions of adjusted age results for the watershed indicate that approximately 30 percent of the flow pathways transmit groundwater that was younger than 68 years old (post-1941) and that about 70 percent of the flow pathways transmit old groundwater. The particle-tracking results are consistent with the apparent ages and mixing ratios developed from the chlorofluorocarbon and tritium results. The model simulations also indicate that approximately 50 percent of the groundwater flowing through the study area was less than 200 years old and about 50 percent of the groundwater flowing through the study area is old water stored in low-permeability geologic units and fault blocks. As a final examination of model response, the conductance parameters of the Canterbury Tunnel and Leadville Mine Drainage Tunnel were manually adjusted from the calibrated values to determine if altering the flow discharge in one tunnel affects the hydraulic behavior in the other tunnel. The examination showed no substantial hydraulic connection.

The multidisciplinary investigation yielded an improved understanding of groundwater characteristics near the Canterbury Tunnel and the Leadville Mine Drainage Tunnel. Movement of groundwater between the Canterbury Tunnel and Leadville Mine Drainage Tunnel that was central to this investigation could not be evaluated with strong certainty owing to the structural complexity of the region, study simplifications, and the absence of observation data within the upper sections of the Canterbury Tunnel and between the Canterbury Tunnel and the Leadville Mine Drainage Tunnel. There was, however, collaborative agreement between all of the analyses performed during this investigation that a substantial hydraulic connection did not exist between the Canterbury Tunnel and the Leadville Mine Drainage Tunnel under natural flow conditions near the time of this investigation.

Here’s the link to the full report.

More Arkansas River basin coverage here.

Animas River watershed: Part two of series about the river, ‘Want water, take a number’ from The Durango Herald

animasriver.jpg

Here’s Part Two of the four part series about the Animas River from Dale Rodebaugh and The Durango Herald. Mr. Rodebaugh outlines how uses of the river have changed over time, from prehistoric times to the filling of Lake Nighthorse (full on June 29 this year), part of the Animas-La Plata Project. Here’s an excerpt:

Durango’s early exploitation of the Animas was as a conduit to get logs to sawmills, where they were turned into lumber and railroad ties.

Today, most of the water pulledfrom the river is for irrigation and consumption, but the city of Durango in 2007 obtained a decree that guarantees a certain amount of flow for a whitewater park at Smelter Rapid. Several entities have won such rights for recreation since legislation establishing recreation rights was enacted in2001.

Also, a certain amount of water is reserved to protect two fish species in the San Juan River – the Colorado pikeminnow and humped-back chub,which are federally listed as endangered.

Click through for the whole article and the slide show.

Here’s a look at how the USGS measures streamflow, from Dale Rodebaugh writing for The Durango Herald. From the article:

The USGS maintains more than 7,000 gauging stations on rivers and lakes across the country. The Durango office manages 41 stations in La Plata, Archuleta, Montezuma, San Juan, Dolores, San Miguel, Ouray and Montrose counties.

The station near U.S. Highway 550 and 14th Street went into service in 1895, only six years after the first one ever was installed in New Mexico on the Rio Grande River to help determine whether there was sufficient water for irrigation.

The USGS computerized its gauging nationally in 1983 and first made real-time data available online in 1995.

Click through for the whole article and the video of hydrologic technician Jennifer Dansie at work on calibration chores.

Meanwhile, the Environmental Protection Agency is considering superfund status for parts of the upper Animas River watershed, according to Mark Esper writing for The Telluride Daily Planet. From the article:

And EPA officials said that while the collaborative approach to water quality in the upper Animas spearheaded by the Animas River Stakeholders Group has been successful, the worsening situation on Cement Creek has compelled the agency to study a possible Superfund listing.

“The problem is worsening water quality,” said Sabrina Forrest, site assessment manager for the EPA in Denver. Forrest explained that while the EPA considers the problem to be worthy of the National Priorities List (NPL) under the Superfund law, local support would be required as well as a sign-off from the governor.

“It’s eligible for listing, but community support is needed for that,” Forrest said. And if the Gladstone sites were to be eventually put on the NPL “the community would still have a huge voice on how this would be done.”[…]

Meanwhile, the EPA is planning a Sept. 16 site tour at Gladstone for those interested in getting a better idea of the situation on the ground up there. Forrest says the EPA hopes it can determine by Dec. 20 if there is enough local support for NPL listing to proceed. Under that timetable, the listing could be made official by March 2012.

The preliminary assessment work focused on a cluster of mine sites at and above Gladstone, including the American Tunnel, Gold King Number 7 level, the Mogul and Grand Mogul and the Red and Bonita mines. Peter Butler of Durango, a steering committee member for the Animas River Stakeholders Group, which was formed as a collaborative approach to water quality issues in 1994, said Cement Creek has seen a steady increase in metals loading since a treatment plant at Gladstone was shut down in 2004. Up to 845 gallons per minute of acid mine drainage is pouring into Cement Creek from just four abandoned mines above Gladstone…

At this point, Butler said possible solutions include various scenarios for a water treatment plant on Cement Creek, bulkheads for the four mines discharging the most, or some combination of that. Then comes the question of who pays. Butler said options include seeking damages from Sunnyside Gold’s parent company, Kinross; luring a large mining company to reopen the Gold King and take on the cleanup liability; taking an incremental approach with a pilot treatment project that could be expanded; invoking Superfund; or a combination thereof.

Todd Hennis of Golden, who described himself as the “unfortunate owner of the Gold King and Mogul mines,” said the EPA has been spinning “fairy tales.” “The problem started in 2000 when water started coming out of the Mogul,” Hennis said. He said that was a result of the American Tunnel bulkheads causing water to back up. The water table has since risen an estimated 1,000 feet, causing acid mine drainage to seep from ever higher points on the mountain. Hennis accused state officials of engaging in “pollution trading” with Sunnyside Gold, with a consent decree letting the mining firm off the hook for water quality problems in the Gladstone area. “The state of Colorado has a huge responsibility for this situation,” Hennis said. “Sunnyside walked out of this district and their $5 million bond was returned.” Hennis said the best solution would be for a mining firm to reopen the Gold King and assume responsibility for the water quality issues. Hennis said he thinks there is $700 million in gold still retrievable from the Gold King mine.

Here’s an article that details the course of the Animas River, including the geology, from its headwaters to the San Juan River, from Dale Rodebaugh writing for The Durango Herald. Here’s an excerpt:

At one time, [David Gonzales, a professor and chairman of the geosciences department at Fort Lewis College] said, gravel impelled by a glacier created a dam to form a lake in the Animas Valley. Later erosion of the debris drained the lake but caused the relatively flat and wide channel. The farthest reaching glacier, which receded about 12,000 years ago, carried gravel as far as 32nd Street, Gonzales said.

More Animas River watershed coverage here.

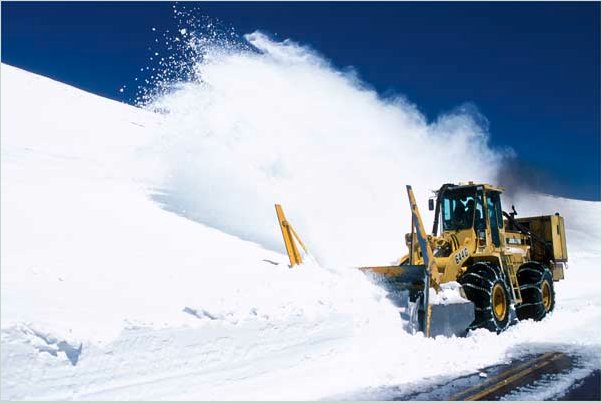
USGS Study Finds Recent Snowpack Declines in the Rocky Mountains Unusual Compared to Past Few Centuries

A picture named plowingsnowtrailridge.jpg

From the Loveland Connection (Bobby Magill):

Using tree ring samples to reconstruct the size of mountain snowpack over the past millennium, USGS researchers were able to show that reductions in the size of the mountain snowpack across the West during the past 30 years is unusual when considering the size of the mountain snowpack each year during the past three centuries…

There was an “inflection point” in the 1980s when the size of a given year’s snowpack was more influenced by temperature than by amount of precipitation, said USGS research scientist Gregory Pederson, lead author of the study, “The Unusual Nature of Recent Snowpack Declines in the North American Cordillera.”[…]

“The region you are sitting in is a particularly dynamic one,” he said. “These basins haven’t shown the substantial temperature-driven declines since the 1980s. (Colorado’s northern mountains) seem fairly resistant to fairly extensive snowpack decline like you see across the Northern Rockies.”

USGS Study Finds Recent Snowpack Declines in the Rocky Mountains Unusual Compared to Past Few Centuries

A picture named topographywesternus.jpg

From The Colorado Springs Gazette (R. Scott Rappold):

Researchers examined tree rings to look at moisture trends going back 500 to 1,000 years, in the first study to examine historic snowpack in this manner. While the northern Rockies have seen the most dramatic loss – less snow, earlier melt-offs – the southern Rockies, including Colorado, have experienced similar trends since the 1980s. That bucks the historical trend, that when the northern Rockies have more snow, the south has less, and vice versa. The recent drops are across the board, 30 to 60 percent of the snowpack.

The study comes at a time of heavy lingering snowpack in Colorado, 248 percent of the average for mid-June. But, said lead author Gregory Pederson, the average is based on recent years; the long view shows this winter may not be as out-of-whack as it seems. “There’s nothing unusual per se about this year, just that it comes in the midst of a lot of low-snowpack years,” he said.

He said the study, along with other research that has shown Western snowpack declines, should be a warning for water suppliers. The only similar periods occurred in the 1350s and 1400s, he said, and these were followed by colder, snowier eras. But, because of the impact of greenhouse gasses, Pederson does not believe that will occur again. “With increased warming, we may now be seeing this temperature impact on the snowpack, more of the precipitation falling as rain rather than snow,” he said…

[Colorado Springs Utilities Water supply planning supervisor Abby Ortega] said the fact the city’s water comes from three different basins insulates it from some of the problems of erratic snowpack. This year, for example, the Arkansas basin has less than half the snowpack of the other side of the Continental Divide, and Pikes Peak has been exceptionally dry.

More coverage from Dan Vergano Sci-Tech Today. From the article:

The historical snowpack reconstruction results, dating to the year 1200 and released by the journal Science, suggest that global warming has broken the normal seesaw pattern of snowpack in the region, in which a down year in the northern Rockies will be offset by a higher snow year in the southern Rockies. Overall, the average yearly snowpack across the northern Rockies directly known from snow records to have dropped 30% to 60% in the past 50 years has fallen more sharply in that time than for any period in the past 800 years, the study shows. “Temperature is the driver here,” says study lead author Greg Pederson of the U.S. Geological Survey’s Northern Rocky Mountain Science Center in Bozeman, Mont. “It doesn’t take a rocket scientist to know that if temperatures get warmer, snow and ice melt sooner.”[…]

The Northern Rockies stretch from Washington state to Montana. The study records show two-decade-long drops in snowpack across the northern Rockies in the 1300s and 1500s that resemble the decline seen in the 20th century, but those declines lasted for shorter periods of time and came when far fewer people were dependent on the snowpack. “Water demand, as much as supply, is the problem,” Pederson says. “We have a lot of fisheries and hydropower relying on this water as well.”

More Colorado River basin coverage here.

USGS Study Finds Recent Snowpack Declines in the Rocky Mountains Unusual Compared to Past Few Centuries

A picture named trailridgesnow052011

Here’s the release from the United States Geological Survey:

A USGS study released today suggests that snowpack declines in the Rocky Mountains over the last 30 years are unusual compared to the past few centuries. Prior studies by the USGS and other institutions attribute the decline to unusual springtime warming, more precipitation falling now as rain rather than snow and earlier snowmelt.

The warming and snowpack decline are projected to worsen through the 21st century, foreshadowing a strain on water supplies. Runoff from winter snowpack – layers of snow that accumulate at high altitude – accounts for 60 to 80 percent of the annual water supply for more than 70 million people living in the western United States.

“This scientific work is critical to understanding how climate change is affecting western water supplies,” Secretary of the Interior Ken Salazar said. “It helps land managers adapt to changing conditions on the ground, assists water managers with planning for the future, and gives all of us a better understanding of the real impacts that carbon pollution is having on our resources and our way of life.”

USGS scientists, with partners at the Universities of Arizona, Washington, Wyoming, and Western Ontario, led the study that evaluated the recent declines using snowpack reconstructions from 66 tree-ring chronologies, looking back 500 to more than 1,000 years. The network of sites was chosen strategically to characterize the range of natural snowpack variability over the long term, and from north to south in the Rocky Mountains.

With a few exceptions (the mid-14th and early 15th centuries), the snowpack reconstructions show that the northern Rocky Mountains experience large snowpacks when the southern Rockies experience meager ones, and vice versa. Since the 1980s, however, there were simultaneous declines along the entire length of the Rocky Mountains, and unusually severe declines in the north.

“Over most of the 20th century, and especially since the 1980s, the northern Rockies have borne the brunt of the snowpack losses,” said USGS scientist Gregory Pederson, the lead author of the study. “Most of the land and snow in the northern Rockies sits at lower and warmer elevations than the southern Rockies, making the snowpack more sensitive to seemingly small increases in temperature. Also, winter storm tracks were displaced to the south in the early 20th century and post-1980s. Forest fires were larger, more frequent and harder to fight, while Glacier National Park lost 125 of its 150 glaciers.”

USGS scientist and co-author Julio Betancourt explains that “The difference in snowpack along the north and south changed in the 1980s, as the unprecedented warming in the springtime began to overwhelm the precipitation effect, causing snowpack to decline simultaneously in the north and south. Throughout the West, springtime tends to be warmer during El Niño than La Niña years, but the warming prior to the 1980s was usually not enough to offset the strong influence of precipitation on snowpack.”
The La Niña episode this year is an example with lots of snow in the north while severe drought afflicts the south. But, in the north, this year’s gains are only a small blip on a century-long snowpack decline.

In the West, the average position of the winter storm tracks tend to fluctuate north and south around a latitudinal line connecting Denver, Salt Lake City and Sacramento. In El Niño years, winter storms track south of that line, while in La Niña years, they track to the north.

This study supports research by others estimating that between 30-60 percent of the declines in the late 20th century are likely due to greenhouse gas emissions. The remaining part of the trend can be attributed to natural decadal variability in the ocean and atmosphere, which is making springtime temperatures that much warmer.

“What we have seen in the last few decades may signal a fundamental shift from precipitation to temperature as the dominant influence on western snowpack.” Pederson said.

The study, The unusual nature of recent snowpack declines in the North American Cordillera, is online at Science magazine http://www.sciencemag.org/lookup/doi/10.1126/science.1201570.

More coverage from Chris Woodka writing for The Pueblo Chieftain. From the article:

USGS scientists, with partners at the universities of Arizona, Washington, Wyoming, and Western Ontario, led the study that evaluated the recent declines using snowpack reconstructions from 66 tree-ring chronologies, looking back 500-1,000 years. With a few exceptions (the mid-14th and early 15th centuries), snowpack reconstructions show that the northern Rocky Mountains experience large snowpacks when the southern Rockies experience meager ones, and vice versa. Since the 1980s, however, there were simultaneous declines along the entire length of the Rocky Mountains, and unusually severe declines in the north.

More coverage from Felicity Barringer writing for The New York Times weblog Green. From the post:

On the one hand, the underlying narrative was depressingly familiar, synchronizing with other studies or predictions involving California’s Sierra, the Himalayas and other spots around the world. What drew my attention is the reminder that snowmelt in the Rockies feeds three huge river systems — the Colorado, the Columbia and the Missouri — on which 70 million Americans depend for water.

Not that everyone living along — or flooded out of the communities along — the Missouri River or its swollen tributaries would consider these findings intuitive. But the U.S.G.S. scientists who led the study point out that climate in the Rocky Mountains has for centuries been an either-or proposition.

It works like this. Draw a hypothetical line in your mind from Denver to Salt Lake City to Sacramento. If there is heavy snow to the north of this line, chances are there will be a drought to the south of it. And vice versa. Or, as an Interior Department press release said, “With a few exceptions (the mid-14th and early 15th centuries), the snowpack reconstructions show that the northern Rocky Mountains experience large snowpacks when the southern Rockies experience meager ones, and vice versa.”

More coverage from United Press International. From the article:

The study backs research that the USGS said estimates that as much as 60 percent of the snowpack declines in the late 20th century are because of greenhouse gas emissions, which are linked to higher global temperature averages…Runoff from winter snowpack makes up nearly 60 percent of the annual water supply for people in the western United States.

More coverage from Craig Welch writing for The Seattle Times via the Bend Bulletin. From the article:

Pederson and his colleagues say the findings are important because they suggest the mountain snows that produce the runoff that powers the Columbia, the Missouri and the Colorado river systems will continue to decline as global temperatures rise, even if precipitation increases.

More coverage from Margaret Munro writing for The Vancouver Sun. From the article:

The study, published Thursday in the journal Science, says the changes are affecting the Colorado, Columbia and Missouri Rivers, which together supply water to 70 million Americans. And they are also altering river flows in the Canadian prairies and central British Columbia, said co-author Brian Luckman, at the University of Western Ontario.

“Snowpack is essential for water supply to many of these areas,” Luckman said, noting that the Rockies feed rivers flowing through central B.C. and the Bow, Athabasca and Oldman rivers in Alberta. “Between 60 to 80 per cent of the water in those rivers is snowmelt from the mountains.”

Mountain snow records don’t go back far beyond 1950, so the team, led by Gregory Pederson at the U.S. Geological Survey, looked at tree rings at 66 sites from B.C. to Colorado to get a read on snowpack levels over the past 800 years.

They found that the snowpack shrank more during the late 20th century than during any other period since 1200 AD, with more severe declines at the northern end of the range studied.

Luckman says the tree rings track the depth of the snowpack because some species such as the alpine larch tend not to grow well in heavy snowpack years because it takes so long for water to start flowing on mountaintops. Trees like Ponderosa Pines at lower elevations thrive in years of heavy snowpack, resulting in thicker tree rings.

More coverage from Joey Bunch writing for The Denver Post. From the article:

The dire long-term forecast cites warmer springs, earlier snowmelts and shifting winter storm patterns, all possible byproducts of global warming caused by greenhouse-gas emissions, according to the USGS. While that could prove disastrous for Colorado’s ski and rafting industries, it’s too early to say if it means less water overall, said Marc Waage, the manager of water-resources planning for Denver Water, which supplies 1.3 million people in the metro region. “I don’t think from this study you can conclude that the overall amount of water is going to decline,” he said, “because we could be compensating snowpack with rain.”

More USGS coverage here.
USGS: You can follow your favorite stream gages via text messaging

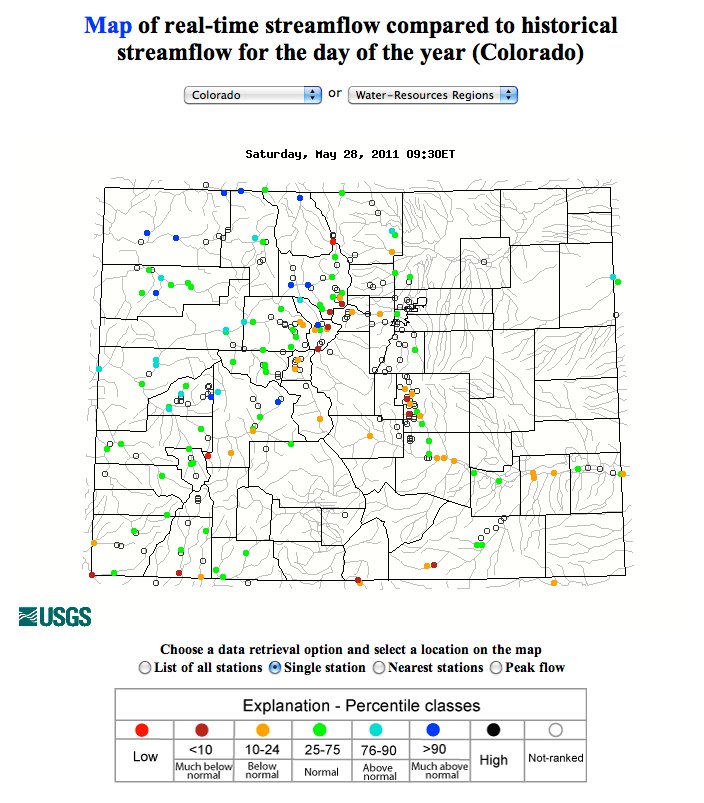
A picture named mapofrealtimestreamflowhistorical05282011

I’ve been watching Clear Creek at Golden and the Cache la Poudre at Fort Collins via the text message service, USGS Water Alert. You choose a threshold for either gage height or flow in cubic feet per second along with a frequency for notification. Notification is via text message or email.

The USGS also runs an online application Water Watch. If you select by state, say Colorado, you can mouse over your favorite gage and read the current stats. The application shows a graphical representation of all reporting gages across the state as well.

Click on the thumbnail graphic above and to the right for a screen shot from this morning. The dots represent current streamflow as compared to average at the location. The legend is at the bottom.

Update: The state website is now back up.

The state’s website is not responding this morning so I’ll point you to it when the link will work.

Wow, Flood DSS is also down. That can’t be good if you’re depending on it for information to use for flood response or emergency response this weekend.

The outage is widespread. The governor’s and state legislature’s websites are not reachable .

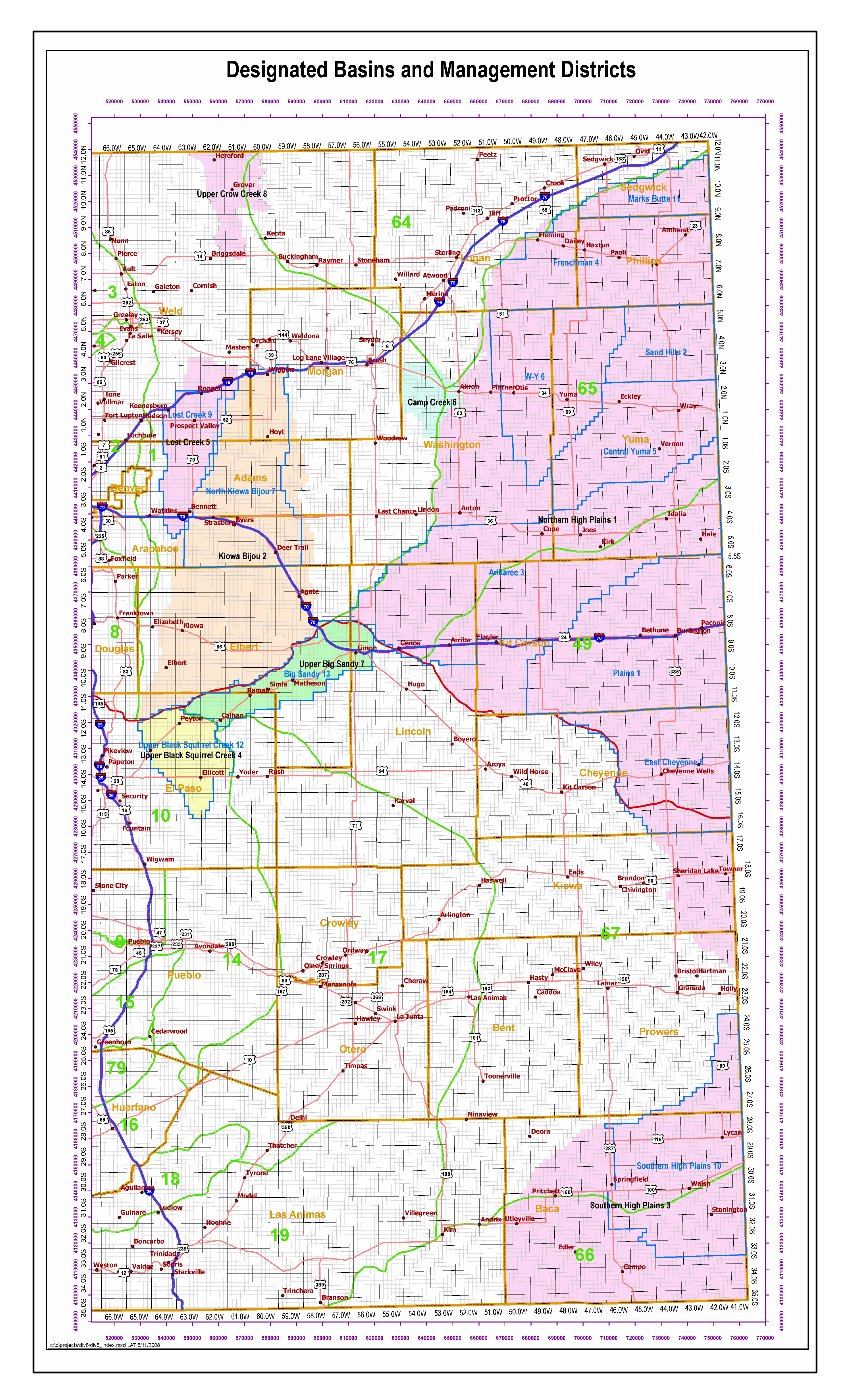
USGS: Well Installation, Single-Well Testing, and Particle-Size Analysis for Selected Sites in and near the Lost Creek Designated Ground Water Basin, North-Central Colorado, 2003–2004

A picture named coloradodesignatedgroundwaterbasins.jpg

Here’s the release from the USGS:

This report describes results from a groundwater data-collection program completed in 2003–2004 by the U.S. Geological Survey in support of the South Platte Decision Support System and in cooperation with the Colorado Water Conservation Board. Two monitoring wells were installed adjacent to existing water-table monitoring wells. These wells were installed as well pairs with existing wells to characterize the hydraulic properties of the alluvial aquifer and shallow Denver Formation sandstone aquifer in and near the Lost Creek Designated Ground Water Basin. Single-well tests were performed in the 2 newly installed wells and 12 selected existing monitoring wells. Sediment particle size was analyzed for samples collected from the screened interval depths of each of the 14 wells.

Hydraulic-conductivity and transmissivity values were calculated after the completion of single-well tests on each of the selected wells. Recovering water-level data from the single-well tests were analyzed using the Bouwer and Rice method because test data most closely resembled those obtained from traditional slug tests. Results from the single-well test analyses for the alluvial aquifer indicate a median hydraulic-conductivity value of 3.8 x 10⁻⁵ feet per second and geometric mean hydraulic-conductivity value of 3.4 x 10⁻⁵ feet per second. Median and geometric mean transmissivity values in the alluvial aquifer were 8.6 x 10⁻⁴ feet squared per second and 4.9 x 10⁻⁴ feet squared per second, respectively. Single-well test results for the shallow Denver Formation sandstone aquifer indicate a median hydraulic-conductivity value of 5.4 x 10⁻⁶ feet per second and geometric mean value of 4.9 x 10⁻⁶ feet per second. Median and geometric mean transmissivity values for the shallow Denver Formation sandstone aquifer were 4.0 x 10⁻⁵ feet squared per second and 5.9 x 10⁻⁵ feet squared per second, respectively. Hydraulic-conductivity values for the alluvial aquifer in and near the Lost Creek Designated Ground Water Basin generally were greater than hydraulic-conductivity values for the Denver Formation sandstone aquifer and less than hydraulic-conductivity values for the alluvial aquifer along the main stem of the South Platte River Basin reported by previous studies.

Particle sizes were analyzed for a total of 14 samples of material representative of the screened interval in each of the 14 wells tested in this study. Of the 14 samples collected, 8 samples represent the alluvial aquifer and 6 samples represent the Denver Formation sandstone aquifer in and near the Lost Creek Designated Ground Water Basin. The sampled alluvial aquifer material generally contained a greater percentage of large particles (larger than 0.5 mm) than the sampled sandstone aquifer material. Alternatively, the sampled sandstone aquifer material generally contained a greater percentage of fine particles (smaller than 0.5 mm) than the sampled alluvial aquifer material consistent with the finding that the alluvial aquifer is more conductive than the sandstone aquifer in the vicinity of the Lost Creek Designated Ground Water Basin…

Beck, J.A., Paschke, S.S., and Arnold, L.R., 2011, Well installation, single-well testing, and particle-size analysis for selected sites in and near the Lost Creek Designated Ground Water Basin, north-central Colorado, 2003–2004: U.S. Geological Survey Open-File Report 2011–1024, 23 p.

Here’s the link to the report. More groundwater coverage here.

USGS: Simulation of Hydraulic Conditions and Observed and Potential Geomorphic Changes in a Reconfigured Reach of Muddy Creek, North-Central Colorado, 2001–2008

A picture named muddycreekoutfallwolfordmountainreservoir.jpg

Here’s the link to the report. From the USGS website:

Muddy Creek near Kremmling, Colorado, is a regulated, meandering, gravel-bed stream that has been monitored for geomorphic change since 2001. One reach of the creek was reconfigured using natural-channel design methods in 2003, providing an opportunity to compare hydraulics in this reach with those in a nearby, unaltered control reach. Streamflow in Muddy Creek has been regulated by Wolford Mountain Reservoir since 1995, but reservoir releases in 2006 and 2008 resulted in out-of-bank floods. The Muddy Creek monitoring program was conducted by the U.S. Geological Survey from 2001 to 2008 in cooperation with the Colorado River Water Conservation District, and the streamflow modeling and analysis were conducted in 2008 in cooperation with the Colorado River Water Conservation District and the Colorado Water Conservation Board.

Minor changes in channel geometry were measured at monitored cross sections in the control reach between 2001 and 2008 and in the reconfigured reach between 2003 and 2008. Geomorphic changes were limited to lateral erosion in a meander bend and lateral erosion of an alluvial fan that formed a vertical scarp in the control reach. Some excavated streambed locations in the reconfigured reach have aggraded to their former elevations, and gravel on alluvial bars might have become better sorted and winnowed of sand-size sediment. Hydraulic conditions in the reconfigured and control reaches were simulated using the U.S. Geological Survey MD_SWMS framework and FaSTMECH computational models.

Elliott, J.G., Schaffrath, K.R., McDonald, R.R., Williams, C.A., and Davis, K.C., 2011, Simulation of hydraulic conditions and observed and potential geomorphic changes in a reconfigured reach of Muddy Creek, north-central Colorado, 2001–2008: U.S. Geological Survey Scientific Investigations Report 2010–5183, 43 p.

More Colorado River basin coverage here.

USGS: Glen Canyon Dam High-Flow Experiments Provide Insights for Future Flow Management of the Colorado River

A picture named glencanyondam030508

Here’s the release from the United States Geological Survey (Lara Schmit/Joan Moody):

High-volume water releases from Glen Canyon Dam can increase sandbar area and volume, but may also result in large increases in non-native rainbow trout downstream of the dam, according to a new U.S. Geological Survey report released today.

The report, Effects of Three-High Flow Experiments on the Colorado River Ecosystem Downstream from Glen Canyon Dam, Arizona, documents the effects of high-flow experiments (HFEs) on resources in Glen Canyon National Recreation Area and the Grand Canyon National Park. The U.S. Department of the Interior conducted HFEs at Glen Canyon Dam in March 1996, November 2004 and March 2008.

“This important scientific research has paved the way for better management of Glen Canyon Dam to enhance protection of downstream resources,” said Anne Castle, Assistant Secretary for Water and Science in the Department of the Interior. “The report pulls together the results from three different high-flow releases so that such events in the future can be targeted for optimal resource benefits and minimizing adverse effects.”
Grand Canyon sandbars provide habitat for wildlife, serve as camping beaches for recreationists, and supply sand that may preserve vegetation and help protect archaeological sites. High flows also create areas of low-velocity flow, or backwaters, used by young native fishes, including endangered humpback chub.

“Research and long-term monitoring of the effects of three high-flow experiments have allowed scientists to unravel some of the many uncertainties about how these Glen Canyon Dam releases affect downstream river resources,” said Dr. Ted Melis, deputy chief of the USGS Grand Canyon Monitoring and Research Center and the report’s editor. “We believe that the scientific findings presented in the report will allow managers to better plan future flow operations to meet desired resource goals.”

HFEs, also known as artificial or controlled floods, are effective at increasing both sandbar area and volume when they are conducted soon after “new” sand has been supplied to the system by flooding from tributaries downstream of the dam. In the absence of new sand supplies, as was the case in 1996, HFEs may still build sandbars, but only by eroding the lower portions of existing sandbars. In other words, sandbars became higher and not wider in 1996.

According to the report, the best possibility for rebuilding and maintaining sandbars is to time HFEs to follow the seasonal flooding of tributaries downstream of the dam. During years of below-average upper Colorado River Basin precipitation, allowing multiple new sand inputs to accumulate before conducting an HFE would result in the greatest sandbar building, the report said. However, during years of wetter upper basin hydrology, HFEs might be more effective immediately following or even during tributary flooding.

Sandbars are built relatively quickly (hours to a few days) when new sand is available from tributaries, as occurred in 2004 and 2008, but they also tend to erode within days to several months under normal dam operations following an HFE. Despite this ongoing erosion, long-term monitoring indicates that about 75 percent of sandbars measured in Marble and Grand Canyons were larger in October 2008 than in February 1996, before the first HFE was conducted.

The 2008 HFE was followed by large increases in non-native rainbow trout in the Lees Ferry reach, the sport fishery immediately downstream of the dam. These fish moved downstream and into areas that support native fishes, including the area with the largest population of endangered humpback chub.

The eight-fold increase of rainbow trout that occurred in 2008 is of particular note, the report said, because rainbow trout are known predators of young humpback chub and may also compete with native fish for limited food resources. Overall, the studies found that HFEs have had no measurable positive effects on juvenile or adult humpback chub populations.

The report is a product of the Glen Canyon Dam Adaptive Management Program, a federally authorized initiative to ensure the mandate of the Grand Canyon Protection Act of 1992 is met through advances in information and resource management. The USGS Grand Canyon Monitoring and Research Center has responsibility for scientific monitoring and research efforts for the program. The Bureau of Reclamation provides financial support for the program that is derived from hydropower revenues from Glen Canyon Dam operations.

The Bureau of Reclamation recently released for public comment two draft Environmental Assessments (EAs) related to topics addressed by this report (1) Development and Implementation of a protocol for High-Flow Experimental Releases from Glen Canyon Dam, Ariz., 2011 through 2020 and (2) Nonnative Fish Control Downstream from Glen Canyon Dam.

More coverage from New West (David Frey):

“There’s really no way we can expect to have a pre-dam landscape by implementing high flows,” said Paul Grams, a hydrologist with the Grand Canyon Monitoring and Research Center and a co-author of a report released Tuesday that examined the findings of three experiments of high flows from the Glen Canyon Dam stretching back to 1996.

Since Glen Canyon Dam was completed in 1963, it not only trapped the water that used to flow through the canyon lands. It also trapped the sediment that made its way to the Grand Canyon. More than just dirt, this mix of sand, gravel and clays played a key role in forming ecosystems for native plants and animals. The dam also took away the river’s historic ebbs and flows from floods to trickles. These changes in water volume, which helped shape the river, were replaced with a steady flow throughout the year. Changes in temperature, flow and sand contributed to losses of native fish, invasions of nonnative species, the erosion of sandbars and the narrowing of river rapids. In an effort to re-create natural flooding, researchers experimented with high-flow releases from the dam in 1996, 2004 and 2008. They found artificial floods increase the size and number of sandbars downstream, but it’s unclear how long the sandbars can survive under ordinary dam operations.

Scientists found the sandbars are most successful when the releases take place during times of normal flooding, when more sand is flowing from tributaries downstream from the lake. The high flows seem to help native fish, researchers found, but they may also encourage nonnative rainbow trout. That’s good news upstream, where rainbow trout are encouraged for fishermen, but it’s bad news downstream, where the trout can muscle out native species, like the endangered humpback chub. “Sandbars are important,” Grams said. “They’re a resource for river recreationists, a resource for riparian vegetation, riparian ecosystems. The underwater part of sandbars creates habitat for native fish.”

More Colorado River basin coverage here.

USGS: Digital map of the High Plains (Ogallala) aquifer

A picture named highplainsogallalaaquiferboundary.jpg

Every now and then I run across a well-crafted graphic. Click on the thumbnail graphic to the right to see a map of the boundary of the Ogallala Aquifer from the United States Geological Service.

More Ogallala aquifer coverage here and here.

USGS: Most River Flows across the U.S. are Altered by Land and Water Management, Leading to Ecological Degradation

A picture named usdroughtmonitor11022010

Here’s the link to the report here’s the release from the USGS (Daren Carlisle/Kara Capelli):

The amount of water flowing in streams and rivers has been significantly altered in nearly 90 percent of waters that were assessed in a new nationwide USGS study. Flow alterations are a primary contributor to degraded river ecosystems and loss of native species.

“This USGS assessment provides the most geographically extensive analysis to date of stream flow alteration,” said Bill Werkheiser, USGS Associate Director for Water. “Findings show the pervasiveness of stream flow alteration resulting from land and water management, the significant impact of altered stream flow on aquatic organisms, and the importance of considering this factor for sustaining and restoring the health of the Nation’s streams and ecosystems.”

Flows are altered by a variety of land- and water-management activities, including reservoirs, diversions, subsurface tile drains, groundwater withdrawals, wastewater inputs, and impervious surfaces, such as parking lots, sidewalks and roads.

“Altered river flows lead to the loss of native fish and invertebrate species whose survival and reproduction are tightly linked to specific flow conditions,” said Daren Carlisle, USGS ecologist and lead scientist on this study. “These consequences can also affect water quality, recreational opportunities and the maintenance of sport fish populations.”

For example, in streams with severely diminished flow, native trout, a popular sport fish that requires fast-flowing streams with gravel bottoms, are replaced by less desirable non-native species, such as carp. Overall, the USGS study indicated that streams with diminished flow contained aquatic communities that prefer slow moving currents more characteristic of lake or pond habitats.

“Management practices related to water demand continue to alter stream flows in many places,” said Jeff Ostermiller, Water Quality Manager with the Utah Division of Water Quality. “Understanding the ecological effects of these flow alterations helps water managers develop effective strategies to ensure that water remains sufficiently clean and abundant to support fisheries and recreation opportunities, while simultaneously supporting economic development.”

Annual and seasonal cycles of water flows — particularly the low and high flows — shape ecological processes in rivers and streams. An adequate minimum flow is important to maintain suitable water conditions and habitat for fish and other aquatic life. High flows are important because they replenish floodplains and flush out accumulated sediment that can degrade habitat.

“While this study provided the first, national assessment of flow alteration, focused studies within specific geographic regions will provide a better understanding of the ecological effects of altered stream flows, which can be more effectively applied to local water management challenges,” said Carlisle.

The severity and type of stream flow alteration varies among regions, due to natural landscape features, land practices, degree of development, and water demand. Differences are especially large between arid and wet climates. In wet climates, watershed management is often focused on flood control, which can result in lower maximum flows and higher minimum flows. Extremely low flows are the greatest concern in arid climates, in large part due to groundwater withdrawals and high water use for irrigation.

The study identified over 1,000 unimpaired streams to use as reference points to create stream flow models. The models were applied to estimate expected flows for 2,888 additional streams where the USGS had flow monitoring gauges from 1980-2007. The estimated values for the 2,888 streams were compared to actual, measured flows to determine the degree to which streams have been altered.

This study was conducted by the USGS National Water-Quality Assessment Program, which has assessed the physical, chemical and biological characteristics of streams and rivers across the nation since 1991.

For more than 125 years, the USGS has served as the Nation’s water monitoring agency, including flow and quality in selected streams and rivers across the United States. USGS continues to work closely with the Environmental Protection Agency and other federal agencies, states and local watersheds to assure that USGS monitoring and assessments provide useful information for managing and protecting streams throughout the Nation.

Water-quality data from more than 1,300 locations, much of it in real-time, are available through USGS Water Quality Watch. Additional information about surface water, groundwater and water quality is available at the National Water Information System Web Interface. You can also receive instant, customized updates about water conditions by subscribing to WaterAlert.

More coverage from The Summit County Citizens Voice (Bob Berwyn):

Flows are altered by a variety of land- and water-management activities, including reservoirs, diversions, subsurface tile drains, groundwater withdrawals, wastewater inputs, and impervious surfaces, such as parking lots, sidewalks and roads.

“Altered river flows lead to the loss of native fish and invertebrate species whose survival and reproduction are tightly linked to specific flow conditions,” said Daren Carlisle, USGS ecologist and lead scientist on this study. “These consequences can also affect water quality, recreational opportunities and the maintenance of sport fish populations.”

For example, in streams with severely diminished flow, native trout, a popular sport fish that requires fast-flowing streams with gravel bottoms, are replaced by less desirable non-native species, such as carp. Overall, the USGS study indicated that streams with diminished flow contained aquatic communities that prefer slow moving currents more characteristic of lake or pond habitats.

More USGS coverage here.
Secretary of Interior Salazar announces the ‘Colorado River Basin Geographic Focus Study’

A picture named coloradoriverbasin.jpg

Here’s the release from the Department of Interior. Here’s an excerpt:

“The Colorado River Basin is ground zero for assessing the effects of climate change on our rivers and taking creative management actions to head off the related dangers posed to our water supplies, hydroelectric power generation and ecosystems,” the Secretary said. “We are with you for the long haul to protect our region and its water.”

The Southwest Climate Center is the fourth of eight planned regional Climate Science Centers—or CSCs–to be established by the Department. With the University of Arizona in Tucson as home base, the center will be led by a consortium of that school and others — University of California, Davis; University of California, Los Angeles; Desert Research Institute, Reno; University of Colorado, Boulder; and the Scripps Institution of Oceanography at the University of California, San Diego.

More coverage from Amy Joi O’Donoghue writing for the Deseret News. From the article:

Called the Colorado River Basin Geographic Focus Study, the inventory will be conducted by scientific experts within the U.S. Geological Survey.

The study will be conducted over a three-year period and also is intended to provide a platform on how much water is needed to support ecosystems amid significant competition over water resources.

Salazar said the study is part of an ongoing effort outlined in the WaterSMART Secretarial Order signed in February of this year, adding that the last comprehensive assessment of water availability in the country was in 1978.

The USGS WaterSMART initiative will produce a water census for the nation, a new and ongoing appraisal for water availability that links both water quality and quantity. It will track changes in flow, use, and storage of water, as well as develop models and predictive tools to guide decisions.

A relatively new area of science evaluates how much water needs to be left in the streams to support important ecological values. This initiative includes a significant research and assessment effort to help wildlife managers characterize the flow needs for aquatic species and their habitat.

The USGS WaterSMART Colorado River Basin Geographic Focus Study will complement the River Basin Supply and Demand grant awarded for the Colorado Basin by the Bureau of Reclamation in 2010. It is one of three such studies on major river basins across the nation planned to begin this year.

More Colorado River Basin coverage here.

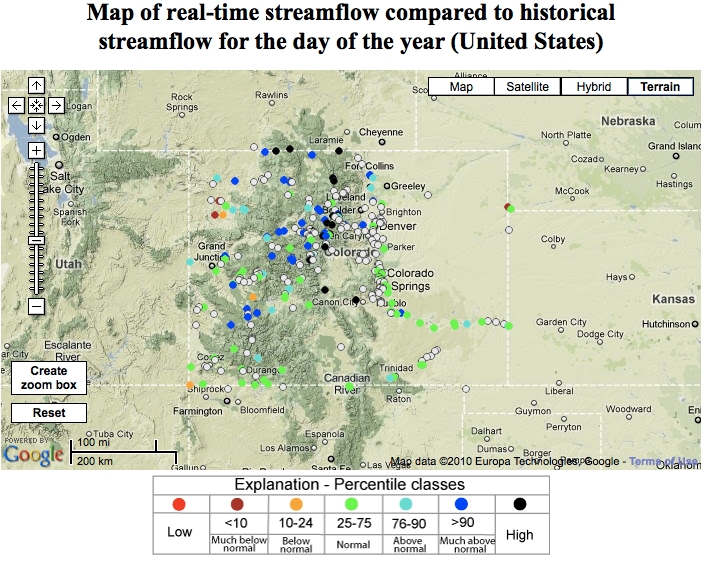
USGS Water Watch: Colorado streamflow map

A picture named usgsstreamflowcolorado06072010

Click here for the USGS’ Water Watch website showing the map of real-time streamflow compared to historical streamflow. Click on the thumbnail graphic to the right for the Google map for tonight at 9:00 p.m.