NOAA released new climate normals for the United States this week. This is something that takes place every 10 years. The new normals use weather data from 1991 through 2020. The previous 30-year normals used weather records from 1981 through 2010.
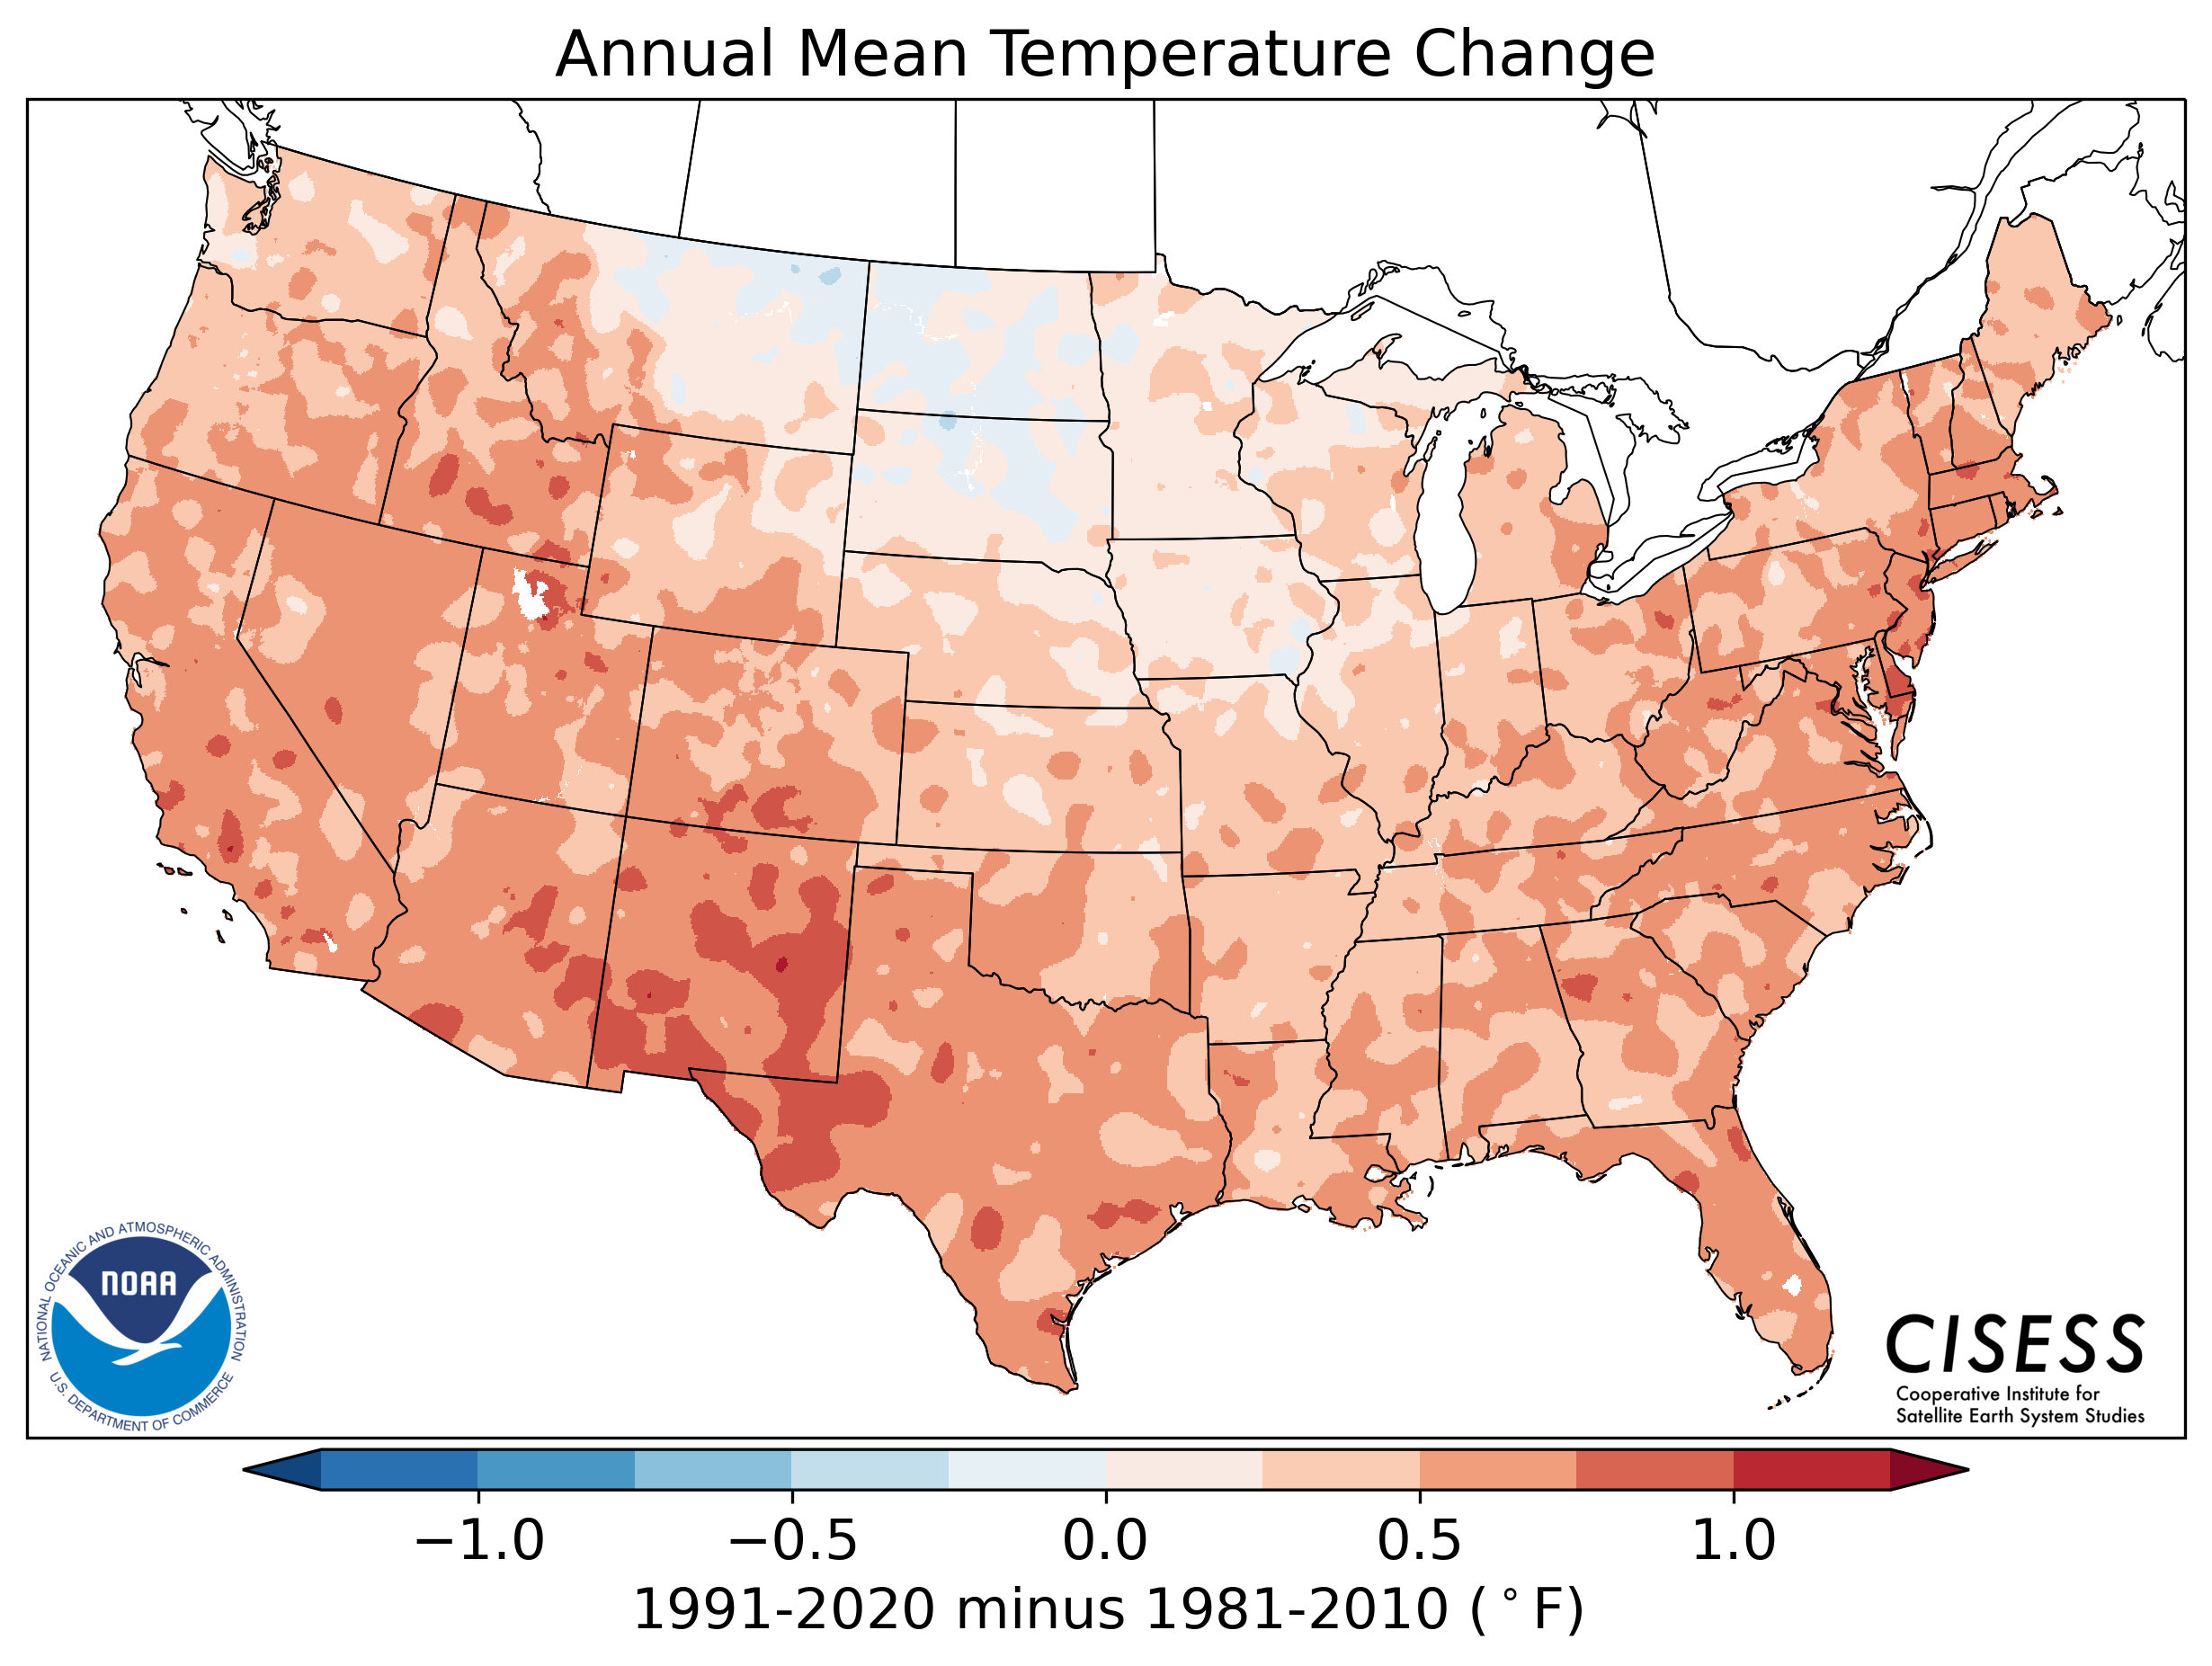
The new normals show that over the past 10 years average temperatures have warmed for most of the lower 48 states when looking at the data from an annual perspective. There is an area with cooler temperatures stretching from Montana to the Dakotas. All of Colorado has warmed over the last decade with the biggest changes found in the southern part of the state.
Average annual temperature change in degrees Fahrenheit for the contiguous U.S. from the 1981–2010 U.S. Climate Normals to the newest data in the 1991–2020 Normals, released by NOAA, May 2021. Averages indicate a warming pattern occurred in all but portions of the Upper Midwest and Northern Plains. Courtesy of CISESS.
As far as precipitation goes, a large part of the United States has become wetter over the last decade, which is something one would expect in a warmer world if there is a source to provide moisture. That’s because warmer air can hold more water vapor and water vapor contains energy that fuels storms.
You may notice that a lot of the wetter locations are east of the Rocky Mountains. Summertime wind patterns and the Gulf of Mexico play a big role in this. A predominant flow of wind from the south transports warm, humid air to that part of the country, setting the stage for afternoon showers and thunderstorms.
But the southwest United States, including Colorado, is trending drier when looking at the new climate normals. A warmer, drier climate can spawn severe long-term droughts and other hazards such as wildfires and water shortages. Unfortunately we’ve seen a lot of this in the past several years.
Annual U.S. precipitation changes by percentage from the 1981–2010 U.S. Climate Normals to the newest data in the 1991–2020 Normals, released by NOAA, May 2021. Decreases indicate a drier Southwest, and increases indicate wetter sections of the Northern Plains, Great Lakes region, and Southeast. Courtesy of CISESS.