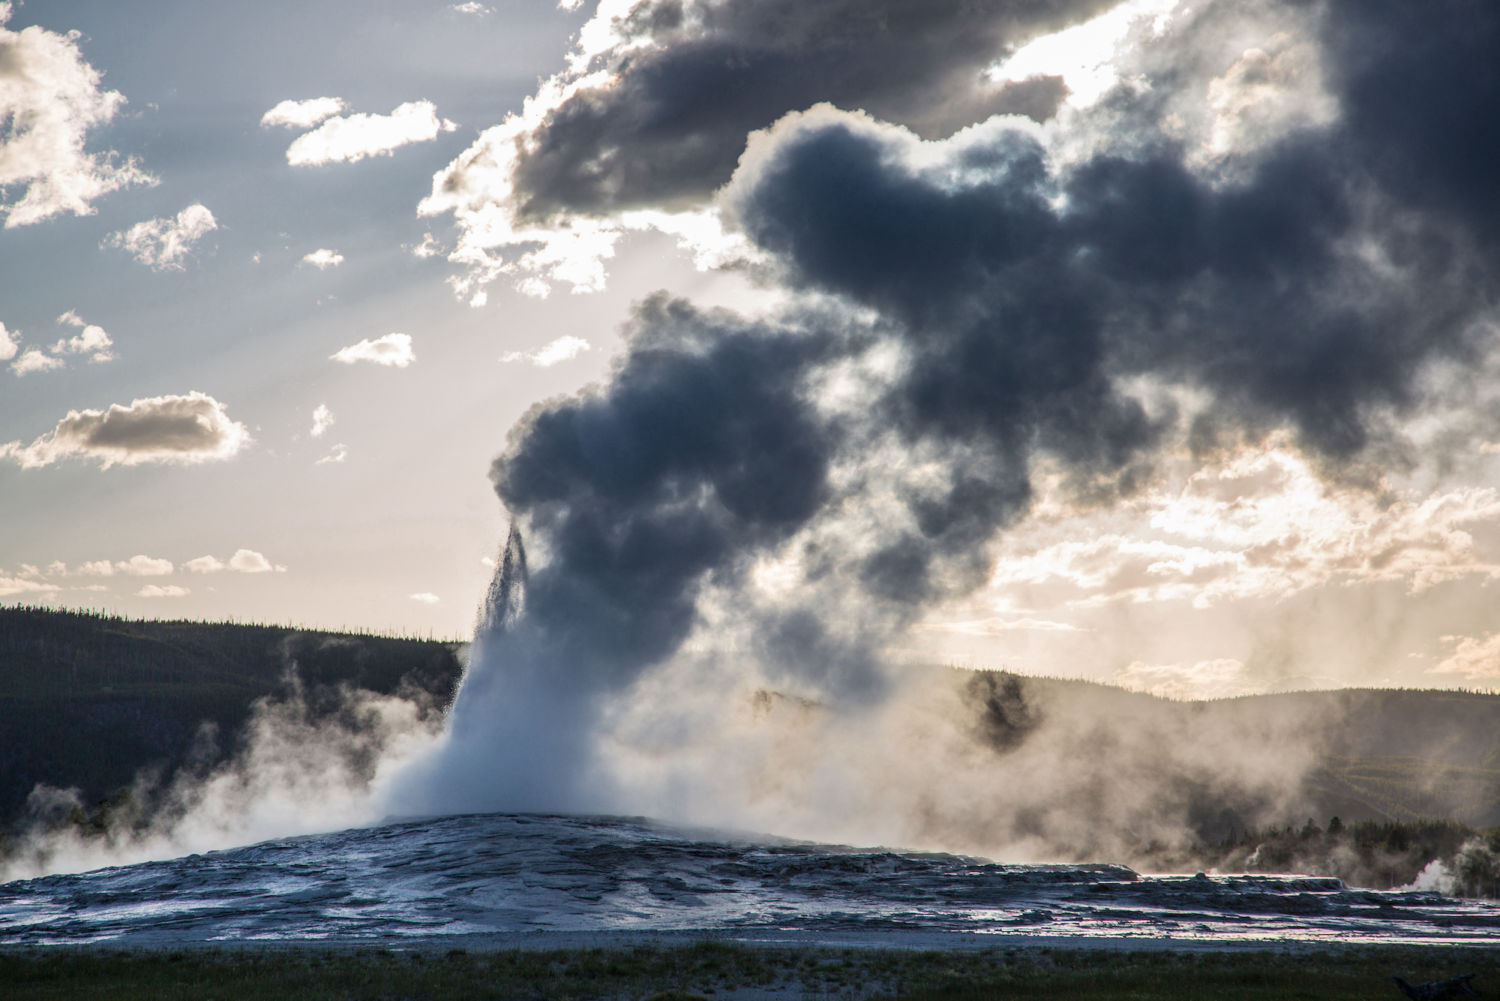
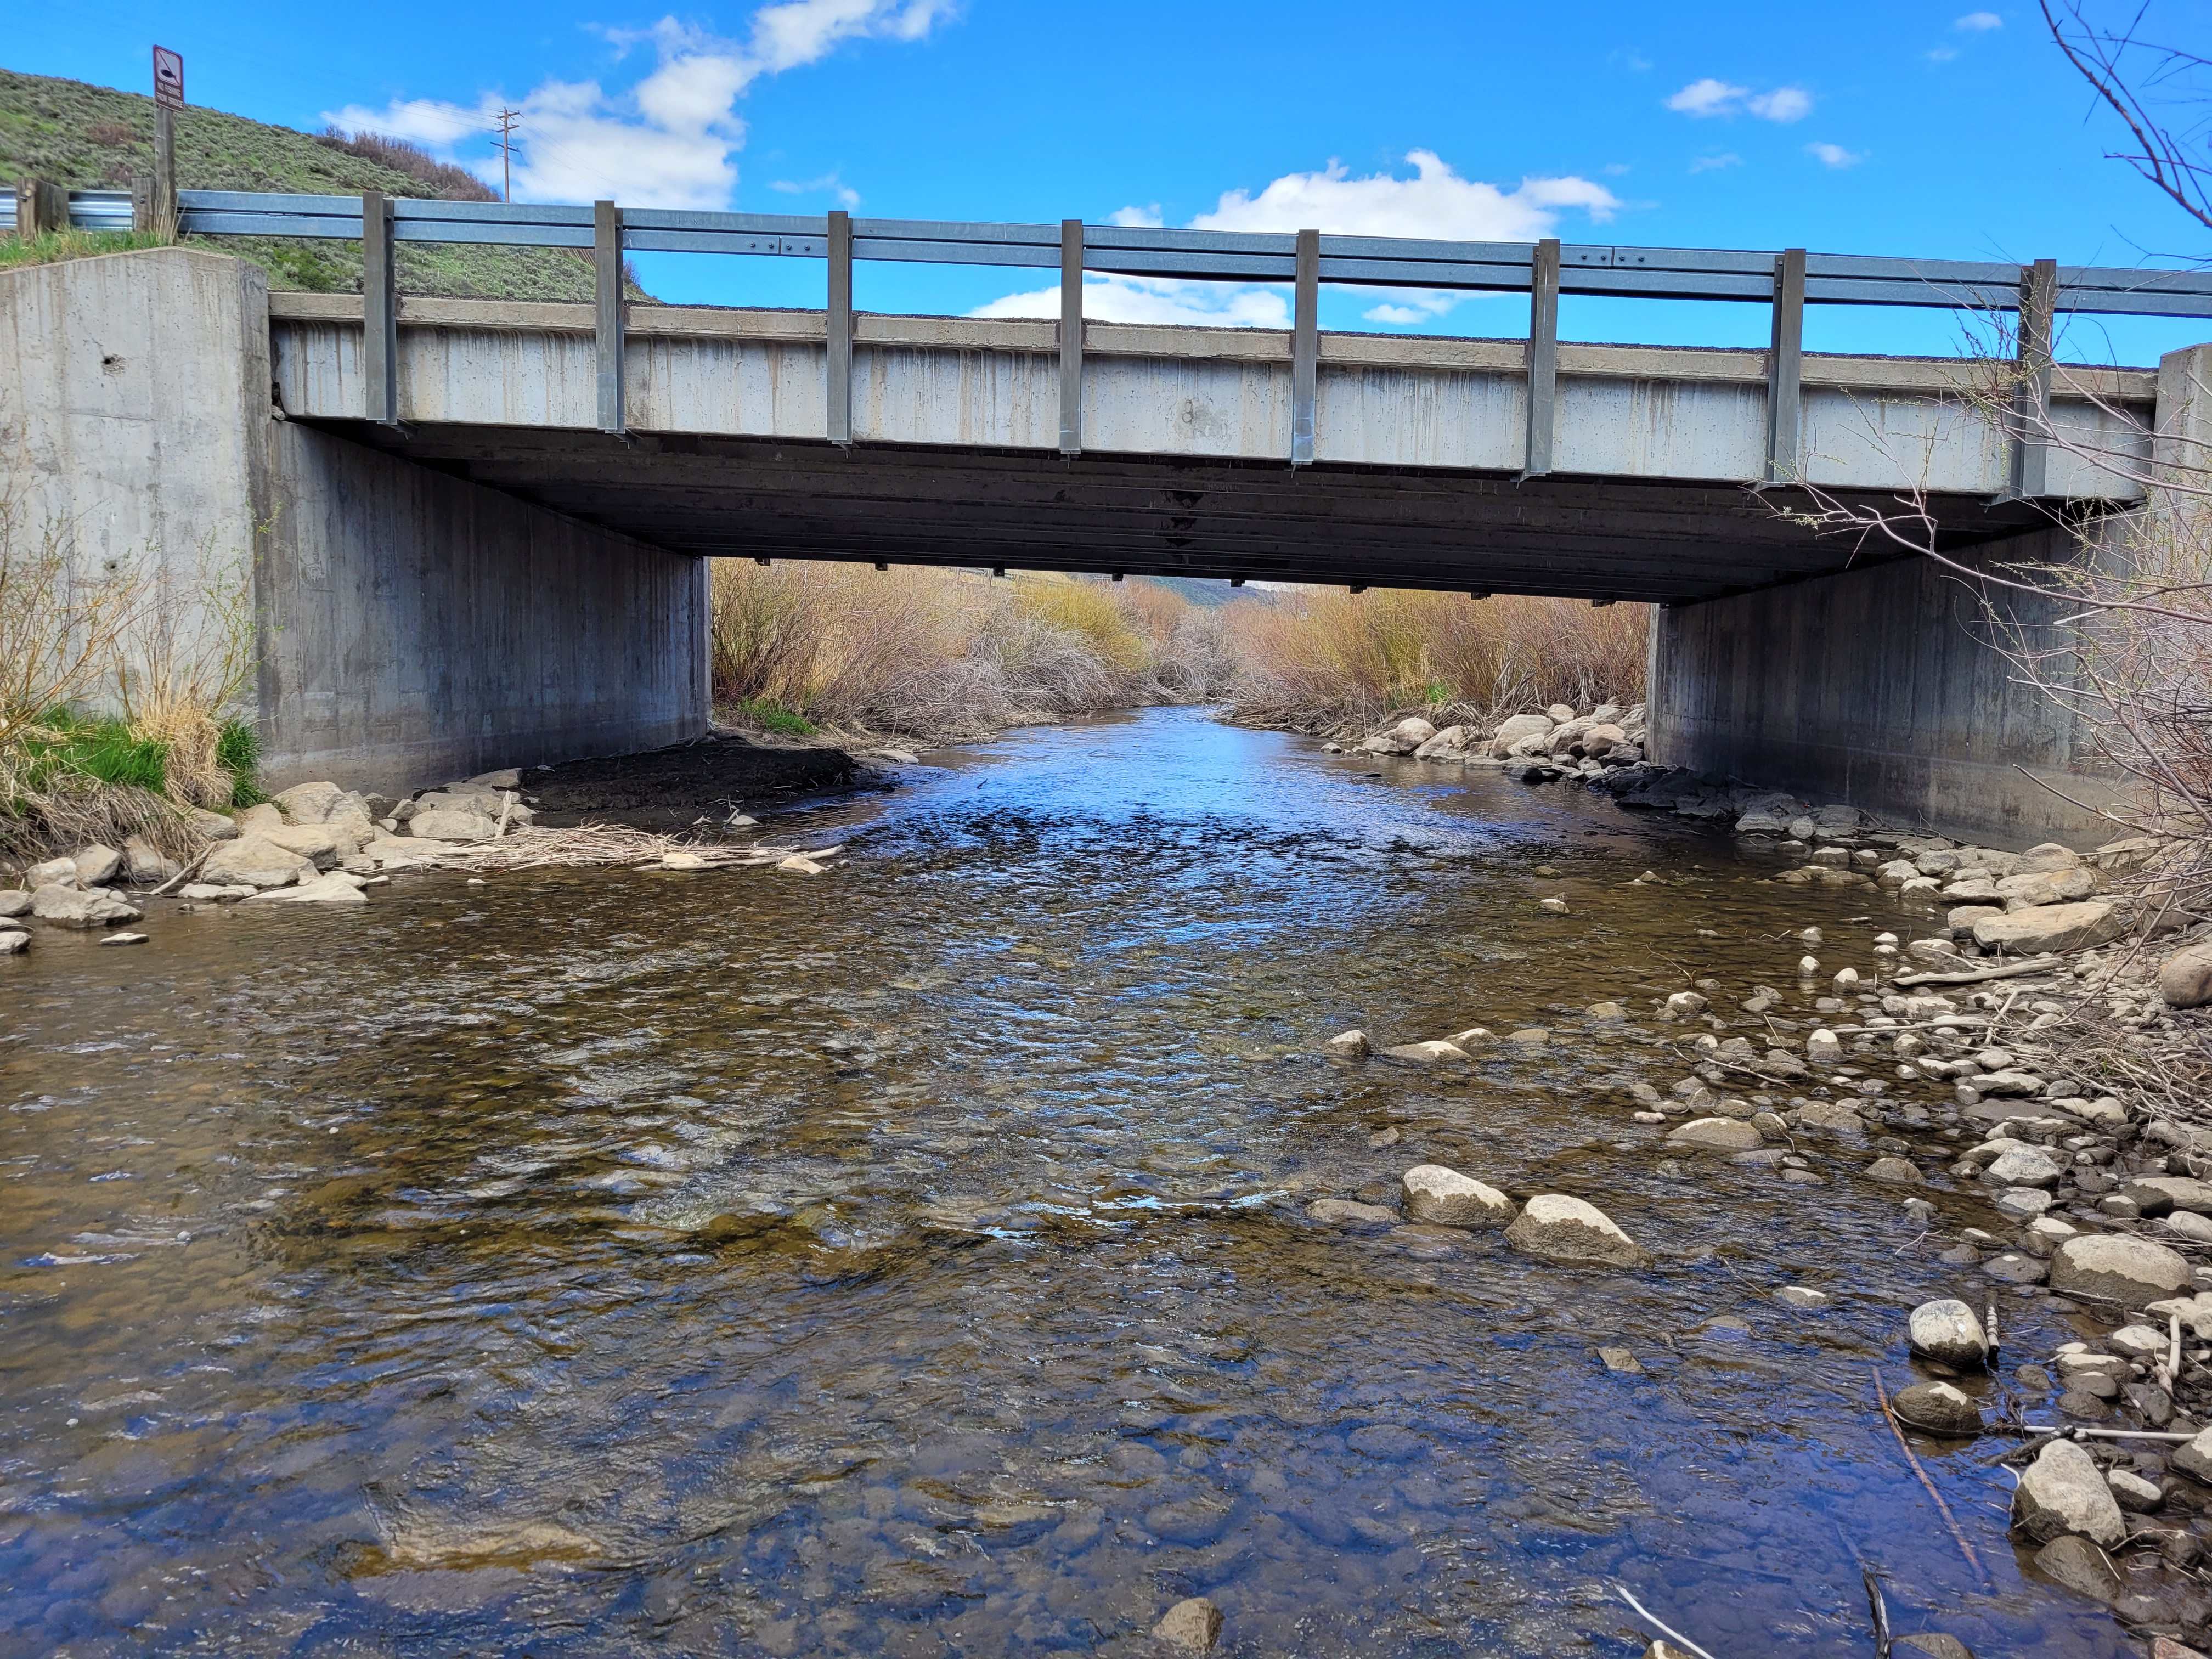
A new report details global warming’s impact on Yellowstone Park, changes that have begun to fundamentally alter its famed ecosystem and threaten everything from its forests to Old Faithful geyser. Such troubling shifts are occurring in national parks across the U.S. West.
In 1872, when Yellowstone was designated as the first national park in the United States, Congress decreed that it be “reserved and withdrawn from settlement, occupancy, and sale and … set apart as a public park or pleasuring ground for the benefit and enjoyment of the people.” Yet today, Yellowstone — which stretches 3,472 square miles across Montana, Wyoming and Idaho — is facing a threat that no national park designation can protect against: rising temperatures.
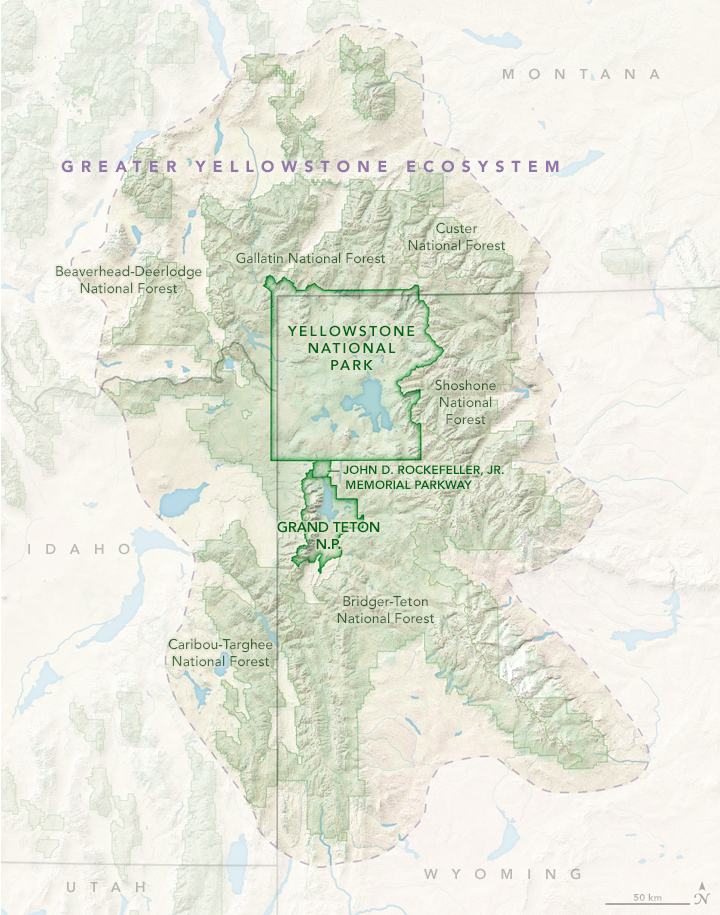
Since 1950, the iconic park has experienced a host of changes caused by human-driven global warming, including decreased snowpack, shorter winters and longer summers, and a growing risk of wildfires. These changes, as well as projected changes as the planet continues to warm this century, are laid out in a just-released climate assessment that was years in the making. The report examines the impacts of climate change not only in the park, but also in the Greater Yellowstone Ecosystem — an area 10 times the size of the park itself.
The climate assessment says that temperatures in the park are now as high or higher as during any period in the last 20,000 years and are very likely the warmest in the past 800,000 years. Since 1950, Yellowstone has experienced an average temperature increase of 2.3 degrees Fahrenheit, with the most pronounced warming taking place at elevations above 5,000 feet.
The Greater Yellowstone Ecosystem. NASA EARTH OBSERVATORY MAP BY JOSHUA STEVENS, USING DATA FROM THE NATIONAL PARK SERVICE AND THE U.S. FISH AND WILDLIFE SERVICE via Yale 360
Today, the report says, Yellowstone’s spring thaw starts several weeks sooner, and peak annual stream runoff is eight days earlier than in 1950. The region’s agricultural growing season is nearly two weeks longer than it was 70 years ago. Since 1950, snowfall has declined in the Greater Yellowstone Area in January and March by 53 percent and 43 percent respectively, and snowfall in September has virtually disappeared, dropping by 96 percent. Annual snowfall has declined by nearly two feet since 1950.
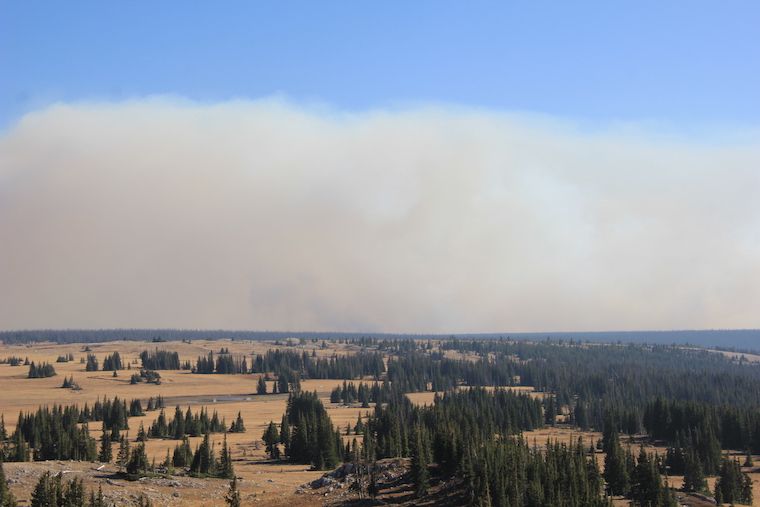
Because of steady warming, precipitation that once fell as snow now increasingly comes as rain. Annual precipitation could increase by 9 to 15 percent by the end of the century, the assessment says. But with snowpack decreasing and temperatures and evaporation increasing, future conditions are expected to be drier, stressing vegetation and increasing the risk of wildfires. Extreme weather is already more common, and blazes like Yellowstone’s massive 1988 fires — which burned 800,000 acres — are a growing seasonal worry.
The assessment’s future projections are even bleaker. If heat-trapping emissions are not reduced, towns and cities in the Greater Yellowstone Area — including Bozeman, Montana and Jackson, Pinedale, and Cody, Wyoming — could experience 40 to 60 more days per year when temperatures exceed 90 degrees F. And under current greenhouse gas emissions scenarios, temperatures in the Greater Yellowstone Area could increase by 5 to 10 degrees F by 2100, causing upheaval in the ecosystem, including shifts in forest composition.
At the heart of the issues facing the Greater Yellowstone Area is water, and the report warns that communities around the park — including ranchers, farmers, businesses and homeowners — must devise plans to deal with the growing prospect of drought, declining snowpack and seasonal shifts in water availability.
“Climate is going to challenge our economies and the health of all people who live here,” said Cathy Whitlock, a Montana State University paleoclimatologist and co-author of the report. She hopes “to engage residents and political leaders about local consequences and develop lists of habitats most at-risk and the specific indicators of human health that need to be studied,” like the connection between the increase in wildfires and respiratory illness. Sounding the alarm isn’t new, but the authors of the Yellowstone report hope their approach, and the body of evidence presented, will convince those skeptical about climate change to accept that it’s real and intensifying.
The report describes a scenario that is now all too common across the American West and in the region’s renowned national parks, from Grand Canyon in Arizona, to Zion in Utah, to Olympic in Washington state. Record warming and extreme drought mean there is not enough fall and winter moisture, leading to steadily declining mountain snowpack. Many iconic venues may soon lose the very features they were named for. Most striking is Glacier National Park in Montana, where, since the late 19th century, the number of the park’s glaciers has declined from 150 to 26. The remaining glaciers are expected to disappear this century.
In Joshua Tree National Park in California’s Mojave Desert, extreme heat — coupled with a prolonged drought — has wreaked havoc on the eponymous species. Because of drought and wildfire, the park is poised to lose 80 percent of its renowned Joshua trees by 2070.
Swaths of Rocky Mountain National Park in Colorado have suffered massive die-offs of white pine and spruce as warming-related bark-beetle infestations have killed an estimated 834 million trees across the state. And in Yosemite National Park in California, the rate of warming has doubled since 1950 to 3.4 degrees F per century. Yosemite is experiencing 88 more frost-free days than it did in 1907. The park’s snowpack is dwindling. Its remnant glaciers are fast disappearing. And wildfires are becoming more common. In 2018, the park was closed for several weeks because of dense smoke from a fire on its border. The National Park Service says that temperatures could soar by 6.7 to 10.3 degrees F from 2000 to 2100, with profound impacts on the Yosemite ecosystem.
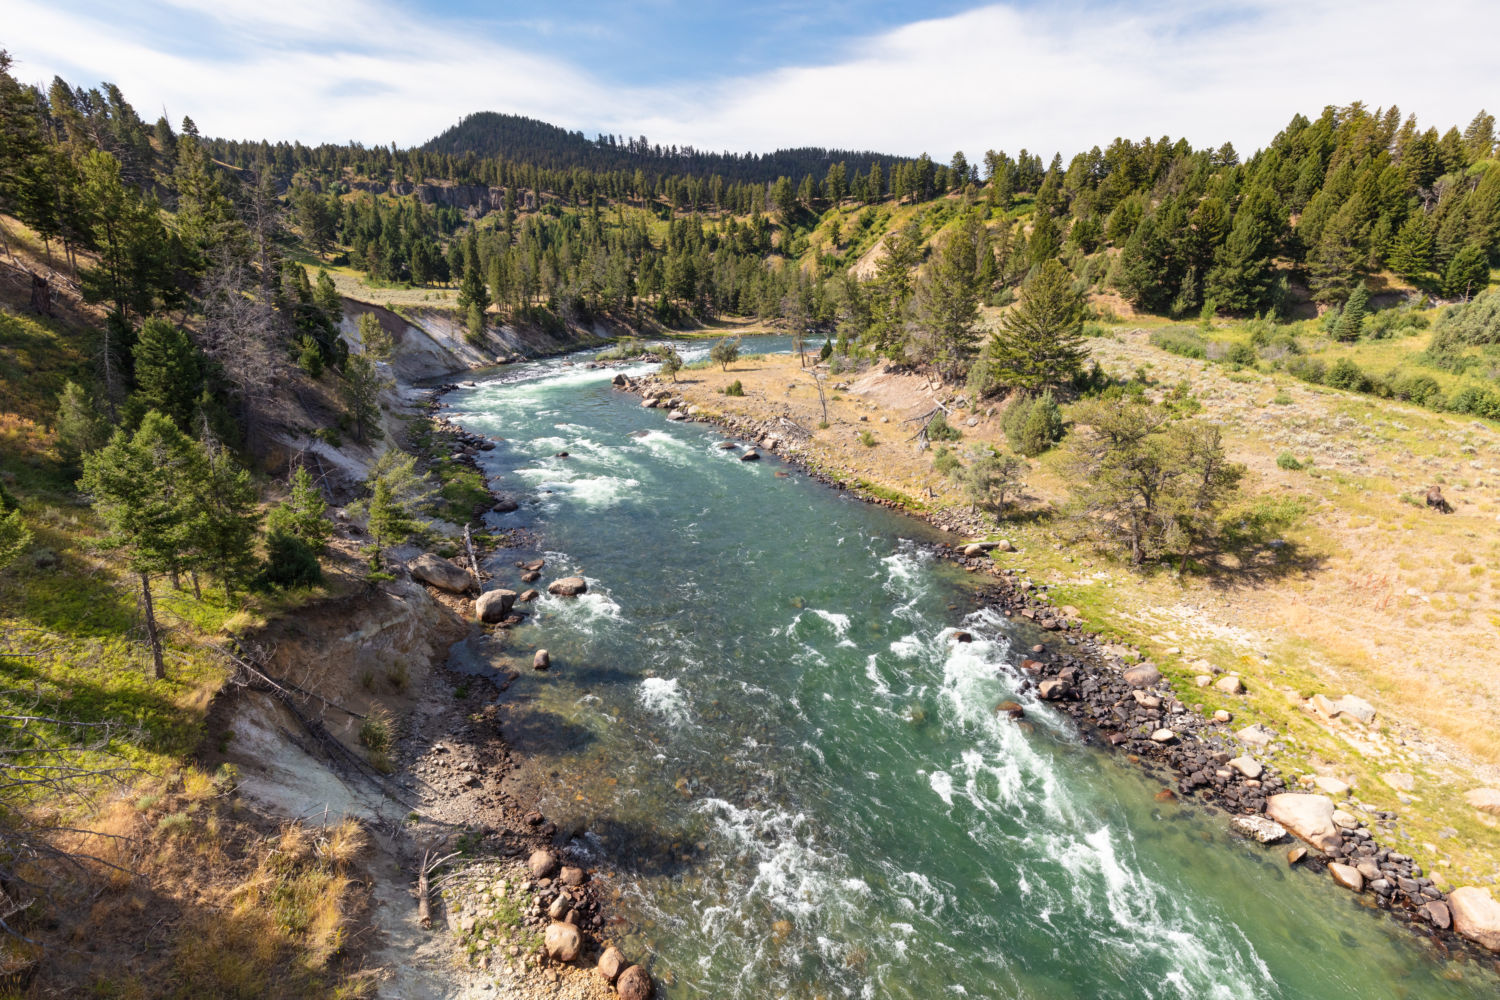
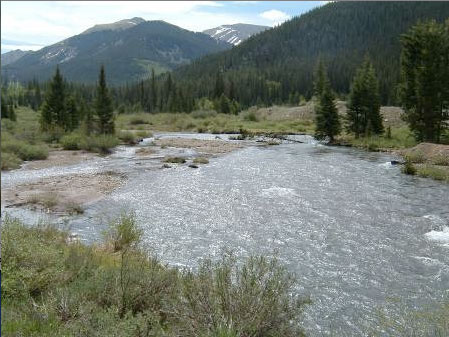
Yellowstone River. Snowpack in the Yellowstone area is melting earlier, leading to a decline in summer streamflows. JACOB W. FRANK / NATIONAL PARK SERVICE via Yale 360
The Yellowstone assessment paints a detailed portrait of the past, present and future impacts of climate-related changes.
“This is one of the first ecosystem-scale climate assessments of its kind,” said co-author Charles Drimal, water program coordinator for the Greater Yellowstone Coalition. “It sets a benchmark for how the climate has changed since the 1950s and what we are likely to experience 40 to 60 years from now in terms of temperature, precipitation, stream flow, growing season and snowpack.” Researchers from the U.S. Geological Survey, Montana State University and the University of Wyoming were the lead scientists on the report.
The report’s study of snowpack and its link to water offer the biggest takeaways for Westerners who might question how or why they’re impacted. Rocky Mountain snowmelt provides between 60 to 80 percent of streamflow in the West, and hotter temperatures mean reduced snowfall and less water for cities as far afield as Los Angeles. For the millions of people living in cities across the West, many of whom are reliant on runoff from the snowpack in the Rocky Mountains, these trends jeopardize already insufficient supplies. The dangers are starkly evident this summer, as years of drought and soaring temperatures have left the West facing a perilous wildfire season and water shortages, from Colorado to California.
“All that snow becomes water that goes into the three major watersheds of the West — some of it goes as far as L.A. — and that comes together in the southern edge of Yellowstone National Park,” said Bryan Shuman, a report co-author and geologist at the University of Wyoming. “Looking at projections going forward, that snowpack disappears.”
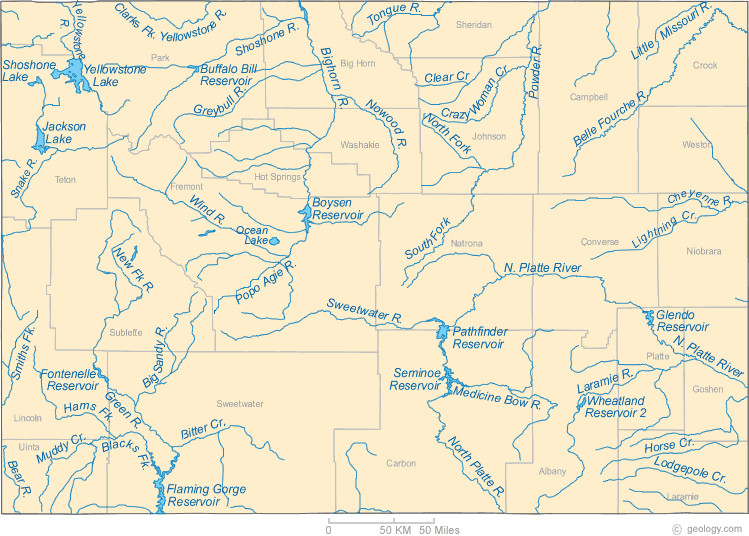
Wyoming rivers map via Geology.com
The Yellowstone, Snake and Green rivers all have headwaters in the Greater Yellowstone Area, feeding major tributaries for the Missouri, Columbia and Colorado rivers that are vital for agriculture, recreation, energy production and homes. Regional agriculture — potatoes, hay, alfalfa — and cattle ranching depend on late-season irrigation, and less snow and more rain equals less water in hot summer months.
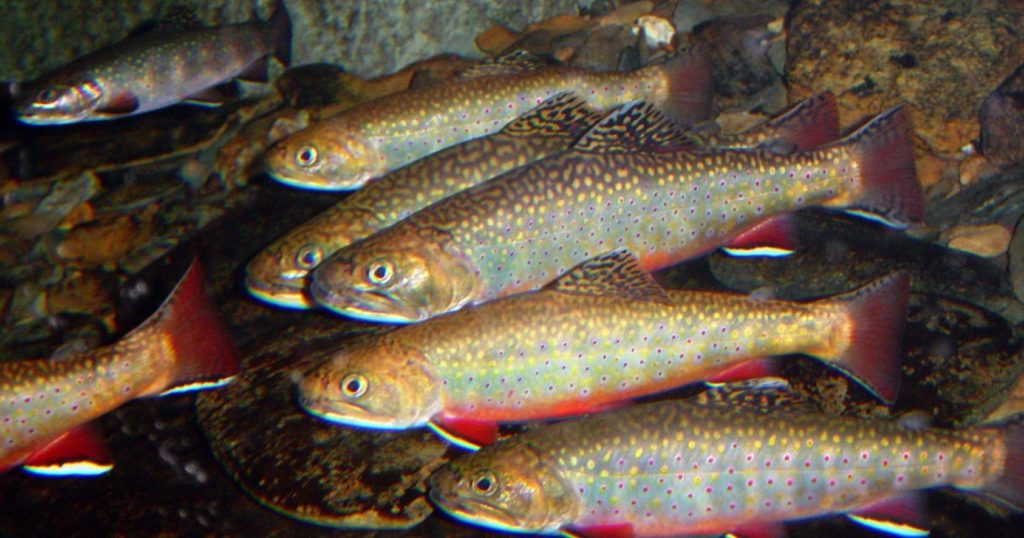
Then there are the rapidly growing tourism and hospitality industries that rely on Yellowstone’s world-class rivers and ski areas for angling and black diamond runs. Fishing is now regularly restricted because of high water temperatures that stress fish.
“Even mineral and energy resource extraction need to be part of this discussion,” said Whitlock, referring to Wyoming’s oil and gas industry, heavily reliant on large amounts of water. Industry may be the slowest to evolve, but it’s among the most at-risk, she said.
Many locals do quietly acknowledge the reality of what’s happening, she said, but community buy-in remains tough in this culture war hotspot, where many farmers and ranchers have long opposed government land intervention.
The land in the Greater Yellowstone Area, comprising 34,000 square miles, is among the last, largely intact temperate ecosystems in the United States and includes two national parks (Grand Teton in Wyoming is the other), five national forests, and half a dozen tribal nations. It’s also home to 10,000 hydrothermal features, including 500 geysers. Recent research has shown that in periods of extreme heat and drought, geysers such as Yellowstone’s renowned Old Faithful have shut down entirely.
The current conditions do have some historical precedent. In the last 10,000 years, Yellowstone has experienced periods of dryness equal to or greater than present, said Whitlock.
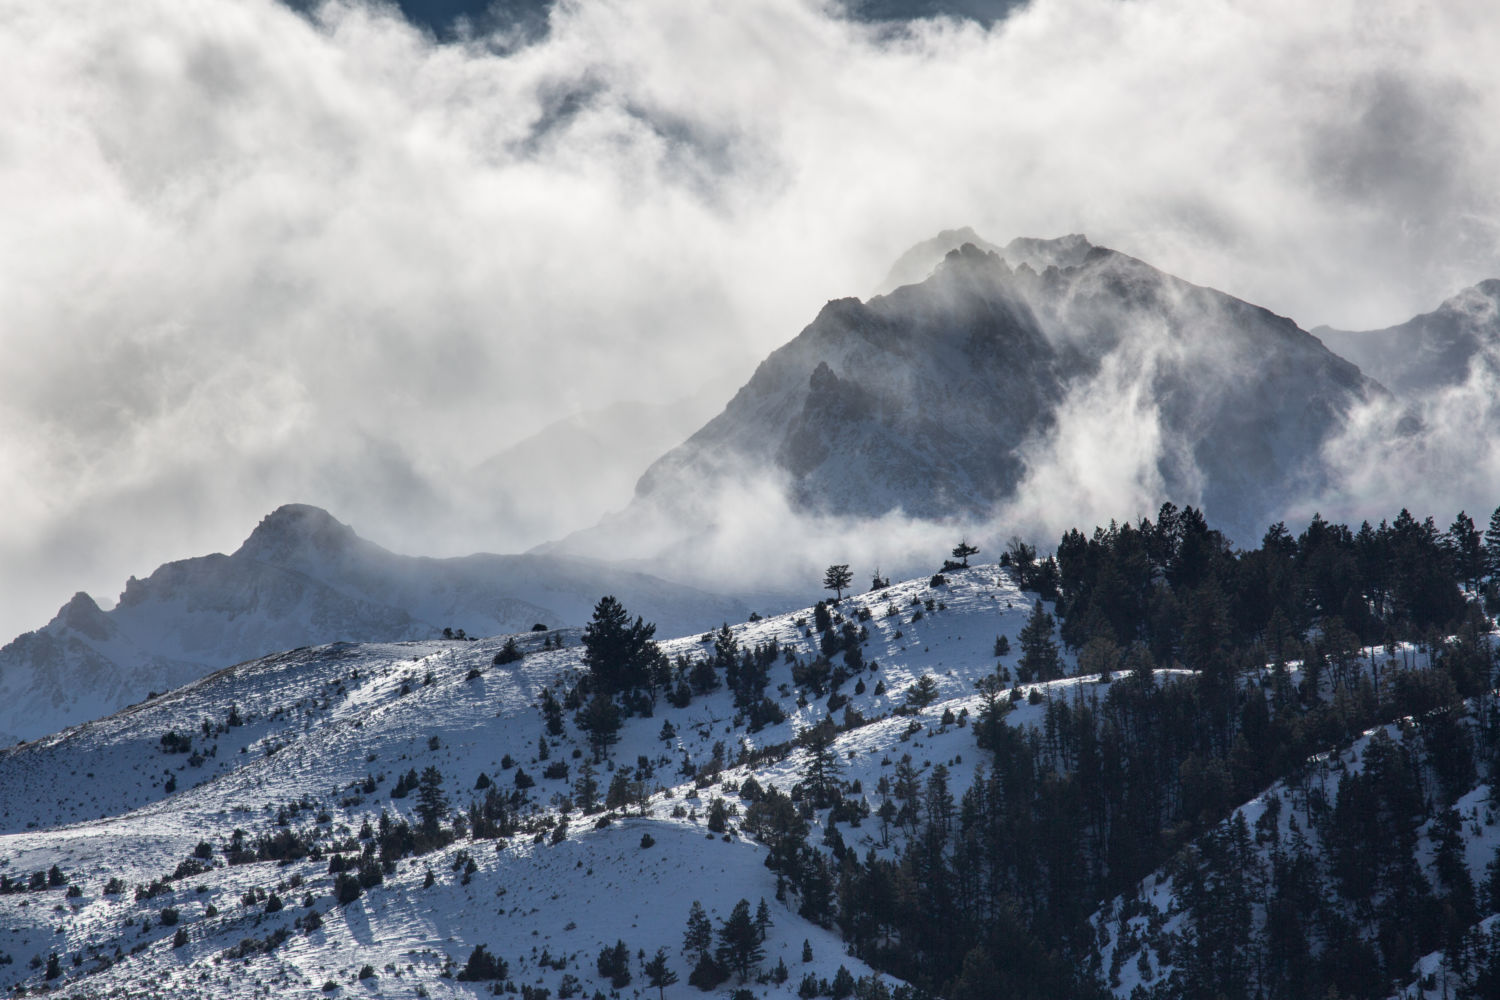
Electric Peak in Yellowstone National Park. Snowfall in the Yellowstone region has declined as a result of climate change. NEAL HERBERT / NATIONAL PARK SERVICE via Yale 360
“That’s a lens to look at the past,” said Shuman, who once trekked the 3,000-mile Continental Divide Trail to get a sense of the land. “If you add just a few degrees, you fundamentally alter things. When you walk across these high mountains, you can see they used to be covered in glaciers. It’s like walking in the ruins of Ancient Rome. That Ice Age world was only 5- to 7-degrees F colder than the pre-industrial era.”
“The water in those mountains is the water supply of the West and it’s drying up,” said Shuman.
In Yellowstone, the threat to human health and livelihoods may be the strongest incentive to take steps to soften the blows from climate change.
“Water is the thing everyone is most concerned about, and in general, people are receptive,” said Shuman. “Our economic future depends on adjusting.”
Just how the residents of the Greater Yellowstone Area will adapt is an open question, but researchers say that acknowledging the myriad problems that are now daily realities for many, from ranchers to anglers, is the first step toward a productive dialogue.
As the West experiences a growth surge, Cam Sholly, Yellowstone National Park’s superintendent, writes in the report that “the strength of local and regional economies” hangs in the balance if no steps are taken to rein in global warming.
Said Whitlock of Montana State, “When you think about the temperature curve that looks like a hockey stick, my parents pretty much lived on the flat part of the curve, I’m on the base, and my grandkids are going to be on the steep part. Our trajectory depends on what we do about greenhouse gases now. By 2040, 2050, we can flatten the curve. But the business-as-usual trajectory, 10 to 11 degrees of warming in Yellowstone and much of the West — what we do in the next decade is critical.”
The Greater Yellowstone Area includes both Yellowstone and Grand Teton national parks, as well as surrounding national forests and federal land. National Park Service
Grand Prismatic Spring Yellowstone National Park. Photo credit: Pixabay via NOAA
In Yellowstone National Park. Photo credit: Pixabay via NOAA
Yellowstone Falls photo credit Abby Howe via the Department of Interior.
As things stand with the El Niño-Southern Oscillation (ENSO), neutral conditions are currently present in the tropical Pacific and favored to last through the North American summer and into the fall. But forecasters at NOAA’s Climate Prediction Center have issued a La Niña Watch, which means they see La Niña likely emerging (~55%) during the September-November period and lasting through winter.
June 2021 sea surface temperature departure from the 1991-2020 average. Image from Data Snapshots on Climate.gov.
Where we are:
I know you’re all excited for me to talk about La Niña, but I’m a killjoy, so bear with me for a second while I talk about the current state of the Pacific. In June, ocean surface temperatures were near the 1991-2020 average across the equatorial Pacific, including the all-important Nino3.4 region (check out this post for more on ENSO indices), which we use to monitor the state of ENSO. Specifically, the June sea surface temperature in the Nino3.4 region was 0.25 degrees Celsius below average, well within the ENSO-neutral range. Ocean temperatures in this region have been quickly returning to near-average conditions over the last several months, increasing by nearly half a degree Celsius since April and over a degree Celsius since last winter’s La Niña peak.
But as we have said, so many, many times: there is more to ENSO than just the surface of the ocean. Putting on our snorkels, let’s dive beneath the surface of the Pacific, where things aren’t as near average but still firmly indicative of an ENSO stuck in neutral. Waters were slightly warmer than average, except for the eastern Pacific where cooler-than-average waters developed near the thermocline—the layer of water that marks the transition between the warmer upper ocean and colder deeper ocean. But overall, nothing to write home about.
To finish off this trilogy of signs about our current ENSO-neutral Pacific, we look to the skies! After all, ENSO is a coupled atmosphere/ocean climate phenomenon. And for the past month, that atmosphere has been pretty darn neutral. Winds at both low and high levels of the atmosphere were pretty normal, and while thunderstorm activity was reduced near the dateline, things were mostly average elsewhere.
There hasn’t been a more boring trilogy since Star Wars episodes 1-3 (yeah…I said it). But then again, that’s expected during neutral ENSO conditions across the Pacific.
The official CPC/IRI ENSO probability forecast, based on a consensus of CPC and IRI forecasters. It is updated during the first half of the month, in association with the official CPC/IRI ENSO Diagnostic Discussion. It is based on observational and predictive information from early in the month and from the previous month. Image from IRI
Where we’re going:
It might seem odd, then, with things seeming so… blah… that a La Niña Watch has been issued. To clarify, a La Niña Watch means conditions are favorable for the development of La Niña within the next six months. So, what’s in the climate model “tea leaves” that has helped scientists feel comfortable enough to start throwing the La Niña label around?
The answer, in part, lies in a strong computer model consensus. While most of the models we look at predict ENSO-neutral to continue to last through fall, many models from the North American Multi-Model Ensemble (NMME) favor a transition to La Niña during the fall and into winter. The NMME is incredibly helpful to forecasters in predicting the future state of ENSO, especially when we are past the notorious spring barrier, a time when model accuracy wanes.
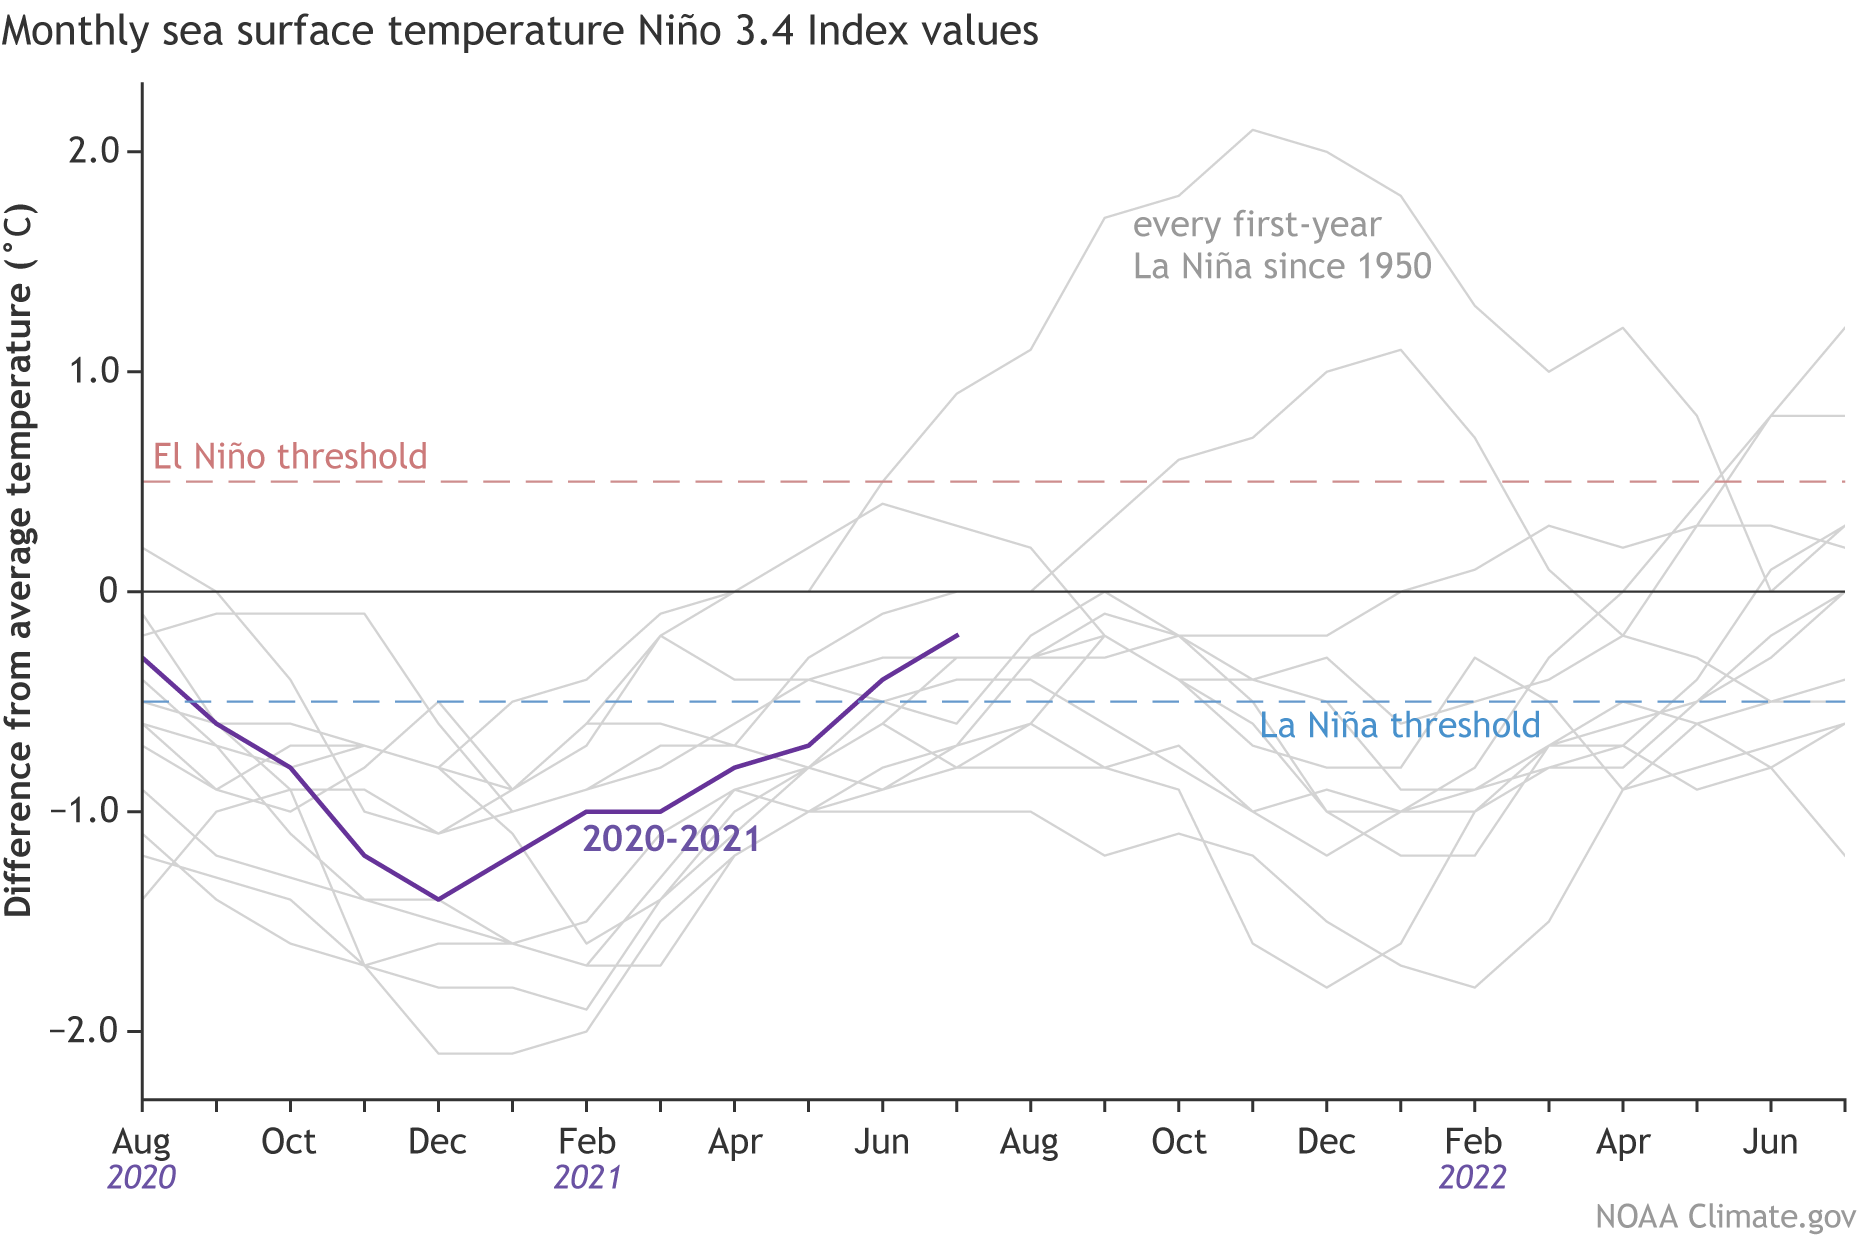
Monthly sea surface temperature anomalies (difference from average) in the Niño 3.4 region of the tropical Pacific for 2020-21 (purple line) and all other years starting from first-year La Niña winters since 1950. Climate.gov graph based on ERSSTv5 temperature data.
Where’s the beef?
Is it all that unusual to have two La Niña winters back-to-back? Nope! In fact, of the twelve first-year La Niña events, eight (!) were followed by La Niña the next winter, two by neutral, and two by El Niño. Honestly, with those numbers, it would have been more surprising if we thought neutral conditions would continue all year.
Putting all of those 12 first-year La Niñas together with 2020-2021, it’s evident how much this last year doesn’t stand out. Though, twelve past cases are not a ton to rely on by itself. This La Niña Watch is buoyed by much more than that.
One specific reason why and when any change to ENSO is important is the potential influence on the Atlantic and eastern Pacific hurricane season. As noted on the ENSO Blog in the past, La Niña can help make atmospheric conditions more conducive for tropical cyclones to form the Atlantic, and less conducive in the Eastern Pacific. If 2021 so far is any indicator, it could be an active year: through the beginning of July, five named storms in the Atlantic have already formed, a new record—breaking the previous record set just last year. In August, the Climate Prediction Center will issue an updated hurricane outlook, so stay tuned for more info on that. In the meantime, you can read the outlook from May to see what scientists were thinking two months ago.
FromE&E News (Thomas Frank) via Scientific American:
The extreme dry conditions threaten crops and raise wildfire risks
The western United States is experiencing its worst drought this century, threatening to kill crops, spark wildfires and harm public health as hot and dry conditions are expected to continue this month.
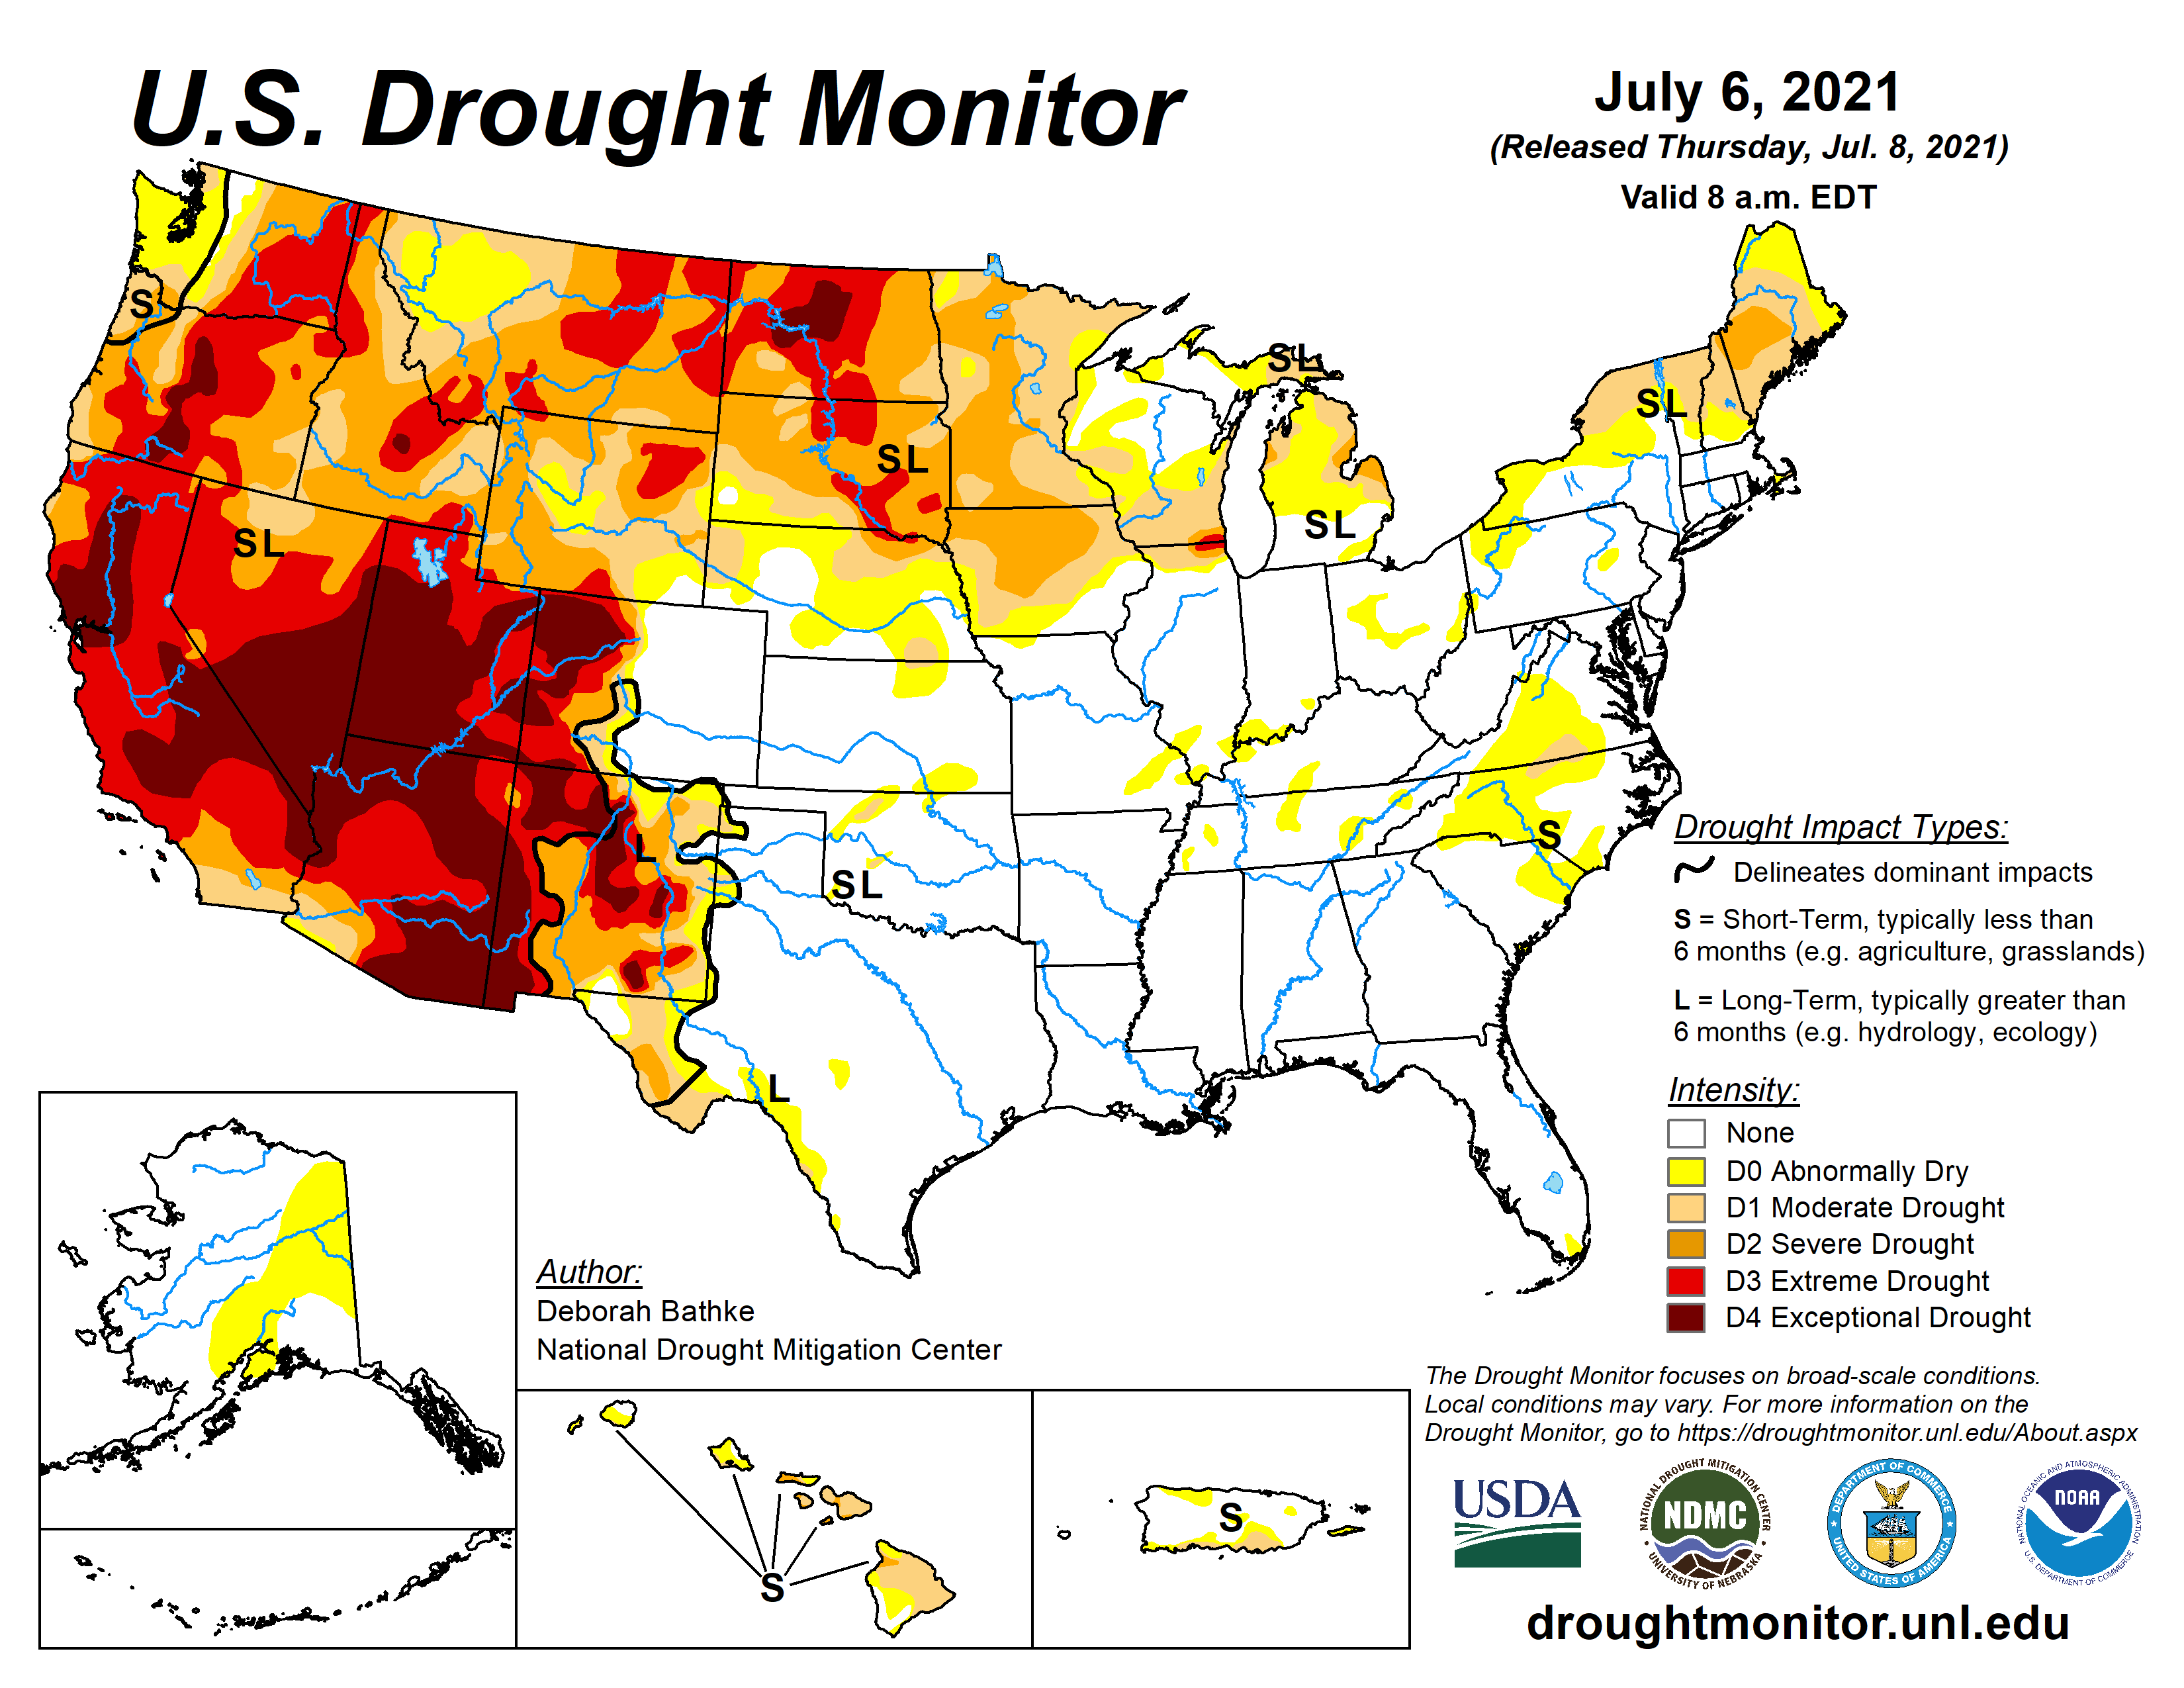
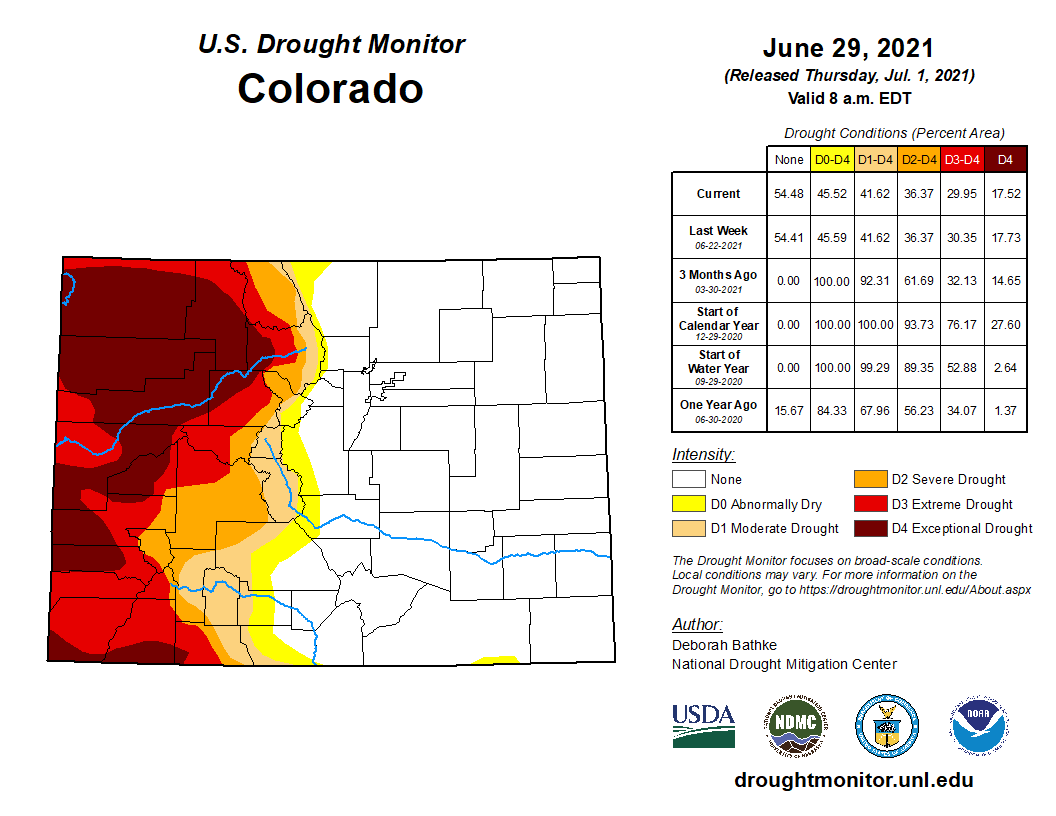
More than 93% of the land in seven Western states is in drought conditions, and nearly 59% of the area is experiencing extreme or exceptional drought—the two worst conditions—according to the latest figures released by the U.S. Drought Monitor.
Both figures are the highest this century for the area that covers all of Arizona, California, Idaho, Montana, Oregon, Washington and most of Utah.
Before this year, the record for the amount of Western land in extreme or exceptional drought was 43%, set in September 2003.
The conditions have led to fire and fishing restrictions across the West and have prompted wildfire alerts. The National Interagency Fire Center is warning that the intensifying drought across the West is creating significant wildfire risk over the next three months from California to the Northwest and across the northern Plains…
US Drought Monitor map July 6, 2021.
Agriculture Department reports show that several crops, including wheat, sunflowers and barley, are threatened by the extensive drought, which is concentrated in the West but is also affecting areas as far east as the Dakotas, Minnesota and Iowa…
Although drought conditions have been exacerbated by recent record temperatures in the West, Kluck said the current drought has been developing since the spring of 2020.
Colorado’s Congressional delegation moves legislation to help address climate crisis
The news about the climate crisis is bleak. The summer started with most of the nation gripped by heat waves smashing records across the continent. Once again the hurricane season is off to a historic start with the earliest fifth-named tropical storm. Last year was the worst fire season that the U.S. West has seen in decades, if not hundreds of years, and this year is likely to be at least as bad. Major rivers are drying up.
We are in a climate emergency and western Colorado is square in the cross-hairs. The alarm is sounding: We must act now, in an urgent and unprecedented manner.
he Gunnison Basin is facing a climate emergency, putting our farm and food systems at severe risk. This map shows the warming that has already occurred in this Gunnison watershed since 1895. It is from our upcoming report on climate change in the region and some steps to take to avert worsening harm. Graphic credit: The Washington Post via the Colorado Farm & Food Alliance
Climate action, generally speaking, needs to do three things to reverse a descent into even greater ecological and social calamity. Importantly, we cannot trade one for the other, which is a bait and switch tactic some industry boosters are now pushing. We need an “all of the above” climate plan (to borrow a favored fossil fuel phrase). We cannot get by pretending, as the erstwhile denialists cum begrudging believers ask us to do, that some new fix will allow business to continue as usual. Instead, we must transform our practices and businesses to meet the needs of this moment.
We need to act, across all sectors, to:
Curb climate pollution.
Keep and return carbon in (to) the ground.
Adapt human systems to be climate-smart and restorative.
These necessary goals are both daunting and full of opportunity. They point to big and rapid change. But each also has the potential to inspire all manner of innovative technology, entrepreneurship, and solutions. So we cannot wait to get started. First we must stop adding to the problem.
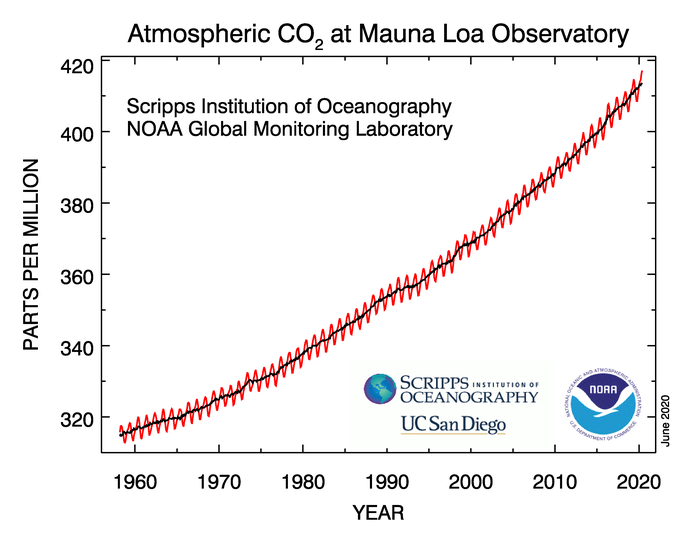
The carbon dioxide data on Mauna Loa constitute the longest record of direct measurements of carbon dioxide in the atmosphere. C. David Keeling of the Scripps Institution of Oceanography began measurements in 1958 at the NOAA weather station. NOAA started its own CO2 measurements in May of 1974, and they have run in parallel with those made by Scripps since then. Credit: NOAA and Scripps Institution of Oceanography.
This year atmospheric concentrations of carbon dioxide have reached toward 420 ppm. Many places are already experiencing heating above the 1.5 degree threshold we are to avoid, as set by international accord. Ice caps, permafrost and glaciers are melting, sea levels rising, biological diversity collapsing: the ecological systems that have long allowed human civilization to flourish are in severe crisis. There is no time to paper over or “both sides” the situation we are in: If we do not act boldly and quickly, our livelihoods, our businesses, and our ability to prosper in the U.S. Southwest are all at severe risk.
The action required is monumental and we should not shy from declaring it as such. And just acknowledging that and reversing course can signal a shift in momentum. But the effort needs to accelerate if we are to avoid even more damaging heating ahead.
We cannot claim to be moving forward if for every small step ahead we continue to take several back. Fortunately in Colorado we do have elected leaders who are at least taking these first steps. So we want to acknowledge these action and encourage more that must follow. And we should stay on guard for back-sliding or double-speak.
Colorado Congressional Leaders Take Action
The Grand Junction Sentinel reported, in a June 23rd article by reporter Dennis Webb that “U.S. Sen. Michael Bennet, D-Colo., is again pushing for passage of bills that would boost funding for cleanup of abandoned, or orphaned, oil and gas wells on federal lands and boost the opportunities for public comment when federal oil and gas lease sales are proposed.”
And last week, President Biden signed a law limiting methane pollution from oil and gas on public lands, a bill sponsored by Colorado congresswoman Diana DeGette. CNN reported: “President Joe Biden on Wednesday signed a bill repealing a Trump-era rule that rolled back regulations on methane emissions — a particularly potent greenhouse gas believed to contribute significantly to the climate crisis — from the oil and gas industries. The President described the bill as an “important first step” to cut methane pollution and said it “reflects a return to common sense and commitment to the common good.”
We applaud these steps. But it must be just the start of an “all of the above” approach to climate action if we are to avert worsening catastrophe. And we must make sure that we are not making the problems worse. Our priorities for public lands should be on conservation and restoration. We should limit the further expansion of fossil fuel development.
The first bill introduced by Sen. Bennet would increase bonding and clean-up requirements for oil and gas on public lands. This may seem minor, but is a critically important fix to a badly broken system. Our public lands fossil fuel leasing and development programs have long put the interests of corporations ahead of both the health of the lands and the interests of the public — and the public ends up paying for it, time and again.
The second piece of legislation from Sen. Bennet improves public oversight and community involvement processes around the oil and gas programs. This too is a small, but vitally important, step. It would begin to re-center community concerns–including the need to address the climate crisis– in public lands management. For too long the scales have been tipped toward the oil and gas industry.
That is why the Colorado Farm & Food Alliance recently issued a statement in support of Senator Bennet’s bills which would start to re-balance the scales in favor of the public, toward greater accountability, and in favor of resource protection.
The climate emergency is real and brings grave risk and an urgent need for action. We must move quickly away from fossil fuels. An obvious place to start is with our public lands, which provide so much from water sources, to critical wildlife lands and popular recreation areas. We have an opportunity to to rethink the purpose of these cherished lands and to model the leadership needed to take the climate crisis head on.
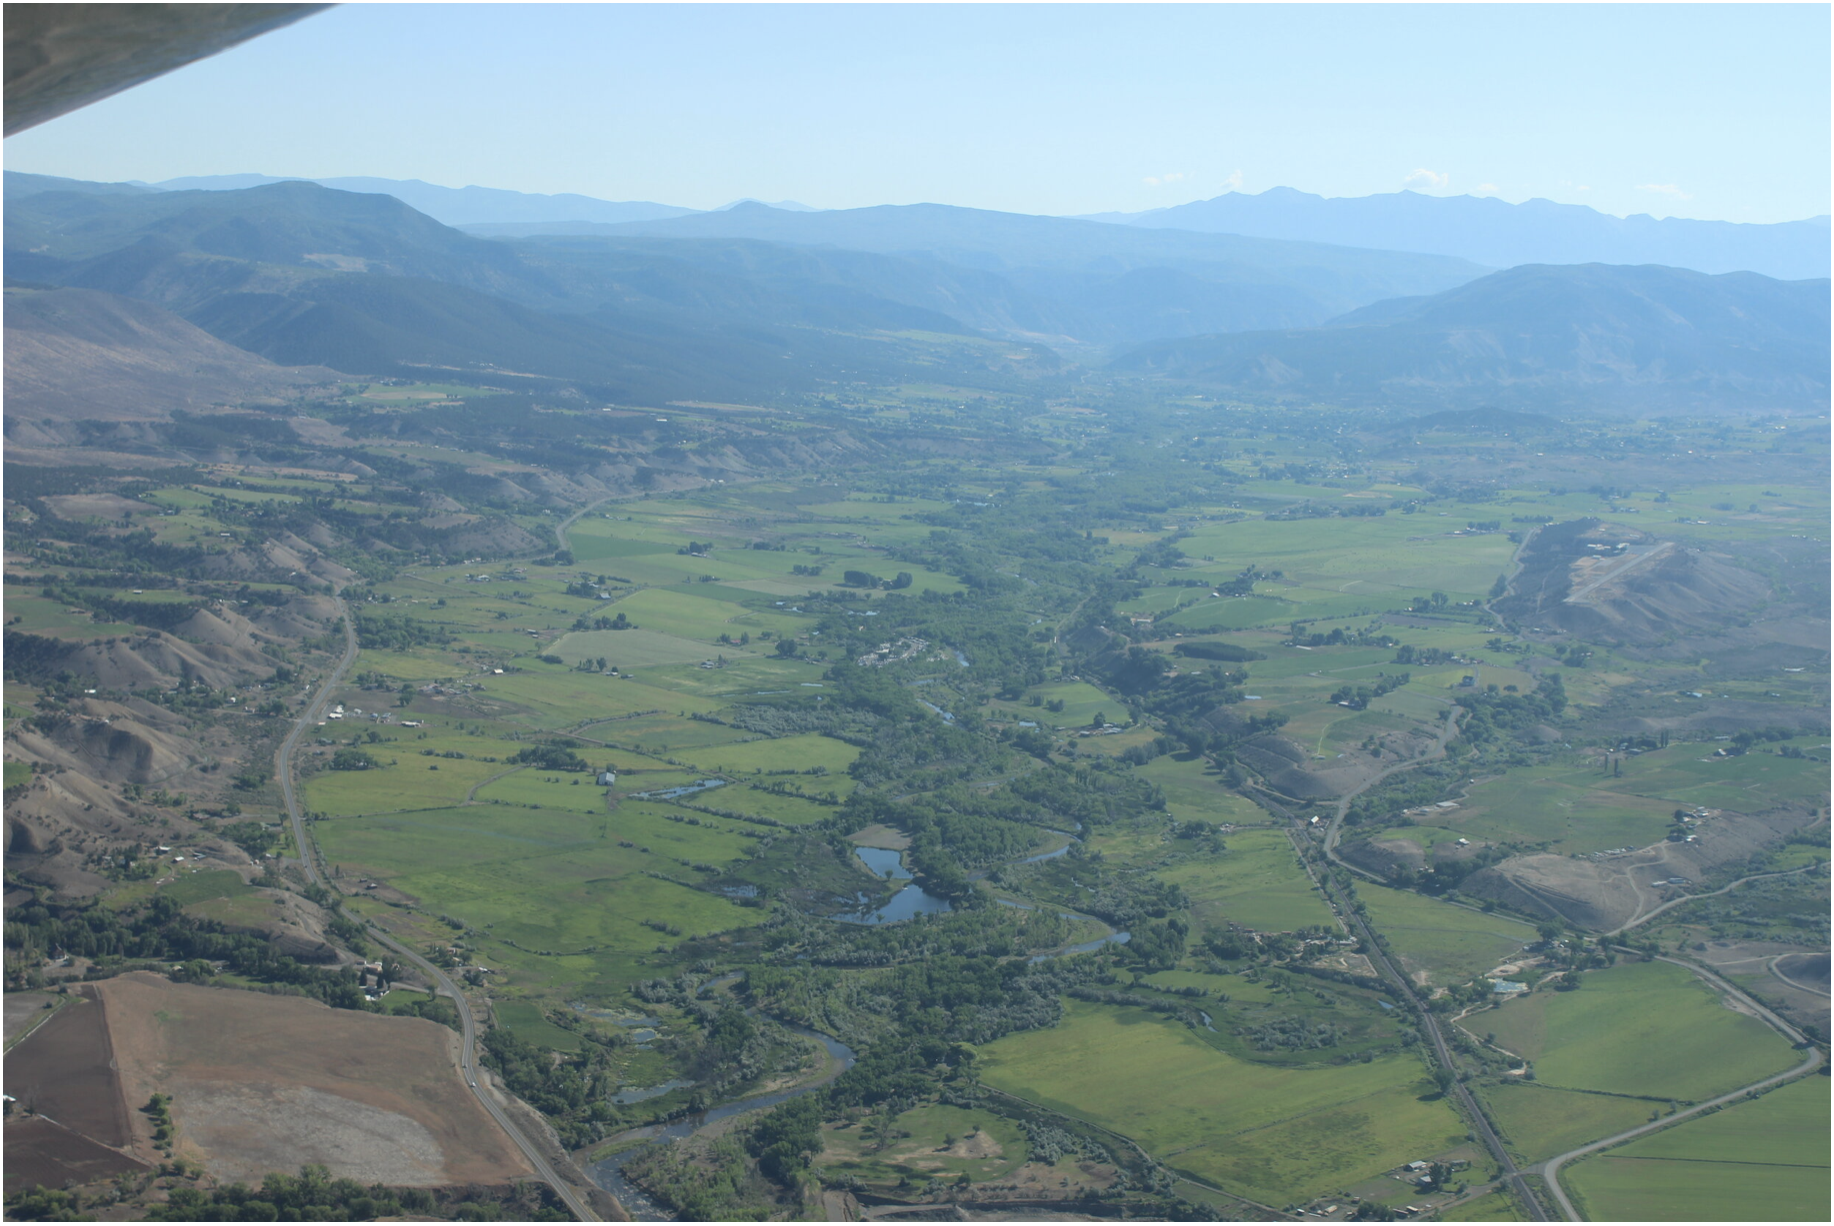
Agriculture in the U.S. Southwest is at high risk from the impacts of climate change. EcoFlight photo of the North Fork Valley by the Western Slope Conservation Center.
The International Energy Agency has noted: “A rapid shift away from fossil fuels [is required].
While these three acts, one now law and two others pending, before Congress are just tweaks to the federal land oil and gas program — they add critical side-boards that will limit the expansion and harm of this activity on our National Forests and other public lands. Still, we must do much more, and continue to enact reforms that move us rapidly beyond fossil fuels and curtail the further expansion of this activity on public lands.
“Net zero means huge declines in the use of coal, oil and gas. …[Efforts must] include, from today, no investment in new fossil fuel supply projects….” — The International Energy Agency
Because, if we are serious about responding to the Climate Emergency then it is time we act like it.
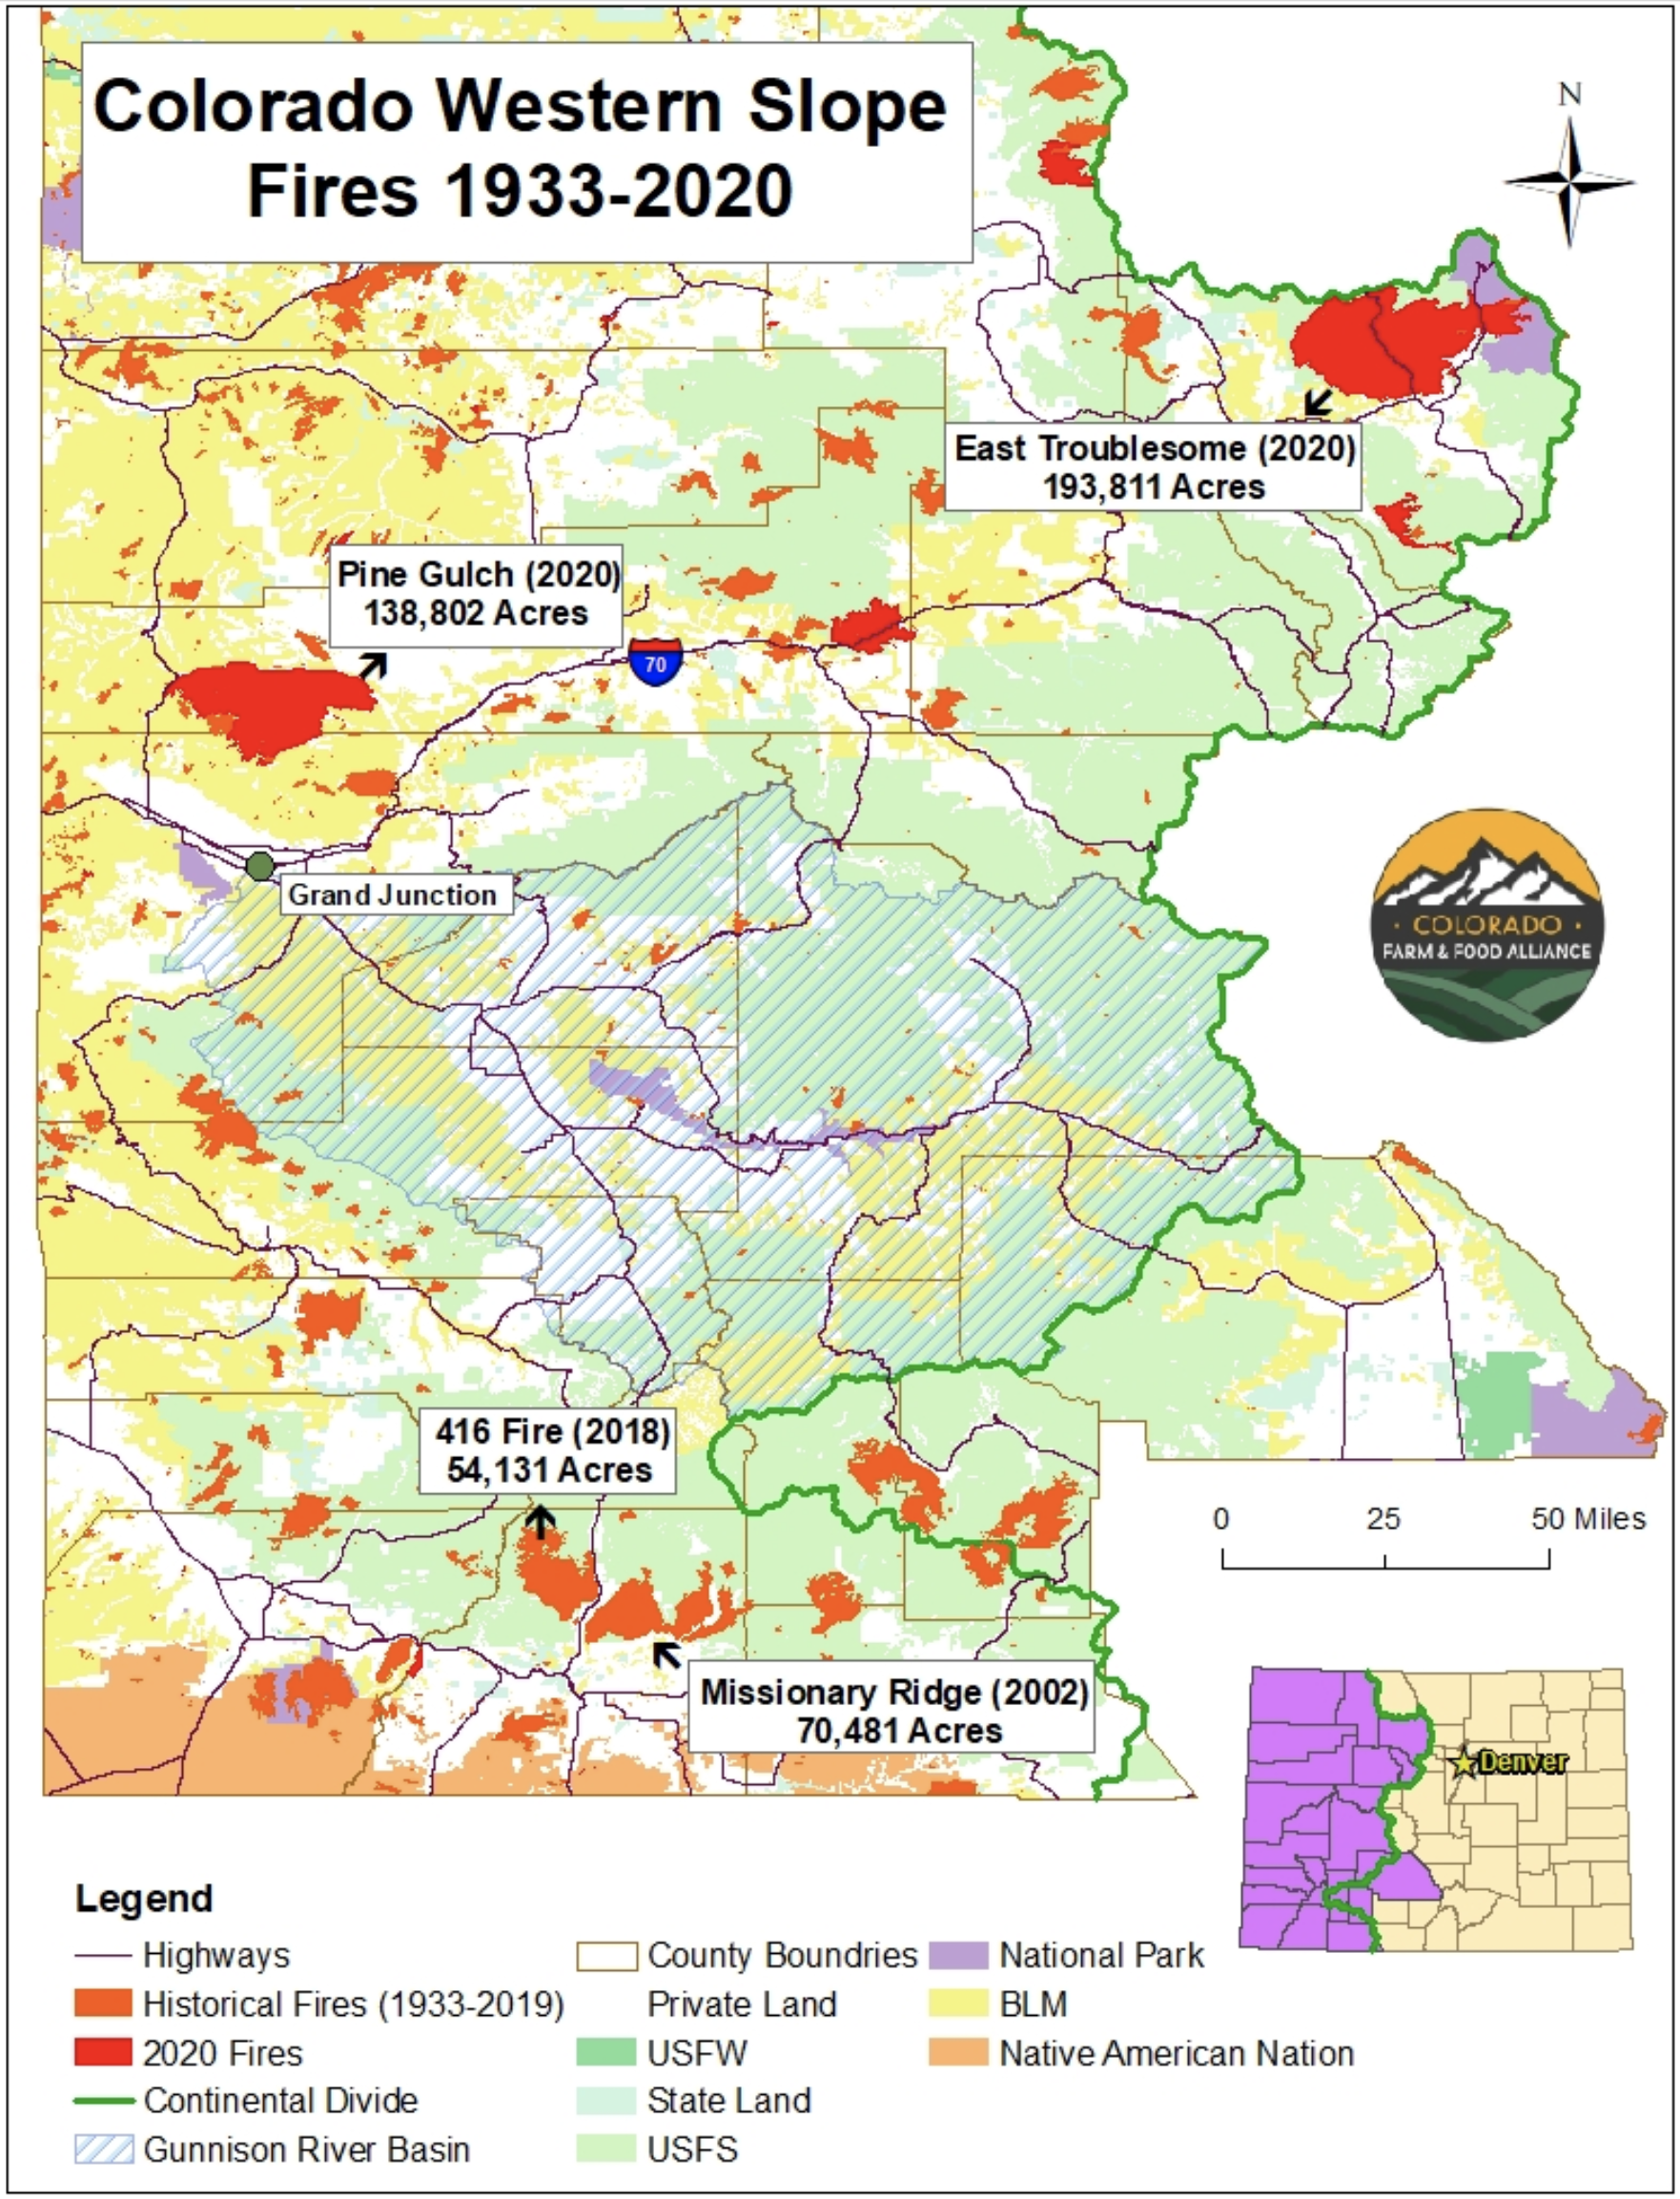
Wildfire season is becoming longer and worse across the West as the twin effects of heat and drought but more forests and grasslands at risk. This map from our up-coming report depicts the changing patterns of fire on the Western Slope since 1933.
Brad Udall on twitter yesterday ran through a striking series of graphs of the current state of the Colorado River. With his permission, I’m posting them here along with a slightly polished version of his accompanying commentary. Some key points that grabbed my attention:
Second-lowest Powell inflow in a period of record we use dating to 1964.
Risk of Powell dropping next year to levels that could jeopardize power production.
Risk of Mead dropping low enough in the next 18 months to trigger much deeper “Tier 2” reductions to Lower Basin water users in 2023.
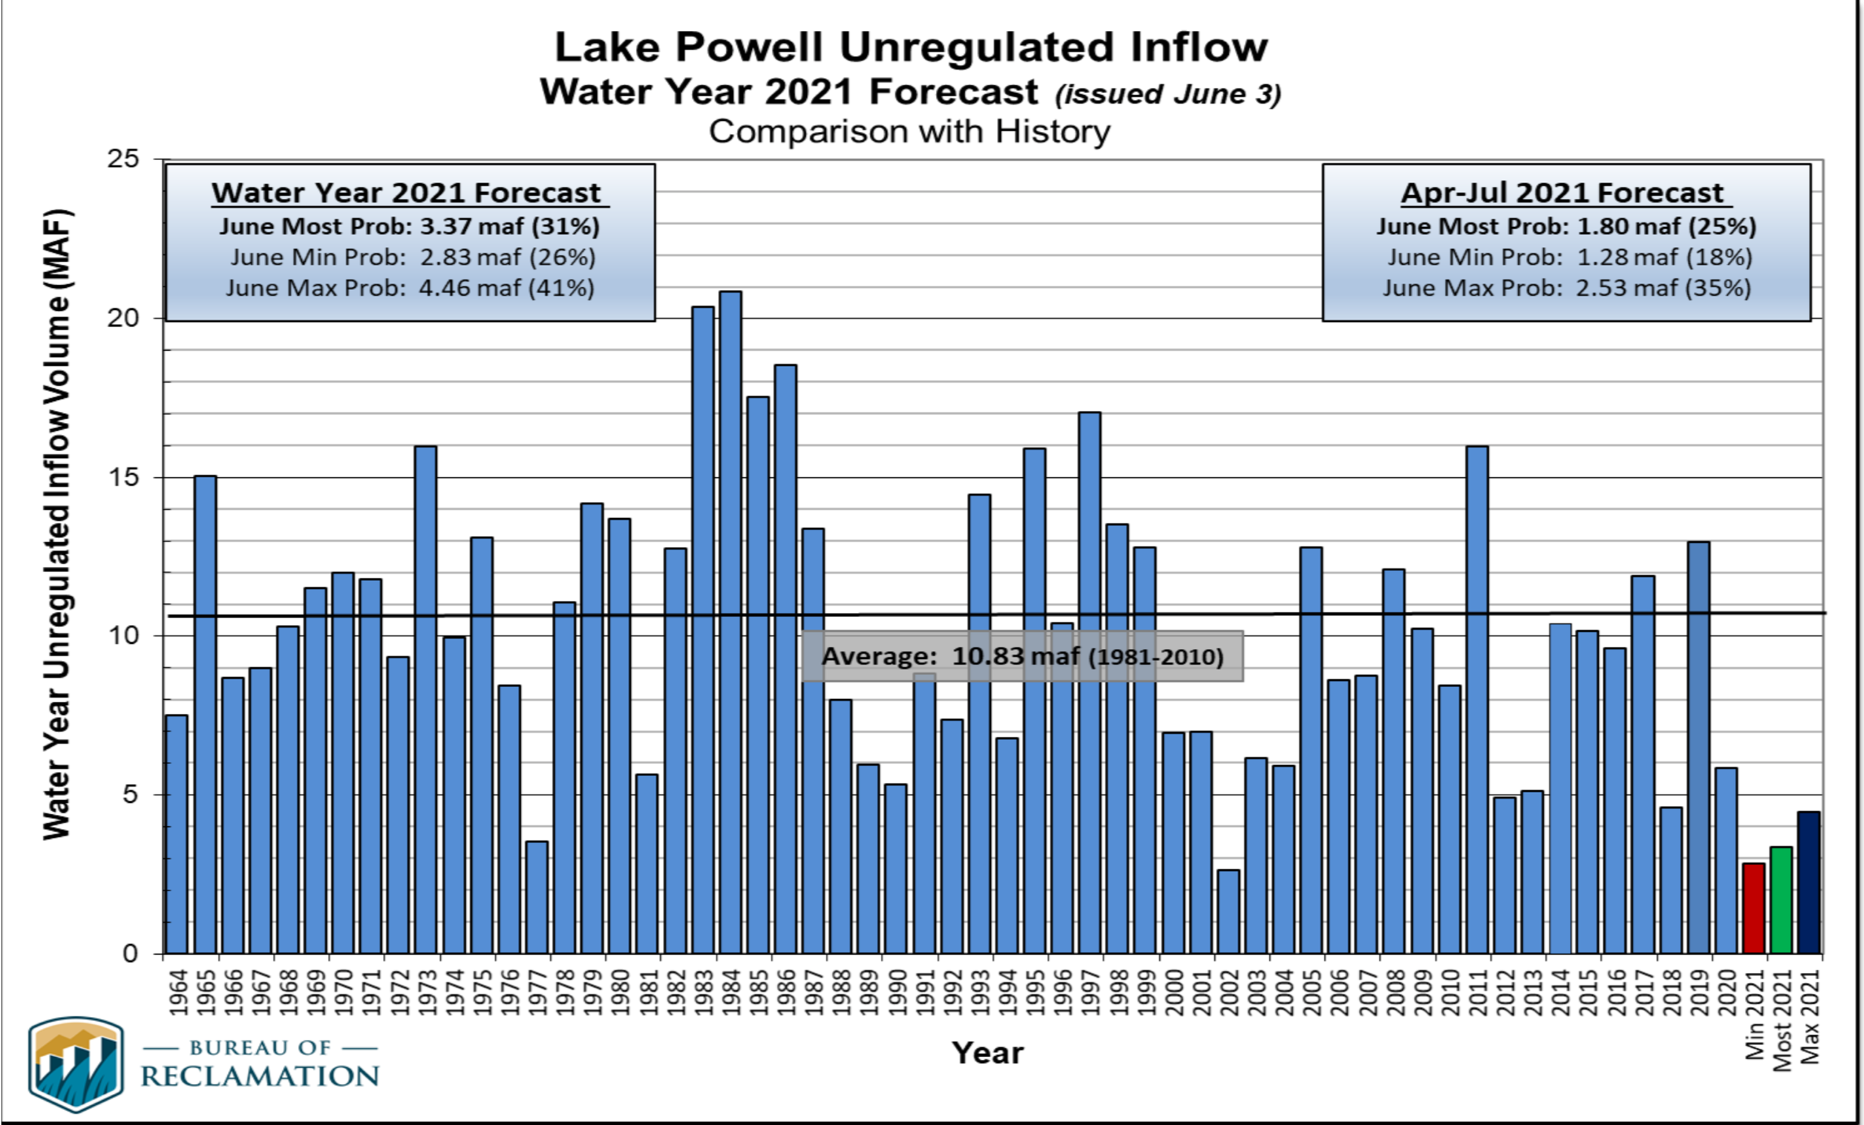
Reclamation’s ‘unregulated inflows’ into Lake Powell show that 2021 will be the 2nd worst year after only 2002 going back to 1964. 2021 will be the RED bar most likely. This is a really grim year for runoff.
Graphic credit: Bureau of Reclamation via Brad Udall
2021 inflow will be only ~3 maf, compared to the 1981-2010 average of 10.3 maf or the 2000-2021 average of 8.3 maf (20% less than 1981-2010 average).(maf = million acrefeet)
Considering that Powell will release or lose to evaporation ~ 8.5 maf, the lake will lose ~ 5 maf this year or ~55 feet of elevation.
April 2021 snowpack above Powell peaked at ~85% of normal but will generate about 25% of normal river flow. This comes on top of April 2020 snowpack of 100% of normal that generated about 50% of normal flow.
Declining runoff efficiency has been noted in multiple peer-reviewed studies. For a recent overview of recent climate change studies on the Colorado River see this written with Jonathan Overpeck:
Jeff Lukas points out that the twitter thread implied that the low runoff efficiency this year as measured by runoff as a percent of snowpack is all due directly to warming. I did not mean to imply that. The low runoff percent numbers are much more a function of (1) very low spring precipitation in both 2020 and 2021 and to a lesser extent (2) low soil moisture from the previous year. It may be that there is a human-caused connection to the low spring precipitation although there’s no real evidence of this yet. Low soil moisture in the springs of 2020 and 2021 is definitely connected to dry and very warm late summer and early fall from the previous years. Teasing this apart to obtain the actual driver(s) is not simple. That said, no one should doubt that climate change is reducing the flows of the Colorado. Multiple peer-reviewed papers have now supported this finding.
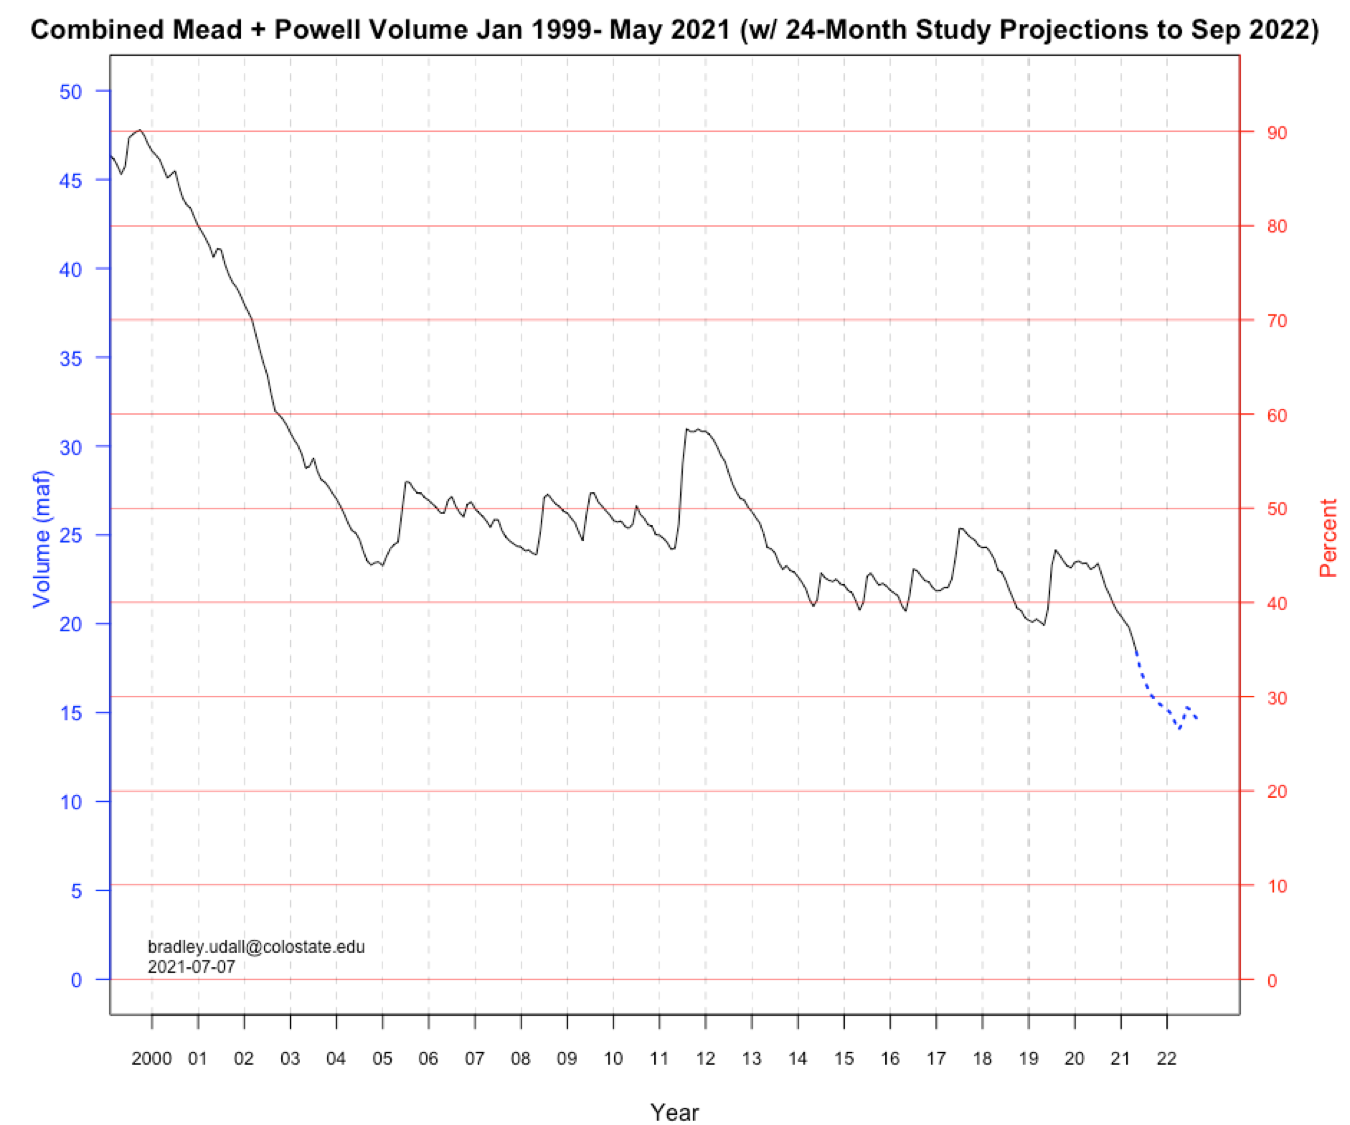
Here’s what’s going to happen to the nation’s 2 largest reservoirs because of this measly inflow:
Losses to Mead and Powell. Graphic credit: Brand Udall via InkStain
Note that combined contents will drop below 30% by late next year.
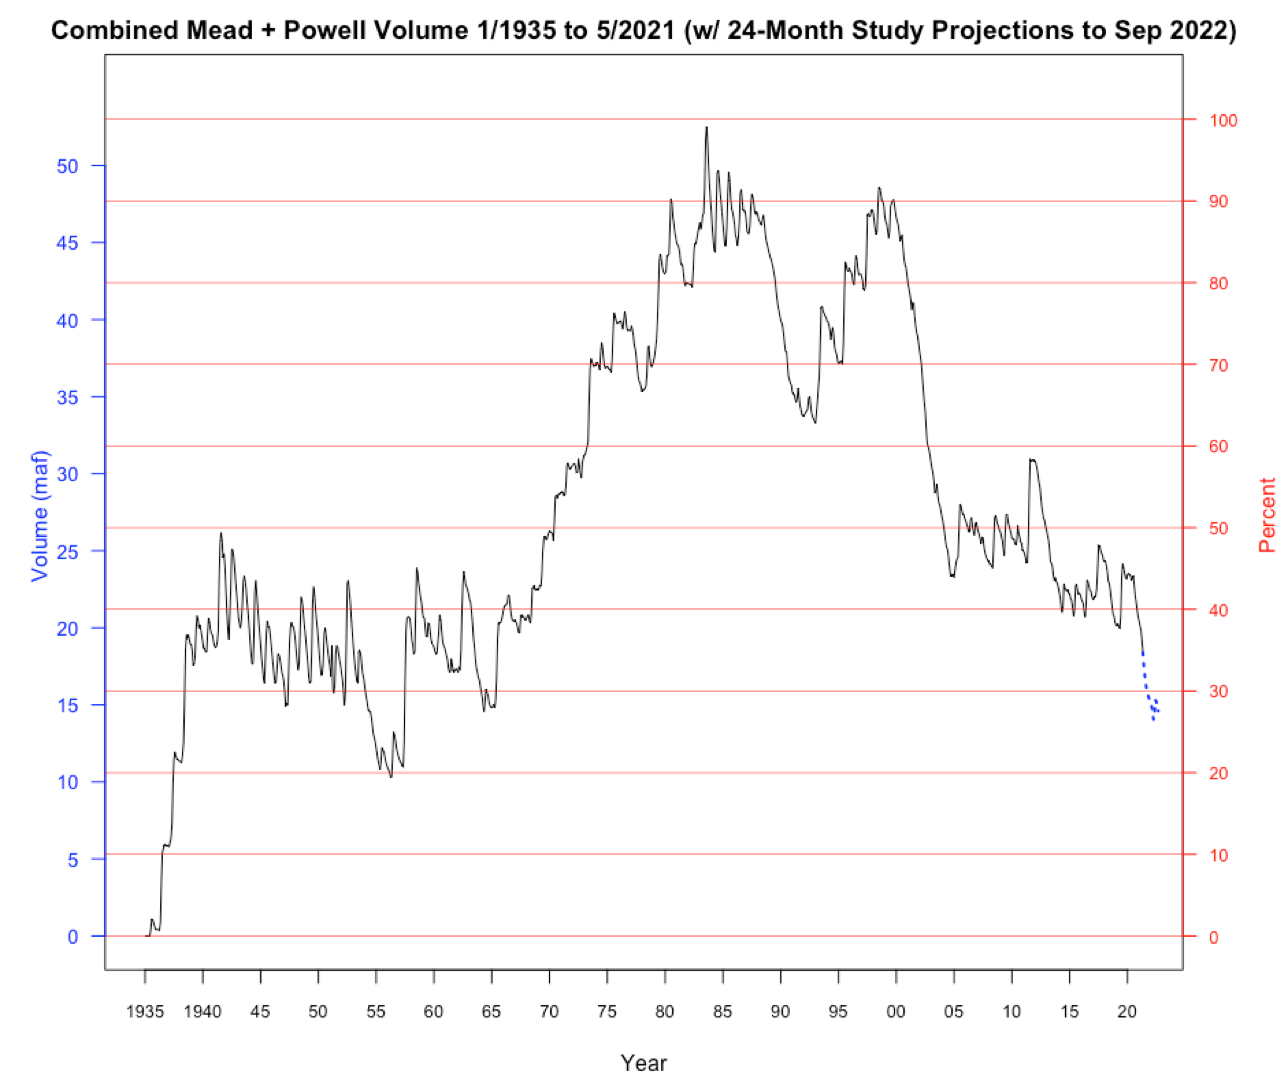
Here’s that decline for all years back to 1935 when Mead first filled. These two reservoirs will hold less water than Mead did alone in many years before 1964 when Powell was built.
Combined storage, Mead and Powell. Graphic credit: Brad Udall via Inkstain
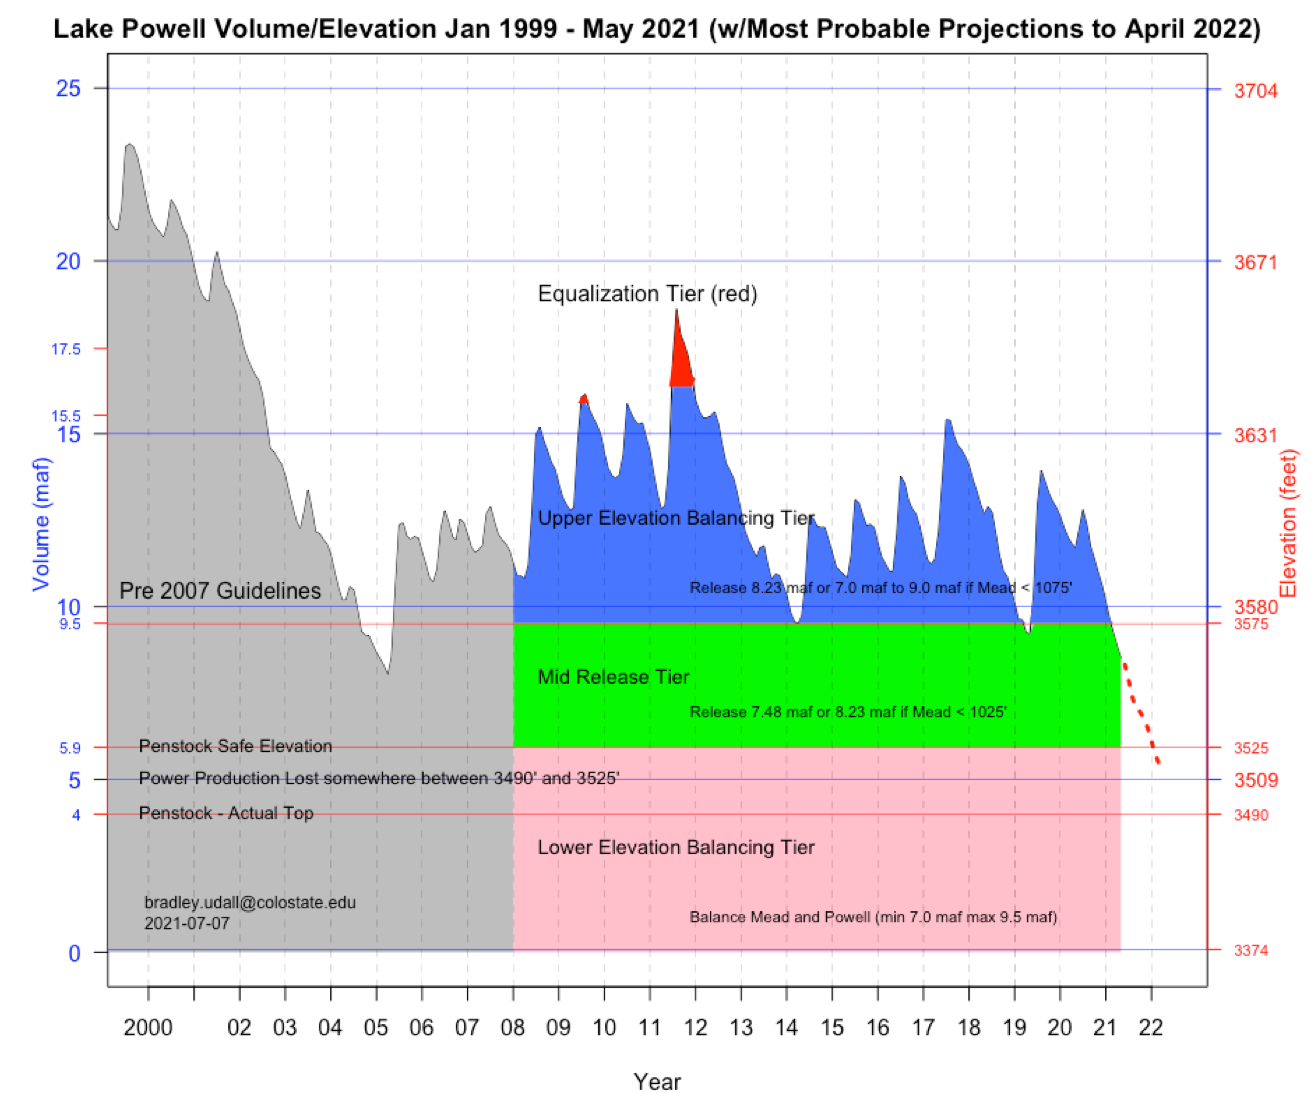
By next April Powell will hit 5.4 maf, ~185 feet below full. See Red dots. This will be the lowest since its initial fill in 1964. Since 1999, Powell will have lost ~18 maf, 75% of its contents.
Graphic credit: Brad Udall via InkStain
At 5.4 maf Powell could be low enough to lose the ability to generate power. (We’re uncertain about how penstocks operate when lake gets low — water in penstocks can not be aerated or turbine damage will occur.)
Loss of power, while not calamitous, is concerning. Power revenues fund environmental compliance and other important items in the basin.
As part of the 2019 agreement, the UB can release flows from reservoirs upstream of Powell to prop it up. But there is only about 5 maf for that all together. It is a one-shot deal.
We’ll have to wait on next winter to understand what happens after April of 2022. But 5.4 maf is very little water in a 25 maf reservoir.
So what about Lake Mead, the nation’s largest reservoir?
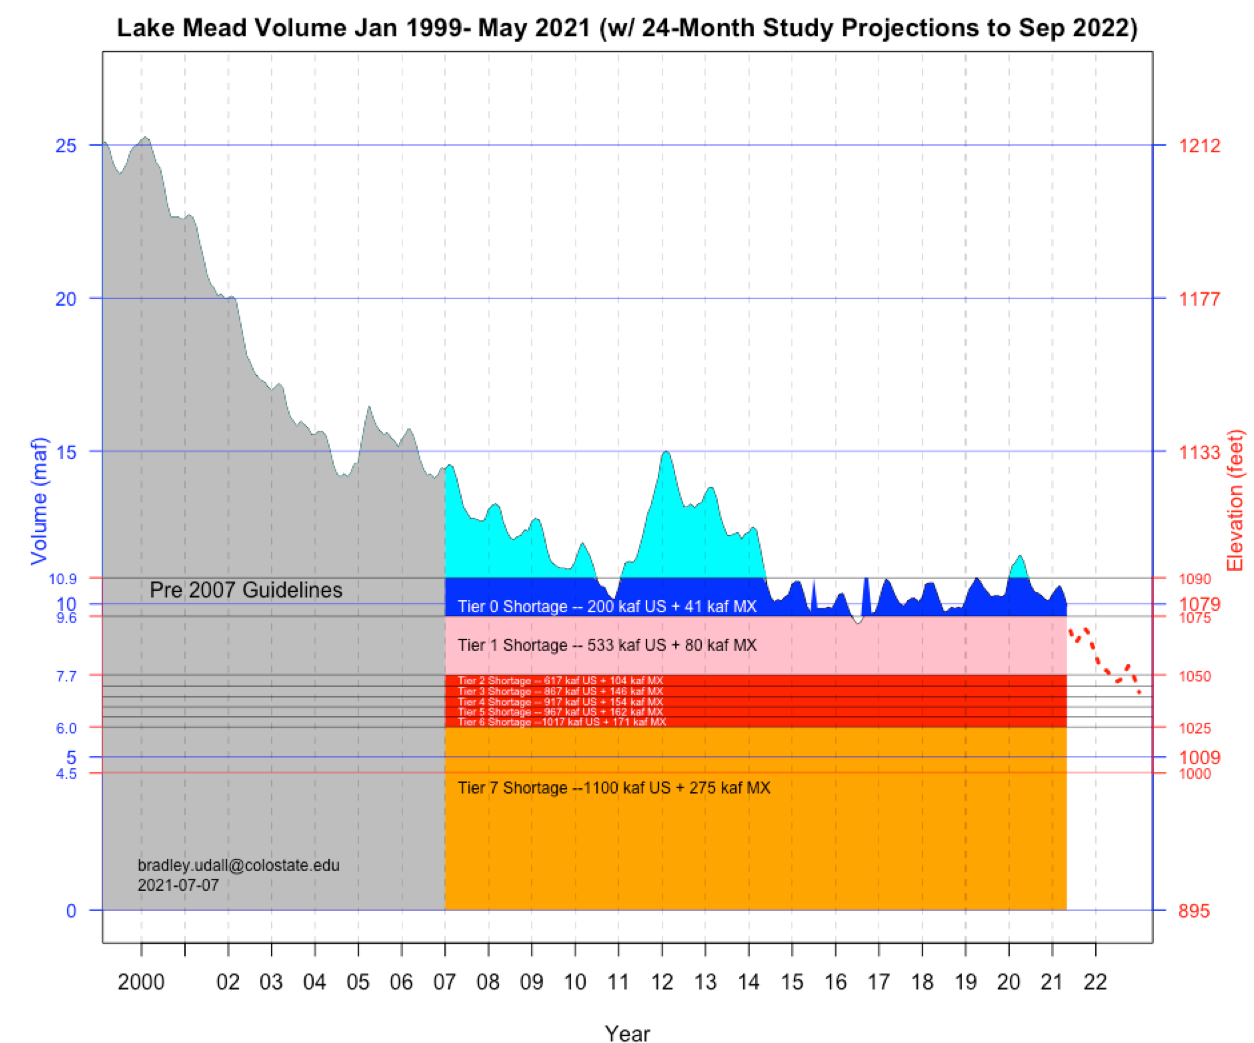
Reclamation’s current forecasts show January 1, 2022 elevation at 1065’ feet (8.8 maf) , well below the 1075’ needed to avoid a ‘Tier 1 Shortage’.
Decline of Lake Mead. Graphic credit: Brad Udall via InkStain
If it ends up below 1050’ on Jan 1 (as projected in August 2022), that will lead to a Tier 2 Shortage (total cutbacks of 721 kaf). Otherwise, Mead will face a 2nd year of Tier 1 shortages. Either way, this is not good.
Shared by seven states and Mexico, the Colorado Basin provides about 40 million Americans with a portion of their drinking water and irrigates up to 5.5 million acres.
It is home to endangered species and supports about $1.4 trillion in economic activity.
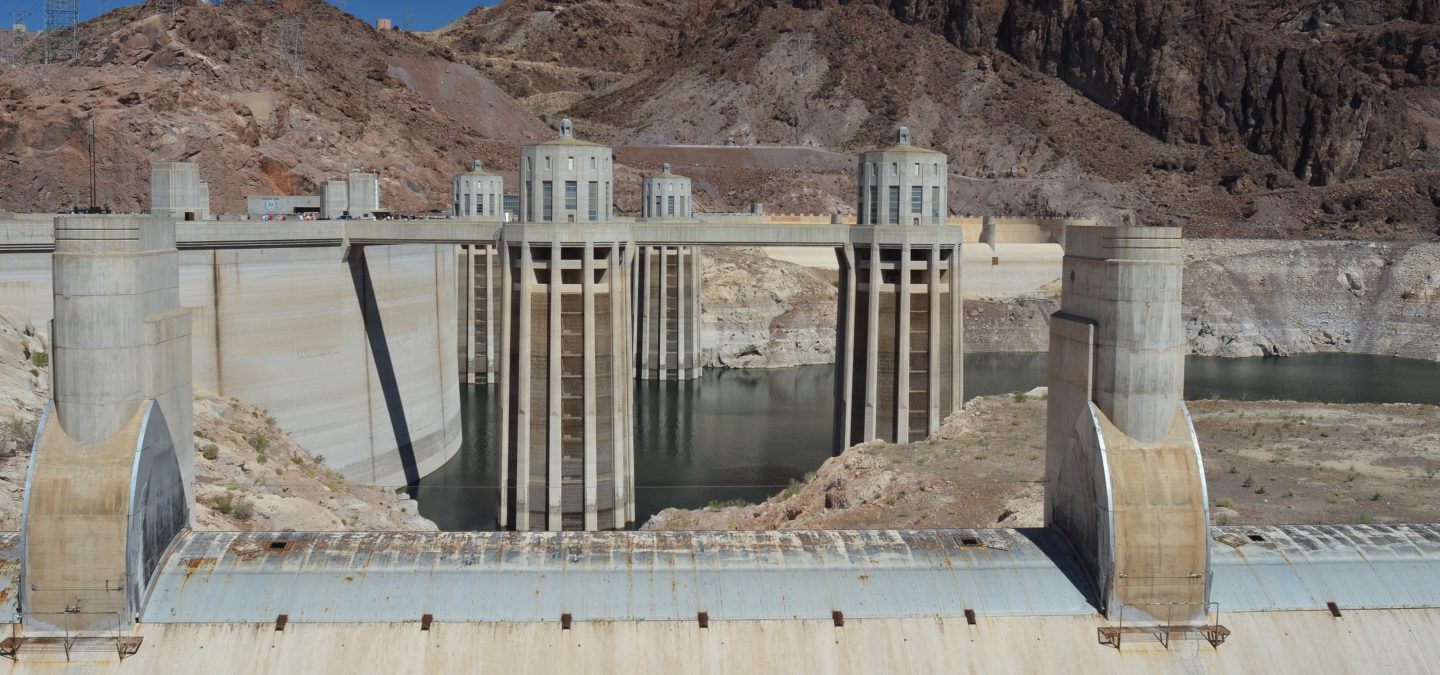
Because of record-high temperatures and a drying climate, the basin is also dangerously close to being parched: Lake Mead, which is just 36 percent full, is in poor health. So is Lake Powell, located upstream and only 34 percent full.
A complex and arcane water banking program in the lower Colorado River basin, adopted in 2007 and later amended, was designed to incentivize water conservation, prevent waste, and boost storage in a waning Lake Mead.
The program has already proved its worth, lifting Lake Mead dozens of feet higher than it otherwise would have been and nurturing collaboration among states that will need to work together to surmount daunting challenges of water availability. In the next two years, the program will be tested in another way, becoming a small but important source of water for Arizona and California even as the lake continues to fall to levels that haven’t been witnessed in several generations.
Water managers in the basin view the program, called intentionally created surplus or ICS, as a flexible tool for adapting to a drying climate. It is a tool that they will soon call upon. Bill Hasencamp from the Metropolitan Water District of Southern California, a large regional wholesaler, told Circle of Blue that the district intends to draw between 100,000 and 150,000 acre-feet from its savings this year.
Arizona officials, meanwhile, plan to use 69,100 acre-feet of ICS credits to reduce mandatory cutbacks that will be required in 2022 if Mead declines as projected. The state already used this maneuver to deal with a cutback last year, albeit in a smaller amount. Instead of taking a big cut in one year, ICS allows Arizona to “smooth the reduction,” as Chuck Cullom of the Central Arizona Project put it. CAP delivers the bulk of Arizona’s Colorado River allocation and is first in line in the state when cutbacks are required.
These amounts are small but significant, especially in these times…
At the same time that water users plan to tap their savings, scholars in the basin are calling for more analysis of the ICS program, especially as Lake Mead’s decline accelerates. They would like to check how the system responds to ICS use under a range of water supply scenarios.
Ever since the late-2000s, the last time that water supplies in Colorado River reservoirs reached critically low levels, the biggest water users in Arizona, California, and Nevada have been stashing water in Lake Mead, in preparation for another emergency to come — and in an attempt to avoid a catastrophic collapse of the region’s water storage system.
With the federal government now projecting that Lake Mead will drop precipitously in the next two years — perhaps to levels not seen since the Great Depression, when the country’s largest reservoir was first filled — that emergency has arrived.
“While Colorado River water users have invested billions of dollars to reduce consumption and increase resiliency, the situation we face today is real and urgent,” John Entsminger, the general manager of the Southern Nevada Water Authority, said at a House Natural Resources subcommittee hearing on May 25…
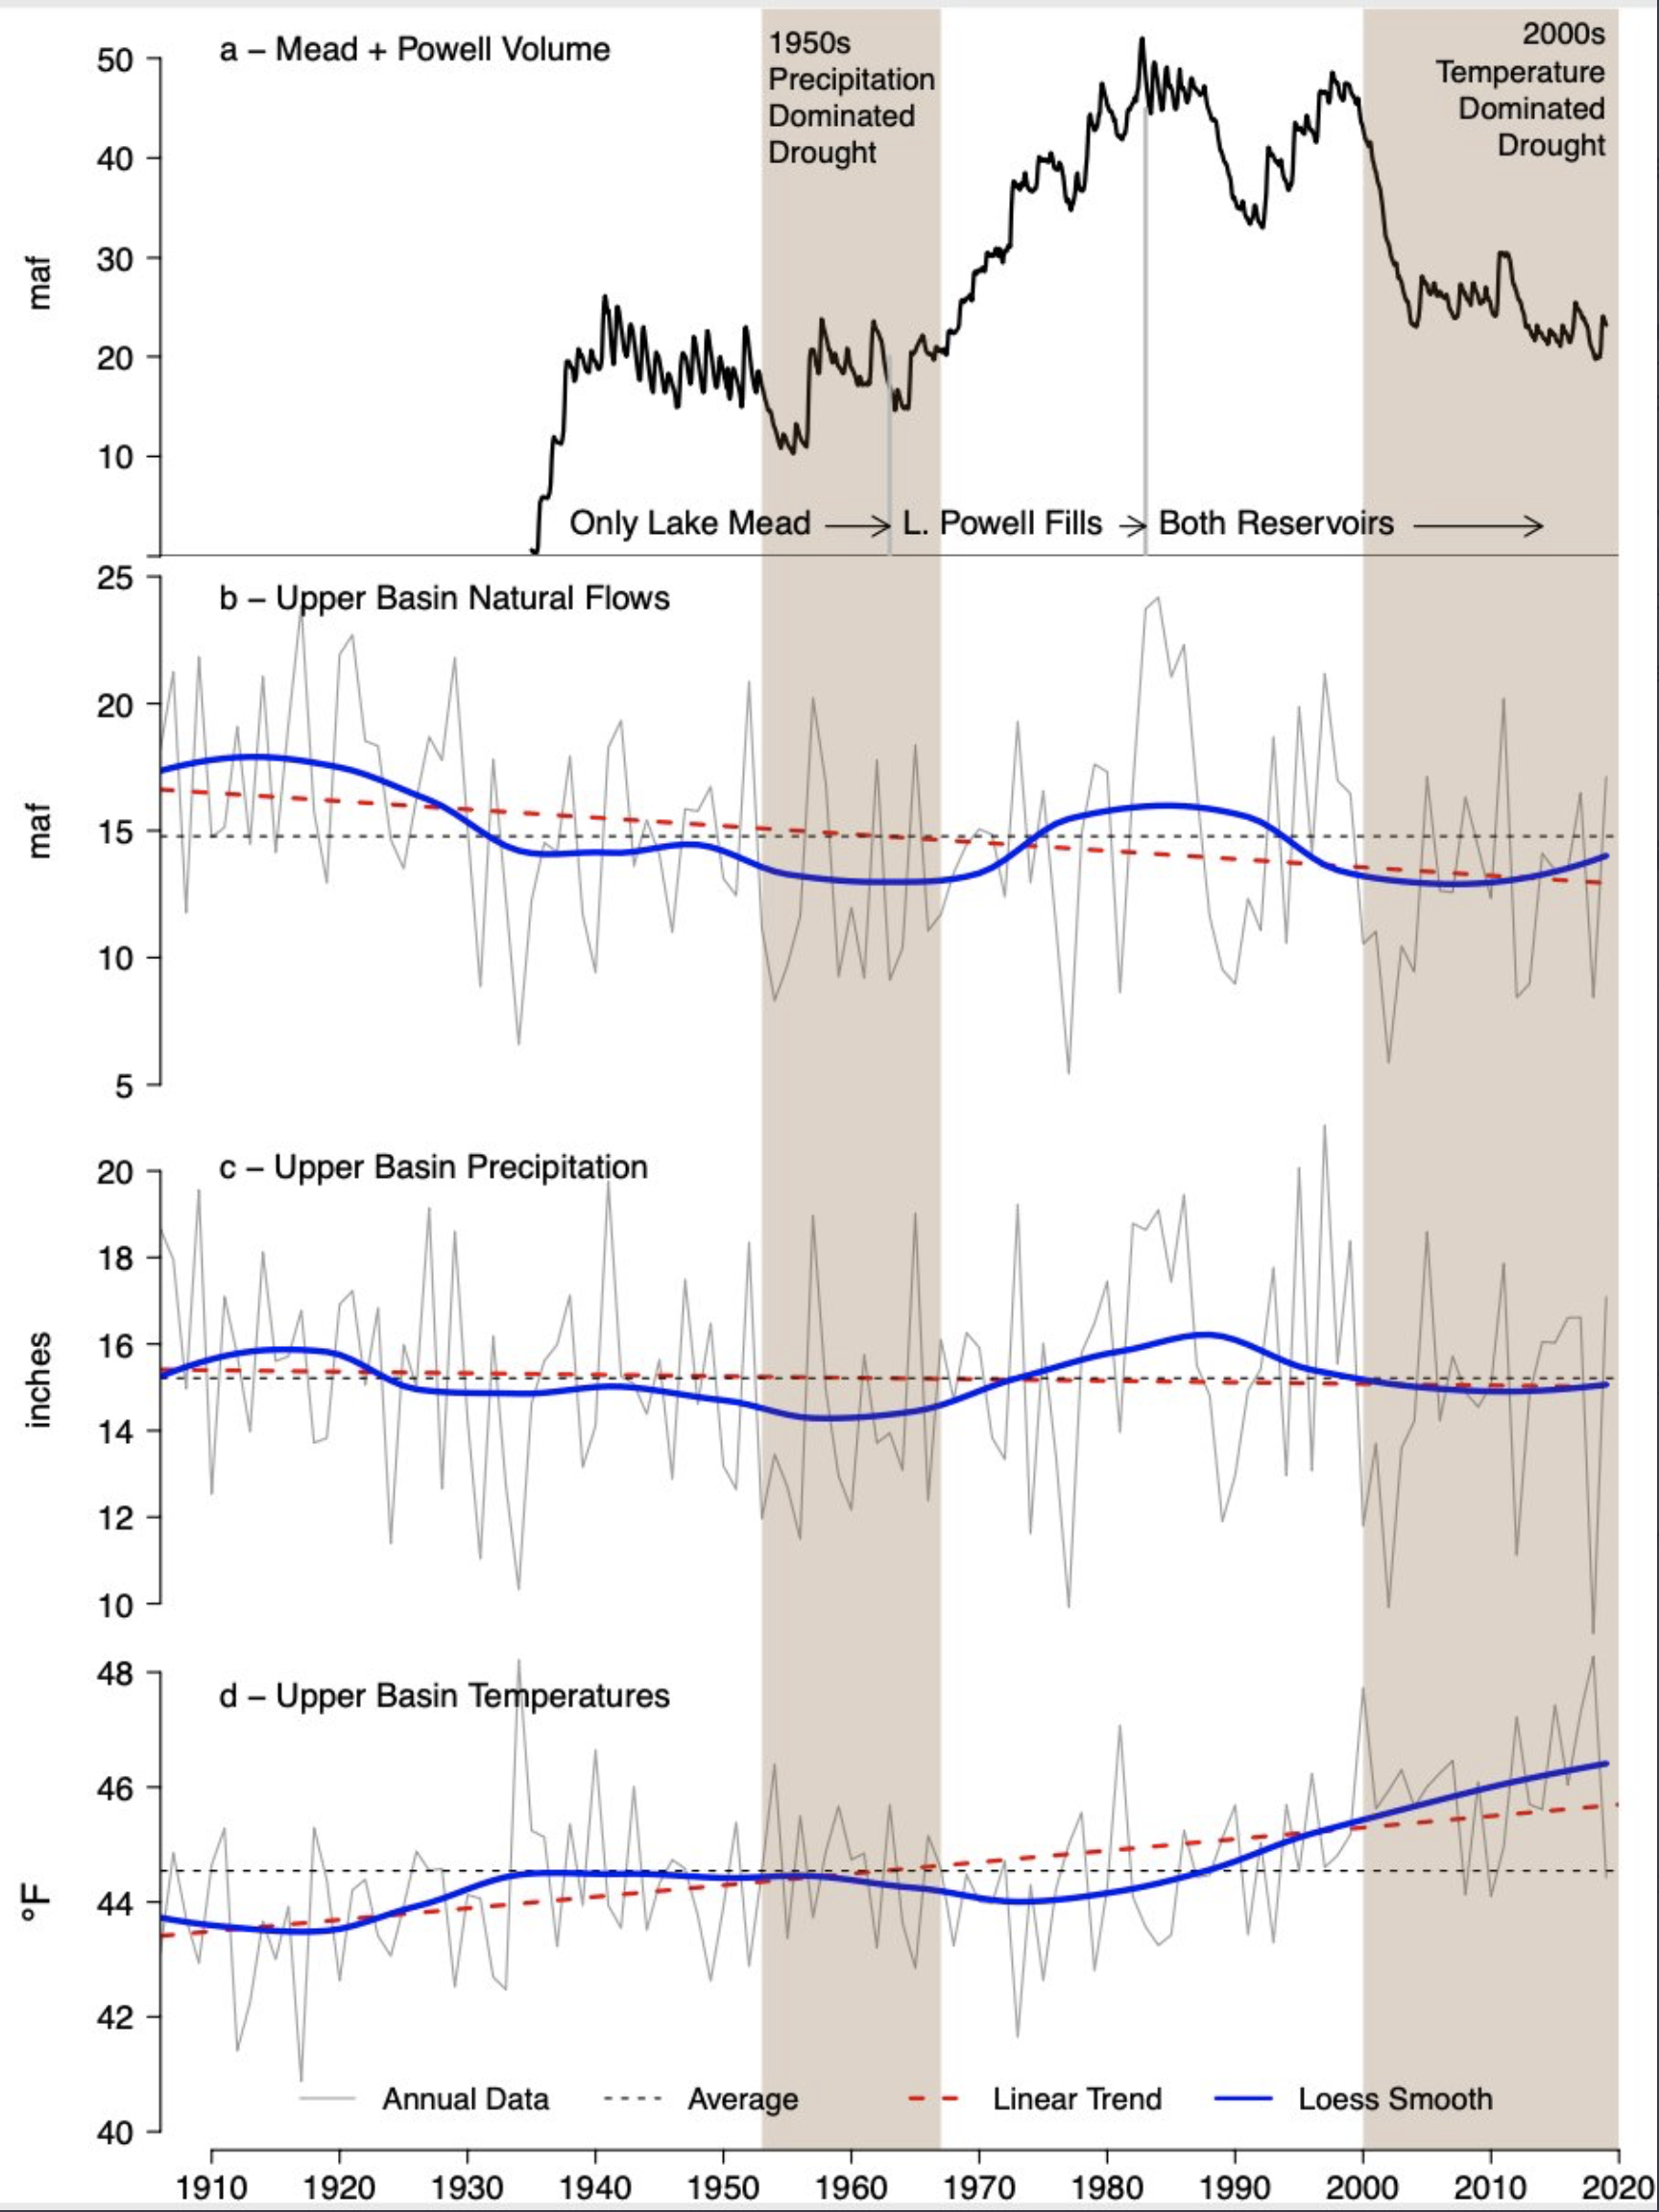
Brad Udall: Here’s the latest version of my 4-Panel plot thru Water Year (Oct-Sep) of 2019 of the #coriver big reservoirs, natural flows, precipitation, and temperature. Data goes back or 1906 (or 1935 for reservoirs.) This updates previous work with @GreatLakesPeck
Arizona, California, and Nevada, which together form the lower basin, rely on water from Lake Mead, whose fluctuations have become a barometer for water stress in the American Southwest. As stress increased in the last two decades, water managers have responded. They have been willing to process new information about the changing hydrology and rewrite the rules by which they operate, constraining themselves so as to dodge the worst outcomes. ICS, to this date, has functioned the same way. But difficult situations are likely to soon arise.
“[ICS] has enabled more opportunity to be a part of this puzzle of how to make things work so that we avoid deep shortages that have harsher implications to water users,” Sharon Megdal, director of the University of Arizona Water Resources Research Center, told Circle of Blue. “I think it’s been a very good tool. But like anything else it’s with uncertainty.”
Creating Surplus
ICS was conceived during negotiations between the seven states that led to a milestone agreement in 2007 that transformed how the basin operates. At the time, Lake Powell had experienced the driest five-year period in the region in a century and there were unresolved questions about delivering water under such conditions. The 2007 Interim Guidelines, which expire at the end of 2025, were a landmark document that secured three substantial changes.
First, the guidelines developed a formula for determining how much water is released from Lake Powell into Lake Mead. The releases are designed to keep the reservoirs roughly in balance.
The guidelines also set Lake Mead elevations at which lower basin states would be required to reduce their withdrawals. The first of these shortage tiers — at 1,075 feet above sea level — is expected to be breached next year. (Mead is currently at 1,073 feet, but for shortage determinations, it is the projected level in the following January that matters. Right now that projection is 1,066 feet.)
The third change was establishing intentionally created surplus, or ICS. The program allows big water users in the lower basin to open a savings account in the lake. To bank water in their account, they must take an action that reduces water consumption. That banked water is credited to the user that created it. ICS is not conservation in the household sense of simply using less. It is not taking a shorter shower or only watering the lawn once a week. ICS is instead more comparable to a personal savings account. Water banked now becomes an asset that can be withdrawn later, subject to certain conditions.
The program was championed initially by the Metropolitan Water District of South California. Known as Met, the district is the largest urban water wholesaler in the state, providing water to 19 million people in six counties including Los Angeles and San Diego. Met wanted a way to take advantage of its right to store “surplus” water in Lake Mead, a right it secured in 1931 when it agreed to be cut off from Colorado River supplies before the state’s irrigation districts were. Met needed the flexibility of extra Lake Mead storage for two reasons: a court decision limited California’s use of Colorado River starting in 2003 and its supply from reservoirs in northern California’s Sierra Nevada mountains is quite variable. In dry years in the Sierra, like this year when deliveries from the State Water Project canals are low, Met draws more water from the Colorado River. It is one of the many ways that human use connects watersheds of the American West that are physically separated by hundreds of miles.
With a bit of linguistic maneuvering, the rules were written so that agencies like Met could create “surplus” by investing in conservation. Say, for example, that Met paid to line a canal with concrete so water would not seep into the soil, or paid farmers to fallow their fields. The Bureau of Reclamation, playing the oversight role in the lower basin, checks that the lining kept water in the canal and the alfalfa fields were not irrigated. That amount of water — the difference between what would have been delivered without the intervention and what was actually delivered — would then be credited to Met in the form of ICS, minus a small percentage that is the lake’s share.
A few years later these rules were altered to bring Mexico into the program. U.S. entities can pay a counterpart in Mexico for conservation and reap the ICS asset. The rules were changed again in 2019, in an agreement called the Drought Contingency Plan, or DCP, that welcomed certain tribal nations into the fold. Banked water is now subjected to a one-time tax of 10 percent, a cut that is credited to the storage system as a whole.
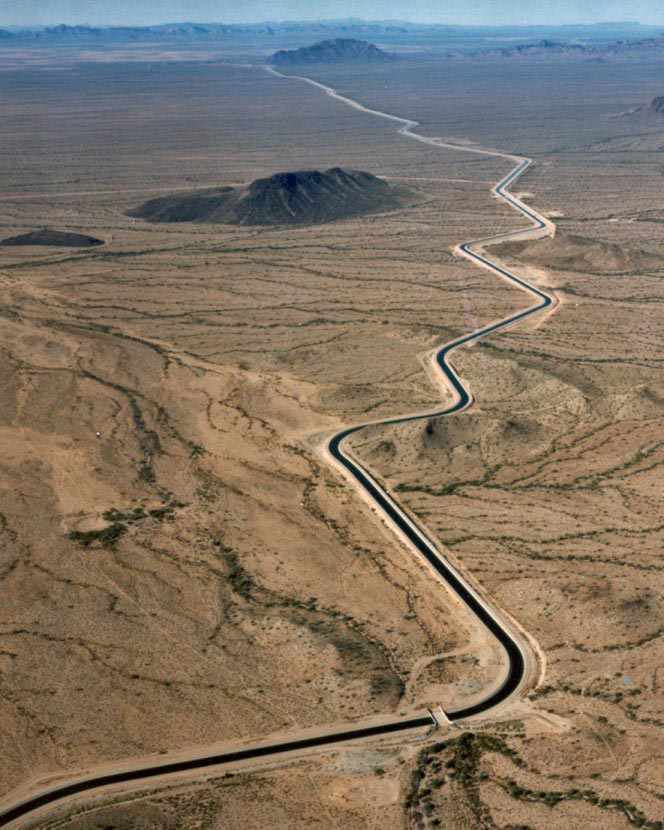
Aerial photo – Central Arizona Project. The Central Arizona Project is a massive infrastructural project that conveys water from the Colorado River to central and southern Arizona, and is central to many of the innovative partnerships and exchanges that the Gila River Indian Community has set up. Public Domain, https://commons.wikimedia.org/w/index.php?curid=326265
Only six entities have created ICS, according to Jeremy Dodds, who is responsible for ICS accounting and verification at the Bureau of Reclamation. Those six are some of the largest water users in the basin: Met, Gila River Indian Community, Colorado River Indian Tribes, Southern Nevada Water Authority, Imperial Irrigation District, and the Central Arizona Water Conservation District, which manages CAP. Within the four categories of ICS, there are limits on the ICS each water user can create, the amount they can take out in a year, and the total amount stored.
There have been far more ICS deposits than withdrawals. Dodds said that about 3.7 million acre-feet of ICS have been created since 2007, but water users have withdrawn only about 550,000 acre-feet. Taking into account the system cuts, the Bureau of Reclamation counts just over 2.8 million acre-feet of ICS in Mead today. About half belongs to Met.
Met has been responsible for nearly all withdrawals, taking out a combined 485,000 acre-feet in 2013, 2014, and 2015 when California was clutched by a severe drought and water deliveries from the State Water Project bottomed out in 2014 at 5 percent of contracted amounts.
When it is withdrawn, ICS is additional to a state’s typical allocation of Colorado River water. That means California can exceed its annual 4.4 million acre-feet allocation when Met draws on ICS.
Bill Hasencamp, who is Met’s manager of Colorado River resources, said that his district’s ICS account is like a yo-yo that goes up and down, depending on water supply conditions elsewhere in California…
ICS serves another purpose, too. Lower basin states can use ICS to cover part of their mandatory cutbacks under the Drought Contingency Plan. In effect, states have “pre-paid” some of their shortage obligations. Arizona leaned on that mechanism in 2020, when it contributed 47,434 in ICS credits to a required 192,000 acre-feet reduction.
That doesn’t mean the rights to the water are lost, though. ICS that pays down a shortage obligation, through the basin’s accounting alchemy, becomes DCP ICS. This is a special category can be withdrawn through the year 2057, but only once Lake Mead rises above 1,110 feet.
Quest for Certainty in an Uncertain System
To this point, basin managers and federal officials are extremely satisfied with ICS. It is a “landmark success,” according to Colby Pellegrino, deputy general manager for the Southern Nevada Water Authority. Cullom of the Central Arizona Project said that the program has led to “deeper collaboration among water users interstate and intrastate and even internationally.” Elizabeth Klein, senior counselor to the secretary of the Interior and the department’s drought response coordinator, praised the ICS program during a House Natural Resources subcommittee hearing on May 25. “This demonstrates the extraordinary importance of taking proactive, cooperative measures to protect limited water supplies,” Klein said.
But as Lake Mead declines, there are scenarios that will test the system of checks and balances.
One uncertainty that has been partially resolved is the risk of unintended consequences. The 2007 Interim Guidelines said that ICS was not allowed to be withdrawn during shortage situations, when Mead is below 1,075 feet. There was fear several years ago that there would be a run on the bank as the lake approached that level. Met would draw down its credits, storing the water elsewhere and leading the reservoir to crash.
That scenario did not happen, due in part to the DCP. That agreement allows ICS to be withdrawn until Mead reaches 1,025 feet. California, in exchange for the ability to take water out at lower lake levels, agreed for the first time to cutbacks in its Colorado River allocation, which constrains its ability to withdraw ICS as the lake declines. Below elevation 1,045, for every five feet that Mead declines, California’s cutbacks increase, thus diminishing its capacity to withdraw ICS.
These are some of the checks and balances written into the system, Pellegrino explained. The compromise on when ICS could be withdrawn provided more certainty, she said, but it also delayed a reckoning with the key question: whether there is a point at which ICS becomes stranded, even temporarily. The DCP contains a clause that the states will discuss “additional measures” if Lake Mead is projected to fall below 1,030 feet.
Hasencamp offered another consideration: the size of the ICS accounts relative to the amount of water in Lake Mead. Right now about 30 percent of the water in the reservoir is ICS. What happens if that figure reaches 40 percent or 50 percent? Is there a limit?
[…]
The false sense of security is what irks Brad Udall about ICS. Udall is a water and climate scientist at Colorado State University who says that ICS has laudable intentions: preventing water waste and increasing water levels in Mead. Higher reservoir levels help lakeside marinas stay in business and maintain the valuable hydropower generated by Hoover Dam. But Udall also believes that discussing Lake Mead water storage without being explicit about how much is set aside as ICS amounts to a “double counting” of supplies, combining the private ICS accounts with the public pool of water.
Udall would prefer a more rigorous examination of the implications of ICS use, especially given that the credits can be used to reduce shortage requirements. But he could not recall any academic study that modeled potential outcomes. One such study, however, is on the horizon.
Sarah Porter, director of the Kyl Center for Water Policy at Arizona State University, said that she plans to start work this year on an assessment of how ICS use would impact water availability in Arizona. A full analysis will take 18 months to two years, she said. But preliminary results could be available in six months or so.
“We have to look at a range of scenarios so we can look at a range of responses,” Porter told Circle of Blue.
The water supply scenarios are indeed daunting. By April 2022, the Bureau of Reclamation projects that Mead will drop to 1,063 feet, or 33 percent of its capacity. A year after that, in April 2023, the forecast is that Mead will sit at 1,047 feet. At that elevation, the reservoir would be just over 28 percent full.
All of these issues should be on the table soon. The basin states are set to begin negotiations over what will replace the 2007 interim guidelines, which expire on December 31, 2025. A big question — maybe the biggest — is how to permanently reduce reliance on the river so that water withdrawals are more in line with the drying hydrology.
A high desert thunderstorm lights up the sky behind Glen Canyon Dam — Photo USBR
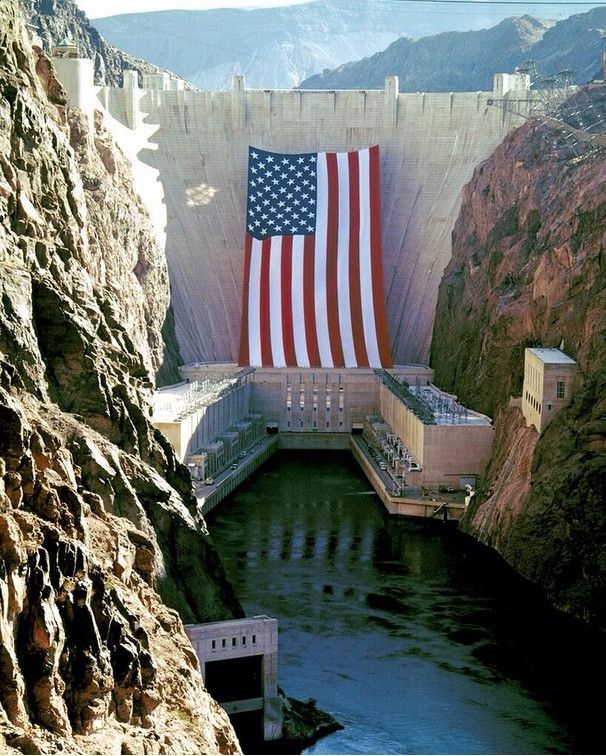
Hoover Dam photo via the US Bureau of Reclamation
Here’s the release from the Bureau of Reclamation:
As one element of the ongoing implementation of the 2019 Drought Contingency Plans for the Colorado River Basin, the Bureau of Reclamation today released additional 5-year projections on the Colorado River System based on June 2021 conditions.
Five-year projections are typically modeled in January, April and August of each year. The additional June projections will inform the ongoing drought operations planning efforts at key Reclamation reservoirs in the Upper Colorado River Basin. These efforts are ongoing among Reclamation and the Colorado River Basin states under the Upper Basin Drought Response Operations Agreement.
“The June 5-year projections for the Colorado River System reaffirm this is a serious situation,” said Wayne Pullan, Upper Colorado Basin Regional Director. “We are actively engaged with the Colorado River Basin states and other partners to respond to changing conditions to avoid critical elevations at Lake Powell.”
Projections for anticipated runoff in the Upper Colorado Basin have declined over the course of the spring. Using information based on recent hydrology (since 1988 and known as the Stress Test Hydrology), Reclamation notes several key findings for Lake Powell in the June 5-year projections:
A 79% chance that Lake Powell will fall below its target water-surface elevation of 3,525 feet sometime next year.
Lake Powell’s target water-surface elevation of 3,525 feet provides a 35 vertical-foot buffer designed to minimize the risk of dropping below the minimum power pool elevation of 3,490 feet, and balances the need to protect the infrastructure at Glen Canyon Dam and to meet current operational obligations to the Lower Colorado River Division states of Arizona, California, and Nevada.
Beyond 2022, Lake Powell’s chances of falling to critical levels also increased.
There is a 5% chance that Lake Powell will fall below minimum power pool elevation of 3,490 feet in 2023 and 17% in 2024.
In the Lower Basin, the updated projections for Lake Mead continue to affirm the high likelihood of a first-ever shortage condition in the Lower Basin in calendar year 2022. Consistent with the 2007 Interim Guidelines, if Lake Mead’s end-of-calendar-year elevation is projected to be at or below 1,075 feet, Lake Mead would operate in a shortage condition in the upcoming year. The prescribed shortage reductions for Arizona and Nevada would also be coupled with water savings contributions under the Lower Basin Drought Contingency Plan. Mexico would reduce their allotment and make water savings contributions under Minute 323 to the 1944 U.S. Mexico Water Treaty. Consistent with the 2007 Interim Guidelines, the 2019 DCP and Minute 323, operational decisions for 2022 will be made by Reclamation in August 2021.
Reclamation is also concerned with the longer-term projections, which show a higher likelihood of Lake Mead declining to the critical elevations of 1,025 and 1,000 feet by 2025. Based on the June update, the chance of this occurring by 2025 is 58% and 21%, respectively.
Reclamation provides projections using two future hydrology scenarios: The Stress Test Hydrology based on the last 32 years, and the Full Hydrology based on the last 114 years. The Stress Test Hydrology provides more plausible near-term outlooks because it embeds the recent warming trend and current drought period. It is about 11% lower on average compared to the Full Hydrology.
Assumptions about drought operations are included in these projections; drought response operation plans to protect Lake Powell are being developed by Reclamation and the Upper Division states of Colorado, New Mexico, Utah, and Wyoming. Pursuant to the provisions of the Drought Response Operations Agreement and the Companion Agreement, Reclamation will consult with the Lower Division states before finalizing drought response operation plans. If actual hydrology demonstrates an imminent need to protect the elevation at Lake Powell, the Secretary retains all applicable authority to adjust releases from the upstream initial units of the Colorado River Storage Project Act (Flaming Gorge, Navajo, and Blue Mesa reservoirs) before those operating plans can be finalized.
Reclamation and the Colorado Basin states continue to closely monitor conditions to be prepared to meet the goals of the DROA in the months and years ahead.
A key component of Reclamation’s Colorado River Basin activities is the integration of sophisticated modeling tools and scientific research to inform water management decisions. Through a decades-long partnership with the Center for Advanced Decision Support for Water and Environmental Systems at the University of Colorado in Boulder, Reclamation hydrologic engineers and hydrologists are actively collaborating with climate, hydrology and decision support scientists to provide advanced modeling tools. Their work is helping Reclamation link advances in science to water resource management decisions in the face of greater uncertainty and increased hydrologic and operational risks.
Reclamation’s modeling and operations teams further refine these tools, such as the 24-Month studies, to make annual operational determinations for Lake Powell and Lake Mead through close coordination with water and power customers throughout the basin.
Click on a thumbnail graphic to view a gallery of drought data from the US Drought Monitor website.
US Drought Monitor map July 6, 2021.
West Drought Monitor map July 6, 2021.
High Plains Drought Monitor map July 6, 2021.
Colorado Drought Monitor map July 6, 2021.
Click here to go to the US Drought Monitor website. Here’s an excerpt:
This Week’s Drought Summary
Another week of hot, dry weather in the Pacific Northwest, Northern Rockies, Northern Plains, and Upper Midwest led to the expansion of drought conditions. Meanwhile, monsoon thunderstorms brought wet weather to eastern New Mexico and West Texas resulted in large one-category improvements. Showers and thunderstorms associated with a slowly moving cold front helped improve conditions in the Great Lakes region and eastern U.S. Drought expanded in parts of the Mid-Atlantic that missed out on the heaviest rain…
Another hot, dry week across the northern tier of the region, coupled with isolated showers, brought a mix of degradations and improvements. Drought expanded in parts of Wyoming, North Dakota, South Dakota, and Nebraska that missed out on the heaviest rainfall. Soils remain dry with USDA reporting that 92% of South Dakota and 76% of North Dakota’s topsoil moisture is short to very short, leading to limited hay production and stunted crop growth. Land enrolled in the Conservation Program has been opened to haying and grazing in some areas and producers are needing to monitor toxicity levels in hay and water supplies. Drought conditions improved in parts of Wyoming and eastern Nebraska, as showers over the last two weeks helped erase rainfall deficits, improve streamflow, and replenish soil moisture. In North Dakota, rainfall is finally helping to chip away at the long-term drought that has plagued the state since fall of 2020…
Another week of hot, dry weather once again led to worsening drought conditions across the Northwest. Temperatures as high as 17 degrees above normal set more high temperature records across the region. The excess heat continued to increase evaporative demand, dry out soils and vegetation, and strain water resources. Many areas in the Northwest saw degradations and pacts across the region continue to build. In Oregon, where drought intensified and expanded across severe drought (D2) to exceptional drought (D4) levels, soil moisture, streamflow, and the SPEI (a drought monitoring indicator that includes the effects of precipitation and temperature) show conditions are among the driest going back to 1895. Dryland agriculture is suffering and fire risk has escalated. In Washington, abnormal dryness (D0) and moderate drought (D1) expanded. With nearly all of the state experiencing dryness or drought, the U.S. Department of Agriculture’s National Agricultural Statistics Service (USDA NASS) reports as of July 4 that 84% of the state’s topsoil moisture is short to very short, significantly impacting forage production. The data show that the state’s rangeland and pasture conditions are far worse this year when compared to all other years this century. In Idaho, which saw expansions in D1-D3 drought categories, the state drought monitoring team noted that the Big Lost River is almost out of storage and priority water use is limited to early 1884 priorities. The team also reported significant agricultural impacts to the state, including crop loss, a lack of forage, and animal deaths. Montana, which saw D1-D4 expansion, recorded less than 25% of normal precipitation in June, which is historically the highest precipitation month. Impacts include diminished forage production and infestations of grasshoppers. Much of the Southwest remained unchanged this week. Where precipitation fell, such as in Arizona, it generally wasn’t enough to improve impacts. In places where it didn’t, conditions already are at D4 or don’t yet warrant additional degradations. The only exception was eastern New Mexico, where heavy rains (about 3 to 8 inches) over the past six to 10 days began to make a dent in the long-term drought, while also contributing to flash floods in the area. According to the Albuquerque National Weather Service, water levels at Santa Rosa Lake have risen over a foot since July 1…
Substantial rain fell across much of the South again this week, leading to large areas of one-category improvements to remaining drought areas in Texas and Oklahoma, where rainfall deficits, soil moisture, and streamflow improved. A two-category improvement was made in far West Texas near El Paso, where more rainfall has been recorded in the last nine days than in the prior 15 months…
Looking Ahead
The National Weather Service Weather Prediction Center forecast for the remainder of the week (July 8 -13) shows tropical storm conditions and rainfall from Elsa will continue across parts of Florida and into the Southeast. Other areas expecting excessive rainfall include the Texas coast, Midwest, and Northeast. In the West, the hot weather will continue with daytime highs well into the 90s and lower 100s. Moving into next week, the Climate Prediction Center six-to-10 day outlook (valid July 13-17) favors above normal temperatures across much of Alaska, the West, northern Plains and Northeast. Below normal temperatures are most likely across the Southern Plains. Below normal precipitation is expected across Alaska, the Northwest, Northern Plains, and Florida while above normal precipitation is favored along a band stretching from the Southwest, across the Midwest, and into the Northeast.
US Drought Monitor one week change map ending July 6, 2021.
Just for grins here are early July US Drought Monitor maps for the past few years.
From RiversEdge West via The Grand Junction Daily Sentinel:
Tamarisk trees, those green bushy plants seen along waterways, have been turning brown across the county thanks to a special beetle used to control the invasive species.
Ben Bloodworth, Tamarisk Beetle Program coordinator with RiversEdge West, sent out a note Monday responding to social media posts from local people wondering why they were seeing so many browning tamarisk plants.
“These are tamarisk trees, or salt cedars, and the phenomenon is currently so pervasive here in the valley that folks are starting to wonder about it on social media,” Bloodworth said. “So, before you blame anyone for over-spraying, or the hot, dry air of June, let’s chat about the millions of little beetles that live in the valley with us.”
According to Bloodworth, tamarisk, which is native to Asia and the Mediterranean, became such an environmental and economic problem in the western United States that the U.S. Department of Agriculture (USDA) decided to research and release a biological control agent to address the issue.
“Biocontrols are natural ‘predators’ that feed on plants in their native ranges but are not found in the U.S.,” Bloodworth said. “In 1987 the USDA began a program to find natural enemies of tamarisk and see if they could live and feed on tamarisk in North America without feeding on anything else.”
Out of hundreds of candidate species, the tamarisk beetle was found to be the most successful. It was found to only feed on tamarisk and not any other species of plants. So the USDA began releasing it, including in Moab, Utah, in 2001. From there the beetle spread up the Colorado River to Mesa County.
“Since tamarisk beetles survive on tamarisk as their only food source, they were never intended to eliminate the invasive plant,” Bloodworth said. “Rather, they were released to help control the spread of the plant and reduce the amount that land managers must remove by other, more costly means.”
The small green beetles, when there is a large enough population, can defoliate a large amount of tamarisk in just a few weeks. Left behind are the orangish brown remains of the formerly green tamarisk.
“The populations ebb and flow with available tamarisk and some years we have almost no tamarisk beetles anywhere,” Bloodworth said. “As you may have noticed by all the brown tamarisk, this is not one of those years!”
Counterintuitively the brown, dead tamarisk is actually less of a fire danger than the green plant, Bloodworth said. It may initially, for a few weeks, be more susceptible to catching fire, but once it has dropped its leaves it is actually less of a fire risk, according to Bloodworth.
“The brown trees may not be pretty, but they do provide for opportunities to restore native vegetation alongside our rivers,” Bloodworth said.
2014 Tamarisk leaf beetle distribution map via the Tamarisk Coalition
This summer, a historic drought and its consequences are tearing communities apart and attracting outside attention to a water crisis years in the making. Competition over Klamath River water has always been intense, but now there is simply not enough, and all the stakeholders are suffering.
“Everybody depends on the water in the Klamath River for their livelihood. That’s the blood that ties us all together,” [Ben] DuVal said of the competing interests. “Nobody’s coming out ahead this year. Nobody’s winning.”
Those living the nightmare worry the extreme drought is a harbinger of global warming.
“The system is crashing … for people up and down the Klamath Basin,” said Frankie Myers, vice chairman of the Yurok Tribe, which is monitoring a massive fish kill on the river. “It’s heartbreaking.”
Twenty years ago, when water feeding the irrigation system was drastically reduced amid another drought, the crisis became a national rallying cry for the political right, and some protesters opened the main irrigation canal in violation of federal orders.
This time, many irrigators reject the presence of anti-government activists. Farmers who need federal assistance to stay afloat fear ties to the far right could hurt them.
Meanwhile, toxic algae is blooming in the basin’s main lake, and two national wildlife refuges critical to migratory birds are drying out. The conditions have exacerbated a water conflict that began more than a century ago.
Beginning in 1906, the federal government reengineered a complex system of lakes, wetlands and rivers in the 10 million-acre Klamath River Basin to create tens of thousands of acres of irrigated farmland.
The Klamath Reclamation Project draws its water from the 96-square-mile Upper Klamath Lake. But the lake is also home to suckerfish central to the Klamath Tribes’ culture and creation stories.
In 1988, the U.S. Fish and Wildlife Service listed two species of sucker fish as endangered. The federal government must keep the lake at a minimum depth to support the fish — but this year, amid exceptional drought, there was not enough water to do that and supply irrigators.
“Agriculture should be based on what’s sustainable. There’s too many people after too little water,” said Don Gentry, the Klamath Tribes chairman.
With the Klamath Tribes enforcing their senior water rights to help suckerfish, there is also no extra water for downriver salmon.
The Karuk Tribe last month declared a state of emergency, citing climate change and the worst hydrologic conditions in the Klamath River Basin in modern history. Karuk tribal citizen Aaron Troy Hockaday Sr. is a fourth-generation fisherman but says he hasn’t caught a fish in the river since the mid-1990s…
In most years, the tribes 200 miles to the southwest of the farmers, where the river reaches the ocean, ask the Bureau of Reclamation to release pulses of extra water from Upper Klamath Lake. The extra water mitigates outbreaks of a parasitic disease that proliferates when the river is low.
This year, the federal agency refused those requests.
Now, the parasite is killing thousands of juvenile salmon in the lower Klamath River, where the Karuk and Yurok tribes have coexisted with them for millennia. An average of 63 percent of fish caught last month in research traps near the river’s mouth were dead…
Near the river’s source, some of the farmers who are seeing their lives upended by the same drought say a guarantee of less water — but some water — each year would be better than the parched fields they have now. Some worry problems in the basin are being blamed on a way of life they also inherited.
Photo credit: Elisa Stone via the World Weather Attribution
Here’s the release from the World Weather Attribution:
During the last days of June 2021, Pacific northwest areas of the U.S. and Canada experienced temperatures never previously observed, with records broken in many places by several degrees Celsius.
Multiple cities in the U.S. states of Oregon and Washington and the western provinces of Canada recorded temperatures far above 40ºC (104 ºF), including setting a new all-time Canadian temperature record of 49.6ºC in the village of Lytton. Shortly after setting the record, Lytton was largely destroyed in a wildfire [1,2]. The exceptionally high temperatures led to spikes in sudden deaths, and sharp increases in hospital visits for heat-related illnesses and emergency calls [3,4,5]. Heatwaves are one of the deadliest natural hazards and this heatwave affected a population unaccustomed and unprepared for such extreme temperatures, for instance with most homes lacking air-conditioning [6]. Currently available mortality estimates of at least several hundred additional deaths are almost certainly an underestimate. The full extent of the impact of this exceptional heat on population health will not be known for several months.
Scientists from the US, Canada, the UK, the Netherlands, France, Germany and Switzerland collaborated to assess to what extent human-induced climate change made this heatwave hotter and more likely.
Using published peer-reviewed methods, we analysed how human-induced climate change affected the maximum temperatures in the region where most people have been affected by the heat (45–52 ºN, 119–123 ºW) including the cities of Seattle, Portland, and Vancouver (with well over 9 million people in their combined metropolitan areas).
Fiure 1: Station data anomalies of the 2021 event relative to the mean of the highest daily maximum temperature of the year in the time series. Note that some stations do not have data up to the peak of the heatwave yet and hence underestimate the event. Negative values certainly do not include the heatwave and have therefore been deleted. The black box shows the study region. Source: GHCN-D downloaded 4 July 2021.
Main findings
Based on observations and modeling, the occurrence of a heatwave with maximum daily temperatures (TXx) as observed in the area 45–52 ºN, 119–123 ºW, was virtually impossible without human-caused climate change.
The observed temperatures were so extreme that they lie far outside the range of historically observed temperatures. This makes it hard to quantify with confidence how rare the event was. In the most realistic statistical analysis the event is estimated to be about a 1 in 1000 year event in today’s climate.
There are two possible sources of this extreme jump in peak temperatures. The first is that this is a very low probability event, even in the current climate which already includes about 1.2°C of global warming — the statistical equivalent of really bad luck, albeit aggravated by climate change. The second option is that nonlinear interactions in the climate have substantially increased the probability of such extreme heat, much beyond the gradual increase in heat extremes that has been observed up to now. We need to investigate the second possibility further, although we note the climate models do not show it. All numbers below assume that the heatwave was a very low probability event that was not caused by new nonlinearities.
With this assumption and combining the results from the analysis of climate models and weather observations, an event, defined as daily maximum temperatures (TXx) in the heatwave region, as rare as 1 in a 1000 years would have been at least 150 times rarer without human-induced climate change.
Also, this heatwave was about 2°C hotter than it would have been if it had occurred at the beginning of the industrial revolution (when global mean temperatures were 1.2°C cooler than today).
Looking into the future, in a world with 2°C of global warming (0.8°C warmer than today which at current emission levels would be reached as early as the 2040s), this event would have been another degree hotter. An event like this – currently estimated to occur only once every 1000 years, would occur roughly every 5 to 10 years in that future world with 2°C of global warming.
In summary, an event such as the Pacific Northwest 2021 heatwave is still rare or extremely rare in today’s climate, yet would be virtually impossible without human-caused climate change. As warming continues, it will become a lot less rare.
Our results provide a strong warning: our rapidly warming climate is bringing us into uncharted territory that has significant consequences for health, well-being, and livelihoods. Adaptation and mitigation are urgently needed to prepare societies for a very different future. Adaptation measures need to be much more ambitious and take account of the rising risk of heatwaves around the world, including surprises such as this unexpected extreme. Deaths from extreme heat can be dramatically reduced with adequate preparedness action. Heat action plans that incorporate heatwave early warning systems can strengthen the resilience of cities and people. In addition, longer-term plans are needed to modify our built environments to be more adequate for the hotter climate that we already experience today and the additional warming that we expect in future. In addition, greenhouse gas mitigation goals should take into account the increasing risks associated with unprecedented climate conditions if warming would be allowed to continue.
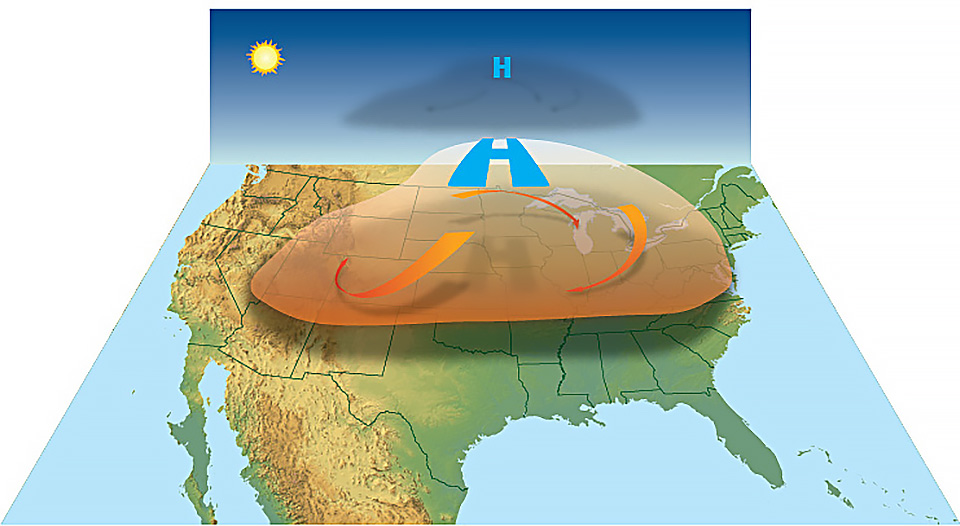
High-pressure circulation in the atmosphere acts like a dome or cap, trapping heat at the surface and favoring the formation of a heat wave. Graphic credit: NOAA
Background information
The heatwave considered in this study is linked to a slow-moving strong high pressure system, sometimes called Omega-blocking or “heat dome”, which brings descending and thus warm and dry air, as well clear skies, further heating the near-surface air. This high pressure system also reached record levels in terms of its strength, measured as the “thickness” of the lower part of the atmosphere, the so-called troposphere. The pressure values observed in the very strong blocking anticyclone are comparable to those observed in other parts of the world in recent heatwaves. The “Omega” blocking pattern is typically associated with heatwaves in this region. While the pressure system was record-breaking in its values, it was far less unusual compared to climatology than the associated extreme temperatures. Recent research suggests that climate change increases the chances for such stagnant high pressure systems in summer through weakening of the summer jet stream. As of yet, it is unclear if, and to what extent, such long-term dynamical changes play a role in this event.
An important feature of this extreme heatwave is that it occurred following a very dry spring over the Western U.S., so the absence of evaporative cooling could be an important factor in the exceptional temperatures observed. However, the northern part of the region impacted by this heatwave experienced wet anomalies in the weeks and months preceding the heat. Anticyclonic subsidence, and downslope winds were also present, and probably acted as additional heating factors. Overall, it is difficult at this stage to assess the extent to which these factors either in isolation or combined provide a good explanation of why the observed temperatures were so much higher than anything ever recorded in this part of the world. Hence, more research is needed to understand the processes as well as potential influence of human-caused climate change on them.
Here we provide a first estimate of the role of climate change on the extreme temperatures measured in the Pacific Northwest. We analyse the maximum daily temperatures as these are relevant to the impact of the event. While the minimum temperatures are also important for health impacts, we used only one index to keep the assessment straightforward. In this rapid study, we do not analyse the impact that human-caused climate change may have on specific aspects leading to the observed synoptic situation. We ask whether and to what extent human-caused climate change altered the likelihood and intensity of the analysed event. Specifically we analyse (1) how the likelihood of the yearly maximum temperature to be as high or higher than observed in June 2021 has changed and (2) how much less severe a heatwave with the same return period would have been in a world without human-caused climate change. It is important to highlight that, because the temperature records of June 2021 were very far outside all historical observations, determining the likelihood of this event in today’s climate is highly uncertain. All numbers shown assume that the heatwave was a very low probability event (about 1 in 1000 years) that was not caused by new nonlinearities. As in previous analyses, we only give a lower bound of the estimate of the influence of climate change on the change in probability of the event as the best estimate and upper bound are very ill-defined for extreme heat.
Based on this first rapid analysis, we cannot say whether this was a so-called “freak” event (with a return time on the order of 1 in 1000 years or more) that largely occurred by chance, or whether our changing climate altered conditions conducive to heatwaves in the Pacific Northwest, which would imply that “bad luck” played a smaller role and this type of event would be more frequent in our current climate.
In either case, the future will be characterized by more frequent, more severe, and longer heatwaves, highlighting the importance of significantly reducing our greenhouse gas emissions to reduce the amount of additional warming.
The latest heat-related death numbers are alarming, yet they are likely a severe undercount and the real toll will only become clear after mortality statistics are reviewed for the role of heat in exacerbating underlying conditions.
References
[1] World Meterological Organization: June ends with exceptional heat
[2] Global News: Scenes of destruction after wildfire destroys village of Lytton, B.C.
[3] Vancouver Sun: Heat wave linked to massive spike in sudden deaths across Lower Mainland
[4] Oregon Health Authority: Summer 2021 Oregon ESSENCE Hazard Report
[5] CNN: Historic Northwest heat wave linked to dozens of deaths and hundreds of emergency room visits
[6] New York Times: Air-Conditioning Was Once Taboo in Seattle. Not Anymore.
Here’s the release from Colorado Parks & Wildlife (Travis Duncan):
Due to extremely low flows and warm water temperatures, Colorado Parks and Wildlife is asking anglers to voluntarily avoid fishing on the Colorado River between Kremmling and Rifle.
Effective Wednesday, July 7, CPW is placing a full-day voluntary fishing closure on the Colorado River beginning at the Highway 9 bridge in Kremmling downstream to the Highway 13 bridge in Rifle. The voluntary closure will remain in effect until further notice, with a possibility of a mandatory emergency closure to all fishing if conditions worsen.
“We know that anglers care deeply about this fishery,” said CPW Aquatic Biologist Lori Martin. “We need their help to conserve this resource.”
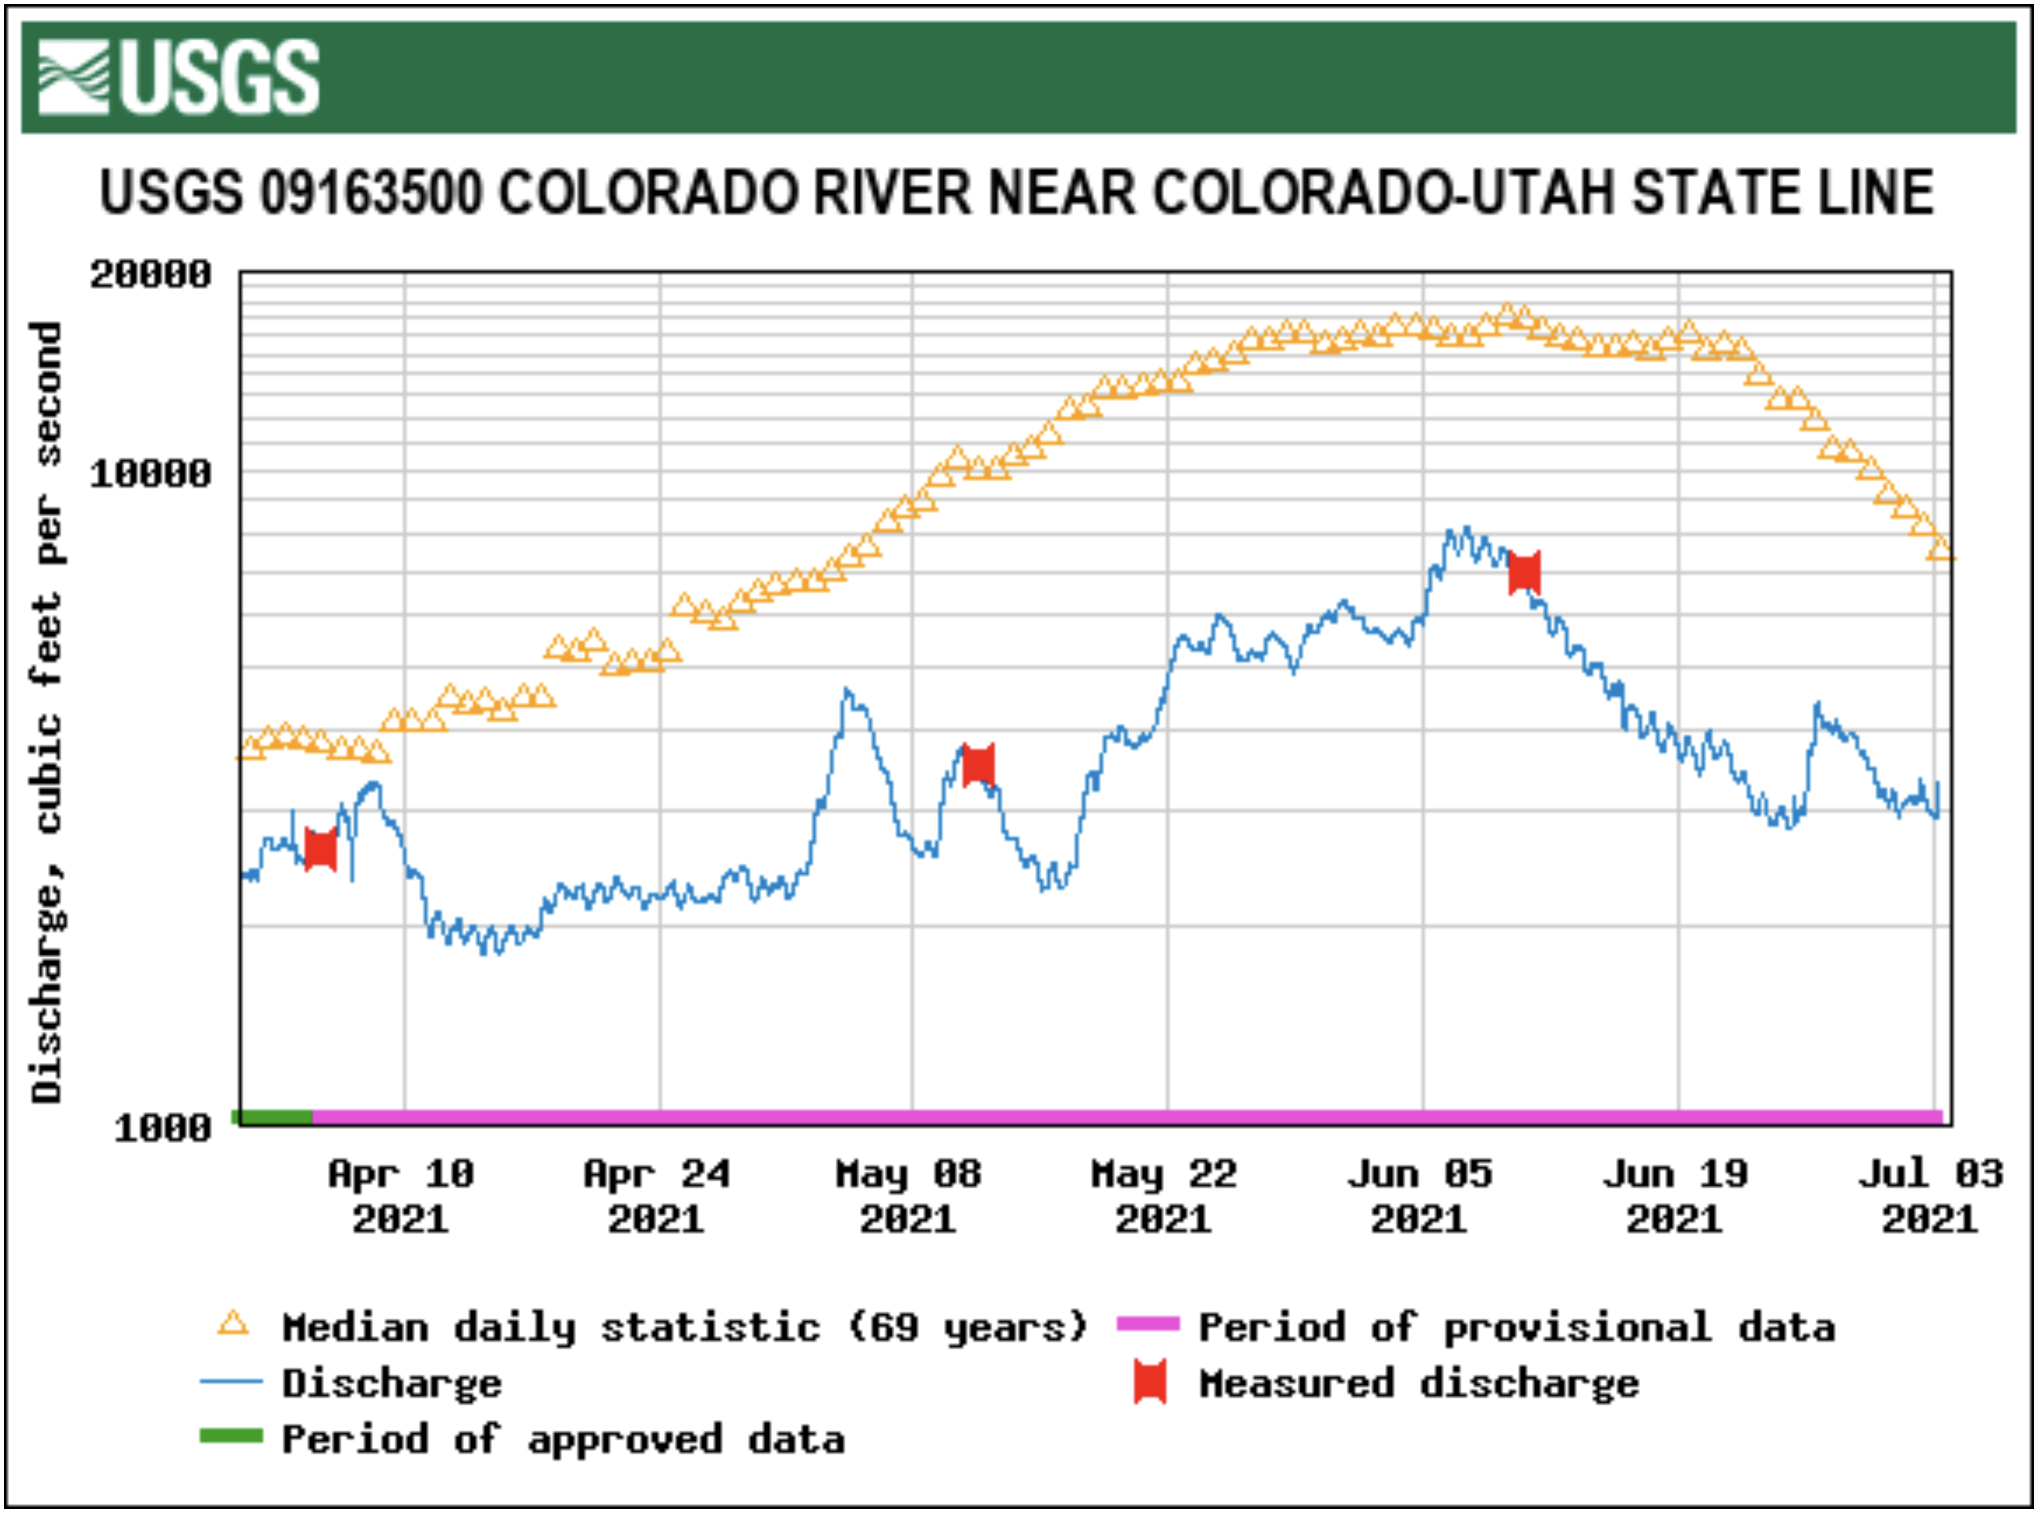
Because of the ongoing drought, flows are down in the river. The USGS gauge on the Colorado River at Catamount Bridge typically measures between 1,500 and 2,000 cubic feet per second (cfs). The gauge has been measuring 600 – 700 cfs, about half what is historically expected there. The USGS gauge on the Colorado River near Dotsero is running at 1,250 cfs, down from an expected 3,000 – 4,000 cfs.
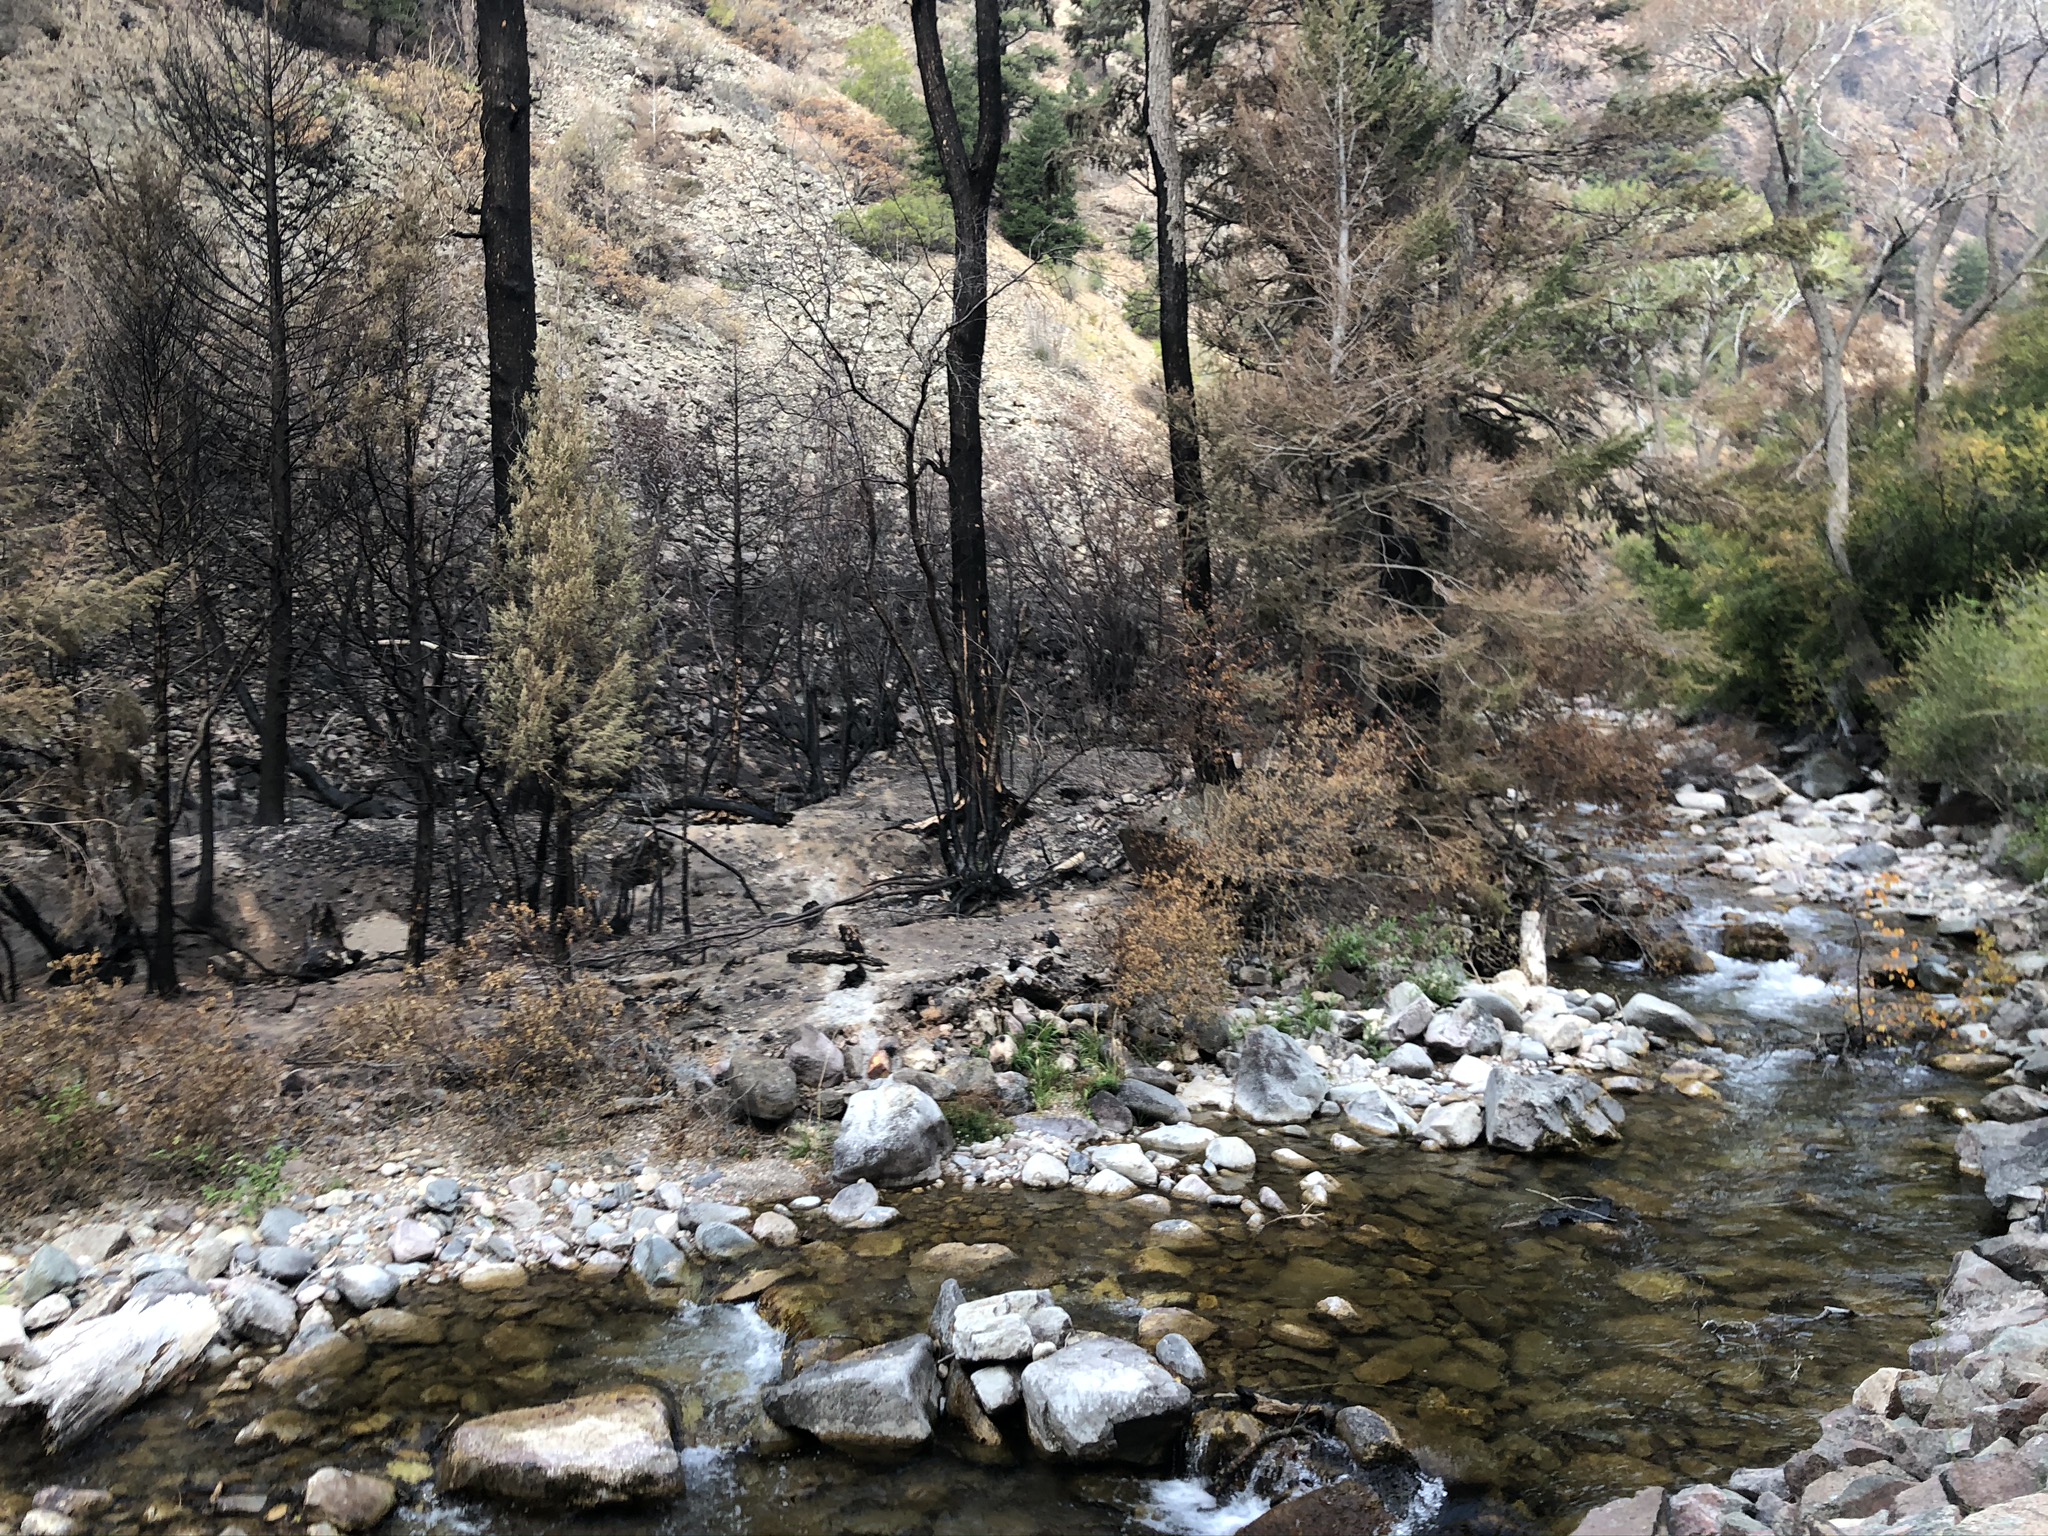
CPW’s aquatic biologists on the West Slope are concerned about critically high water temperatures and possible low dissolved oxygen. Some fish mortality has already been observed this summer. In addition to these issues, another factor unique to this year has been multiple mudslides and flash flood events resulting from last year’s fires. This has increased the sediment load in some river sections.
“With the high sediment load, the fish can’t find clear water,” said CPW Aquatic Biologist Kendall Bakich “They’ve got to sit through those conditions. And at nighttime, the temp isn’t coming down enough, so there’s no recovery for those fish right now. They’ve just got to hang on.”
These conditions aren’t just limited to the Colorado River.
“We’re likely looking at moving into a voluntary fishing closure on the Yampa River from the upstream boundary of the Chuck Lewis State Wildlife Area downstream to the west city limits of the town of Steamboat Springs,” said CPW Aquatic Biologist Bill Atkinson. “Water temps surpassed 75 degrees on Tuesday, so if it hits 75 degrees on Wednesday, the closure will be implemented.”
Biologists are also closely monitoring the Fraser and upper Colorado Rivers in Grand County, another area where temperatures are edging toward dangerous levels for trout.
Anglers should be aware that most of the major rivers on Colorado’s Western Slope are experiencing adverse conditions heading into the hottest days of summer. Follow the Leave No Trace Principle to “Know Before You Go” to the West Slope this summer and check out conditions related to mandatory and voluntary fishing closures: https://cpw.state.co.us/thingstodo/Pages/StatewideFishingConditions.aspx
Tips for anglers
CPW is encouraging trout anglers to consider fishing early in the day and in higher altitude lakes and streams as hot, dry conditions and reduced water levels increase stress to trout populations.
Heat, drought, and low water levels are contributing to elevated water temperatures in much of Colorado, depleting oxygen levels and leaving trout vulnerable. Trout are cold-water fish that function best in 50-60 degree waters. When temperatures exceed 70 degrees, they often stop feeding and become more susceptible to disease. Warm temperature and low water levels can also lead to algae blooms in rivers and reservoirs which cause oxygen levels to drop when algae die and decompose.
Anglers are asked to carefully consider the water and weather conditions when they go fishing for trout. If water seems too warm or fish appear lethargic, it would be best to leave the fish undisturbed. During mid-summer, try to fish early in the morning when the water is coolest.
“Get out early to avoid the higher water temperatures commonly seen in the afternoon and evening,” Martin said. “Anglers are also encouraged to seek out high-elevation trout lakes and streams, where water temperatures are more suitable and fishing doesn’t potentially add additional stress.”
Martin also urged anglers to add a hand-held thermometer to their fishing kits so they can test the waters they intend to fish.
“Anglers should monitor water temperatures and stop fishing when water temperatures start to approach 70 degrees,” she said. “If trout have difficulty recovering after being caught and are acting lethargic, it’s a good decision to call it quits for the day.”
Other suggestions include using heavier tippet and line to quickly reel in and release the fish, always wetting your hands before handling a fish, and to keep the fish submerged while unhooking and releasing it. Avoid taking the fish out of the water even for a quick photo in these conditions.
Dr. John Allen is an Assistant Professor of Meteorology in the Department of Earth and Atmospheric Sciences, Central Michigan University. Dr. Allen’s research focuses characterizing severe convective storms globally, and how these events that produce hailstorms and tornadoes are linked to climate change and variability from subseasonal to seasonal scales. In 2015 he and colleagues at Columbia developed an experimental seasonal tornado outlook, and he was a founding member of the experimental subseasonal Extended Range Tornado Activity Forecast group.
La Niña’s influence is linked to a higher frequency of tornadoes in the spring. However, although La Niña conditions were present through April, 2021, the year so far has recorded below-average tornado counts. Now that we are through the peak of the season, discussion among forecasters has turned toward deliberating over the low tornado frequency in what many predicted to be an active season (1).
What happened?
Photo by John Allen via NOAA.
To begin to address what happened in 2021, we need to go back to what these seasonal predictions are based on. While there are many contributing sources of tornado variability, there is a relationship between El Niño/Southern Oscillation (ENSO) and the frequency of tornadoes. Many people will remember that the last extremely active tornado year, 2011, was a strong La Niña year. A moderate La Niña was observed this past winter and was predicted to continue into the spring, leading to expectations and speculation in the media about a potentially active season. In this post, we consider the relevant factors and what this tells us about our capacity to predict seasonal tornado activity.
How ENSO and tornadoes are related
Connecting tornadoes to the larger climate system is a hard problem, as the frequency of tornadoes typically has large year-to-year variability. However, the idea of a connection between ENSO and severe thunderstorms and tornadoes is not new, with some of the most tornado-active years in history being associated with La Niña (Marzban and Schaefer 2001, Cook and Schaefer 2008). We also know that you don’t need ENSO to get a lot of tornadoes—a year when ENSO is neutral sees on average around 1,200 tornadoes across the United States, with the majority occurring in the March to June window.
In the past decade, we’ve made great advances in understanding what causes this year-to-year variability (2), thanks to extended computer simulations of past events, new high-quality datasets that can tell us about the favorable conditions for tornado development, and the development of longer records of tornado observations. Through this, we’ve been able to show that, generally, El Niño leads to fewer tornado events in the spring, while La Niña tends toward higher-than-normal frequency.
Photo by John Allen via NOAA.
During La Niña, the jet stream that drives much of our weather is somewhat weakened relative to neutral years, and the mid-latitude branch is diverted northward toward the Arctic over the western or central Pacific, and southward over northwestern North America. (Visit this post for details on how La Niña changes the jet stream.) This split path typically favors low-pressure systems developing east of the Rockies (Allen et al. 2015, Cook et al. 2017). It is this weather-climate “teleconnection” that most readily connects ENSO to tornado occurrence. The frequency of these low-pressure systems turns out to be key for bringing all the pieces together to produce tornado outbreaks, including wind shear (3), the fronts that initiate storms (Lagerquist et al. 2020), the moisture transport and the mid-level atmospheric instability that strengthen storms (Muñoz and Enfield 2011)
March-May values of a blend of tornado reports with a tornado environment index (TEI) for El Nino and La Nina years. Maps by climate.gov; data from C. Lepore and M. Tippett.
La Niña certainly does not always increase tornado likelihood. For example, a similar magnitude La Niña in 1989 was accompanied by a similar near- to below-average tornado season to 2021 so far. Like all climate influences on the weather scale, you can think of La Niña weighting the dice in favor tornado events, while on the flipside El Niño reduces the overall likelihood. In any one case, however, the specific atmospheric pattern on shorter timescales plays an important role (4).
Tornadoes in 2021
Tornado activity—and, more broadly, severe thunderstorm activity—for 2021 has been lower than average after a somewhat late start (5). Both January and February are fickle months for tornado frequency, so a slow start doesn’t tell us much about the season to come. Considering tornado frequency against the historical record of the last 2 decades, March 2021 was an outlier and considerably above average, April 2021 was equally a below-average outlier, and May 2021 was near average.
5th-95th percentile box-and-whisker distributions of Storm Prediction Center monthly tornado reports for the period 2000-2020 as compared to the value for 2021 (red square). Orange horizontal line corresponds to the dataset mean. Outliers are indicated by the unfilled circles. Inset: January 1 to May 31 2021 season-to-date comparison. Climate.gov figure based on original from John Allen. Correction 7/1/21: The original version of this graphic mislabeled the range of values shown by the blue boxes. The boxes show values in the 25th-75th percentile, not the 5th-95th percentile.
Despite being relatively quiet, for the season to date there was a preliminary total of 580 tornadoes reported through May 31st, less than the 2000–2020 average of 676.These events caused 13 fatalities. Also, despite the below-average tornado count in April, there were still some significant financial losses from severe weather. These resulted from hail events impacting major urban centers, and for 2021 the US is again on track to exceed $10 billion insured losses to severe storms.
The vast majority of tornadoes in 2021 accumulated over just a few days in March and one particularly active period in May. This is fairly typical, as tornado outbreaks—clusters of tornadoes—and consecutive days with tornadoes are certainly not unusual (Tippett et al. 2016, Trapp 2014). March saw tornadoes on 16 days, with concentrated periods on March 13th, 17th, and the 25th–27th. April had no real large accumulation of tornadoes on any single day, while May had tornadoes on all but 5 days, with large events between the 2nd to the 4th and on the 26th, and 18 days in June with no widespread events and low numbers of tornado reports (6).
The most recent story to grab the headlines has been the surprise that, through the middle of June 2021, we did not record an EF3 tornado for the first time since reliable records began in the 1950s (though this changed on June 20th). However, this is somewhat unsurprising, as without the volume of higher tornado frequency days, the probability of stronger tornadoes is also lower. This statistic can also be misleading – tornado damage is only rated if the tornado hits a structure well-built enough to withstand it. With shorter tornado path lengths, and fewer tornadoes, the likelihood of a storm crossing paths with structures or other damage indicators decreases. This is further compounded by tornadoes rarely occurring in their usual regions where damage is more likely.
Photo by John Allen via NOAA.
Putting it All Together: La Niña 2020–21
There has already been discussion this year about 2021 being “atmospherically” strange for a La Niña. While NOAA’s primary metric for ENSO, the three-month-average sea surface temperature anomaly in the Niño-3.4 region of the tropical Pacific (Oceanic Niño Index), suggested a moderate La Niña in terms of sea surface temperatures through the winter and early spring before waning into May, the circulation over North America didn’t seem to be playing the same tune. Nowhere is this more evident than considering the air pressure patterns as compared to historical La Niña events.
(Top) Geopotential height anomalies (m) at the 500 hectopascal (hPa) pressure level during January–May 2021. Cold colors indicate below-average atmospheric pressure and warm colors indicate above-average atmospheric pressure at a level about three miles above the Earth’s surface. (Bottom) The average 500 hPa geopotential height anomalies from January–May for the 9 strongest La Niña episodes since 1950. Note the different scaling between the top and bottom figures. The top figure has a wider range of values because the top figure includes contributions from both predictable signals, like La Niña, and random weather variability, whereas the bottom figure has filtered out most of the random weather variability. Anomalies are calculated with respect to the 1991-2020 base period. Figure by John Allen and NOAA Climate.gov with NCEP/NCAR Reanalysis data obtained from the NOAA Physical Sciences Laboratory.
The eastern Pacific high-pressure signature typical of La Niña was present, but this year was considerably stronger and broader across the north Pacific, while the low-pressure region over the northwestern United States was much weaker. Stronger surface highs over the eastern Pacific reflected the blocking of the typical flow pattern, and lack of troughing saw fewer low-pressure systems than average form east of the Rockies, with significant implications for precipitation and severe weather frequency over the Plains and Midwest.
This is not to say we didn’t get some smaller tornado outbreaks, such as those in late March and early May, but overall the spring and early summer were less favorable for producing these important low-pressure systems, and hence tornadoes.
The un-La Niña-ish atmosphere over North America meant that suggesting that the spring tornado season would be active was fraught with danger! Nonetheless, some of the calling cards of La Niña did persist from the winter months; for example, persistent dry conditions across the southwest since last fall. The challenge here is that it is nearly impossible to attribute tornado variability solely to the contributions of ENSO. As has been discussed on the ENSO Blog before, ENSO is very much like the violin section of an orchestra—it leads the movement of variability in our atmosphere. But what would a symphony by Beethoven or Mozart sound like without punctuation from other sections of the orchestra, both on shorter intervals and helping drive the overall piece?
Photo by John Allen via NOAA.
The tornado season of 2021 might be past its peak, but we certainly aren’t out of the woods just yet. However, the difference between expectation (higher than normal) and observations (lower than normal) thus far highlights the need to further explore the details of what drives variability in tornado frequency. Open questions also remain about how long ENSO’s influence persists into the spring months and how robust its influence on the atmosphere is, factors that may have played a role in this season’s evolution. It also suggests that greater caution is needed to understand the other processes at play before suggesting any given La Niña year will be the next 2011–as 1989 showed us prior to 2021, not all La Niña events favor such extreme generational outliers.
Lead Editor: Emily Becker
Footnotes
1) Tornado season is not easily defined, as tornadoes can occur on any day of the year. Despite this challenge, the vast majority of tornadoes occur between the beginning of March and the end of June each year, with ~1000 of the 1400 per year on average (averaged over 2005–2015) occurring between this period. Tornado season also varies by location. In the southeastern United States, tornado season is typically between February and April. In the central Great Plains, the peak is closer to April to June, and in the Midwest and close to the Rockies May through the end of June are typically the peak months. By July, the majority of tornado activity has shifted north to Canada.
2) Some recent studies include Lee et al. 2013, Allen et al. 2015, Cook et al. 2017, Lepore et al. 2017, Molina et al. 2018, and Lee et al. 2021.
3) Wind shear is the presence a degree of changing wind speed and direction at different levels of the atmosphere. The easiest way to see wind shear is by looking up at the clouds – if you see clouds moving in different directions, that is wind shear. Wind shear is important to the storms that produce tornadoes, it helps the organize the storms shape, move rain away from the updraft, and allows a storm to sustain itself outside the normal lifetime of a thunderstorm to several hours. Developing tornadoes also require the presence of changing wind speed and direction with height close to the ground, as the presence of shear generates ‘spin’ that can be stretched upwards to form the tornado.
4) The trouble with understanding tornado variability is that it’s affected by both small-scale and large-scale processes. Non-ENSO contributors to tornado variability identified so far include the Arctic Oscillation, North Atlantic Oscillation, Madden-Julian Oscillation, Global Wind Oscillation, and sea surface temperatures in the Gulf of Mexico (Molina et al. 2018). Each of these signals can project upon ENSO in either a constructive or destructive manner such that it can be very difficult to tease out which element was responsible for any sub-seasonal period of activity, and these interplays are generally poorly understood. That these influences can range from sub-seasonal scales of weeks to months can mean the difference between an overall active season and an inactive one can be dependent on the smallest of margins.
Adding to the challenge is that tornadoes are rather temperamental about the conditions they form in and difficult to predict on short timescales, making them a challenging seasonal forecast target. Too warm and tornadoes become less frequent, too dry and the same result is likely. Even in a “perfect” environment where violent tornadoes seem certain, timing is everything, and small differences as to the arrival of an individual trough impulse, or a slightly warmer-than-expected layer in the atmosphere can mean no storms form at all. This was exemplified in the predicted violent tornado outbreak that failed to realize on May 20, 2019.
5) A severe thunderstorm is defined as any convective storm that produces one or more of hail of 1 inch or large in diameter, storm induced winds of 58 mph or greater, or a tornado.
6) Long periods of relative quiet are more in line with La Niña conditions. For example, after more than 800 tornadoes in April 2011, May saw little to no activity before the 21st, before producing 241 tornadoes in the following 5 days. While these periods of relatively low frequency occur in most years, this pattern is particularly prevalent during La Niña, as is a tornado season that is skewed toward occurring earlier in the spring (Allen et al. 2018).
References
Allen, J.T., Molina, M.J. and Gensini, V.A., 2018. Modulation of annual cycle of tornadoes by El Niño–Southern Oscillation. Geophysical Research Letters, 45(11), pp.5708-5717.Cook, A.R. and Schaefer, J.T., 2008. The relation of El Niño–Southern Oscillation (ENSO) to winter tornado outbreaks. Monthly Weather Review, 136(8), pp.3121-3137.
Cook, A.R., Leslie, L.M., Parsons, D.B. and Schaefer, J.T., 2017. The impact of El Niño–Southern Oscillation (ENSO) on winter and early spring US tornado outbreaks. Journal of Applied Meteorology and Climatology, 56(9), pp.2455-2478.
Lagerquist, R., Allen, J.T. and McGovern, A., 2020. Climatology and Variability of Warm and Cold Fronts over North America from 1979 to 2018. Journal of Climate, 33(15), pp.6531-6554.
Lepore, C., Tippett, M.K. and Allen, J.T., 2017. ENSO‐based probabilistic forecasts of March–May US tornado and hail activity. Geophysical Research Letters, 44(17), pp.9093-9101.
Lee, S.K., Atlas, R., Enfield, D., Wang, C. and Liu, H., 2013. Is there an optimal ENSO pattern that enhances large-scale atmospheric processes conducive to tornado outbreaks in the United States?. Journal of Climate, 26(5), pp.1626-1642.
Lee, S.K., Lopez, H., Kim, D., Wittenberg, A.T. and Kumar, A., 2021. A Seasonal Probabilistic Outlook for Tornadoes (SPOTter) in the Contiguous United States Based on the Leading Patterns of Large-Scale Atmospheric Anomalies. Monthly Weather Review, 149(4), pp.901-919.
Marzban, C. and Schaefer, J.T., 2001. The correlation between US tornadoes and Pacific sea surface temperatures. Monthly Weather Review, 129(4), pp.884-895.
Molina, M.J., Allen, J.T. and Gensini, V.A., 2018. The Gulf of Mexico and ENSO influence on subseasonal and seasonal CONUS winter tornado variability. Journal of Applied Meteorology and Climatology, 57(10), pp.2439-2463.
Munoz, E. and Enfield, D., 2011. The boreal spring variability of the Intra-Americas low-level jet and its relation with precipitation and tornadoes in the eastern United States. Climate dynamics, 36(1-2), pp.247-259.
Tippett, M.K., Lepore, C. and Cohen, J.E., 2016. More tornadoes in the most extreme US tornado outbreaks. Science, 354(6318), pp.1419-1423.
Trapp, R.J., 2014. On the significance of multiple consecutive days of tornado activity. Monthly Weather Review, 142(4), pp.1452-1459.
Western governors told top federal officials that it was time to dramatically rework programs to help states recover from wildfires, thin overgrown, drought-ravaged forests, and protect mountain water systems.
Governors representing 17 states gathered last week for the virtual Western Governors’ Association conference, which included sessions on forest health, climate change and broadband initiatives, among other policy concerns.
Because the federal government owns vast swaths of land across the West, expanding shared stewardship programs, building in more flexibility to distribute more cash in new ways, and creating a new “green” timber industry to help thin ailing forests and reduce wildfire risk are all needed quickly, according to Colorado Gov. Jared Polis, who addressed a roundtable meeting with U.S. Secretary of Agriculture Tom Vilsack.
“With the federal government owning a big part of our state, it’s a shared responsibility to address forest health and fire mitigation,” Polis said. “Shared stewardship agreements are a valuable tool. But these need to be reimagined and re-upped given this new normal.”
The Western Governor’s Association represents 19 western states, as well as Guam, American Samoa and the Northern Mariana Islands.
The federal government owns roughly 30 percent of Colorado’s land and even more in other states, such as Idaho and Montana.
Thinning forests and protecting mountain watersheds is an often daunting, cross-boundary exercise between the U.S. Forest Service, the U.S. Bureau of Land Management, and state and local agencies.
Congress has been working on a massive infrastructure bill that has some bipartisan support and which will, if approved later this year, provide millions of dollars in new spending for roads, bridges and rural broadband networks, and may also include new funding to help deal with the devastation from wildfires across the West.
Governors made clear to federal leaders that forest health needs to be included in that definition of infrastructure, in part because of its importance to the West’s water supplies. In Colorado, for instance, approximately 80 percent of the drinking water for all residents flows off of forested watersheds.
“We have to have more treatment and to do that we will need more resources,” said Idaho Gov. Brad Little. “Hopefully we can get Congress to understand that as they are working on infrastructure [funding] for bridges and roads, we need to invest in our forests as well.”
Vilsack told governors he was hopeful that the new infrastructure bill as well as other federal legislation, such as the Great American Outdoors Act, would deliver funding and new programs that would help the West cope with a warming climate, water shortages and more frequent wildfires.
“We’re aware of the fire issue and we know the importance of having additional money on the treatment side, as well as ways to create more markets for the wood we produce [when forests are thinned],” Vilsack said.
“But I see a lot of opportunity, especially if we innovate and create voluntary programs and encourage people to take advantage of the income crops that are going to be created,” Vilsack said.
Jerd Smith is editor of Fresh Water News. She can be reached at 720-398-6474, via email at jerd@wateredco.org or @jerd_smith.
The Snake River Water District is planning ahead for increasing water needs in the Keystone area due to population growth over the past decade.
District Executive Director Scott Price said in a statement that the district recently created a water system master plan looking into emerging challenges in the next 10 years. The plan includes a prioritized list of short- and long-term projects.
According to the plan, the district needs to invest $38.5 million over the next decade to address trouble areas, update the old water treatment plant and add a new pump station and storage tank. The district is currently seeking grants and loans to help fund the improvements. It is also evaluating user rates that have remained unchanged for the past eight years.
The district will hold public meetings with key stakeholders to discuss the financial plans. There will be two public meetings July 22, including a 1 p.m. livestream on the district’s Facebook page and an in-person meeting at 6:30 p.m. at the district’s office in Keystone, 0050 Oro Grande Drive.
Lake Powell is seen in a November 2019 aerial photo from the nonprofit EcoFlight. Keeping enough water in the reservoir to support downstream users in Arizona, Nevada and California is complicated by climate change, as well as projections that the upper basin states of Colorado, Utah, Wyoming and New Mexico will use as much as 40% more water than current demand. A recent white paper from a lineup of river experts calls those use projections into question. CREDIT: ECOFLIGHT via Aspen Journalism
Polis signs latest $20 million infusion for Colorado Water Plan as hotter, drier climate grips Southwest
Colorado Gov. Jared Polis has signed off on increased funding for water development projects that state officials regard as critical to meet growing demands. But the state’s plans to secure more water from rivers here are colliding with the hotter, drier climate that’s hammering the Southwest, where Colorado River reservoirs are at record-low levels.
Federal authorities warn hydropower electricity for millions of people (and their air conditioners) could be jeopardized if water levels in Lake Powell and Lake Mead — now both about 34% full — fall much lower. That’s partly why water officials from seven states met in Denver this week to size up perils before their next round of negotiations over how states deal with diminishing water.
Colorado, New Mexico, Utah and Wyoming (the Upper Basin states along the Colorado River) are facing pressure from Lower Basin states (Arizona, Nevada, California) to use less water — even though the 1922 Colorado River Compact legally entitles them to use more — to try to save the downriver reservoirs.
“There’s a reality that we do have a shrinking water supply and we’re all going to have to figure out new ways to reduce our use. We try to stay out of any state’s business, but we also realize there’s not enough water for the Upper Basin to use its full allotted water under the compact,” said Bill Hasencamp, the Colorado River resources manager for the Metropolitan Water District of Southern California, which serves 19 million people in the Los Angeles area and San Diego…
Colorado leaders over the past six years have awarded more than $500 million in grants and loans for 323 projects in carrying out the state’s water plan — which calls for $100 million a year through 2050. Polis last week signed the latest monetary infusion into law: HB21-1260 for $20 million more to the Colorado Water Conservation Board to go toward increased water storage capacity and supply. The bill provides $15 million for loans and grants and $5 million for the regional “roundtable” panels that have planned 500 local water development projects.
Polis also signed off on SB21-189 to spend $1.2 million more in construction funds for the implementation of the overall $20 billion water plan, which was launched in 2015 to ensure enough for a productive economy — from cities to farms to the recreation industry — while preserving healthy rivers through efficient water use and carefully designed water projects. Two in progress would siphon significantly more water out of the Colorado River basin — an expanded reservoir for Denver and enlarged Moffat system that diverts west-flowing water to the northern Front Range…
“We are already actively talking about and experiencing cuts, which have been particularly painful in this very dry year,” [Rebecca Mitchell] said, referring to the state’s allocation system that forces junior water-rights holders to use less in dry times. “These are historically low conditions and we need basin-wide solutions that we work on together.”
State officials in Colorado, Utah and Wyoming contend they’re entitled under the 1922 compact to use as much as 2 million acre-feet more water. But those shares are based on century-old calculations for how much water the river can provide — 15 million acre-feet a year — rather than the 12.3 million acre-feet average total flow since 2000.
Contingency plans for enduring severe droughts are expected to force mandatory cutbacks next year in Arizona, Nevada and Mexico.
Monument Creek, taken looking south from the northern section of Monument Valley Park via Loraxis
FromThe Tri-Lakes Tribune (Benn Farrel) via The Colorado Springs Gazette:
With limited water resources, the Town of Monument looks to encourage water conservation among residents while the area is experiencing high temperatures in its semi-arid climate and increased water demand.
As the town invests $22 million in improvements to the infrastructure of its water system, an increase in water production and additional storage is in the near future. However, to maintain healthy landscapes around the community, the town is encouraging responsible water practices, implementing water restrictions and has offered tips to efficient water use…
Properties within the service of Triview Metropolitan District are also under restrictions from May 1 through Sept. 30 every year…
Properties which use the Woodmoor Water and Sanitation District are restricted from June 1 to Sept. 30…
Photo from the Colorado Independent.
On May 31, the Town of Monument released an informational video, “Conserving water using rain barrels,” on its YouTube channel, informing residents of their rights to conserve rainwater with rain barrels and how to do it. A few years ago, the State of Colorado legislature passed House Bill 16-1005 which allows single-family residences to collect rainwater in two barrels maximum, each up to 110 gallons, to be used solely for outdoor use and not consumption or indoor use. It also mandates the top of the barrels must be sealed to prevent pests from getting in.
The bill was geared toward helping homeowners offset the use of their irrigation systems for their landscaping.
Residents of the Town of Monument, who use of the town’s water system, are offered a $50 rebate if receipts for the rain barrel purchases are provided and their account with the Monument Water Department is current. The rebate is given in the form of a credit toward the account.
Tips for installing the rain barrels are available on the Town of Monument’s YouTube channel, or by visiting the town’s website, tomgov.org, clicking on the “Community” tab and visiting the Garden & Landscaping page.
Denver Basin Aquifer System graphic credit USGS.
The Triview Metropolitan District is presently making a transition from making use of the non-renewable groundwater from the Denver Basin to renewable surface water. Last year, the district acquired 568-acre feet of water rights and purchased another 1,000-acre feet of water storage in April. Triview acquired nearly 850 acres of land to be used for the development of two large reservoirs which are near completion.
View atop Mount Royal overlooking the town of Frisco, CO and Lake Dillon. Photo credit: Ndebel Creative Commons Attribution-Share Alike 4.0
Here’s a guest column from Melissa Sherburne that’s running in The Colorado Sun:
We all have a choice to either engage in efforts to help combat the loss of biodiversity and climate change, or watch from the sidelines.
Because we love our public lands and want to protect them for future generations, the Frisco Town Council recently unanimously passed a resolution that states that we stand with President Biden, U.S. agencies, members of Congress, state and local officials, and others in support of science-based, locally-led conservation efforts that help the country achieve the goal of protecting 30% of our country’s lands and waters by 2030, commonly referred to as 30×30.
These efforts are a part of the administration’s America the Beautiful vision for how the United States can work collaboratively to conserve and restore the lands, waters, and wildlife that support and sustain our country and create jobs and strengthen the economy.
Melissa Sherburne. Photo credit: Town of Frisco
Last month, the world’s leading biodiversity and climate experts released an important peer-reviewed report that emphasizes the importance of looking at the loss of biodiversity and climate crises as one problem rather than tackling each individually. The report authors warn that if we don’t take this approach and instead try to solve these problems in isolation, we do so at our peril.
I am very encouraged that the 30×30 goal contained in the America the Beautiful vision does just what scientists are recommending by acknowledging that we have to address the loss of nature and climate change together. If we can restore whole ecosystems, then they will, in turn, cheaply and quickly absorb the carbon emissions that are the root cause of climate change and are wreaking havoc on the planet.
30×30 can ensure that we preserve a healthy network of biodiversity and protect our natural areas while not only helping to offset climate change, but also protect and restore more public lands that are foundational to our way of life, health, and economies in mountain communities like Frisco.
Local governments know how important it is to set attainable and forward-looking goals. Achievable targets can make small differences in the near term, and more significant impacts over the long term.
Making decisions about finite resources like lands and waters and climate change can be overwhelming, but they are so important because they have lasting impacts. We have to ensure that we are stewards for future generations.
I am proud that the Town of Frisco is committed to conserving our lands and waters. In 2020, we worked with Colorado Open Lands to place a permanent conservation easement on 10.88 acres in the Meadow Creek wetlands and also restored 0.41 acres of wetlands. This effort grew out of the need to restore and preserve a new wetlands area because we lost wetlands during the Frisco Bay Marina’s 2019 “Big Dig” project.
Because of this conservation easement, the land is protected from development allowing community members and visitors the opportunity to enjoy these lands for recreation and rejuvenation well into the future.
Because Frisco is surrounded by public land, we must continue to work in partnership with community partners, the U.S. Forest Service, Summit County, and Denver Water to protect natural resources and wildlife habitat, encourage human-powered recreation, and mitigate wildfire risk.
I would like our town to engage in more regional conservation efforts like Summit Safe Passages, which works to create safer roads for wildlife and people by building wildlife crossing structures across roads to reduce wildlife related collisions, ensure healthy wildlife populations and save taxpayers money.
We all have a choice to either engage in efforts to help combat the loss of biodiversity and climate change, or watch from the sidelines. I am grateful that President Biden has chosen the former by setting forth an inclusive and locally-led America the Beautiful conservation vision that includes the 30×30 goal — a way for us to collaborate and achieve results for natural resource protection at a national scale.
We and future generations will benefit if local, state, tribal governments, and local communities like Frisco can collaborate more frequently to achieve science-based voluntary landscape scale conservation.
Melissa Sherburne is a council member for the Town of Frisco, a board member for High Country Conservation Center, and a planning and public lands consultant with a master’s degree in Environmental Management degree from Duke University and a bachelor’s in Environmental Studies from the University of Colorado Boulder.
Cross Mountain Ranch, a sprawling cattle, guest and hunting operation near Maybell and the Yampa’s confluence with the Little Snake River, needed water to flood meadows for sheep and other livestock.
But there was nothing left to divert into the ranch’s ditch at Lily Park. A state official’s snapshot from the time shows no Yampa there at all — just a gravel bar with a stagnant puddle at the base.
The ranch may be far down river, but it’s high in priority. Under Colorado water law, that means the ranch long ago secured water rights that are vastly senior to many other users on the river. So if the ranch needs it, the state water engineer has to put a “call” on the Yampa and tell junior holders upriver to stop using, letting their water flow on toward Cross Mountain and the Utah border.
Yampa division engineer Erin Light did just that for the first time ever in 2018. She has an 80-page list of descending water rights holders on the Yampa. The ranch is on page one.
The easiest way to find enough water to meet the ranch’s rights was to call Craig Generating Station, a massive coal-fired electricity plant holding a variety of river rights and reservoir shares in the Yampa basin. The power station, managed by Tri-State Generation and owned by a variety of Western utilities, has been cooperative on water issues, Light said, and quickly sent more water downstream.
Then it happened again in 2020. Drought. A nearly dry river by the time the Yampa neared Dinosaur National Monument. And an official state call.
Yampa River at Stagecoach Res Inlet 10 CFS 5-24-21 May 2021. Photo credit: Scott Hummer
This year, the Yampa is looking severely troubled again. It’s no longer a fluke, but a trend. And so Light has asked her boss, state engineer Kevin Rein, to approve her 15-page memorandum and request declaring the Yampa officially “over appropriated.”
Too many users have divided up the river’s dwindling water too many ways, and future ditch diggers and well drillers need to be warned. Dozens of new water rights applications hit the water court for Yampa claims every year, she added…
Yampa not alone under drought pressure
The Yampa isn’t the first Colorado river to suffer the indignity of an official declaration of over appropriation. In fact, most of the major rivers were divided too many ways decades ago and therefore need to be managed down to the drop, from the South Platte on the Front Range, to the Arkansas and the Poudre.
But the fact it’s happening to the Yampa, long running relatively wild and free through the thinly-populated open range of northwest Colorado, is a clear danger sign, according to state officials and conservation groups. Drought in the short term and climate change in the long term are overlaid by relentless economic growth throughout Colorado, turning debates over water use from a distant worry into a current event…
West Drought Monitor map June 29, 2021.
Light’s detailed memo justifying the over appropriation declaration for the Yampa noted that water volume delivered by the river has fallen in recent decades from a norm of 1.5 million acre-feet a year to 1.1 million acre-feet. At the U.S. Geological Survey’s Maybell gauge on the Yampa on Friday, the river flowed at about 340 cubic feet per second, less than 16% of the median figure for that day in 105 years of recordkeeping…
So what would state approval of the over appropriation designation mean in practical terms for northwestern Colorado counties? Developers seeking to drill a new well in the Yampa Basin will see new state scrutiny of their plans to make sure they are not drawing down river water already owned by a senior rights holder. If Light thinks there would be damage, she can require the developer to augment the loss with a different supply, such as stored reservoir water or a pond capturing water during higher runoff periods…
Anyone with an improperly permitted well will also face new reviews, and demands for augmentation. Because of the way Colorado’s rivers and water tables behave, state engineers consider wells to be drawing down river water just as if they were taking it from the river’s surface.
People could still apply for new surface rights from the Yampa, but they will be warned, Light said, that their supply is likely to run out by August or September when senior rights holders put in their call to protect what they need.
Sunset from the western shore of Antelope Island State Park, Great Salt Lake, Utah, United States.. Sunset viewed from White Rock Bay, on the western shore of Antelope Island. Carrington Island is visible in the distance. By Ccmdav – Own work, Public Domain, https://commons.wikimedia.org/w/index.php?curid=2032320
FromThe Associated Press (Lindsay Whitehurst). Click through and read the whole article and for the photographs. Here’s an excerpt:
For years, though, the largest natural lake west of the Mississippi River has been shrinking. And a drought gripping the American West could make this year the worst yet.
The receding water is already affecting the nesting spot of pelicans that are among the millions of birds dependent on the lake. Sailboats have been hoisted out of the water to keep them from getting stuck in the mud. More dry lakebed getting exposed could send arsenic-laced dust into the air that millions breathe…
The lake’s levels are expected to hit a 170-year low this year. It comes as the drought has the U.S. West bracing for a brutal wildfire season and coping with already low reservoirs. Utah Gov. Spencer Cox, a Republican, has begged people to cut back on lawn watering and “pray for rain.”
For the Great Salt Lake, though, it is only the latest challenge. People for years have been diverting water from rivers that flow into the lake to water crops and supply homes. Because the lake is shallow — about 35 feet (11 meters) at its deepest point — less water quickly translates to receding shorelines…
The waves have been replaced by dry, gravelly lakebed that’s grown to 750 square miles (1,942 square kilometers). Winds can whip up dust from the dry lakebed that is laced with naturally occurring arsenic, said Kevin Perry, a University of Utah atmospheric scientist.
Smog blankets Salt Lake City. Photo credit Wikimedia Commons.
It blows through a region that already has some of the dirtiest wintertime air in the country because of seasonal geographic conditions that trap pollution between the mountains…
Luckily, much of the bed of Utah’s giant lake has a crust that makes it tougher for dust to blow. Perry is researching how long the protective crust will last and how dangerous the soil’s arsenic might be to people…
Most years, the Great Salt Lake gains up to 2 feet (half a meter) from spring runoff. This year, it was just 6 inches (15 centimeters), Perry said.
“We’ve never had an April lake level that was as low as it was this year,” he said.
More exposed lakebed also means more people have ventured onto the crust, including off-road vehicles that damage it, Great Salt Lake coordinator Laura Vernon said…
Brine shrimp support a $57 million fish food industry in Utah but in the coming years, less water could make the salinity too great for even those tiny creatures to survive.
American White Pelicans flying in formation. Photo credit Missouri Department of Conservation.
“We’re really coming to a critical time for the Great Salt Lake,” said Jaimi Butler, coordinator for Great Salt Lake Institute at Westminster College in Salt Lake City. She studies the American white pelican, one of the largest birds in North America.
They flock to Gunnison Island, a remote outpost in the lake where up to 20% of the bird’s population nests, with male and female birds cooperating to have one watch the eggs at all times.
“Mom goes fishing and dad stays at the nest,” Butler said.
But the falling lake levels have exposed a land bridge to the island, allowing foxes and coyotes to come across and hunt for rodents and other food. The activity frightens the shy birds accustomed to a quiet place to raise their young, so they flee the nests, leaving the eggs and baby birds to be eaten by gulls.
Denver Water cuts back on some of its West Slope supplies to help struggling streams.
The Colorado River is hurting.
The struggles of the river’s largest reservoirs, Lake Mead and Lake Powell, have been well documented over the last decade as drought has ravished the West.
The story, however, starts more than 500 miles upstream in Grand County, Colorado.
The county is filled with streams that make up the beginning of the mighty Colorado’s journey in the mountains north of Grand Lake. Around 60% of the water in Grand County is diverted from these streams and used for agricultural and municipal water supply, mostly on the Front Range.
That includes the Denver metro area, which receives about 20% of its water from Grand County, where Denver Water has water rights dating back to the 1920s. Most of the water is captured in rivers and streams around Winter Park when mountain snow melts in the spring.
Rivers and creeks in Grand County are part of Denver Water’s North Collection System. Water flows through the Moffat Tunnel, under the Continental Divide, to Gross and Ralston reservoirs. Image credit: Denver Water.
But, after a lackluster runoff season on the West Slope combined with dry soils from the past year, the hot, dry conditions in early June meant the high-country rivers and streams needed help.
Denver Water responded by voluntarily reducing diversions from several Grand County creeks and coordinating with the Colorado River District, Grand County, Northern Water and other Learning By Doing partners to adjust operations, where possible, to help boost water levels in some of the more troubled areas.
“While our primary responsibility is to make sure we’re supplying water to 1.5 million people in the metro area, we’re always looking for opportunities to help improve conditions on the rivers, to help the aquatic environment, recreation and communities they flow through,” said Nathan Elder, Denver Water’s manager of water supply.
By reducing diversions, Denver Water foregoes collecting a portion of water it is legally entitled to collect for its water supply in exchange for improving streams and tributaries along the Colorado River.
The Fraser River flows below a Denver Water diversion structure in Grand County in June 2021. Denver Water voluntarily released around 11,000 acre-feet of water from streams in the county from June 6 through early July in 2021 to improve aquatic habitat downstream. Photo credit: Denver Water.
It started with a plea for help
On June 5, the Colorado River District asked Denver Water for help after reporting extremely low water levels and critically high water temperatures on the Colorado River. The river district reported conditions were creating unhealthy habitat for fish and aquatic insects.
“When the email came in Saturday morning, we were in a position to quickly respond and reduce the amount of water we were pulling from several Grand County creeks,” Elder said.
Denver Water has continued making operational adjustments since that email.
The utility estimates that by early July it will have voluntarily foregone collecting around 11,000 acre-feet of water from Grand County to help keep more water in the Colorado and Fraser rivers. That’s roughly enough water to supply over 44,000 residences for one year.
“It has been helpful to hear directly from stakeholders in Grand County, including Trout Unlimited and ranchers along the river, on where we may be able to truly help the river, the community and the environment with our operational adjustments,” Elder said.
“With help from the West Slope, we’ve been able to target specific areas and send some beneficial water downstream.”
This includes adjusting water releases from Williams Fork Dam twice a day in a way that also benefits the Colorado River.
For example, when releasing water from the dam, Elder and his team try to time the flows, so the water reaches the river in Kremmling — an area prone to higher river temperatures — during hotter times of the day.
The higher water level helps to cool down the water, which is better for the aquatic environment.
Warm temperatures and low water levels create unhealthy conditions for fish in Colorado streams. Denver Water worked with the Colorado River District to send cooler water downstream in June to help lower temperatures on the Colorado River near Kremmling. Photo credit: Denver Water.
Position to help
The wet spring conditions along the Front Range boosted water supplies in Denver Water’s South Platte River collection system, which drastically reduced customers’ demand for water across the metro area — where Denver Water serves a quarter of the state’s population.
In fact, from January to May, Denver Water’s customer water use hit a 50-year low across the metro area, despite nearly 600,000 more people in its service area since 1970. That includes years in which the metro area was on mandatory drought restrictions.
“Some of the low use may be due to COVID-19 impacts on business and obviously a wet, cool spring helped,” said Greg Fisher, demand manager for Denver Water.
“It’s a great sign that our customers really understand efficient water use and let Mother Nature do the watering for them when possible.”
This wet spring on the Front Range also helped provide additional flexibility on how Denver Water collected and distributed water across its collection system during the spring snow runoff.
“We were able to turn off the Roberts Tunnel in April, which helped bring water levels up in Dillon Reservoir for boating,” Elder said.
“The conditions also enabled us to send more water down the Blue River below Dillon Dam to help improve fish habitat around Silverthorne instead of sending the water to the Front Range.”
Denver Water uses the Roberts Tunnel to bring water from Dillon — the utility’s largest reservoir — under the Continental Divide to the Front Range.
But flexibility like this is not always possible, especially with the myriad threats Denver’s water system is facing.
“Between the rising temperatures, changes to the timing of spring runoff, extreme fire behavior and half a million more people expected in the metro area by 2040, our ability for flexible operations is decreasing in a time when we need it the most,” said Elder.
“We must take an ‘all-in’ approach that includes conservation, water reuse and development of new water supplies so we can continue to maximize the benefits of a large system.”
Wet conditions in the metro area during the spring of 2021 reduced demand for water for irrigation. The lower demand gave Denver Water more flexibility to fill its reservoirs and provide additional water for environmental benefits on the West Slope. Photo credit: Denver Water.
More flexibility
According to Elder, hot, dry weather conditions highlight the benefits of having a large water collection system, as it provides the water planning team more flexibility in its operational playbook.
Denver Water relies on a network of reservoirs to collect and store water. The large collection area provides flexibility for collecting water as some areas receive different amounts of precipitation throughout the year. Image credit: Denver Water.
The vision for the Gross Reservoir Expansion Project, which is in its final steps of permitting, is an example of how additional water storage can really help streams in times of drought.
“As part of the Gross Reservoir Expansion, some of the voluntary things we’re doing this year — like leaving more water in the Grand County rivers — will become required annual operations for us,” said Elder.
Denver Water is planning to expand Gross Reservoir in Boulder County. The additional storage capacity will create more balance in the utility’s storage and give water planners more flexibility in their operational strategy. Photo credit: Denver Water.
That’s because Denver Water is one of 18 partners who signed the Colorado River Cooperative Agreement in 2013, ushering in a new era of cooperation between the utility and West Slope stakeholders, all with the vested interest in protecting watersheds in the Colorado River Basin.
As part of that agreement, a process called “Learning by Doing” was created, which has helped the utility stay better connected on river conditions in Grand County. The partnership is a collection of East and West Slope water stakeholders who help identify and find solutions to water issues in Grand County.
“Denver Water has been part of Grand County for over 100 years, and we understand the impact our diversions have on the rivers and streams,” said Rachel Badger, environmental planning manager at Denver Water.
“Our goal is to manage our water resources as efficiently as possible and be good stewards of the water — and Learning By Doing helps us do that.”
That’s because Denver Water is one of 18 partners who signed the Colorado River Cooperative Agreement in 2013, ushering in a new era of cooperation between the utility and West Slope stakeholders, all with the vested interest in protecting watersheds in the Colorado River Basin. As part of that agreement, a process called “Learning by Doing” was created, which has helped the utility stay better connected on river conditions in Grand County. The partnership is a collection of East and West Slope water stakeholders who help identify and find solutions to water issues in Grand County. “Denver Water has been part of Grand County for over 100 years, and we understand the impact our diversions have on the rivers and streams,” said Rachel Badger, environmental planning manager at Denver Water. “Our goal is to manage our water resources as efficiently as possible and be good stewards of the water — and Learning By Doing helps us do that.”
The U.S. has the highest per-capita greenhouse gas emissions of any other country, according to the Center for Climate and Energy Solutions.
Americans can take easy steps to cut planet-warming emissions like carbon dioxide and simultaneously save money.
Efficient households can save $1,560 a year on natural gas and utility costs over a 50-year period, according to a University of Michigan analysis.
1. Use LED lightbulbs
LED lightbulbs use at least 75% less energy than standard incandescent bulbs and last 25 times longer, according to the U.S. Department of Energy.
Households can save $75 on energy costs a year by swapping out just five of their most frequently used bulbs with Energy Star-certified LEDs, according to the Consumer Federation of America.
(LED stands for “light-emitting diode.”)
By 2027, widespread use could save more than a cumulative $30 billion at today’s electricity prices, the Energy Department said.
Replacing all bulbs in a household would be the equivalent of removing roughly 5.3 million to 6.4 million cars from the road, according to an estimate from Katharine Hayhoe, chief scientist at the Nature Conservancy.
“The basic problem we have is often our default [choice] is not the best, and not necessarily the cheapest,” Hayhoe said. “It’s just the default.”
(As a practical note: Choose LEDs between 2700 and 3000 kelvins to match the soft, yellow-white light of old bulbs; 4000K to 6500K bulbs will have a cooler or bluish light, according to the Consumer Federation.)
2. Unplug devices
Energy consumed by electronic devices in standby mode accounts for 5% to 10% of household energy use — adding up to an extra $100 a year, on average, according to the Center for Sustainable Systems.
The Center recommends unplugging devices when not in use or plugging them into a power strip and turning off the power strip.
The Center recommends unplugging devices when not in use or plugging them into a power strip and turning off the power strip.
3. Change the thermostat
Households can reduce their heating and cooling bills by resetting their thermostats when asleep or away from home. A programmable thermostat does this automatically according to a pre-set schedule.
Here’s the concept: Set the temperature lower in colder weather and higher in warmer weather, which uses less energy.
This may be easier now that Americans who’d been working from home during the Covid pandemic are heading into the office more frequently.
Households can save up to 10% a year by turning the thermostat 7°F to 10°F from its normal setting for eight hours a day, according to the Energy Department.
Savings can total roughly $90 a year, according to Mel Hall-Crawford, director of energy programs at the Consumer Federation of America.
4. Use cold water
Running a dishwasher and washing machine with cold instead of hot or warm water could save on energy bills, according to environmental experts.
“Heating water is one of the more expensive things that we do,” according to John Hocevar, oceans campaign director for Greenpeace USA.
For example, washing clothes with cold water once a week can reduce a household’s emissions by over 70 pounds annually, according to the Center for Sustainable Systems.
That’s the equivalent of the emissions from driving the average passenger car 80 miles, according to the Environmental Protection Agency.
Households can also consider using a drying rack instead of a drying machine, experts said. Drying is responsible for 71% of the electricity required to wash and dry a load of clothes, according to an estimate from the Sustainability Consortium.
Individuals can also ensure a dishwasher is full before running it, and even setting a timer in the shower to avoid overuse of hot water, experts said.
5. Cut down on plastic
Replacing single-use plastic with reusable alternatives has become easier than ever for households, said Eberhardt of the Environmental Defense Fund.
Consumers can replace Ziploc bags with silicon bags; Saran wrap with beeswax wrap; plastic water bottles with reusable bottles or a water filter; and plastic straws for portable, reusable ones, experts said.
(The same applies for single-use, non-plastic items like paper towels — which come wrapped in plastic and could be replaced with dish towels or sponges.)
“You’re really cutting your weekly grocery costs and it’s better for the planet,” Eberhardt said.
Top 10 sources of plastic pollution in our oceans.
More than 95% of plastic packaging is made from fossil fuels, Hocevar said.
And most isn’t recyclable — a commonly misunderstood fact about the plastic Americans toss in blue bins, he said. Even plastic that can be recycled is often only recycled once.
It’s then burned or put in a landfill, both of which contribute to the release of planet-warming gases, he said.
Buying non-perishable items in bulk is also generally cheaper and cuts down on plastic packaging, Hocevar added.
6. Tweak your diet
The food Americans eat can vary greatly in terms of its carbon footprint.
Generally, eating a more plant-based diet and cutting red meat intake can be cheaper, more environmentally friendly and healthier — which could help cut long-term medical bills, experts said.
“Diet is very personal and cultural,” Keoleian said. “But people should know they can save money and really reduce their carbon emissions.”
For example, beef has about seven times the emissions of fish (farm-raised) and 10 times those of chicken according to some sources. The difference is even starker relative to plant-based foods and proteins — beef has been found to have a carbon footprint 230 times higher than nuts or root vegetables, for example.
Storm clouds gather as cows graze at the USDA-ARS Central Plains Experimental Range near Nunn, Colo. Photo by David Augustine/USDA-ARS via the Fence Post
Those emissions may come from sources like food production, transportation and packaging. Cows, for example, generate a lot of methane, a greenhouse gas that’s much more potent than carbon.
Families can consider “meatless Mondays,” for example, to reduce their consumption of red meat, Eberhardt said.
About 1 in 4 Americans reported eating less meat (beef, pork or chicken) over the past year, according to a Gallup poll from early 2020. The environment was their No. 2 reason for doing so, behind health.
Trade groups representing farmers and beef producers — the American Association of Meat Processors, American Farm Bureau Federation, National Cattlemen’s Beef Association and North American Meat Institute — didn’t return CNBC’s requests for comment on this article.
Jerry Bohn, a Kansas cattleman and president of the National Cattlemen’s Beef Association, recently pushed back on the notion of decreased consumption of red meat for Americans.
“U.S. farmers and ranchers are the best in the world when it comes to producing safe, wholesome and sustainable high-quality beef for American families, and doing it with the smallest possible footprint and we’re committed to continuing on that path of improvement,” he said in April.
Families should also try reducing the amount of food they throw away, Eberhardt said.
About 30% to 40% of food produced in the U.S. isn’t consumed, with that waste largely on the consumer end — which then produces greenhouse gas as it decays, Eberhardt said. Her family creates a basic meal plan at beginning of every week to avoid buying excess food.
7. Buy efficient appliances
Consumers should replace old household appliances with energy-efficient options to help lower their electric bill.
Those can be anything from refrigerators to dishwashers, microwaves and air conditioners. (Efficient machines will carry an Energy Star label.)
This might be a longer-term decision for consumers — but doesn’t have to be.
“Many people think you want to extend the service life [of the old appliance] to save money,” Keoleian said. “You’re actually hurting your wallet by doing that because they are so inefficient.”
Refrigerators are among the largest users of household appliance energy, according to the Center for Sustainable Systems. (In 2015, the average household emissions from refrigeration equaled about 820 miles of driving.)
But switching other appliances could have a big difference, too. If all clothes dryers sold in the U.S. were Energy Star-certified, Americans could save more than $1.5 billion a year in utility costs and prevent emissions similar to about 2 million vehicles, according to Energy Star.
Coyote Gulch’s Leaf charging at the City of Thornton’s Infrastructure Maintenance Center August 31, 2019. Charging infrastructure partially paid for with a grant from the Colorado Energy Office.
8. Change how you get around
Consumers can also replace older cars with electric vehicles, for example — which may make sense especially for those who drive closer to home and don’t have “range anxiety” related to recharging.
FuelEconomy.gov can help consumers identify and compare efficient vehicles.
There are other, potentially easier steps consumers can take, too. For example, about a fifth of vehicle trips are shopping-related — but combining errands (“trip-chaining”) can help avoid unnecessary driving, according to the Center for Sustainable Systems.
Even making sure tires are inflated properly can play a role. Fuel efficiency decreases 0.2% for each 1 pound-per-square-inch decrease, according to the Center.
Carpooling or telecommuting once a week to cut down on driving (and associated costs) may help, too.
Wheat fields along the Colorado River at the Colorado River Indian Tribes Reservation. Wheat, alfalfa and melons are among the most important crops here. By Maunus at English Wikipedia, CC BY-SA 3.0, https://commons.wikimedia.org/w/index.php?curid=47854613
The Colorado River Indian Tribes and another tribe in Arizona played an outsized role in the drought contingency plans that had the state voluntarily give up water. As Arizona faces mandatory cuts next year in its Colorado River supply, the tribes see themselves as major players in the future of water.
“We were always told more or less what to do, and so now it’s taking shape where tribes have been involved and invited to the table to do negotiations, to have input into the issues about the river,” first-term Colorado River Indian Tribes Chairwoman Amelia Flores said.
Lake Mead on the Nevada-Arizona border has fallen to its lowest point since it was filled in the 1930s. Water experts say the situation would be worse had the tribe not agreed to store 150,000 acre-feet in the lake over three years. A single acre-foot is enough to serve one to two households per year. The Gila River Indian Community also contributed water.
The Colorado River Indian Tribes received $38 million in return, including $30 million from the state. Environmentalists, foundations and corporations fulfilled a pledge last month to chip in the rest.
Kevin Moran of the Environmental Defense Fund said the agreement signaled a new approach to combating drought, climate change and the demand from the river.
“The way we look at it, the Colorado River basin is ground zero for water-related impacts of climate change,” he said. “And we have to plan for the river and the watersheds that climate scientists tell us we’re probably going to have, not the one we might wish for.”
Tribal officials say the $38 million is more than what they would have made leasing the land. The Colorado River Indian Tribes stopped farming more than 15 square miles (39 square kilometers) to make water available, tribal attorney Margaret Vick said…
While some fields are dry on the reservation, the tribe plans to use the money to invest in its water infrastructure. It has the oldest irrigation system built by the U.S. Bureau of Indian Affairs, dating to 1867, serving nearly 125 square miles (323 square kilometers) of tribal land.
The age of the irrigation system means it’s in constant need of improvements. Flores, the tribal chairwoman, said some parts of the 232-mile (373-kilometer) concrete and earthen canal are lined and others aren’t, so water is lost through seepage or cracks.
A 2016 study conducted by the tribe put the price tag to fix deficiencies at more than $75 million. It’s leveraging grants, funding from previous conservation efforts and other money to put a dent in the repairs, Flores said.
“If we had all the dollars in the world to line all the canals that run through our reservation, that would be a great project to complete,” Flores said. “I don’t think that’s going to happen in our lifetime.”
The tribe is made up of four distinct groups of Native Americans — Chemehuevi, Mohave, Hopi and Navajo. The reservation includes more than 110 miles (177 kilometers) of Colorado River shoreline with some of the oldest and most secure rights to the river in both Arizona and California.
While much of the water goes to farming, it also sustains wildlife preserves and the tribe’s culture…
The tribe can’t take full advantage of its right to divert 662,000 acre-feet per year from the Colorado River on the Arizona side because it lacks the infrastructure. It also has water rights in California.
An additional 46 square miles (121 square kilometers) of land could be developed for agriculture if the tribe had the infrastructure, according to a 2018 study on water use and development among tribes in the Colorado River basin.
From the 2018 Tribal Water Study, this graphic shows the location of the 29 federally-recognized tribes in the Colorado River Basin. Map credit: USBR
“One of the things I like about the river is that my learning curve is perpetually steep because there are always challenges, there are always one-offs, and there are situations that we are facing on this river that we need to adapt to. Currently, we are facing hydrology and low reservoir conditions the likes of which we have never seen,” Haas said.
As Utah continues growing and drought intensifies the desert’s water scarcity, lawmakers fear losing some of the the state’s share of the river. Utah’s allocation is 1.725 million acre-feet of water or 23% of the water appropriated to the Upper Basin states that also include Colorado, Wyoming and New Mexico. Utah now uses about 1 million acre-feet and plans to develop about 1.4 million acre-feet of water, according to the Division of Natural Resources.
That’s where Haas comes in. She will lead the newly created Colorado River Authority of Utah, which begins its work in late July, officials announced last Tuesday.
A watchdog for Utah’s interests
Utah legislative leadership in the 2021 session sponsored the Colorado River Amendments bill, HB297, which, with $9 million in one-time money and $600,000 of ongoing money, set up the authority meant to serve as a “watchdog” for Utah’s share of water in the drought-challenged Colorado River.
Amy Haas, executive director, Upper Colorado River Commission, is critical of the 2007 operating guidelines (Source: Bureau of Reclamation via the Water Education Foundation)
Haas has lived in Utah part-time for the past four years for her work in the Upper Colorado River Commission, where she currently serves as executive director. She first began working on water issues about 20 years ago as an attorney in private practice in New Mexico representing institutional and private water interests. She then worked for New Mexico on policy representing that state in its interstate stream compacts.
Haas said she’s excited to be a part of Utah’s new authority as it forms “from the ground up.”
“The river is stressed, currently. I think many people know that, and I would like to be a part of sound water management, prudent water management, and I would like to be a part of a team. Utah has been and will continue to be a responsible steward of its Colorado River allocation. And I think that the authority, and the creation of the authority, really represents that Utah is proceeding in a very responsible manner regarding the development of its allocation,” Haas said.
In her new role, Haas will work with Gov. Spencer Cox, Brian Steed, executive director of the Utah Department of Natural Resources, and Colorado River Commissioner of Utah and Colorado River Authority of Utah Chairman Gene Shawcroft “to take full advantage of Utah’s entitlement to the Colorado River while engaging in prudent water management,” she said…
Lake Powell at historic low
Haas is stepping into her role even as Lake Powell’s water is at a record-low level. It’s 34% full now, she said, calling it “frighteningly” low.
“It’s about 35 feet above an elevation where the federal government together with the states (Colorado, Wyoming, New Mexico and Utah) will develop a plan to operate the reservoir such that the states can meet their obligations under a 100-year-old agreement and also that hydropower generation, which is a very important feature of Lake Powell, can be maintained and will not be jeopardized,” she said.
If the lake reaches that critical level, the Bureau of Reclamation will go in and shore up its elevations, according to Haas.
Haas was involved in developing the federally authorized drought contingency plan for the Upper Basin of the Colorado River, which is now being deployed. The plan includes releasing water from federal reservoirs upstream of Lake Powell to store and use in Lake Powell, enhancing cloud seeding, removal of non-native vegetation and additional conservation measures…
She’s optimistic that the states in the U.S. and Mexico with interests in the river will continue working closely together on its management, as they have done in the past — and that that collaboration will increase due to current conditions. For example, Mexico recently partnered with the Basin states and federal government to take shortages in its allocation of the river, which Haas said helped water managers address constraints.
Water releases increase to Blue River but not enough for commercial rafting
Dillon Reservoir is now 100% full, according to Denver Water, which manages the reservoir.
Nathan Elder, manager of water supply for Denver Water, said it’s normal for the reservoir to be full this time of year, but he noted that the reason it’s full despite an ongoing drought is because the water is carefully managed, and much less water was released from the reservoir to the Blue River than in an average year…
Elder said this was a year where the reservoir started out lower than normal and less water flowed in from the melting snowpack…
Elder noted that Denver Water is bringing much less water through the Roberts Tunnel than it typically would because of good moisture levels in the South Platte Basin, which is at 96% of normal, and water conservation by consumers on the Front Range…
While more water is being released into the Blue River now — 184 cubic feet per second as of Wednesday afternoon compared with 100 cfs prior to Monday — it’s still not enough for rafting this year. Elder said a flow of 500 cfs is needed for rafting, but the maximum outflow this year will likely only get to about 250 cfs.
The main reason water levels are low this year is because the snowpack was below average. According to a measurement site at Copper Mountain, the 2021 snowpack peaked at 12.4 inches of snow-water equivalent, or the amount of water held in the snowpack. That’s nearly 5 inches less than the 17.3 inch median for the site, which is based on 30 years of data.
Recent rain has helped slightly but isn’t as much of a determining factor as snowpack…
Treste Huse, a senior hydrologist at the National Weather Service in Boulder, said stream flows in Summit County overall are below normal compared with historic levels. Huse said all streams in Summit County are below normal and that Straight Creek is running much below normal — 13 cfs Wednesday near Dillon compared with an average of 55 cfs for the same date. Recent precipitation levels have been above normal, but it hasn’t made much of a difference, Huse said…
In the past 30 days, the Dillon weather station has recorded 1.69 inches of precipitation — 50% above the normal 1.13 inches in the same time period. And in the past four months, precipitation is slightly above normal. Huse said that while precipitation is above normal, the difference is less than an inch, and with dry soil conditions, it doesn’t make much of a dent in the water supply.
Colorado Drought Monitor map June 29, 2021.
Huse noted that while Summit County’s drought conditions have improved, the northern half of the county is still in a severe drought.
Lake Mead behind Hoover Dam. Lake Mead last month fell to its lowest level since the Hoover Dam was built in 1936. The shoreline has dropped 45 meters since the reservoir was last full in 2000. Photo by Ken Neubecker via American Rivers
New research reveals a positive feedback loop with negative consequences linked to lower springtime humidity across an already parched landscape
question has bothered climatologist Park Williams during the decade he’s been probing drought in the Southwest. Like other climate scientists, he knew from research papers and worldwide storm patterns that a warming atmosphere is thirstier and sops up more moisture from oceans and the land.
“But, in the Southwest, we’ve seen the exact opposite happening,” said Williams, an associate professor in the University of California, Los Angeles’ geography department. “For the last 50 or so years, we’ve actually seen the amount of water vapor molecules in the atmosphere decline” while temperatures have climbed about twice as fast as the global average.
A new paper from UCLA researcher Karen McKinnon largely solved that puzzle by showing the hottest days in the summer months are getting dramatically drier as a result of the Southwestern spring heating up and leaving less moisture behind to cool the summer through evaporation.
The study, published in the journal, Nature Climate Change, shows a surprising new way in which heat and humidity are interrelated and comes at the beginning of a summer that is already sweltering and plagued with wildfire and drought. For some, the paper also raises concerns about future warming in southwestern states.
“When you look at those hottest days, we’re starting to see pretty large decreases in humidity,” said McKinnon, who works in UCLA’s Department of Statistics and Institute of the Environment and Sustainability.
Her team analyzed spring and summer data from 28 weather stations at airports in southern California, Arizona, Colorado, Nevada, New Mexico and Utah. They zeroed in on “specific humidity,” a measure of the molecules of moisture in the atmosphere that ignores factors like temperature that are counted in the more commonly discussed “relative humidity.”
“On these hot dry days, the source of the moisture in the air is basically coming from the soils from the land surface—and we’re seeing declines in near surface soil moisture over the summer over these past couple of decades—and that’s leading pretty clearly to these decreases in humidity,” she explained. “So, we’re having lower humidity days as the soil moisture gets drier.”
The researchers found that specific humidity had decreased across the region by an average of about 20 percent. And, in California and Nevada, the decreases were about one-third of the mean value…
A feedback loop brings new drought concerns
The pattern identified in the study is a positive feedback loop with negative implications. Increasing heat in the spring dries the soil, which, in turn, raises summer temperatures due to the lack of soil moisture, which helps cool the landscape when it evaporates.
The weekly U.S. Drought Monitor classifies more than half of the West as being in “extreme” or “exceptional” drought, with between 86% and 92% of the land in California, Utah and Arizona in the most severe drought categories. Meanwhile, observations show drought conditions have dominated the region over the past two decades, pushing the Southwest into what’s called a “megadrought.”
West Drought Monitor map June 29, 2021.
The drought is easing in Colorado compared with 3 months ago, when the entire state was dry or in drought. The most recent drought map shows about 46% still experiencing some level of parched conditions, with nearly 30% of the state in extreme or exceptional drought.
Colorado Drought Monitor March 2, 2021.
Colorado Drought Monitor map June 29, 2021.
Simon (Shih-Yu) Wang, a professor of climate dynamics at Utah State University, called the McKinnon team’s new statistical analysis “a rigorous approach” that reaffirms the significance of the soil moisture and temperature link that researchers have been studying in earnest for a decade.
“When we don’t have water in the soil, we’re gonna get a lot hotter a lot faster,“ he said of the hot-dry pattern that’s become typical with climate change in the Southwest. “Basically, it’s what you expect in a drought situation in semi-arid regions.”
[…]
Mike Hobbins, senior research scientist at the University of Colorado Cooperative Institute for Research in Environmental Sciences in Boulder, said the McKinnon study has strong implications, especially for wildfire. Trends identified in the study suggest that fire seasons could become more explosive, he said.
That’s because fire is strongly influenced by the difference between the amount of moisture the atmosphere can potentially hold and how much it actually has.
The difference between the two is known as the “vapor pressure deficit.” And the bigger the deficit, the thirstier the atmosphere and the more erratic wildfire becomes. That, plus the dried out condition of vegetation means, “the fire season will grow at both ends,” he said.
The McKinnon paper noted that the future of this summertime trend remains unclear, even though it’s something that the research team considered in its analysis. Uncertainty surrounding precipitation trends in climate models for the Southwest—some models show precipitation increasing—makes it hard to know how much vapor pressure deficit the region will face.
The Southwest ought to prepare “for a range of possible outcomes,” McKinnon said. Still, with the projected rise in temperatures and the new information about the hot-dry dynamic leaves little room for optimism about a moister future in the Southwest…
But Williams, part of a research team behind a paper last year showing that the human-caused share of climate change can be blamed for about half of the historic Southwest drought, also thinks about how the extra warmth from the heat waves might promote enough convection to result in precipitation.
This story was originally published by InsideClimate News, an independent, nonprofit, nonpartisan news organization that covers energy, climate and the environment.
A work crew prepares to install a debris boom at Grand Lake. The boom will prevent floating debris from entering the Alva B. Adams Tunnel. Photo credit: Northern Water
While new wildfires across Colorado and the West are creating another year of smoky skies and damaged forests, work to contain debris and restore watersheds damaged by the East Troublesome Fire has started taking shape in Grand County.
This month, crews started to place a series of booms at the east end of Grand Lake to capture floating debris that could move into the lake from heavy rainstorms that sometimes occur in the summertime. The bright yellow booms are anchored near the intake to the Alva B. Adams Tunnel, which delivers water from the West Slope to the East Slope components of the Colorado-Big Thompson Project.
In addition to the boom at Grand Lake, two more will be installed at Willow Creek Reservoir to capture debris from that heavily affected watershed. According to damage assessments, more than 90 percent of the Willow Creek watershed suffered damage in last October’s fire.
Work will also be concentrated to capture debris before it reaches the reservoirs. Starting in July, helicopter crews will drop mulch and seeds on burned areas that are inaccessible to ground-based efforts. That material will help to keep soil and debris in place, and in future years will provide appropriate ground cover at those sites.
Other methods for debris containment to be installed include catchment basins where smaller tributaries might be transporting loosened materials.
Funding for the efforts has come from the federal Natural Resources Conservation Service’s Emergency Watershed Protection program and state matching funds from the Colorado Water Conservation Board.
Finally, Northern Water has also provided a self-service site in Grand Lake where property owners can get sandbags and wattle to protect their property from high-water flows that might occur this year or in the future. In May, employees of Northern Water and Grand County volunteered to fill sandbags using equipment donated by the Salvation Army.
Because of the importance of the Upper Colorado River watershed to the Colorado-Big Thompson Project and the drinking water for more than 1 million residents in Northeastern Colorado, Northern Water has taken a lead role with Grand County as local sponsors for the Emergency Watershed Program.
The final position of the debris boom at Grand Lake will protect the inlet to the Alva B. Adams Tunnel. Photo credit: Northern Water
Safety inspectors walk on top of the Crystal Dam in the Black Canyon of the Gunnison National Park in May 2008, when high snowpack and warm temperatures prompted reservoir managers to make more room through a managed release, or spill. The reservoir spilled most recently in May 2019. Photo by William Woody
To address the water needs of a growing population amid shortages, the Colorado Water Plan in 2015 set a goal of attaining 400,000 acre-feet of new water storage by 2050.
Colorado is working its way toward that goal, but building new storage is easier said than done. Increasing environmental and social concerns, limited geographic locations, and even more limited water rights have made many traditional reservoir storage projects tougher to build. On top of that, long-range forecasting — to figure out how much water is going to be available to be stored — has become especially difficult as a result of climate change.
An April 2020 study published in the journal Science found that the American West’s current drought is as bad or worse than any in the past 1,200 years of tree-ring records. Ordinarily, storage would be the obvious solution to drought and dry years. You collect moisture in wet years and save it for times of need. But climate change has created a catch-22. Storage may be necessary, but it has become more challenging to build and less water is available to capture.
Dan Luecke, former director of the Environmental Defense Fund’s Rocky Mountain office, says these challenges have upended a philosophy long built on risk analysis to one defined by “decision-making under uncertainty.”
“For a long time, we’ve known there’s risk but we could look to the historical record to manage it,” says Luecke. (Luecke also serves on the Water Education Colorado Board of Trustees). “With climate change, that record is called into question … The nature of the game has changed.”
The cascading challenges of climate change have led water managers to think creatively about alternatives to traditional infrastructure. Greeley, for example, replaced a plan to expand an existing reservoir with one that will store water underground. Front Range districts collaborated to reallocate the space in Chatfield Reservoir, a flood storage basin, raising the water level to add permanent water storage supply. As part of the Basin Implementation Plan for the Yampa/White/Green River Basin, water managers are exploring putting reservoirs high in the mountains to limit evaporative loss.
Decision-making under uncertainty makes it all the more complicated for water providers to meet Colorado’s water needs and has caused many to reexamine what a smart storage project is made of — one that can help meet water supply goals for many water users while respecting the environment, one that is also acceptable to stakeholders, and one with minimum impacts so that it can make its way through the permitting process. Water managers are growing increasingly innovative, out of necessity, to develop water storage projects that will work.
Reservoirs under Climate Change
It’s not simply a matter of how much water is available to store. Everything from the location and size of reservoirs to the timing for capturing runoff and for making releases is being reviewed. Various climate models, including those used by the Colorado Water Conservation Board for state water planning, project warmer temperatures that will affect evaporation rates in rivers and reservoirs and seasonal shifts in precipitation, including reduced mountain snowpack and earlier runoff. Earlier and reduced flows could, for instance, necessitate dams releasing water earlier to meet demand.
Temperature rise, too, makes storing water a challenge. Any pool will lose water through evaporation, and more during hot, dry times, but the loss is worse for reservoirs at lower elevations with more exposed surface area. The science used to estimate evaporative loss is imprecise — estimates could be off by as much as 20 to 30 percent, according to the U.S. Bureau of Reclamation, which is conducting a study to refine its methods. Even so, a 2018 Bulletin of the American Meteorological Society study estimated that losses from Lake Powell and Lake Mead could total as much as 15% of the annual upper basin allocation among Colorado River Basin states, or five to six times the annual water use of Denver. The same study said that summer evaporation rates may have risen by as much as 6% over the last 25 years.
The National Climate Assessment, published in 2018, states that climate change is fueling stronger storms that could overwhelm dams and infrastructure designed to capture more moderate storm surge flows. It’s also intensifying wildfires that destroy landscapes, load reservoirs with sediment, and threaten water delivery infrastructure.
The 2019 Technical Update to the Colorado Water Plan lays out a number of alternatives to new traditional storage projects, including rehabilitating existing infrastructure, reallocating flood storage to active storage, and using below-ground aquifer storage alternatives. While the options are vast, the update says that to meet the state’s goals, “at least some new large reservoirs are needed.”
But building those reservoirs also requires water to fill them, says Brad Udall, senior water and climate research scientist at Colorado State University. Water rights are not as easy to come by in an era of constraint. Any new water rights claimed today are junior in the state’s legal priority system, making storage necessary to capture peak flows after all senior water rights are satisfied. But as climate change shifts the timing and magnitude of peak flows, reservoirs may not be as effective a tool for managing junior water rights.
“A dam is a bit like opening a bank account, there has to be something to put in it,” Udall says. “Ultimately, everything bends to the hydrological realities of what the supply is.”
The Jigsaw Puzzle
The era of uncertainty doesn’t just make individual storage projects a puzzle — the long-range plans that help utilities figure out what storage they need are now a tangle of variables. Balancing climate-complicated precipitation projections with population and water use trends, regulatory changes, and competition for resources can make the standard planning process a head-spinning endeavor.
When Colorado Springs Utilities started updating its 2017 Integrated Water Resource Plan (IWRP), the utility wanted a “comprehensive view” that would take a hard look at risk analysis, says water planner Kevin Lusk. Colorado Springs doesn’t sit on a major river system and relies on storage in remote watersheds to manage its variable supply. In the early 2000s, the utility’s water yield saw a 600% difference between the driest and wettest years.
Realizing that a backward-looking dataset might no longer apply to a present and future defined by climate change, the utility took a state-of-the-art new approach to its planning process. Recently, Colorado Springs partnered with the consulting firm Black and Veatch, which expanded the multi-objective evolutionary algorithm (MOEA) to utilities to help them assess the complexities in planning. The machine learning tool can project thousands of possible futures using precipitation, temperature and hydrological factors, then help planners narrow down their range of possible options.
“As these plans get so big, it’s hard for the human mind to comprehend them,” says Leon Basdekas, a private consultant who worked at Colorado Springs Utilities, then Black and Veatch, designing and managing the utility’s IWRP. “This tool allows you to evaluate complex planning options in ways that would be impossible to do otherwise.”
Leon Basdekas, pictured beside Monument Creek, worked with Colorado Springs Utilities using a machine learning tool to help the water provider assess complex future water supply and demand scenarios and evaluate where new water storage could be beneficial. Photo by Matthew Staver via Water Education Colorado
For Colorado Springs, the advanced IWRP process helped water planners see a range of climate and streamflow possibilities, then identify 14 storage options that could meet future water demand. Some, like a potential new reservoir on Williams Creek or one upstream of Rampart Reservoir, have been under discussion for years. Others are more general concepts without specific sites, such as gravel pit storage along the Arkansas River. Among those identified projects, Colorado Springs has also been exploring Eagle River storage options, including the potential Whitney Reservoir, to collect and store Western Slope water, although nearby towns and others have objected to possible impacts on the Holy Cross Wilderness Area. Lusk says Whitney Creek alternatives are “one of many possibilities” and that the IWRP analysis even considers “less tangible characteristics” like community values and opposition to any individual project when optimizing storage opportunities.
More than anything, Lusk says, the advanced modeling helped the utility gain a better appreciation for the full scope of storage and transmission. The “a-ha moment,” he says, is seeing how one individual new reservoir may not mean as much for the system as, say, shoring up existing pipelines to make the already-built system run more efficiently.
“We can’t just look at storage on its own, it’s a package deal with supply and conveyance,” Lusk says. “This is a complex jigsaw puzzle.”
When Mitigation Meets Enhancement
To the north, the Northern Integrated Supply Project, or NISP, has been moving through a decades-long process to obtain the necessary permits and to gain the favor of local stakeholders. NISP has been reshaped, with operational changes and environmental improvements now built in, in response to stakeholder concerns.
Northern Water’s project, if fully approved, will build two reservoirs, one northwest of Fort Collins off the Cache la Poudre River and another northeast of Greeley, to deliver nearly 40,000 acre-feet of water a year to 15 communities and irrigators along the Front Range. With the population of northern Colorado expected to double by 2050, backers say that such a large shared storage project is necessary to efficiently serve booming towns like Erie, Windsor and Severance. Through water exchanges with farmers — which will average about 25,000 acre-feet per year — and the purchase of conservation easements on farms, Northern Water says the project will also help farmers reduce the negative impacts of buy and dry by keeping water on farms while serving the growing Front Range population.
Northern Integrated Supply Project (NISP) map July 27, 2016 via Northern Water.
But supplying those growing towns will necessarily require impacts. NISP will involve constructing the 170,000 acre-foot Glade Reservoir (to accommodate the reservoir, seven miles of U.S. Highway 287 will be relocated) and the 45,600 acre-foot Galeton Reservoir. Northern Water will also build another forebay reservoir, five pump plants, and 80 miles of pipeline.
That kind of construction naturally attracted opposition from environmentalists and some communities. Concerns include that taking water out of the already-stressed Poudre River could reduce its crucial spring peak flows, which flush sediment downriver and restore habitat.
Several environmental reviews as part of the permitting process concluded that the need for storage was there, even after accounting for planned water conservation savings. With so many communities involved, scrapping the collaborative project, as some environmental groups advocated for, would leave them all competing for limited resources.
“I think quite a few participants who saw [NISP] as a [potential] future supply are now looking at this as the future,” says Christopher Smith, general manager of the Left Hand Water District and chairman of the NISP participants committee. “I don’t think anyone is left who is speculating on this. It’s necessary.”
So Northern Water started looking for what project manager Carl Brouwer calls “the wow factor.”
“We really changed our perspective to thinking about how we could put water back and be a part of the preservation of the Poudre River,” Brouwer says.
Cache la Poudre River. Photo credit: Allen Best
Project proponents added an estimated $60 million in mitigation and enhancement measures, bringing the total estimated project cost to about $1.1 billion. The idea is that water would be released from Glade Reservoir year round and no water will be diverted to storage when flows dip below 50 cubic feet per second (cfs) in the summer and 25 cfs in the winter to eliminate spots where the river already dries up. Collection operations will be adjusted to keep peak flows in the Poudre River two out of every three years, and 90% of the time little or no diversion will take place during peak flows. Organizers will also build new fish passage structures and improve 2.4 miles of stream channel near a Colorado Parks and Wildlife (CPW) fish hatchery north of Fort Collins.
The mitigation and enhancement plan received unanimous approval from CPW and the Colorado Water Conservation Board in 2017, and the Colorado Water Quality Control Division approved the project’s 401 Water Quality Certification in 2020. NISP has continued moving through the federal permitting process, with final approval expected this spring or summer.
Karlyn Armstrong, water project mitigation coordinator for CPW, says that the flow program will be a benefit to the river. “Currently the river goes dry in places — once the program comes online, the river will have water 365 days a year through the conveyance flow reach,” Armstrong says. “Aquatic life will benefit from sustained minimum flows.”
Critics remain. In August 2020, the Fort Collins City Council voted 5-1 to oppose the project, citing the potential loss of spring flows, and some environmentalists say communities should explore options with less of an environmental footprint.
But Brouwer says that the project, combined with Northern’s efforts on conservation and water exchanges, should set the new standard for infrastructure in the state with its environmental focus.
“What really changed was embracing the enhancement part of mitigation and enhancement. We can make it better,” Brouwer says. “We’ve set the bar pretty high and I do think this will become the norm.”
Addressing Demand
Improved or not, some still say a large storage project like NISP shouldn’t happen at all. Boulder-based Western Resource Advocates has been a long-time opponent of NISP and in 2012 released an alternative plan it said could meet the needs of Front Range communities without the footprint of new infrastructure. The nonprofit’s “Better Future” alternative included conservation tools that would offset 20,482 acre-feet of use by 2060 and apply reuse technology to another 4,905 acre-feet. Combined with flexible water sharing agreements between agricultural users and municipalities and more thoughtful expansion onto previously irrigated agricultural land that could come with water rights, WRA says their plan reimagines what adding supply could look like.
“We know we need more storage going forward, but new storage doesn’t have to be connected to new development,” says Laura Belanger, water resources engineer at Western Resource Advocates. “Alternative supply portfolios that include reuse or conservation can mean storage that optimizes existing supplies more efficiently.”
WRA’s plan as an alternative to NISP was rejected in 2018, as were all other alternatives proposed during the public comment period, when the U.S. Army Corps of Engineers issued NISP’s Environmental Impact Statement, saying that these options “did not meet the project’s purpose and need and practicability screening criteria.” WRA says it relies on different calculations than the economic reports backing NISP and has continued to update its alternative in a series of recent comments on the NISP proposal.
Whether or not it could replace NISP, the “Better Future” model represents how some are thinking about limiting demand as a way to reduce the need for additional storage. Aggressive conservation has started to decouple water use from population growth in some cities across the West; a survey of 20 Western cities published in the journal Water found that between 2000 and 2015, total water use dropped 19% while populations increased by 21% on average. Denver Water has reduced per capita water use by 22% over the past decade.
The City of Aurora has also made conservation and reuse a foundational part of its water plan, including more efficient landscaping requirements, rebates for low water-use appliances, and requirements that new developers make their buildings less wasteful. Tim York, the city’s water conservation supervisor, estimates that it costs about $600 in staff time and resources for each acre-foot of water conserved, compared to about $25,000 per acre-foot for water acquired on the open market.
That doesn’t mean Aurora isn’t looking for more storage. The city is moving ahead on the proposed Wild Horse Reservoir project, a 96,000 acre-foot storage site in Park County.
“There’s always going to be more to be done from conservation and efficiency. At the same time, you can only get so low,” says York. “You get to a point where you need storage. The mindset that you can conserve your way out of any drought is just not realistic.”
Many small- and medium-sized utilities don’t have the staff to mirror Aurora’s efforts, but Belanger says that the strain on resources under the drought makes it necessary for all municipalities to embrace conservation.
“The more efficient existing and new development is, the more water you can have in the supply,” Belanger says. “Managing the demands of your community produces sustainable savings.”
Can Restoration Double As Storage?
Some advocates say it’s time to think beyond cement and instead embrace natural watershed restoration as a storage solution.
In its 2016 Water Plan, the State of California declared that source watersheds would be considered “integral components of water infrastructure,” putting reviving watersheds on essentially the same level as building new dams or pipelines. While Colorado hasn’t adopted similar language yet (Montana is the only other state to do so), there is increased attention to restoring watersheds as an ecological tool with water storage benefits.
“Our water has so much to do, we should give it a longer reach and take advantage of all the benefits,” says Abby Burk of the Audubon Society. “When water is in rivers instead of sitting in reservoirs, there are so many more benefits that support healthy, thriving ecosystems.”
Snowmelt and storm events, for instance, flash quickly through incised streams that are disconnected from their floodplains. Healthier connected floodplain-riparian areas can restore plant life, recharge underground aquifers, preserve flows for aquatic species, and even reduce flood risk. Water in the ground also won’t evaporate like it does from reservoirs. However, it’s less clear if this restoration work can provide the kind of material storage benefits providers want to see.
“We’re careful about saying that restoration of floodplains and wetlands does not produce more water, but it can change the timing,” says Jackie Corday, a consultant working with American Rivers on healthy headwaters issues. “The water can be attenuated [by absorption into the restored floodplain], the runoff is slowed when it’s stored as groundwater, then it slowly gets released throughout the summer instead of all at once.”
A beaver dam on the Gunnison River. Photo: Brent Gardner-Smith/Aspen Journalism
Stretching natural runoff releases into the hot summer months could help farmers irrigate for longer growing seasons without storing water above ground, but little research has quantified that potential. Researchers are eyeing projects meant to mimic beaver structures to see how they change flows. A project that’s currently underway to restore floodplains and wetlands upstream of Grand County’s Shadow Mountain Reservoir could offer a good model; preliminary assessments from that project are expected by the end of the year.
According to Melinda Kassen, senior counsel for the Theodore Roosevelt Conservation Partnership, restoration fits into a more natural philosophy of water systems. She hopes to see more municipalities begin to view natural infrastructure as just as valid as traditional infrastructure.
“You just have to remember that there is an alternative, and sometimes that’s hard when you’ve done something one way for 150 years,” Kassen says. “When we talk about water storage now, one of the first things we say is that we should be looking at green infrastructure instead of gray.”
Thinking System-Wide
A bigger way of thinking is taking hold in the South Platte River Basin, home to approximately 70% of the state’s population and its largest projected water supply gap. The South Platte Basin Implementation Plan, completed in 2015 to inform the state water plan, showed that, with a population expected to reach 6 million by 2050, there could be a maximum annual water supply gap of 540,000 acre-feet.
The “status quo” strategy to fill that gap for cities is buy and dry, says Joe Frank, general manager of the Lower South Platte Water Conservancy District in northeastern Colorado. Frank has always worked on behalf of the water users in his district, but as water stresses increase, he is thinking more creatively about the future of agriculture by “providing water security for both” farms and cities.
There are more water rights on the South Platte River than there is water to fulfill them in most years, which is why buy and dry — where cities purchase senior agricultural water rights, drying up a farm and gaining the priority to divert that water when flows are low — has been attractive to municipalities. As an alternative, new storage might help. Some flows are available for capture, just not every year. The South Platte Storage Study, ordered by the Colorado Legislature in 2016 and completed in 2017, found that while flows were extremely variable between 1996 and 2015, a median flow of 293,000 acre-feet per year in excess of South Platte River interstate compact obligations crossed the state line into Nebraska. The amount of water that could be put to use in Colorado is much less, the study found, but additional South Platte storage could help with a variety of things — from compact compliance to water sharing agreements to river flows and to better utilizing reusable return flows from upstream municipalities. It also found that a combination of storage pools working conjunctively up and down the river could be more beneficial than individual reservoirs.
To explore ways to move beyond individual reservoirs to close the gap, Frank and other water managers throughout the basin are collaborating on the South Platte Regional Opportunities Water Group, or SPROWG, and working toward a system-wide approach to storage and water use.
A group called the South Platte Regional Opportunities Working Group, or SPROWG, is proposing to store 175,000 acre-feet of water in a series of reservoirs on the South Platte River, from north of Denver to the Morgan County line. The project also includes a long pipeline to pump water from the river back to the metro area to be cleaned and re-used. Graphic credit: CWCB via Aspen Journalism
In a feasibility study published in March 2020, SPROWG members identified four alternative concepts that could help close the supply gap without diverting additional water from the Western Slope or buying up valuable water rights from local farmers. The study analyzed the potential to store between 215,000 and 409,000 acre-feet of water in various generalized locations between Denver and the Nebraska state line. New storage would rely on available flows not obligated to existing water rights, water that can be reused, or temporary lease agreements with farmers. Stored water would then be used locally, transported through a pipeline for regional use, or exchanged between locations.
The idea, said SPROWG advisory committee member Lisa Darling, was to think regionally instead of by district, to move water where it’s needed at any given time.
“Maybe there was this sort of older water buffalo thinking in the past, but I think we know now that we can’t develop projects in a vacuum anymore,” says Darling, the executive director of the South Metro Water Supply Authority. (Darling also serves as president of Water Education Colorado’s Board of Trustees.) “There’s a holistic system and that’s the prism we have to look through now.”
Dan Luecke, who fought multiple large infrastructure projects across the state, says he’s been encouraged by an increase in innovation where cities and growers are thinking more collaboratively on both storage and use. In an era of constraints, he says, it will take all users — even those across state lines — working together to think about creative and efficient approaches to the storage dilemma.
“If we could get cities and irrigators to agree to some kind of combined management scheme, we might need more storage but we could look at it in a more integrated and efficient context,” Luecke says. “It’s not about storage for this user or that area, it’s about an entire system that’s more flexible.”
Jason Plautz is a journalist based in Denver specializing in environmental policy. His writing has appeared in High Country News, Reveal, HuffPost, National Journal, and Undark, among other outlets.
The ongoing drought across much of the West and above-average temperatures have water quality managers like [Chad] Rudow concerned.
“We had a below-average snowpack, and that snow melted off quicker than usual,” Rudow said. “The double whammy that we got is we went into the year with below-average soil moisture levels.”
When the snow did melt, a lot of that moisture went toward replenishing depleted soil and did not make it back into the rivers, necessarily.
Tanner Shelp, an employee at Roaring Fork Anglers, said although trout fishing had been “amazing” so far this summer, he was worried about it being short lived due to warmer water temperatures and the sheer number of people out on the water each day…
Trout can easily die, even if an angler adheres to proper catch-and-release techniques when water temperatures exceed the mid-60s…
Once river temperatures hit the mid- to upper 60s, the brown, rainbow and other species of trout swimming their waters get stressed, Shelp said…
According to data from the United States Geological Survey, the Roaring Fork River’s water temperature ranged between 57 and 61 degrees Fahrenheit [July 1, 2021]. The Roaring Fork Conservancy via its Instagram account warned that Wednesday night, the Roaring Fork River reached 64 degrees, adding “several stretches along the Colorado River (Upper Colorado and Utah border) have already reached 70 degrees.”
Last year’s Mullen fire burned almost 177,000 acres along the border between Colorado and Wyoming, leaving parts of Medicine Bow-Routt National Forests desolate and burnt. In the absence of normal vegetation, an invasive weed has taken root, and U.S. Forest Officials intend to reverse that.
Cheatgrass is a non-native, invasive grass species in Colorado, characterized by its ability to thrive in areas heavily disturbed by events like construction, fire, and floods. A Colorado State University fact sheet says letting cheatgrass dominate an area could impact wildlife populations and change soil properties. Once introduced to an area, it can produce “more than 10,000 plants per square yard.”
In addition to being a general nuisance and extremely pervasive, cheatgrass is also a major fire risk.
“Though several components can affect flame length and fire spread, a typical cheatgrass fire on flat terrain with wind speeds of 20 miles per hour may generate flame lengths up to eight feet in height; the fire can travel more than four miles per hour,” the CSU fact sheet says.
The plant’s natural life cycle is part of why it presents such a fire hazard. Cheatgrass dies off between April and June, and when that happens, it dries out more quickly than native vegetation, according to the Sage Grouse Initiative. It also has particularly thin stems and leaves, which help it burn more quickly than many native species.
Cheatgrass is an annual invasive plant that crowds out native plants in sagebrush range. Near Elko, Nevada. Photo credit: The Sagebrush Initiative
The U.S. Forest Service, in partnership with the U.S. Department of Agriculture and the Wyoming Game & Fish Department, has begun treating a 9,200 acre area within the Mullen fire perimeter for cheatgrass, with the hopes of reducing or eradicating its presence.
“It is great to continue collaboration efforts with our partners on controlling invasive species in the footprint of the Mullen Fire. Our past treatments have proven to be successful in managing cheatgrass, which is a huge threat to native ecosystem recovery post wildfire.” said Forest Service specialist Jackie Roaque in a statement.
The Forest Service’s operation will last about two months and primarily take place in Wyoming. Recreationists in Medicine Bow-Routt, particularly along the North Platte River, might be affected by the spraying.
Research suggests wildfires are likely to become larger and more unpredictable because of drier and hotter conditions spurred on by climate change.
We have songs and stories to teach children about the connection between seemingly unrelated things. John Muir put it in perspective: “When you tug at one thing in nature, you find it hitched to everything else.”
My “ah-ha!” moment happened at a presentation I attended a few years ago. A slide on the screen showed two rows of fish: on the left, smaller fish from a river with an urbanized floodplain, and on the right, fish of the same species and same age from a river with a natural, functioning floodplain. The fish on the right were almost twice the size as the ones on the left.
A healthy riparian corridor includes native trees and minimal disturbance within 100 feet of the streambank. Waccamaw River photo by Charles Slate.
Fish from rivers with healthy floodplains thrive, while those in rivers without a healthy floodplain merely survive.
The connection between thriving fish, healthy rivers, and functioning floodplains? Trees.
Forested watersheds have been shown much higher water quality than their urbanized counterparts. Trees provide a wide range of ecological services. Tree canopy lessens the erosive impact of rain and slows the velocity of stormwater flowing towards the river, as well as floodwaters spilling out onto the floodplain. Trees trap sediments that build the floodplain while the roots stabilize the riverbanks. Trees also provide shade for maintaining water temperature. Fallen leaves, limbs, and branches support the food web by providing food and habitat for the bugs that are in turn food for fish. Clean, cool water with more food equals bigger fish. Therefore, fish grow on trees.
The connection between fish and trees and rivers is now poised to emerge in our urban areas.
Many cities, from large to small, are recognizing the benefits of reestablishing the physical and emotional linkage between the river, trees and the community. For instance, San Antonio has its iconic River Walk, Chicago has just completed its riverfront, Washington DC has its Southwest Waterfront neighborhood, and Pittsburgh has reconnected neighborhoods to its three rivers via a network of urban trails. Furthermore, Hartford, Nashville, Providence, Denver, and Detroit all offer events on their downtown riverfronts that draw thousands, and Cincinnati, Columbus, Owensboro and many more are rediscovering their community-to-river reconnection. But when you look at images of these urban riverfronts, you notice they all have one thing in common: a lot of hardscape. Hard engineered solutions are meant to reduce maintenance and accommodate maximum access.
The trend in revitalizing urban riverfronts is a giant step forward, but our urban riverfronts also need soft green edges. They need the green space and trees that humans and fish, and all living things, require to thrive. It isn’t possible or desirable to return our urban rivers to forested watersheds, but we can reintroduce trees to our river corridors provide while also adding value to our urban communities.
Healthy for fish, healthy for people. Give trees to fish, and we’re also giving them to ourselves.
I’ve decided there needs to be a song about how fish grow on trees. Remember this folk song?
“…Oh, the limb on the tree,
And the tree in a hole
And the hole in the ground
And the green grass grew all around, all around
And the green grass grew all around…”
Let’s add “…and the green trees grew all around, all around…and big fish in the river are found.”
FromThe Associated Press (Seth Borenstein) via US News & World Report:
An Associated Press analysis shows that the recent heat wave struck places that are warming up faster than other parts of the United States.
As outlandish as the killer heat wave that struck the Pacific Northwest was, it fits into a decades-long pattern of uneven summer warming across the United States.
The West is getting roasted by hotter summer days while the East Coast is getting swamped by hotter and stickier summer nights, an analysis of decades of U.S. summer weather data by The Associated Press shows.
State-by-state average temperature trends from 1990 to 2020 show America’s summer swelter is increasing more in some of the places that just got baked with extreme heat over the past week: California, Nevada, New Mexico, Arizona, Utah, Oregon and Colorado.
The West is the fastest-warming region in the country during June, July and August, up 3 degrees on average since 1990. The Northwest has warmed nearly twice as much in the past 30 years as it has in the Southeast.
That includes Portland, Oregon which set a record 116-degree high that was 3 degrees warmer than temperatures ever recorded in Oklahoma City or Dallas-Fort Worth.
Although much of the primary cause of the past week’s extreme heat was an unusual but natural weather condition, scientists see the fingerprint of human-caused climate change, citing altered weather patterns that park heat in different places for longer periods…
Climate change is altering and weakening the jet stream, narrow bands of wind that circle the Earth flowing west to east. Those changes allow key weather-producing patterns of high and low pressure to stall in place. High pressure is stalling more often in the West in summer, said Pennsylvania State University climate scientist Michael Mann. High pressure brings hot and dry weather that, when stalled, can create what are known as heat domes. Low pressure brings wet weather.
Another factor is higher water temperatures in the Pacific Ocean that also generate more so-called high-pressure ridges the West, said Gerald Meehl, a National Center for Atmospheric Research scientist who studies heat waves.
These patterns are showing up so often that their effects can be seen in long-term data. The U.S. Northwest, western Canada and Siberia, which also just saw a stunning heat wave, are among Earth’s fastest warming land areas during summer since 1990, Cohen said…
The Midwest is warming slower during the summer than either coast. That’s because stalled low pressure areas often drive cooler air into the Great Lakes region, said North Illinois University climate scientist Victor Gensini.
Water explains the big difference between western and eastern heat trends, scientists said.
“In western states where drought has been expanding and intensifying during the past decade, soil moisture has been declining. Dry soil heats up faster than moist soil during the day because all the solar energy goes into heating rather than into evaporating moisture,” said Jennifer Francis, a climate scientist at the Woodwell Climate Research Center. “Dry soil also cools off faster at night.”
That’s partly why the West, which is getting drier by the decade and is mired in a 20-year megadrought, is seeing those crazy triple digit daytime temperatures.
The East is getting wetter by the decade, NOAA records show, and the East Coast is seeing its biggest warming increase at night. The overnight lows in New Jersey and Delaware have warmed 3 degrees since 1990, the biggest increases in the nation.
Water vapor is a greenhouse gas, Francis explained, “So at night it traps more of the heat.”
Kathie Dello, North Carolina’s state climatologist, attributes the trends to human-caused warming. “There’s no other explanation,” she said.
Wildfires exploded in the record-hot air over southern British Columbia on Wednesday, June 30, producing several massive fire-generated thunderstorms. The ‘pyrocu’ spit out lightning and cast the massive evening shadows seen in this satellite image from 0210Z Thursday, July 1, 2021 (7:10 pm PDT Wednesday). Climate scientist Daniel Swain called the event “a literal firestorm.” (Image credit: RAMMB/CIRA/CSU)
FromYale Climate Connections (Bob Henson and Jeff Masters):
Hundreds of North Americans – and perhaps many more yet to be tallied – have died of heat-related illness over the past week after a mind-boggling heat wave struck the U.S. Pacific Northwest U.S. and far southwest Canada. It’s virtually certain to be the deadliest weather event on record for the region. The unprecedented death toll is the result of a heat onslaught more intense by some measures than anything in global records, yet very much in line with the expected impacts of a human-warmed climate.
The poster community of this horrific episode has to be Lytton, British Columbia. The town broke Canada’s longstanding all-time national high temperature of 45 degrees Celsius (113 degrees Fahrenheit) with a high of 46.6°C (116°F) on Sunday, June 27. The next day brought 47.9°C (118.2°F), and Tuesday a stunning 49.6°C (121°F).
The intense heat flash-dried the rugged, forested landscape, and wildfires mushroomed across the area on Wednesday, June 30. By evening, the entire town of Lytton was under mandatory evacuation orders, and Mayor Jan Polderman told CBC News that “the whole town is on fire.” Most homes in Lytton have been destroyed, according to provincial authorities.
Lytton is home to the Lytton First Nation, a Nlaka'pamux band. In Canada and beyond, Indigenous people are disproportionately affected by climate impacts and Indigenous knowledge has much to contribute to climate solutions. https://t.co/Pgn8Xucvxz
The lighting from the dry thunderstorms (pyrocumulonimbus) that developed was so intense that over 700,000 intracloud and cloud-to-ground lightning flashes were recorded in 15 hours, including more than 100,000 cloud-to-ground strikes. That’s about 5% of the total number of lightning flashes Canada typically sees in an entire year (see Tweet below).
The fires have generated huge clouds of choking smoke that put air quality in the red “Unhealthy” range in Kamloops, British Columbia, on Thursday.
I've watched a lot of wildfire-associated pyroconvective events during the satellite era, and I think this might be the singularly most extreme I've ever seen. This is a literal firestorm, producing *thousands* of lightning strikes and almost certainly countless new fires. #BCwxhttps://t.co/jS0DrJldR3
This heat disaster’s tragic nature is evident even in initial data. British Columbia has reported 486 sudden deaths, three times more than usual for this time of year. At least 16 people died of heat-related causes in Seattle. And in Multnomah County, Oregon, which includes Portland, the county medical examiner announced in a poignant news release on Wednesday that 45 residents had died as a result of excessive heat.
“The preliminary cause of death is hyperthermia,” the county said. “The people who died ranged in age from 44 to 97 and include 17 women and 27 men … Many had underlying health conditions. Many of those who died were found alone, without air conditioning or a fan.”
Similarly, many of those who died in British Columbia were found alone in unventilated homes, according to the chief coroner of British Columbia, Lisa Lapointe, as cited by BBC.
The eventual death toll from this heat wave is likely to be much higher than current estimates, according to Kristie Ebi, a professor of global health at the University of Washington. Death certificates need to be gathered and analyzed from multiple areas, and the underlying and contributing causes of death ascertained (a challenge in itself). So it can take months to fully calculate the number of “excess deaths” related to a regional heat wave, as explained in detail in a YCC post last December.
“Those numbers are only going to go up,” Ebi said. Focusing only on factors such as heat stroke “gives you a massive underestimate of the overall [death toll].” Many heat wave deaths are triggered by respiratory and cardiovascular failures often under-recognized as being related to the torrid, often-polluted air of a heat wave.
If there’s one thing Ebi wants to avoid, it’s thinking of this catastrophic heat wave as the “new normal,” which she calls “really misleading” as it actually underestimates the gravity of the situation. “It implies we’re going from one state to another state. We’re in a period when there’s going to be ongoing change for decades.
“The new normal is not the current temperature. The new normal is the constant change.”
Otherworldly heat records
Never in the century-plus history of world weather observation have so many all-time heat records fallen by such a large margin than in the past week’s historic heat wave in western North America. The only heat wave that compares is the great Dust Bowl heat wave of July 1936 in the U.S. Midwest and south-central Canada. But even that cannot compare to what happened in the Northwest U.S. and western Canada over the past week.
“This is the most anomalous regional extreme heat event to occur anywhere on Earth since temperature records began. Nothing can compare,” said weather historian Christopher Burt, author of the book “Extreme Weather.”
Pointing to Lytton, Canada, he added, “There has never been a national heat record in a country with an extensive period of record and a multitude of observation sites that was beaten by 7°F to 8°F.”
International weather records researcher Maximiliano Herrera (@extremetemps) agrees. “What we are seeing now is totally unprecedented worldwide,” said Herrera, who tweeted on June 30, “It’s an endless waterfall of records being smashed.”
Some examples of the extremity of this event, based on preliminary data:
Portland, Oregon, broke its longstanding all-time record high (107°F from 1965 and 1981) on three days in a row – a stunning feat for any all-time record – with highs of 108°F on Saturday, June 26; 112°F on Sunday; and 116°F on Monday. That 116°F is one degree higher than the average daily high on June 28 at Death Valley, California.
• Quillayute, Washington, broke its official all-time high by a truly astonishing 11°F, after hitting 110°F on Monday (old record: 99°F on August 9, 1981). Quillayute is located near the lush Hoh Rain Forest on the Olympic Peninsula, just three miles from the Pacific Ocean, and receives an average of 100 inches of precipitation per year.
• Jasper, Alberta, broke its all-time high of 36.7°C (98.1°F) on four days in a row, June 27-30, with highs of 37.3°C, 39.0°C, 40.3°C, and 41.1°C (99.1°F, 102.2°F, 104.5°F, and 106°F).
• All-time state highs were tied in Washington (118°F at Dallesport) and set in Oregon (118°F at Hermiston, beating the reliable record of 117°F), and provincial highs were smashed in British Columbia (49.6°C at Lytton, beating 39.1°C) and Northwest Territories (39.9°C at Fort Smith, beating 31.7°C).
According to Herrera, more all-time heat records have been broken by at least 5°C (9°F) in the past week’s heat wave than in the previous 84-plus years of world weather recordkeeping, going back to July 1936. It’s worth noting that the record North American heat of the 1930s, including 1936, was largely connected to the Dust Bowl, in which the effects of a multiyear drought were amplified by over-plowed, denuded soil across the Great Plains – an example of human-induced climate change itself, albeit temporary.
Preliminary data from NOAA’s U.S. Records website shows that 55 U.S. stations had the highest temperatures in their history in the week ending June 28. More than 400 daily record highs were set. Over the past year, the nation has experienced about 38,000 daily record highs versus about 18,500 record lows, consistent with the 2:1 ratio of hot to cold records set in recent years.
What next?
The hellish heat dome that developed over the hardest-hit areas in this heat wave has now weakened and shifted east, though unusually hot conditions remain over a large part of the northern U.S. and western Canada.
Unrelenting drought has only intensified in recent weeks across the western U.S., where the overall extent of drought is at its highest level since the U.S. Drought Monitor was established in 2000. As of June 29, severe to exceptional drought (levels D2 to D4) covered 81% of the West, the first time on record that index has gone above 80%.
Meanwhile, a downstream buckling of the jet stream has led to an unusually mild, wet week from the Southern Rockies into the Midwest, though nothing close to record-setting on the same level as the heat wave. Oklahoma City received nearly 7” of rain in the last week of June, and parts of Detroit saw 6-8” of rain on June 26, triggering widespread high-impact flooding.
Uh-oh: another extreme high-pressure ridge predicted for the U.S. West
It’s July, the hottest month of the year in the Northern Hemisphere, and extreme ridges of high pressure forming in July have a good chance of setting all-time heat records. Unfortunately, the latest 10-day forecasts from the GFS and European models predict that the western U.S. will have an unusually intense ridge of high pressure capable of overthrowing more all-time U.S. heat records July 10-12.
By one common measure, the 12Z Thursday run of the GFS model is predicting that the heat dome at the center of this upper-level high will be nearly as strong as any ever observed. Warm air expanding at lower levels pushes up the height of the 500-millibar surface, roughly at the midpoint of the atmosphere, vertically. The 500-mb height is predicted by the GFS ensemble model average to exceed 598 decameters over the southwestern U.S. on July 11; the operational version of the model predicted 601 dm. The record-high 500-millibar height at Las Vegas, Nevada, as measured in twice-daily weather-balloon launches (soundings) since 1948, is 602 dm.
Ten-day forecasts of this nature are often inaccurate, so the coming heat wave may fall short of setting all-time records. Nevertheless, with record drought gripping the region, even an average-strength heat wave could boost the odds of significant wildfire activity.
Pagosa Country also remains in a voluntary drought stage…
“Under the Volun- tary Drought State there are no mandatory water use restrictions, however PAWSD does encourage responsible water use. This spring we have seen higher than normal temperatures. These high tempera- tures along with a reduction in late spring precipitation resulted in a quicker than normal melting of the snowpack reducing our available water and could lead to water use restrictions.”
[…]
River report
According to the U.S. Geological Survey (USGS), the San Juan River was flowing at a rate of 221 cfs in Pagosa Springs as of 10 a.m. on Wednesday, June 30.
Based on 85 years of water records at this site, the average flow rate for this date is 759 cfs.
The highest recorded rate for this date was in 1957 at 3,020 cfs. The lowest recorded rate was 19.9 cfs, recorded in 2002.
As of 10 a.m. on Wednesday, June 30, the Piedra River near Arboles was flowing at a rate of 176 cfs.
Based on 58 years of water records at this site, the average flow rate for this date is 764 cfs.
The highest recorded rate for this date was 2,030 cfs in 1979. The lowest recorded rate was 10.6 cfs in 2002.
Drought Report
According to the National Integrated Drought Information System (NIDIS) as of 10 a.m. on June 22, 100 percent of Archuleta County is in a moderate drought stage.
The NIDIS website notes that under a moderate drought stage dry-land crops may suffer, range- land growth is stunted, very little hay is available and risk of wildfires may increase.
The NIDIS website also notes that 71.17 percent of the county is in a severe drought stage.
According to the NIDIS, under a severe drought stage, fire season is extended.
Additionally, the NIDIS website notes that 51.04 percent, mostly the western portion, of the county is in an extreme drought.
The NIDIS website notes that under an extreme drought stage, large fires may develop and pasture conditions worsen.
According to the NIDIS, 6.24 percent of the county, in the south- western portion, is in an exceptional drought stage.
Under an exceptional drought stage, agricultural and recreational losses are large and dust storms and topsoil removal are widespread.
The Fountain Creek Watershed is located along the central front range of Colorado. It is a 927-square mile watershed that drains south into the Arkansas River at Pueblo. The watershed is bordered by the Palmer Divide to the north, Pikes Peak to the west, and a minor divide 20 miles east of Colorado Springs. Map via the Fountain Creek Watershed Flood Control and Greenway District.
Developers have dreams for Fountain that would quadruple the community’s size up to about 40,000 homes.
“It just hit us, that huge number of quadrupling,” Fountain City Manager Scott Trainor said. The requests to build the tens of thousands of homes poured in over the past two years, with many developers wanting to start immediately, he said.
Trainor said the city’s chances of adding more than 30,000 homes are “slim to none,” even with Security and Widefield water and sanitation districts serving about 20% of the city’s land.
The flood of proposals forced Fountain officials to take a step back and look at the critical needs with water at the top of the list. The community currently owns enough water to serve a little more than the equivalent of 1,200 taps and is setting out to find more as part of a water master plan.
The rush to build tens of thousands of new homes in Fountain is indicative of the growth pressure facing the bedroom community that supports Colorado Springs, Fort Carson and Pueblo. Fountain homes have traditionally been more affordable than those in Colorado Springs, in part because the land is cheaper, but the community has not been immune to rising housing construction costs, such as lumber, Trainor said.
If Fountain’s water supply can’t support the growth, developers will have to look for water from other sources and new residents may be pushed out to communities such as Pueblo West…
With current water supplies, Fountain officials said they expect to serve five new developments that will help fill the immediate need for housing…
The city will need to purchase, lease or otherwise secure water to meet additional demands outside of the Fountain and Widefield services areas and it is working on a water master plan to identify those future water sources, Blankenship said. The plan will work to identify water for the next 30 years, he said…
Not all of Fountain is dependent on the city’s water supply because Widefield and Security water and sanitation districts are serving numerous projects. Among them, the Security district may serve a shopping center redeveloping near Highway 85 and Main Street, and the Widefield district may provide water to a new subdivision of 1,180 homes called Corvalis, Trainor said.
FromThe Bulletin of Atomic Scientists (Peter Gleick):
No one wants to be a statistic in a climate disaster—an anonymous entry in a dataset of extreme events. But sometimes things sneak up on you. A couple of weeks ago, during one of the extraordinary and severe heat events striking western North America, I almost suffered from heat stroke.
You’d think I would know better—I’m a climate scientist and hydrologist. I’ve been researching, writing about, and discussing climate and weather risks for nearly four decades. I know that heat deaths are the most prevalent of all deaths from natural disasters, killing thousands or even tens of thousands of people every year. I know that extreme heat events are getting worse, precisely because of human-caused climate change.
And yet, there I was, trying to dig a simple hole in the ground for a wooden post in the dense, clay soils of the foothills of the Sierra Nevada in 100-degree-plus heat. Fifteen minutes was all it took for me to suddenly experience extreme dizziness and nausea. I came very close to passing out and was only saved by two nearby workers who brought me cold water and a cold compress to put on my head and neck and saw me safely back to an air-conditioned enclosure.
Climate change is already causing an increase in extreme events, including droughts and heat. The western United States is suffering from perhaps the most widespread and severe drought in recent history. As of early July, more than 98 percent of the American West was suffering from drought, with more than 80 percent in severe drought or worse. Extreme heat has struck several times since June, breaking records throughout the region and putting more than 20 million people under heat warnings from Canada to Mexico. Portland, Oregon broke a new record high of 115 degrees Fahrenheit; Seattle set a new record high of 108. Temperatures in the small town of Lytton, British Columbia, climbed to 121 degrees Fahrenheit (49.5 degrees Celsius), the highest temperature ever recorded in Canada, and then the town was destroyed by a fast-burning wildfire. Wildfires are now spreading rapidly throughout the region. Water levels in the major Colorado River reservoirs are at record lows, and Arizona and Nevada will almost certainly see reductions in their allocations from the river next year.
We’re not prepared for climate change, even in one of the wealthiest countries of the world and even with decades of warnings from scientists, in part because of extensive efforts of climate denial, the waffling of politicians, and legacy infrastructure built for yesterday’s climate, not tomorrow’s. In the Pacific Northwest, for example, struck by the recent extreme heat, very few people have air-conditioners, worsening the risk of heat illnesses among the most vulnerable populations. In a severe heat wave in Europe in 2019, several thousand people died and power plants had to be shut down because water temperatures were too high to cool them. A worse European heat wave in 2003 killed an estimated 70,000 people.
This is just the beginning. The Earth has only warmed by around a degree or two so far and is on track for several more degrees of warming. And yet the severe imbalances we’re now experiencing in extreme weather are only going to get worse with each passing year if rapid reductions in greenhouse gas emissions can’t be achieved. The heat extremes we’re seeing now will become the baseline—regular events—punctuated by even more extreme high temperatures as the planet warms further and weather patterns are increasingly disrupted.
I think I know better now than to try to do physical labor during extreme heat. But many workers have little or no ability to avoid these risks: farmworkers, construction workers, laborers of all kinds who are exposed to increasingly severe conditions and are often not informed about the risks or offered protections from them. More people are going to get sick; more are going to die from climate threats. Try not to be one of them, and do what you can to get our politicians to acknowledge and work to reduce these risks.
Monument is planning to install a new water treatment system in the coming months that will remove radium from one of its wells allowing it to start serving the town again.
The town expects to spend about $1.5 million on the new water treatment system, an associated building and lab space. The work will expand an existing facility at Second Street and Beacon Lite Road, said Tom Tharnish, Monument’s public works director.
Extended exposure to radium, a naturally occurring element and common along the Front Range, can cause cancer and other health problems over time, according to the Environmental Protection Agency…
The problem was discovered in the city’s 9th well about four years ago and no unsafe levels of radium ever reached residents’ taps. Monument’s engineers designed a system that diluted the radium to safe levels, but that proved to be only a temporary fix. The well was shut down late last year while the town worked on a more permanent solution, Tharnish said.
The new filtration system will employ a resin that will filter out the radium at the end of the water treatment process, he said…
The new technology will also come with ongoing maintenance costs. The resin will need to be replaced every year to 18 months and will require between $18,000 to $20,000, Tharnish said…
Monument’s board of trustees approved drilling a 10th well in November to help offset the loss of water from the well that had to be shut off because of radium pollution. The work was expected to cost $624,975. The new well is expected to be in production next week, Tharnish said.
The community is also seeking additional water rights, so that it doesn’t need to rely as heavily on its groundwater, Wilson said.
FromThe Durango Herald (Shannon Mullane) via The Cortez Journal:
Colorado Gov. Jared Polis declared a drought emergency Wednesday for La Plata County and 20 other counties on the Western Slope.
The declaration applies to counties experiencing severe, extreme or exceptional drought conditions, including the five-county region in Southwest Colorado. In response, Polis directed several state task forces to monitor the area and gather input about urgent, unmet needs…
The most recent water year, which runs from Oct. 1 to Sept. 30, was the 12th warmest on record in Colorado since 1895 and saw record-breaking fires around the state. It was the third driest water year, trailing 2002, the driest year, and 2018, the second driest year, according to the conservation board…
The Drought Response Plan and supporting task forces will remain activated, assessing conditions and recommending mitigation measures, until statewide conditions significantly improve, according to the conservation board…
Annual precipitation in Colorado averages 17 inches statewide, and its semi-arid climate means water availability is a consistent concern, according to the conservation board website.
Severe, widespread, multi-year droughts – like the one affecting the Western Slope – are less common.
Since 1893, Colorado has experienced six droughts that are widely considered “severe.” These droughts affected most of the state, involved record-breaking dry spells and/or lasted for multiple years.
L. to R. Dan Gibbs, Kate Greenberg, Jared Polis, Rebecca Mitchell at Confluence Park in Denver June 2021.
Here’s the release from the Colorado Water Conservation Board:
The Colorado Department of Natural Resources (DNR) and the Colorado Water Conservation Board (CWCB) celebrated with Governor Polis and legislative leaders on signing legislation into law, which will provide $20 million in state stimulus funding towards the Colorado Water Plan, the state’s collaborative framework for addressing water challenges.
“This investment in our water is a significant boost for the Colorado Water Plan. Our water supply is highly variable, and our demands are growing, all while much of our state deals with a lingering drought. The Water Plan sets a vision and allows our state to plan better for Colorado’s water future,” said Dan Gibbs, Executive Director, Colorado DNR. “We greatly appreciate the strong support of legislators, water providers and other partners for this needed and timely funding to help us address our water challenges head on.”
Of the funding from House Bill H.B.21-1260, $15 million is directed from the state’s General Fund to the Water Plan Grant Program for statewide goals, and $5 million is directed to local water projects recommended by each of the state’s nine stakeholder-driven basin roundtables.
“We are so grateful for the legislature’s support in funding critical water projects around the state that will help us all meet our future needs. This funding is not only important for water supply, but also for ensuring that we have a healthy environment, productive agriculture, and robust recreational opportunities,” said CWCB Director Becky Mitchell.
CWCB awards Water Plan Grants to agricultural water projects, conservation and land use planning efforts, engagement and innovation, environment and recreation projects, and projects that enhance water storage and supply. The upcoming deadlines for grant applications are July 1 and December 1.
Funding dedicated to projects at the local level are intended to assist Colorado water users in addressing their critical water supply issues and interests. Grants must be approved by at least one of Colorado’s nine basin roundtables and are then forwarded to the CWCB for final approval.
On the same day, Governor Polis signed Senate Bill 21-189, the annual CWCB Construction Fund Projects Bill, which includes funding for a variety of CWCB programs and projects including satellite monitoring systems, the floodplain map modernization program, weather modification permitting, and funding for Water Education Colorado, among other programs.
ON SEPTEMBER 24, WE WILL STRIKE TO DEMAND FOR INTERSECTIONAL CLIMATE JUSTICE! JOIN US!
The climate crisis does not exist in a vacuum. Other socio-economic crises such as racism, sexism, ableism, class inequality, and more amplify the climate crisis and vice versa. It is not just a single issue, our different struggles and liberations are connected and tied to each other. We are united in our fight for climate justice, but we must also acknowledge that we do not experience the same problems; nor do we experience them to the same extent.
MAPA (Most Affected Peoples and Areas) are experiencing the worst impacts of the climate crisis and are unable to adapt to it. This is because of the elite of the Global North who have caused the destruction of our lands through colonialism, imperialism, systemic injustices, and their wanton greed which ultimately caused the warming of the planet. With both the COVID, climate, and every crisis in history, overexploited countries and marginalized sectors of society are systematically left behind to fend for themselves.
The time to join the masses and follow the lead of our environmental defenders and workers has been long overdue. Reparations to MAPA must be paid for the historic injustices of the richest elite, vaccine equity, cancellation of debt, and climate finance are only the beginning of these. Together we will fight for a just future where no one is left behind. The historical victories of collective action have proven the need for the youth to stand united with the multisectoral, intergenerational struggle for a better future for all; a future where people and planet are prioritized.
As North America enters its peak summer growing season, gardeners are planting and weeding, and groundskeepers are mowing parks and playing fields. Many are using the popular weed killer Roundup, which is widely available at stores like Home Depot and Target.
In the past two years, three U.S. juries have awarded multimillion-dollar verdicts to plaintiffs who asserted that glyphosate, the active ingredient in Roundup, gave them non-Hodgkin lymphoma, a cancer of the immune system. Bayer, a German chemical company, bought Roundup’s inventor, Monsanto, in 2018 and inherited some 125,000 pending lawsuits, of which it has settled all but about 30,000. The company is now considering ending U.S. retail sales of Roundup to reduce the risk of further lawsuits from residential users, who have been the main source of legal claims.
Glyphosate is now showing up in humans, but scientists are still debating its health effects. One thing is clear, though: Because it’s an effective and very cheap weedkiller, it has become pervasive.
Research on glyphosate’s possible human health effects in inconclusive, but concern is rising over its heavy use worldwide.
How glyphosate went global
When glyphosate was commercialized under the Roundup brand name in 1974, it was widely viewed as safe. Monsanto scientists claimed that it would not harm people or other nontarget organisms and did not persist in soil and water. Scientific reviews determined that it did not build up in animal tissue.
In the 1990s Monsanto began packaging glyphosate with crops that were genetically modified to be resistant to it, including corn, soybeans, cotton and canola. Farmers who used these “Roundup Ready” seeds could apply a single herbicide to manage weeds during the growing season, saving time and simplifying production decisions. Roundup became the highest-selling and most profitable herbicide ever to appear on the global market.
An employee arranging boxes of agricultural chemicals at a warehouse of Anhui Fengle Agrochemical Co. on Feb. 26, 2021, in Hefei, China. Ruan Xuefeng/VCG via Getty Images)
China still dominates the pesticide industry – it exported 46% of all herbicides worldwide in 2018 – but now other countries are getting into the business, including Malaysia and India. Pesticides used to flow from Europe and North America to developing nations, but now developing countries export many pesticides to wealthy nations. More pesticide factories in more places leads to oversupply and even lower prices, with critical implications for human health and the environment.
The question of whether glyphosate causes cancer in humans has been hotly debated. In 2015 the International Agency for Research on Cancer, an agency of the World Health Organization, classified it as a probable human carcinogen based on “limited” evidence of cancer in humans from actual real-world exposures and “sufficient” evidence of cancer in experimental animals.
There also are questions about possible linkages between glyphosate and other human health problems. A 2019 study found that children whose mothers experienced prenatal exposure to glyphosate had a significantly higher risk of autism spectrum disorder than a control population.
However, the U.S. Environmental Protection Agency and the European Food Safety Authority maintain that glyphosate is unlikely to cause cancer in humans and does not threaten human health when used according to the manufacturer’s directions.
A challenge for regulators
In the 1990s and early 2000s, the world community adopted several groundbreaking agreements to restrict or monitor sales and use of hazardous pesticides. These agreements – the Stockholm and Rotterdam conventions – target compounds that are either acutely toxic or persist in the environment and accumulate in animals, including humans. Glyphosate does not appear to meet these criteria, but humans may be more exposed to it because of its ubiquity in soil and water and on food.
Today a handful of countries, including Luxembourg and Mexico, have banned or restricted the use of glyphosate, citing health concerns. In most countries, however, it remains legal with few restrictions.
Scientists are unlikely to reach consensus soon about glyphosate’s health and environmental impacts. But that has also been true of other pesticides.
For example, DDT – which is still used in developing countries to control mosquitoes that spread malaria and other diseases – was banned in the U.S. in 1972 for its effects on wildlife and potential harm to humans. But it was not thought to cause cancer in humans until 2015, when scientists analyzed data from women whose mothers were exposed to DDT while pregnant in the 1960s, and found that these women were more than four times as likely to develop breast cancer than others who were not exposed. This study was published 65 years after the first congressional testimony on DDT’s human health impacts.
In 1946, health officials who believed incorrectly that polio was spread by insects ordered widespread fogging with DDT in San Antonio, Texas, decades before the pesticide’s health and environmental effects were understood.
Science can take a long time to reach conclusive results. Given how widely glyphosate is used now, we expect that if it is definitively found to harm human health, its effects will be widespread, difficult to isolate and extremely challenging to regulate.
And finding a cheap silver bullet to safely replace it could be hard. Many substitutes on the market today are more acutely toxic. Nonetheless, there’s a need for better options, because weeds are developing resistance to glyphosate.
In our view, growing concerns about glyphosate’s effectiveness and possible health impacts should accelerate research into alternative solutions to chemical weed control. Without more public support for these efforts, farmers will turn to more toxic herbicides. Glyphosate looks cheap now, but its true costs could turn out to be much higher.
This article has been updated to remove a reference to glyphosate detection in breast milk, which was based on a study that was not peer-reviewed.
The Bureau of Reclamation is awarding $1.14 million in WaterSMART Water Marketing Grants to seven projects in California, Colorado, Utah, and Washington. These grants will provide cost-shared financial assistance for the selected entities to develop water marketing strategies to establish or expand water markets or water marketing activities.
“Water markets and water marketing allow the movement of water between willing buyers and sellers under state and federal law,” said Chief Engineer David Raff. “These strategies will provide water managers more flexibility in addressing their water management challenges and reduce conflicts over water.”
These grants will support more than $2.6 million in water marketing planning activities including the recipients’ cost share. The seven selected projects are:
City of Vallejo Water Department, Water Marketing Strategy Development for Lake Curry Reservoir (California): Reclamation Funding: $200,000, Total Project Cost: $495,995
San Luis Rey Indian Water Authority, San Luis Rey Indian Water Authority Water Marketing Strategy Plan (California): Reclamation Funding: $200,000, Total Project Cost: $400,000
City of Thornton, City of Thornton Northern Properties Stewardship Plan: Water Optimization Market Feasibility Study (Colorado): Reclamation Funding: $275,000, Total Project Cost: $550,000
Rio Grande Water Conservation District, Colorado’s Rio Grande Basin Water Cooperative Project (Colorado): Reclamation Funding: $212,755, Total Project Cost: $425,511
Mt. Nebo Water Agency, South Utah County Water Banking Strategy (Utah): Reclamation Funding: $44,000, Total Project Cost: $88,460
Selah Moxee Irrigation District, Easy Moxie Declining Groundwater Area Water Marketing Strategy (Washington): Reclamation Funding: $150,000, Total Project Cost: $480,000
TransAlta Centralia Generation, LLC, TransAlta Centralia Water Marketing Strategy (Washington): Reclamation Funding: $60,000, Total Project Cost: $120,000
Through WaterSMART, Reclamation works cooperatively with states, tribes, and local entities to plan for and implement actions to increase water supply reliability through investments to modernize existing infrastructure and attention to local water conflicts. Visit http://www.usbr.gov/watersmart to learn more.
Colorado River “Beginnings”. Photo: Brent Gardner-Smith/Aspen Journalism
FromInkStain (Eric Kuhn and John Fleck). Click through and read the whole thing. Here’s an excerpt:
Unlike the Lower Colorado River Basin States, which have traditionally taken pragmatic and self-serving views of the 1922 Colorado River Compact, the Upper Basin States have largely shown the century-old document unwavering reverence.
The reverence comes from the way the agreement protected Wyoming, Colorado, Utah, and New Mexico against the avaricious impulses of fast-growing Lower Basin states, especially Arizona and California. The Compact promised water that has driven a century of development and dreaming in the Upper Basin.
Now, however, climate change-driven aridification has the Upper Basin in a vise-like squeeze. Increasing regional temperatures are reducing the river’s natural flow while the compact imposes fixed delivery (or non-depletion) obligations on the four Upper Basin States.
The net difference between the amount of water flowing from the Upper Basin’s watersheds and the amount that must be passed to the Lower Basin at Lee Ferry is the amount that can be consumed. As recent discussions about implications of “Alternative Management Paradigms for the Future of the Colorado and Green Rivers” by Kevin Wheeler, et al from the Colorado River Futures Project out of Utah State University have shown, state water officials from the upper river are beginning to understand that today’s law of the river places most of the future climate change risk on their states. But their fealty to the compact remains a major factor. (One of us, Eric Kuhn, is a co-author of the report. The other, John Fleck, serves on the project’s advisory committee.)
This dilemma raises the fundamental question facing the basin as it begins to negotiate the post-2026 river:
In recent months the paper’s authors have held briefings for state and federal water management agencies, water districts, and environmental NGOs. Most recently, they met (via Zoom) with representatives of the Upper Basin States under the umbrella of the Upper Colorado River Commission. Although the briefings varied in length and how deeply they got “into the weeds” concerning the modelling and science behind the study, the general messages and discussions were similar:
Balancing the river system’s water budget will require deeper cuts in total system water use than now contemplated by the basin Drought Contingency Plans. Further, future conservation targets and reservoir operations rules cannot be static. They will have to accommodate declining long-term average flows and increased variability. There is a general agreement that the post-2026 guidelines should work effectively down to a mean natural flow of 11-12 million acre-feet per year. Nevada’s John Entsminger suggested 11 maf at the University of Colorado’s Getches-Wilkinson Center Conference in 2019 – one of the last and most meaningful public conversations among the basin leadership before the pandemic shut us all down. For comparison, the estimated natural flow at Lee Ferry for the current 2000-2021 period is about 12.4 maf/year…
Our hope is that collectively, they will be open to a wide range of different future options and that they will pursue different options in parallel. We would also hope that one of those options is to recognize that we now have a fundamentally different river to manage than the one that their predecessors thought they had when the 1922 Compact, 1944 Treaty with Mexico, and 1948 Compacts were negotiated, therefore, managing today’s river may require breaking the chains that unnecessarily tie us to the past.
Those caught in the July 1 rainstorm said it was like weeks of monsoon rains — that came all at once.
Thursday evening’s deluge gave the entire county some much-needed moisture — but it flooded Salida’s main streets several inches deep in places, as the storm sewers couldn’t keep up. Tourists and visitors in downtown Salida scrambled to find shelter from the continuing downpour that began there just before 7:00 p.m., as the slow-moving front hung over the Arkansas River Valley.
The National Weather Service issued flood warnings throughout the area from late afternoon onward. As of 1:00 p.m. Friday, it again issued flood warnings across the Chaffee County area until at least 4:00 p.m. MST. They included the message that the storms have the potential for dangerous and life-threatening situations to develop…
The storm caused the infamous Chalk Creek Canyon “dip” to flow, closing CR 162 and routing residents and camping visitors to the canyon onto the gravelled back route south of Mt. Princeton Hot Springs, where the downpour had flooded parts of that county road as well…
Chaffee County quickly moved from immediate concerns over agricultural ditch water shortages and drought to flooding concerns, especially in the burn scar areas left by the Decker Fire and the Hayden Pass Fire.
While residents of Buena Vista reported much lower rain amounts, more than two inches fell in the Chalk Creek Canyon, with estimates of three to four inches in the southern half of the county…
Muddy torrents are shown above, coursing through the CR 111 flood diversion ditch in Salida. Earlier flows washed over the banks, as evidenced by the pooled waters on either side. Video courtesy of area resident Maureen Parsons.
In other parts of the south end of the county, localized flash floods occurred on the north side of Methodist Mountain. Most flood controls worked but there is damage reported between CR 110-111.
Flooding also appears to have happened up and downstream along the South Arkansas (unconfirmed at press time), which has had little water the past few days…
Residents of the Central Colorado Rockies know that what is called the “summer monsoon flow” is what we depend upon for summer moisture. The storm clouds that boil up over the Sawatch and Sangre de Cristo mountain ranges in mid-afternoon often bring short-lived showers, clearing again in time for evening barbeques.
Strong storms brought heavy rain to Colorado’s Front Range on Thursday, causing flash flooding in some areas with more rain likely on the way.
Many streets in Greeley experienced flash flooding on Thursday afternoon after torrential downpours dropped an estimated 3 to 4 inches of rain in about an hour over the city, according to the National Weather Service (NWS) in Boulder.
An unprecedented heat wave worsened drought conditions in Northwest, according to the US Drought Monitor. Record-breaking temperatures in Oregon and Washington dried soil and vegetation further, leading to an expansion of moderate and severe drought in that region.
Vast swaths of the West remain in a historic and unrelenting drought, the worst in the region in at least 20 years. The most severe conditions are centered in the Southwest in California, Nevada, Utah and Arizona. But areas of extreme and exceptional drought extend north as well into Oregon and Washington, where oppressive weekend heat dried out the ground and vegetation even more.
Climate change is playing a key role in these compounding crises: Drought and extreme heat are fueling wildfires; reduced snowpack and the lack of substantial precipitation are exacerbating water demands for millions of people, as well as agriculture, ecosystems and deteriorating infrastructure.
In addition to mandatory water restrictions already in place, even stricter cuts are looming amid the drought in some states as water levels plummet along the Colorado River.
Around 93% of the West is in some level of drought, up from 91% last week. Nearly 60% of the West is under ‘extreme’ or ‘exceptional’ drought — the two most severe classifications. It is the largest area of the West under those classifications in the 21-year history of the US Drought Monitor.
Conditions in much of the Southwest remained the same, though the drought in some areas, such as central Arizona, expanded. The drought has also sparked an increase in wildfire encounters in California, Nevada, and Utah.
The record-shattering heat waves in the Pacific Northwest also led to worsening drought conditions across the region.
As the planet warms, drought and extreme heat will also fuel deadly wildfires. Multiple studies have linked rising carbon dioxide emissions and high temperatures to increased acreage of burning across the West, particularly in California…
Stream and river flow
Streamflow, a measure of how much water is carried by rivers and streams, is another significant indicator of drought and its impact.
As drought conditions have worsened in 2021, hundreds of stream and river locations are experiencing below-average flow. More than 50 percent of the western monitoring stations reported lighter-than-usual flows. Fishing restrictions have also been put in place on many rivers in Montana due to low flows and warm waters.
Changes in streamflow affect the water supply for our own municipal use, crop irrigation and power generation.
A Laramie County family said last week statutes and regulations obligate the state engineer to approve its plan to drill eight high-capacity water wells into the troubled High Plains Aquifer, a plan some neighbors strongly oppose.
Members of the Lerwick family made their case for the new wells in a three-day public hearing in Cheyenne that pit neighbor against neighbor. Farmers and ranchers living near the proposed development said it would draw water from the aquifer under their lands, imperiling springs, creeks and wells on which their operations depend.
If the project moves forward, opponents said, they will be left with unsatisfactory legal recourse. But expert witnesses called by the Lerwicks contested those claims, saying that there’s enough water for the development and that they’re not looking to harm their neighbors
The hearing stemmed from a 2019 application by Ty Lerwick, Keith Lerwick and Rod and Jill Lerwick to the State Engineer’s Office for eight permits to drill irrigation wells in the High Plains Aquifer system.
The proceeding’s purpose was to provide information to the Laramie County Control Area Advisory Board and the State Engineer’s Office. The advisory board will make a recommendation to the state engineer, who will then issue a decision on the Lerwick applications…
The various parties presented their cases, and participation was limited to the parties, their representatives and their identified witnesses. Those opposed to the Lerwick wells were identified as contestants, and the Lerwicks as contestees.
The applications would allow the Lerwicks to drill high-capacity wells that protesters say would draw more than 1.5 billion gallons from the ground each year. Several farmers and ranchers testified that they would have to drill new wells at significant cost to replace water sources that could be lost if the proposed wells are approved…
Epler even argued that approval could set a dangerous precedent for Wyoming.
The Lerwicks used their words sparsely throughout the proceeding. Rod Lerwick said his intention is to develop the water for irrigation, not harm his neighbors.
The area in question, which covers two-thirds of eastern Laramie County, is designated as the Laramie County Control Area. Since it was established in 1981, groundwater levels have continued to decline, according to the state engineer’s records. Despite that, in 2015, then-state engineer Pat Tyrell issued an order that created potential for new high-capacity wells to be drilled in the area.
Both the Lerwicks and their opponents contend that the law is on their side.
Evidence shows there is water available for appropriation in the aquifer and that law requires the state engineer to approve development that is of benefit to the public interest, according to the Lerwicks’ lawyer, Laramie attorney Bill Hiser. The state engineer could impose regulations on the Lerwicks’ development designed to protect the public interest, and that his clients would comply, Hiser said.
He also noted that guideposts are in place to ensure development proceeds properly. Not only would people who believe they’ve been injured by the development have an interference claim as a recourse, Hiser said, but the state engineer has the ability to monitor the development as it proceeds. (Hiser said there is “no chance” the Lerwicks would start eight new high capacity wells at one time.)…
Epler, attorney for the contestants, painted a different picture.
The Lerwicks’ permit applications are not legally sufficient, Epler said, pointing to what she saw as errors and omissions. The burden is on the applicants to demonstrate there is water available for appropriation in the source, and the Lerwicks failed to do so, she said.
The contestants’ position, Epler said, is that there is not, in fact, water available for the Lerwicks’ development. Granting the permits would only lead to more high capacity wells, she said, exacerbating the problem…
The rights of established water users needed to be considered, Mark Stewart, a Cheyenne attorney representing Lerwick-opponents at the Gross-Wilkinson Ranch, said. The ability to bring an interference claim, Stewart said, is an insufficient legal remedy.
“That’s too little too late,” Stewart said. “You’ve heard uncontroverted evidence that an injury to groundwater cannot be remedied immediately. It takes time to investigate, to determine the amount of injury, and it takes time to remedy and redress that.”
The development’s relative harm to the community would “far outweigh” the benefit to the Lerwicks, Conner Nicklas, a Cheyenne attorney representing Harding Ranch, Inc., said. Nicklas said his client had already seen water drying up in wells and on the surface, and estimated it would cost $500,000 to resupply water lost because of the Lerwick development…
Probing the ultimate purpose, contestants’ attorneys asked Lerwick about any plans to transfer water rights temporarily — potentially for significant profit — for oilfield use. Lerwick testified that he had not entered into third-party agreements to transfer water rights for fracking and that there was no third-party financing of the application…
Epler asked if there could be a profit incentive to eventually transfer water for fracking, to which Lerwick replied it was “possible, but not likely.”
Rod Lerwick said he has “nothing to hide” when it comes to the family’s plans for groundwater development. The plan for now, he said, is to use the development for irrigation.
When asked how he would feel if he were in the contestants’ situation, Rod Lerwick said he has thought about that, but doesn’t know if he would be among protesters to a permit application…
Expert testimony
Two expert witnesses testified for the Lerwicks that there is groundwater available for high-capacity irrigation wells in the Laramie County Conservation Area.
In 2012, the state engineer’s office contracted with AMEC Environment & Infrastructure to conduct a hydrogeologic study largely focused on the conservation area. The modeling depicted current aquifer drawdown compared to pre-development conditions, and also evaluated future groundwater level changes with several modeling scenarios…
Ben Jordan, senior hydrologist at Weston Groundwater Engineering in Laramie, said that the modeling in what’s known as the AMEC Report, as well as hydrographs and monitoring wells, tell him there is water available for appropriation in the district where the proposed wells would be located…
Jordan also said there “are tools in place to make sure harm is minimized,” whether that’s the state engineer putting certain requirements on the permit or the recourse of filing an interference claim…
The contestants responded with their own expert witnesses, who questioned the picture Jordan and Rhodes painted…
Russ Dahlgren, a hydrologist and engineer with Dahlgren Consulting, Inc., testified that he does not believe there is water available for a development like the one proposed by the Lerwicks. The AMEC model, he said, needs to be vetted, reviewed and modified. In an April 2020 letter to the State Engineer’s Office, Dahlgren wrote that the 2015 order that opened up the conservation area to high-capacity drilling should be discontinued and urged a moratorium on new high-capacity wells.
Dahlgren also testified that filing an interference claim takes a significant amount of time and effort. “I think we can do better than that particular standard,” he said.
The application now moves to the Laramie County Control Area Advisory Board, which has yet to set a date to consider the information gathered at the hearing.
Colorado Water Court for the Arkansas River Basin (Division 2) has issued a decree expanding the area within which the Upper Arkansas Water Conservancy District can provide augmentation water. The expansion includes parts of Custer and Fremont counties.
Attorney Kendall Burgemeister reported the news at the June meeting of the Upper Ark District board of directors. The decree is the culmination of a 3-year legal process that required the District to demonstrate its ability to provide replacement water and protect local water rights within the expanded boundary.
District General Manager Terry Scanga said the decree has already spurred several requests for water to replace evaporation from ponds within the new augmentation boundary, or “blue line.”
The Division 2 Engineer’s Office, Colorado Division of Water Resources, recently began evaluating ponds in the Arkansas River Basin for evaporative losses, identifying more than 10,000 ponds with no legal right to divert or store water.
An agency fact sheet describing the new pond management effort states, “For every acre of pond surface area, up to 1 million gallons of water is lost to evaporation each year.”
Under Colorado water law, water lost to evaporation from the ponds in question is injuring water rights owners by depriving them of water to which they are legally entitled.
The significance of these cumulative water losses prompted Division 2 Engineer Bill Tyner to implement the pond management initiative.
Tyner told Aspen Journalism, “Once we put the data together and we could look at the images of ponds and get a count of the number and relative sizes on average of those ponds, it did make us just very sure that this was a problem that could have some very negative consequences for the basin if we didn’t get more aggressive about the way that we took it on.”
Property owners within the new blue line are now seeking augmentation water from the Upper Ark District to avoid having to drain their ponds.
Scanga said the District’s agreements for pond augmentation are “curtailable.” During drought years, the district will stop augmenting ponds, and the pond owners will have to release water, which essentially provides a backup water supply.
Scanga said almost 50 parties filed statements of opposition in the case but that most opposers did not remain active in the case, including Custer County, prompting the judge to dismiss those filings “for lack of participation.”
Once stipulations were agreed upon with the handful of opposers did participate, the blue line decree was issued without the need for a trial.
From the USFS (Jonathan Hare) via The Montrose Press:
The Grand Mesa, Uncompahgre and Gunnison National Forests is planning to authorize Colorado Parks and Wildlife’s Spring Creek Reservoir Dam Outlet Rehabilitation Project.
The project would last approximately 90 days beginning August 2021. The purpose of this project is to address the most immediate maintenance concerns to reduce the risk of dam failure.
“In the fall of 2017, the U.S. Forest Service was approached by CPW with eminent structural concerns at Spring Creek Reservoir,” District Ranger Matt McCombs said.
“CPW and the USDA, Forest Service worked together to take immediate action to safeguard the dam and public safety. This project is a continuation of that important work and partnership.”
Work on U.S. Department of Agriculture, Forest Service lands would include the construction of a 625-foot access road to the dam’s outlet, repairs/upgrades of the outlet pipe and installation of a new gate stem and controller along with a reinforced grade beam with instrumentation for monitoring.
Reaching the outlet and upstream site for the grade beam requires the reservoir to be fully drained. To allow for the required work, CPW is actively drawing down the water in Spring Creek Reservoir.
The work proposed on Forest Service lands is expected to be cleared through the National Environmental Policy Act under a categorical exclusion. A preliminary evaluation of anticipated environmental effects indicate there are no extraordinary circumstances that would require preparation of an Environmental Assessment or Environmental Impact Statement.
For additional information, questions or concerns, please contact Jonathan Hare at 970-642-4445 or jonathan.hare@usda.gov.