#Colorado State of Our Rivers Report — #Conservation Science Partners

Table 3. Summary of the top-scoring HUC10 watersheds across the state for ONRW potential, based on total river miles that scored within the top 25% of segment-level ONRW scores.

Click here to read the report. Here’s the executive summary:

Rivers are crucial to supporting biodiversity and providing ecosystem services such as clean drinking water and recreation opportunities, offering far more value to people, wildlife, and ecosystems than might be expected given their small global footprint. Yet rivers are under increasing threat as the climate warms and our populations grow, placing greater stress and demand on freshwater resources. Despite their life-giving importance, few rivers and streams are currently protected from human impacts to their integrity and flow. We have the opportunity now to protect more of these waterways in the United States through a variety of mechanisms.

We offer a rigorous assessment of wild rivers that are currently unprotected and, using various criteria for evaluating their ecological value, quantify and highlight those that are most ecologically important to protect. We focused in particular on identifying rivers and streams throughout Colorado with the highest potential for Outstanding National Resource Water (ONRW) designation, although we anticipate the data provided to be valuable for supporting river protection through other mechanisms, such as the federal Wild and Scenic Rivers Act. Here, we connect designation criteria to statewide data to identify rivers with the greatest potential to achieve formal protection via ONRW designation. We summarize our key findings and map these rivers statewide to help visualize the “best of the best” river segments and other ecologically important places to seek new protections.

Our assessment shows that, of the 15,221 miles considered, rivers and streams with the highest ONRW potential are distributed widely across western Colorado, while most rivers east of the Front Range do not achieve sufficient water quality to be considered further for ONRW designation. In all, 662 river miles demonstrate outstanding overall value in that they score in the top 25% of all rivers statewide for every ONRW criterion, including water quality, ecological significance, recreational value, and absence of human modification, attributes that do not coincide as strongly elsewhere. It is important to note that Colorado requires water quality data for potential designation; unmeasured rivers and streams were excluded from consideration. Colorado’s rivers support a variety of aquatic species identified by the state as Species of Greatest Conservation Need (SGCN); 1,881 river miles are within the ranges of at least five aquatic SGCN. An impressive 12,600 river miles across western Colorado have sufficient water quality to support all beneficial uses, including drinking water; protection of any of these waters would help to maintain provision of this vital ecosystem service for generations to come. At the watershed level, the headwaters of the Dolores River are extraordinary in representing the greatest total river miles with high ONRW potential in a single watershed.

In short, thousands of river miles across Colorado—western Colorado, in particular—possess a wide range of ecological values and ecosystem services worthy of protection, whether through state-level designations, federal Wild & Scenic designation, or other available mechanisms. This assessment and the data accompanying it offer scientifically grounded support for identification of the values associated with rivers, streams, and watersheds across Colorado that can inform and support efforts to ensure those values persist.

Click to enlarge.

Rare earth elements and old mines spell trouble for Western #water supplies — University of #Colorado

Here’s the release from Instarr (Shelly Sommer):

Rare earth elements are finding their way into Colorado water supplies, driven by changes in climate, finds a new study published in the journal Environmental Science & Technology.

Rare earth elements are necessary components of many computing and other high-tech devices, like cell phones and hard drives. But there is growing recognition that they can be hazardous in the environment even at low levels of concentration.

“This is of concern because their concentrations are not monitored and there are no water quality standards set for them,” says study author Diane McKnight, who is an INSTAAR Fellow and Engineering professor at the University of Colorado Boulder.

The study is the first to look at how rare earth elements move within a watershed that is rich in minerals. It is also the first to investigate how climate change, by altering stream flow and natural weathering processes, is releasing more rare earth elements into streams.

Sampling water quality in the Snake River. Photo credit: Instaar

Diane McKnight has led her students in investigations of water quality in the Snake River watershed of Colorado since the 1990s. Their main focus has been measuring and observing acid rock drainage. In this process, rocks that include sulfide-based minerals, such as pyrite, oxidize when exposed to air and water. The resulting chemical reaction produces sulfuric acid and dissolved metals like iron, which drain into streams. More acidic water can further dissolve heavy metals, like lead, cadmium, and zinc, and as it turns out can carry rare earth elements as well.

“What really controls the mobility of rare earth elements is pH. Acid literally leaches it out of the rocks,” says first author Garrett Rue, who earned a masters degree studying limnology with McKnight and a subsequent PhD from the University of Colorado Boulder.

Acid rock drainage happens naturally throughout the western United States, with its pyrite-rich geology. But historic mines that disturb large amounts of rocks and soil amp up the process dramatically and cause downstream water pollution.

Within the Snake River watershed, towns impacted by acid mine drainage have been forced to adapt to poor water quality. Some former mining boomtowns, like Silverton, import water from distant sources. Others rely on expensive water treatment plants. All fish in the Snake River are stocked, since the water is too high in zinc for any native fish species to survive. The problem is endemic to the western United States, says Rue: “Upwards of forty percent of the headwaters to major rivers in the West are contaminated by some form of acid mine or rock drainage.”

The Snake River has made a good natural laboratory for investigating both, since the Peru Creek part of the watershed was heavily mined, while the Upper Snake River was not. But Rue and McKnight found that both parts of the watershed are now contributing significant amounts of metals downstream, as climate change has brought longer summers and less snow in the winters. Longer, lower stream flows make it easier for metals to leach into the watershed, and concentrate the metals that would otherwise be diluted by snowmelt.

The same processes that mean more heavy metals are finding their way into streams are also acting on rare earth elements. The researchers found rare earth elements throughout the Snake River. “We documented a concentration range of one to hundreds of micrograms per liter—several orders of magnitude higher than typical for surface waters—with the highest concentrations nearest the headwaters and areas receiving drainage from abandoned mine workings,” says Rue.

They also documented that increases in rare earth elements in the Snake River corresponded to warming summer air temperatures, and that rare earth elements are accumulating in insects living in streams at concentrations comparable to other metals such as lead and cadmium shown to be toxic.

“We’re starting to understand that once rare earth elements get in the water, they tend to stay there,” says Rue. “They aren’t removed by traditional treatment processes either, which has implications for reuse and has led some European cities to designate REEs as an emerging contaminant to drinking water supplies. And considering that the Snake River flows directly into Dillion Reservoir, which is Denver’s largest source of stored water, this could be a concern for the future.”

The researchers suggest that investigating and investing in technologies to recover rare earth elements from natural waters could yield valuable commodities and help address the problems associated with acid rock and mine drainage, which are poised to worsen as the climate shifts.

“Rare earth elements are used to make a lot of products. But most of the supply comes from China. So our government has been looking for sources, but at the same time mining has left an indelible mark on the waters of the West,” says Rue. “If we can harvest some of these materials that are already coming into our environment, it might be worthwhile to treat that water and recover these materials at the same time.”

“This problem is getting worse and we need to deal with it,” adds McKnight. “If we can solve the problem holistically, we can have a valuable resource and also think about climate adaptation.”

Something in the water: Trying to get a handle on E. coli issues in the #SanJuanRiver, #AnimasRiver — The #Durango Telegraph

The Animas River in Durango, in Apri, 2018. Photo: Brent Gardner-Smith/Aspen Journalism

From The Durango Telegraph (Jonathan Romeo):

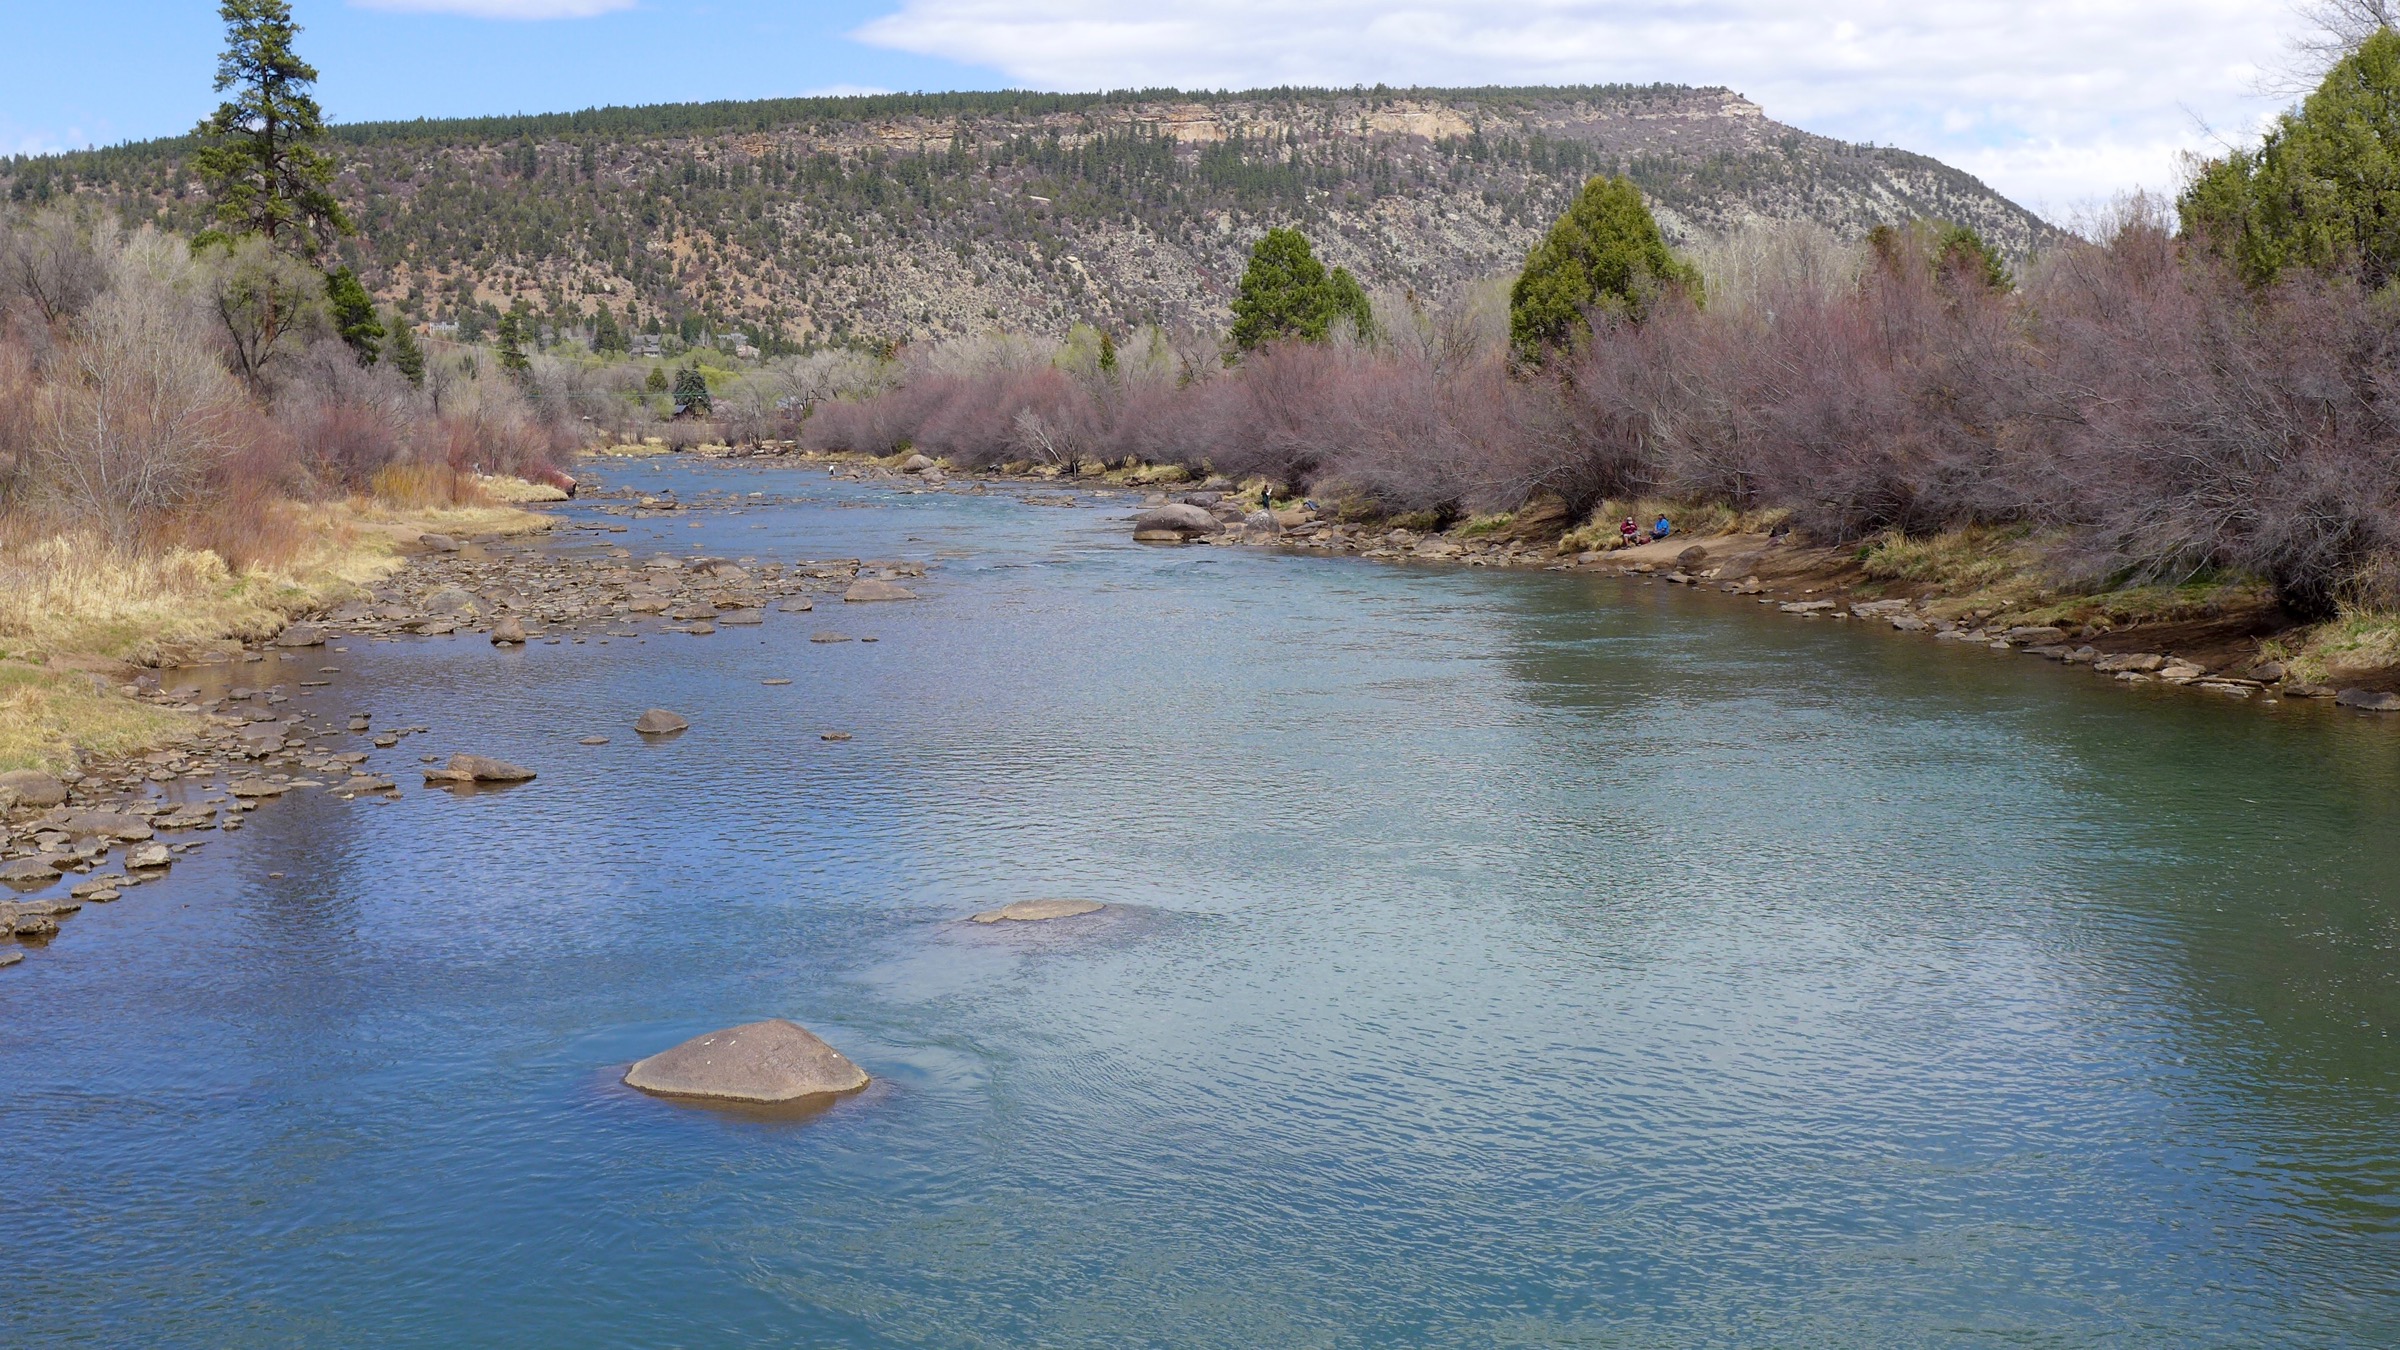
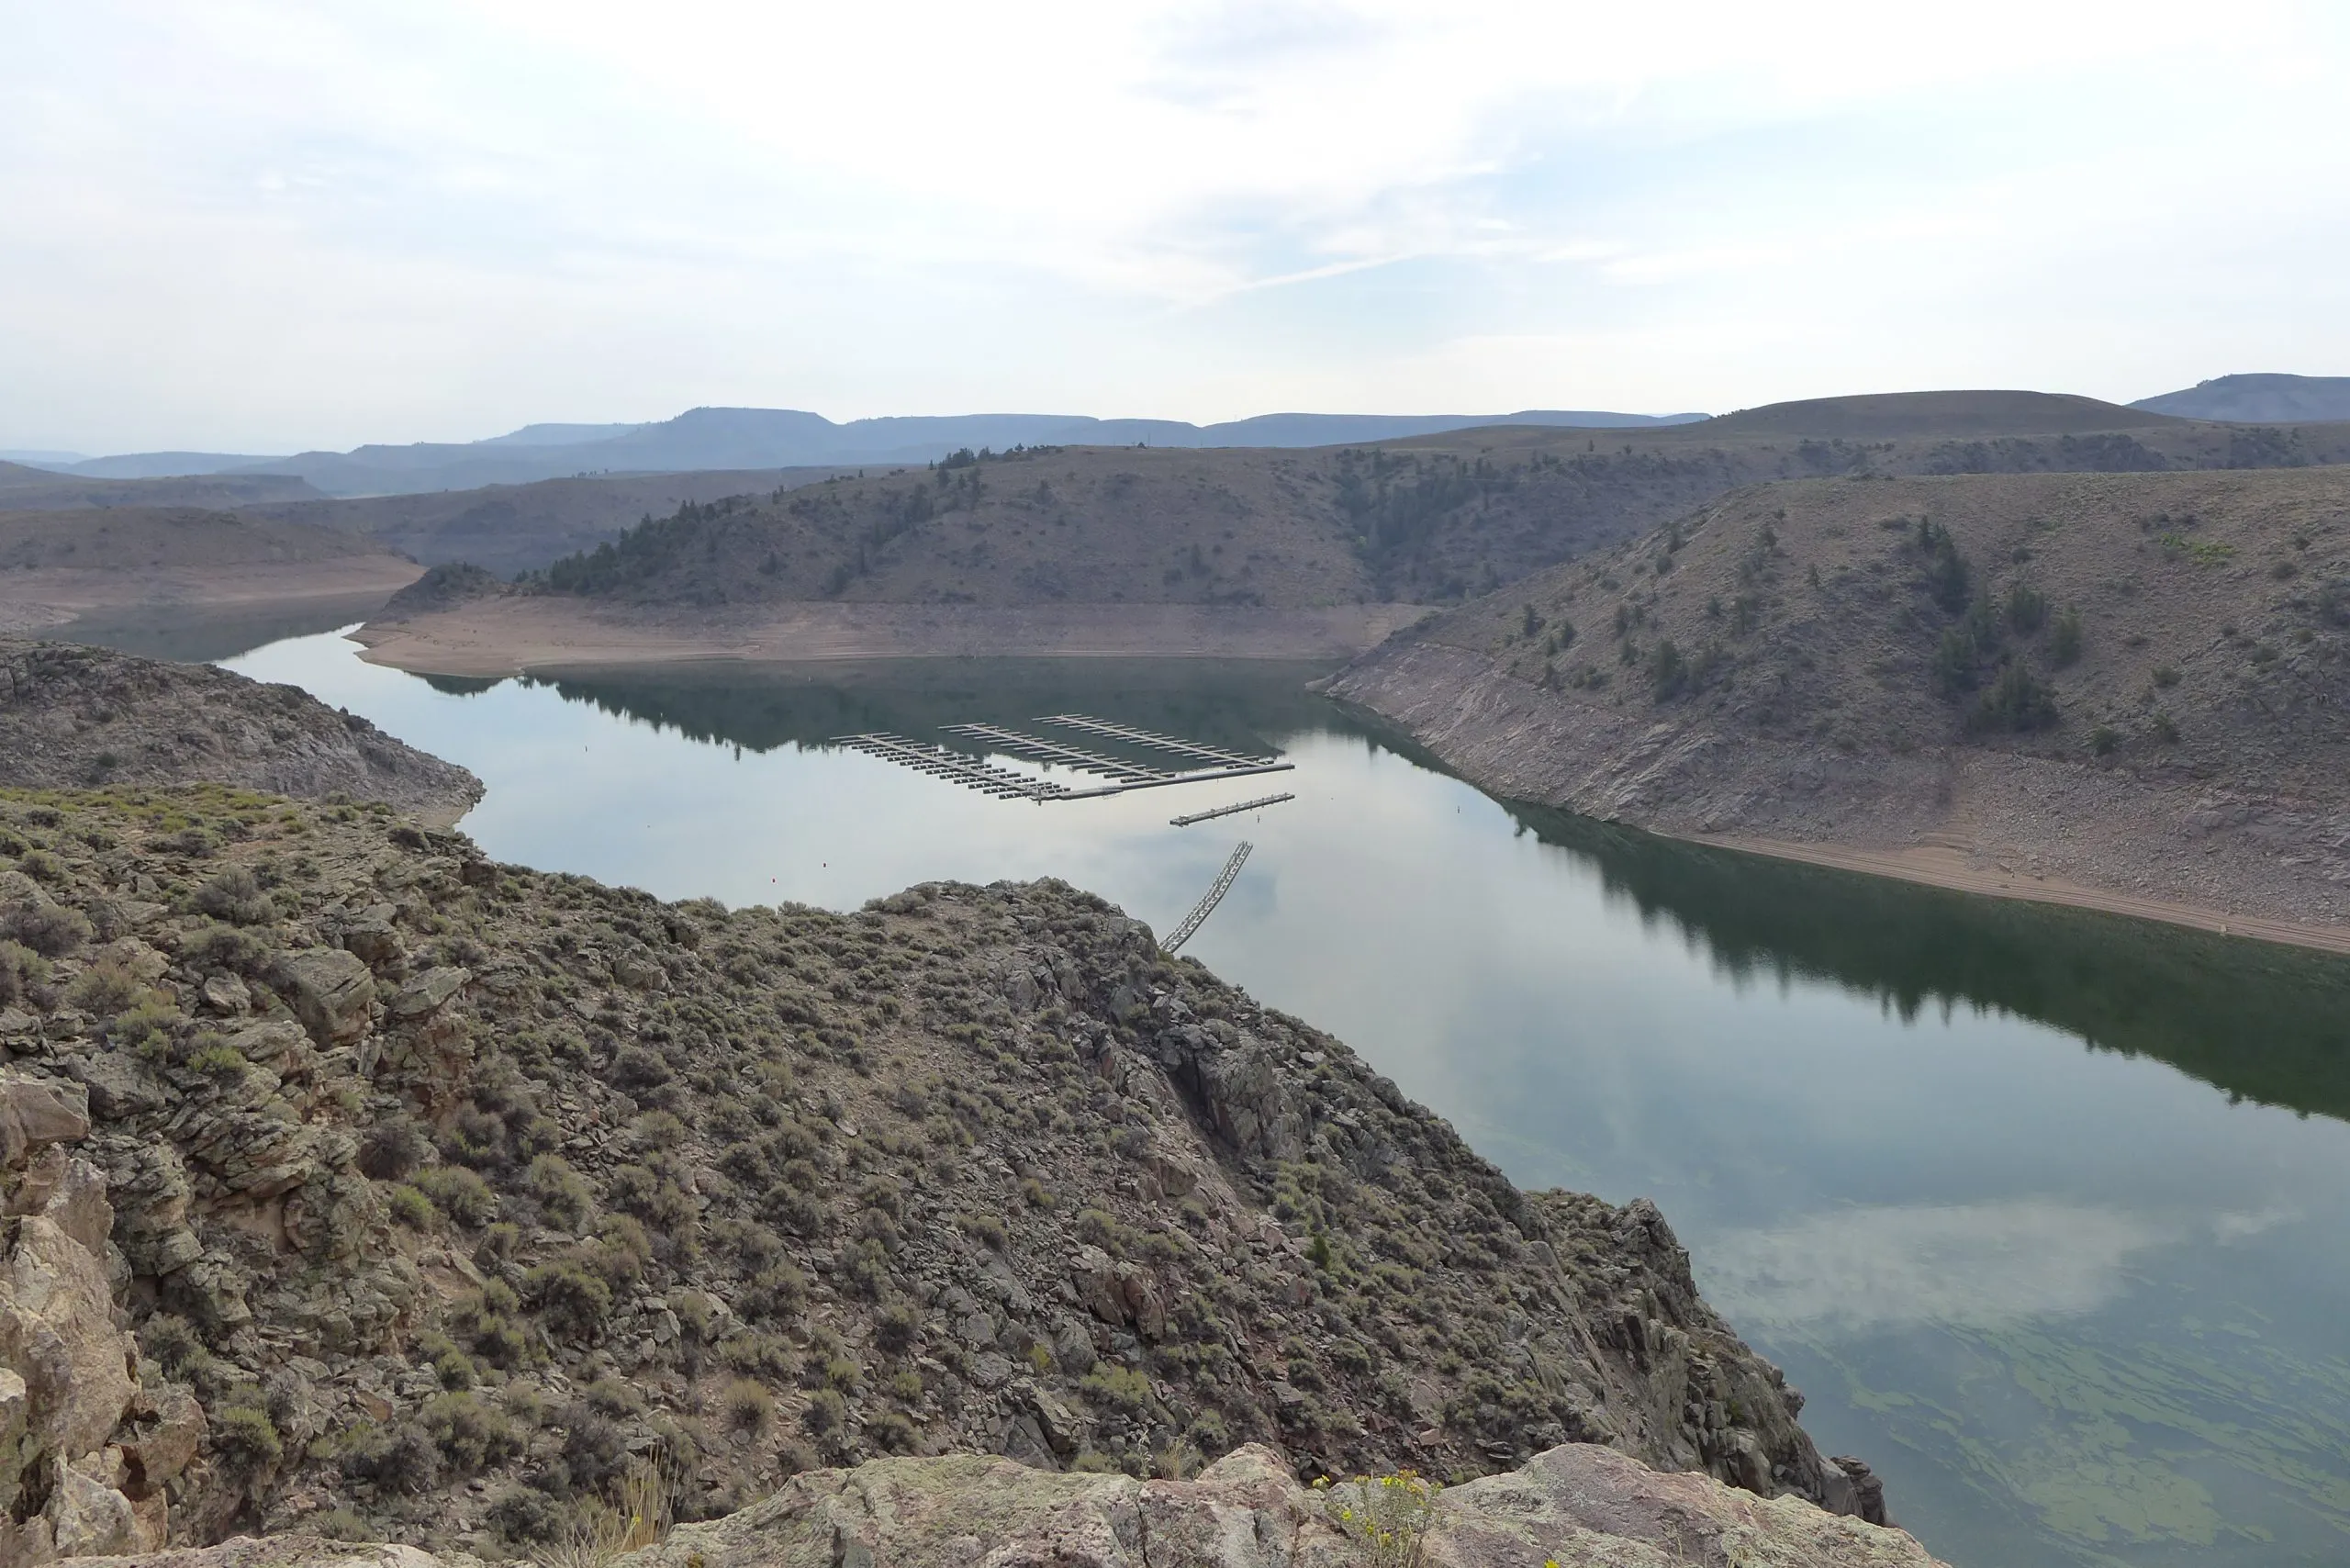
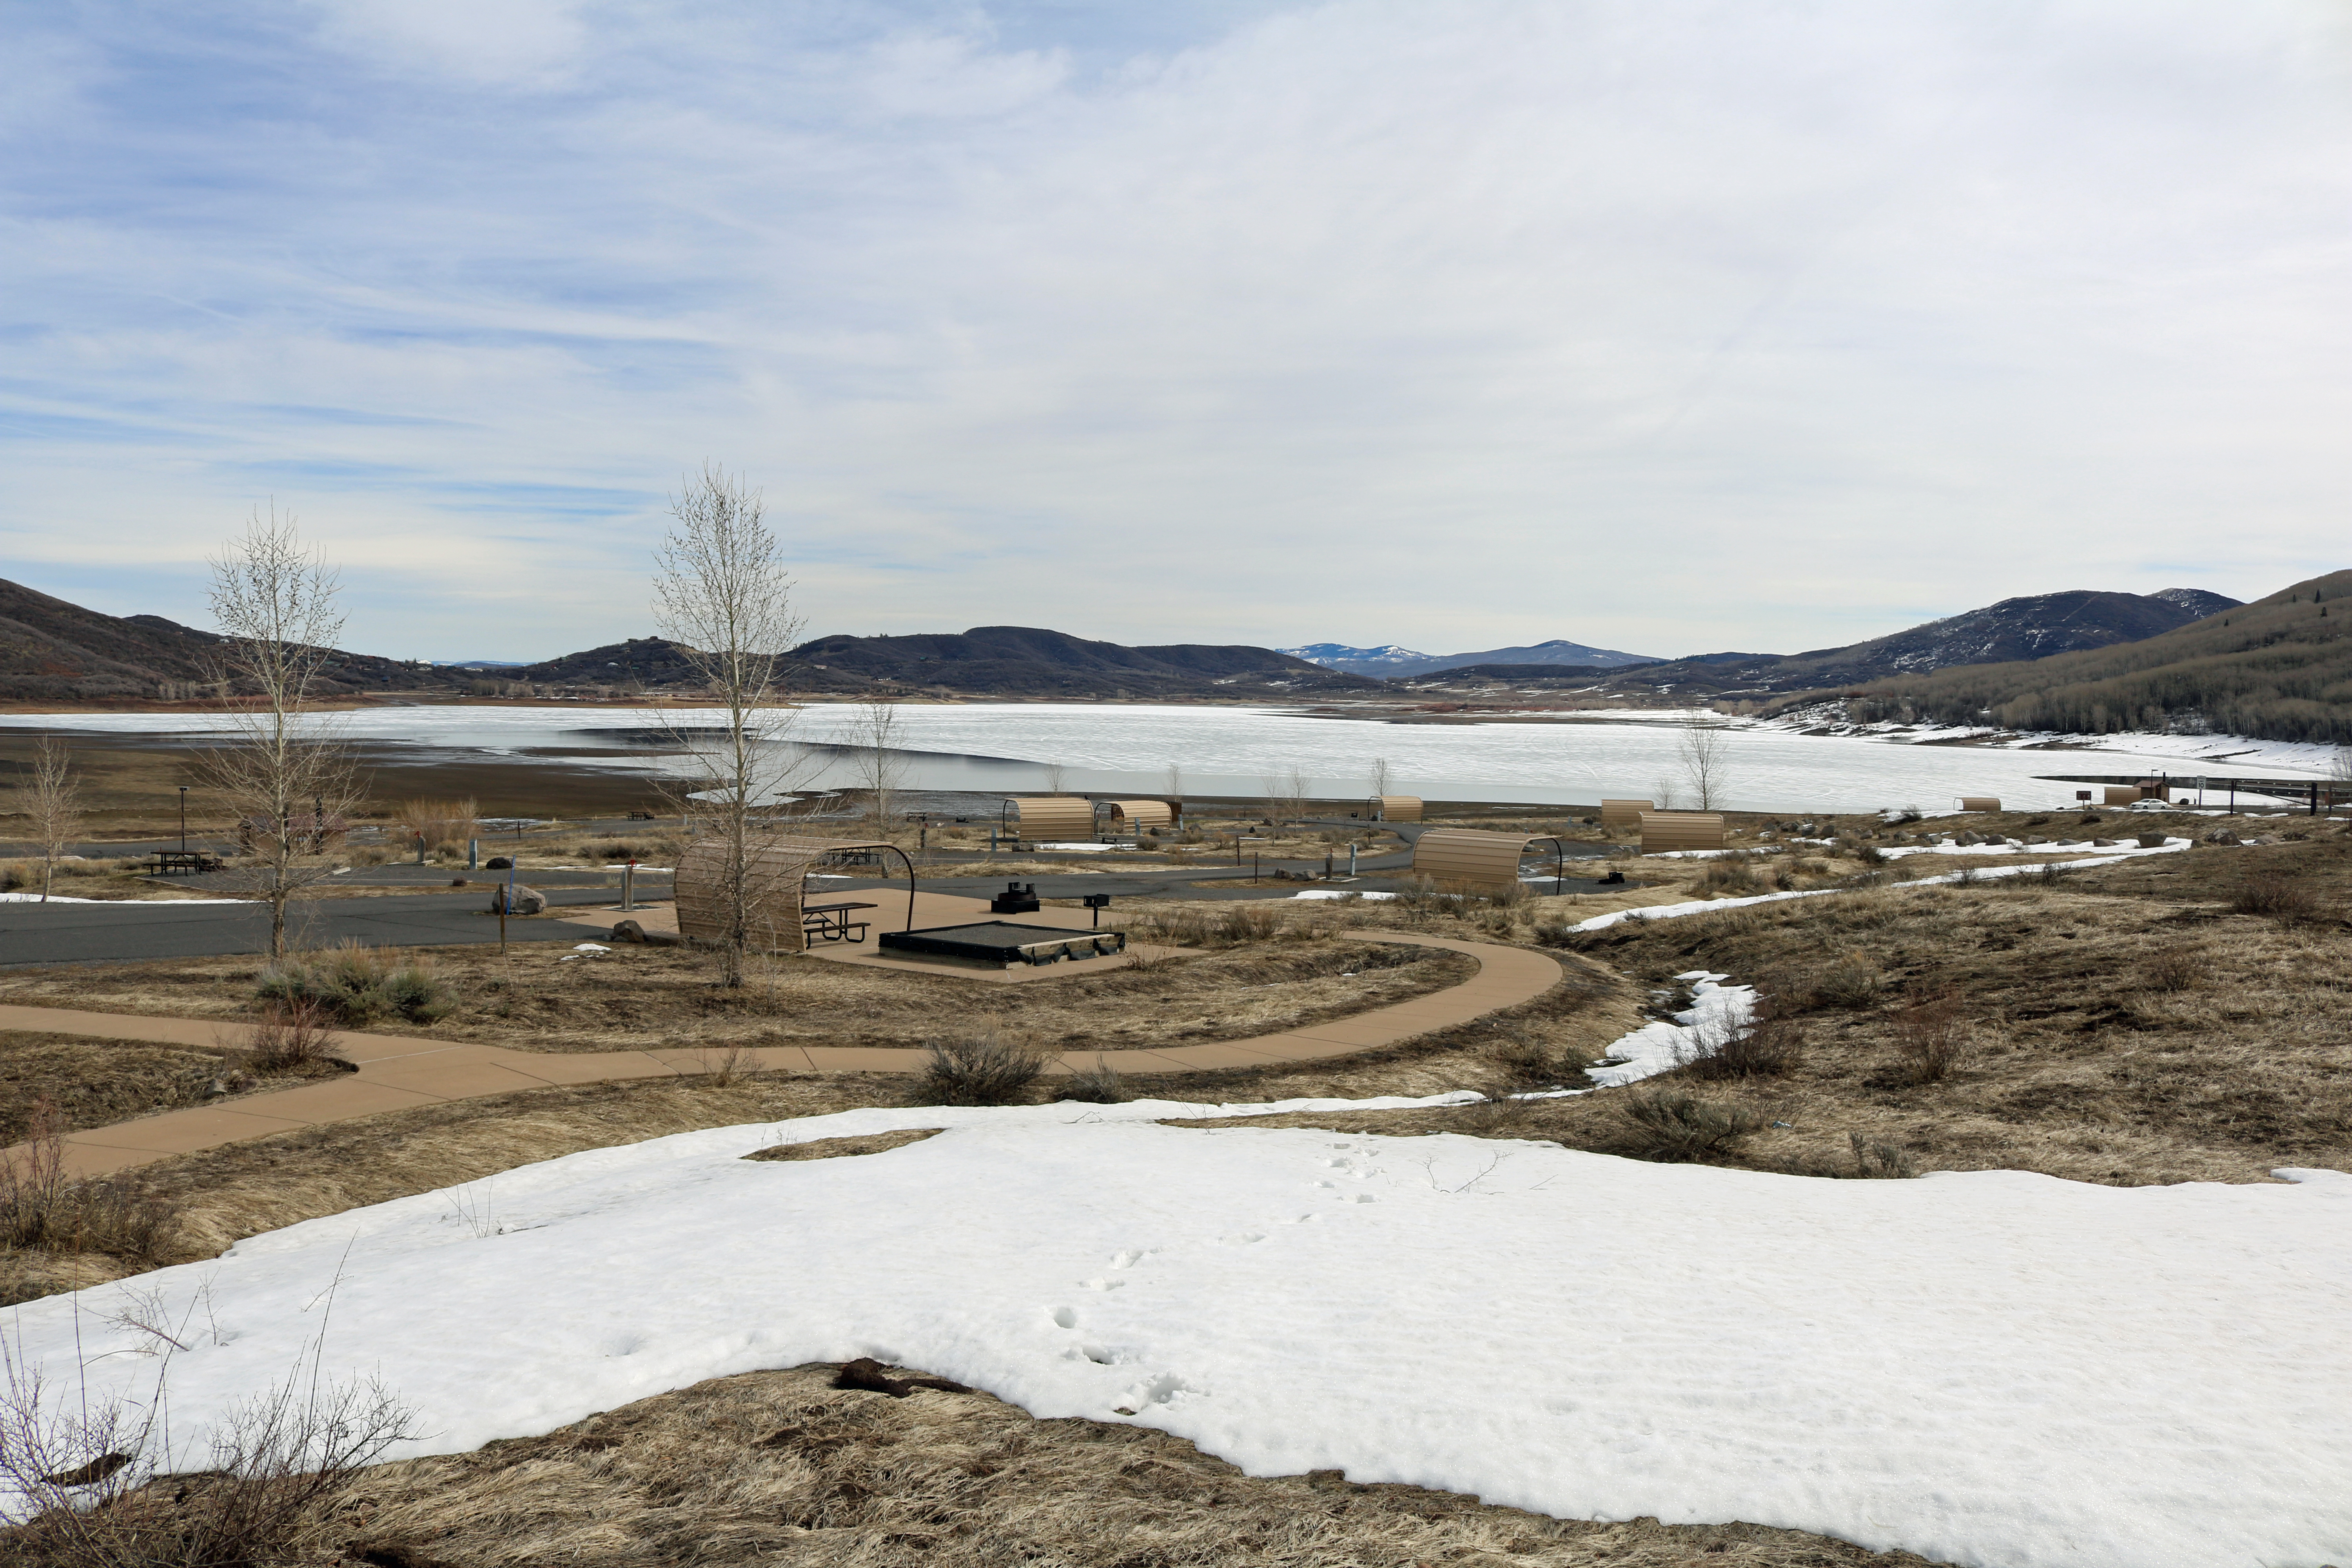
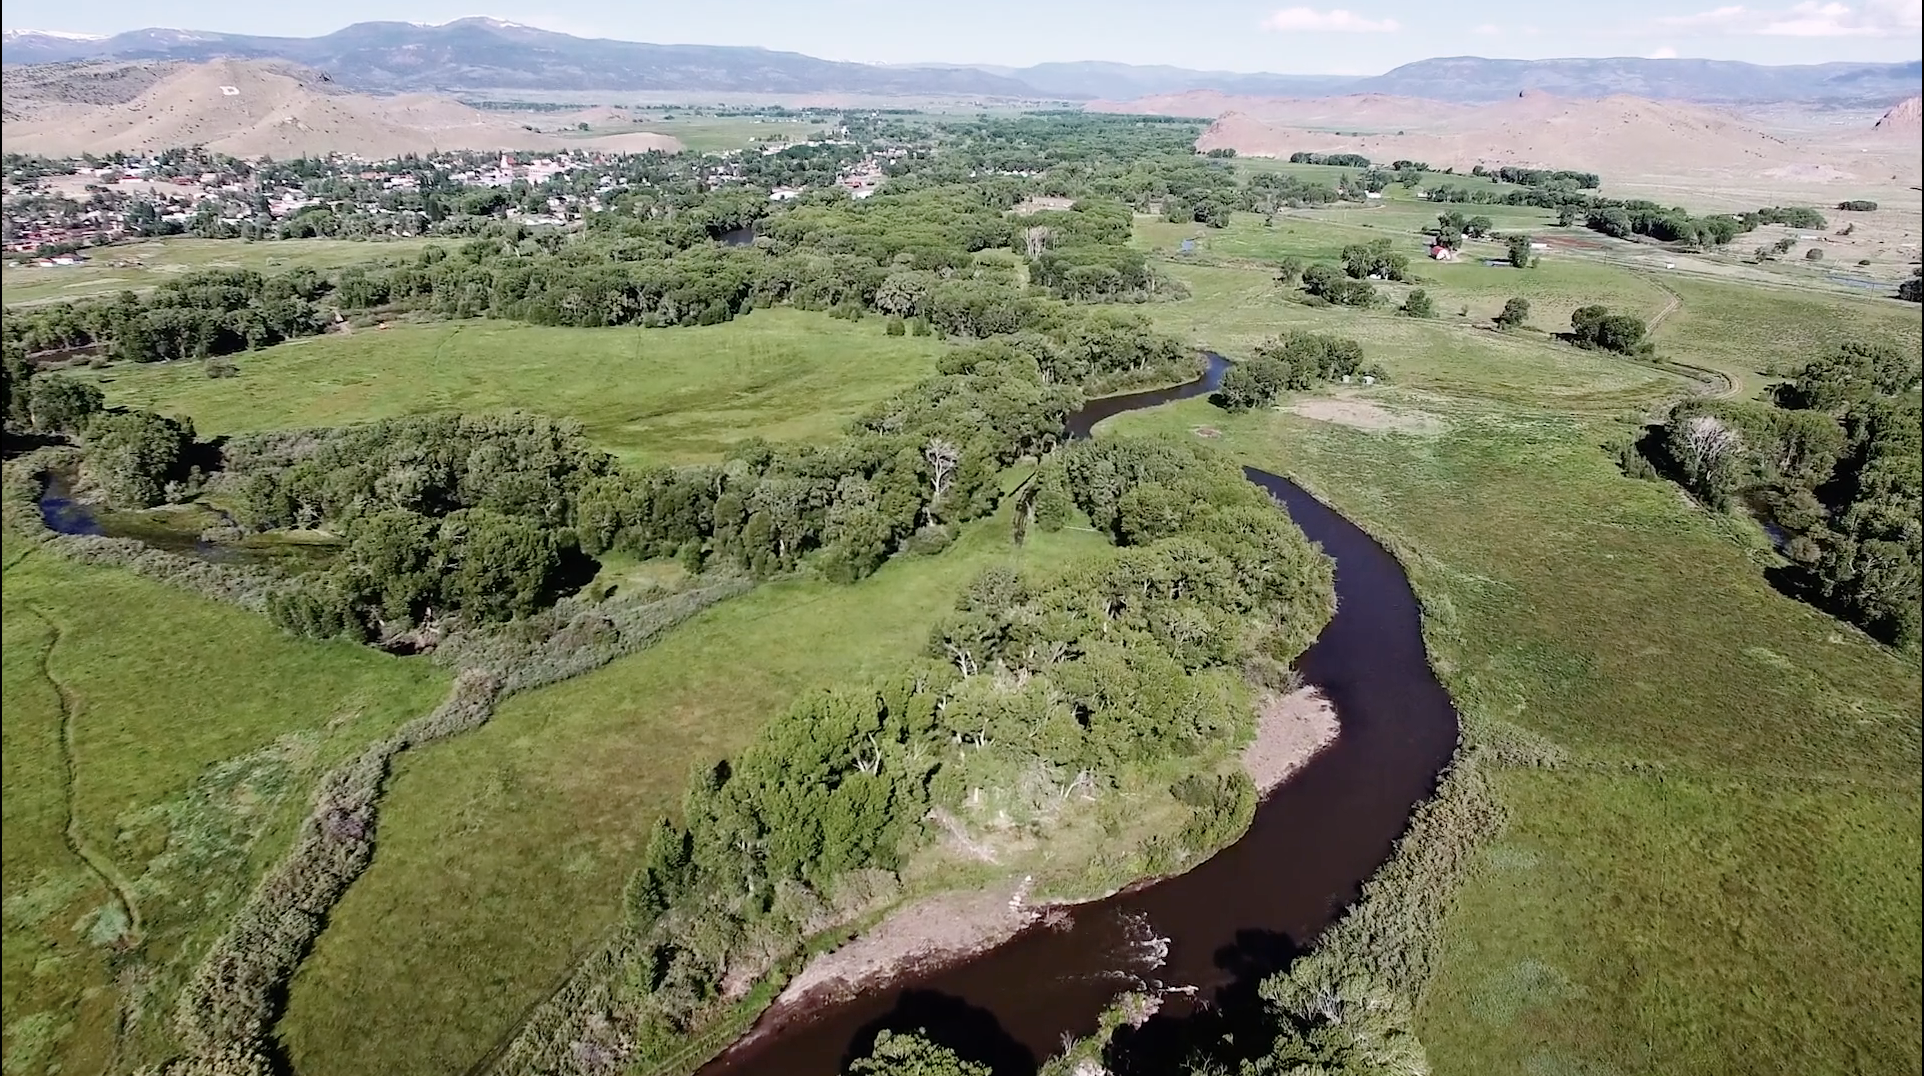
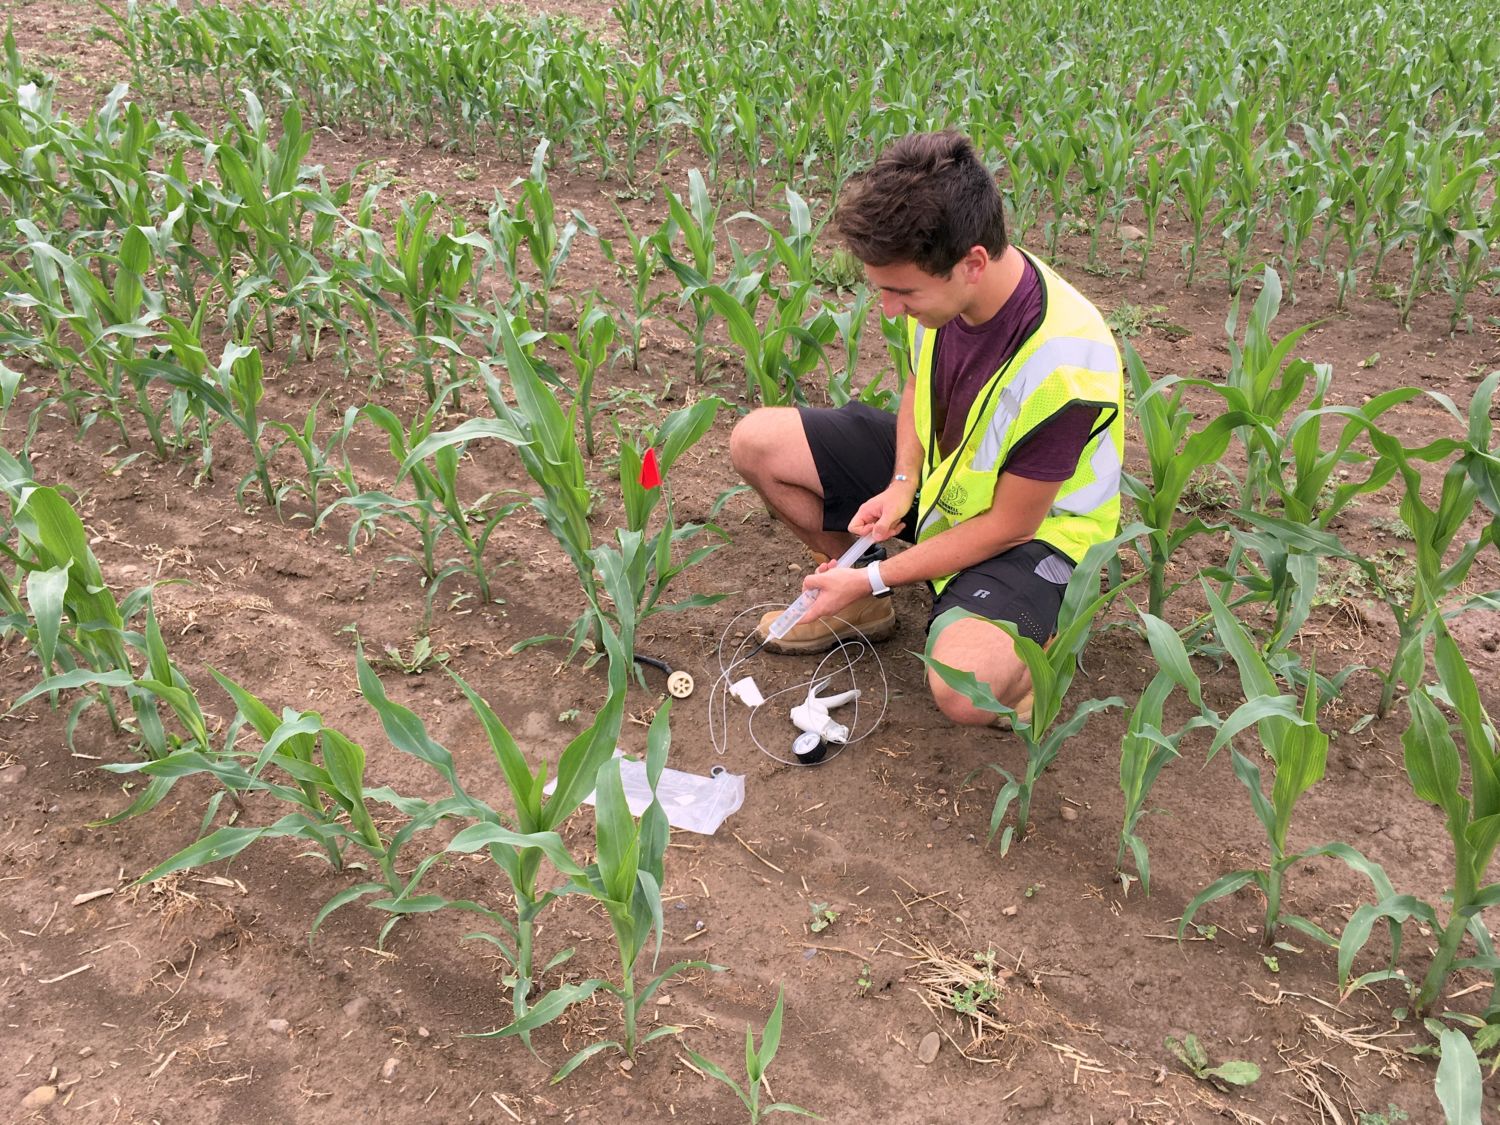
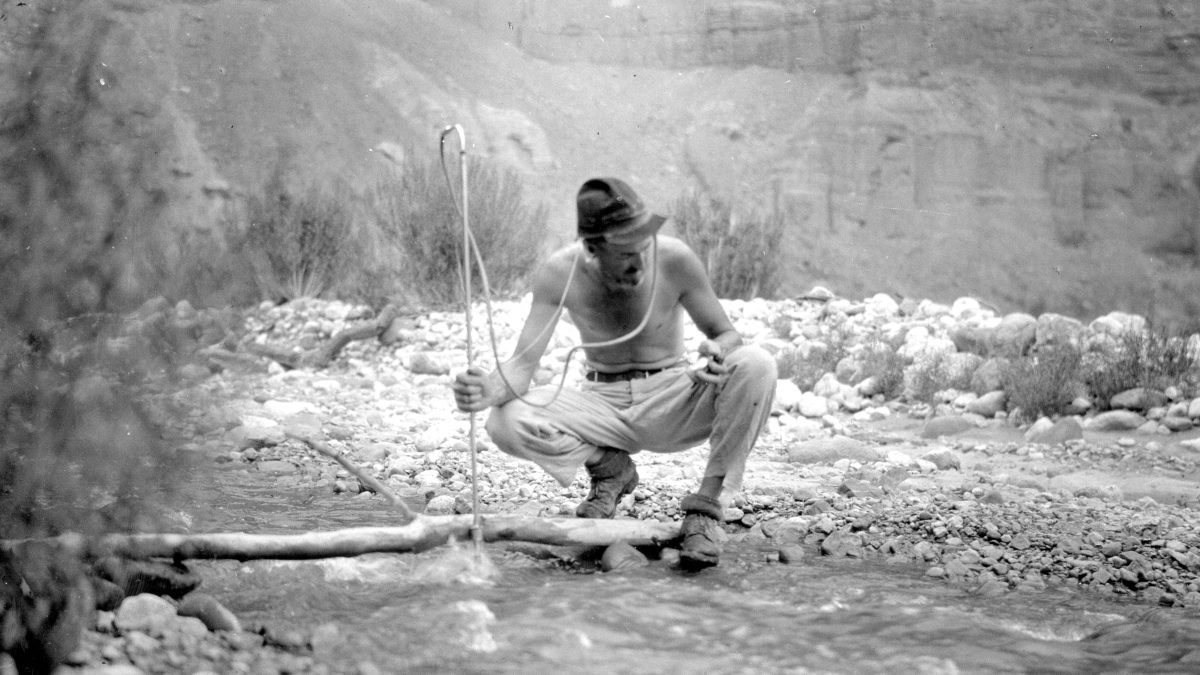
“We know who pooped in the river, now we’re trying to figure out where it’s coming from,” Alyssa Richmond said as she took a sample of water recently from the muddy San Juan River, in the blazing high desert outside Farmington.

Richmond is coordinator for the San Juan Watershed Group, a collection of local agencies and volunteers working to improve water quality on the San Juan River as it runs through northern New Mexico. The group’s ultimate goal, Richmond said, is to have the stretch of river meet national water quality standards. But as it stands, it’s not going well.

Among a plethora of water-quality issues that include mine pollution, urban runoff and rising water temperatures amid an increasing drought, is the issue of E. coli contamination. A naturally occurring bacteria that lives in all humans and animal stools, E. coli can contaminate ground and surface water, and lead to health implications.

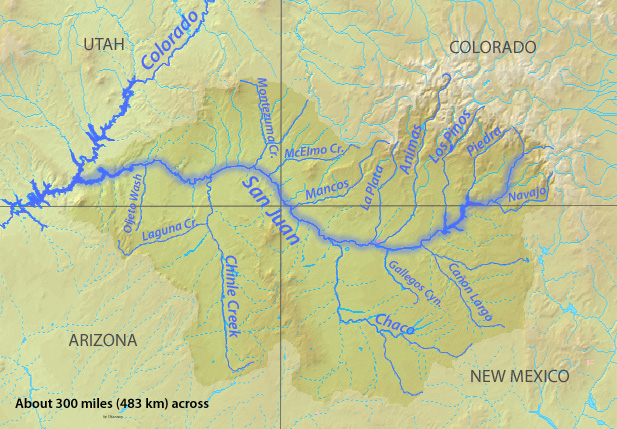
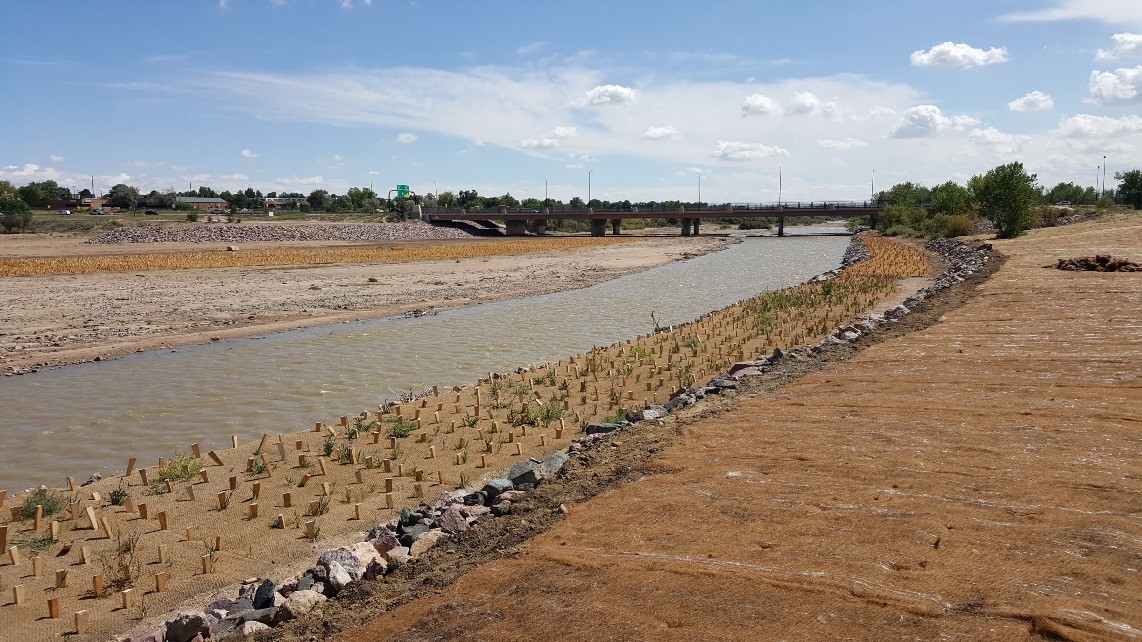
For at least the past 10 years, researchers have launched a full-scale investigation to better understand E. coli issues up and down the San Juan River watershed, from high up in the San Juan Mountains to its major tributary, the Animas River, to stretches that run into the Navajo Nation.

Early results are not encouraging: the EPA’s standard for acceptable E. coli levels is 126 colony-forming units (CFU) per 100 milliliters. In stretches of the San Juan River through Farmington, water samples taken this summer exceeded nearly 1,500 CFUs. “We didn’t expect it to be as high as it was,” Richmond said on a sampling day in late August. “It was shocking.”

But it’s not all doom and poop. The San Juan Watershed Group’s efforts will ultimately help inform where cleanup projects should be focused to achieve the highest improvement in water health. And, all up and down the watershed, even to the highest reaches of the Animas River around Silverton, there is a concerted push to face E. coli issues head on.

“The good news is everyone agrees there should be no human poop in the water,” said San Juan Citizens Alliance’s Animas Riverkeeper Marcel Gaztambide, who probably never thought he’d have to make so obvious a statement to the local paper. “And it’s an issue of concern, so it’s good we’re talking about it now.”

Defecation detectives

E. coli is a difficult contaminant to fully contextualize because not only is it naturally occurring, it is also one of the most common bacteria. It can come from livestock as well as wildlife like elk, deer, birds, beaver – pretty much any animal that poops. And to complicate matters further, only some strains of the bacteria are harmful to human health.

In the early 2010s, however, researchers knew high E. coli levels were an issue in the San Juan River in northern New Mexico, but the question was, who was the main culprit? After conducting two years of microbial source testing, which not only shows the level of E. coli but also pinpoints the exact source, the results were not what researches were expecting. It came back that the largest contributors were … drumroll, please … humans.

In fact, test results showed human feces in 70 to 100 percent of samples taken from the Animas River at the Colorado-New Mexico state line down to the border of the Navajo Nation.

With the guilty party exposed, funding was again secured to take the investigation a step further this summer by understanding where exactly the human waste was coming from, Richmond said. It’s a process that’s rather simple, by testing upstream and downstream of suspected source points, and then seeing where the spikes in E. coli levels occur. And already, there are some potential smoking guns: failing septic tanks from homes and development, outdated wastewater treatment plants and illegal RV dumping.

What the sampling has also shown, Richmond said, is the high E. coli levels aren’t necessarily coming from upstream communities in Durango and elsewhere. Instead, early results indicate the highest spikes happen in and around Farmington…

It’s a watershed moment

But that doesn’t necessarily mean upstream communities are swimming in sparkling clean waters.

The Animas River, for instance, has issues all its own. Remember that EPA standard of 126 cfu/100 mL? Well, one study conducted by Fort Lewis College in October 2018 found E. coli levels in the Animas at Santa Rita Park, near the Whitewater Park (close your eyes kayakers and surfers) at 226 CFUs. Bare in mind, this was before the completion of the City’s new water reclamation facility in December 2019…

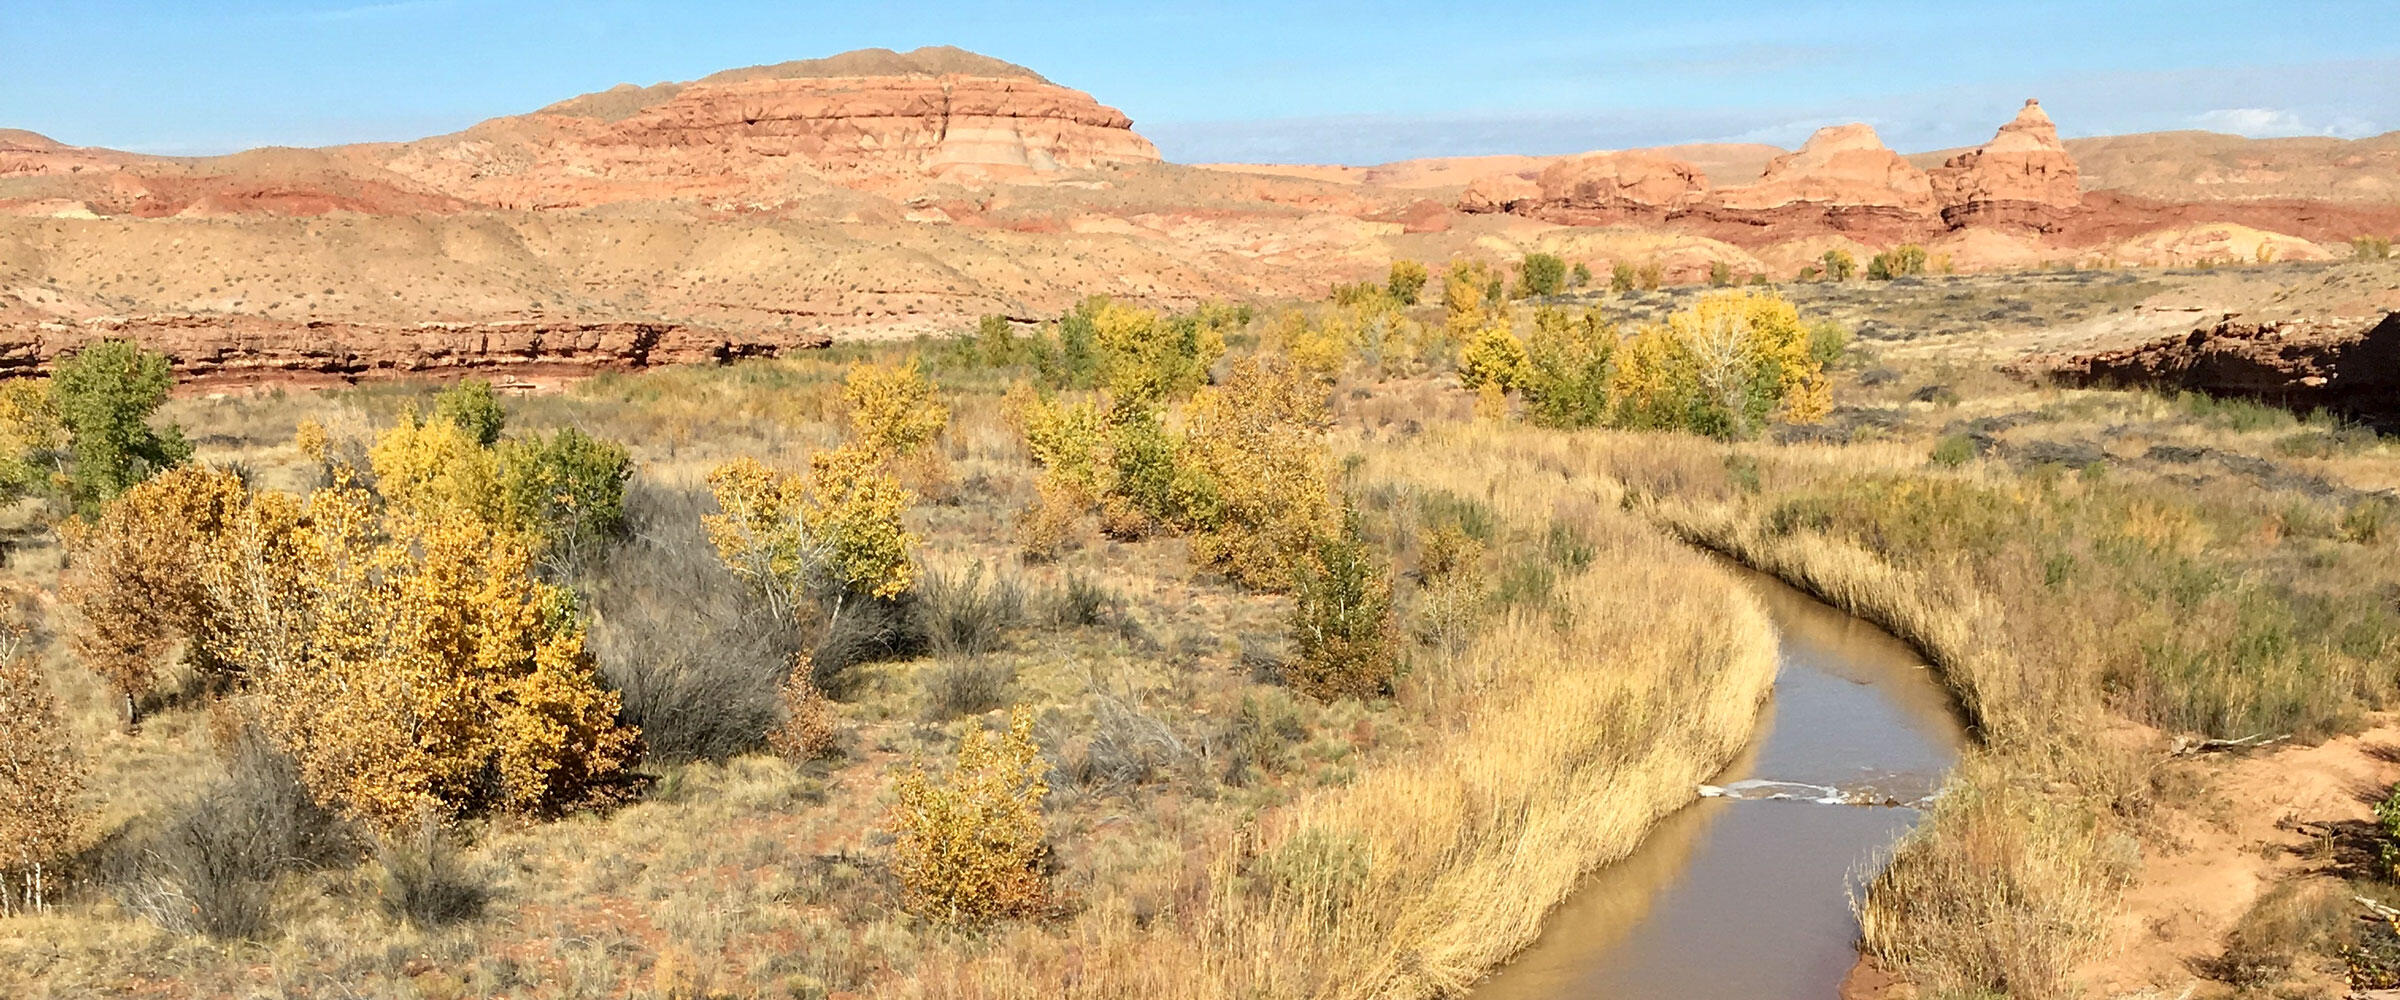
Over in the Florida River, which runs into the Animas about 18 miles south of Durango, progress is also being made, said Warren Rider, coordinator for the Animas Watershed Partnership, which focuses on water quality issues on the Colorado side of the border.

The Florida River for years has exceeded safety standards for E. coli and accounts for nearly a quarter of the bacteria and nutrients dumped into the Animas River before the state line. In a bit of a shock, the Florida was delisted last year, but that was mostly due to a lack of data, researchers say.

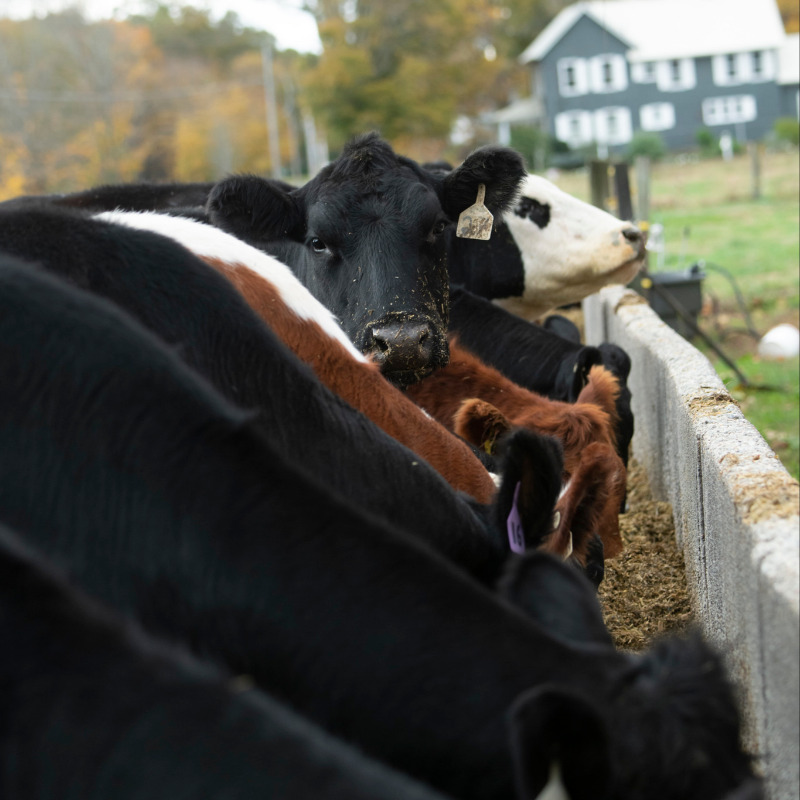
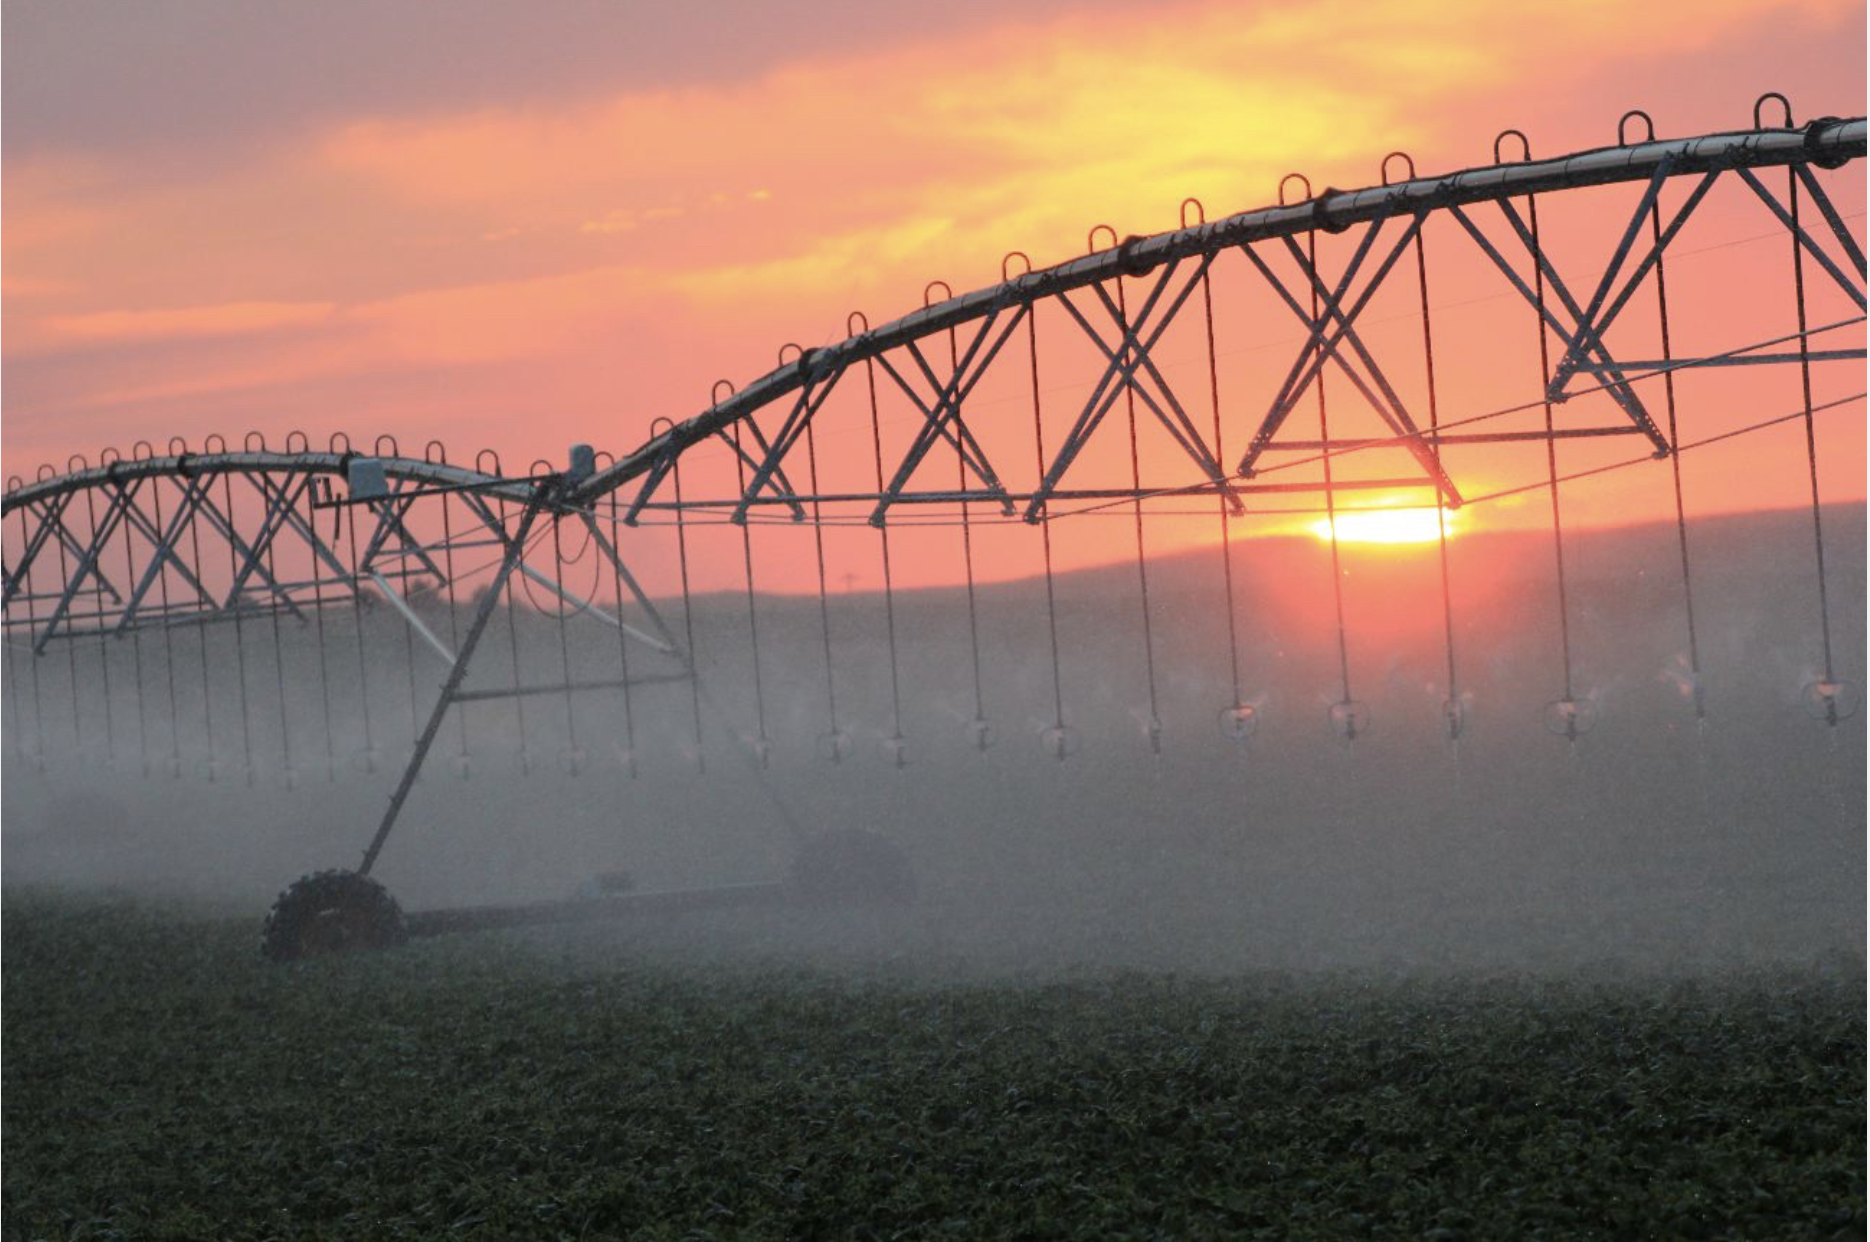
While natural sources do account for a portion of contamination in the Florida, agriculture and livestock operations also contribute a good amount of harmful bacteria. As a result, Rider said the Animas Watershed Partnership has tried to work with landowners to fence off waterways to livestock and reestablish vegetation along stream banks…

Up in the high country

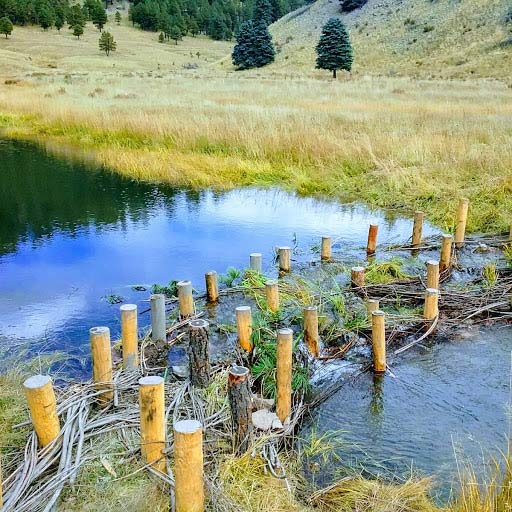
And no one has forgotten about the highest reaches of the watershed atop the San Juan Mountains, where an unprecedented increase in recreation, and therefore human waste, has been well noted and nosed in the past year or so.

This summer, the U.S. Forest Service and Mountain Studies Institute partnered to test heavily trafficked recreation areas for E. coli. Colleen Magee-Uhlik, a forest ambassador with MSI, said areas with high use of recreation showed much higher concentrations than locations with little human impact.

In the obvious case study, South Mineral Creek – that of Ice Lakes fame – water samples taken above the highest areas of recreation tested at about 22 CFUs. Farther downstream, in a location that would catch all the cumulative impacts of recreation and camping, samples were more than four times as high, at nearly 90 CFUs. (And, it should be noted, South Mineral was closed this year because of fire damage, which likely means levels would be even higher if people were in the area)…

Christie Chatterley, Fort Lewis College assistant professor of physics and engineering, said in the popular backpacking spot Chicago Basin in the Weminuche Wilderness, a student-led research program also found high levels of E. coli in streams. FLC has plans to conduct microbial source testing to see exactly where the bacteria is coming from, but Chatterley said it’s probably safe to assume hikers and campers…

So what can be done?

For starters, using best practices in the high country, such as burying waste 6 to 8 inches deep and 200 feet away from water, and packing out toilet paper can go a long way. This message is even more important as record numbers of people visit the backcountry, many without a working knowledge of how to protect the very landscape they come to enjoy.

Farther downstream, upgrading septic tanks is seen as another obvious target. Brian Devine, with San Juan Basin Public Health, said new septic regulations require people selling their homes to have septic systems inspected. In 2020 alone, more than 500 systems were inspected, which led to many leeching septic tanks being fixed. “It’s resulting in systems getting repaired,” he said. Richmond, with the San Juan Watershed Group, said agencies are working with New Mexico health officials to tackle failing and outdated septic systems as well.

And, the city of Durango’s Biggs said the Clean Water Act continues to push water quality standards. “The Clean Water Act has really improved water quality, and the Animas would be a testament to that,” he said. “And everyone benefits, including our downstream users.”

So yes, there’s no quick and easy fix to E. coli issues in the Animas and San Juan rivers, but all these efforts are folded into the long history of communities along the watershed, and the responsibilities they have to one another, Biggs said. It’s an issue that dates back to the 1800s when Silverton would send down water contaminated by mining operations to Durango, and a few decades later, when Durango’s uranium pile sat along the banks of the Animas River, only to be swept downstream.

San Juan River Basin. Graphic credit Wikipedia.

Nearly half of #Colorado has shed its #drought status since last year, but the coming months don’t look good — The Colorado Sun

From The Colorado Sun (Olivia Prentzel):

At least 54% of the state now is experiencing drought conditions, compared to 100% this time last year. But record-breaking heat and a dry winter could mean conditions worsen, a climatologist says.

As drought loosened its grip across nearly half Colorado in the past year, parts of Colorado could see conditions worsen in the coming months due to an autumn and winter that experts say will be hotter and drier than normal.

About 52% of the state’s geographic area now faces some type of drought — ranging from abnormally dry to exceptional drought. This time last year, the entire state was plagued by the lack of rain, according to the U.S. Drought Monitor. While the drought was somewhat eased by the summer monsoon season, already punishing drought conditions have begun to worsen, with the most severe impacts hitting the Western Slope.

Colorado Drought Monitor map September 7, 2021.

Record-breaking heat coupled with a dry winter forecast could mean that drought in Colorado will likely get worse in the coming months, according to Peter Goble, a climatologist with the Colorado Climate Center at Colorado State University.

“The outlook is not encouraging,” Goble said. “It looks like summer is going to hang on here for a little while and as we look forward to winter, (we’re) looking at a high probability of another La Nina year,” he said, the second La Nina winter in a row…

“In recent history, those double-dip La Nina years — or years we have it come back a second time — have been quite dry across the center of the country and only really wet in the northwest and northeast corners,” Goble said. “If that pattern were to resurface, we could see drought conditions worsen over the next three to nine months.”

[…]

Colorado also saw its fourth warmest June through August period on record, Goble said…

Now, about 15% of the state is seeing conditions of the severity recorded last September, maps show.

Despite the decrease, Goble said he’s still concerned about the state’s current drought conditions and for what’s to come.

“The biggest thing that concerns me is, as good as the precipitation was in western Colorado over the summer, we didn’t see that big of a recovery to the overall water supply system or our lakes, streams and reservoirs,” he said…

The boat ramp at Elk Creek Marina had to be temporarily closed so the docks could be moved out into deeper water. Colorado water managers are not happy that emergency releases from Blue Mesa Reservoir are impacting late summer lake recreation.
CREDIT: HEATHER SACKETT/ASPEN JOURNALISM

In the east, worsening drought conditions also raise concerns regarding the winter wheat planting season. Without a layer of moisture in the top level of soil, it becomes harder for seeds to stay put and can affect how much grows, he said.

#ClimateChange tops talk during Senator Michael Bennet’s telephone town hall September 3, 2021 — The #FortMorgan Times

The graph shows average annual global temperatures since 1880 (source data) compared to the long-term average (1901-2000). The zero line represents the long-term average temperature for the whole planet; blue and red bars show the difference above or below average for each year. (These data were among the sources of data used in the State of the Climate in 2020’s temperature analysis, but here are compared to the 20th-century average. In the report, they are compared to the 1981-2010 average.)

From The Fort Morgan Times (Katie Roth):

U.S. Senator Michael Bennet held a telephone town hall event on Friday, Sept. 3 to answer questions and address concerns for Coloradoans. Though Bennet spends a lot of time in Washington D.C., he has been back in Colorado for the past few weeks. He has held 30 events in 13 different counties across the state and came away observing three things in need of attention: climate change, both man-made and natural infrastructure, and affordable healthcare, housing and education.

“I think the United States has not been investing in our people or our infrastructure for a very, very long time, and it shows. But things are beginning to change. Last month, the Senate passed a historic $1.2 trillion infrastructure bill on a bipartisan vote,” said Bennet…

Bennet is focusing on both paid family leave and climate change, as well. He advocates for paid parent leave so Coloradoans can stay home with a sick child or an elderly family member without losing his or her job.

As for climate change, Bennet recognizes the problems at hand: “We’ve got to act urgently on climate. If we don’t, I really worry that we’re not going to recognize our own state in a few years, and I think all of us refuse to hand our kids and grandkids a state where you can’t see the mountains or you can’t go outside half the summer and families live in fear of wildfire… droughts… There’s a lot of work to do ahead, and I’m more optimistic than I’ve been in a long time that the agenda in Washington (D.C.) reflects our priorities in Colorado. And that’s, in large part, thanks to the feedback I receive in conversations like this that I can carry back to Washington (D.C.).”

[…]

A caller from Westminster in Adams County, Ellen, expressed her disappointment in Bennet’s lack of actions taken to combat climate change: “I appreciate you saying you feel urgency over the climate crisis, but you need to act in line with that urgency. Your vote to prohibit banning fossil fuel development on public lands and your vote to support a liquefied natural gas export terminal in Texas (were) so unacceptable. To prevent more severe climate crises than we already face, we have to end extracting and burning fossil fuels.”

While Bennet made it clear he did not regret those votes, he did explain his reasoning for them: “I believe very strongly that if we are ever going to actually get off of fossil fuels, we have to have a plan to transition off of fossil fuels. I don’t believe that we could just get off them tomorrow and be done with it without driving energy prices through the roof… what we need is a thoughtful approach over the next 10, 20, 30 years to get this economy to a net zero carbon economy. If we don’t have a plan to get to net zero by 2050, then we’re not ever going to do it.”

[…]

A woman named Irma submitted an online question asking Bennet how he is protecting Colorado’s watershed and water supply.

From his research over the past year or so, Bennet discovered that it would cost $60 billion to protect the west’s watershed. While that seems like a steep price, Colorado has spent $60 billion in the past four to five years fighting fires. Bennet wrote a bill called the Outdoor Restoration Partnership Act which pushes to use funds for forest mitigation and watershed restoration. Bennet sits on the Senate’s Agriculture Committee, and he hopes his bill will be passed as part of the reconciliation package…

Marti from Lafayette in Boulder County, originally from Ohio, moved to Colorado to be closer to her family and enjoys the Colorado weather. She called with a question about poor air quality and frequent ozone alerts. More specifically, she shared her research on Suncor Energy in Denver and how it has not met federal admission standards for toxic gasses. She questioned how the company could be held accountable. Bennet was not as familiar with Suncor and made a note to look into whether or not that problem could be solved on a state or federal level or instead handled by the Environmental Protection Agency (EPA). Bennet also shared his wish to reinstate a law from when Hickenlooper was in office with a goal to capture fugitive methane from pipelines and drilling rigs, a law which President Trump removed.

Crops Struggle As A Record-Dry Summer Follows A Record-Wet Spring For Parts Of The Eastern Plains — Colorado Public Radio

From Colorado Public Radio (Michael Elizabeth Sakas):

Colorado’s Eastern Plains saw a lot of rain in the spring, which helped half of the state escape drought.

Summer was a different story. Many areas got much less rain than normal, and some spots around Washington and Yuma counties recorded their lowest amount of precipitation on record.

Courtesy of Russ Schumacher, from West Wide Drought Tracker

Now drought has started to creep back in.

State climatologist Russ Schumacher said a weather station in Akron recorded its second-wettest spring, followed by the driest summer recorded there.

Joel Schneekloth, a regional water resource specialist with Colorado State University Extension, said if the extra spring moisture had been met with average summer rainfall, it would have been a “fantastic” year for many crops.

Schneekloth said the “saving grace” of this summer for the plains was the wet spring and closer-to-normal temperatures meant farmers used just a little more water than average. He said that made the biggest difference compared to historically dry summers in years like 2012 and 2002…

The wet spring meant most corn growers in Washington County will likely have a better year than they did in 2020, Schneekloth said. The county’s average corn crop yielded around 15 bushels per acre in 2020, but that average could increase to 35 this year.

What’s hurting the most this summer is proso millet, which was the third-largest crop for Washington County, according to 2017 data from the USDA.

“In our area for the most part, it’s a disaster,” Schneekloth said.

The millet is planted in early June, and the area’s last good rain was weeks before that. Schneekloth said the shallow roots failed in the dry soil. Those dry soils will have a long-term effect going into the fall because they will make planting wheat before the winter tough, Schneekloth said. He hopes some rain will fall before then…

Ron Meyer, an agronomist for Colorado State University Extension, said the extreme rain helped some crops on the Eastern Plains.

Meyer worried there wouldn’t be any wheat to harvest after a dry fall and winter in 2020 and into 2021. But the moisture got the wheat-growing again in March, which resulted in an above-average crop.

Once it stopped raining again in the summer, spring-planted crops like corn, sunflower and millet are now struggling.

Crop residue. Photo credit: Joel Schneekloth

Meyer said the dry summer shows why it’s important for farmers and ranchers to adapt to a warming climate. One way is through “banking” soil moisture by adopting practices that promote soil health and reduce tilling, as well as using drought-adapted varieties of crops to improve their chances of having a good harvest in extreme conditions.

#CastleRock #Water recognized for excellence — The Douglas County News-Press

Plum Creek near Sedalia.

From The Castle Rock News-Press (Thelma Grimes):

With purified, reuse water flowing into Castle Rock homes this summer, the town was already celebrating the ability to supply high-quality drinking water to customers.

Accolades for the success at Castle Rock Water continued last week when the department received recognition for Outstanding Water Treatment Plant by the Rocky Mountain Section of the American Water Works Association.

The Rocky Mountain Section is the regional division of the American Water Works Association, the principal association for scientific and educational opportunities dedicated to managing and treating water. The Rocky Mountain Section represents water industry organizations in Colorado, New Mexico and Wyoming.

Castle Rock won in the large department category, which includes programs serving more than 50,000 people. The award was given specifically for the operations at the Plum Creek Water Purification Facility, which has developed the advanced treatment processes to accommodate purified reuse water…

The association also presented Castle Rock Water plant mechanic Casey Devol with the Water Treatment Maintenance Award for his design of new processes to clean pipelines. The annual award is given to a maintenance professional who demonstrates exceptional performance, dedication and teamwork. Devol was also recognized for his contribution to the Water to Wire efficiency study to reduce energy usage and pumping costs.

The local and national recognition for Castle Rock Water comes as efforts to invest in the town’s sustainable water future continues. Dating back to 2006, the town invested $208 million to build the reusable water facility.

Part of that investment included the construction of the $60 million Plum Creek Purification Facility. Reuse water will account for one-third of the community’s water supply and will be a big step in providing a sustainable water supply as the town grows and drought conditions are expected to continue.

In addition to the American Water Works Association awards, Castle Rock Water also received recognition for its efforts in environmental stewardship. This is the third consecutive year the water provider has received a Gold Level in the Environmental Leadership Program by the Colorado Department of Public Health and Environment. Reducing energy consumption, increasing water conservation efforts and instituting purified reuse water were among the primary considerations for the award.

#NewMexico #drought picture has improved considerably over summer, thanks to #monsoon2021

From The Farmington Daily Times (Mike Easterling):

While monsoon season does not conclude officially until the end of September, it is clear the summer weather pattern that typically brings a good deal of moisture to the Southwest has helped ease the drought’s grip on much of New Mexico.

Chuck Jones, a meteorologist with the National Weather Service in Albuquerque, said the agency will not have figures on monsoon rain totals until early October, after the season has drawn to a close.

New Mexico Drought Monitor Map September 7, 2021.

But a look at the U.S. Drought Monitor map for New Mexico — and the rest of the Southwest — shows substantial improvement over the past two and a half months. Many parts of the state that were bone dry at the beginning of summer have emerged mostly, or even entirely, from the drought.

Nowhere has that change been more dramatic than in the southeast corner of the state. According to the Southwest and California Drought Status Update issued June 24 by the federal government’s National Integrated Drought Information System, parts of seven counties in that corner of New Mexico were characterized as being in exceptional drought — the worst category — and every county in that region was suffering from severe, extreme or exceptional drought, the three worst categories.

Now, two and a half months later, the picture there is much different, as portions of six of those counties are now characterized as normal. Much of the remaining territory in the southeast corner of the state is classified as being only abnormally dry or experiencing moderate drought.

While other parts of the state also saw marked improvement — portions of 13 counties in New Mexico now are drought free, compared to parts of just two counties on June 24 — others have not been so fortunate. Many parts of central, southwest and northwest New Mexico that were locked in drought at the beginning of the summer remain that way, even though their status has improved, as well.

The drought continues to take a heavy toll on San Juan, McKinley, Rio Arriba, Bernalillo, Santa Fe, Las Alamos, Catron, Grant, Hidalgo and Luna counties, with each of those counties still showing substantial territory characterized as being in extreme drought, the second-worst category.

That’s not to say those locations are as bad off as they were even a month ago, when large portions of all those counties were experiencing exceptional drought. In fact, the percentage of the state that is classified as being in exceptional drought has declined from more than 50% at the start of 2021 to approximately 33% three months ago, 4.5% on Aug. 10 and 0% on Sept. 9. And while 21.2% of New Mexico was in extreme drought on Aug. 10, that percentage declined to 19.1% by Sept. 7.

According to drought.gov, this was the 32nd wettest August in New Mexico over the last 127 years. Las Cruces has enjoyed an especially good monsoon so far, having racked up 5.06 inches of precipitation over that period, the third-wettest monsoon on record, according to drought.gov.

San Juan County has not seen that kind of bounty, but it has experienced a relatively good monsoon season, at least by the paltry standards of recent years. Jones said Farmington has received 1.6 inches of moisture at Four Corners Regional Airport over the three-month period, a figure that nearly matches the 30-year average of 1.62 inches.

For the year, Farmington has drawn 4.31 inches of precipitation, which comes close to matching the figure of 4.68 inches the city has received on average through the end of August for the last 30 years. Over the last three decades, Farmington has averaged a total of 7.76 inches annually.

As of Sept. 7, the vast majority of San Juan County was still characterized as being in extreme drought, with only slivers of the southwest and southeast corners in severe drought. But on Aug. 10, approximately half the county was in exceptional drought, and now none of it is.

Is #ClimateChange to blame for extreme weather events? Attribution science says yes, for some – here’s how it works — The Conversation


Climate change made the devastating flooding in Belgium, Germany and other European countries in July 2021 more likely.
Anthony Dehez/Belga/AFP via Getty Images

Xubin Zeng, University of Arizona

Extreme rainfall and flooding have left paths of destruction through communities around the world this summer. In New York City, remnants of Hurricane Ida flooded streets and subway lines as more than 3.15 inches of rain fell in an hour and more than 7 inches fell in all on Sept. 1-2, 2021. A week earlier in Tennessee, a record-shattering 17 inches of rain fell in 24 hours, turning creeks into rivers that flooded hundreds of homes and killed 20 people.

A lot of people are asking: Was it climate change? Answering that question isn’t so simple.

There has always been extreme weather, but human-caused global warming can increase extreme weather’s frequency and severity. For example, research shows that human activities such as burning fossil fuels are unequivocally warming the planet, and we know from basic physics that warm air can hold more moisture.

A decade ago, scientists weren’t able to confidently connect any individual weather event to climate change, even though the broader climate change trends were clear. Today, attribution studies can show whether extreme events were affected by climate change and whether they can be explained by natural variability alone. With rapid advances from research and increasing computing power, extreme event attribution has become a burgeoning new branch of climate science.

The latest attribution study, released Aug. 23, 2021, looked at the rainfall from the European storm that killed more than 220 people when floods swept through Germany, Belgium, Luxembourg and the Netherlands in July 2021.

A team of climate scientists with the group World Weather Attribution analyzed the record-breaking storm, dubbed Bernd, focusing on two of the most severely affected areas. Their analysis found that human-induced climate change made a storm of that severity between 1.2 and nine times more likely than it would have been in a world 1.2 degrees Celsius (2.1 F) cooler. The planet has warmed just over 1 C since the industrial era began.

An overturned trailer and flooded car were washed into a creek by flash flooding during heavy rainfall in Tennessee.
Parts of Tennessee saw about 17 inches of rainfall in 24 hours in late August, shattering the state’s previous record.
AP Photo/John Amis

Similar studies haven’t yet been conducted on Hurricane Ida’s rainfall or the Tennessee storm, but they likely will be.

So, how do scientists figure this out? As an atmospheric scientist, I have been involved in attribution studies. Here’s how the process works:

How do attribution studies work?

Attribution studies usually involve four steps.

The first step is to define the event’s magnitude and frequency based on observational data. For example, the July rainfall in Germany and Belgium broke records by large margins. The scientists determined that in today’s climate, a storm like that would occur on average every 400 years in the wider region.

The second step is to use computers to run climate models and compare those models’ results with observational data. To have confidence in a climate model’s results, the model needs to be able to realistically simulate such extreme events in the past and accurately represent the physical factors that help these events occur.

The third step is to define the baseline environment without climate change – essentially create a virtual world of Earth as it would be if no human activities had warmed the planet. Then run the same climate models again.

The differences between the second and third steps represent the impact of human-caused climate change. The last step is to quantify these differences in the magnitude and frequency of the extreme event, using statistical methods.

For instance, we analyzed how Hurricane Harvey in August 2017 and a unique weather pattern interacted with each other to produce the record-breaking rainstorm in Texas. Two attribution studies found that human-caused climate change increased the probability of such an event by roughly a factor of three, and increased Harvey’s rainfall by 15%.

Another study determined that the western North American extreme heat in late June 2021 would have been virtually impossible without human-caused climate change.

US Map showing strong temperature anomalies from Oregon through British Columbia.
The extreme heat wave in the Pacific Northwest in June 2021 sent temperatures more than 27 F (15 C) above normal in some areas.
NASA Earth Observatory

How good are attribution studies?

The accuracy of attribution studies is affected by uncertainties associated with each of the above four steps.

Some types of events lend themselves to attribution studies better than others. For instance, among long-term measurements, temperature data is most reliable. We understand how human-caused climate change affects heat waves better than other extreme events. Climate models are also usually skillful in simulating heat waves.

Even for heat waves, the impact of human-caused climate change on the magnitude and frequency could be quite different, such as the case of the extraordinary heat wave across western Russia in 2010. Climate change was found to have had minimal impact on the magnitude but substantial impact on the frequency.

There can also be legitimate differences in the methods underpinning different attribution studies.

However, people can make decisions for the future without knowing everything with certainty. Even when planning a backyard barbecue, one does not have to have all the weather information.


Read more:
The water cycle is intensifying as the climate warms, IPCC report warns – that means more intense storms and flooding


This article was updated Sept. 2, 2021, with the New York City flooding.

[Get our best science, health and technology stories. Sign up for The Conversation’s science newsletter.]The Conversation

Xubin Zeng, Professor of Atmospheric Sciences and Director of the Climate Dynamics and Hydrometeorolgy Center, University of Arizona

This article is republished from The Conversation under a Creative Commons license. Read the original article.

NASA #Drought Research Shows Value of Both #Climate Mitigation and Adaptation

This July 7, 2021 image from the Moderate Resolution Imaging Spectroradiometer (MODIS) on NASA’s Terra satellite shows the nearly snow-free mountain peaks of the Sierra Nevada mountain range. According to state and federal scientists, snowmelt in this region happened three to four weeks earlier than normal, and instead of flowing downstream, most of this water soaked into mountain soils still parched from previous droughts. Credit: NASA’s Earth Observatory / Lauren Dauphin Photo credit: NASA

From NOAA (Jessica Merzdorf Evans):

Seasonal summer rains have done little to offset drought conditions gripping the western United States, with California and Nevada seeing record July heat and moderate-to-exceptional drought according to the National Oceanic and Atmospheric Administration (NOAA). Now, new NASA research is showing how drought in the region is expected to change in the future, providing stakeholders with crucial information for decision making.

The study, published in the peer-reviewed journal, Earth’s Future, was led by scientists at NASA’s Goddard Institute for Space Studies (GISS) and funded by NOAA’s Climate Program Office and NASA’s Modeling, Analysis and Prediction (MAP) Program. It found that the western United States is headed for prolonged drought conditions whether greenhouse gas emissions continue to climb or are aggressively reined in.

While the risk of intense single-year droughts increases as greenhouse gas emissions increase in the model results, the risk of multi-year droughts is high regardless of the emissions scenario, the study found.
Credits: NOAA Climate Program Office / Anna Eshelman

However, the study also showed that the severity of acute, extreme drought events and the overall severity of prolonged drought conditions can be reduced with emissions-curbing efforts compared to a high-emissions future. This is important information for decision-makers considering two tools they can use to reduce climate impacts: Adaptation and mitigation.

Adaptation is a term used by the scientific community and policymakers to describe policies that address impacts that will occur or are already occurring. For example, adaptation to rising sea levels might include relocating low-lying infrastructure. By contrast, mitigation – efforts to reduce the amount of greenhouse gases in the atmosphere – can limit the severity of future impacts or even prevent them from happening by limiting how much the climate changes. Switching to cleaner energy sources and reducing greenhouse warming-driven ice melt are examples of mitigation to sea level rise.

Rather than representing competing options, adaptation and mitigation can both be used to address climate impacts. This new research shows how the two can complement each other when it comes to drought.

“Mitigation has clear benefits for reducing the frequency and severity of single-year droughts,” said lead author Ben Cook, a research scientist at GISS and an adjunct associate research scientist at Columbia University. “We may have more of these 20-year drought periods, but if we can avoid the really sharp, short-term, extreme spikes, then that may be something that’s easier to adapt to.”

Turning to the Past to Understand the Future

Both acute single-year and prolonged multi-year droughts occur naturally due to variations in ocean currents, precipitation and other factors. But climate change is turning up the heat in addition to these natural variations, causing even more water to evaporate from plants and soil, resulting in increased dryness even in the absence of major precipitation deficits.

As greenhouse gas emissions increase and Earth’s temperature rises, the southwestern United States is forecasted to become drier, with the risk of future soil moisture deficits increasing as emissions increase.
Credits: NOAA Climate Program Office / Hunter Allen and Anna Eshelman

To understand the southwest’s vulnerability and tendency towards drought and the factors that contribute to it, the team selected the severe single-year drought of 2002 and the extended drought of 2000 to 2020 as examples of acute and prolonged droughts respectively. They then looked at how common these acute and prolonged droughts were, not only during the period of instrumental records, but also using reconstructed drought conditions stretching back more than a thousand years and state-of-the-art supercomputer simulations of the future.

The team reconstructed soil moisture from the years 800 to 1900 using tree ring data from the region. The thickness of tree rings varies due to the wetness or dryness of each year, providing scientists with a reliable way of estimating how much rain fell in a given year. For years after 1900, they used directly measured soil moisture values. To look at a range of possible futures, the team used data from the latest version of the Coupled Model Intercomparison Project, or CMIP6. CMIP6 is an ensemble of climate model simulations that provide climate change projections depending on a range of possible greenhouse gas emission scenarios, allowing scientists and policymakers to directly compare the impacts of different emissions policies. And under different emissions scenarios, drought behaves differently.

The southwestern United States has been prone to drought for millennia. But warming temperatures dry the soil further, and the region’s natural aridity becomes the backdrop for a higher risk of severe and prolonged droughts if greenhouse gas emissions continue to climb, said Kate Marvel, a research scientist at GISS and Columbia University.

“The paleoclimate record shows that this region is prone to drought,” she said. “There have been really, really severe droughts in the past: For instance, we know there were megadroughts in the 13th century. But against the backdrop of natural climate variability — the things the climate would do even without human influence — we are confident increases in greenhouse gases make the temperature rise, and we’re fairly confident that increases drought risk in this region.”

In addition to single- and multi-year droughts alone, there’s also a risk of intense single-year droughts occurring within longer periods of drought. This risk increases as greenhouse gas emissions increase, according to the study.
Credits: NOAA Climate Program Office / Anna Eshelman

A Future Not Yet Set in Stone

Understanding that some amount of increased drought can be expected under high and low emission scenarios alike has implications for adaptation strategies like rationing water usage and changing agricultural practices. At the same time, the study’s finding that greenhouse emissions reductions still matter for extreme drought underscores the value of mitigation.

“The ongoing southwestern drought highlights the profound effects dry conditions have on people and the economy,” said Ko Barrett, senior advisor for climate in NOAA’s Office of Research and vice-chair of the Intergovernmental Panel on Climate Change’s Sixth Assessment Report. “The study clearly highlights the impact that greenhouse gas mitigation could have on the occurrence and severity of Southwestern drought. It is not too late to act and blunt impacts like severe Southwestern drought periods and short-term drought events.”

Marvel agreed. “There’s going to be a new normal regardless,” she said. “There’s going to have to be some adaptation to a drier regional climate. But the degree of that adaptation – how often these droughts happen, what happens to the drought risk – that’s basically under our control.”

The August 2021 #Climate Summary is hot off the presses from the @ColoradoClimate Center

Click here to read the summary. Here’s an intro from email:

A continued active monsoon pattern has resulted in further improvements to drought conditions over western Colorado while short-term abnormally dry spots have popped up over eastern Colorado.

Overall, August 2021 was what we typically expect to see, especially in recent years – hot temperatures, dry conditions, the occasional spotty shower. And similar to many of our recent years, the month ended warmer and drier than average.

For western Colorado, summer 2021 was HOT! In fact, this makes 7 summers out of the last 10 years that have been warmer than average. This was the second hottest summer in the record, going back 127 years. The hottest summer was 2018.

Low-tech process-based restoration of riverscapes design manual — Utah State University

Click here to access the manual (Joseph M. Wheaton, Stephen N. Bennett, Nicolaas Bouwes, Jeremy D. Maestas & Scott M. Shahverdian. Contributions from: Stephen N. Bennett, Nicolaas Bouwes, Reid Camp, Christopher E. Jordan, William W. Macfarlane, Jeremy D. Maestas, Elijah Portugal, Scott Shahverdian, Nicholas Weber & Joseph M. Wheaton). Here’s the executive summary:

Stream and riverine landscapes or riverscapes are made up of a series of interconnected floodplain, groundwater, channel habitats, and their associated biotic communities that are maintained by physical and biological processes that vary across spatial and temporal scales (Ward, 1998). An over-arching goal of riverscape restoration and conservation is to improve the health of as many miles as possible, while ensuring those systems achieve and maintain their potential in self-sustaining ways. This design manual is intended to help the restoration community more efficiently maximize efforts to initiate self-sustaining recovery of degraded riverscapes at meaningful scales.

Structural-starvation of wood and beaver dams in riverscapes is one of the most common impairments affecting riverscape health. At a basic level, a riverscape starved of structure drains too quickly and efficiently, lacks connectivity with its floodplain and has simpler more homogenous habitat. By contrast, a riverscape system with an appropriate amount of structure provides obstructions to flow. What follows in the wake of structurally-forced hydraulic diversity are more complicated geomorphic processes that result in far more diverse habitat, resilience, and a rich suite of associated ecosystem services.

The purpose of this design manual is to provide restoration practitioners with guidelines for implementing a subset of low-tech tools—namely post-assisted log structures (PALS) and beaver dam analogues (BDAs)—for initiating process- based restoration in structurally-starved riverscapes. While the concept of process-based restoration in riverscapes has been advocated for at least two decades, details and specific examples on how to implement it remain sparse. Here, we describe ‘low-tech process-based restoration’ as a practice of using simple, low unit-cost, structural additions (e.g., wood and beaver dams) to riverscapes to mimic functions and initiate specific processes. Hallmarks of this approach include:

• An explicit focus on the processes that a low-tech restoration intervention is meant to promote
• A conscious effort to use cost-effective, low-tech treatments (e.g., hand-built, natural materials, non-
engineered, short-term design life-spans)
• ‘Letting the system do the work’, which defers critical decision making to riverscapes and nature’s ecosystem engineers

Importantly, the manual conveys underlying principles guiding use of low-tech tools in process-based restoration in systems impaired by insufficient structural complexity. Although intended to be simple, low-tech restoration still requires some basic understanding of watershed context, riverscape behavior and channel evolution, and careful planning. The manual provides interested practitioners with sufficient conceptual and applied information on planning, design, permitting, construction and adaptive management to get started, as well as references to additional information and resources. Detailed design and construction guidance is provided on two effective low-tech tools: 1) beaver dam analogues (BDAs) for mimicking beaver dam activity, and 2) post-assisted log structures (PALS) for mimicking wood accumulation in riverscapes. Throughout the manual, readers are reminded that the structures themselves are not the solution, but rather a means to initiate specific, desirable processes. Ultimately, embracing the design principles will help practitioners better understand the ‘why’ behind structural interventions and allow for more efficient and effective riverscape restoration.

Restoration beaver dam San Antonio Creek. Photo credit: WildEarth Guardians

Depleted by #drought, #LakePowell and #LakeMead were doomed from the beginning — The Washington Post

Delph Carpenter’s original map showing a reservoir at Glen Canyon and one at Black Canyon via Greg Hobbs

From The Washington Post (Becky Bollinger):

For the first time, the U.S. Bureau of Reclamation issued a water shortage for Lake Mead starting in 2022. Located between southern Nevada and northwestern Arizona, Lake Mead provides water and generates electricity for the more than 20 million people in the lower Colorado River Basin.

This shortage isn’t a surprise. Water levels at Lake Mead and Lake Powell to the northeast have already reached historic lows amid the summer drought. By January, the bureau projects water levels at Lake Mead to fall to 1,065.85 feet — nine feet below the first shortage trigger elevation. Levels on Lake Powell, which stores water for the Upper Colorado River Basin, are only marginally better, projected to be just 45 feet above the required elevation to produce hydropower.

The overall situation is not good, but why? This whole reservoir system along the Colorado River Basin was designed to get us through the drought years. Why isn’t it working? A glimpse into the history of the system, how it was designed and the impacts of climate change sheds light on why it was destined to fail — and why it may never recover.

Colorado River “Beginnings”. Photo: Brent Gardner-Smith/Aspen Journalism

A crash course on the Colorado River Basin

As Americans began moving west, they found that Western rivers behaved very differently from those found in the Midwest and East Coast.

Western rivers were fed by snow from the peaks of the Rocky Mountains. During the winter, river flows would decrease, sometimes even freeze over. As spring and summer arrived, the warmer temperatures melted snowpack that accumulated on the mountains over the winter. Then the melt would run off at exactly the perfect time — the beginning of the growing season. Water would be abundant for farming and other needs during the warm season.

But issues arose with this “perfect” system. People learned less snowfall in one winter would result in less water flowing in the spring and summer. Water might not be as abundant as desired.

Then came an issue of who could use the water. Consider a farmer named Joseph. He and his family would settle on their land and pull from the river during the warm season. It had been a good winter so they expected high river flows that spring. Instead, the flows were really low. Where was his water?

He would go upstream to find that another farmer named William had settled his family there, and he was taking the water. Joseph told William that he couldn’t have the water. But William said it flowed through his land and therefore it was his. Joseph argued that it would actually flow through this land, and he was here first — it was his.

Thus was born the idea of water appropriation, albeit this is an extremely simplified and embellished version of the story.

Later, the Colorado River Compact of 1922 determined the river belonged to all parties where the river and its tributaries flowed. Everyone would share it equitably. This would include the upper basin states (Wyoming, Utah, Colorado and New Mexico) and the lower basin (Arizona, Nevada, and California).

The compact stated the upper basin would share 7.5 million acre-feet per year and the lower basin would also share 7.5 million acre-feet per year. Since the majority of this water originates in the Rocky Mountains of the upper basin states, those states must ensure the consistent delivery of water to the lower basin.

Lake Mead (initially formed by the Hoover Dam in 1935) was designed to hold water for the lower basin states. As an “insurance policy,” the upper basin had Lake Powell, which began filling in 1963. If drought meant the upper basin states couldn’t deliver their promised amount to the lower basin, they could deliver it with water in the savings account of Lake Powell.

While this plan initially seemed to work well, it was doomed from the beginning, for three reasons.

1. The water was already overallocated

How did the compact come up with the number 15 million acre-feet? Well, the number wasn’t just picked out of hat. There was a bit of analyzing of annual precipitation and runoff to come up with the estimate. In the early 1920s, data from the previous 10 to 20 years would be used to calculate the estimate. Unfortunately, the 1910s was a relatively wet decade and skewed the estimates higher than they should have been.

Brad Udall: Here’s the latest version of my 4-Panel plot thru Water Year (Oct-Sep) of 2019 of the #coriver big reservoirs, natural flows, precipitation, and temperature. Data goes back or 1906 (or 1935 for reservoirs.) This updates previous work with @GreatLakesPeck

The chart above shows the [upper basin average flows] since 1920, as recorded by the U.S. Geological Survey. There is a lot of year-to-year variability, which is why building reservoirs to store during the wet periods became essential…

2. Population increases

Today, the Bureau of Reclamation estimates 40 million people rely on water from the Colorado River Basin. When the compact was signed in 1922, the total population of the seven basin states was not even 6 million people.

While the majority of the water from the Colorado River is used for agriculture, the smaller percentage of municipal use can’t be ignored when considering significant population increases. The old rule of thumb is that one acre-foot of water is enough for two households for a year. An increasing number of households throughout the Southwest puts further strain on the already overallocated Colorado River system.

3. Climate change will further reduce water availability in the basin

Temperatures throughout the Colorado River Basin are increasing, with particular “hot spots” in the Rocky Mountains. Scientists are still parsing out precipitation and snowpack trends on the mountains, but higher temperatures alone will reduce the water supply provided by the Colorado River.

For one, an earlier peak snowpack and earlier melt because of a warmer environment reduces runoff efficiency. Higher temperatures allow more water to evaporate into the atmosphere. This increased evaporative demand also means the same level of crop production requires more water.

Climate change is also increasing the frequency and severity of droughts in the Southwest. We’ve seen this quite obviously play out in the 21st century — repeated and prolonged droughts have chipped away at the available water supply while fewer opportunities for recovery have occurred. These trends will continue.

U.S. Drought Monitor July 23, 2002.

No going back

For many in the upper basin states, the situation became clear after the 2002 drought…

The 2002 drought was the most severe drought in the Upper Colorado River Basin in recorded history. To this day, cumulative flows on the Colorado River near the Colorado-Utah state line have not been lower.

While the lower basin states continued a business-as-usual path, it became clear in the upper basin that the system would not quickly recover from this drought. But with each step forward in recovery, another drought would take the system two steps back again.

Upper basin and lower basin states have worked on drought contingency planning, and new adjustments were written after the 2002 drought to prepare for a time when Lake Mead might get too low.

This year, we reached that point. Moving forward, we need to explore other solutions to meet our population and agriculture demands and preserve our forests, rivers and wildlife.

We all must accept that the question is not: “How do we recover Lakes Powell and Mead and get them back to good water levels again?” Instead, we need to ask: “How do we continue to meet the needs of the Southwest without Lakes Powell and Mead?”

Becky Bolinger is the assistant state climatologist for Colorado and a research scientist at Colorado State University.

Fountain Creek watershed projects improve quality of life, but impact often goes unnoticed — The #Pueblo Chieftain

Highway 47 Bank Restoration Project before project. Photo credit: Fountain Creek Watershed
Flood Control And Greenway District

From The Pueblo Chieftain (Sara Wilson):

The work managed by the Fountain Creek Watershed, Flood Control and Greenway District can be “unrecognizable,” but its leaders want citizens to recognize the importance of its flood control projects, as well as understand why it’s crucial to find more funding.

One of those projects in Pueblo is the restoration of approximately 3,000 feet of the creek that runs under the US Highway 47 bridge near Jerry Murphy Road, completed in November 2018.

“It was $6.6 million for something you would drive by and not recognize, while at the same time it protects a major thoroughfare,” District Executive Director Bill Banks said while giving the annual tour of the district’s projects on Sept. 10.

After Highway 47 Project. Photo credit: Fountain Creek Watershed
Flood Control And Greenway District

In this instance, a 2015 flooding event catalyzed the Colorado Department of Transportation to partner with the district to realign the creek in order to protect the bridge. CDOT contributed $1.5 million to the project, which also included major landscaping design to provide bank and floodplain stabilization…

Pueblo Channel Project at 13th Street before. Photo credit: Fountain Creek Watershed
Flood Control And Greenway District

Another large project the district completed in June 2021 is a 2,600 feet stretch of the creek that ends at the 8th Street bridge on the East Side. That $3.4 million project narrowed the creek channel from 600 feet to an average of 150 feet. This both stabilized the channel and made it easier for the water to push sediment through, rather than dumping it haphazardly along the banks.

“A lot of conventional wisdom is to make a channel really wide in order to convey as much water as possible to prevent flooding,” said Aaron Sutherlin, who oversaw the 8th Street bridge project with Matrix Design Group. “When you make things as wide as possible, you lose the ability to transport sediment. What you get in a system is sediment that dumps out in places you don’t know where it’s going to go. That’s exactly what happened at this site.”

That project also built the creek to withstand up to 6,000 cubic feet per second, a so-called “100-year flood.”

Pueblo Channel Project at 13th Street after. Photo credit: Fountain Creek Watershed

That influx was a $50 million payout from Colorado Springs Utility to offset the impact of its water delivery system from the Pueblo Reservoir to the cities of Colorado Springs and Fountain. So far, Banks said the district has spent about $27 million from those funds and has identified over $200 million worth of projects.

Are ‘water positive’ pledges from tech companies just a new kind of greenwashing? In response to historic droughts, Google and Facebook say they want to use less water at their data centers — Popular Science #ActOnClimate

Google Data Center, The Dalles, Oregon. By Visitor7 – Own work, CC BY-SA 3.0, https://commons.wikimedia.org/w/index.php?curid=16564116

From Popular Science (Angely Mercado):

Corporate America is making a new kind of climate pledge. In recent months, multiple tech giants have pledged to use their reach and resources to join the fight for water conservation. Facebook made an announcement at the end of August declaring their efforts to “be water positive by 2030.” And just this week, Google made a similar announcement to make its data centers more efficient and support water security in the communities it operates in.

Google, Facebook, and several other companies have promised to put more water back into the environment than they pipe in—an exchange they call “water positive.” This means they plan to cut the amount of water needed to run their facilities, while protecting natural waterways and preserving access to clean drinking water in drought-prone areas. The math is based on the number of gallons they want to restore, not newly produced H2O. Both Facebook and Google have also promised to share their conservation research and tech with others…

Given the current state of the planet, it’s only fitting that corporations like Facebook and Google change how they use up water and other vital resources, says Pamela Chasek, a professor and chair of the political science department of Manhattan College, who has also commented on past corporate climate pledges…

A 2020 report by Data Center Knowledge found that Google operates more than 20 data centers around the world. Facebook, meanwhile, has seven data centers in the US. The social media company has also announced that it will open more data centers this year.

“The typical data center uses about 3-5 million gallons of water per day—the same amount of water as a city of 30,000-50,000 people,” Venkatesh Uddameri, professor and director of the Water Resources Center at Texas Tech University told NBC News earlier this year. Much of it is used to chill the giant servers, machine learning systems, and other hardware the companies run around the clock.

Both Facebook and Google say they’re testing out ways to cut down the water used to cool these data centers. “For example, we deployed technology that uses reclaimed wastewater to cool our data center in Douglas County, Georgia,” Google Sustainability Officer Kate Brandt writes in an email to PopSci. “At our office campuses in the San Francisco Bay Area, we worked with ecologists and landscape architects to develop an ecological design strategy and habitat guidelines to improve the resiliency of landscapes and nearby watershed health.”

In its pledge post, Facebook noted that it uses “onsite recycled water systems” at some global offices. The company also stated that it’s developed technology that enables “data centers to be cooled with outside air,” allowing them “to operate 80 percent more water efficiently on average compared to the industry standard.”

For the other end of the “water positive” equation, both companies say they’ve sought out local partners to meet their new water sustainability goals. Google writes that it’s “working with the Colorado River Indian Tribes project to reduce the amount of water that is withdrawn from Lake Mead reservoir on the Colorado River in Nevada and Arizona.” Meanwhile, Facebook points out that it’s providing funding “to the Rio Grande Water Fund to restore the connection between the stressed Cedro Creek and its historic floodplain.”

Water usage has long been a concern as large tech offices and data centers compete with area residents (people and wildlife) over limited water supplies in drought-prone areas. The friction has only intensified in recent years. In 2017, multiple South Carolina-based conservation groups criticized Google for its plans to draw more than a million gallons of water per day from the depleted Goose Creek watershed. The corporation ultimately struck a deal to draw 5 million gallons per day from another aquifer.

When asked if the water pledges felt like greenwashing, Chasek says it’ll depend on how Facebook and Google are held accountable and how transparent both companies are when implementing the actions behind their promises.

“One of the interesting things with the Facebook project is that they’re working with NGOs and other organizations in terms of partnerships,” she explains. “These partnerships can determine where best to do water-restoration work, [which] is one piece of that accountability. How are they investing in these water restoration projects … particularly like in the western US where we’re seeing the highest amount of water stress? Those projects need to see a lot of scrutiny.”

Jim Murphy, an assistant professor and the environmental advocacy clinic director at the Vermont Law School, agrees that major tech companies should be held accountable for their sustainability claims by outside organizations or even governmental agencies. But he argues that while it makes sense for powerful industries to help with water management, policy is the best way to manage responsible use of natural resources, especially in communities hard hit by climate change.

“The problem with private companies, even if they’re publicly owned … is they have certain obligations to their shareholders,” he says. “These are not accountable entities or entities that are created [through] public interest.”

That kind of decoupling is especially important as fossil fuel companies like BP, which helped to exacerbate climate change through greenhouse gas emissions, launch “water positive” campaigns of their own.

“Making sure that we properly protect the entire watershed from pollution and destruction is paramount,” Murphy continues. “The Biden administration has taken some steps in this direction, and they really need to continue that through.”

#Greeley City Council approves revision to water agreement with #Windsor — The Greeley Tribune #ActOnClimate #SouthPlatteRiver

Windsor Lake Reservoir. Photo credit: The Town of Windsor

From The Greeley Tribune (Kelly Ragan):

The city of Greeley is set to bring in at least $60,000 more per year after revising a longstanding agreement on water with the town of Windsor.

An amendment to an existing agreement, approved by city council Tuesday, will make drought supply municipal water available to Windsor during dry times…

While Greeley still owns the rights, Windsor pays to [lease] those water rights to keep the city going if (and when) drought hits.

Greeley and Windsor have worked together on water for decades. The two entered into an intergovernmental agreement back in 1996 when Greeley agreed to treat and deliver potable water drawn from Windsor’s own sources.

In the event we do see times of shortage, Windsor will be able to access up to 350 acre-feet of water per year, enough water for about 700 to 1,050 homes…

The agreement approved by city council Tuesday goes into effect in 2022, starting at $60,000. Windsor is set to pay regardless of whether it is a drought year. The annual payment will then tick up by 3% per year.

Why does this matter?

Greeley hasn’t had to use drought restrictions for almost 20 years. But city officials haven’t forgotten how dire things got in 2002, a drought year that climate experts agree was one of the worst in 300 years.

According to the city, the shortage conditions that would need to kick in for Windsor to use the water happen about twice per decade – but climate change could mean those conditions would be met more often.

Rivers flowing well below average — The #PagosaSprings Sun #SanJuanRiver #ColoradoRiver #COriver #aridification

From The Pagosa Springs Sun (Clayton Chaney):

According to the U.S. Geological Survey (USGS), the San Juan River was flowing at a rate of 27.3 cubic feet per second (cfs) in Pagosa Springs as of noon Wednesday, Sept. 8. That rate is more than 100 cfs below the average flow rate for Sept. 8.

Based on 85 years of water records at this site, the average flow rate for this date is 139 cfs.

The highest recorded rate for this date was in 1970 at 1,160 cfs. The lowest recorded rate was 17 cfs, recorded in 1978.

As of noon Wednesday, Sept. 1, the Piedra River near Arboles was flowing at a rate of 40.1, which is up from last week’s instantaneous reading of 31.5 cfs.

However, the flow rate for that date is almost 80 cfs below the average flow rate for Sept. 8.

Based on 58 years of water records at this site, the average flow rate for that date is 120 cfs.

The highest recorded rate for this date was 1,300 cfs in 1991. The lowest recorded rate was 8.94 cfs in 2002.

Water report

According to a press release from the Pagosa Area Water and Sanitation District (PAWSD) Manager Justin Ramsey, the district remains in a Stage 1 drought per its drought management plan.

…the U.S. Drought Monitor…indicates our area is in a severe to moderate drought.

Ramsey notes that PAWSD is continuing to request voluntary odd/even watering days, “requesting that if your address is an odd number only irrigate on odd calender days and vice-versa for even number ad- dresses.”

There are no other mandatory water use restrictions in place, be- sides limiting irrigation to after 6 p.m. and before 9 a.m…

Colorado Drought Monitor map September 7, 2021.

Drought report

The NIDIS website indicates 95.29 percent of Archuleta County is abnormally dry, up slightly from the previous report of 94.84 percent of the county being abnormally dry.

The percentage of the county in a moderate drought remains at 67.47 percent.

The NIDIS website also notes that 41.75 percent of the county is in a severe drought stage, which is up slightly from the previous report of 41.2 percent.

Additionally, the NIDIS website notes that 9.12 percent of the county remains in an extreme drought — consistent with the previous report — mostly in the southwestern por- tion of the county.

The NIDIS website notes that under an extreme drought stage, large fires may develop and pasture conditions worsen.

No portion of the county is in exceptional drought.

For more information and maps, visit: https://www.drought.gov/states/Colorado/county/Archuleta.

Federal Agencies Are Ready To Loosen Protections On Certain Fish Native To The #ColoradoRiver — KUER #COriver #arifidification

Confluence of the Little Colorado River and the Colorado River. Climate change is affecting western streams by diminishing snowpack and accelerating evaporation. The Colorado River’s flows and reservoirs are being impacted by climate change, and environmental groups are concerned about the status of the native fish in the river. Photo credit: DMY at Hebrew Wikipedia [Public domain]
From KUER (Lexi Peery):

The razorback sucker fish could be downlisted from an endangered species to threatened in the next year or so, according to the U.S. Fish and Wildlife Service. This week, environmental groups sent the agency a letter in opposition to the move.

The letter argues the razorback sucker is still in trouble, despite recoveries it’s made in the last 30 years, which is when it was first listed as federally endangered. The fish is native to the Colorado River, which is facing historic shortages due to the west’s megadrought…

The USFWS proposed a change in the fish’s status because they said its situation has improved and threats to it have been reduced. Though, they said it will need to be continually managed.

The letter from environmentalists was submitted as a public comment on the reclassification process. A spokesperson for the USFWS said they received around 35 comments.

Jen Pelz, Wild Rivers program director at the conservation group WildEarth Guardians, said it’s “irresponsible” to downlist the species now.

“Until the ecosystem that they live in can support self-sustaining populations, we believe that those species should maintain their endangered status, which is the highest protection under the law,” she said.

The humpback chub, another Colorado River native fish, could also be downlisted. The USFWS proposed a reclassification last year.

Screen shot from the Upper Colorado River Endangered Fish Recovery Program website August 28, 2021:

#ClimateChange Is Intensifying the #Water Cycle, New IPCC Report Finds — Circle of Blue #ActOnClimate

US Drought Monitor map September 7, 2021.

From Circle of Blue (Laura Gersony):

The climate crisis will jeopardize key sources of fresh water and make extreme weather events more severe. But experts say there’s still time to prevent the worst outcomes.

  • Extreme droughts affecting agriculture and ecosystems are already more frequent and intense than they were last century. This trend will continue as glacial melting, decreased rainfall, and a “thirstier” atmosphere jeopardize sources of freshwater in some parts of the globe.
  • Heavy rainfall will also become more common and more powerful.
  • There are a handful of high-impact “tipping points” that could drastically change global or regional water cycles. These events are unlikely in our current climate—but the warmer Earth gets, the bigger the risk becomes.
  • With swift, drastic action, warming could still be limited to 1.5 or 2 degrees Celsius, avoiding the worst-case scenarios for freshwater.
  • #Forget plans to lower emissions by 2050 – this is deadly procrastination: Fixating on ‘net zero’ means betting the future of life on Earth that someone will invent some kind of whiz-bang tech to draw down CO2 — The Guardian #ActOnClimate

    Greenhouse gas missions reduction pathways to achieve net zero. Cutout from fig.1a, Warszawski et al (2021)

    From The Guardian (Peter Kalmus):

    The world has by and large adopted “net zero by 2050” as its de facto climate goal, but two fatal flaws hide in plain sight within those 16 characters. One is “net zero.” The other is “by 2050”.

    These two flaws provide cover for big oil and politicians who wish to preserve the status quo. Together they comprise a deadly prescription for inaction and catastrophically high levels of irreversible climate and ecological breakdown.

    First, consider “by 2050”. This deadline feels comfortably far away, encouraging further climate procrastination. Who feels urgency over a deadline in 2050? This is convenient for the world’s elected leaders, who typically have term limits of between three and five years, less so for anyone who needs a livable planet.

    Pathways for achieving net zero by 2050 – meaning that in 2050 any carbon emissions would be balanced by CO2 withdrawn through natural means, like forests, and through hypothetical carbon-trapping technology – are designed to give roughly even odds for keeping global heating below 1.5C. But it’s now apparent that even the current 1.1C of global heating is not a “safe” level. Climate catastrophes are arriving with a frequency and ferocity that have shocked climate scientists. The fact that climate models failed to predict the intensity of the summer’s heatwaves and flooding suggests that severe impacts will come sooner than previously thought. Madagascar is on the brink of the first climate famine, and developments such as multi-regional crop losses and climate warfare even before reaching 1.5C should no longer be ruled out.

    “The Roundup” newsletter is hot off the presses from @AspenJournalism #ColoradoRiver #COriver #aridification

    The boat ramp at Elk Creek Marina had to be temporarily closed so the docks could be moved out into deeper water. Colorado water managers are not happy that emergency releases from Blue Mesa Reservoir are impacting late summer lake recreation.
    CREDIT: HEATHER SACKETT/ASPEN JOURNALISM

    Click here to read the newsletter. Here’s an excerpt:

    Colorado water managers unhappy with timing of emergency releases

    In an effort to prop up water levels at the declining Lake Powell, federal water managers are negatively impacting recreation on Colorado’s biggest man-made lake.

    That’s the message from Colorado water managers and marina operators at Blue Mesa Reservoir in Gunnison County. On Aug. 1, the Bureau of Reclamation, which operates the reservoir, began emergency releases. By the time the releases are finished the first week of October, Blue Mesa is projected to fall to its second-lowest level ever, just 215,000 acre-feet, or 22.8% of its 941,000-acre-foot capacity.

    As of Sept. 1, the reservoir was 37% full, which is about 68 feet down from a full reservoir, and a ring of muddy shoreline was growing. Parking lots and boat slips sat empty, and Pappy’s Restaurant was closed for the season. The dwindling water levels are first impacting Iola, the easternmost of Blue Mesa’s three basins. Iola is where the Gunnison River now cuts through a field of mud.

    Eric Loken, who operates the reservoir’s two marinas (Elk Creek and Lake Fork), said he was given only nine days’ notice to empty Elk Creek Marina’s 180 slips. The dock system’s anchors, which are not built for low water, had to be moved deeper. He said about 25 people lost their jobs six weeks earlier than normal and the marinas lost about 25% of its revenue for the year.

    Low water at Vega State Park impacting boaters but not visitation — The #GrandJunction Daily Sentinel #ColoradoRiver #COriver #aridification

    Vega State Park, with a view of Vega Reservoir in early spring, still partially frozen. By Jeffrey Beall – Own work, CC BY 4.0, https://commons.wikimedia.org/w/index.php?curid=57567250

    From The Grand Junction Daily Sentinel (Sam Klomhaus):

    Vega State Park’s boat ramps have been left high and dry this summer.

    Every one of the park’s boat ramps are closed because of low water.

    It was a bleak season for visitors to get boats on the high-elevation reservoir.

    According to Park Manager James Masek, only one of the lake’s three boat ramps, the Island boat ramp, was even able to open this season, but it closed July 29.

    Normally, Masek said, the Island, Early Settlers and Oak Point boat ramps open in May, and on good years, Island is able to stay open until October…

    Vega Reservoir ended last year pretty low, Masek said, and didn’t get the snowpack on Grand Mesa needed to fill back up…

    The park’s water level goes down as the summer progresses because the water is used for irrigation…

    The visitation isn’t quite as high as it was last year, when the park saw a huge spike from people heading outside during the COVID-19 pandemic, but it’s consistent with previous years.

    How the “Best Accidental #Climate Treaty” Stopped Runaway #ClimateChange: The #MontrealProtocol halted the destruction of the #ozone layer. In the process, it saved one of #Earth’s most important carbon sinks — EOS #ActOnClimate

    The planet would store 580 billon tons less carbon in plants and soil by the end of the century if the Montreal Protocol had never existed. That’s more than all the carbon held in Earth’s forests. Credit: Marc Pell/Unsplash

    From EOS (Jenessa Duncombe):

    The international treaty that phased out the production of ozone-depleting chemicals has prevented between 0.65°C and 1°C of global warming, according to research.

    The study also showed that carbon stored in vegetation through photosynthesis would have dropped by 30% without the treaty, which came into force in 1989.

    Researchers from the United Kingdom, New Zealand, and the United States wrote in Nature that the Montreal Protocol was essential in protecting carbon stored in plants. Studies in the polar regions have shown that high-energy ultraviolet rays (UVB) reduce plant biomass and damage DNA. Forests and soil currently absorb 30% of human carbon dioxide emissions.

    “At the ends of our simulations, which we finished around 2100, the amount of carbon which is being taken up by plants is 15% the value of our control world where the Montreal Protocol is enacted,” said lead author and atmospheric scientist Paul Young of Lancaster University.

    In the simulation, the UVB radiation is so intense that plants in the midlatitudes stop taking up a net increase in carbon.

    Plants in the tropics fare better, but humid forests would have 60% less ozone overhead than before, a state much worse than was ever observed in the Antarctic ozone hole.

    A “World Avoided”

    The study used a chemistry climate model, a weather-generating tool, a land surface model, and a carbon cycling model. It links ozone loss with declines in the carbon sink in plants for the first time.

    Chlorofluorocarbons (CFCs), ozone-depleting chemicals phased out by the Montreal Protocol, are potent greenhouse gases. The study estimated that CFCs would warm the planet an additional 1.7°C by 2100. Taken together, the damage from UVB radiation and the greenhouse effect of CFCs would add an additional 2.5°C warming by the century’s end. Today, the world has warmed, on average, 1.1°C at the surface, leading to more frequent droughts, heat waves, and extreme precipitation.

    Carbon dioxide levels in the atmosphere would reach 827 parts per million by the end of the century too, double the amount of carbon dioxide today (~412 parts per million).

    The work analyzed three different scenarios: The first assumes that ozone-depleting substances stayed below 1960 levels when massive production kicked in. The second assumes that ozone-depleting chemicals peaked in the late 1980s before tapering off. The last assumes that ozone-depleting chemicals increase in the atmosphere every year by 3% through 2100.

    The last scenario, called the “World Avoided,” assumes not only that the Montreal Protocol never happened but also that humans had no idea CFCs were harming ozone, even when the effects would become clear in the 2040s. The models also assume one kind of UVB damage to all vegetation, when in reality, plants react differently.

    The ozone layer over Antarctica has stabilized and is expected to recover this century. Credit: Amy Moran/NASA Goddard Space Flight Center

    “The Montreal Protocol is regarded as one of the most successful global environmental treaties,” said University of Leeds atmospheric scientist Martyn Chipperfield, who was not involved in the research. “CFCs and other ozone-depleting substances are potent greenhouse gases, and the Montreal Protocol is known for having real benefits in addressing climate change by removing previous levels of high CFCs from the atmosphere.”

    The Kigali Amendment to the Montreal Protocol in 2016 brought climate change to the forefront. Countries agreed to gradually phase out hydrofluorocarbons (HFCs), which are used in applications such as air conditioning and fire extinguishing systems. HFCs originally replaced hydrochlorofluorocarbons (HCFCs) and CFCs because they do not harm ozone. Yet HFCs are potent greenhouse gases.

    The Montreal Protocol was the “best accidental climate treaty,” said Young. “It is an example of where science discovered there was a problem, and the world acted on that problem.”

    Injecting sulfate aerosols into the stratosphere has been proposed as one geoengineering solution to slow global warming. “People are seriously talking about this because it’s one of the most plausible geoengineering mechanisms, yet that does destroy ozone,” Young said. Calculating the harm to the carbon cycle is “the obvious follow-up experiment for us.”

    The research highlights the importance of the U.N. Climate Change Conference of the Parties (COP26) this fall, which will determine the success of worldwide climate targets.

    Immediate and rapid reductions in greenhouse gases are necessary to stop the most damaging consequences of climate change, according to the Intergovernmental Panel on Climate Change.

    The #Colorado Department of Agriculture Begins Accepting Applications for Drought Resiliency Competitive Grants

    Screen shot from the Vimeo film, “Rio Grande Headwaters Restoration Project: Five Ditches,” https://vimeo.com/364411112

    Here’s the release from the Colorado Department of Agriculture:

    The Colorado Department of Agriculture is accepting applications for a competitive grant program to assist with projects that help Colorado anticipate, prepare for, mitigate, adapt to, or respond to any event, trend, or climatological disturbance related to drought or climate. Resulting from Senate Bill 21-234, this funding is intended to support drought and climate resilience efforts for agricultural producers.

    “Many farmers and ranchers have been affected by multi-year hazards: 2018 drought, 2019 freeze, 2020 drought and wildfires. Climate extremes can be very detrimental to producers and the 2021 season does not look any more forgiving,” said Conservation Services Division Director Les Owen. “These hardships have caused deep economic and ecological costs to agriculture in Colorado and this program aims to mitigate some of those losses and help prepare ag producers for changing climatic conditions.”

    The purpose of the competitive grant program is to respond to Colorado’s prolonged drought conditions caused by absent monsoon seasons, record-high temperatures, and extreme evaporative demands from wind, low humidity and high temperatures. After several years of unusual weather patterns, a warm spring, dry summer, and critically hot autumn further contributed to the 2020 record-breaking wildfire season. So far in 2021, Colorado has experienced a long lasting and severe drought in most parts of the state.

    CDA will award approximately $1.5 million in grants for drought-related projects. Projects that can demonstrate long-term and widespread benefits will be the most competitive. Funding can also be used to match investments in new projects.

    Applications for the competitive grants are open now and the deadline to apply is September 30, 2021. All applications must be submitted via an online form (to see all application questions, click here but please note that this is for informational purposes only and cannot be used to submit an application). Applicants will be asked to include narrative statements about the project they are applying for, including the expected outcomes and drought preparedness impacts.

    Eligible entities include Tribes; state government, municipalities, enterprises, counties and agencies; districts including Authorities, title 32/Special Districts (conservancy, conservation and irrigation districts); Federal agencies that apply with a state entity; Private Incorporated entities including mutual ditch companies, homeowners associations and corporations; Private individuals, partnerships and sole proprietors; and Non-Governmental Organizations.

    More information about the application process can be found at http://ag.colorado.gov/stimulus. With questions, applicants can reach out to cda_agstimulus@state.co.us.

    Anger is the only reasonable response to COVID obstructionists — #Colorado Newsline

    Graphic credit: Colorado Department of Health and Environment, September 20, 2021

    We were willing to debate the efficacy of masks.

    We agreed there should be balance between lockdown measures and economic interests.

    We patiently accumulated evidence that COVID-19 vaccines are safe and effective.

    We kept our cool through every quack remedy and grifter treatment.

    We offered guidance to the confused and correctives to the misinformed.

    We forbore ignorant assertions that the coronavirus was a hoax, bratty defiance of public health orders, puerile abuse of “freedom,” looney vaccine conspiracies.

    We did this all with fear, as we watched wave after wave of infections disrupt our lives and kill members of our families.

    But now, as we suffer through a second summer of illness and death, we find ourselves confronted with a category of people whose behavior is despicable — the COVID obstructionists, the ones who not only refuse to protect themselves but actively prevent others from doing so. 

    GET THE MORNING HEADLINES DELIVERED TO YOUR INBOX

    There’s no point trying to understand them, no reasoning with them. They deserve no patience, no forbearance. The only reasonable response to these miscreants is anger. White hot anger.

    Last weekend, Jefferson County Public Health staff were forced to close a mobile vaccination clinic after medical professionals were harassed and threatened. At one clinic someone threw some kind of liquid at a nurse. Passengers in cars threw garbage at the staff.

    “It’s the epitome of selfishness and I am angry today,” Dawn Comstock, the agency’s executive director told The Denver Post.

    Comstock speaks for all of us who have tried to do our part for the wellbeing of the community. We trusted the science. We recognized the obligation we have to our friends and neighbors. We accepted the inconvenience of mask-wearing and the negligible risks of vaccinations. We did this in service to the greater good. And in return, COVID deniers, pandemic conspiracists and vaccine obstructionists are literally killing us with their stupidity and selfishness. They are inflicting illness on our loved ones, and now we are angry. 

    What Comstock’s medical staff experienced is only one instance of a vile pattern of behavior in America. Blame starts with certain leaders.

    From the very beginning of the pandemic some elected officials downplayed the danger. Former President Donald Trump assured Americans that the virus would magically disappear. He also promoted pea-brained treatments and made a show of not wearing a mask.

    Colorado has long had its own COVID deniers, like Republican state Rep. Patrick Neville, who sued the governor over mask mandates, and various sheriffs who refused to enforce mask rules, and Republican U.S. Rep. Lauren Boebert, who defied a public health order when she kept her Rifle restaurant open for sit-down service in May 2020.

    Such tantrums set the tone for what was to come.

    The emergence of vaccines held the promise of a return to normal life. But protection depended on community-wide participation, and too many Americans by the time the first vaccines were administered in December had been persuaded that the vaccines were unsafe or some nefarious form of government control. That meant that even with this pandemic-ending miracle of medical science at hand, some of our leaders and neighbors decided they would rather show off their imbecility than help eradicate the virus. Anti-vaccine parents were so threatening toward members of a school board in Grand Junction that board members had to have police escorts to their cars after a recent meeting. Florida Gov. Ron DeSantis moved to block Florida schools from issuing mask mandates. Fox News host Tucker Carlson encouraged viewers to harass people wearing masks and call police on parents of mask-wearing kids. Eleven states have prohibited mask mandates. And there are innumerable individual acts of obstruction of the sort witnessed in Jefferson County last weekend.

    To what end? The country is gripped by a fourth wave of infections, and hospitals in many parts of the country, including Colorado, are approaching or exceeding capacity as unvaccinated patients pour in.

    In the beginning of the pandemic, it was easier to tolerate ignorance and stubbornness. Not anymore, not with nearly 700,000 or more dead and the highly-contagious delta variant tearing through the population. Now we want severity. We want mask requirements. We want vaccine mandates. We want crisis standards of care that prioritize vaccinated patients.

    We will grieve for the unvaccinated who don’t make it, but there’s only so much room in our hearts, because we’re grieving the loss of our own loved ones who did not have to die. They could still be with us, and we are angry that they’re not.

    SUPPORT NEWS YOU TRUST.

    Colorado Newsline is part of States Newsroom, a network of news bureaus supported by grants and a coalition of donors as a 501c(3) public charity. Colorado Newsline maintains editorial independence. Contact Editor Quentin Young for questions: info@coloradonewsline.com. Follow Colorado Newsline on Facebook and Twitter.

    To Meet Paris Accord Goal, Most of the World’s #FossilFuel Reserves Must Stay in the Ground — Inside #Climate News #ActOnClimate #KeepItInTheGround

    Directional drilling from one well site via the National Science Foundation

    From Inside Climate News (Nicholas Kusnetz):

    A new study in Nature reports that oil, gas and coal production must begin falling immediately to have even a 50 percent chance of keeping global temperatures from rising more than 1.5 degrees Celsius.

    After a summer of weather extremes that highlighted the urgency of limiting global warming in starkly human terms, new research is clarifying what it will take to do so. In order to have just a 50 percent chance of meeting the most ambitious climate target, the study found, the production of all fossil fuels will need to start declining immediately, and a significant majority of the world’s oil, gas and coal reserves will have to remain underground over the next few decades.

    While the research, published Wednesday [September 8, 2021] in the journal Nature, is only the latest to argue that meeting the 2015 Paris Agreement goals to limit warming requires a rapid pivot to clean energy, it lays out with clear and specific figures exactly how far from those targets the world remains.

    “The inescapable evidence that hopefully we’ve shown and that successive reports have shown is that if you want to meet 1.5 degrees, then global production has to start declining,” said Daniel Welsby, a researcher at University College London, in the United Kingdom, and the study’s lead author. As part of the Paris Agreement, nations agreed to try to limit global warming to 1.5 degrees Celsius (2.7 degrees Fahrenheit) above pre-industrial times.

    The study found that nearly 60 percent of global oil and gas reserves and about 90 percent of coal reserves must be left unexploited by 2050, though a portion of those fuels could be produced in the second half of the century. Total oil and gas production must begin declining immediately, the research said, and continue falling at about 3 percent annually through 2050. Coal production must fall at an even steeper rate.

    While the authors noted a few signs of change, including that coal production is already on the decline, the current course is far off what’s needed. In March, the International Energy Agency warned that oil production was on track to rebound from a pandemic-driven dip and would surpass 2019 levels within a couple of years. That projection came on the heels of a separate report in December by the United Nations Environment Program, which said energy producing countries are set to expand fossil fuel output for years.

    The new paper builds on these studies and other related work to estimate the “unextractable” portion of the fossil fuel stores that are currently considered profitable to exploit—so-called proven reserves. Put another way, the research effectively says that most of the fossil fuels that energy companies currently list as financial assets, or that governments report as strategic ones, would be rendered worthless if the world is to have a shot at limiting warming to 1.5 degrees Celsius.

    Click to enlarge.

    Water Funding Playbook A Guide to Local Funding Initiatives for #Water and Rivers — Water for #Colorado

    Click here to go to the Water for Colorado website tool for local funding initiatives:

    Solving Colorado’s Water Issues

    Colorado needs long-term funding to conserve, maintain, and restore our water supplies, river and stream flows, and economy in the face of numerous challenges, from prolonged drought and rising temperatures driven by climate change and population growth. Maintaining healthy river systems and water availability is essential to sustain Colorado’s way of life, preserve natural resources, grow our crops, and bolster our economy.

    Our State Water Plan Lacks Sustainable Funding

    The Colorado Water Plan, developed by the Colorado Water Conservation Board in 2015, sets forward a path to secure our water future by protecting Colorado’s rivers, securing clean, safe, reliable drinking water for our communities, and preserving our agricultural heritage.

    Colorado’s existing public funding resources are insufficient to address the current and future needs identified in the Water Plan to secure our water future. Establishing new sources of funding – whether local or statewide – will help to keep Colorado’s rivers healthy and flowing to continue to support clean drinking water for all Coloradans and reliable water supplies for farms and ranches across the state.

    In the last few years, Coloradans have illustrated their support for water funding by approving three different tax increases where water is the beneficiary. In 2019, the passing of Proposition DD legalized sports betting in Colorado with the majority of the proceeds of the betting taxes funding Colorado’s Water Plan. At the local level, both the Colorado River Water Conservation District and the St. Vrain and Left Hand Water Conservancy District successfully passed public funding initiatives to increase their mill levies in the fall of 2020, with other municipalities like the cities of Denver and Boulder and counties like Summit and Chaffee passing voter-approved funding for water and rivers in the last three years. Coloradans clearly understand the need for additional water funding and they are willing to pay for it.

    How (and Why) to Use This Guide

    The purpose of this guide is to assist water conservancy districts, nonprofits, local governments, citizen stakeholder initiatives and others in learning more about successfully implementing new local sources of public funding for water in Colorado. This guide is intended to help you understand the general process and important questions to ask when pursuing a public funding measure, such as a bond, property tax, sales tax, or mill levy increase. You will also see video interviews with individuals and organizations that have participated in public funding measures in Colorado, as well as with experts in the field of public funding.

    Area organizations protesting CDPHE selenium regulations — The Grand Junction Daily Sentinel

    Book Cliffs and Mt. Garfield (on right, approximate altitude 6,600′) in Mesa County, Colorado. By User Skez on en.wikipedia – Originally from en.wikipedia; description page is (was) here03:31, 2 March 2006 Skez 992×708 (137,232 bytes) (Near Grand Junction, CO Taken by Sean Davis http://flickr.com/photos/skez/32161524/), CC BY-SA 2.0, https://commons.wikimedia.org/w/index.php?curid=835434

    From The Grand Junction Daily Sentinel (Sam Klomhaus):

    A group of concerned Grand Valley organizations announced Wednesday they plan to appeal a decision by the Colorado Department of Public Health and Environment to implement total maximum daily levels of selenium and recoverable iron in watersheds north of the Colorado River in the Grand Valley.

    Selenium, recoverable iron and E. Coli are all “pollutants of concern” in the watershed, according to a CDPHE report on the total maximum daily levels.

    According to the report, elevated selenium levels can cause mortality, deformity and reproductive failure in fish and aquatic birds.

    The decision, which would affect 14 “washes” from the Government Highline Canal diversion to below Salt Creek, was announced Aug. 10. The appeal would stop the decision from being forwarded to the Environmental Protection Agency and formally implemented while the appeal process is ongoing.

    Mark Harris, general manager of the Grand Valley Water Users Association, said Wednesday he was “saddened and surprised” by the CDPHE’s decision, which he said ignored ongoing efforts to mitigate selenium levels in area water, as well as the amount of selenium that naturally occurs in area soils and gets washed into the watershed whenever it rains…

    Harris said that while protecting water quality is important, the amount of selenium reduction the CDPHE is requiring is impossible from a practical and cost standpoint.

    To comply with the regulations, Harris explained, the economic and physical landscape of the Grand Valley would have to change. The cost of complying with CDPHE’s proposed regulations would be borne by area governments and passed on to residents, Grand Junction Chamber of Commerce CEO Diane Schwenke said.

    Organizations supporting the appeal are Associated Members of Growth and Development, city of Fruita, city of Grand Junction, Mesa County Valley School District 51, Grand Junction Chamber of Commerce, Grand Valley Water Users Association, Housing and Building Association of Colorado, Mack airport, Mesa County, Orchard Mesa Irrigation District, Palisade Irrigation District and Western Colorado Contractors Association.

    The selenium in the soil is washed out of the Bookcliffs and into the watershed, Harris said, and mitigation efforts include lining irrigation canals and ditches to keep the selenium from leeching in.

    Harris said there has already been a lot of success reducing the selenium levels in the watershed since the 1970s and 80s, success he contends the CDPHE has ignored.

    Water ‘investment’ tough to define, may involve property rights — The #Sterling Journal-Advocate

    A lateral brings water from the Grand Valley Irrigation Company canal to this parcel of land, which is owned by private equity firm Water Asset Management, a company that has been accused of water speculation. A state work group has released its report on investment water speculation, but failed to come to a consensus and did not make recommendations to lawmakers.
    CREDIT: BETHANY BLITZ/ASPEN JOURNALISM

    From The Sterling Journal-Advocate (Jeff Rice):

    Trying to recommend ways to improve on Colorado’s anti-water speculation law is a tough job, primarily because the state’s constitution, statutes and legal precedence already do a good job of it.

    It doesn’t take much to set off alarms in Colorado’s water community, and in 2019 there were purchases of irrigated land by entities not normally associated with water use. According to water journalist Allen Best, “large, water-rich ranches in the Grand Valley on the West Slope by investment banks” tripped all kinds of alarms across the state. Of all the nightmares that keep Colorado water interests awake at night, water speculation is among the spookiest.

    During the 2020 legislative session, the General Assembly passed Senate Bill 20-048, which directed the director of the Colorado Department of Natural Resources to convene a working group to recommend ways to shore up the state’s protections against water speculation.

    Joe Frank, manager of the Lower South Platte Water Conservancy District, was named to the 22-member working group, which submitted its final report, titled “Report of the Work Group to Explore Ways to Strengthen Current Water Anti-Speculation Law,” last month on Aug. 13, just two days short of the deadline.

    Critics immediately denounced the report, saying it has little value because it doesn’t actually make any recommendations to the Legislature. In an interview with Best, Frank said there’s still work to be done before any new laws can be written.

    Talking last week with the Journal-Advocate, Frank said it’s going to be difficult to figure out ways to strengthen something that’s already quite strong.

    “We took it upon ourselves to define two types of water speculation,” Frank said. “There’s traditional speculation, which is already pretty well addressed. And then we defined what we call ‘investment water speculation,’ and that’s harder to get your hands around.”

    Under Colorado water law the water in Colorado is a public resource for beneficial use by public agencies, private persons and entities. A water right, which is owned, is created to use a portion of the public’s water resources, and is subject to water availability and under the terms specified by a water court. Those specifications — date of priority, physical location, and the amount that can be used by the water right – appear in what is called a decree.

    Cities own water rights and the infrastructure to deliver such rights, so people are purchasing water from the city even though water in Colorado is a public resource. Water rights are real property rights and can be sold and traded as long as it is continued to be put to beneficial use…

    According to Frank, about the only way to prevent “investment water speculation” is to define actions that prove intent, and that raises the specter of yet another agrarian nightmare; trampling on a property owner’s right to sell his property.

    “Is it the intent to come in and profit from the increased value of water?” Frank asked. “It has to do with point of sale and real property. But can you pass a law that says you can interfere with the market?”

    In other words, in order to prove intent, it would be necessary to examine and have some legal control over the sale of land and water rights. In theory, an investor from Manhattan could buy several irrigated farms, allow the water to be used for crops for a period of time while the dollar value of those shares increases, and then sell those shares to, say, a growing Denver suburb and pocket the profit.

    State Sen. Don Coram, who wrote SB 20-048, has gone on record saying he doesn’t want the state to get involved in curtailing property rights.

    Frank said there may be no easy way to write anti-speculation legislation, but rather it may take a series of smaller actions.

    “The over-arching issue that we have to solve is supply and demand,” Frank said. “When there’s more demand than supply, that drives up the price of water. Conservation and efficiency only go so far, and nobody is creating any more water.”

    New, hopeful future for cherished lake in #Colorado — The #ColoradoSprings Gazette

    Sweetwater Lake, Garfield County, Colorado. Photo credit: Todd Winslow Pierce with permission

    From The Colorado Springs Gazette (Seth Boster):

    A scenic lake in western Colorado is poised to become the public destination admirers have long envisioned.

    That’s after the announcement of Sweetwater Lake entering the U.S. Forest Service portfolio.

    A recent press release promised wildlife protection and new recreation access to the 488 acres in a remote pocket between Garfield and Eagle counties, backdropped by Flat Tops Wilderness. Previously, the shores had been privately held and feared to be in the crosshairs of development.

    “Save the Lake” was the fundraising campaign waged by Eagle Valley Land Trust. Last year, in partnership with The Conservation Fund, the lake was saved to the tune of $7.1 million.

    Now, thanks to millions of more dollars from the Land and Water Conservation Fund, Sweetwater Lake has been transferred to White River National Forest. After decades-long shortages, Congress’s move to fully restore that fund last summer was seen as critical for federal land managers to take control of the lake.

    Wildfire burn scars can intensify and even trigger thunderstorms, leading to catastrophic flooding – here’s how — The Conversation


    Parts of Lake Elsinore, California, were overrun with muddy floodwater after a storm hit the Holy Fire burn scar in 2018.
    Jennifer Cappuccio Maher/Digital First Media/Inland Valley Daily Bulletin via Getty Images

    William R. Cotton, Colorado State University

    Wildfires burn millions of acres of land every year, leaving changed landscapes that are prone to flooding. Less well known is that these already vulnerable regions can also intensify and in some cases initiate thunderstorms.

    Wildfire burn scars are often left with little vegetation and with a darker soil surface that tends to repel rather than absorb water. These changes in vegetation and soil properties leave the land more susceptible to flooding and erosion, so less rainfall is necessary to produce a devastating flood and debris flow than in an undisturbed environment.

    Burn scars can also initiate or invigorate thunderstorms, raising the risk both of flooding and of lightning that could spark more fires in surrounding areas, as my research with fellow atmospheric scientist Elizabeth Page has shown.

    Factors contributing to thunderstorms

    Three things contribute to the potential for burn scars to fuel thunderstorms: lack of vegetation, reduced soil moisture and lower surface albedo – essentially how well it reflects sunlight. When burned soil is darker, it absorbs more energy from the sun.

    These factors contribute to higher surface temperatures over the burn scar area relative to unburned areas nearby. The temperature difference can drive air currents, causing convection – the motion of warmer air rising and cooler air sinking. When that rising warm air draws in more humid air from surrounding areas, it can produce cumulonimbus clouds and even thunderstorms that can trigger rain and flooding.

    Fire officials explain how burned land becomes more flood prone.

    In an analysis of a flash flood that occurred on burn scars in Australia in 2003, scientists found that the soil’s moisture was low and its albedo in the burn area had fallen from 0.2 to 0.08. To put that into perspective, charcoal has an albedo of about 0.04 and fresh snow is nearly the maximum of 1. When the scientists simulated those changes in a computer model, they found that if the land hadn’t been burned, just over a tenth of an inch of rain would have fallen. Instead, those changes led to 1.25 inches and severe flooding.

    Studies have found that the intensity of this effect of burn scars on storm potential decreases over time, but the risk remains until the vegetation regrows.

    A view from an airplane of hillsides, some dark from burning, other still green, with roads winding through them.
    Burn scars from California wine country’s 2019 Kincade Fire are still evident in 2021.
    Jane Tyska/Digital First Media/East Bay Times via Getty Images

    Riding the thermals

    When I used to pilot sailplanes, also known as gliders, I often rode the thermals – upward currents of warm air – in the Santa Catalina Mountains near Tucson and in Colorado’s Front Range. The best locations for catching thermals were on the south and southwest slopes of rugged terrain, where the thermals became chutes of rapidly rising air.

    A wildfire in one of these locations would burn more intensely because of the swift air currents, leaving a dark, water-repelling surface with little vegetation behind. With moisture from the Southwest Monsoon that arrives in the region in late summer, these thermal chutes, intensified by burn scars, are prime locations for initiating or intensifying storm-producing cumulonimbus clouds and flooding.

    In these arid regions, plant recovery may take three to five years or more, particularly in locations where intense fires burned on south- and west-facing slopes where sunlight is more intense. Many of the record-breaking 2020 wildfires in Colorado and Arizona occurred in mountainous terrain where flash flooding on burn scars has been deadly in the past. These areas will continue to be of particular concern over the next few years.

    People search through damaged homes and vehicles, including an old truck nose down in the foundation of a home that's no longer there.
    Flooding and mud from heavy rain on a burn scar damaged homes in Manitou Springs, Colorado, in 2013. The region was hit with flooding again in 2021.
    Kathryn Scott Osler/The Denver Post via Getty Images

    The effects can linger

    How long burn scars will continue to fuel storms depends on how arid the region is and how quickly vegetation recovers.

    Forecasters, emergency responders and people living in and near wildfire burn scars need to be aware that these areas are at risk both for potential major flooding and debris flows, and for invigorated storms with a potential for heavy precipitation.

    [Get our best science, health and technology stories. Sign up for The Conversation’s science newsletter.]The Conversation

    William R. Cotton, Professor Emeritus of Meteorology, Colorado State University

    This article is republished from The Conversation under a Creative Commons license. Read the original article.

    Hurricane Ida: 2 reasons for its record-shattering rainfall in NYC and the Northeast long after the winds weakened — The Conversation #ActOnClimate


    Philadelphia’s Manayunk neighborhood was flooded by the remnants of Hurricane Ida.
    AP Images/Matt Rourke

    Russ Schumacher, Colorado State University

    Record downpours from Hurricane Ida overwhelmed cities across the Northeast on Sept. 1, 2021, hitting some with more than 3 inches of rain an hour. Water poured into subway stations in New York City, and streets flooded up to the rooftops of cars in Philadelphia. The storm had already wreaked havoc on the Gulf Coast after hitting Louisiana three days earlier as a Category 4 hurricane.

    Ida had weakened well below hurricane strength by the time it reached the Northeast, so how did it still cause so much rain?

    Two major factors likely contributed to its extended extreme rainfall.

    First, Ida’s tropical moisture interacted with developing warm and cold fronts.

    Second, evidence is mounting that, as the climate warms, the amount of precipitation from heavy rainstorms is increasing, especially in the central and eastern U.S.

    Map with 24-hour rainfall totals showing extreme rainfall from Pennsylvania to Massachusetts.
    Rainfall totals over 24 hours, Sept. 1-2, 2021.
    CoCoRaHS Mapping System, CC BY-ND

    From tropical to extratropical

    As hurricanes move northward from the tropics, they often transition from their characteristic circular shape to become “extratropical cyclones” with warm and cold fronts extending outward from the low pressure at the center. Even though they no longer have the intense winds that they did in the tropics, they still bring tropical humidity. That moist air is lifted along the fronts, and long-lasting, very heavy rain can result. That was happening as Ida’s remnants moved toward the Northeast.

    Weather forecasters saw the disaster coming.

    Forecasters emphasized the threat of flash flooding well ahead of its arrival, and the National Oceanic and Atmospheric Administration’s Weather Prediction Center issued a rare “high risk” of excessive rainfall outlook for parts of the Northeast a day in advance.

    The widespread, intense rainfall overwhelmed rivers and drainage systems in the highly populated corridor from Philadelphia to New York to Boston. That led to major flash flooding and at least 50 deaths in the region, in addition to at least 17 deaths earlier along the Gulf Coast. Newark, New Jersey, recorded 8.41 inches of rain, their most ever in a single day, shattering the old record by over 1.5 inches. Weather stations in New York City saw rain rates over 3 inches per hour. The extreme rainfall arrived with tornadoes in several states, including Maryland and New Jersey.

    Warmer climate, heavier rainfall

    Extreme rain and flash flooding aren’t new to the Northeast, and they often result from hurricanes or their remnants. The remains of Hurricanes Agnes (1972), Floyd (1999), Irene (2011), Lee (2011) and Sandy (2012), among others, all brought widespread rainfall and flooding through the area.

    Yet, heavy downpours are becoming more common in the region as the climate warms.

    The reasons are fairly simple: Warmer air can have more water vapor in it. With every 1 degree Celsius (1.8 F) increase in temperature, there can be about 7% more moisture in the air. This is formally known as the Clausius-Clapeyron relation.

    Because the amount of rain that a storm produces is closely connected to the amount of water vapor in the air, this means that, all else being equal, heavy downpours are more likely in a warmer climate. It explains why heavy rain occurs year-round in the tropics, whereas it is much more likely in summer than winter in the U.S.

    This is also why the intensity of rainfall is expected to increase as the climate warms. When weather patterns that bring together the ingredients for heavy rainfall, like hurricanes, occur in a warmer world, more moisture is available, and more rain falls. Unfortunately, this is not a linear process: A small bit of added moisture can lead to a lot more rain.

    The latest National Climate Assessment, in 2018, described a trend toward increasing precipitation in the Northeast and also warned that aging infrastructure in the region isn’t prepared to handle the water.

    Observed changes in heavy precipitation across the U.S., from the 4th National Climate Assessment. This figure shows four different metrics of heavy precipitation change. For example, the upper right panel shows that in the northeastern U.S., the amount of rain in the heaviest precipitation events increased by 55% from 1958-2016.
    4th National Climate Assessment

    Hurricanes are limited to certain areas, but extreme rainfall from other types of storms can occur just about anywhere – think of intense cloudbursts during the summer monsoon in the Desert Southwest, or organized thunderstorm systems like the one that caused deadly flooding in Tennessee in August 2021.

    Many communities are already highly vulnerable to the type of extreme precipitation that has been observed historically. Floods have always been a hazard, and intense rainfall can test the infrastructure even in places where it happens often. But as the climate changes, these risks will only increase further.

    This article was updated Sept. 3 with the Northeast death toll rising.

    [Over 100,000 readers rely on The Conversation’s newsletter to understand the world. Sign up today.]The Conversation

    Russ Schumacher, Associate Professor of Atmospheric Science and Colorado State Climatologist, Colorado State University

    This article is republished from The Conversation under a Creative Commons license. Read the original article.

    Assessing the U.S. #Climate in August 2021 — NOAA

    Courtesy of Pixabay.com

    From NOAA:

    During meteorological summer (June-August), the average temperature for the Lower 48 was 74.0°F, 2.6°F above average, nominally eclipsing the extreme heat of the Dust Bowl in 1936 by nearly 0.01°F and essentially tying 1936 for the warmest summer on record. A record 18.4 percent of the contiguous U.S. experienced record-warm temperatures for this season. For August, the contiguous U.S. average temperature was also 74.0°F, 1.9°F above the 20th-century average and ranked as the 14th-warmest August on record. For the year to date, the contiguous U.S. temperature was 55.6°F, 1.8°F above the 20th-century average, ranking 13th warmest in the January-August record.

    The summer precipitation total across the Lower 48 was 9.48 inches, 1.16 inches above average, ranking eighth wettest in the historical record. The August precipitation total for the contiguous U.S. was 3.09 inches, 0.47 inch above average, ranking 14th wettest in the 127-year period of record. The year-to-date precipitation total across the contiguous U.S. was 21.19 inches, 0.48 inch above the long-term average, ranking in the middle third of the January-August record.

    Devastating flash flooding and fatalities resulted from multiple events during August including Tropical Storm Fred in western North Carolina, convective flooding from a complex of storms across middle Tennessee, Hurricane Ida across Louisiana and portions of the Northeast in early September and from Tropical Storm Henri, also across parts of the Northeast. With 35 fatalities accounted for during August*, it was the deadliest month for flooding across the U.S. since Hurricane Harvey in 2017.

    Wildfires continued to spread across the western U.S. during August as the Dixie Fire in north-central California became the second-largest fire in the state’s history. The Caldor Fire also in California grew rapidly during August, threatening South Lake Tahoe communities. Air quality remained a concern across the U.S. as ash and fine particulates from the many wildfires obscured the skies.

    *The remnants of Hurricane Ida impacted the Northeast in early September, raising the 2021 fatality count outside of the August observation period.

    This monthly summary from NOAA National Centers for Environmental Information is part of the suite of climate services NOAA provides to government, business, academia and the public to support informed decision-making.

    August
    Temperature

  • August temperatures were above average across the West Coast, Southwest and from the Plains to the East Coast. Vermont and New Hampshire both had their warmest August on record while Maine and Massachusetts ranked second warmest. Much of the above-average warmth can be attributed to warm overnight temperatures. Temperatures were near to below average across much of the northern Rockies and the southern Plains.
  • The Alaska average August temperature was 49.4°F, 0.1°F below the long-term mean, ranking in the middle third of the 97-year period of record for the state. Temperatures were above average across portions of the Southeast Interior, Panhandle and Aleutian regions. Temperatures were cooler than average across the North Slope, Northeast Interior, northern West Coast and parts of Bristol Bay. A persistent cold low-pressure system over the northern Chukchi-Beaufort Seas during August contributed to the cooler-than-average temperatures and the largest observed sea ice extent over the Chukchi Sea since 2006.
  • Precipitation

  • Precipitation was above average across portions of the central and northern Rockies, the northern Plains, Great Lakes and from the Deep South to southern New England. Mississippi ranked fourth wettest while Tennessee had its fifth-wettest August on record. The Southwest monsoon continued to be active in August, eliminating much of the year-to-date precipitation deficit across the region. Tucson, Arizona, had its wettest August and second-wettest summer on record. Precipitation was below average across portions of the West, southern Rockies, central Plains, Midwest, northern Great Lakes and northern New England.
  • Statewide precipitation for Alaska was above average for August, but varied by region. Precipitation was below average across the Aleutians, Bristol Bay and Northwest Gulf regions while the interior regions, Northeast Gulf and Panhandle regions experienced above-average precipitation for the month.
  • According to the August 31 U.S. Drought Monitor report, approximately 46.6 percent of the contiguous U.S. was in drought, slightly more than the coverage at the beginning of August. Drought conditions expanded or intensified across the Northern Tier, the Pacific Northwest and portions of California. Drought coverage and/or intensity lessened across parts of the Four Corners region, the Midwest, Hawaii and Puerto Rico and was eliminated in Alaska.
  • An additional note on Hurricane Ida precipitation and temperature implications: As is typical with very heavy rainfall events, localized bands of very heavy rain may not be completely captured by the gauge-based observing network, which is the basis for this analysis. This circumstance can lead to an underrepresentation of actual rainfall totals. The issue can be compounded by disruptions to the observers’ ability to report values during or following a severe event and, in this case, several of our reporting stations posted missing data for both temperature and precipitation during this event. Additionally, quality assurance routines may flag large valid precipitation values as erroneous, resulting in underestimated values. NCEI is working to ensure all reports are indeed validated. As a result, a more complete accounting of the temperature statistics and precipitation across Louisiana during August will be available with the September report.

    Summer (June-August)
    Temperature

  • Summer temperatures were above average to record warmest from the West Coast to the Great Lakes and into the Northeast as well as across portions of the Mid-Atlantic and Gulf Coast. California, Nevada, Utah, Oregon and Idaho each reported their warmest June-August on record. Sixteen additional states had a top-five warmest summer on record. No state ranked below average for the summer season. Temperatures were below average across portions of the southern Plains and Southeast. Warm overnight temperatures heavily influenced the warm summer temperatures, especially across portions of the Southeast, where daytime temperatures were below average for the season.
  • The Alaska statewide average temperature for the summer was 51.4°F, 1.0°F above average and ranked in the warmest one-third of the 97-year record. Temperatures were warmer than average across much of the eastern half of the state as well as across the Aleutians and near average for much of the rest of the state.
  • Precipitation

  • Precipitation was above average across portions of the Great Basin and Southwest, from the southern Plains to the Great Lakes and across much of the eastern U.S. Mississippi had its wettest summer on record with Alabama, Michigan, New York and Massachusetts ranking among their five wettest summers on record. Precipitation was below average from the Northwest to the western Great Lakes and into the central Plains. Minnesota had its seventh-driest summer on record.
  • Precipitation in Alaska was above average across much of the northern half of the state as well as across portions of the Northeast Gulf and Panhandle regions. Precipitation was below average in the southwestern portion of the state. Kotzebue had its wettest summer on record, reporting 9.21 inches and besting the previous record, set in 1963, by nearly an inch. The wildfire season was well-below average with only 254,000 acres consumed — less than half of the median value.
  • Year-to-date (January-August)
    Temperature

  • Year-to-date temperatures were above average from the West Coast to the Great Lakes and into the Northeast as well as across parts of the Mid-Atlantic and Southeast. California and Maine each reported their third-warmest January-August on record. Sixteen additional states had a top-ten warmest year-to-date period. Temperatures were below average across much of the southern Plains and lower Mississippi Valley.
  • Year-to-date temperatures across Alaska were near average with above-average temperatures observed across the southwestern portion of the state. Much of the rest of the state experienced near average temperatures for this period.
  • Precipitation

  • January-August precipitation was above average from the Deep South to the Midwest, across the Southeast and portions of the Northeast. Mississippi had its third-wettest such year-to-date period on record. Precipitation was below average from the West Coast to the western Great Lakes and across portions of northern New England. Montana ranked fifth driest while three additional states ranked among the driest 10 January-August periods on record.
  • For Alaska, January-August precipitation was above average across the West Coast, North Slope and from the Central Interior to the Panhandle. Precipitation was below average in parts of the Cook Inlet region.
  • For more detailed climate information, check out our comprehensive August 2021 U.S. Climate report scheduled for release on September 14, 2021.

    The latest #ElNino/Southern Oscillation (#ENSO) discussion is hot off the presses from the #Climate Predication Center

    Click here to read the discussion:

    ENSO Alert System Status: La Niña Watch

    Synopsis: A transition from ENSO neutral to La Niña is favored in the next couple of months, with a 70-80% chance of La Niña during the Northern Hemisphere winter 2021-22.

    In the last month, ENSO-neutral continued with near-to-below average sea surface temperatures (SSTs) persisting in the central and eastern equatorial Pacific. In the last week, all of the Niña index values ranged from -0.2oC to -0.3oC. Negative subsurface temperature anomalies (averaged from 180-100oW) remained steady in August, reflecting below-average temperatures that extended from the surface to ~250m depth in the eastern Pacific Ocean. Low-level wind anomalies were easterly over the western Pacific Ocean, while upper-level wind anomalies were westerly over the western and east-centralPacific. Tropical convection was suppressed near and west of the Date Line and enhanced over Indonesia. Given these conditions, the ocean-atmosphere system reflected ENSO-neutral, but is edging toward La Niña.

    The IRI/CPC plume average of forecasts for the Niño-3.4 SST region from the last month favored borderline or weak La Niña during the fall and winter 2021-22. The forecaster consensus this month, however, favors the latest predictions from the NCEP CFSv2 and the North American Multi-Model Ensemble, which suggest higher chances for the emergence of La Niña. At this time, forecasters anticipate La Niña to be of weak strength (seasonal average Niño-3.4 index values between -0.5oC to – 0.9oC). In summary, a transition from ENSO-neutral to La Niña is favored in the next couple of months, with a 70-80% chance of La Niña during the Northern Hemisphere winter 2021-22 (click CPC/IRI consensus forecast for the chances in each 3-month period).

    Farmers restore native grasslands as groundwater disappears — The Associated Press

    The dry bed of the Arkansas River near the Santa Fe Trail crossing at Cimarron, Kansas. The Ogallala aquifer groundwater levels in much of western Kansas started dropping in the 1950s as pumping increased, according to the Kansas Geological Survey. File Photo / Max McCoy

    From The Associated Press (Tammy Webber):

    For decades, the Texas Panhandle was green with cotton, corn and wheat. Wells drew a thousand gallons (3,785 liters) a minute from the seemingly bottomless Ogallala aquifer, allowing farmers to thrive despite frequent dry spells and summer heat.

    But groundwater that sustained generations is drying up, creating another problem across the Southern plains: Without enough rain or groundwater for crops, soil can blow away — as it did during the Dust Bowl of the 1930s.

    “We wasted the hell out of the water,” says Muleshoe, Texas, farmer Tim Black, recalling how farmers irrigated when he was a kid. Water flooded furrows or sprayed in high arcs before farmers adopted more efficient center-pivot systems.

    His grandfather could reach water with a post-hole digger. Black is lucky to draw 50 gallons (189 liters) a minute from wells up to 400 feet (122 meters) deep.

    Now farmers are facing tough choices, especially in parts of Texas, New Mexico and Oklahoma.

    Some are growing less-thirsty crops or improving irrigation. Others, like Black, are replacing some cash crops with cattle and pastureland.

    And more are planting native grasses that go dormant during drought, while deep roots hold soil and green with the slightest rain…

    Black, a former corn farmer, plants native grasses on corners of his fields, as pasture for cattle and between rows of wheat and annual grass.

    The transition to cattle, he hopes, will allow his oldest son to stay on the land Black’s grandparents began plowing 100 years ago. His younger son is a data analyst near Dallas…

    More than half the currently irrigated land in portions of western Texas, eastern New Mexico and the Oklahoma Panhandle could be lost by the end of the century, according to a study last year. And the central part of the aquifer could lose up to 40% of irrigated area by 2100.

    Those losses might be slowed as farmers adapt to lower water levels, researchers say. But the projections underscore the need for planning and incentives in vulnerable areas.

    The U.S. Department of Agriculture is prioritizing grasslands conservation in a “Dust Bowl Zone” in parts of Colorado, Kansas, New Mexico, Oklahoma and Texas.

    But reestablishing native vegetation in the sandy soil over the Ogallala has proven difficult where irrigation ceased on former Kansas farmland. The same is true on land outside the Ogallala previously irrigated with river water, including in Colorado’s Arkansas River Valley.

    Extended periods of drought that plagued the Southwest over the past 20 years likely will continue, says meteorologist Brad Rippey with the USDA.

    So farmers may need to use some remaining groundwater to reestablish native grasses, says study co-author Meagan Schipanski, an associate professor of soil and crop sciences at Colorado State University.

    Historic photo of the High Plains in Haskell County, Kansas, showing a treeless semi-arid grassland and a buffalo wallow or circular depression in the level surface. (Photo by W.D. Johnson, 1897)

    USDA Expands Assistance to Cover Feed Transportation Costs for #Drought-Impacted Ranchers

    Photo credit: USDA

    Here’s the release from the USDA:

    In response to the severe drought conditions in the West and Great Plains, the U.S. Department of Agriculture (USDA) announced today its plans to help cover the cost of transporting feed for livestock that rely on grazing. USDA is updating the Emergency Assistance for Livestock, Honey Bees and Farm-raised Fish Program (ELAP) to immediately cover feed transportation costs for drought impacted ranchers. USDA’s Farm Service Agency (FSA) will provide more details and tools to help ranchers get ready to apply at their local USDA Service Center later this month.

    “USDA is currently determining how our disaster assistance programs can best help alleviate the significant economic, physical and emotional strain agriculture producers are experiencing due to drought conditions,” said Agriculture Secretary Tom Vilsack. “The duration and intensity of current drought conditions are merciless, and the impacts of this summer’s drought will be felt by producers for months to come. Today’s announcement is to provide relief as ranchers make fall and winter herd management decisions.”

    ELAP provides financial assistance to eligible producers of livestock, honeybees, and farm-raised fish for losses due to disease, certain adverse weather events or loss conditions as determined by the Secretary of Agriculture.

    ELAP already covers the cost of hauling water during drought, and this change will expand the program beginning in 2021 to cover feed transportation costs where grazing and hay resources have been depleted. This includes places where:

  • Drought intensity is D2 for eight consecutive weeks as indicated by the U.S. Drought Monitor;
  • Drought intensity is D3 or greater; or
  • USDA has determined a shortage of local or regional feed availability.
  • Cost share assistance will also be made available to cover eligible cost of treating hay or feed to prevent the spread of invasive pests like fire ants.

    Under the revised policy for feed transportation cost assistance, eligible ranchers will be reimbursed 60% of feed transportation costs above what would have been incurred in a normal year. Producers qualifying as underserved (socially disadvantaged, limited resource, beginning or military veteran) will be reimbursed for 90% of the feed transportation cost above what would have been incurred in a normal year.

    A national cost formula, as established by USDA, will be used to determine reimbursement costs which will not include the first 25 miles and distances exceeding 1,000 transportation miles. The calculation will also exclude the normal cost to transport hay or feed if the producer normally purchases some feed. For 2021, the initial cost formula of $6.60 per mile will be used (before the percentage is applied), but may be adjusted on a state or regional basis.

    To be eligible for ELAP assistance, livestock must be intended for grazing and producers must have incurred feed transportation costs on or after Jan. 1, 2021. Although producers will self-certify losses and expenses to FSA, producers are encouraged to maintain good records and retain receipts and related documentation in the event these documents are requested for review by the local FSA County Committee. The deadline to file an application for payment for the 2021 program year is Jan. 31, 2022.

    Additional USDA Drought Assistance

    USDA has authorized other flexibilities to help producers impacted by drought. USDA’s Risk Management Agency (RMA) extended deadlines for premium and administrative fee payments and deferred and waived the resulting interest accrual to help farmers and ranchers through widespread drought conditions in many parts of the nation. Additionally, RMA authorized emergency procedures to help streamline and accelerate the adjustment of losses and issuance of indemnity payments to crop insurance policyholders in impacted areas and updated policy to allow producers with crop insurance to hay, graze or chop cover crops at any time and still receive 100% of the prevented planting payment. This policy change supports use of cover crops, which improves soil health can help producers build resilience to drought.

    Meanwhile, USDA’s Natural Resources Conservation Service (NRCS) provides technical and financial assistance to improve irrigation efficiency and water storage in soil, helping producers build resilience to drought. In response to drought this year, NRCS targeted $41.8 million in Arizona, California, Colorado and Oregon through Conservation Incentive Contracts, a new option available through the Environmental Quality Incentives Program, focused on drought practices.

    USDA offers a comprehensive portfolio of disaster assistance programs. On farmers.gov, the Disaster Assistance Discovery Tool, Disaster Assistance-at-a-Glance fact sheet (PDF, 4.7 MB), and Farm Loan Discovery Tool can help producers and landowners determine all program or loan options available for disaster recovery assistance.

    Massive numbers of new #COVID19 infections, not vaccines, are the main driver of new coronavirus variants — The Conversation

    Vaughn Cooper, University of Pittsburgh and Lee Harrison, University of Pittsburgh

    The rise of coronavirus variants has highlighted the huge influence evolutionary biology has on daily life. But how mutations, random chance and natural selection produce variants is a complicated process, and there has been a lot of confusion about how and why new variants emerge.

    Until recently, the most famous example of rapid evolution was the story of the peppered moth. In the mid-1800s, factories in Manchester, England, began covering the moth’s habitat in soot, and the moth’s normal white coloring made them visible to predators. But some moths had a mutation that made them darker. Since they were better camouflaged in their new world, they could evade predators and reproduce more than their white counterparts.

    We are an evolutionary biologist and an infectious disease epidemiologist at the University of Pittsburgh who work together to track and control the evolution of pathogens. Over the past year and half, we’ve been closely following how the coronavirus has acquired different mutations around the world.

    It’s natural to wonder if highly effective COVID-19 vaccines are leading to the emergence of variants that evade the vaccine – like dark peppered moths evaded birds that hunted them. But with just under 40% of people in the world having received a dose of a vaccine – only 2% in low-income countries – and nearly a million new infections occurring globally every day, the emergence of new, more contagious variants, like delta, is being driven by uncontrolled transmission, not vaccines.

    A coronavirus cut open showing a strand of RNA.
    Coronaviruses use RNA to store information, and small changes in that genetic code can lead to new strains of the virus.
    Vchal/ iStock via Getty Images Plus

    How a virus mutates

    For any organism, including a virus, copying its genetic code is the essence of reproduction – but this process is often imperfect. Coronaviruses use RNA for their genetic information, and copying RNA is more error-prone than using DNA. Researchers have shown that when the coronavirus replicates, around 3% of new virus copies have a new, random error, otherwise known as a mutation.

    Each infection produces millions of viruses within a person’s body, leading to many mutated coronaviruses. However, the number of mutated viruses is dwarfed by the much larger number of viruses that are the same as the strain that started the infection.

    Nearly all of the mutations that occur are harmless glitches that don’t change how the virus works – and others in fact harm the virus. Some small fraction of changes may make the virus more infectious, but these mutants must also be lucky. To give rise to a new variant, it must successfully jump to a new person and replicate many copies.

    The bottleneck of transmission is what limits the ability of a new variant to infect another person.
    Vaughn Cooper via Biorender, CC BY-ND

    Transmission is the important bottleneck

    Most viruses in an infected person are genetically identical to the strain that started the infection. It is much more likely that one of these copies – not a rare mutation – gets passed on to someone else. Research has shown that almost no mutated viruses are transmitted from their original host to another person.

    And even if a new mutant causes an infection, the mutant viruses are usually outnumbered by non-mutant viruses in the new host and aren’t usually transmitted to the next person.

    The small odds of a mutant being transmitted is called the “population bottleneck.” The fact that it is only a small number of the viruses that start the next infection is the critical, random factor that limits the probability that new variants will arise. The birth of every new variant is a chance event involving a copying error and an unlikely transmission event. Out of the millions of coronavirus copies in an infected person, the odds are remote that a fitter mutant is among the few that spread to another person and become amplified into a new variant.

    A close up drawing of a large tower-like structure attaching to a small receptor on a cell.
    Mutations have changed the structure of the spike protein, seen in red, and made the coronavirus better able to infect cells using the ACE2 receptor, seen in blue.
    Juan Gaertner/Science Photo Library via Getty Images

    How do new variants emerge?

    Unfortunately, uncontrolled spread of a virus can overcome even the tightest bottlenecks. While most mutations have no effect on the virus, some can and have increased how contagious the coronavirus is. If a fast-spreading strain is able to cause a large number of COVID-19 cases somewhere, it will start to out-compete less contagious strains and generate a new variant – just like the delta variant did.

    Many researchers are studying which mutations lead to more transmissible versions of the coronavirus. It turns out that variants have tended to have many of the same mutations that increase the amount of virus an infected person produces. With more than a million new infections occurring every day and billions of people still unvaccinated, susceptible hosts are rarely in short supply. So, natural selection will favor mutations that can exploit all these unvaccinated people and make the coronavirus more transmissible.

    Under these circumstances, the best way to constrain the evolution of the coronavirus is to reduce the number of infections.

    Vaccines stop new variants

    The delta variant has spread around the globe, and the next variants are already on the rise. If the goal is to limit infections, vaccines are the answer.

    Even though vaccinated people can still get infected with the delta variant, they tend to experience shorter, milder infections than unvaccinated individuals. This greatly reduces the chances of any mutated virus – either one that makes the virus more transmissible or one that could allow it to get past immunity from vaccines – from jumping from one person to another.

    Eventually, when nearly everyone has some immunity to the coronavirus from vaccination, viruses that break through this immunity could gain a competitive advantage over other strains. It is theoretically possible that in this situation, natural selection will lead to variants that can infect and cause serious disease in vaccinated people.

    However, these mutants must still escape the population bottleneck. It is unlikely that vaccine-induced immunity will be the major player in variant emergence as long as there are lots of new infections occurring. It’s simply a numbers game, and for now, the modest benefit the virus would get from vaccine evasion is dwarfed by the vast opportunities to infect unvaccinated people.

    The world has already witnessed the relationship between the number of infections and the rise of mutants. The coronavirus remained essentially unchanged for months until the pandemic got out of control. With relatively few infections, the genetic code had limited opportunities to mutate. But as infection clusters exploded, the virus rolled the dice millions of times and some mutations produced fitter mutants.

    The best way to stop new variants is to stop their spread, and the answer to that is vaccination.

    [You need to understand the coronavirus pandemic, and we can help. Read The Conversation’s newsletter.]The Conversation

    Vaughn Cooper, Professor of Microbiology and Molecular Genetics, University of Pittsburgh and Lee Harrison, Professor of Epidemiology, Medicine, and Infectious Diseases and Microbiology, University of Pittsburgh

    This article is republished from The Conversation under a Creative Commons license. Read the original article.

    This week’s topsoil moisture short/very short by @usda_oce

    Good News, Bad News

    Good: Improvements in MN/IA and parts of the Northern/Central Plains after good rainfall

    Bad: WA is back to 100% short/very short. MT at 93%

    #Drought news: One class degradation in areas of Larimer, Weld, Boulder, Broomfield, Adams, Arapahoe, Jefferson, and #Denver counties

    Click on a thumbnail graphic to view a gallery of drought data from the US Drought Monitor.

    Click here to go to the US Drought Monitor website. Here’s an excerpt:

    This Week’s Drought Summary

    This U.S. Drought Monitor (USDM) week saw continued improvement in conditions across drought-stricken areas of the Central and Northern Plains states as well as in Iowa and Minnesota where light-to-moderate rainfall accumulations were observed. Despite recent precipitation in the Northern Plains, hay shortages and the associated costs of purchasing and transporting supplemental feed are forcing some ranchers to sell livestock. In response to the emerging situation, the U.S. Department of Agriculture (USDA) announced expansion of emergency assistance through the ELAP program to help cover feed transportation costs for drought-impacted ranchers. In the Northeast, the remnants of Hurricane Ida brought intense, heavy rains (5 to 10+ inches) and devastating flooding to areas of Pennsylvania, New Jersey, New York, and Connecticut. In the Southeast, short-term dryness (past 30- to 60-day period) and declining soil moisture and streamflow levels led to degradation on the map in portions of the Carolinas. In the South, short-term precipitation shortfalls and declining soil moisture levels led to some degradation of conditions in areas of Arkansas and Oklahoma that have largely missed out on recent rainfall events. Out West, dry conditions prevailed across most of the region this week. However, some beneficial rainfall was observed across isolated areas of the Southwest in association with the remnants of Hurricane Nora…

    High Plains

    On this week’s map, areas of the region—including eastern portions of North Dakota, South Dakota, Nebraska, and Kansas—saw isolated improvements in response to continued rainfall activity. The heaviest rainfall in the region was observed in eastern Kansas where accumulations ranged from 2 to 7 inches, while areas further to the north in Nebraska and the Dakotas received 1-to-4-inch accumulations in isolated areas. For the last 30-day period, the percentage of normal precipitation has ranged from 100 to 300% of normal across a widespread area of the Central and Northern Plains. However, isolated pockets of dryness have persisted—particularly in western portions of the region that have not benefited from the recent rainfall events. According to the USDA for the week ending September 5, the percentage of topsoil in North Dakota rated short to very short was 63%, while neighboring South Dakota was rated 66% short to very short…

    Colorado Drought Monitor one week change map ending September 7, 2021.

    West

    For the week, most of the region continued to experience dry conditions, although some residual moisture from Hurricane Nora worked its way into the Southwest leading to some isolated shower activity. On this week’s map, improvements were made in isolated areas of Arizona, New Mexico, and Utah where recent monsoonal rainfall has continued to improve drought conditions on a shorter-term basis. For the monsoon season (to date), some impressive rainfall totals have been observed in areas of southern and central Arizona and New Mexico as well as in areas of Utah. In Arizona, Tucson is currently having its 3rd wettest monsoon season on record with 12.41 inches (as of September 7), Flagstaff 10.35 inches (4th wettest), Payson 13.06 inches (2nd wettest), and Las Cruces, New Mexico 5.06 inches (3rd wettest). Elsewhere in the region, much of California, western Great Basin, Pacific Northwest, and the Northern Rockies have experienced drier-than-normal conditions during the past 90-day period. In Washington, drought and associated precipitation deficits dating back to the springtime, combined with extreme summer heat, have severely impacted the state’s wheat crop which is reportedly had its lowest output since 1973. According to the USDA, the percentage of topsoil rated short to very is as follows: Washington 100%, Oregon 89%, Idaho 75%, Montana 93%, Wyoming 70%, and California 85%. According to the Natural Resources Conservation Service (Sept 1), reservoir storage levels were below normal across all the western states except for Washington state (data not yet available for Montana)…

    South

    After the passing of Hurricane Ida, the region experienced some drying out this week as compared to the previous week’s deluge. For the past 30-day period, above-normal precipitation levels (130 to 300% of normal) have been observed across southeastern Louisiana, Mississippi, and much of Tennessee. Conversely, precipitation has been below normal across much of Arkansas, Texas, and Oklahoma during the past month, leading to expansion of areas of Abnormally Dry (D0). This includes around Tulsa, Oklahoma, which observed only 0.85 inches (normal 3.64 inches) for the month of August and no precipitation to date for September. Elsewhere, some minor improvements were made in an area of Moderate Drought (D1) in the Trans-Pecos region in the vicinity of Big Bend National Park where the Chisos Basin observing station reported 10.42 inches of rain (340% of normal) for the month of August. Likewise, the Pine Springs Guadalupe National Park observing station in the Trans-Pecos logged 8.98 inches (560% of normal) during August 2021. For the week, average temperatures were above normal (3 to 9 deg F) across Texas, Oklahoma, and western portions of Louisiana and Arkansas while areas to the east were 1 to 6 deg F below normal…

    Looking Ahead

    The NWS WPC 7-Day Quantitative Precipitation Forecast (QPF) calls for moderate-to-heavy rainfall accumulations ranging from 2 to 5+ inches along the Gulf Coast of Texas, Louisiana, Florida Panhandle, and areas of southern Georgia. Across the Mid-Atlantic and the Northeast, light rainfall accumulations (generally < 1 inch) are expected; except for coastal areas of Massachusetts and Maine where accumulations of approximately 2 inches are predicted. In the Midwest, light precipitation accumulations (generally < 1 inch) are forecasted across the eastern half of the region, while areas in the western extent will be drier over the coming week. From the Plains to the West Coast, mainly dry conditions will prevail with the exception of areas of isolated, light precipitation possible across the Central and Southern Rockies and the northern Great Basin, while slightly greater accumulations (generally around 1 inch) are expected in the Northern Rockies. The CPC 6-10-day Outlooks are for a moderate-to-high probability of above-normal temperatures across the northern half of the conterminous United States as well as along the Eastern Seaboard extending into New England. Across much of the Pacific Northwest, North Dakota, and the Upper Midwest, normal temperatures are expected. In terms of precipitation, there is a low-to-moderate probability of above-normal precipitation across New England, the Midwest, the South, and the eastern half of Texas. Below-normal precipitation is expected across most of the Western U.S.

    US Drought Monitor one week change map ending September 7, 2021.

    Just for grins, here’s a gallery of early September US Drought Monitor maps for the past several years.

    This slideshow requires JavaScript.

    Reporting on the State of the #Climate in 2020 — NOAA

    Global surface temperature each year compared to the 1981-2010 average from three datasets: NOAA (red line), NASA (orange), and University of East Anglia (pink). The background image from the NOAA DISCOVR/EPIC mission shows Hurricane Laura coming ashore in Louisiana on August 26, 2020. Image by NOAA Climate.gov, adapted from State of the Climate in 2020. [Correction (08-25-21): The original version of this graphic and the caption indicated the temperature data were compared to the 20th-century average. They are compared to the 1981-2010 average.]
    From NOAA (Jessica Blunden):

    A new State of the Climate report confirmed that 2020 was among the three warmest years in records dating to the mid-1800s, even with a cooling La Niña influence in the second half of the year. New high temperature records were set across the globe. The report found that the major indicators of climate change continued to reflect trends consistent with a warming planet. Several markers such as sea level, ocean heat content, and permafrost once again broke records set just one year prior. Notably, carbon dioxide (CO2) levels in the atmosphere also reached record highs in 2020, even with an estimated 6%–7% reduction of CO2 emissions due to the economic slowdown from the global pandemic.

    These key findings and others are available from the State of the Climate in 2020 report released online today [August 25, 2021] by the American Meteorological Society (AMS).

    Click here to read the report.

    The 31st annual issuance of the report, led by NOAA National Centers for Environmental Information, is based on contributions from more than 530 scientists from over 60 countries around the world and reflects tens of thousands of measurements from multiple independent datasets (full report). It provides a detailed update on global climate indicators, notable weather events and other data collected by environmental monitoring stations and instruments located on land, water, ice and in space.

    The report’s climate indicators show patterns, changes and trends of the global climate system. Examples of the indicators include various types of greenhouse gases; temperatures throughout the atmosphere, ocean, and land; cloud cover; sea level; ocean salinity; sea ice extent and snow cover.

    Report highlights include these indications of a warming planet:

    • Greenhouse gases were the highest on record. As they do each year, and again in the midst of a global pandemic that slowed economic activity around the world, the major greenhouse gas concentrations, including CO2, methane (CH4) and nitrous oxide, rose to new record high values during 2020. The global annual average atmospheric CO2 concentration was 412.5 parts per million.
      Atmospheric carbon dioxide concentrations (CO2) in parts per million (ppm) for the past 800,000 years. On the geologic time scale, the increase to today’s levels (orange dashed line) looks virtually instantaneous. Graph by NOAA Climate.gov based on data from Lüthi et al., 2008, via the NOAA NCEI Paleoclimatology Program.

      This was 2.5 parts per million greater than 2019 amounts and was the highest in the modern 62-year measurement record and in ice core records dating back as far as 800,000 years. The year over year increase of methane (14.8 parts per billion) was the highest such increase since systematic measurements began.

    • Global surface temperature was near-record high. Annual global surface temperatures were 0.97°–1.12°F (0.54°–0.62°C above the 1981–2010 average, depending upon the dataset used). This places 2020 among the three warmest years since records began in the mid- to late 1800s.
      The graph shows average annual global temperatures since 1880 (source data) compared to the long-term average (1901-2000). The zero line represents the long-term average temperature for the whole planet; blue and red bars show the difference above or below average for each year. (These data were among the sources of data used in the State of the Climate in 2020’s temperature analysis, but here are compared to the 20th-century average. In the report, they are compared to the 1981-2010 average.)

      This was the warmest year on record without the presence of El Niño. The seven warmest years on record have all occurred in the past seven years, since 2014. The global average surface temperature has increased at an average rate of 0.14°F (0.08°C) per decade since the start of the record; since 1981, the rate of increase has been more than twice as high.

    • Upper atmospheric temperatures were record or near-record setting. In the region of the atmosphere just above Earth’s surface, the globally averaged annual lower troposphere temperature equaled the record high of 2016. In the layer above that, the lower stratosphere temperature continued to decline, as expected in a warming world.
    • Sea surface temperatures were near-record high. The globally averaged 2020 sea surface temperature was the third highest on record, surpassed only by 2016 and 2019, both of which were associated with El Niño conditions.
    • Global upper ocean heat content was record high. Globally, upper ocean heat content reached record highs in 2020 in the upper layer measured from the surface to 2,300 feet (700 meters), according to four of the five datasets analyzed in the report. This record heat reflects the continuing accumulation of thermal energy in the top 2,300 feet of the ocean.
    This map shows heat content anomalies—differences from the long-term average—in the top 700 meters (~2,100 feet) of the global ocean. Positive anomalies mean the ocean gained heat in 2020 (orange); negative anomalies mean the ocean lost heat energy (blue) in 2020. NOAA Climate.gov image, based on data provided by John Lyman.

    Ocean heat content was also record high in the deeper layer beneath, from 700 to 2,000 meter depth, according to all five datasets. Oceans absorb more than 90% of Earth’s excess heat from global warming. The warmer upper ocean waters can drive stronger hurricanes and increase melting rates of ice sheet glaciers around Greenland and Antarctica.

    • Global sea level was highest on record. For the ninth consecutive year, global average sea level rose to a new record high and was about 3.6 inches (91.3 millimeter) higher than the 1993 average, the year that marks the beginning of the satellite altimeter record.
    Increase in global mean sea level based on satellite altimeter data. NOAA Climate.gov, adapted from Figure 3.15a in State of the Climate in 2020.

    Global sea level is rising at an average rate of 1.2 inches (3.0 centimeter) per decade due to changes in climate. Melting of glaciers and ice sheets, along with warming oceans, account for the trend in rising global mean sea level.

    Change in sea level since the 1993. Blue indicates places where sea level has increased by up to 20 centimeters (8 inches); brown indicates places where sea level has dropped by the same amount. NOAA Climate.gov image, based on data from P. Thompson, UHSLC.
    • Oceans absorbed a record amount of CO2. The ocean absorbed about 3.0 billion metric tons more CO2 than it released in 2020. This is the highest amount since the start of the record in 1982 and almost 30% higher than the average of the past two decades. More CO2 stored in the ocean means less remains in the atmosphere, but this also leads to increasing acidification of the waters, which can greatly harm or shift ecosystems.

    The report also documents key regional climate and climate-related events.

    • The Arctic continued to warm; minimum sea ice extent was near-record low. The annual mean surface air temperature for the Arctic land areas was the highest in the 121-year record, at 3.8°F (2.1°C) above the 1981–2010 average. This was the seventh straight year with an annual temperature more than 1°C higher than the 1981–2010 average. On June 20, a temperature of 38°C was observed at Verkhoyansk, Russia (67.6°N), provisionally the highest temperature ever measured within the Arctic Circle. The Arctic continues to warm at a faster pace than lower latitudes. With the warmth came fires. The Arctic experienced its highest fire year in terms of the amount of carbon released into the atmosphere, surpassing the record set in 2019 by 34%. The majority of the fires occurred in northeastern Siberia where abnormally high temperatures also occurred.
    At the annual maximum ice extent in March 2020, only 2% of the Arctic ice cover consisted of old, thick ice (white). Most of the ice cover consist of ice that was less than a year old—i.e. seasonal ice that doesn’t survive the summer. NOAA Climate.gov image, based on data from the National Snow and Ice Data Center.

    In March, when sea ice reached its annual maximum extent, thin, first-year ice comprised ~70% of the ice; the thickest ice—usually more than four years old—had declined by more than 86% since 1985 to make up just 2% of total ice in 2020. When the minimum sea ice extent was reached in September, it was the second smallest in the 42-year satellite record, behind 2012.

    Sea ice concentration across the Arctic Ocean on September 15, 2021, the day of the summer minimum. The yellow line shows the median extent (middle value) of the ice cover between 1981 and 2020. NOAA Climate.gov image based on data from the National Snow and Ice Data Center.

    The Northern Sea Route along the Siberian coast was open for about 2.5 months, from late July through mid-October, compared to less than a month typically.

    • Antarctica saw extreme heat and a record-long ozone hole. Extreme warmth was observed across parts of Antarctica during austral summer, contributing to a major heat wave. On February 6, Esperanza Station reached 64.9°F (18.3°C), the highest temperature ever recorded on the continent, surpassing the previous record set in 2015 by 2.0°F (1.1°C). The warmth also led to the largest late-summer surface melt event in the 43-year record, affecting more than 50% of the Antarctic Peninsula and impacting elevations as high as 1,700 meters.Later in the year, the Antarctic polar vortex was unusually strong and persistent, with polar temperatures in the stratosphere at record low levels throughout November and December. This strong vortex was linked to the longest-lived ozone hole over the Antarctic region, which lasted to the end of December. Record-low ozone values in late austral spring and early summer led to unusually high levels of UV radiation across the Antarctic region.
    Ozone concentration over Antarctica the week of September 14–20, 2020. To allow comparisons from year to year, experts define the “ozone hole” as the area in which ozone levels are below 220 Dobson Units (dark blue, marked with black triangle on color bar). NOAA Climate.gov image, based on TOAST data from the NOAA Environmental Visualization Lab.
    • Tropical cyclones were well-above average overall. There were 102 named tropical storms during the Northern and Southern Hemisphere storm seasons, well above the 1981–2010 average of 85. Three tropical cyclones reached Saffir–Simpson scale Category 5 intensity. The North Atlantic hurricane basin recorded a record 30 named storms, surpassing the previous record of 28 in 2005. Seven of those storms became major hurricanes, matching 2005 for a record number. Major Hurricanes Eta and Iota made landfall along the eastern coast of Nicaragua in nearly the same location within a two-week period, impacting over seven million people across Central America. In the western North Pacific, Super Typhoon Goni was the strongest tropical cyclone to make landfall in the historical record and led to the evacuation of almost one million people in the Philippines. Very Severe Cyclonic Storm Gati made landfall over Somalia, the first storm of such intensity to do so.

    Geographical Regional Highlights

    North America

  • Mexico reported its warmest year in its 49-year record, tied with 2017 and 2019.
  • The contiguous United States reported its fifth-warmest year. Alaska reported its coolest year since 2012, although it was still warmer than its 1981–2010 average. The annual temperature for Alaska has increased at an average rate of 0.50°C per decade over the past half century.
  • Most of Mexico was drier than average in 2020 due to the late onset of a weak North American Monsoon and a lack of tropical cyclones on the Pacific side. The United States was dominated by warm, dry air in the West and an active storm track that brought wet conditions to much of the East. In Canada, the Avalon Peninsula in Newfoundland was hit by a strong blizzard with hurricane force winds in January. The storm contributed to the snowiest January on record for Saint John’s.
  • Central America and the Caribbean

  • The annual average temperature over the Caribbean basin was the second highest since the start of the record in 1891. Annual average maximum temperatures were record high for stations in The Bahamas, Dominica, and Trinidad and Tobago.
  • Powerful Category 4 Hurricanes Eta and Iota impacted Central America in November, making landfall along the eastern coast of Nicaragua in nearly the same location within a two-week period.
  • South America

  • Most of South America had above-average temperatures during the year. Central South America reported its second-warmest year for the region in its 61-year record, behind only 2015. During a strong heat wave in October, the city of São Paulo, Brazil, recorded four of its five all-time daily maximum temperatures.
  • The Bolivian lowlands suffered one of its most severe droughts on record during autumn. Drought also spanned the Chaco and Pantanal in Bolivia, Paraguay and southern Brazil. The Paraguay River shrank to its lowest levels in half a century. A decadal “mega drought” in south-central Chile continued through its 11th year, with extreme conditions in the most populated areas. Argentina reported its driest year since 1995.
  • Africa

  • Seychelles, an archipelago in the Indian Ocean off East Africa, observed its highest annual temperature in the record dating to 1972. In West Africa, Nuguru, Nigeria, observed about 80 days of maximum temperatures exceeding 104°F (40°C) in 2020, surpassing its previous record of 77 days in 2019.
  • Extremely heavy rains in April triggered widespread flooding and landslides in Ethiopia, Somalia, Rwanda and Burundi. The Lake Victoria region was the wettest in its 40-year record, and the lake itself rose more than three feet (one meter) due to the excessive rain.
  • Europe

  • The year 2020 was the warmest year on record for Europe, with all five of the warmest years occurring since 2014. Record warmth was reported for Belarus, Belgium, European Russia, Estonia, Finland, France, Kazakhstan, Lithuania, Luxembourg, the Netherlands, Norway, Poland, Spain, Sweden, Switzerland and Ukraine.
  • In February, almost all areas in Europe observed temperatures more than 5°F (3°C) higher than average. Biarritz in southern France reached a temperature of 80.0°F (26.6°C), which is higher than the monthly average for July and August.
  • The Middle East experienced an extreme drought during autumn, with most places reporting 0%–20% of their typical precipitation in September and no precipitation at all in October.
  • Asia

  • In 2020, Japan and Russia each observed their highest annual temperature on record. In northern Siberia, annual temperatures were more than 9°F (5°C) above average across vast territories. The average winter temperature for all of Russia was 5°C above normal. In East Asia, Hong Kong, China, reported 50 hot nights, where the daily minimum temperature did not dip below 82.4°F (28.0°C), and 47 very hot days, where the daily maximum temperature reached at least 91.4°F (33.0°C), both of which set new annual records.
  • The 2020 Southwest Asian Monsoon season (June–September) was the wettest since 1981, coincident with the emergence of La Niña. The Meiyu season (July–August), a typical rainy season over the Yangtze and Huaihe River Valleys of China, doubled its typical duration by two months in 2020. The May–October total rainfall averaged over the area was the most since the start of the record in 1961. Associated severe flooding affected about 45.5 million people.
  • As is typical, several tropical cyclones impacted Asia in 2020. Super Typhoon Goni was the strongest storm on record anywhere in the world to make landfall. More than one million people were evacuated from its path in the Philippines. Eight tropical cyclones directly affected Vietnam. Typhoon Molave was one of the most intense storms to reach the country in the past 20 years.
  • Oceania

  • Most locations across Micronesia were drier than average during the first half of 2020 and wetter than average at all locations in the second half. For the year, Kosrae was record wet, while Kapingamarangi and Saipan observed near-record low annual rainfall totals.
  • The last days of 2019 and first days of 2020 saw particularly hazardous fire weather in eastern Australia, where multiple fires had been burning since austral spring 2019. The emergence of La Niña was a welcome change for the Australian region, with this phase of ENSO contributing to increased rainfall over the continent, after a very significant 2019/20 fire season. Even with increased rainfall, this was Australia’s fourth-warmest year in its 111-year record. Both November and spring as a whole had record high temperatures.
  • Aotearoa, New Zealand, reported its seventh-warmest year since records began in 1909, in part due to its warmest winter on record. La Niña conditions contributed to higher temperatures in the latter part of the year. From late-December 2019 through February 2020, several areas across New Zealand observed record or near-record dry spells, that is, at least 15 consecutive days with less than one millimeter of rain each day. A 64-day dry spell, the longest on record, was reported in Blenheim, a town on the northern tip of the South Island.
  • The State of the Climate in 2020 is the 31st edition in a peer-reviewed series published annually as a special supplement to the Bulletin of the American Meteorological Society. The journal makes the full report openly available online.

    How Adding Rock Dust to Soil Can Help Get #Carbon into the Ground — Yale Environment 360 #ActOnClimate

    Basalt is spread on the Leverhulme Centre for Climate Change Mitigation’s research cornfields in Illinois. JORDAN GOEBIG

    From Yale Environment 360 (Susan Cosier):

    Researchers are finding that when pulverized rock is applied to agricultural fields, the soil pulls far more carbon from the air and crop yields increase. More studies are underway, but some scientists say this method shows significant benefits for farmers and the climate.

    On a hot and humid August day near Geneva, New York, Garrett Boudinot stands in a field of hemp, the green stalks towering a foot or more over his 6-foot, 4-inch frame. Today, the mustached Cornell University research assistant will harvest six acres of the crop, weigh it in red plastic garbage bins, and continue to analyze the hundreds of water samples taken with measuring devices called lysimeters that have been buried in the field over the last three months.

    Boudinot, part of a research team at Cornell University, will sweat through the next two days of field work to see whether an unusual component added to the soil earlier in the year helped increase yields and sequester carbon. This soil amendment “we just call lovingly ‘rock dust,’ which isn’t very descriptive,” says Boudinot. “But it’s really silicate rocks that have been pulverized to a fine powder.”

    The hemp field trial is just one of the projects being led by Ben Houlton, dean of Cornell’s College of Agriculture and Life Sciences. For the last two years, he and colleagues at the Working Lands Innovation Center, a research consortium based at the University of California, Davis, have been testing various soil amendments that grab carbon from the air and trap it below ground. They’ve tested biochar, manure, and rock dust used on the New York land and California farm plots, and so far, the most effective soil treatment is basalt pulverized into dust.

    “As far as I can tell,” says Houlton, “ours is the largest-scale project of its kind, using this intensive sort of scientific approach.”

    The hemp field experiments go beyond testing which amendments increase yields and sequester carbon and examine how much rock dust should be applied for best results. Some sections got 20 tons of rock dust per acre, while others got 40, allowing the researchers to get a more fine-tuned picture of the relationship between the dust, the soil, and the crops. The research adds to a growing body of scientific work showing the potential for these soil amendments to become one of the many measures needed to help solve our climate crisis.

    Agriculture accounts for nearly a quarter of the world’s carbon dioxide emissions, making the farming sector an important part of efforts to reach net zero by 2050 and limit global warming to 1.5 degrees Celsius, an increase scientists warn the world should not surpass if we want to avert some of the more drastic consequences of climate change. To help reduce carbon in the atmosphere, scientists once proposed seeding the oceans with iron. That tactic was criticized as environmentally damaging and ineffective and has not gained widespread acceptance. But seeding soils with carbon-capturing rock dust could.

    In addition to Houlton, scientists from the United Kingdom to Canada are testing various soil amendments on agricultural lands, assessing how much carbon they sequester through a process called enhanced weathering. While Houlton’s researchers apply basalt to hemp in New York and to alfalfa and olive trees in California, scientists working with the University of Sheffield’s Leverhulme Centre for Climate Change Mitigation in the U.K. are spreading basalt on cornfields in Illinois and on sugarcane in Australia. In Ontario, Canada, researchers are applying wollastonite from a nearby mine on soybean and alfalfa fields.

    esearcher Zack Kozma gathers a water sample from a field where rock dust has been added to the soil at Cornell’s AgriTech Agricultural Experiment Station. Photo credit: GARRETT BOUDINOT
    A clump of soil containing rock dust. Photo credit: SOPHIE NASRALLAH

    According to the U.N. Intergovernmental Panel on Climate Change (IPCC), rocks naturally remove 1 gigaton (1 billion tons) of carbon dioxide a year from the atmosphere (a number that has changed over time). Adding rock dust to agricultural lands speeds up the chemical reactions that lock carbon up — for thousands of years — in soil. If applied to croplands globally, rock dust could theoretically help suck an estimated 2 to 4 billion tons of carbon dioxide from the air every year, between 34 and 68 percent of the global greenhouse gas emissions produced by agriculture annually. And though treating so much land might be unrealistic, the process has the potential to scale up quickly because rock dust isn’t in short supply and farmers don’t need to purchase new gear to apply it: They’ve already got fertilizer-spreading equipment in their barns.

    “This is an incredibly exciting technology that has a lot of wins for society and, frankly, we could deploy this very quickly,” says Houlton.

    Basalt, the additive being used in the Cornell project, is a byproduct of mining and manufacturing operations and is found all over the world. Some estimates show that there’s enough basalt rock dust stockpiled to treat the planet’s croplands for several years.

    “Rock extraction is one of the largest things we do as a species,” says Phil Renforth, an engineer at Heriot-Watt University in Edinburgh, who works on carbon capture. “By mass we do more than twice as much rock extraction as we do food production.”

    Basalt contains magnesium, calcium, and silica, among other components. When the rock is pulverized and applied to soils, magnesium and calcium are released from the silica and dissolve in water as it moves through the soil. The minerals in the soil react with the water and carbon that would otherwise go back into the atmosphere, forming bicarbonates, which can hang around in water for thousands of years, eventually making their way to the oceans where they can precipitate out as limestone and stay on the seafloor for millions of years.

    Different amendments result in slightly different chemical reactions in the soils, and the soils provide various conditions, such as different pHs. Some amendments, like wollastonite, may be better at sequestering carbon but aren’t as abundant. Others may contain heavy metals, which can harm crops and groundwater. “There’s the chemistry of the rock; there’s the availability of the rock; and then there’s the carbon benefits of the material, as well as the potential for what I would call ‘negative consequences’ to emerge,” says Houlton.

    The varied lands on which crops are grown require a number of field trials to assess how much more carbon stays in the soil, but the results are encouraging. On plots in California, initial results show a doubling of carbon uptake. That’s surprising, says Houlton, considering that the crops were grown under the driest conditions in the state’s history.

    ock dust applied to an experimental field at the University of California, Davis. Photo credit: IRIS HOLZER

    Leverhulme Centre director David Beerling, who is five years into a decade-long effort to investigate enhanced weathering on croplands, published a paper last year in Nature that demonstrated the potential of the method. He and colleagues found that if China, India, and the United States applied rock dust to all of their agricultural lands, 1 billion tons of carbon dioxide could be removed from the atmosphere.

    The research results so far are significant enough that the IPCC mentioned enhanced weathering in its most recent report, listing the method of spreading ground-up rocks on soils as a way to capture more carbon and stimulate cropland productivity.

    But scientists are still weighing the costs and benefits of such applications, including the expense of transporting the material and better calculating the carbon storage and crop yield benefits. Researchers may have more data to draw on soon: Results of much larger trials by Houlton and Beerling could be published as soon as next year.

    Rock dust applications could benefit more than just the climate — they could help farmers, too. Field tests on corn and alfalfa show increases in crop yields thanks to rock dust, which releases other essential nutrients like phosphorous and potassium. In some cases, yields are 30 percent higher, results that could entice farmers looking to decrease inputs while increasing harvest. Initial weight measurements show potentially higher yields on the hemp fields in New York as well.

    The rock dust may also affect the nitrogen cycle, Beerling points out, ultimately allowing farmers to apply less nitrogen fertilizer. That could lead to fewer nutrient pollution issues, especially in Corn Belt states where runoff drains into the Mississippi watershed and down into the Gulf of Mexico. Beerling and researchers are currently working on a map of available basalt and crops on which it could be applied in 13 states in the Midwest.

    Reducing atmospheric carbon doesn’t yet provide an income stream to farmers, although incentivizing “carbon farming” has been floated by the Biden administration. Both Houlton and Beerling are looking to quantify exactly how much carbon a crop can capture so that if a market does come to fruition, farmers could be paid for the amount of carbon they sequester.

    To accomplish that, Boudinot is looking at the soil water chemistry from the hemp fields to see how much bicarbonate formed at a foot below the surface. That data, along with information from the experimental plots in California and results from the first five years of research led by the Leverhulme Centre, could provide critical evidence for the farming community.

    “What do you think of a carbon dioxide removal technology that reuses waste rock dust, captures carbon, improves soils, restore soils, and improves yields?” asks Beerling. “It’s a no-brainer, at least in the short term, if you’ve got this material and the evidence stacks up. Why wouldn’t you do it?”

    This story was produced in collaboration with the Food & Environment Reporting Network, a nonprofit investigative news organization.

    Forty Years Ago, Xeriscaping Started Changing the Landscape of #Denver — Westword

    Xeriscape landscape

    From Westword (Claire Duncombe):

    Liz Gardener remembers how some people worried that a new water-saving landscaping concept could alter Denver’s image as the Emerald City of the Plains. “We have to keep it green,” they warned.

    The concept “is green,” replied Gardener, a former Denver Water conservation officer who so enjoyed gardening that she’d changed her name to reflect that passion. “But it’s also red and yellow and purple.”

    Spurred by the droughts of the late 1970s, a task force led by Denver Water employees had set out to create a new kind of gardening, one that would counteract the effects of a growing population on Denver’s water supply. One novel idea was a landscaping technique that prioritizes water conservation.

    In 1981, Denver Water adopted the concept and named it “xeriscape landscaping,” or xeriscaping.

    “Nancy [Leavitt] came up with the term,” Gardener recalls. “She had a background in botany and biology, and she knew about xeros.” The Greek word means “dry,” and Leavitt thought to combine it with “scape.” But others immediately said, “People are going to hate that word,” she remembers. They worried that “xeri,” similar to “zero” in pronunciation, would be equated only with rocks and cacti — gardens that didn’t need water at all.

    People don’t always see the connection between water supply and water demand, Gardener continues. And they often have different perceptions of what makes a beautiful garden — especially if they previously lived in lush places that receive more than Denver’s 14.5 inches of rain a year.

    But over the past forty years, xeriscaping has inspired a cultural shift in Colorado. The practice has become part of the city’s ecosystem, enshrined in ordinances and included in planning documents, and can be credited with helping decrease Denver water usage even as the city’s population has exploded over the past four decades.

    Xeriscape was not an easy sell in the early days, however, and its confusing name was only part of the problem…

    Xeriscape has served as “a powerful teaching methodology,” says Kelaidis. It illustrates how thoughtful planning can conserve water, which leads to conversations about where the water comes from and why it’s important to be prudent with its use…

    The seven principles of xeriscape take into consideration how a garden might most efficiently use water. For example, families may choose to keep a portion of their yard covered in grass. But they can plan to irrigate the lawn so that runoff water hydrates other plants instead of trickling into the street. They can also plant flowers, shrubs and trees that need less water to begin with…

    Along with Denver Water, the Denver Botanic Gardens, Colorado State University and the Associated Landscape Contractors of Colorado have worked to get the principles of xeriscape out through books, seminars, demonstration gardens and plant cultivation…

    Mrs. Gulch’s Blue gramma “Eyelash” patch August 28, 2021.

    The Denver Botanic Gardens has one of a number of demonstration gardens meant to connect these concepts and create a blueprint for ways to garden beautifully yet consciously. When people first enter the grounds, the plants and design reflect European and coastal environments, but farther down the pathways are more native and drought-tolerant gardens. “People end up saying, ‘Hey, these are beautiful, too,’” says Kelaidis.

    But a sizable portion of those native plants weren’t available when xeriscaping principles were first adopted forty years ago. “Many of these plants were out there, but they’re kind of rangy and look a little scruffy,” Kelaidis explains.

    So Kelaidis personally brought back native plants such as “red birds in a tree” and a hardy form of Arizona cypress from Cookes Peak, New Mexico, as well as the Pawnee Buttes sand cherry that grows northeast of Denver. He also traveled to similar semi-arid and steppe regions around the world, such as South Africa, where he found the “ice plant.” Kelaidis explains that while some believe in only cultivating native species, there are many garden flowers that originated in steppe regions, including lilacs, bearded irises, peonies and the Persian rose.

    Kelaidis and others at the DBG also teamed up with CSU, as well as local nurseries, garden centers and gardening professionals, to create Plant Select in 1997. The nonprofit helps to educate gardeners and sell and distribute plants that grow well in high plains and intermountain regions. In addition to finding species with beautiful blooms and textures, Plant Select cultivates plants that can better handle fluctuations in temperature, lack of water and different kinds of soil; many are also more pest-resistant.

    Although Plant Select caters primarily to Colorado, it also provides plants to out-of-state retailers in Wyoming, Montana, Texas, Oregon, New Mexico, South Dakota, Nebraska, Utah and California.

    According to Plant Select’s Demonstration Garden Survey Summary in 2020, seven of its 24 gardens were watered three times a week, seven were watered bi-weekly, and seven were watered once a week. “They’re always coming out with new native varieties, with a new list of plants that are adaptable to the Colorado environment,” says Phil Steinhauer, president of the Associated Landscape Contractors of Colorado board of directors. “They’re marketing it so that people are asking for it.”

    […]

    The more water-wise gardening there is, the more xeriscaping becomes normal — which is exactly what proponents hoped for when they coined the concept forty years ago.

    Still, there is work to be done. Xeriscaping gets a boost every time there is a drought cycle, such as the years from 1999 to 2003. But afterward, the demand recedes.

    #RepublicanRiver district hosts meetings on water user fees — The #LaJunta Tribune-Democrat

    The Republican River’s South Fork near Hale, Colorado, with the region’s seemingly endless fields. Credit: Wikimedia Commons/Jeffrey Beall

    From The La Junta Tribune-Democrat (Candace Krebs):

    The Republican River Water Conservation District is hosting a series of meetings this week to discuss changes in rates paid for conservation contracts along the South Fork. Due to a 2016 resolution approved by the Republican River Compact Administration, Colorado was granted 100% credit for water delivered by the compact compliance pipeline now located in northeastern Colorado. In exchange for this, Colorado agreed to retire up to 25,000 acres in the South Fork Republican drainage area. The agreement requires 10,000 acres be retired by the end of 2024 and the remaining 15,000 acres by the end of 2029. To offset the added expense for increased conservation payments, the RRWCD is considering increasing the annual water use fee to a total of $30 per irrigated acre next year. This increase would be on the 2022 tax-roll and would be payable in early 2023. The last informational meeting on the topic is scheduled for 1:30 p.m. Friday at the Burlington Event Center.

    Report: Agricultural impacts of #sustainable #water use in the United States — Nature.com

    A center-pivot sprinkler near Wray, Colo. Photo/Allen Best

    Click here to read the report (Neal T. Graham, Gokul Iyer, Mohamad I. Hejazi, Son H. Kim, Pralit Patel & Matthew Binsted). Here’s the abstract:

    Governance measures such as restrictions on groundwater pumping and adjustments to sectoral water pricing have been suggested as response strategies to curtail recent increases in groundwater pumping and enhance sustainable water use. However, little is known about the impacts of such sustainability strategies. We investigate the implications of such measures, with the United States (U.S.) as an example. Using the Global Change Analysis Model (GCAM) with state-level details in the U.S., we find that the combination of these two governance measures can drastically alter agricultural production in the U.S. The Southwest stands to lose upwards of 25% of their total agricultural production, much of which is compensated for by production increases in river basins on the east coast of the U.S. The implementation of future sustainable water governance measures will require additional investments that allow farmers to maximize production while minimizing water withdrawals to avoid potentially detrimental revenue losses.

    #Colorado health officials hopeful after #Arizona court rejects Trump-era Clean Water Act rules — @WaterEdCO #DirtyWaterRule #WOTUS

    The Colorado Department of Public Health and Environment. Credit: Jerd Smith

    From Water Education Colorado (Jerd Smith):

    Colorado state health officials said they’re hopeful a recent federal court ruling that effectively overturned Trump-era rules reducing oversight of Western rivers and streams will allow states to revert back to a more protective standard.

    “We are aware of Arizona’s court decision and are following what it means for other states, especially arid states such as Colorado. We are hopeful the Arizona ruling will apply nationwide because it has the potential to allow states to revert back to standards that protected our state waters more,” said Trisha Oeth via email.

    Oeth, who is the environmental health and protection policy director at the Colorado Department of Public Health and Environment (CDPHE), also said the state understood the need to ensure that more certainty regarding the regulations was critical to protect all the interest groups affected by them.

    The Trump rule sought to overturn Obama Administration rules that expanded the scope of the Clean Water Act. But Aug. 30, the Arizona court rejected it, saying it harmed streams in Western states and ignored important science. It has directed regulators across the country to use a set of rules developed prior to the Obama Administration’s actions until the Biden Administration can develop new regulations.

    Since 2019, when the Trump-era rule was finalized, the CDPHE has been working, without success, on a proposed permitting program that lawmakers would have to approve. The permitting program would have covered streams and rivers left unprotected by the Trump rule. The so-called dredge-and-fill permits proposed by the state would be required when activities such as road and home building affect streams no longer covered by the Trump rule.

    But farm interests, developers and contractors remain concerned that the Clean Water Act (CWA) rule, known as the Waters of the U.S. (WOTUS) rule, will remain mired in legal battles and regulatory uncertainty, delaying projects and raising their costs.

    “It’s a big fear of ours,” said Zach Riley, the Colorado Farm Bureau’s director of public policy. The organization, which has 23,000 members, had supported the narrower WOTUS rule.

    The political seesaw has been going on for decades with the CWA legally hamstrung over murky definitions about which waterways fall under its jurisdiction, which wetlands must be regulated, what kinds of dredge-and-fill work in waterways should be permitted, what authority the CWA has over activities on farms and Western irrigation ditches.

    Administered by the U.S. Army Corps of Engineers and the Environmental Protection Agency, the CWA is credited with making U.S. waters some of the cleanest in the world. But it has also been difficult to administer, in part because the country is home to widely different geographies and because of numerous court cases that have altered how it is interpreted by different presidential administrations.

    Western states have been particularly concerned because in the Midwest and East, for instance, major rivers that carry barge and shipping traffic are clearly “navigable,” the term early courts used to determine how water would be regulated. If a stream was navigable, it was subject to federal law.

    But Colorado and other Western states rely on shallow streams that often don’t flow year round and don’t carry traditional commercial traffic. Over the years many of those streams too became protected by the Clean Water Act.

    The Trump administration’s WOTUS rule, however, excluded them, saying that only navigable streams would be regulated, meaning that thousands of miles of streams in Colorado and other Western states that don’t flow year round or carry commercial shipping traffic would no longer have been protected.

    Whether Colorado can or should craft a new permitting regulation that will remove it from the political back-and-forth that has dogged WOTUS and provide industry and environmental groups with more certainty isn’t clear yet.

    The CDPHE has not yet said what it plans to do, saying it is still analyzing the Arizona decision.

    “At the state level, it will be interesting,” said Alex Funk, senior counsel and director of water with the Theodore Roosevelt Conservation Partnership, which has advocated for a new state permitting program. “We’re still supportive of a state program to get out of this habit of having new WOTUS rules every four years…we need something that will survive at the federal level.”

    Still others want the CDPHE to take a breather, to wait and see how the EPA and other agencies interpret this latest ruling before trying to create a new state regulation.

    “Given the pace of change and the multiple rounds of litigation, the state could take more time to discuss what’s needed,” said Gabe Racz, an attorney who represents water utilities and industry at the Colorado Water Congress.

    And Racz said he believes there is a chance that the Biden Administration will be able to craft new rules that can endure at the federal level, regardless of who is in the White House.

    “The Biden Administration announced they planned to develop a durable rule. I’m hopeful. That’s a step in the right direction,” Racz said.

    Jerd Smith is editor of Fresh Water News. She can be reached at 720-398-6474, via email at jerd@wateredco.org or @jerd_smith.

    Colorado Rivers. Credit: Geology.com

    Water Connections: Adaptation from Forests to Deserts, September 21, 2021

    Spruce beetle-impacted forest in Southwestern Colorado with moderate levels of tree mortality. Photo credit: Sarah Hart

    Click here for all the inside skinny and to register:

    Participate in person or virtually on September 21st

    The Southwestern Water Conservation District and Four Corners Water Center at Fort Lewis College are partnering to present “Water Connections: Adaptation from Forests to Deserts.”

    This hybrid event will be held on Tuesday, September 21st from 5:00-8:00 p.m. at Fort Lewis College. Register now to reserve your in-person seat for $15.

    If you prefer to view the livestream from home, please register to receive the Zoom link at no cost.

    Below is a preview of the evening’s agenda:

    5:00 p.m. Appetizers and Networking Outdoors

    5:30 p.m. Snowtography – Forest Treatments and Hydrology

  • Joel Biederman, Research Hydrologist with USDA’s Southwest Watershed Research Center, presents his recent hydrology studies tied to forest treatments and upcoming test cases in southwestern Colorado
  • 6:30 p.m. Break

    6:45 p.m. Survey of Adaptation Strategies – From Our Forests to Our Deserts

  • Moderated by Steve Wolff, SWCD’s General Manager
  • Aaron Kimple, Mountain Studies Institute, regional forest health initiatives.
  • Selwyn Whiteskunk, Ute Mountain Ute Tribal Councilman, adapting to drought from the water user and tribal perspectives.
  • Carrie Padgett, Harris Water Engineering, southwest Colorado planning for future water needs.
  • Becky Mitchell, Colorado Water Conservation Board Director and Colorado Commissioner to the Upper Colorado River Commission, how aridification affects our water management.
  • Register

    Edge of Existence: As climate change and habitat loss push wildlife to the brink, the time to protect biodiversity is now — The Nature Conservancy #ActOnClimate

    A hunting ocelot is a triple threat—it can snag its prey on the ground, in a tree or from the water. Small rodents and reptiles are common quarry. © Charlie Hamilton James

    From The Nature Conservancy (Ben Goldfarb):

    In 1999, a strange virus began to afflict pig farmers in Malaysia. Patients suffered headaches, fevers and brain inflammation; ultimately more than 100 Malaysians died. Named the Nipah virus for the village where it was first identified, the pathogen is carried by fruit bats, which had been driven from their natural habitat by deforestation and fire and were foraging in orchards surrounding pig farms. It is believed that the bats were transmitting the virus to pigs, which passed it to humans. Nature’s deterioration, it seems, had spawned a public health crisis.

    Click on the image to enlarge. Credit: The Nature Conservancy
    Bugle Boys: Few large mammals are as expressive as elk, which grunt, squeal and bark to communicate within their herds. The species’ most famous call is the bugle, an eerie trumpeting that males utter to court females or challenge rivals for breeding privileges. The deeper the bugle, the angrier the elk. Males can even be recognized by their unique bugles. © Charlie Hamilton James

    The Nipah virus spillover provided evidence of a profound truth: Our fate is inextricably linked to the biodiversity that surrounds us. Insects pollinate our crops; oceans feed us; forests provide us with shelter. The COVID-19 pandemic has reinforced the fact that when nature suffers, human well-being follows suit—loss of habitat and more contact with wildlife increases the risk of transmitting zoonotic viruses to humans. “Healthy waters, healthy lands, healthy people—all are part of a cohesive and integrated whole,” says Lynn Scarlett, chief external affairs officer for The Nature Conservancy.

    A polar bear swims in the waters around Svalbard, Norway. © Fernando O’Farrill
    Gator Chomp
    Alligators aren’t just apex predators in the freshwater swamps and marshes of the southeastern United States—they’re also ecosystem engineers. The “gator holes” that they excavate hold water during the dry season, creating vital oases for fish, herons, frogs and otters. AMERICAN ALLIGATOR © Ingo Arndt/Nature Picture Library

    To keep that whole intact, delegates from nearly 200 countries will convene for the next meeting of the United Nation’s Convention on Biological Diversity, which will set global priorities for safeguarding habitats, saving species and protecting the ecological services that sustain human communities. Although a date for the convention is uncertain due to global travel restrictions at the time of publication, its mission couldn’t be more urgent. Since the late 19th century, the world has lost approximately half of its coral reefs, and other critical ecosystems, like wetlands and tropical forests, are shrinking fast. Around 1 million species are threatened today with extinction. “The arc of conservation is at a pivot point,” Scarlett says.

    Baby Blues
    Scorpions like this rock scorpion, photographed while illuminated by ultraviolet light, give birth to live young and the mothers are exceptionally devoted. The female carries her offspring, known as scorplings, on her back for weeks, until their exoskeletons harden and they’re ready for life on their own. ROCK SCORPION © Piotr Naskrecki

    To meet that challenge, a suite of innovative conservation strategies has evolved. Consider what happened in 2020 when a hurricane bludgeoned a coral reef in Mexico with wind speeds exceeding 100 knots. The damage from Hurricane Delta triggered a payout of about $850,000 from an insurance policy, taken out by the state of Quintana Roo with TNC’s assistance—perhaps the first such policy ever purchased on a natural feature. Within days the funds put locals to work cementing corals back into place and planting new colonies, rebuilding the living sea wall that will defend their coastline from future storms.

    “We have increasingly come to realize that we can’t just create a preserve and put our picket fence around it,” Scarlett says. “And that means we need to be engaging a world of environmental stewards.”

    Along Came a Spider: The world’s heaviest spider, the goliath birdeater weighs up to 6 ounces—more than an average-sized avocado. In spite of its name, it rarely eats birds, as it prefers insects, worms and frogs. This tarantula is armed with inch-long fangs and barbed hairs that it can send flying at assailants. GOLIATH BIRDEATER © Piotr Naskrecki

    But using out-of-the-box tactics and working with local partners are only half the battle. Tackling the scope of today’s mass-extinction crisis—the most severe since a hunk of space rock is believed to have set the dinosaurs on a crash course toward oblivion—requires a global perspective. Animals from gray whales to monarch butterflies cross national borders during their migrations; invasive species leap between continents; and climate change casts its net over the entire planet. The high seas, the vast expanse of ocean that lies beyond any nation’s territorial waters, have long been virtually lawless. But since 2018 U.N. delegates have been negotiating a treaty that would conserve and protect marine diversity in areas beyond national jurisdiction—proof that international consensus is possible.

    A Bug’s Life
    Moths like the Deyrolle’s emperor moth are our planet’s nocturnal support staff: Scientists describe them as “secret pollinators” that sustain hundreds of plants, and their bodies feed birds, bats and even bears. They may be less conspicuous than butterflies, but they’re remarkably diverse: More than 11,000 species flit through the United States alone. DEYROLLE’S EMPEROR MOTH © Piotr Naskrecki
    Pest Management
    The biological sonar that bats use to navigate and hunt is called echolocation. A bat closing in on an insect may emit and interpret up to 200 sonic pulses each second. A hungry bat is an exterminator without equal: Researchers estimate that bats provide the equivalent of more than $20 billion in insect-control services each year. MOZAMBIQUE LONG-FINGERED BAT © Piotr Naskrecki

    Scarlett is counting on the upcoming conference to ratify a similarly bold global vision: a commitment known as “30×30,” under which nations would pledge to protect 30% of their lands and seas by 2030. She also hopes that the conference will create new conservation funding sources; a recent report by TNC and its partners estimates that at least $598 billion more per year is needed to stave off the collapse of nature’s systems.

    Sunrise Ceremony
    The courtship ritual performed by the sage-grouse, the icon of western North America’s sagebrush plains, is one of nature’s most dramatic. Males woo hens at display sites, called leks, fanning their tails and inflating their breast sacs. For decades, TNC has worked with ranchers and energy and mining companies to protect the grouse’s stage in the sage. GREATER SAGE-GROUSE © Charlie Hamilton James
    On the Move
    The home ranges of black bears (like this one traveling a game trail in Wyoming’s Bridger-Teton National Forest) can cover a lot of ground: A male’s territory might be more than 300 square miles. In Florida, TNC identified and is safeguarding wildlife corridors so that these intelligent omnivores have room to roam. BLACK BEAR © Charlie Hamilton James

    Fulfilling such lofty objectives won’t be easy—the world failed to achieve the previous targets the convention established in 2010. But signs of hope are not hard to find: At least 17% of land and inland water worldwide is already protected, and as much as 80% of the world’s forest biodiversity can be found on the lands of Indigenous peoples, who make up less than 5% of the global population. Conservation efforts have pulled dozens of species back from the brink, including the California condor and the Przewalski’s horse. And even as the window for preserving biodiversity grows narrower every year, we have no choice but to try. “When it comes to ambition,” Scarlett says, “more is better.”

    What does the term “stream stage” mean? — USGS

    Eugene Clyde LaRue measuring the flow in Nankoweap Creek, 1923. Photo credit: USGS via Environment360

    From the USGS:

    Stream stage is an important concept when analyzing how much water is moving in a stream at any given moment. “Stage” is the water level above some arbitrary point in the river and is commonly measured in feet. For example, on a normal day when no rain has fallen for a while, a river might have a stage of 2 feet. If a big storm hits, the river stage could rise to 15 or 20 feet, sometimes very quickly. This is important because past records might tell us that when the stage hits 21 feet, the water will start flowing over its banks and into the basements of houses along the river — time to tell those people to move out! With modern technology, the USGS can monitor the stage of many streams almost instantly.

    Hydrologists are able to convert stage height into streamflow volume by determining a rating curve for each site.

    Learn more:

  • Streamgaging Basics
  • National Water Information System (NWIS) Mapper
  • Boosting #Water Reliability for Birds and People — Audubon #ActOnClimate

    San Rafael River in Utah. Photo credit: Abby Burk via Audubon Rockies

    From Audubon Rockies (Abby Burk):

    Colorado and the West face unprecedented drought conditions, impacts from wildfires, and water scarcity driven by climate change. The Colorado River shortage declaration on August 16th is a sharp warning that the river system is in crisis. If we do not act quickly, the future could be even tougher. But, there are important things we can do now to keep the Colorado we love strong by building climate change resilience in our watersheds.

    A recent report from Audubon and conservation partners suggests that we need to start investing now in solutions for the long-term. These solutions include improving forest health, restoring and protecting our natural water infrastructure (stream floodplains and wetlands), and practicing regenerative agriculture. Work must be done on a scale to match the scale of the water problems we’re facing.

    Relatively affordable natural solutions are critical to have in the toolbox alongside traditional strategies. One such natural affordable method for restoring our source watersheds is called “low-tech process-based restoration (PBR).” PBR is a low-cost, high-benefit option designed to restore headwater rivers, floodplains, wet meadows, and wetlands. PBR methods benefit rivers and communities by restoring natural river processes like hydrology, sediment movement, and nutrient cycling by reconnecting deeply cut degraded streams with their floodplains and adjacent wetlands, if historically present.

    PBR methods benefit the entire riverscape—streams, floodplains, wetlands, and the vegetation surrounding them. Riverscapes support habitat critical to birds and other wildlife and ecological services that directly influence water quality and quantity. Many studies in the past decade show that this type of restoration approach results in restoring natural ecological and hydrological stream processes that provide benefits beyond traditional restoration methods. The benefits include improved water quality and aquifer recharge, reduced flood risks, and improved riverscape ecology (see here and here).

    Lower Beaver Creek. Process-based restoration methods can be successfully applied in a variety of ecosystems. Photo credit: Jackie Corday via Audubon Rockies

    Existing natural systems that are particularly important for birds—such as riparian areas, floodplains, and wetlands—slow runoff and promote groundwater recharge by effectively storing water and slowly releasing it back to the surface water system. In this way, these natural systems fill a role similar to traditional reservoirs. The hydrologic characteristics of these natural systems also improve water quality by filtering sediment and pollutants.

    Models show that climate change and historic drought will continue to affect the Colorado River Basin in the coming years and further increase the severity and frequency of wildfires. These fires create devastating impacts for communities, wildlife, and forest ecosystems, including Colorado’s rivers and waterways. In the wake of Colorado’s three historic wildfires in 2020 and future wildfires, PBR techniques can help reduce the impacts of wildfires on water supplies and assist in wildfire recovery by sustaining riverscape plant communities.

    (Two Utah landowners describe their experience using stream restoration to heal their land.)

    The good news is that PBR methods help create resilience for our watersheds and are pretty affordable. PBR techniques can be scaled up to benefit all water uses and the cost is approximately $50,000 – $100,000 per mile on small streams.

    Also, PBR techniques for stream restoration can reduce sedimentation loading in storage reservoirs. In 2010, Denver Water invested nearly $30 million in dredging Strontia Springs Reservoir after the Cheesman Fire, and it’s almost in need of dredging again. Dredging reservoirs temporarily takes care of the problem of loss of storage space and dam safety, but it is not a long-term solution that addresses the actual problem of sedimentation coming from degraded watersheds. Studies are showing healthy floodplains upstream of reservoirs capture and store more sediment while degraded riverscapes deliver more sediment [Disclaimer: Link is to a Coyote Gulch post, thanks!].

    Riverscapes and wetlands are disproportionally important to birds and provide habitat for severely declining and climate-vulnerable species. Audubon Rockies is a partner in the Healthy Headwaters Working Group, a statewide collective of stream restoration experts, scientists, and agency, academic, and nonprofit staff who are working together to amplify headwater restoration in Colorado. Scaling up PBR projects in Colorado’s source watersheds can improve our long-term water security for people and wildlife in the face of increasing climate change impacts.

    All of us depend on natural systems for clean and reliable water. When we invest in the health of Colorado’s watersheds and rivers, we invest in our resilience to climate change.

    41st Annual #Colorado Law Conference on Natural Resources Equity in the #ColoradoRiver Basin: How to Sustainably Manage a Shrinking Resource , September 29-October 1, 2021 #COriver #aridification

    Horseshoe Bend, Arizona. Photo credit: Getches-Wilkinson Center

    Click here for all the inside skinny and to register:

    In any given year of late, demands for water in the Colorado River Basin exceed supply. Chronic drought, record heat, and rampant wildfires are already affecting the Basin’s overall health and resilience, and the historically low levels in Lakes Mead and Powell have caused an unprecedented call on the river. These historic challenges come at a time when several key components of the “Law of the River” are sunsetting in 2026. Key players are already revisiting the 2007 Interim Guidelines, Minute 323, and the 2019 Drought Contingency Plan. Relatedly, endangered fish recovery programs relevant to the region expire in 2023. Meanwhile, 48% of Tribal households in the U.S. do not have access to reliable water sources, clean drinking water, or basic sanitation. These harsh realities hasten the need to advance sustainable water management, improve watershed resilience, and ensure clean water access through collaborative decision-making. We look forward to bringing together diverse expertise and perspectives from across the region to draw the roadmap to an equitable future in the Colorado River Basin.

    Part 1: Universal Access to Clean Water on Tribal Lands (Thursday morning)
    Part 2: Ecosystem Health of the Colorado River Basin (Thursday afternoon)
    Part 3: CRB Hydrology & Management Guideline Renegotiations (*Friday)

    Opening Reception
    Wednesday, September 29
    5:30-7:30 p.m.
    Wolf Law Building, Schaden Commons

    We look forward to reconnecting with friends and colleagues, as well as
    celebrating the 25-year career of Dr. Doug Kenney who retired at the end of 2020.

    41st Annual Colorado Law Conference on Natural Resources
    Thursday, September 30 and Friday, October 1
    9:00 a.m.-5:00 p.m.
    Wolf Law Building, Wittemyer Courtroom

    Conference Program

    Conference Registration