Click the link to read the article on the Esquire website (Charles P. Pierce). Here’s an excerpt:
Water and sewer privatization has been going on for a while now. According to the folks at http://foodandwaterwatch.org, customers of private water systems pay 59 percent higher rates than do customers of public systems, and the rates in areas with private water systems increase an average of three times the rate of inflation.
And, all math aside, if water is not a basic human right, then nothing is. The United Nations declared as much in 2010. As water supplies around the world edge into the critical zone, the time to protect that human right against profiteering and corporate pillage is now, before the situation gets irreversible and we find that all our water is owned by some hedge-fund cowboys with bank accounts in the Caymans.
Turning a buck on water is very much like subletting the air, which I’m sure someone is working on as we speak.
Synopsis: La Niña is favored to continue through 2022 with the odds for La Niña decreasing into the Northern Hemisphere late summer (60% chance in July-September 2022) before increasing through the Northern Hemisphere fall and early winter 2022 (62-66% chance).
During June, below-average sea surface temperatures (SSTs) weakened across most of the central and eastern equatorial Pacific Ocean with SSTs returning to near-average in the east-central Pacific, as reflected by the Niño indices, which ranged from -0.4oC to -1.2oC during the past week. Subsurface temperatures anomalies averaged between 180°-100°W and 0-300m depth were weakly positive in June. Below-average subsurface temperatures persisted near the surface to ~75m depth in the eastern equatorial Pacific Ocean, with above-average temperatures at depth (~100 to 200m) in the western and central Pacific Ocean. Low-level easterly wind anomalies prevailed in the western and central equatorial Pacific, while upper-level westerly wind anomalies continued over most of the equatorial Pacific. Convection remained suppressed over the western and central Pacific and enhanced over Indonesia. Overall, the coupled ocean-atmosphere system was consistent with La Niña conditions.
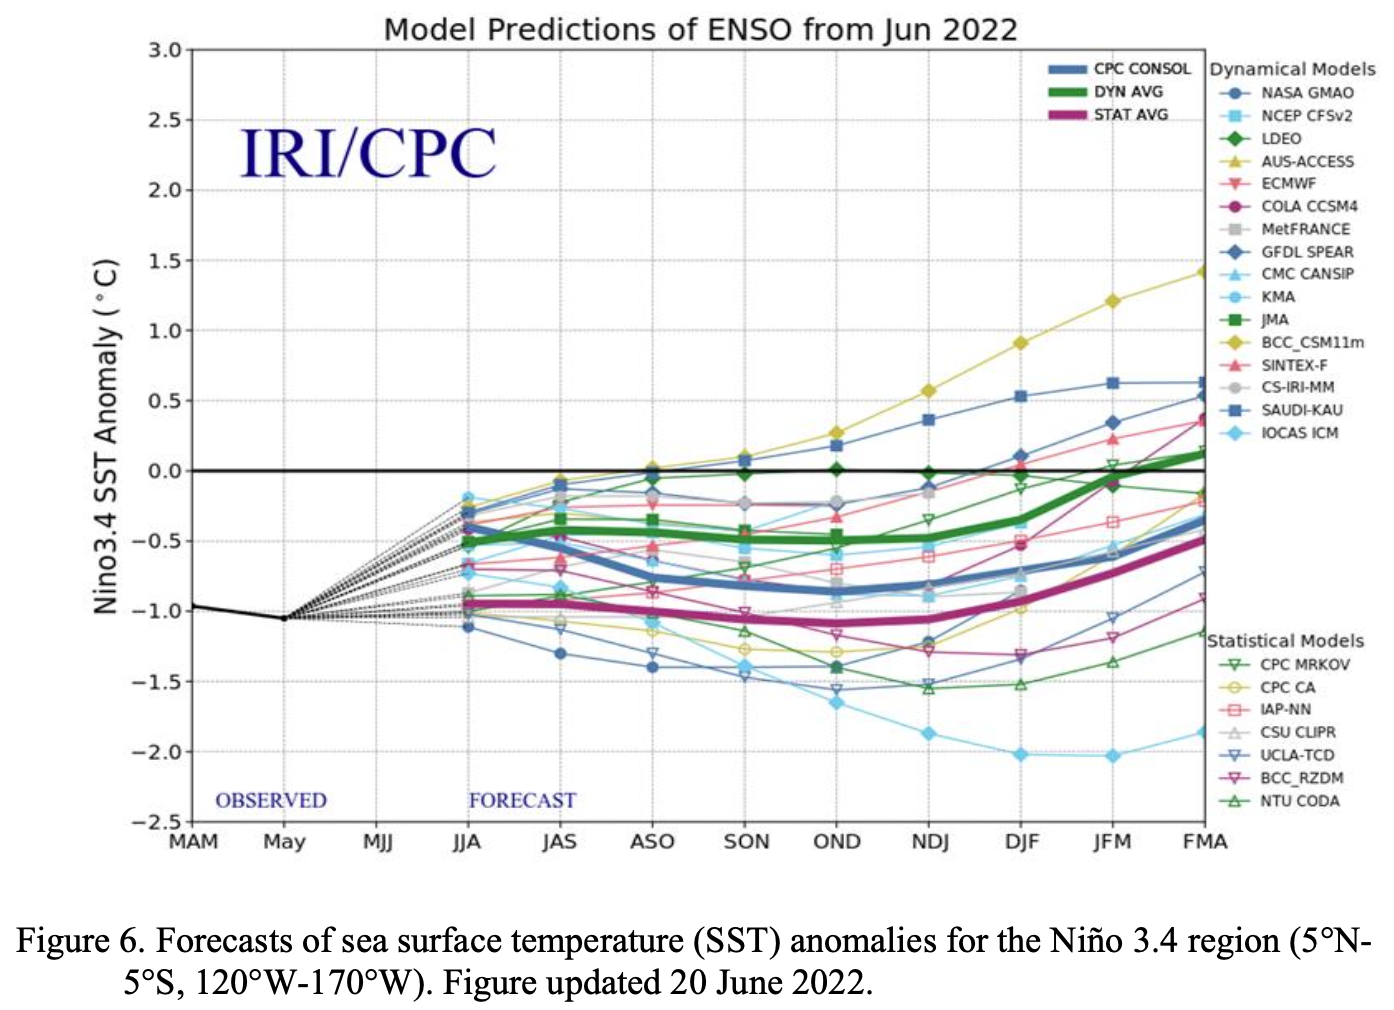
The most recent IRI/CPC plume average for the Niño-3.4 SST index now forecasts La Niña to persist into the Northern Hemisphere winter 2022-23. The forecaster consensus also predicts La Niña to persist during the remainder of 2022, with odds for La Niña remaining at 60% or greater through early winter. Lowest odds occur during the next few months with a 60% chance of La Niña and a 39% chance of ENSO-neutral during July-September 2022. Subsequently, chances of La Niña increase slightly during the fall and early winter. In summary, La Niña is favored to continue through 2022 with the odds for La Niña decreasing into the Northern Hemisphere late summer (60% chance in July- September 2022) before increasing through the Northern Hemisphere fall and early winter 2022 (62-66% chance; click CPC/IRI consensus forecast for the chances in each 3-month period).
Aerial mulching. Photo credit: Colorado State Forest Service
Click the link to read the article on the KUNC website (Alex Hager):
Work to protect water quality on the northern Front Range resumes this week with a whir of helicopter blades in Poudre Canyon. For the second year in a row, those aircraft will drop mulch on areas burned by the Cameron Peak Fire in 2020 — an effort to stabilize burned soil and keep ashy debris out of rivers.
Colorado’s largest-ever wildfire left a charred moonscape, with soil turned into gray dust and shards of blackened trees and plants littering the ground. When it rains, ash and sediment can be swept downhill into rivers that supply water to town pipes. In 2021, that forced the City of Fort Collins to stop treating water from the river and switch to an alternate supply from Horsetooth Reservoir…
Last year, crews dropped wood shards on 5,050 acres in the Cache La Poudre and Big Thompson watersheds. This summer, they hope to cover nearly 5,000 more — with 3,500 acres identified near the Poudre and 1,200 acres near the Big Thomspon. Those efforts aren’t cheap. Last year’s aerial mulching work cost $11 million. Keeping a helicopter in the air costs $87 each minute, but local utilities justify the expense as a precaution against even more costly treatment that would be necessary without it.
Contractors will begin 2022’s aerial mulching campaign on Thursday, July 14, 2022 starting in the Pingree Park area. It will continue through the summer and fall.
The South Platte River Basin is shaded in yellow. Source: Tom Cech, One World One Water Center, Metropolitan State University of Denver.
Click the link to read the article on the NOAA website (Emily Becker):
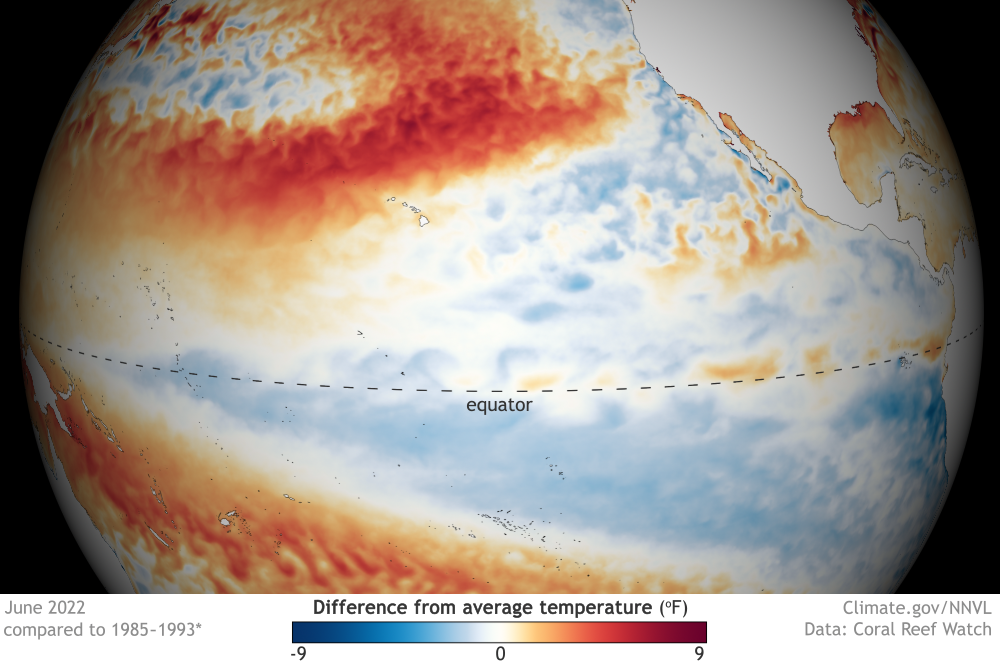
I’m in San Diego this week, gazing out across the Pacific toward La Niña’s cool tropical ocean surface. (I’m not here for Comic-Con, but there are a lot of posters around the city that keep that upcoming event in the forefront.) Just over my horizon, La Niña—the cool phase of the El Niño-Southern Oscillation (“ENSO” for short)—remains in force, despite some warming in the sea surface temperature over the past month or so. Forecasters expect La Niña to continue through the summer and into the fall and early winter.
Sea surface temperatures around the equator in the central and eastern Pacific were mostly cooler than average (blue) in June 2022. A few warm pockets (orange) dotted the far eastern Pacific. NOAA Climate.gov map from our Data Snapshots collection.
Ka-Pow!
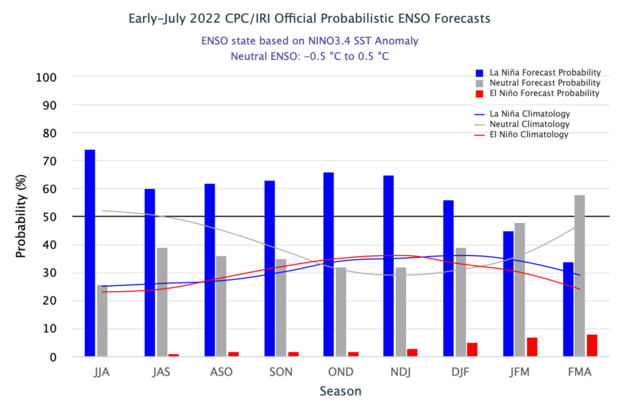
Numbers-wise, there’s about a 60% chance of La Niña through the summer, ticking up a bit to the mid 60%s around 66% by October–December 2022. The second most likely outcome is ENSO-neutral conditions. El Niño is a distant third, with chances only in the low single digits through the early winter. This forecast isn’t much different from the past couple of months.
The official CPC/IRI ENSO probability forecast. The bars show the seasonal chances for each possible ENSO state—El Niño (red), La Niña (blue), and neutral (gray)—from spring 2022 through winter 2022–23. The forecast is based on a consensus of CPC and IRI forecasters, and it is updated during the first half of the month, in association with the official CPC/IRI ENSO Diagnostic Discussion. It is based on observational and predictive information from early in the month and from the previous month. Image from IRI.
While we’re doing the numbers, let’s see how La Niña measured up last month. As I mentioned above, the cool sea surface temperature anomaly weakened a bit in June, but remained in La Niña territory. (Anomaly = difference from the long-term average, long-term being 1991–2020 here, and the La Niña threshold is -0.5 °Celsius, which is just shy of 1 degree Fahrenheit.) According to the ERSSTv5, our most consistent sea surface temperature dataset, June’s sea surface temperature anomaly in the Niño-3.4 region was -0.8 °C. This is the 7th-strongest negative June anomaly in our 1950–present record.
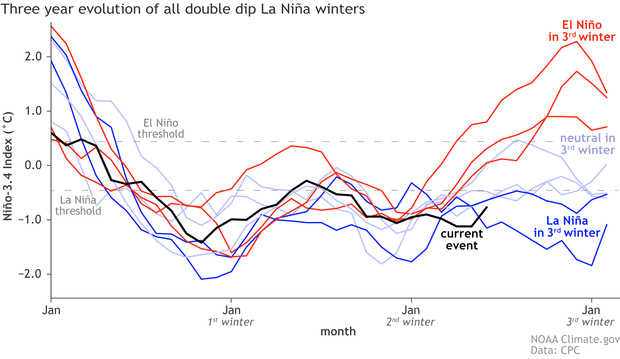
Three-year history of sea surface temperatures in the Niño-3.4 region of the tropical Pacific for 8 previous double-dip La Niña events. The color of the line shows the ENSO state in the third winter (red: El Niño, darker blue: La Niña, lighter blue: neutral). The black line shows the current event. Monthly Niño-3.4 index is from CPC using ERSSTv5. Time series comparison was created by Michelle L’Heureux, and modified by Climate.gov.
This recent weakening in the Niño-3.4 anomaly—it was -1.1 °C in May—is partly due to a slight diminishment of the trade winds, the prevailing east-to-west winds near the Equator, in the first half of June. When the trade winds weaken, wind-driven evaporative cooling slows and the surface warms. Also, a fairly weak downwelling Kelvin wave, a region of warmer-than-average water under the surface, has been moving from west to east over the past few months , gradually rising toward the surface.
The trade winds re-strengthened over the second half of June, and remain stronger than average as we go to press. This will likely help to cool the surface, and may contribute to an upwelling Kelvin wave, a region of cooler-than-average subsurface water that moves west to east. Along with being a sign that La Niña’s amped-up Walker circulation—the atmospheric response to La Niña’s cooler sea surface—is still present, the stronger trades are a source of confidence in the forecast for La Niña to continue through the summer.
Sea surface temperatures the week of July 9, 2022, showing the warm-to-cool gradient in temperatures across the tropical Pacific Ocean from west to east. Temperatures in the West Pacific Warm Pool, around the Maritime Continent, are above 80 degrees Fahrenheit (yellow-orange), while a cooler tongue of water (blue) extends from the coast of South America to the central Pacific. The prevailing east-to-west trade winds near the equator create this temperature contrast by pushing warm water west and allowing deeper, cooler water to well up to the surface. NOAA Climate.gov image from our Data Snapshots collection.
Zowie!
That said, there may well be short-term fluctuations in the Niño-3.4-region sea surface temperature that flirt with the La Niña threshold. For example, the current weekly Niño-3.4 index is -0.5°C. (This uses a different sea surface temperature monitoring dataset, the OISST.) However, as Michelle detailed a few years ago, ENSO is a seasonal phenomenon, meaning we evaluate it using monthly and seasonal averages, not weekly. Most climate models are predicting that the three-month-average Niño-3.4 index will remain below -0.5°C, another source of confidence in the forecast.
Thwack!
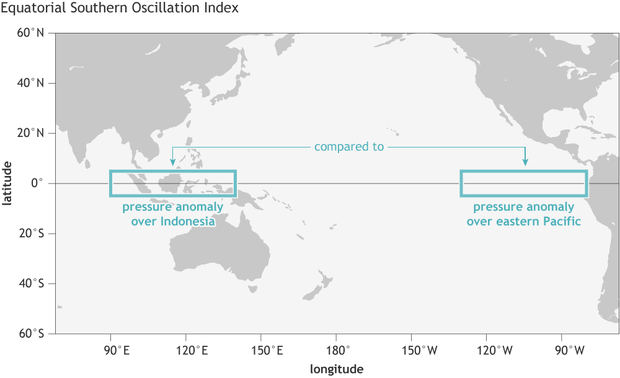
As I mentioned above, the June sea surface temperature anomaly was the 7th-most negative June anomaly on record. Where does the atmospheric response rank? Let’s take a look at the Equatorial Southern Oscillation Index (EQSOI), an index that measures the relative atmospheric surface pressure in the equatorial eastern Pacific versus that in the western Pacific.
The Equatorial Southern Oscillation Index compares pressure anomalies across a broad region of the western tropical Pacific (5 degrees North and South latitude, 80–130 degrees West longitude) to pressure anomalies on the other side of the basin (5 degrees North and South latitude, 90–140 degrees East longitude). NOAA Climate.gov image by Fiona Martin.
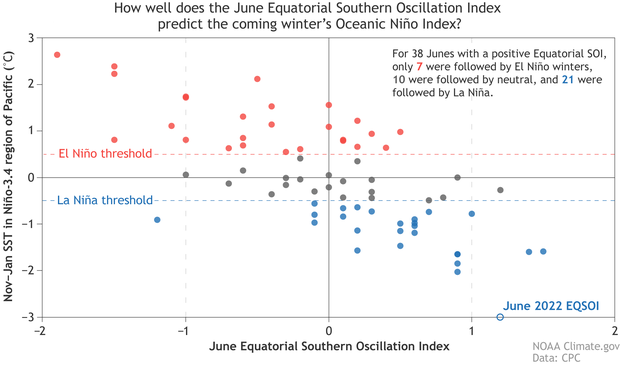
When this index is positive, it means the pressure is relatively higher in the east and lower in the west, indicating a stronger Walker circulation. June 2022 tied for third strongest on record (1950–present), which got me wondering about the relationship between the strength of the Walker circulation in the summer to the Niño-3.4 index in the following early winter.
It turns out that the June EQSOI has a correlation of about 0.7 with the Niño-3.4 index in the following November–January period. This is a fairly strong correlation, but by no means does it guarantee any particular November-January outcome. The other tied-for-third June, 2013, was followed by an ENSO-neutral winter. Most other Junes in the range of the 2022 value were followed by La Niña winters, though.
Each dot on this scatterplot shows the atmospheric ENSO conditions each June (horizontal axis) since 1950 versus the oceanic ENSO conditions the following November–January (vertical axis). When the June Equatorial Southern Oscillation Index (ESOI) is negative, winter Oceanic Niño Index conditions are frequently in the El Niño range (red dots), sometimes neutral (gray dots), but rarely in the La Niña range (blue dots). When June ESOI is positive, the winter is usually in the La Niña range, sometimes in the neutral range, but rarely in the El Niño range. The June 2022 EQSOI—shown as an open circle on the horizontal axis—was the third-highest June SOI on record. Data from CPC, image by Climate.gov.
Blammo!
Given all these sources of confidence, why isn’t the probability of La Niña higher? First, while a majority of the climate models do predict continued La Niña, there is still a pretty wide range of potential outcomes. Also, as I mentioned above, the subsurface temperature in the eastern half of the tropical Pacific is a bit warmer than average. If this anomaly is large—much cooler than average, or much warmer—it has a stronger relationship with the eventual Niño-3.4 index. However, when it is pretty small, as it was in June 2022, the outcomes are more varied. Finally, as we’ve covered extensively, a triple-dip (three-peat!) La Niña is a pretty unusual occurrence.
That’s all, folks! I’m going to go dip my toes in the Pacific.
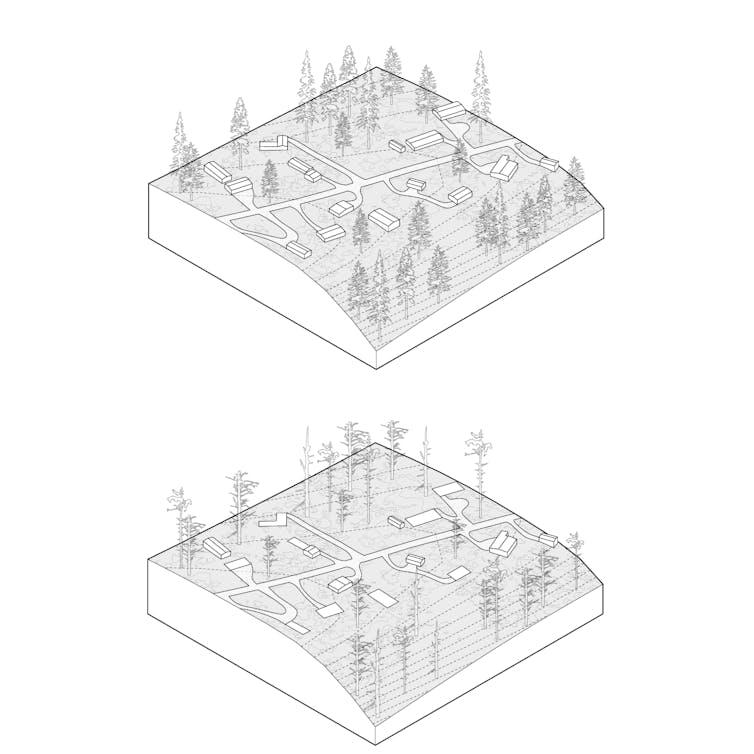
Wildfires in the American West are getting larger, more frequent and more severe. Although efforts are underway to create fire-adapted communities, it’s important to realize that we cannot simply design our way out of wildfire – some communities will need to begin planning a retreat.
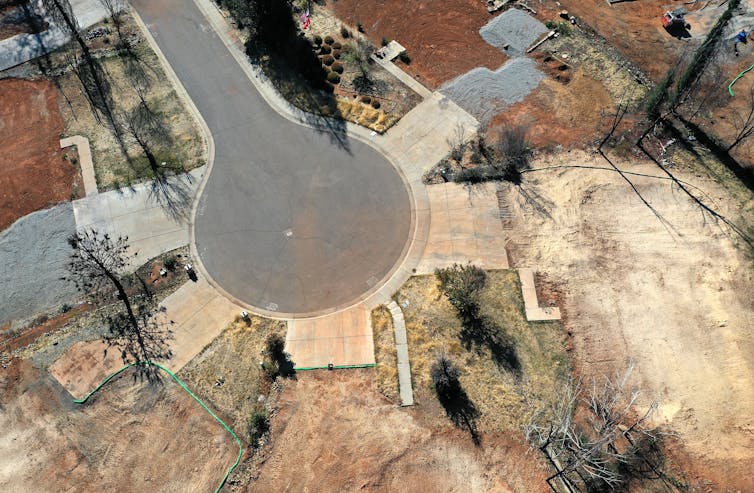
Paradise, California, is an example. For decades, this community has worked to reduce dry grasses, brush and forest overgrowth in the surrounding wildlands that could burn. It built firebreaks to prevent fires from spreading, and promoted defensible space around homes.
But in 2018, these efforts were not enough. The Camp Fire started from wind-damaged power lines, swept up the ravine and destroyed over 18,800 structures. Eighty-five people died.
Across the America West, thousands of communities like Paradise are at risk. Many, if not most, are in the wildland-urban interface, a zone between undeveloped land and urban areas where both wildfires and unchecked growth are common. From 1990 to 2010, new housing in the wildland-urban interface in the continental U.S. grew by 41%.
Whether in the form of large, master-planned communities or incremental, house-by-house construction, developers have been placing new homes in danger zones.
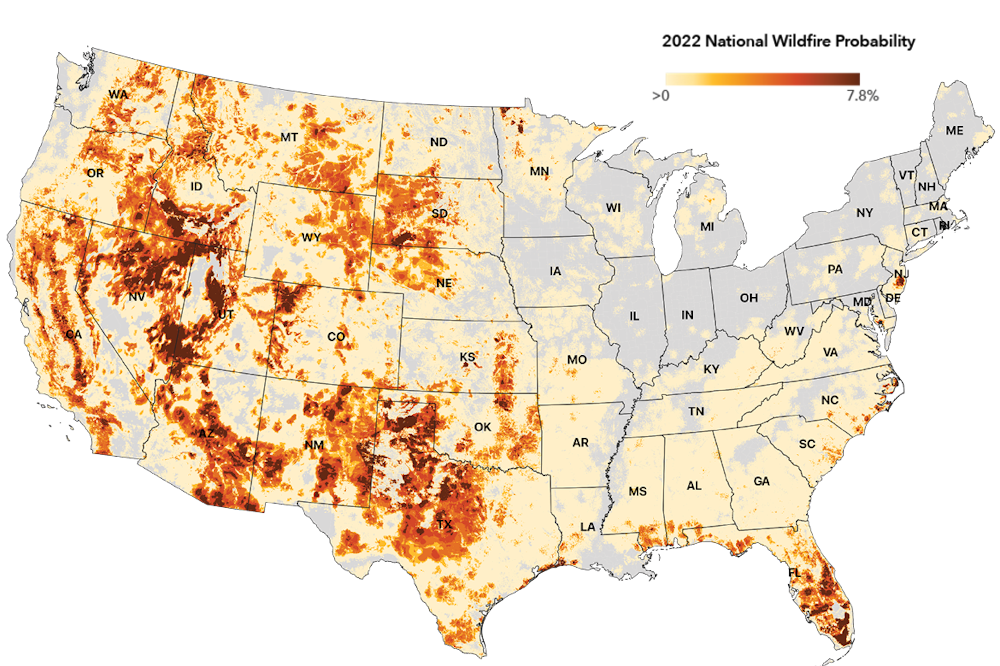
First Street Foundation created a national wildfire model that assesses fire risk at the local level to help communities understand and prepare. The map reflects the probability wildfire will occur in an area in 2022. First Street Foundation Wildfire Model
It has been nearly four years since the Camp Fire, but the population of Paradise is now less than 30% of what it once was. This makes Paradise one of the first documented cases of voluntary retreat in the face of wildfire risk. And while the notion of wildfire retreat is controversial, politically fraught and not yet endorsed by the general public, as experts in urban planning and environmental design, we believe the necessity for retreat will become increasingly unavoidable.
But retreat isn’t only about wholesale moving. Here are four forms of retreat being used to keep people out of harm’s way.
Limiting future development
On one end of the wildfire retreat spectrum are development-limiting policies that create stricter standards for new construction. These might be employed in moderate-risk areas or communities disinclined to change.
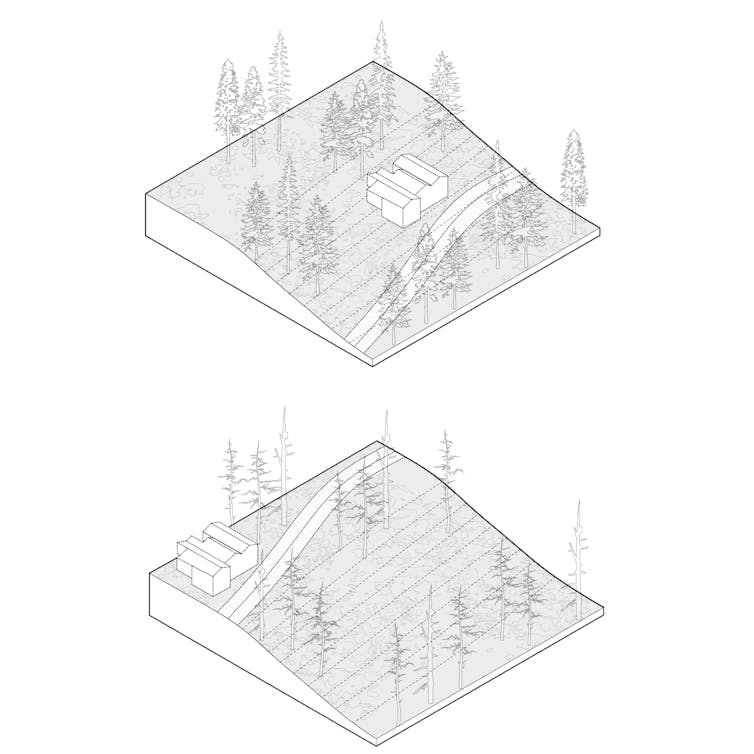
An example is San Diego’s steep hillside guidelines that restrict construction in areas with significant grade change, as wildfires burn faster uphill. In the guidelines, steep hillsides have a gradient of at least 25% and a vertical elevation of at least 50 feet. In most cases, new buildings cannot encroach into this zone and must be located at least 30 feet from the hillside.
While development-limiting policies like this prevent new construction in some of the most hazardous conditions, they often cannot eliminate fire risk.
Development-limiting policies can include stricter construction standards. The illustration shows the difference between a home on a steep hillside that is hard to defend from fire and one farther from the slope. Emily Schlickman
Halting new construction
Further along the spectrum are construction-halting measures, which prevent new construction to manage growth in high-risk parts of the wildland-urban interface.
These first two levels of action could both be implemented using basic urban planning tools, starting with county and city general plans and zoning, and subdivision ordinances. For example, Los Angeles County recently updated its general plan to limit new sprawl in wildfire hazard zones. Urban growth boundaries could also be adopted locally, as many suburban communities north of San Francisco have done, or could be mandated by states, as Oregon did in 1973.
Halting construction and managing growth in high-risk parts of the wildland-urban interface is another retreat tool. Emily Schlickman
To assist the process, states and the federal government could designate fire-risk areas, similar to Federal Emergency Management Agency flood maps. California already designates zones with three levels of fire risk: moderate, high and very high.
Incentives for local governments to adopt these frameworks could be provided through planning and technical assistance grants or preference for infrastructure funding. At the same time, states or federal agencies could refuse funding for local authorities that enable development in severe-risk areas.
In some cases, state officials might turn to the courts to stop county-approved projects to prevent loss of life and property and reduce the costs that taxpayers might pay to maintain and protect at-risk properties
Threehigh-profileprojects in California’s wildland-urban interface have been stopped in the courts because their environmental impact reports fail to adequately address the increased wildfire risk that the projects create. (Full disclosure: For a short time in 2018, one of us, Emily Schlickman, worked as a design consultant on one of these – an experience that inspired this article.)
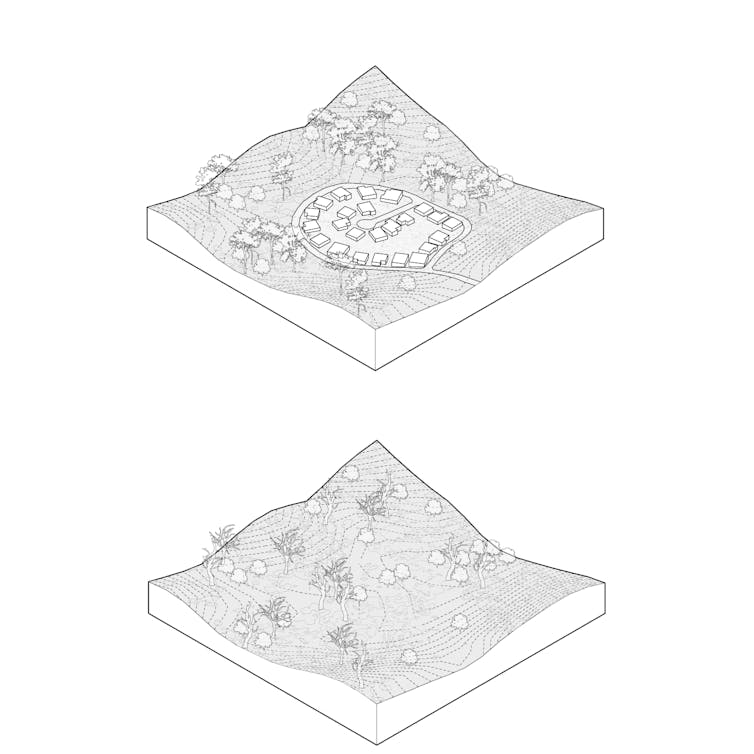
Incentives to encourage people to relocate
In severe risk areas, the technique of “incentivized relocating” could be tested to help people move out of wildfire’s way through programs such as voluntary buyouts. Similar programs have been used after floods.
Local governments would work with FEMA to offer eligible homeowners the pre-disaster value of their home in exchange for not rebuilding. To date, this type of federally backed buyout program has yet to be implemented for wildfire areas, but some vulnerable communities have developed their own.
The city of Paradise created a buyout program funded with nonprofit grant money and donations. However, only 300 acres of patchworked parcels have been acquired, suggesting that stronger incentives and more funding may be required.
Removing government-backed fire insurance plans or instituting variable fire insurance rates based on risk could also encourage people to avoid high-risk areas.
Another potential tool is a “transferable development rights” framework. Under such a framework, developers wishing to build more intensively in lower-risk town centers could purchase development rights from landowners in rural areas where fire-prone land is to be preserved or returned to unbuilt status. The rural landowners are thus compensated for the lost use of their property. These frameworks have been used for growth management purposes in Montgomery County, Maryland, and in Massachusetts and Colorado.
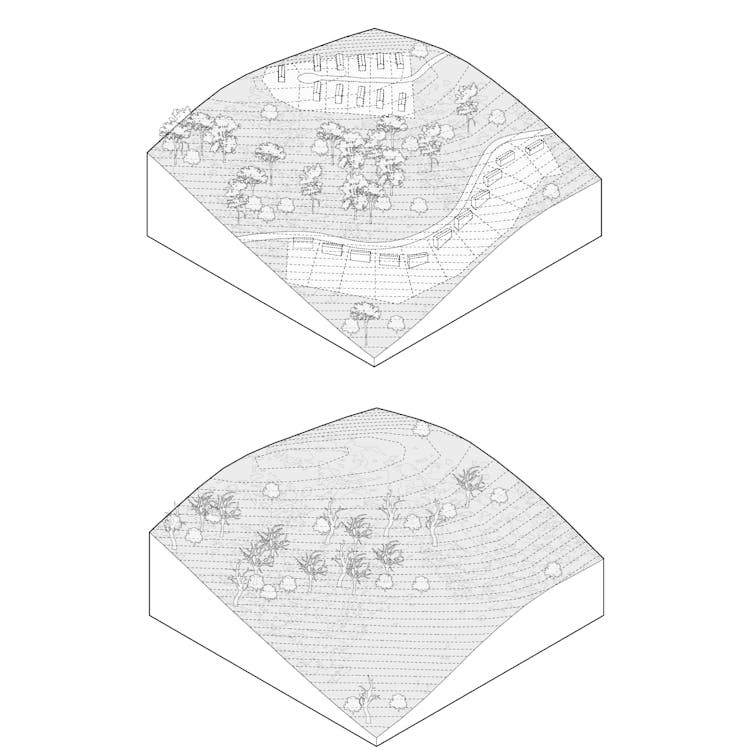
Incentivized relocating can be used in severe risk areas by subsidizing the movement of some people out of wildfire’s way. The illustrations show what before and after might look like. Emily Schlickman
Moving entire communities, wholesale
Vulnerable communities may want to relocate but don’t want to leave neighbors and friends. “Wholesale moving” involves managing the entire resettlement of a vulnerable community.
This technique, though, has drawbacks – from the complicated logistics and support needed to move an entire community to the time frame needed to develop a resettlement plan to potentially overloading existing communities with those displaced.
In extreme risk areas, wholesale moving could be an approach – managing the resettlement of an entire vulnerable community to a safer area. Emily Schlickman
Even with ideal landscape management, wildfire risks to communities will continue to increase, and retreat from the wildland-urban interface will become increasingly necessary. The primary question is whether that retreat will be planned, safe and equitable, or delayed, forced and catastrophic.
My family has been raising cattle in the Southwest for almost 50 years, and last year we experienced a first – producers in our valley did not receive any supplemental irrigation water from the reservoir. Agricultural producers in the river valleys and winding canyons of the Southwest are feeling the impacts of climate change. Temperatures are rising, snowpack is decreasing, runoff is occurring earlier in the year, and it’s becoming drier. As climate change continues to impact the Southwest, understanding how these environmental changes impact us will help farmers and ranchers like myself adjust our land management practices to remain resilient to drought and climate change.
Ecosystems Adapt & So Can We!
Areas that receive low amounts of rainfall are especially susceptible to changes in the environment. The plants and animals that live in dry areas are specialized to this unique landscape, and as the world around them changes, they must adapt or face extinction. Fortunately, healthy ecosystems respond to change, and so can we. The key to responding is diversity. Biodiversity is what gives species the genetic advantage they need to adapt to changing environments. The environment is changing, and just as genetic diversity allows for change, farmers and ranchers can proactively use innovative, versatile strategies to respond and help their enterprises survive.
Healthy Livestock Make Happy, Profitable Ranchers
Ensuring livestock remain healthy is the top priority for those who raise animals. Managed grazing that supports healthy soils and robust forage is a must. Lack of water affects the nutritional content and digestibility of forage. This leads to animals – and ranchers – becoming stressed. Adjusting stocking rates and pasture rotation are a few strategies recommended by the USDA Southwest Climate Hub that can help support the health of your pastures, which in turn supports the health of your animals.
Increased temperatures aren’t just uncomfortable; livestock consume more water when it is hot, making stock water especially important when water is scarce. Warmer temperatures also directly impact the health of our livestock, which in turn reduces profits. Providing access to pastures with trees or shade structures where livestock can get out of the sun is just as important as providing access to water.
It’s No Surprise That Plants Need Water
Photo courtesy of Sensa Wolcott
When water is limited, our fields produce less hay, forage and produce, making it challenging to grow what we need to be successful. Changing temperature will affect which crops thrive in particular areas. The Colorado State University Extension office provides many helpful strategies for how we can tackle these challenges. Prepare to make adjustments to the specific plants that you cultivate. Try planting crop varieties that require less water to thrive and research how specific crops use water. Rotate crops in a way that better promotes growth and productivity during drought and incorporate strategies that slow down water and increase infiltration, such as installing contour swales in fields.
Changes in temperature and precipitation patterns will impact the harvest timing of hay and produce and increase the likelihood of weeds popping up. Be prepared for changes in when you typically harvest and focus on increasing biodiversity by planting a mixture of different types of plants in a hayfield or pasture. Variety provides resilience as well as defense against invasive species, which are less likely to move into healthy, drought-resilient pastures and hayfields.
Healthy Watersheds Support Us All
Wetland. Photo courtesy of Sensa Wolcott
Water is critical to life in Colorado because it supports the biodiversity and health of the entire watershed, including the animals and plants so important to farmers and ranchers. Improving irrigation efficiency and upgrading diversion structures can help us adapt to rising temperatures that cause snow to melt and runoff earlier in the year. Early runoff means there is less water later in the season, when animals, plants, and irrigators all need water. Practicing irrigation strategies that encourage keeping rivers wet and implementing practices that increase groundwater storage support healthy waterways and support the needs of farmers and ranchers.
Riparian area management techniques like those mentioned in this article from Agri-Food Canada can benefit producers and the ecosystem. Try fencing livestock out of parts of the riparian corridor to support healthy riparian ecosystems. Livestock can cause erosion and water quality concerns – but well-planned access points that provide livestock with access to crucial drinking water can support both a healthy herd and a thriving waterway.
Farmers and ranchers want to see water in the river – the longer the better – which also supports the health and well-being of the aquatic ecosystem. Protecting our riparian areas is imperative; when our riparian corridors are healthy and thriving, so are we.
We Have a Choice
The future of agriculture is tied tightly to the future of our waters. Healthy ecosystems that have a variety of plants and animals are vital. Choosing innovative management strategies enables us to be good stewards of the natural world while also improving our farms and ranches so that we all can remain resilient in the face of drought and a changing climate.
Sensa Wolcottt.
Sensa Wolcott works as the Watershed Coordinator for the Mancos Conservation District. She is pursuing her Masters in Biology through Miami University’s Project Dragonfly, where her work focuses on community-based conservation and connecting people with the land through dialogue and collaboration. Sensa and her family live on their family owned and operated cattle ranch and enjoys hiking, camping, mountain biking, and photography.
Mancos and the Mesa Verde area from the La Plata Mountains.
Click the link to read the article on the NOAA website:
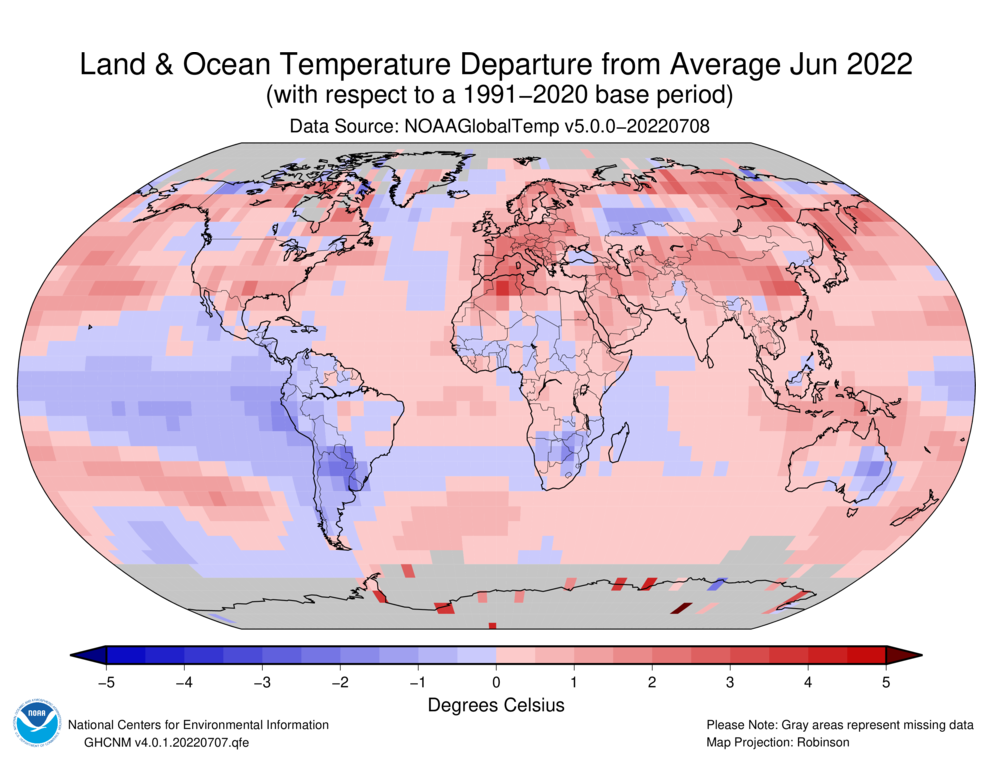
Globally, June 2022 was the sixth-warmest June in the 143-year NOAA record. The year-to-date (January-June) global surface temperature was also the sixth warmest on record. According to NCEI’s Global Annual Temperature Outlook, there is a greater than 99% chance that 2022 will rank among the 10-warmest years on record but only an 11% chance that it will rank among the top five.
This monthly summary, developed by scientists at NOAA’s National Centers for Environmental Information, is part of the suite of climate services NOAA provides to government, business, academia and the public to support informed decision-making.
Monthly Global Temperature
The June global surface temperature was 1.57°F (0.87°C) above the 20th-century average of 59.9°F (15.5°C). This ranks as the sixth-warmest June in the 143-year record. June 2022 marked the 46th consecutive June and the 450th consecutive month with temperatures, at least nominally, above the 20th-century average. The ten-warmest Junes on record have all occurred since 2010.
The Northern Hemisphere land-only surface temperature for June was 2.81°F (1.56°C) above average, making it the second warmest on record after June 2021. Europe had its second-warmest June on record, largely due to an unusually early heatwave heat wave coming from North Africa. Spain and France recorded temperatures not typically seen until July or August, breaking many temperature records for the month. Asia also had its second-warmest June on record.
Temperatures were above average throughout most of North America, Europe, and Asia and across parts of northern Africa, the Arabian Peninsula, and western and northern Oceania. Parts of China, the Middle East, and northern Africa experienced record-warm temperatures for June. Sea surface temperatures were above average across much of the northern, western, and southwestern Pacific, as well as parts of the Atlantic and eastern Indian oceans.
Temperatures were near- to cooler-than-average across parts of western and southern South America and in small areas of eastern Australia, western Russia, and southern Africa. Consistent with La Niña, sea surface temperatures were below average over much of the south-central, central, and eastern tropical Pacific. There were no areas with record-cold June temperatures in 2022.
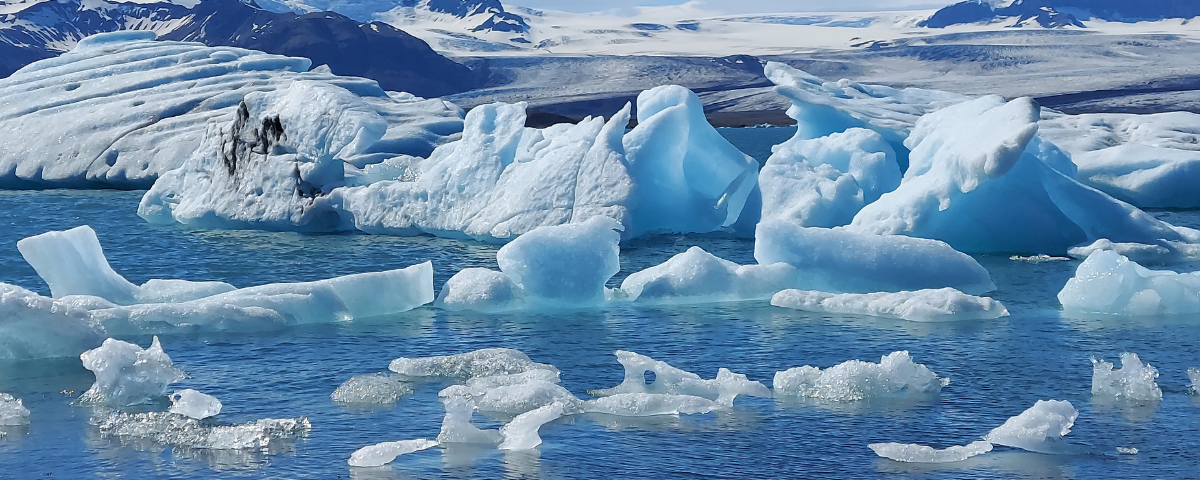
Sea Ice
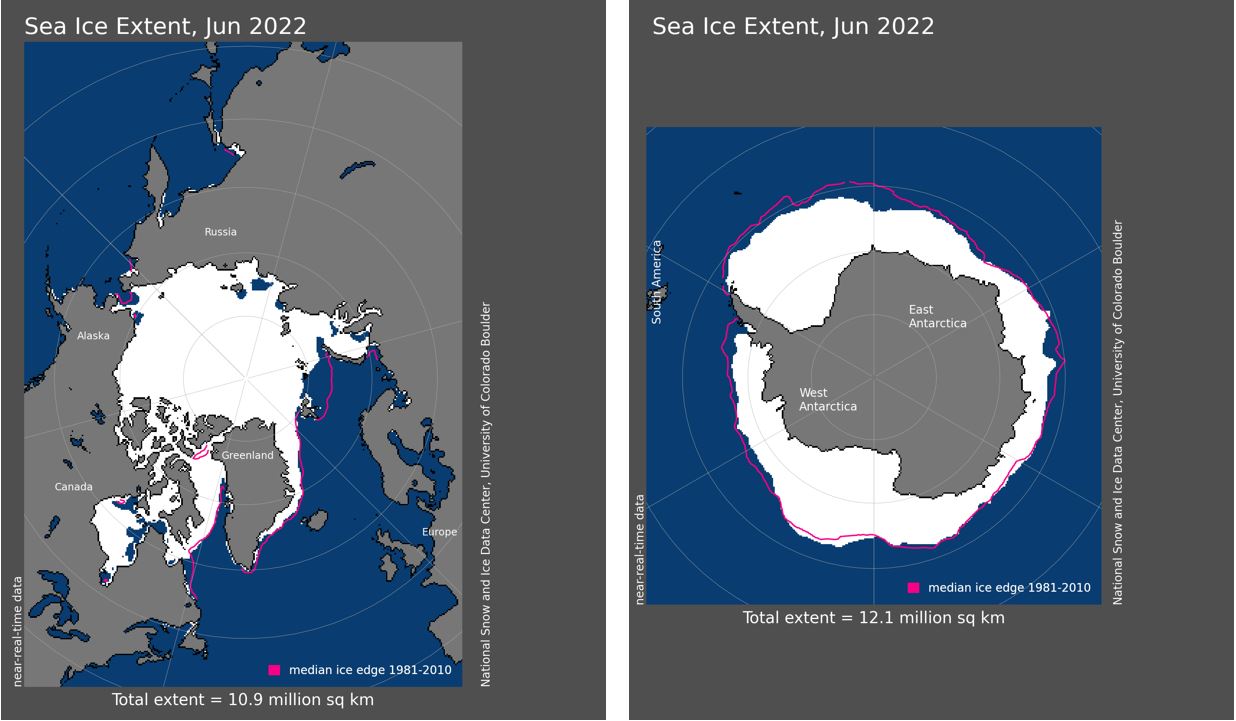
Globally,June 2022 saw the second-lowest June sea ice extent on record. Only June 2019 had a smaller sea ice extent.
June 2022 Arctic (left) and Antarctic (right) sea ice extent. Courtesy of NSIDC and NOAA.
Arctic sea ice extent in June averaged 4.19 million square miles, which is 347,000 square miles — roughly the size of Sweden, Norway, and Denmark combined — below the 1981-2010 average and the 10th-smallest June extent in the 44-year record. According to an analysis by theNational Snow and Ice Data Center(NSIDC), regional sea ice extent was below average in the Barents, Chukchi, East Siberian, and Kara seas and Hudson Bay, while conditions in Baffin Bay were near normal. The 10-smallest June Arctic sea ice extents have occurred since 2010.
Antarctic sea ice extent for June was a record low at 4.68 million square miles, or about 471,000 square miles below average. Following a below-average Antarctic sea ice extent in May, sea ice growth in June was slower than average.
Global Tropical Cyclones
June 2022 produced five named storms across the globe, which is near-normal activity for June. Only one of those, Hurricane Blas, reached tropical cyclone strength (74 mph) in June, but two storms that formed in June later reached cyclone strength in July. The global cyclone activity for January through June remains near normal by most metrics.
Although it was only a tropical storm for about 30 hours, Tropical Storm Alex was the Atlantic’s first named storm of the season. The East Pacific had two named storms in June, which is near-average activity. The West Pacific, which has below-average year-to-date activity, only had one named storm this month.