The health of our waters is the principal measure of how we live on the land — Luna Leopold
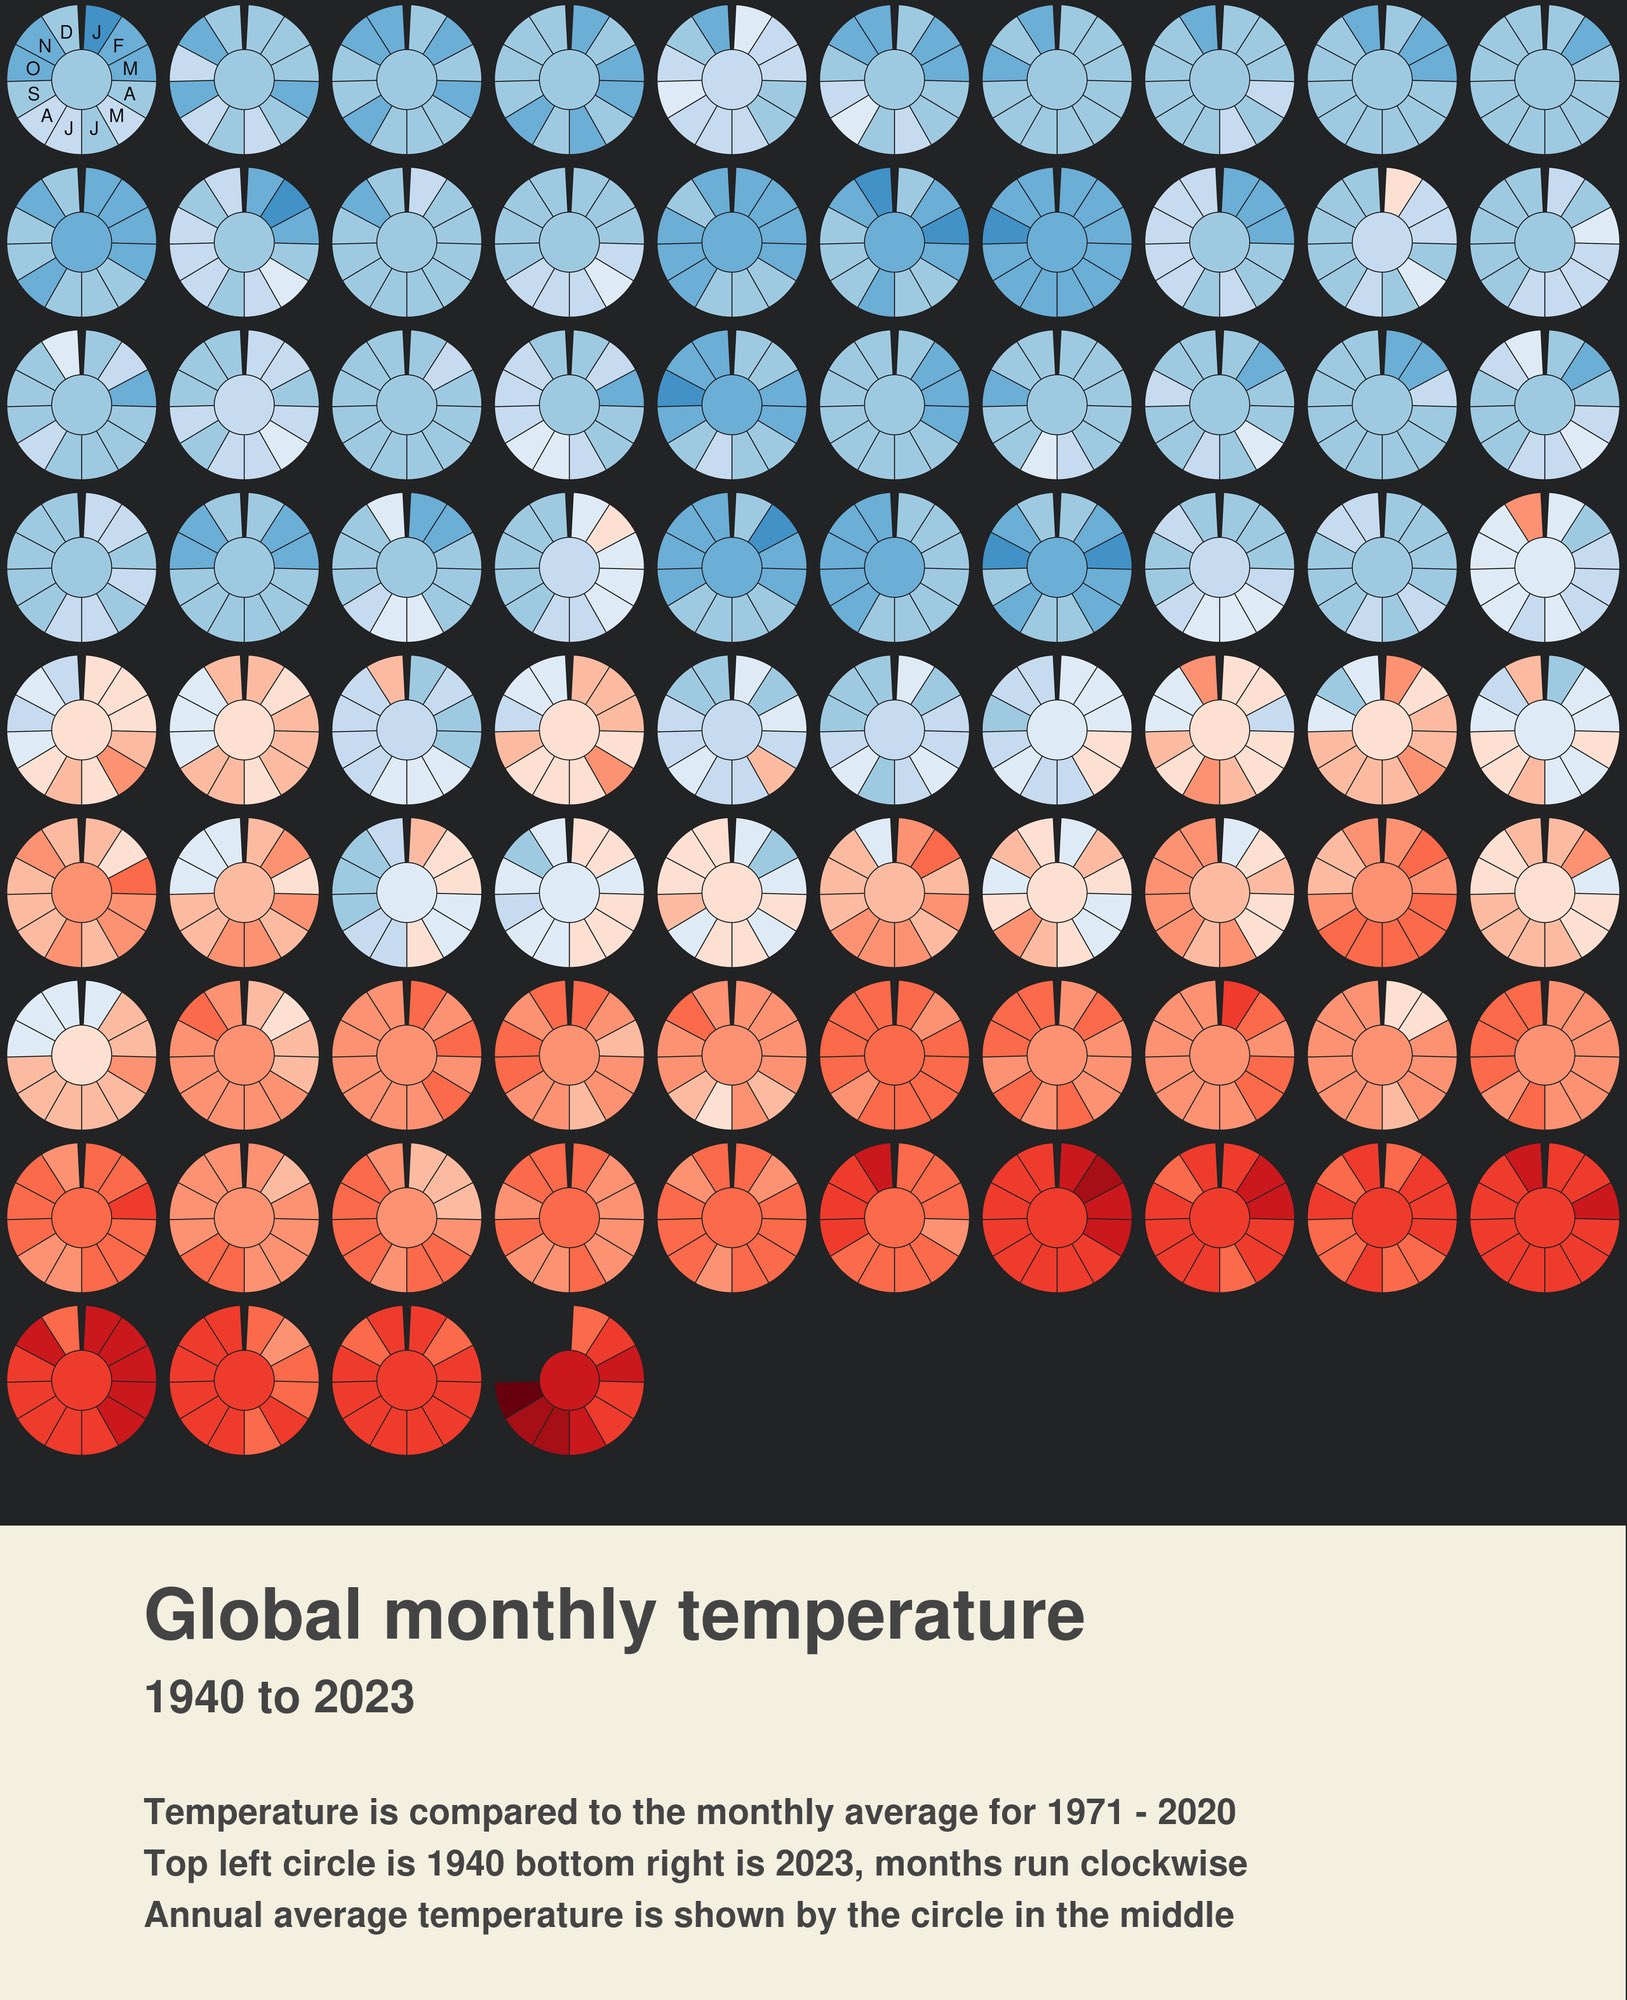
Best visualization I’ve seen of global temperature rise. Each row is a decade. Oof. So what are you going to do to help rein in the heat? — Dr. Ayana Elizabeth Johnson @ayanaeliza #ActOnClimate