Article: Scattered tree death contributes to substantial forest loss in #California — Nature #ActOnClimate

In panel a, the orange circles denote the total count of dead trees in each national forest. Supplementary Table 3 provides the lookup table for national forest abbreviations. The underlying map represents the percentage of tree mortality, which is the count of detected dead trees against the count of all trees in 2011 within 240 × 240 m grids43. Only forests, shrublands, and grasslands that are contained in the National Land Cover Database 201963 and ESA WorldCover 202064 are included in the mapping (Methods). b Total number of dead trees and spatial coverages for 16 main logical ecological groupings of forest types in California44. c Box plots of percentages of tree mortality per ha for each forest-type group. The boxes represent the interquartile range (IQR) which is between the 25th and the 75th percentile of the percentages of tree mortality. The whiskers represent 1.5 times the IQR. The white lines inside the boxes represent the medians. The notches inside boxes represent the 95% confidence intervals for the medians. Random selection of 30% of the pixels per forest-type group was applied to mitigate the spatial auto-correlation. The colour scheme used in panels a, b is consistent with the forest-type group map (Supplementary Fig. 7), representing different forest-type groups.

Click the link to access the report on the Nature website (Yan ChengStefan OehmckeMartin BrandtLisa RosenthalAdrian DasAnton VrielingSassan SaatchiFabien WagnerMaurice MugabowindekweWim VerbruggenClaus Beier & Stéphanie Horion). Here’s the abstract:

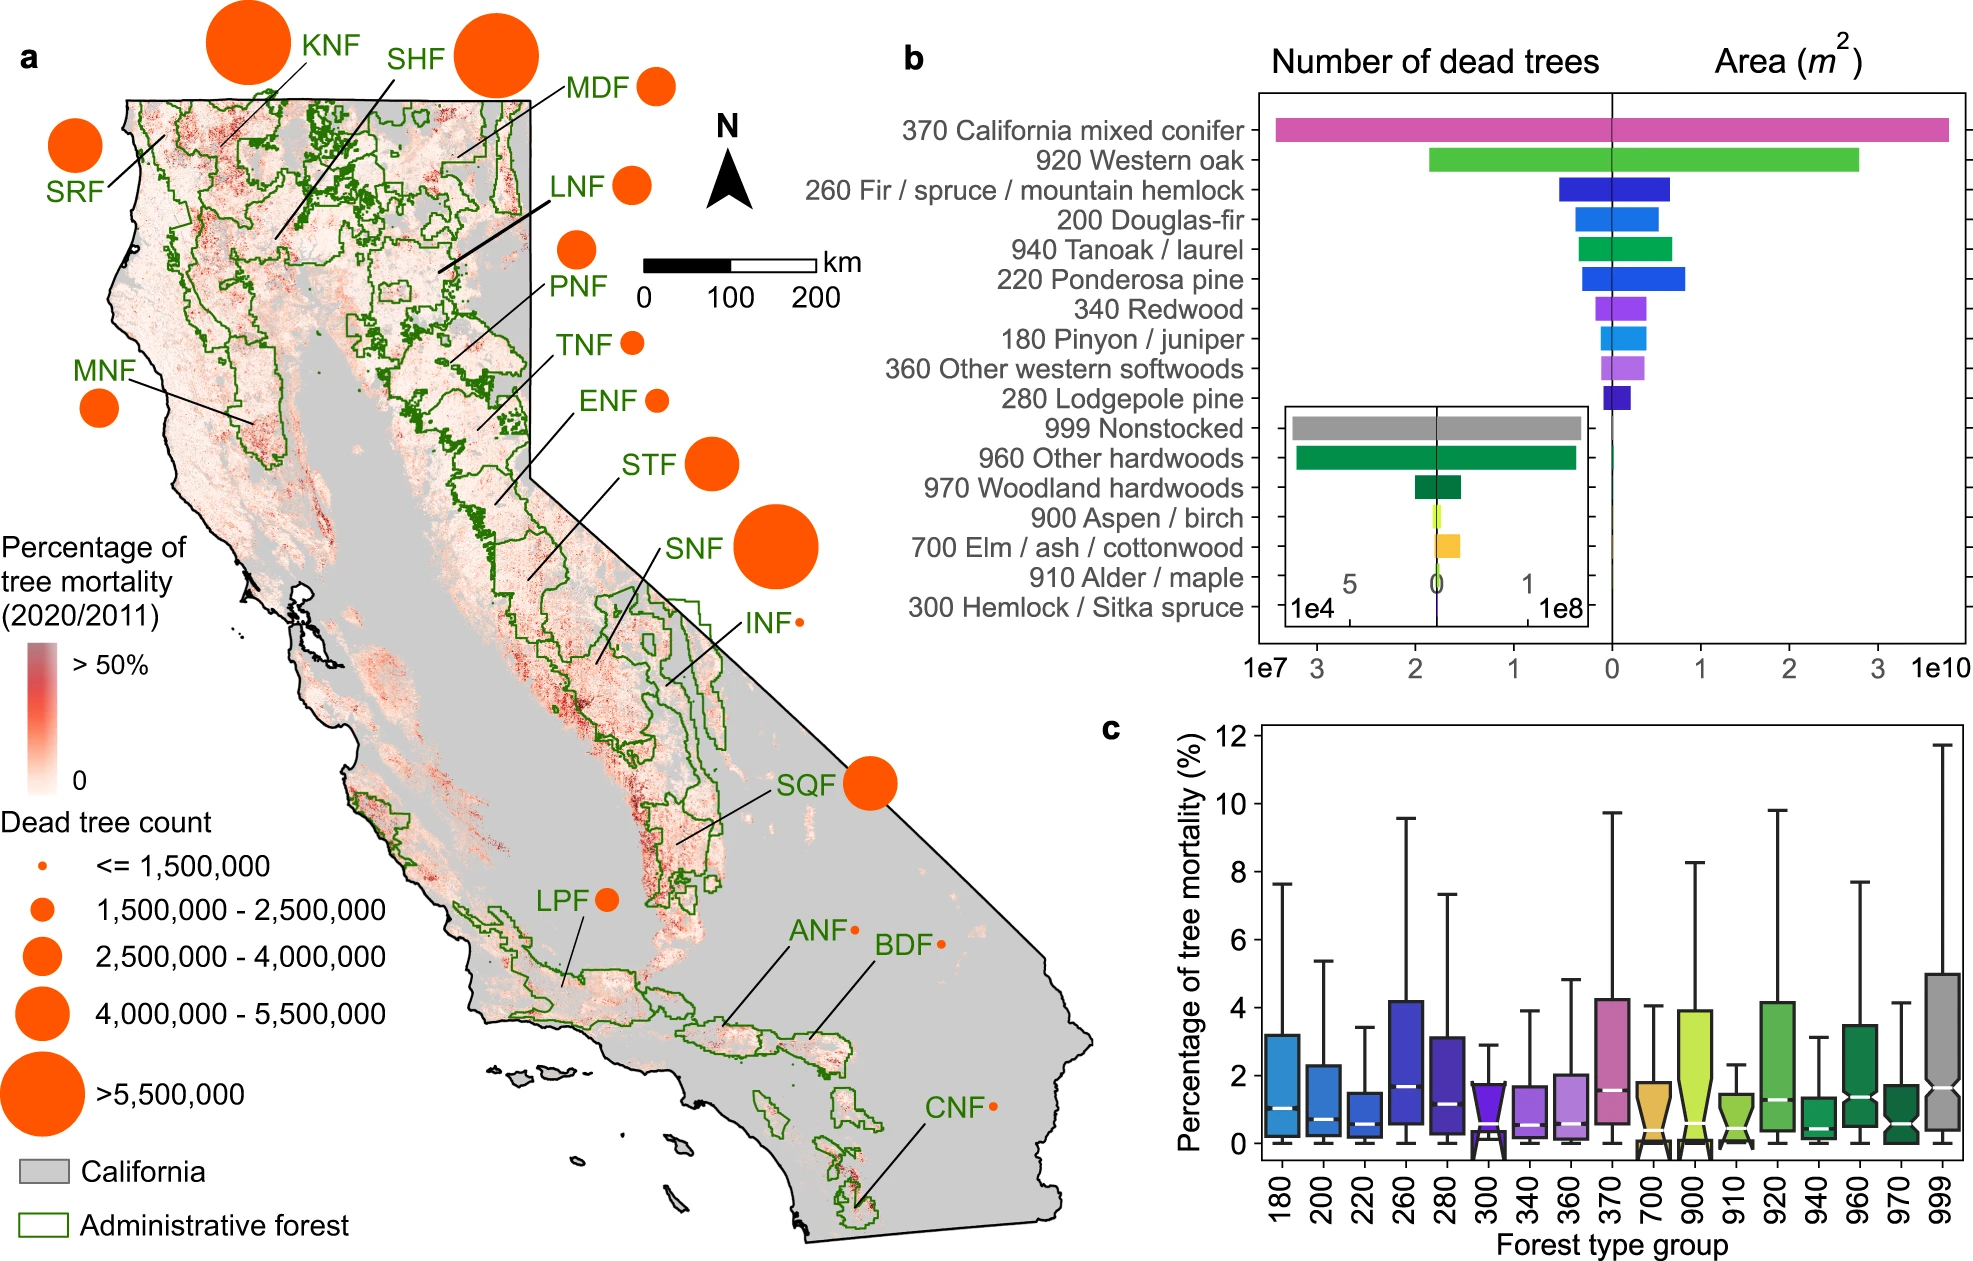
In recent years, large-scale tree mortality events linked to global change have occurred around the world. Current forest monitoring methods are crucial for identifying mortality hotspots, but systematic assessments of isolated or scattered dead trees over large areas are needed to reduce uncertainty on the actual extent of tree mortality. Here, we mapped individual dead trees in California using sub-meter resolution aerial photographs from 2020 and deep learning-based dead tree detection. We identified 91.4 million dead trees over 27.8 million hectares of vegetated areas (16.7-24.7% underestimation bias when compared to field data). Among these, a total of 19.5 million dead trees appeared isolated, and 60% of all dead trees occurred in small groups ( ≤ 3 dead trees within a 30 × 30 m grid), which is largely undetected by other state-level monitoring methods. The widespread mortality of individual trees impacts the carbon budget and sequestration capacity of California forests and can be considered a threat to forest health and a fuel source for future wildfires.

Leave a Reply