Click the link to read the release on the NRCS website:
Current snowpack stands at 114 percent of median. As Colorado welcomes the spring season, a review of March storms reveals that late-season snowstorms and consistent precipitation have led to a significant boost in snowpack and precipitation numbers across most major river basins.
Denver, CO – April 8th, 2024 – Current snowpack stands at 114 percent of median. As Colorado welcomes the spring season, a review of March storms reveals that late-season snowstorms and consistent precipitation have led to a significant boost in snowpack and precipitation numbers across most major river basins. The state experienced a marked increase in snow water equivalent (SWE) in March, ending the month at 112 percent of median snowpack. Statewide, precipitation for March was 155 percent of median and water year-to-date precipitation stands at 103 percent of median. These conditions have improved streamflow volume forecasts statewide, currently standing at 103 percent of median.
Credit: NRCS
From March 13-15, an impactful upslope storm shrouded the Front Range with SNOTELS reporting one to nearly four feet of new snow in the South Platte basin. Snowpack in the South Platte improved from 93 percent at the start of March to 115 percent by mid-March and ended the month at 121 percent. “This mid-March storm propelled many sites within this basin into the upper decile. Not only did Niwot SNOTEL receive five inches of SWE and a 41-inch increase in snow depth, ranking it third highest in its 44-year record, but this storm also mirrored these exceptional increases at numerous SNOTEL sites,” comments Nagam Gill, NRCS hydrologist. The Upper Rio Grande basin shows similar improvements and boosted snowpack at the start of the month from 84 to 96 percent mid-month.
As Colorado surpasses the historical peak SWE date, typically in early April, our focus shifts from accumulating snowpack to the streamflow forecasts. The April 1 forecasts show improvement with most basins above median. Notably, 43 out of 87 streamflow monitoring stations have forecasted streamflow volumes above median. In the combined Yampa-White-Little Snake River basin streamflow volumes are forecasted at 120 percent and have all nine streamflow monitoring stations anticipating above median flows. Despite these positive developments, certain basins have not fully rebounded from the earlier deficits in the water year. “Statewide precipitation from October to December 2023 was at 80 percent, ranging from 59 to 87 percent across basins,” says Gill. “This below-median precipitation early in the water year could mean drier soils which would need to absorb more snowmelt, potentially affecting streamflow efficiency.” The combined San Miguel-Dolores-Animas-San Juan River basin, while receiving above median March precipitation at 145 percent, stands at 82 percent of median streamflow forecasts, reflecting a water year-to-date precipitation of 92 percent of median. The South Platte River basin benefitted from upslope storms, enhancing precipitation medians, and echoing this uptick in the streamflow volumes, with all 12 stations reporting near or above median 50% exceedance forecasts. Streamflow forecasts in the Upper Rio Grande and the Arkansas River basins are anticipating 96 and 107 percent, respectively. The Colorado Headwaters and Gunnison River basins are both forecasted above median streamflow at 105 and 104 percent, respectively.
Although we await more detailed reservoir data, preliminary figures at the end of March indicate that storage levels have generally kept pace with historical medians ranging from 86 to 116 percent of median. The Yampa-White-Little Snake and South Platte River basins are maintaining near normal reservoir storage at 103 and 99 percent of median, respectively. The combined San Miguel-Dolores-Animas-San Juan River basin is at 86 percent with Navajo Reservoir at 82 percent of historical capacity.
View of West Tennessee Creek from Northern Lode inholding. Photo credit: USFS
From email from the USFS:
LEADVILLE, Colo., April 9, 2024 – The Leadville Ranger District of the Pike-San Isabel National Forests & Cimarron and Comanche National Grasslands in partnership with the Wilderness Land Trust, announce the acquisition of the 10.2 acre Northern Lode inholding located in Lake County near Leadville, Colorado. The entire property is within the boundary of the Holy Cross Wilderness. Acquisition of the inholding is under the authority of the Organic Act of August 3, 1956. Under the Wilderness Act of September 2, 1964, this parcel will be automatically designated as wilderness and will be precluded from development.
Wilderness areas provide a natural environment for plant and animal species, protect watersheds that provide clean drinking water to surrounding communities, filter and clean the air, sequester carbon and offer opportunities for solitude and recreation in a place mostly undisturbed by modern human development. The acquired parcel is only accessible by foot or horse travel and does not have any roads or trails. It has scenic views of the West Tennessee Creek drainage and the Continental Divide. Part of it straddles the ridgeline that runs between Galena Mountain and Homestake Peak, about a half mile from the West Tennessee Creek Lakes Trail #1499 and 3.25 miles from National Forest System Road 131. Historically, this parcel was utilized for mining and mineral exploration consisting of prospecting pits and horizontal passages for the purposes of access or drainage.
“The Wilderness Land Trust worked with the landowner for over a year before we were able to acquire the property in February 2022. This property was important for us to pick up firstly because it was a true wilderness inholding,” said Kelly Conde, lands specialist with Wilderness Land Trust. “It is located on a very steep slope, just below 13,000-foot Homestake Peak. Any mineral development would have had a big impact on the landscape. Secondly, this was the second to last private inholding on the Pike-San Isabel side of the Holy Cross Wilderness. As an organization that is dedicated to filling in the holes in our wilderness areas, it was exciting to be able to pick up and transfer the inholding to the U.S. Forest Service.”
“This is a great acquisition because wilderness inholdings can change the character and solitude of an area if developed,” said Leadville District Ranger Patrick Mercer. “Just by consolidating the land ownership, current and future preservation of the Holy Cross Wilderness takes a big step forward. I’m really pleased that the team was able to get this across the finish line.”
The acquisition of the parcel falls within one of the categories that may be excluded from documentation in an Environmental Impact Statement or Environmental Analysis. A project or case file and decision memo are not required under 36 CFR 220.6(d)(6). Through the process of scoping and interdisciplinary review, no extraordinary circumstances significantly affecting the environment were found to exist.
One soldier with team of six dogs and sled at foot of Homestake Peak. Wikane, J. Harry (John Harry), 1915-1999. Date: 1943 via Denver Public Library Digital Collections
As part of the Administration’s commitment to combating PFAS pollution, EPA announces $1B investment through President Biden’s Investing in America agenda to address PFAS in drinking water
April 10, 2024
WASHINGTON – Today, April 10, the Biden-Harris Administration issued the first-ever national, legally enforceable drinking water standard to protect communities from exposure to harmful per-and polyfluoroalkyl substances (PFAS), also known as ‘forever chemicals.’ Exposure to PFAS has been linked to deadly cancers, impacts to the liver and heart, and immune and developmental damage to infants and children. This final rule represents the most significant step to protect public health under EPA’s PFAS Strategic Roadmap. The final rule will reduce PFAS exposure for approximately 100 million people, prevent thousands of deaths, and reduce tens of thousands of serious illnesses. Today’s announcement complements President Biden’s government-wide action plan to combat PFAS pollution.
Through President Biden’s Investing in America agenda, EPA is also making unprecedented funding available to help ensure that all people have clean and safe water. In addition to today’s final rule, EPA is announcing nearly $1 billion in newly available funding through the Bipartisan Infrastructure Law to help states and territories implement PFAS testing and treatment at public water systems and to help owners of private wells address PFAS contamination. This is part of a $9 billion investment through the Bipartisan Infrastructure Law to help communities with drinking water impacted by PFAS and other emerging contaminants – the largest-ever investment in tackling PFAS pollution. An additional $12 billion is available through the Bipartisan Infrastructure Law for general drinking water improvements, including addressing emerging contaminants like PFAS.
EPA Administrator Michael Regan will join White House Council on Environmental Quality Chair Brenda Mallory to announce the final standard today at an event in Fayetteville, North Carolina. In 2017, area residents learned that the Cape Fear River, the drinking water source for 1 million people in the region, had been heavily contaminated with PFAS pollution from a nearby manufacturing facility. Today’s announcements will help protect communities like Fayetteville from further devastating impacts of PFAS.
“Drinking water contaminated with PFAS has plagued communities across this country for too long,” said EPA Administrator Michael S. Regan. “That is why President Biden has made tackling PFAS a top priority, investing historic resources to address these harmful chemicals and protect communities nationwide. Our PFAS Strategic Roadmap marshals the full breadth of EPA’s authority and resources to protect people from these harmful forever chemicals. Today, I am proud to finalize this critical piece of our Roadmap, and in doing so, save thousands of lives and help ensure our children grow up healthier.”
“President Biden believes that everyone deserves access to clean, safe drinking water, and he is delivering on that promise,” said Brenda Mallory, Chair of the White House Council on Environmental Quality. “The first national drinking water standards for PFAS marks a significant step towards delivering on the Biden-Harris Administration’s commitment to advancing environmental justice, protecting communities, and securing clean water for people across the country.”
“Under President Biden’s leadership, we are taking a whole-of-government approach to tackle PFAS pollution and ensure that all Americans have access to clean, safe drinking water. Today’s announcement by EPA complements these efforts and will help keep our communities safe from these toxic ‘forever chemicals,’” said Deputy Assistant to the President for the Cancer Moonshot, Dr. Danielle Carnival. “Coupled with the additional $1 billion investment from President Biden’s Investing in America agenda to help communities address PFAS pollution, the reductions in exposure to toxic substances delivered by EPA’s standards will further the Biden Cancer Moonshot goal of reducing the cancer death rate by at least half by 2047 and preventing more than four million cancer deaths — and stopping cancer before it starts by protecting communities from known risks associated with exposure to PFAS and other contaminants, including kidney and testicular cancers, and more.”
EPA is taking a signature step to protect public health by establishing legally enforceable levels for several PFAS known to occur individually and as mixtures in drinking water. This rule sets limits for five individual PFAS: PFOA, PFOS, PFNA, PFHxS, and HFPO-DA (also known as “GenX Chemicals”). The rule also sets a limit for mixtures of any two or more of four PFAS: PFNA, PFHxS, PFBS, and “GenX chemicals.” By reducing exposure to PFAS, this final rule will prevent thousands of premature deaths, tens of thousands of serious illnesses, including certain cancers and liver and heart impacts in adults, and immune and developmental impacts to infants and children.
This final rule advances President Biden’s commitment to ending cancer as we know it as part of the Biden Cancer Moonshot, to ensuring that all Americans have access to clean, safe, drinking water, and to furthering the Biden-Harris Administration’s commitment to environmental justice by protecting communities that are most exposed to toxic chemicals.
EPA estimates that between about 6% and 10% of the 66,000 public drinking water systems subject to this rule may have to take action to reduce PFAS to meet these new standards. All public water systems have three years to complete their initial monitoring for these chemicals. They must inform the public of the level of PFAS measured in their drinking water. Where PFAS is found at levels that exceed these standards, systems must implement solutions to reduce PFAS in their drinking water within five years.
The new limits in this rule are achievable using a range of available technologies and approaches including granular activated carbon, reverse osmosis, and ion exchange systems. For example, the Cape Fear Public Utility Authority, serving Wilmington, NC – one of the communities most heavily impacted by PFAS contamination – has effectively deployed a granular activated carbon system to remove PFAS regulated by this rule. Drinking water systems will have flexibility to determine the best solution for their community.
EPA will be working closely with state co-regulators in supporting water systems and local officials to implement this rule. In the coming weeks, EPA will host a series of webinars to provide information to the public, communities, and water utilities about the final PFAS drinking water regulation. To learn more about the webinars, please visit EPA’s PFAS drinking water regulation webpage. EPA has also published a toolkit of communications resources to help drinking water systems and community leaders educate the public about PFAS, where they come from, their health risks, how to reduce exposure, and about this rule.
“We are thankful that Administrator Regan and the Biden Administration are taking this action to protect drinking water in North Carolina and across the country,” said North Carolina Governor Roy Cooper. “We asked for this because we know science-based standards for PFAS and other compounds are desperately needed.”
“For decades, the American people have been exposed to the family of incredibly toxic ‘forever chemicals’ known as PFAS with no protection from their government. Those chemicals now contaminate virtually all Americans from birth. That’s because for generations, PFAS chemicals slid off of every federal environmental law like a fried egg off a Teflon pan — until Joe Biden came along,” said Environmental Working Group President and Co-Founder Ken Cook. “We commend EPA Administrator Michael Regan for his tireless leadership to make this decision a reality, and CEQ Chair Brenda Mallory for making sure PFAS is tackled with the ‘whole of government’ approach President Biden promised. There is much work yet to be done to end PFAS pollution. The fact that the EPA has adopted the very strong policy announced today should give everyone confidence that the Biden administration will stay the course and keep the president’s promises, until the American people are protected, at long last, from the scourge of PFAS pollution.”
“We learned about GenX and other PFAS in our tap water six years ago. I raised my children on this water and watched loved ones suffer from rare or recurrent cancers. No one should ever worry if their tap water will make them sick or give them cancer. I’m grateful the Biden EPA heard our pleas and kept its promise to the American people. We will keep fighting until all exposures to PFAS end and the chemical companies responsible for business-related human rights abuses are held fully accountable,” said Emily Donovan, co-founder of Clean Cape Fear.
More details about funding to address PFAS in Drinking Water
Through the Bipartisan Infrastructure Law, EPA is making an unprecedented $21 billion available to strengthen our nation’s drinking water systems, including by addressing PFAS contamination. Of that, $9 billion is specifically for tackling PFAS and emerging contaminants. The financing programs delivering this funding are part of President Biden’s Justice40 Initiative, which set the goal that 40% of the overall benefits of certain federal investments flow to disadvantaged communities that have been historically marginalized by underinvestment and overburdened by pollution.
Additionally, EPA has a nationwide Water Technical Assistance program to help small, rural, and disadvantaged communities access federal resources by working directly with water systems to identify challenges like PFAS; develop plans; build technical, managerial, and financial capacity; and apply for water infrastructure funding. Learn more about EPA’s Water Technical Assistance programs.
More details about the final PFAS drinking water standards:
For PFOA and PFOS, EPA is setting a Maximum Contaminant Level Goal, a non-enforceable health-based goal, at zero. This reflects the latest science showing that there is no level of exposure to these contaminants without risk of health impacts, including certain cancers.
EPA is setting enforceable Maximum Contaminant Levels at 4.0 parts per trillion for PFOA and PFOS, individually. This standard will reduce exposure from these PFAS in our drinking water to the lowest levels that are feasible for effective implementation.
For PFNA, PFHxS, and “GenX Chemicals,” EPA is setting the MCLGs and MCLs at 10 parts per trillion.
Because PFAS can often be found together in mixtures, and research shows these mixtures may have combined health impacts, EPA is also setting a limit for any mixture of two or more of the following PFAS: PFNA, PFHxS, PFBS, and “GenX Chemicals.”
EPA is issuing this rule after reviewing extensive research and science on how PFAS affects public health, while engaging with the water sector and with state regulators to ensure effective implementation. EPA also considered 120,000 comments on the proposed rule from a wide variety of stakeholders.
Background:
PFAS, also known as ‘forever chemicals,’ are prevalent in the environment. PFAS are a category of chemicals used since the 1940s to repel oil and water and resist heat, which makes them useful in everyday products such as nonstick cookware, stain resistant clothing, and firefighting foam. The science is clear that exposure to certain PFAS over a long period of time can cause cancer and other illnesses. In addition, PFAS exposure during critical life stages such as pregnancy or early childhood can also result in adverse health impacts.
Across the country, PFAS contamination is impacting millions of people’s health and wellbeing. People can be exposed to PFAS through drinking water or food contaminated with PFAS, by coming into contact with products that contain PFAS, or through workplace exposures in certain industries.
Since EPA Administrator Michael S. Regan announced the PFAS Strategic Roadmap in October 2021, EPA has taken action – within the Biden-Harris Administration’s whole-of-government approach – by advancing science and following the law to safeguard public health, protect the environment, and hold polluters accountable. The actions described in the PFAS Strategic Roadmap each represent important and meaningful steps to protect communities from PFAS contamination. Cumulatively, these actions will build upon one another and lead to more enduring and protective solutions. In December 2023, the EPA released its second annual report on PFAS progress. The report highlights significant accomplishments achieved under the EPA’s PFAS Strategic Roadmap.
Products that contain PFAS. Graphic credit: Riverside (CA) Public Utilities
Click the link to read the article on the NOAA website:
April 8, 2024
Severe storms brought large hail and tornadoes to portions of the Midwest; blizzard buried parts of California under feet of snow
Key Points:
March 12–15 saw the most intense severe weather outbreak of the year through March 31 after powerful storms brought baseball-sized hail and more than 20 tornadoes to portions of the Midwest, resulting in significant damage and loss of life.
A blizzard blasted parts of California’s Sierra Nevada with gusts of up to 190 mph and more than 10 feet of snow at the beginning of March.
March 2024 was the 17th-warmest March on record for the nation and precipitation ranked in the wettest third of the historical record for the month.
Other Highlights:
Temperature
The average temperature of the contiguous U.S. in March was 45.1°F, 3.6°F above average, ranking 17th warmest in the 130-year record. March temperatures were above average across much of the contiguous U.S., while below-average temperatures were observed in small pockets of the West and Southwest.
The Alaska statewide March temperature was 14.1°F, 3.3°F above the long-term average, ranking in the warmest third of the 100-year period of record for the state. Above-average temperatures were observed across much of the state with near-normal temperatures in parts of the North Slope, Interior, Southwest and parts of the Aleutians and Panhandle.
For January–March, the average contiguous U.S. temperature was 39.4°F, 4.2°F above average, ranking fifth warmest on record for this period. Temperatures were above average across most of the contiguous U.S., while record-warm temperatures were observed in parts of the Northeast. Wisconsin, Michigan, New York, Vermont, New Hampshire and Maine each ranked second warmest for the January–March period.
The Alaska January–March temperature was 9.4°F, 3.5°F above the long-term average, ranking in the warmest third of the historical record for the state. Much of the state was above normal for the three-month period while temperatures were near average across the eastern portions of the state and in parts of the Aleutians and Panhandle.
Precipitation
March precipitation for the contiguous U.S. was 2.85 inches, 0.34 inch above average, ranking in the wettest third of the historical record. Precipitation was above average across much of the West, in the Great Lakes and along the Gulf and East coasts and in parts of the northern Plains. Conversely, precipitation was below normal across much of the Ohio Valley, the Plains, and in parts of the Northwest and Florida. Maine and Rhode Island each had their second-wettest March on record.
Alaska’s average monthly precipitation ranked in the middle third of the historical record. Precipitation was above average in parts of the North Slope, West Coast and Southeast, while below-normal precipitation was observed in parts of the central Interior, south-central Alaska and in parts of the Panhandle during the month.
The January–March precipitation total for the contiguous U.S. was 8.15 inches, 1.19 inches above average, ranking 10th wettest in the 130-year record. Precipitation was above average across much of the contiguous U.S., with Rhode Island having its second-wettest year-to-date period on record. Conversely, precipitation was below average across much of the northern Plains and in small parts of the Northwest, central and southern Plains, Ohio Valley and Southeast during the January–March period.
The January–March precipitation for Alaska ranked in the wettest third of the 100-year record, with above-average precipitation observed in parts of the North Slope, West Coast and Southeast, while below-normal precipitation was observed in parts of the central Interior and south-central Alaska, as well as southern portions of the Panhandle during this period.
A map of the U.S. plotted with significant climate events that occurred during March 2024. Please see the story below as well as more details in the report summary from NOAA NCEI at http://bit.ly/USClimate202403 offsite link. (Image credit: NOAA/NCEI)
Billion-Dollar Disasters
One new billion-dollar weather and climate disaster was confirmed in March 2024 after a severe weather event impacted the central and southern U.S. during mid-March, with the most severe weather occurring on March 13–15. The U.S. has sustained 378 separate weather and climate disasters since 1980 where overall damages/costs reached or exceeded $1 billion (including CPI adjustment to 2024). The total cost of these 378 events exceeds $2.675 trillion.
Other Notable Events
Five wildfires, including the Smokehouse Creek wildfire, were finally contained in the Texas Panhandle, the largest cattle-producing region in the world. The wildfires resulted in approximately 1.1 million acres scorched, hundreds of destroyed structures, hundreds of miles of ruined fencing and more than 7,000 dead cattle.
Winter did not bring heavy snowfall to Wisconsin nor the temperatures necessary to maintain the snow, allowing fires to begin early and in high numbers. Between January–March 2024, there have been more than 220 fires across Wisconsin. A 5.25-inch diameter hail stone fell in Ada, Oklahoma on March 14, which is the largest stone reported in Pontotoc County since 1950, as well as the largest to fall in the state in nearly 13 years.
A state of emergency was declared for Ohio as several tornadoes struck the state, resulting in 3 fatalities on March 14 when an EF-3 tornado crossed Auglaize and Logan Counties.
US Drought Monitor map April 2, 2024.
Drought
According to the April 2 U.S. Drought Monitor report, about 18% of the contiguous U.S. was in drought, down about 3.6% from the end of February. Drought conditions expanded or intensified in portions of the Plains and in parts of the Northwest, central Mississippi Valley, northern Great Lakes and Hawaii this month. Drought contracted or was reduced in intensity across much of the Mississippi Valley, Puerto Rico and the West, and in parts of the Plains, Great Lakes and Carolinas.
Monthly Outlook
Above-average temperatures are favored to impact much of the central U.S., Northwest and Northeast in April while above-average precipitation is likely from much of the Plains to parts of the East Coast and in much of the Southwest. Drought is likely to persist along portions of the Northern Tier, the Southwest, Hawaii and Puerto Rico. Visit the Climate Prediction Center’s Official 30-Day Forecasts and U.S. Monthly Drought Outlook website for more details.
Significant wildland fire potential for April is above normal across much of the Upper Midwest and in parts of the central and southern Plains. For additional information on wildland fire potential, visit the National Interagency Fire Center’s One-Month Wildland Fire Outlook.
This monthly summary from NOAA’s National Centers for Environmental Information is part of the suite of climate services NOAA provides to government, business, academia and the public to support informed decision-making. For more detailed climate information, check out our comprehensive March 2024 U.S. Climate Report scheduled for release on April 11, 2024. For additional information on the statistics provided here, visit the Climate at a Glanceand National Maps webpages.
The National Weather Service Colorado Basin River Forecast Center on Friday estimated that Lake Powell will receive 5.7 million acre-feet of water between April and July as snow melts off the mountains…That volume is 89% of the normal runoff for that time period recorded between 1991 and 2020…
Three factors determine how much water ends up in Lake Powell: the amount of snowpack on Western mountains, spring temperatures (warmer weather can cause snow to melt faster) and soil moisture (dry soil absorbs melting snow, leaving less water for reservoirs)…Snowpack jumped in March throughout the Upper Colorado River Basin, the portion of the river basin that lies above Lake Powell and includes Colorado, New Mexico, Utah and Wyoming…
(Colorado Basin River Forecast Center) This graph depicts snowpack in the Upper Colorado River Basin, which includes Colorado, Utah, New Mexico and Wyoming. SWE stands for snow water equivalent, which is the measure of how much water is in snow. As of April 1, snow water equivalent in the Upper Basin is 113% of the median snow water equivalent recorded between 1991 and 2020.
Last month, the Upper Basin saw 130% of average precipitation, bringing precipitation above Lake Powell to 102% of average for October 2023 through March 2024. But an above-average year for snow doesn’t guarantee an above-average runoff, given the forecast of warm spring temperatures and dry soil conditions. Right now, forecasters say, soil moisture across the entire Colorado River Basin — which includes Arizona, California and Nevada as the Lower Basin — is close to below normal. Soil moisture is better in the Upper Basin than in the Lower Basin. When forecasting how much water Lake Powell will get, hydrologists release three possible scenarios. On Friday, forecasters reported that there is a 10% chance that the reservoir could receive as much as 8.3 million acre-feet of water or more from April through July. In a drier scenario, there is a 10% chance that runoff could drop to 4.4 million acre-feet of water or below. The most likely case is that Lake Powell sees about 5.7 million acre-feet of water.
A bird perches upon towering mud banks left behind by a shrinking Lake Powell on July 5, 2022. A new proposal for managing the Colorado River and its reservoirs encourages states to include environmental protections as they draw up water sharing plans. Photo credit: Alex Hager/KUNC
Click the link to read the article on the KUNC website (Alex Hager):
This story is part of ongoing coverage of the Colorado River, produced by KUNC and supported by the Walton Family Foundation. It was produced in partnership with The Water Desk, an independent initiative of the University of Colorado Boulder’s Center for Environmental Journalism.
April 1, 2024
A coalition of environmental groups is proposing a new set of rules for managing the Colorado River after 2026, when the current guidelines expire. Their proposal, which aims to weave environmental protections into river management policy, comes amid heated negotiations about how the shrinking river should be shared in the future.
In March, the seven states which use the river found themselves divided into two camps, each faction publishing its own proposal for managing water. The two groups have promised to work towards consensus and are aiming to agree on a singular plan before 2026. The authors of the new environmentally-focused proposal — a group of seven conservation nonprofits — say they don’t expect their own plan will be adopted in full, but hope to encourage state and federal water managers to consider plants, animals and ecosystems while drawing up their own Colorado River policies.
“If you integrate these ideas into those annual operations, you can have your water security — which the states want — but then you also get these environmental benefits that make sure that you do have a healthy flowing river that is the foundation for the entire system,” said John Berggren, a water policy expert at Western Resource Advocates, one of the conservation groups that co-signed the proposal.
All seven of the organizations that crafted the river management proposal receive funding from the Walton Family Foundation, which also supports KUNC’s Colorado River coverage.
“New plot using the nClimGrid data, which is a better source than PRISM for long-term trends. Of course, the combined reservoir contents increase from last year, but the increase is less than 2011 and looks puny compared to the ‘hole’ in the reservoirs. The blue Loess lines subtly change. Last year those lines ended pointing downwards. This year they end flat-ish. 2023 temps were still above the 20th century average, although close. Another interesting aspect is that the 20C Mean and 21C Mean lines on the individual plots really don’t change much. Finally, the 2023 Natural Flows are almost exactly equal to 2019. (17.678 maf vs 17.672 maf). For all the hoopla about how this was record-setting year, the fact is that this year was significantly less than 2011 (20.159 maf) and no different than 2019” — Brad Udall
Current negotiations about how to share the Colorado River are driven by one defining fact: The water supply for 40 million people across the Southwest is shrinking due to climate change. Talks about how to rein in demand accordingly have been contentious since states are reluctant to cut into water supply for the cities, farms and ranches within their borders.
Fish biologist Dale Ryden holds a razorback sucker on Jan. 26, 2024. The native fish species is one of many in the Colorado River protected by the Endangered Species Act. Photo credit: Alex Hager/KUNC
The “Cooperative Conservation Alternative,” as dubbed by the environmental proposal’s authors, offers a series of ideas on how to make sure decisions about the water supply for people and businesses don’t leave the environment behind.
The first idea outlined in the proposal is the implementation of a new way of measuring how much water is stored in reservoirs along the Colorado River, with water releases adjusted accordingly. Among other tweaks to measuring reservoir storage, the proposal suggests adjusting reservoir releases according to recent trends in climate conditions. For example, the new method would take into account snowmelt lost to dry, thirsty soilswhen determining release levels following particularly dry years.
The environmental groups also want to see fish habitats considered as a factor when determining how much water is released from major reservoirs. The proposal cites the health of aquatic ecosystems in the Grand Canyon, where native fish are threatened by predatory invasive species that have been able to travel downstream due to dropping water levels in Lake Powell – the nation’s second largest reservoir.
The proposal also suggests the creation of a “Conservation Reserve,” a program that would allow water users to store some of their supply in major reservoirs. That stored water would be used to help avoid low reservoir levels that could damage infrastructure– including hydropower generators – but would not be counted when determining how much water is released from major reservoirs in a given year. The “Conservation Reserve” would replace the existing “Intentionally Created Surplus” program.
The conservation groups say the ideas in their proposal are designed to benefit the environment, but shouldn’t be seen as objectionable by the water users along the Colorado River or the states which ultimately have the most say in the river’s fate.
“That water supply is available to all of us because of the function of the river as an ecosystem itself,” said Jennifer Pitt, Colorado River program director at the National Audubon Society. “If we ignore that entirely, and the system that sustains that functioning waterway erodes and breaks down, we may lose some of its ability to deliver us water in the first place.”
Pitt also said more robust ecosystem protections can occasionally help water users stay in legal compliance with environmental rules. There are 27 species covered by the Endangered Species Act in the lower Colorado River basin, and water users can face penalties if they’re unable to leave enough water in the river to maintain healthy habitatsfor those protected species.
A toad climbs a rock in a canyon near Lake Powell on July 6, 2022. The authors of a new proposal to protect ecosystems along the Colorado River said a healthy flowing river would benefit human water users as well as plants and animals. Photo credit: Alex Hager/KUNC
The environmental proposal joins prior suggestions from the Colorado River’s upper basin states of Colorado, Utah, Wyoming and New Mexico, and a competing proposal from the lower basin states of California, Arizona and Nevada.
Native America in the Colorado River Basin. Credit: USBR
A number of the 30 federally-recognized Native American tribes that use the Colorado River may also be working on water management proposals. The Gila River Indian Community in Arizona, which has positioned itself as a major tribal player in water management talks, said it did not support the lower basin states’ plan released in March and will soon release its own suggestions for managing the river.
A separate group of 16 tribes sent a letter to the Bureau of Reclamation – the federal agency that manages Western dams and reservoirs – outlining a series of “principles” the tribes want to see reflected in final Colorado River management plans.
While the current rules for sharing the river are set to expire in 2026, the Biden administration’s water officials want to arrive at a final set of replacement rules by the end of 2024 to avoid any complication that could come from a change in presidential administration after the November election.
“The idea that we would allow this archaic little water right to disappear and watch it get siphoned off to benefit someone else’s future is really hard to take if you live and thrive here in Western Colorado.” — Colorado River District General Manager Andy Mueller
The city of Grand Junction became the latest entity to contribute to an effort to preserve a senior water right on the Colorado River Wednesday after City Council voted unanimously to pledge $1 million to the cause. The water right is from the Shoshone power plant in Glenwood Canyon, and provides 1,250 cubic feet per second under the senior right, and 158 cubic feet per second under the junior water right.
“It’s one of the oldest, largest rights on the Colorado River within our state,” said Colorado River District General Manager Andy Mueller said at Wednesday’s meeting. “It’s very unique in that it’s a non-consumptive water right built and first decreed in 1902 to generate hydroelectic power.”
In December, Xcel Energy and the river district agreed on a sale of the water rights for $99 million…Mueller said communities have relied on this water right for recreation, agriculture and development.
The White River National Forest hired two interns with funds from Pitkin County Healthy Rivers and Streams to study beaver utilization of Roaring Fork Watershed headwaters. U.S. Forest Service/Courtesy photo
The White River National Forest and Pitkin County Health Rivers and Streams gathered habitat data on the native keystone species in the Roaring Fork watershed throughout the summer of 2023.
“We didn’t have a huge sample size, but we feel like we learned enough to take some stabs at things. My impression is that there is some greater capacity on the landscape than what we have at the moment,” said Clay Ramey, a wildlife biologist with the U.S. Forest Service (USFS). “And there are places on the landscape that we might be able to make a little better by putting posts or BDAs, or structures in the creek, that beavers can glom on to, we could put beavers in those places and they might be likely to do well.”
[…]
At the random sites, they identified 47 dams and 6 lodges. Only about half, 53 sites, showed signs of current or past beaver utilization, through damns, chewed trees, and other evidence. The team concluded that the dispersion of beavers in the subwatersheds was wide and sparse. Vegetation at the sites varied if the site was occupied or unoccupied by beavers. Aspens, willows, and cottonwoods were prevalent on occupied sites. Conifers were more prevalent on unoccupied sites…Occupied sites were flatter with wider banks, flatter slopes, and lower elevation, but Ramey said that these high-elevation beavers did not always avoid high elevation…
[Lisa] Tasker and Ramsey said that a long-term goal of this study is to help the public learn to live among beavers, while also identifying potential relocation spots as necessary.
American beaver, he was happily sitting back and munching on something. and munching, and munching. By Steve from washington, dc, usa – American Beaver, CC BY-SA 2.0, https://commons.wikimedia.org/w/index.php?curid=3963858
Beavers have constructed a network of dams and lodges on this Woody Creek property. Pitkin County is betting big on beavers, funding projects that may eventually reintroduce the animals to suitable habitat on public lands. CREDIT: HEATHER SACKETT/ASPEN JOURNALISMBeaver. Photo credit: Oregon State UniversityA beaver dam on the Gunnison River. Photo: Brent Gardner-Smith/Aspen JournalismNorth American beaver (Castor canadensis)
Beaver dam analog on the Smith Fork of the Gunnison River. Screenshot from Tales on the Smith Fork — Colorado Farm & Food
Tales on th Smith Fork tells the story of a project to rehabilitate a riparian area along a stream at a ranch in western Colorado using low-tech process-based restoration and the installation of beaver dam analogs. Produced by the Colorado Farm & Food Alliance and filmmaker David Jacobson, this film was made possible with a grant from the LOR Foundation: “We work with people in rural places to improve quality of life.” Thank you Rancho Largo, David and the LOR Foundation for making this work possible.
Click the link to read the article on the Sky-Hi News website (Elliot Wenzler). Here’s an excerpt:
April 8, 2024
Conservationists point to graywater uses as a way to cut down on water consumption in the West
A bill that would allow graywater systems to be included in new homes throughout Colorado received rare unanimous approval from the Colorado House on Friday…The bipartisan House Bill 2024-1362 (Measures to Incentivize Graywater Use) is sponsored by Rep. Meghan Lukens, D-Steamboat Springs, and Rep. Marc Catlin, R-Montrose, Sen. Dylan Roberts, D-Frisco, and Sen. Cleave Simpson, R-Alamosa…Currently, local governments are permitted to opt into graywater programs. Under the bill, the whole state would be automatically allowed to include graywater systems in new constructions, but local governments could choose to opt their community out…
Since the state gave initial approval for local governments to opt into graywater programs in 2013, only six jurisdictions have chosen to do so including Pitkin County, Grand Junction, Denver, Castle Rock, Fort Collins, Broomfield and Golden. If approved by the Senate and signed by the governor, the bill would go into effect at the start of 2026.
Graywater is mentioned in the Colorado Water Plan as a possible tool for the state to meet current and future water needs. It notes there are challenges with the technology, including the effort of retrofitting existing buildings with the systems. It also includes a “general lack of interest on the part of local governments to enact local graywater ordinances,” a “lack of interest from developers” and “concerns that property owners could be resistant to operating and maintaining a graywater system within their residences” as challenges.
The Canyon Country lost an important, fierce, and sometimes curmudgeonly voicelast month when Jim Stiles died at his home in Clearwater, Kansas. Stiles founded the Canyon Country Zephyr in Moab, Utah, in 1989, and continued to publish, edit, and do much of the writing for the publication in its various forms right up to his death.
I didn’t always agree with Stiles. We sparred, sometimes heatedly, over his opposition to the designation of Bears Ears National Monument. I think we felt a similar disappointment in the gentrification of Moab and other parts of the Canyon Country, but disagreed on the causes, and had it out a couple times over that. But I always admired and respected him, his writing, his thinking, and his tenacity in “clinging hopelessly to the past,” as the Zephyr’s tagline reads.
I don’t know what will happen to Zephyr going forward, though it’s hard to imagine it without Stiles’ involvement in some form. But for now the website still exists, with archives going back to 2011. I’d suggest heading over there and checking it out while you still can.
Watch for an essay on Moab, Stiles’ old stomping ground, in next Tuesday’s Land Desk.
🥵 Aridification Watch 🐫
The Upper Colorado River snowpack appears to have peaked a day or two earlier than normal, but 10% higher. We’ll take it.
Just about normal: That sums up snowpack levels across much of the Southwest right now. And you know what? Normal feels like a reason to celebrate following more than two decades of aridification and megadrought. Except for one little thing. As the great Bruce Cockburn sings:
The trouble with normal is it always gets worse.
Okay, when it comes to snowpack it may not always get worse. But since “normal” is a moving average based on 30-year segments, and the current “normal” is pegged to 1990 to 2020 — one of the driest periods in the last 1,200 years or so — then it’s fair to conclude that normal has, indeed, gotten worse.
Note that in the Upper Rio Grande, the current snowpack level (after taking a big drop over the last couple days) is right at the 1991-2020 normal, but still below the period-of-record normal, which extends back into the super-moist 1980s. And normal on the Rio Grande typically means it will run dry through Albuquerque sometime this summer. Bummer.
March was a big one for folks getting caught in avalanches in Colorado, but fortunately there were no fatalities. So far this season avalanches have killed 13 people nationwide.
But even so, this year’s snowpack is a heck of a lot better in most places than it was a few years ago — at least so far. During that 1990-2020 period, the snowpack’s median peak for most watersheds has occurred in early April. Whether the spring runoff is as healthy as the snowpack, though, depends a lot on what happens next. A wet, cool spring could boost the snowpack even more, pushing the peak forward and delaying the peak runoff, which is good for lowland water supplies and could further boost reservoir levels.
Black line = 2024; Purple = 2023; Red = 2021. As you can see, the North Fork is sitting right at normal these days.
Southwestern Colorado’s snowpack appears to have peaked at the usual time, before dropping off rather quickly due to a pair of warm days. Note the big boosts in February and March, saving the region from a disastrous 2021-esque snowpack. Will high April winds and dust melt it off too quickly?
But a warm, windy, dry April and May? Not so good. Warm days and nights will speed up the snowmelt and affect runoff. But the real dastardly culprit is that wind (which is kicking up in the North Fork Valley as I write this), which not only sucks moisture out of the snow, but also lifts up dust from the lowlands and deposits it on the high country snowfields, lending them a reddish brown tint. That, in turn, reduces the snow’s albedo, or ability to deflect the sun’s rays, which causes the snow to melt and evaporate more quickly.
Either way, Lake Powell’s levels will rise somewhat over the next few months. The question is by how much and, more importantly, how significant the summer decline will be. Meanwhile, all that normal-ness should keep the reservoir from dropping to critically low levels for at least another year.
Oof. The snowpack in the Flathead drainage in Montana is at critically low levels right now — near record-low levels, in fact. Yikes.
The same cannot be said for reservoirs further north, however. Snowpack levels in Montana and Wyoming and much of the Northwest are frighteningly low. While those rivers aren’t endangered in the way the Colorado River is, the meagre winter snows are expected to diminish hydropower output from the Northwest’s dams this summer, which will likely force grid operators to rely more heavily on fossil fuel generation.
Dust, snow, and diminishing albedo — Jonathan P. Thompson, May 7, 2021
The McElmo Dome, Mesa Verde, and Ute Mountain, obscured by dust. Heavily grazed lands are in the foreground. The view was blotted out altogether later that day. Jonathan P. Thompson photo.
“Most of us are poor now, like I am. Many of them blame John Collier, who made us reduce our flocks and herds because there was not enough grass for all. But I think the true reason is a change in the climate. When I was a young man this whole country was covered with tall grass. We had rains enough in summer to keep it alive and growing. Now the rains do not come and the grass dies. There are fewer sheep and horses now than when our family claimed this valley, yet all you can see is sand. The grass is gone.
“All we need to be rich again is rain.“
—Navajo elder Hoskannini-Begay, who lived on Naatsis’áán, or Navajo Mountain, near the confluence of the San Juan and Colorado Rivers, to Charles Kelly in 1945
Click the link to read the article on the Big Pivots website (Allen Best):
April 4, 2023
Mike Kruger of the Colorado Solar and Storage Association explains why the big jump now and how storage has become an important component of the trade organization’s agenda.
First, a question for you: What is your first reaction to seeing the chart below. Is it wow! Or had you already realized that this was coming, this break-out year for solar in Colorado?
When I talked with Mike Kruger, who directs Colorado Solar and Storage Association, he assured me that most readers of Big Pivots will not be surprised. Most saw it coming – and, in fact, had it not been for Covid and the supply disruptions, Colorado might have had its big leap during 2021.
The chart comes from the Solar Energy Industries Association report of March 2024. The report — which brims with interesting data — says nearly 40% of Colorado’s 4,112 megawatts of installed solar capacity was installed in 2023. And that Colorado is projected to gain another 2,835 megawatts of capacity in the next five years.
Credit: Solar Energy Industries Association report of March 2024
A full admission: I said wow, and I had been tracking this story since roughly 2016 – which is one place where this story starts. Xcel Energy that year began its electric resource planning cycle. It got bids late in 2017 and announced them just after Christmas. I remember seeing the e-mail distributed by Leslie Glustrom, an Xcel shareholder and watchdog. Wind, especially, but solar, too, had delivered jaw-dropping offers. In that instant it became apparent to me that coal would soon to be in our rear-view mirror.
The Colorado Public Utilities Commission approved Xcel’s plans for a deep investment in renewables in September 2018.
That November Jared Polis was elected Colorado governor after having campaigned on a platform of 100% renewables.
In early December, Xcel Energy announced it planned to achieve an 80% reduction in carbon emissions by 2030 as compared to 2005 levels. Platte River Power Authority announced an even more ambitious goal in December but one festooned with conditions. And by the next May, Colorado had a law that required Xcel and Black Hills Energy to attain 80% decarbonization by 2030.
Kruger had arrived in the midst of this sudden pivot to take the reins of what was then called the Colorado Solar Energy Industries Association. At the time, the staff consisted of Kruger and one other individual. The organization now has six staff members, suggestive of the growth of the solar industry in Colorado.
On a recent Friday, between an emergency discussion about legislative affairs and his next appointment, Kruger talked with Big Pivots for about 25 minutes about the context for this graph and the story that lies beyond.
Big Pivots: What explains this big jump in solar during 2023 in Colorado?
Mike Kruger: We’re finally seeing the fruits of some of our labors here to decarbonize stuff. The big jump is explained largely by Thunder Wolf and Neptune, Xcel’s two big solar projects in Pueblo County. Nearly 500 MWs of new solar and 125 megawatts of battery as well. All are for Xcel Energy. And then we have the projects of the electrical cooperatives, including the 80-megawatt project out by Bennett (east of Denver). Hunter. That power goes to CORE Electric Cooperative and …
Holy Cross Energy.
Yeah. The Hunter project came on in 2023. Multiple other smaller projects entered service in 2023, too.
We’re just seeing the fruits of the labor by COSSA and other advocacy groups to decarbonize. Neptune and Thunder Wolf were a result of the solicitation in 2017 that came online in 2023. So it takes time to build these things. Obviously, we have a pandemic between them, which pushed the timeline even further.
Now that they’ve been set up, these dominoes are going to start falling. We’re going to really see hundreds, if not thousands, of megawatts of solar added to the grid every year through the rest of the decade.
In 2019, when we passed our first decarbonization bill, we had a 15-gigawatt system in Colorado. That was our peak demand. 80% of that is around 12 gigawatts of demand. Through 2019, we had installed about 2 gigawatts of renewables, mostly wind.
So, to meet those decarbonization goals, you have to build a lot of solar farms. You have to put up a lot of wind turbines. For the first time we’re seeing that legislative and policy work finally coming together.
We can only expect it to get bigger. The future now is 25 gigawatts by 2034, according to modeling by the Colorado Energy Office. To hit that we now have to add a gigawatt (of generation) every year for all the 2020s and then need to add two gigawatts a year for the first five years of the 2030s.
It’s a good time to be a solar installer, to be a solar developer. There’s a “gignormous” market in Colorado. It’s heavily competitive, but it‘s a big market.
Mike Kruger, right, and Will Toor, director of the Colorado Energy Office, after a panel discussion about net-metering at the Colorado Solar and Storage Association annual conference in February. Credit: Allen Best/Big Pivots
How deeply is this understood within your industry. And how well do you think the general public understands this?
I suspect the world’s energy geeks recognize where solar is and where it’s going to be. I don’t think they would be surprised. In fact, I think most would be frustrated that the jump didn’t happen in 2021 rather than in 2023.
And I don’t think any Big Pivots readers would be surprised. They might be surprised by the size of the jump, but we are starting from a pretty small base.
As for people writ large, they have no idea that renewables were responsible last year for 30% of Colorado’s electric grid. I think most people would be shocked. If you were an Xcel customer, it was even higher, I think close to 50%.
And you didn’t experience outages, or at least any more outrages than you have experienced previously. You lost power for four hours in 2023, like you did in 2022, like you did in 2021, right? That speaks to how well the utilities are quickly figuring this stuff out. Kudos to them. They have one job, keep the lights on, and they’re doing it with now a much higher carbon-free mix and more intermittent generation.
OK, what we see here was basically an outcome of decisions made in 2017. If memory serves me, for much of that decade prices for solar had come down 10% a year. Although I think the costs have now leveled off.
Some of the best prices we had were in that Xcel RFP from 2017. The prices are up now. They’ve elevated, but they’re still tons cheaper than the alternatives. Go back to Xcel Energy’s most recent 120-day report. Even solar-plus-storage came in cheaper than gas. Nobody bid coal, but solar would come in cheaper than coal, even from the existing coal plants.
Is it as cheap as it ever was? No. But it’s still really cheap. And I think that whether you’re a homeowner or a utility — and increasingly we’re seeing corporate buyers, such as Amazon and Google — it’s a very viable option.
That’s combined with really strong (state) policy support. Our neighbors to the west gutted their efforts on solar support and generally climate friendly policies. And now they don’t have anywhere near the decarbonized electricity system that we do.
The neighbors to the west being Utah?
Yes, specifically Utah. They have one big city, like we do. No offense to our good folks in Colorado Springs and Pueblo. And they have similar geography: lots of mountains and high desert.
Hunter Solar, located east of Denver and south of Bennett, came online in late 2023. CORE Electrical Cooperative has 45 megawatts of the generating capacity and Holy Cross Energy has 30. Photo credit: Allen Best/Big Pivots
So your members are not surprised by this. They knew it was coming. They might’ve wished that it had happened earlier, if not for Covid. Is that surge then reflected in your organization? By that, I mean the number of members you have. And I’ve been noticing that you have added staff.
It’s a “virtuous cycle.” When I started, it was me and one other individual, and we had, I think it was, 83 to 85 members. We didn’t exactly know how many we had. This week we crossed 300 members. Now, we’re at almost four times the size. And I’ve gone from me and a single individual to now me and five others. We have six on our staff.
My membership has invested in me and the organization, and we have won a bunch of policy victories, which then opens the market even further. And then that allows those folks to invest further in the policy and advocacy work that we do.
We are getting pretty close to the top. An annual survey of companies doing work in each market shows about 350 in Colorado, and I have 300 of them. Using the kind-of-standard 80-20 rule. I think we’re probably pretty close to the top as far as membership numbers go.
That doesn’t mean those members won’t continue to grow. Part of the point of our work is to ensure that members who are currently doing two rooftop systems a week can, if their customer demand is there, expand to five a week.
Or consider Sandbox Solar in Fort Collins, which started in 2015. They were exclusively a rooftop company. All they did was residential rooftop. Now they’ve expanded into the commercial-industrial market and can be successful with multiple footprints. They’re a different company now than when they started.
If memory serves me, you came on in 2018, right?
Correct. I think my first day was Oct. 1. Then we (his family) moved here right around Halloween.
Then in the spring of 2019, my board said, we’re rebranding. We’re adding storage, so rename us, rebrand us, build a new website.
How important is that storage as a component of what you do? Do you have companies that are storage exclusive?
We have some companies that are exclusively developers of storage on a large scale.
Increasingly, we have solar folks expanding (into storage) Photon Brothers is a really good example. The company has been doing rooftop systems for maybe 10 years, and they are now the leading installer of (Tesla) Powerwalls in the state because they’ve really leaned into that. They have a group of customers for which they know so this makes good sense.
For solar of 20 megawatts or more to be bid into a utility RFP without the option to have batteries is almost unheard of.
In places that have price signals, like time-of-use rates, we see batteries being used there and also in places that are prone to outages. So we’re definitely seeing that as an expanded business opportunity, but almost always by a solar company that’s moving into that space. The exception, like I said, we have a few large-scale companies that do only battery storage.
Mike Kruger, right, chats with Kevin Smith, then chief executive of Lightsource bp, upon the near completion of the Bighorn solar project in October 2021. The 300 megawatt solar project was built for Evraz, the owner of the steel mill in Pueblo. Since then Target, Walmart and Amazon have all installed solar projects associated with their operations in Colorado. Amazon has a 6-megawatt solar project in Aurora. Credit: Allen Best/Big Pivots
Looking back to before you arrived in Colorado, your predecessors spent a fair amount of time at the PUC and in meetings, trying to work toward policies. But it’s my sense that you now have two attorneys that can be engaged in the PUC process. Are there signal accomplishments that you think you’ve been able to achieve in the policy realm?
Some of the stuff I’m proudest of is still working its way through.
First, I want to be clear that I stand on the shoulders of the folks that came before me. I didn’t come into an organization that I created from scratch. We’re actually celebrating our 35th anniversary this year.
One item I’m very proud of is that we just got a tariff from Xcel and Black Hills about multi-unit net-metering so that for apartment dwellers you can put a large solar array on-site somewhere in the apartment or on the roof and the individual apartment occupants and renters can get solar credits. That’s a huge market that has not been tapped. That was a single issue that we pushed. There really wasn’t a lot of other folks pushing it. Once we got it to the Legislature and brought it to people’s attention, we picked up some allies. That’s one I’m proud of.
The most recent Xcel electric resource plan had a lot of small details, but those details add up. We’re getting 5,300 megawatts of new renewables being procured.
One of our big wins was in Xcel’s initial filing, they only wanted 400 megawatts of batteries. We forced them back to the drawing board. They are ending up buying 1,848 megawatts of batteries. So, more than four times what was originally planned.
Once you get all those batteries on the grid, we will better be able to integrate renewables. We’ll decarbonize faster. We’ll have less need for gas-peakers. And we’ll have an increasingly stable grid, right?
Batteries solve a lot of the intermittency issues that had had many utilities concerned. They don’t solve everything. I get that lithium-ion batteries have four-hour windows or six-hour windows. But four hours is better than nothing. And energy geeks like the Big Pivots readers will know that we really are only worried about four hours or thereabouts most days. Except for—
When you’re worried about a hundred hours when the wind isn’t blowing, right?
Yeah, exactly. There will be some point in the future when we have 10 days of no sun, no wind, and it will be dastardly cold or whatever. And we’ll need something bigger than that.
That’s why COSSA is involved in some of the conversations about regional markets and expanded transmissions, because it may be brutally cold here with no wind and no solar, but it won’t be in New Mexico or it won’t be in Idaho.
Hopefully we’re smart enough to grab a big geographic footprint to offset those few occasions.
Allen, there’s plenty more to do. The state is far from decarbonized. We have some policies in place, but not enough. And then we’re adding a boatload of new load (demand), right? New electrification of vehicle and fleets and industrialization and buildings. We’ve haven’t solved any of that. It’s a huge opportunity for my membership. It’s millions and millions of dollars of new private investment in mitigating climate change that we haven’t even tapped into yet.
Any workforce issues? As we talk about decarbonizing buildings, it’s brought up again and again that we don’t have the workforce familiar with heat pumps, for example.
Yes and no. Right now, solar is kind of in a steady state where we’re not hiring but we’re not firing. If you’ve been a student of this for a long time, we’ve had the “solar coaster” where we’ve ramped up and hired a bunch of folks and then the bottom dropped out and we let a bunch of folks go. Right now I think things are pretty steady state.
However, like other trades, we struggle to attract new individuals. You can make a lot of money being a crew lead or being a sales lead or a chief designer, but maybe it’s on us to do a better of communicating that. It’s not as sexy as say, going to Harvard or getting your master’s degree from CU or whatever.
All the trades have this problem. That includes plumbers and electricians. I applaud a bipartisan effort to draw attention to that through education. Honestly, though, if you wanted to become an electrician today, if you know where to look, you can do it for free. The grants are available, the training is available, and you can end up with a $150,000 job and have no debt.
Percentage of State’s Electricity from Solar: 9.03%.
Solar Companies in State: 394 (38 Manufacturers, 182 Installers/Developers, 174 Others).
Total Solar Investment in State: $7.7 billion.
Prices have fallen 47% over the last 10 years.
Growth Projection: 2,836 MW over the next 5 years (ranks 19th).
OK, and you have to go in a minute, but let’s talk land use.
I am not totally convinced that we have a problem to solve yet. I think there is potential for conflict, whether that’s on the local community with NIMBys or the environmentalists who are worried about specific species or ecosystems. However, we don’t have them yet.
For us to be solving a problem at the Legislature that we don’t have yet feels a little premature. I know there are folks on the other side who say, well, we should solve them before they become a problem. I get a little worried about solving a problem that doesn’t exist because we might solve it in the incorrect way and create all kinds of unintended consequences. Coming up on seven weeks left in the session, we don’t have a bill yet. To my knowledge, there’s still not an agreement about what a bill should contain.
But things could move quickly – as always.
And then Kruger was off to his next meeting. The land use in question was a non-bill that has been getting a lot of attention – including from Big Pivots. See: “Should Colorado tell counties how to review renewable projects?” It would set a statewide standard for evaluating renewable energy projects by towns, cities and county governments. In late February, Sen. Chris Hansen told Big Pivots he planned to introduce it during March. As of early April, it has not.
What will have to wait are my questions about hail and solar panels. My in-house editor wants to know whether Colorado’s proclivity for hail made it somewhat less attractive to solar developers.
And then there’s the question about all those acres and acres of warehouse roofs that are proliferating along I-70 and I-76 on the eastern and northeaster edges of metropolitan Denver. What role might they place in the future? Will they be covered with solar panels some day?
Author’s note: My “Extinction Countdown” column will mark its 20th anniversary this summer. As that milestone approaches, let’s look back at some previous entries, which I’ll update for the world we find ourselves in today. A version of this article was published in 2016 in Scientific American.
Japanese knotweed. Purple loosestrife. Kudzu. Mesquite. Giant hogweed. Bitou bush. What do these plants have in common? Easy: They’re among the most “invasive” plant species on the planet. When humans bring these highly adaptable, fast-growing plants to new ecosystems, whether it’s on purpose or by accident, native species often get squeezed out and pushed toward extinction.
But, unlike predators such as rats and cats — which have threatened animal species and caused extinctions around the globe — have displaced plants like kudzu ever actually driven another plant species extinct? The authors of a 2016 paper published in the journal AoB Plants couldn’t document any confirmed cases.
Not yet, anyway. But that’s only because globalization is a relatively recent phenomenon.
“The main reason why there is no clear evidence of extinction that can be exclusively attributed to plant invasions is that invasions have not been around long enough,” co-author Dave Richardson of the Centre for Invasion Biology at Stellenbosch University, South Africa, said in a prepared release. “Our research shows that plant extinction is an agonizingly slow process. However, red flags are evident in numerous locations around the world — species that now exist in fragmented populations, with radically reduced opportunities to reproduce.”
Richardson and co-author Paul Downey from the University of Canberra looked at these “red flags” and came up with a six-point “extinction trajectory” for native plant species facing threats from displaced vegetation:
Plants die more quickly than they can be replaced by their offspring in some locations.
Plants disappear from some locations entirely, but potential offspring remain as “propagules,” seeds or spores that could regenerate a new cohort of individuals.
Some locations lose both individual plants and their propagules. With no plants or seeds, this is a local extinction.
The last locations hosting a species lose their individual plants, but in some places seeds or spores remain in the soil.
The species is entirely lost in the wild, with no individuals or propagules. The only survivors are held in botanic collections.
The remaining plants are lost, and the remaining seeds or spores are no longer capable of becoming new plants.
Downey said that this research suggests we need to start managing threatened plants much earlier than we currently do.
“If we wait until we have sufficient evidence to show that extinctions are occurring, it will be too late to save a great number of species,” he said. Hundreds of plants species, the authors warn, may already be functionally extinct and exist now only as “the living dead.”
The biggest risk point for many plant species appears to exist somewhere between points 2 and 4 on Downey and Richardson’s scale. As we’ve seen with many endangered plants, figuring out how to keep a species alive in a botanical setting is not as easy as simply sticking a seed in the ground. Many plants require very specific conditions in which to germinate — some rely on fire, for example, while others need to be consumed by an animal, after which stomach acids soften a seed’s outer layer before it is pooped back out. Other plants require specific pollinators, which may also disappear as humans destroy an ecosystem’s delicate balance.
Will we discover the details on how these endangered plants propagate in time to save them? That seems unlikely for many species. Another 2016 paper in Conservation Biology warned that plants in general remain understudied while scientists concentrate on mammals and other more charismatic species, much in the same way that scientists also ignore “ugly” creatures. The authors called this “plant blindness” and suggest that it could have severe implications for conservation of many species now and in the future.
As Downey and Richardson wrote in their paper, the lack of evidence for extinctions “does not mean we should disregard the broader threat.” In fact, that may just make it more urgent.
Stephen Roe Lewis, Governor of the Gila River Indian Community, speaks in Tucson, Ariz. on Mar. 13, 2024. The tribe has been a high-profile partner to federal and state water managers in recent years, but Lewis said it does not support the latest Lower Basin proposal for post-2026 Colorado River management. Credit: Alex Hager/KUNC
Click the link to read the article on the KUNC website (Alex Hager):
March 13, 2024
This story is part of ongoing coverage of the Colorado River, produced by KUNC in northern Colorado, and supported by the Walton Family Foundation.
The Gila River Indian Community says it does not support a three-state proposal for managing the Colorado River’s shrinking supply in the future. The community, which is located in Arizona, is instead working with the federal government to develop its own proposal for water sharing.
The tribe is among the most prominent of the 30 federally-recognized tribes that use the Colorado River. In recent years, it has signed high-profile deals with the federal government to receive big payments in exchange for water conservation. Those deals were celebrated by Arizona’s top water officials. But now, it is diverging from states in the river’s Lower Basin — Arizona, California and Nevada.
Stephen Roe Lewis, The Gila River Indian Community’s Governor, announced his tribe’s disapproval of the Lower Basin proposal at a water conference in Tucson, Ariz., while speaking to a room of policy experts and water scientists.
“This is not the time to be standing on the sidelines,” Lewis said. “We all have a responsibility to do what we can. And that’s why The Community can’t support the current Lower Colorado River approach as it stands now.”
The announcement adds a new wrinkle to an already-complicated process. Last week, the seven states that use the Colorado River unveiled competing plans for managing its water. The Lower Basin states revealed one, and the Upper Basin states – Colorado, Utah, Wyoming and New Mexico – revealed another. The opposing plans represent stark ideological differences between the two groups of states, marking the latest disagreement between rival camps that have argued over water management for decades.
Lewis, who has positioned his tribe as an ally to the federal government in helping save water, outlined a few major sticking points that led Gila River to work on its own proposal.
Water enters an irrigation canal on the Gila River Indian Reservation on May 7, 2021. The Gila River Indian Community is among the most important tribal players in ongoing negotiations about using water from the Colorado River. Photo by Ted Wood/Water Desk
One issue, Lewis said, is that the Lower Basin’s proposal creates an “unfair burden” on the state of Arizona. Under the proposed plan, all seven states would have to cut back on demand for water if levels in the nation’s largest reservoirs — Lake Mead and Lake Powell — drop below a predetermined trigger in the future. Arizona would take the largest of those cutbacks.
Another, he said, is that the Lower Basin’s plan does not explain how it would mitigate the impact of those potential new water cutbacks. Lewis said he would like to see plans to identify new sources of water away from the Colorado River that could replace water lost to cutbacks, or financial compensation.
States are under pressure to agree on plans to manage the river before 2026, when the current guidelines for sharing its water expire. Both of last week’s plans came just ahead of a deadline from the Bureau of Reclamation, the federal agency which manages the West’s dams and reservoirs. The deadline was an effort to get the ball rolling on new river rules with enough time to implement them before a potential change in administration after the upcoming November election.
Reclamation officials said they expect to work with states over the spring and summer and reach a draft for post-2026 river management rules by the end of 2024.
Now, Lewis and his staff are working with Reclamation on what could potentially be a third competing proposal. He said he hopes a proposal will be released in “weeks,” rather than months.
“It’s potentially not just the Gila River, because this will affect other tribes as well,” Lewis said. “I wouldn’t be surprised if other tribes started to register their concerns as well.”
As states and the federal government draw closer to a new set of river management rules, some tribes have repeatedly expressed frustration about being excluded from negotiations. Tribal communities often lack reliable access to clean water due to aging infrastructure and a history of underinvestment, and many are calling for greater inclusion going forward.
Lewis said that was not the issue in this case, and that the Gila River Indian Community was included in talks.
“We were at the table,” Lewis said. “It’s just the proposal, the finished product as it is right now, doesn’t reflect our concerns.” [ed. emphasis mine]
North American Indian regional losses 1850 thru 1890.
Click the link to read the proposed guidelines on the Water for Colorado website. Here’s the introduction:
On behalf of our respective organizations, the undersigned conservation groups (Conservation Groups or Groups) submit the Cooperative Conservation Alternative (Cooperative Conservation) to contribute to the ongoing dialogue shaping the future of the Colorado River through the post-2026 NEPA process for developing Colorado River Guidelines and Strategies.
The Groups request the Bureau of Reclamation include Cooperative Conservation in its analysis of post-2026 Colorado River Guideline Operations and Strategies as a forward-looking, comprehensive approach for addressing the pressing and evolving challenges facing the Colorado River Basin, its ecosystems, and the diverse community of sovereigns and stakeholders who rely upon its resources.
Cooperative Conservation is designed to inform and enhance one or more alternatives for consideration in developing the post-2026 Colorado River Operations and Strategies Environmental Impact Statement (EIS). It emerges from a synthesis of lessons learned, a deep understanding of the Basin’s environmental dynamics, and a commitment to collaborative, equitable water management, and endeavors to introduce innovative strategies that balance the needs of human and natural systems under the shadow of climate change and increasing water scarcity. [ed. emphasis mine]
The urgency to redefine the framework for Colorado River operations cannot be overstated. The Bureau of Reclamation’s (Reclamation) notice of intent to prepare an EIS for the post-2026 Colorado River marks a critical step toward addressing the Basin’s future needs (“Notice of Intent To Prepare an Environmental Impact Statement for Post-2026 Colorado River Operational Guidelines and Strategies for Lake Powell and Lake Mead,” 88 Fed. Reg. 12345 (June 16, 2023)). The existing guidelines, while pioneering at the time of their inception, are now recognized as insufficient to navigate the complexities of prolonged drought, escalating impacts of climate change, and pressing needs of a diverse array of sovereigns and stakeholders. Cooperative Conservation is rooted in the recognition that the Colorado River Basin has entered an era of uncertainty, where traditional management approaches must be reevaluated in light of scientific advancements, changing hydrological patterns, and the imperative of sustainability.
“New plot using the nClimGrid data, which is a better source than PRISM for long-term trends. Of course, the combined reservoir contents increase from last year, but the increase is less than 2011 and looks puny compared to the ‘hole’ in the reservoirs. The blue Loess lines subtly change. Last year those lines ended pointing downwards. This year they end flat-ish. 2023 temps were still above the 20th century average, although close. Another interesting aspect is that the 20C Mean and 21C Mean lines on the individual plots really don’t change much. Finally, the 2023 Natural Flows are almost exactly equal to 2019. (17.678 maf vs 17.672 maf). For all the hoopla about how this was record-setting year, the fact is that this year was significantly less than 2011 (20.159 maf) and no different than 2019” — Brad Udall
The significance of this Alternative lies not only in its aim to expand consideration of ways to address the immediate challenges, but also in its vision for a resilient and adaptive future that honors the interdependence of all who share this vital river. By embracing a holistic perspective that integrates scientific insight, stakeholder inclusivity, and environmental stewardship, our alternative is a framework for optimizing every drop of the Colorado River to better ensure it can remain a life-sustaining resource for future generations.
As the Conservation Groups submit this Alternative, we are mindful of the collective effort required to steward the Colorado River through the challenges ahead. We look forward to engaging in a constructive dialogue with Reclamation, the Basin States and Tribes, and all interested stakeholders involved in this essential process, united by our shared commitment to the River that sustains us all.
Map credit: AGU
Native America in the Colorado River Basin. Credit: USBR
by Jonathan Thompson, High Country News March 28, 2024
This is an installment of the Landline, a monthly newsletter from High Country News about land, water, wildlife, climate and conservation in the Western United States. Sign up to get it in your inbox.
In 2018, Brian Richter, a hydrologist and water sustainability expert, hooked a camper trailer to the car, and he and his wife embarked on a road trip up the spine of the Rocky Mountains. It was one of the driest years in a two-decade-long regional megadrought, and the entire Southwest was parched. Wildfires raged from British Columbia to Colorado, while reservoir levels continued to plummet.
As Richter traveled through the West’s uplands, he saw all the expected signs of drought: Tinder-dry forests, diminished streamflows, stressed vegetation and a ubiquitous pall of smoke that irritated eyes and lungs and blotted out the view. But he also noticed something that struck him: Nearly every valley bottom was still relatively verdant, even lush, despite the desiccating conditions.
The reason, of course, was irrigation. A major part of the settler-colonial project has been a determined effort to harness the West’s rivers and streams to raise crops and support a growing population. This has not only succeeded, it has altered much of the landscape, establishing a stark dividing line between irrigated and non-irrigated lands. “It’s part of our aesthetic as Westerners,” Richter said.
While golf courses, turf and booming desert cities gulp up a lot of water, the lion’s share of the West’s water still goes to growing crops and turning rural valleys green. Richter got to wondering: Precisely where was all that water going, and how were the different uses affecting various ecosystems? So he set out with a team of researchers to deconstruct the drivers of Western water consumption.
Irrigated landscape in McElmo Canyon in the summertime. Jonathan P. Thompson photo.
They found that 86% of the water consumed in the Western U.S. is used to irrigate crops. Everything else — from energy development to swimming pools to Las Vegas’ elaborate casino fountains — gets by on the remaining 14%. In the Colorado River Basin itself, things are marginally more balanced, with agriculture consuming about 79% of the water. Most of that, however, is used to grow food for cattle — alfalfa, hay and grass.
“We were quite surprised to see how large a proportion was going to cattle crops,” Richter told me in a Zoom interview earlier this month. The findings were published in Nature Sustainability in 2020. The article’s title — “Water Scarcity and Fish Imperilment Driven by Beef Production” — grabbed media attention and sparked many a news story that blamed the Colorado River’s demise on our appetite for cheeseburgers and steaks and the hay necessary to create them.
This spring, Richter and his team published an update of sorts, this time focusing entirely on the Colorado River. It’s the first-ever complete accounting of the system, encompassing water use from the Gila River, a tributary in New Mexico and Arizona, and all the consumptive uses[1] of the Colorado’s water, including reservoir evaporation and riparian and wetland evapotranspiration, as well as out-of-basin exports to places like Denver and the Rio Grande watershed, and water use in Mexico.
Sadly, this more complete tabulation exonerates neither bovines or beefeaters. Still, though the percentages going to cows and alfalfa farmers didn’t change significantly, it did provide more detail on those uses. Findings included:
Irrigated agriculture is by far the dominant consumer of Colorado River water, accounting for 52% of overall consumption (which includes reservoir evaporation and riparian and wetland evapotranspiration) and 74% of direct human consumption.
Cattle-feed crops (alfalfa and other hay) consume more Colorado River water than any other crop category, accounting for 32% of all water from the basin; 46% of direct water consumption; and 62% of all agricultural water consumed.
Cattle-feed crops consume 90% of all the agricultural irrigation water in the Upper Basin — three times more than is consumed by municipal, commercial and industrial uses combined.
19% of the water supports the natural environment through riparian and wetland vegetation evapotranspiration along river courses.
This accounting can help guide water managers in making the estimated 2-to-4 million acre-feet of cuts from the total annual consumption necessary to stabilize reservoir levels. Even larger reductions will be required to bring water consumption into balance with availability, as climate change-exacerbated drought and heating continues to further diminish the Colorado River. And yet, so far, the Upper Basin and Lower Basin states aren’t even close to agreeing on how those cuts should be made, or who should bear the burden.
Alfalfa and other cattle-feed crops consume 90% of all the agricultural irrigation water in the Colorado River’s Upper Basin.
The Lower Basin states — California, Nevada and Arizona — use far more water than the Upper Basin states. But when drought years shrink the Colorado River, the Upper Basin is forced to cut consumption under the 1922 Colorado River Compact. Therefore, the Upper Basin’s representatives argue, the Lower Basin should bear the burden of future cuts. The Lower Basin is willing to accept 1.5 million acre-feet of cuts, but beyond that, it wants its upstream counterparts to share the load. That amounts to an 814-billion-gallon gap between the competing proposals.
There’s a tendency to believe that rapidly growing desert cities — and ostentatiously profligate water-users, such as golf courses and lawns and swimming pools — ought to bear the burden of the cuts. But even if you cut off all the pumps in Lake Mead that serve Las Vegas, it wouldn’t make much of a difference. Southern Nevada’s consumptive Colorado River water use is about one-tenth of the Imperial Irrigation District’s in Southern California, where monumental amounts of water go to growing alfalfa and other food crops. And even as its population soars, Las Vegas is using less and less water, a phenomenon Richter terms “decoupling.”
“The only dial we have to work with is irrigated farming,” Richter said. His accounting would seem to offer an easy out: Just stop growing alfalfa and fallow the fields, or shift to less water-intensive crops. But it’s not quite that easy.
Cowgirls lasso calves so they can be branded and vaccinated at Harts Basin Ranch in April. The Delta County ranch, whose owners have been accused of water speculation, raises organic cattle.
CREDIT: HEATHER SACKETT/ASPEN JOURNALISM
Alfalfa is a paradoxical crop: It’s thirstier than other crops, yet also relatively drought-tolerant. It doesn’t need to be replanted every year, meaning that less tilling of the soil is required. It can be harvested by machine, so it doesn’t require a lot of increasingly hard-to-find human labor. And it’s always in demand: Though beef cattle numbers are on the decline in some Western states, the dairy industry is burgeoning — and alfalfa is important for dairy operations.
Rather than reducing alfalfa acreage or production, some Colorado River Basin farmers, especially in Utah and Arizona, have begun growing more since the megadrought began. The federal government has forked out millions of dollars to pay farmers to stop growing alfalfa, or at least to stop irrigating their fields. But that can only achieve a fraction of the needed cuts, and it is hardly sustainable over the long term. And, by reducing overall supply, it drives up prices for hay, incentivizing other farmers to switch to alfalfa rather than away from it.
Besides, shutting down farmers’ ditches and spigots would imperil those emerald ribbons of green that curl through the West’s dry rocky valleys. Agricultural irrigation greens up more than crops: The farm fields’ runoff and leaky canals also nurture willows and wetlands as well as the wildlife that depends on them.
It’s quite the quandary, and it’s hard to see a clear path to sustainability. What is clear is that massive changes are long overdue, and those changes will alter the Western landscape, perhaps returning it to something that resembles the days before industrial-scale irrigation began.
“It’s really intriguing to me to think about how the Western landscape is going to have to change,” Richter said. “What we’re talking about is not unlike the fossil fuel industry, especially coal, as it goes into decline. The ramifications for regional and local economies and the culture and social fabric of communities are even going to be greater, especially for agricultural communities.
“It’s going to be an interesting decade ahead,” he added. “And I sure wouldn’t want to be one of those negotiators on the Colorado River.”
We want to hear from you!
Your news tips, comments, ideas and feedback are appreciated and often shared. Give Jonathan a ring at the Landline, 970-648-4472, or send us an email at landline@hcn.org.
[1] Consumptive use is the amount of water withdrawn from the system and not returned to it. The Southern Nevada Water Authority, for example, withdraws about 450,000 acre-feet from Lake Mead annually — far more than the 300,000 acre-feet it’s entitled to under the Colorado River Compact. But it also returns more than 200,000 acre-feet in the form of treated effluent, giving it a consumptive use of 223,670 acre-feet in 2022.
This article first appeared on High Country News and is republished here under a Creative Commons license.
Click the link to read the article on the Vail Daily website (Scott Miller). Here’s an excerpt:
April 6, 2024
The good news is that the snowpack around Colorado is looking pretty good heading into spring and summer. In fact, more than 70% of the state is reporting no drought conditions, a significant change from the start of this year, when just less than 35% of the state was in zero-drought status…
After a slowish start, the snow water equivalent at measurement sites on Vail Mountain, Copper Mountain and Fremont Pass are all near or just above 100% of the 30-year median. The Copper Mountain site is nearest to the snow fields atop Vail and Shrine passes; the Fremont Pass site is closest to the headwaters of the Eagle River near Tennessee Pass…The Fremont Pass site is the highest and longest-lasting of those sites. It was also the slowest this season to hit 100% of the 30-year median, not hitting that mark until early March. All of those high-elevation sites — ranging from roughly 10,300 feet at Vail to 11,300 feet at Fremont Pass — hit their peak accumulation between late April and early May. That means we still have another few weeks to expect spring storms.
Here’s the release from Southeastern Water (Chris Woodka):
Leann Noga, a longtime employee of the Southeastern Colorado Water Conservancy District, was appointed Executive Director of the District at a special Board of Directors meeting on March 8, 2024.
“Each and every one of us very much look forward to working with you, ” Board President Bill Long said. “I think we all have confidence in you and your ability to lead the Southeastern District. It’s a great day for the District.”
Long also thanked Jim Broderick, who is retiring, for his 22 years of service to the District as Executive Director. Mrs. Noga, 43, started working for the District in 2004, and most recently was the Director of Finance and Administrative Services.
“I want to be the spokesperson for the District and carry forward the Board’s message,” Mrs. Noga said following the appointment. “The Board is made up of water experts, and I will draw on that expertise. I will lead by example and manage with fairness and accountability.”
She briefly outlined her goals:
“At the top of the list of course is finishing the Arkansas Valley Conduit,” she said. “I also want to continue to develop relationships for the District, collaborate with others on water issues and protect the District and the value of its water.”
Mrs. Noga started in the District as an administrative support specialist but constantly continued to acquire the skills and education to advance within the organization. In 2013, she earned her Bachelor of Science degree in business administration from Colorado State University-Pueblo. In 2017, she earned a Master of Finance with a specialization in human resource management from Colorado State University.
At the same time, she and her husband Pat began raising a family. They have three children: Patrick, Mikey and Kayle. Pat attended the meeting in support of his wife on Friday. Mrs. Noga is also a member of the National Water Resources Association, Colorado River Water Users Association, Colorado Rural Water Association, Government Finance Officers Association, Colorado Water Congress, Water Education Colorado and Association for Records Management Association.
The Board’s decision was unanimous and came at the end of a search for a new Executive Director that began in December 2023. Several candidates were interviewed in February and Mrs. Noga was named the sole finalist by the Board at a February 21, 2024 meeting. Other Board members voiced strong support for Mrs. Noga.
“I think there is a real belief (in the Arkansas Basin) in your capacity to take on this leadership role and guide the next chapter of the District’s history,” said Board member Greg Felt, a Chaffee County Commissioner and Chairman of the Colorado Water Conservation Board. “There are a lot of people in this basin who are really proud of you, and I think there are lot of women who are exceptionally proud of you.”
Mrs. Noga pointed out after the meeting that the Board’s decision coincidentally occurred on International Women’s Day.
“It’s not lost on me than Leann literally started at the bottom and has worked herself to the top,” said Dallas May, a rancher who represents Prowers and Kiowa Counties. He is also chairman of the Colorado Parks and Wildlife Commission. “I think that’s so commendable that somebody could and would do that, and she’s done that at the same time as raising a family.”
“I think this decision is great for the District’s future,” said Alan Hamel, who represents Pueblo County on the Board. “You have a great staff. I’m sure with your leadership and the support of all 15 Board members, you’ll move the District forward. ”
The Southeastern District was formed in 1958 and includes parts of nine counties: Bent, Chaffee, Crowley, El Paso, Fremont, Kiowa, Otero, Prowers and Pueblo. The District is the state agency for the Fryingpan-Arkansas Project and administers the project in partnership with the U.S. Bureau of Reclamation. The two agencies are working together to build the Arkansas Valley Conduit.
Some of the District’s activities include allocation of Fry-Ark Project water, operation of the James W. Broderick Hydropower Plant at Pueblo Dam, an excess capacity storage contract for Pueblo Reservoir and the Upper Arkansas Voluntary Flow Management Program.
Arkansas Valley Conduit map via the Southeastern Colorado Water Conservancy District (Chris Woodka) June 2021.
It’s the beginning of April, which signifies the beginning of the end of our snowpack season. In Colorado, our southern basins typically reach their peak snowpack in the next few days, while our northern basins still have a few more weeks to go. But by this time, we usually have a pretty good idea on how we fared this season and what our water situation might look like as we approach the summer. So let’s take a look!
At the end of March, all Colorado basins reported above median snowpack. The Arkansas basin is at the highest, with 119% of median, and the San Juan basin in southwest CO is at the lowest, with 104% of median. Despite the basin averages. there are a few individual SNOTEL sites that are a bit below average. A few sites around the San Juan mountains are showing lower snowpack, as is Park Reservoir on the Grand Mesa.
The above graph shows how the snowpack has accumulated since the beginning of October, following the black line. The green line indicates what’s typical, and the “X” shows the normal peak date and value. For the statewide average, we’re six days away from the peak, and well on target to reach and possibly exceed that normal peak.
So, what happens after we reach peak?
It’s easy to forget, but passing the peak does not mean it stops snowing. In fact, it’s very important that snow continue to accumulate in the high elevations well into May! It’s hard to tease out from the snowpack graphs (like the one above) that new snow is being added on, even in the midst of overall melting. The peak really means the mountains have hit a critical time when solar radiation, and the higher angle of the sun, are having a greater impact on the snow surface. Snowpack becomes isothermal (meaning consistent temperature of 32°F throughout the entire depth), and melting takes over.
The graphic above is a pretty cool product produced by the NRCS. Focusing in on the Colorado Headwaters region here, we’re looking at the total amount of snowpack that accumulates in each individual month for water years back to 2012. The stacked graph on the right shows the median (what is typically expected). Next to that is how the current water year is stacking up. The magenta color is March snowpack. You can see this year is a bit ahead of the median, but behind what we had last year. The teal and green colors are yet to stack up for April and May. For just April and May, we normally add 3.4″ of new snowpack. Water Years 2013 and 2019 are examples of when we got much more than that in April and May.
Now look more closely at Water Years 2012 and 2021. In 2012 snowpack lagged behind for most of the winter. And there was barely any accumulations in March and April, resulting in near record low snowpack for many areas, including the Colorado headwaters. In 2021, accumulations were a little behind at the end of March, but not too far off. Unfortunately, very low snowpack numbers in April and May resulted in much below average total snowpack and contributed to worsening drought conditions.
While our 7-day outlook for precipitation shows more activity over the mountains, mid-April is looking more likely to be warm and dry. If we pick up normal accumulations as the melt starts this spring, our snowpack season will end in decent shape. Areas that miss out on new accumulations and start a rapid melt may find their situation a bit more concerning at the beginning of summer. We’ll see how it all unfolds soon!
If you are interesting in exploring the interactive graphics provided by the NRCS – and used for this blog – check out the NRCS Colorado Snow Survey page.
Colorado lawmakers on Wednesday hailed the announcement by federal officials that 220,000 acres of national forest land on Colorado’s Western Slope will be protected from oil and gas development and mining for at least the next 20 years.
The U.S. Interior Department confirmed that it would withdraw the Thompson Divide area near Crested Butte from federal mineral leasing, following an 18-month review process and more than a decade of advocacy by local conservationists and Colorado officials.
“This announcement is a testament to the persistence of Colorado’s farmers, ranchers, hunters, anglers, recreationists, wildlife enthusiasts, and conservation groups, who were unrelenting in their work to protect the landscape we all love,” Bennet, a Democrat who has long championed the move, said in a press release.
“The Thompson Divide area is a treasured landscape, valued for its wildlife habitat, clean air and water, and abundant recreation, ecological and scenic values,” said U.S. Interior Secretary Deb Haaland. “The Biden-Harris administration is committed to ensuring that special places like these are protected for future generations.”
Prohibiting mineral leasing in the Thompson Divide area is one component of the Colorado Outdoor Recreation and Economy Act, a public lands package championed by Democrats in the state’s congressional delegation since 2019. With the bill stalled by Republican opposition, President Joe Biden in 2022 moved to implement several CORE Act provisions through executive action, including the designation of the Camp Hale–Continental Divide National Monument near Leadville.
While oil and gas trade groups opposed the move, a U.S. Forest Service assessment last year found the impact on the industry would be negligible, while “the proposed action would protect the agricultural, ranching, wildlife, air quality, recreation, ecological, and scenic values of the Thompson Divide area for both intrinsic and economic value to local communities.”
The withdrawal order applies to nearly 200,000 acres of in the White River and Grand Mesa, Uncompahgre, and Gunnison national forests, in addition to 20,000 acres of public land administered by the Bureau of Land Management. The Federal Land Policy and Management Act authorizes the Interior Department to order such withdrawals for a maximum of 20 years.
The CORE Act, which Colorado Democrats have reintroduced for a third time in Congress, still aims to make the withdrawal permanent. The bill stands little chance of being passed by the Republican-controlled House, where GOP lawmakers including Rep. Lauren Boebert of Windsor have called it a “400,000-acre land grab.”
But a long list of local elected officials and conservation advocates say Wednesday’s announcement has been a long time coming.
“We have worked for almost two decades to secure meaningful protection for the Divide, with ranchers, hunters, anglers, mountain bikers, off road vehicle users, and environmentalists coming together in an unlikely alliance to preserve the current uses of these lands,” Jason Sewell, a rancher and president of the Thompson Divide Coalition, said in a statement. “While we will continue to advocate for permanent protections for the Thompson Divide as afforded in the CORE Act, we could not be more thrilled to know that this landscape will continue for the next 20 years to provide the recreational opportunities, jobs, and wildlife habitat that it has for generations.”
In response to falling flows in the critical habitat reach, the Bureau of Reclamation has scheduled an increase in the release from Navajo Dam from 400 cubic feet per second (cfs) to 500 cfs for tomorrow, April 5th, at 4:00 AM.
Releases are made for the authorized purposes of the Navajo Unit, and to attempt to maintain a target base flow through the endangered fish critical habitat reach of the San Juan River (Farmington to Lake Powell). The San Juan River Basin Recovery Implementation Program recommends a target base flow of between 500 cfs and 1,000 cfs through the critical habitat area. The target base flow is calculated as the weekly average of gaged flows throughout the critical habitat area from Farmington to Lake Powell.
Click the link to read the article on The Denver Post website (Elise Schmelzer). Here’s an excerpt:
April 3, 2024
The statewide snowpack sat at 109% of the 30-year median on Wednesday, just a few days shy of the normal peak of snowpack for the state. Every major river basin in the state also recorded above-median snowpack, reducing the risk of large, uncontrollable wildfires and boosting the state’s water supplies. Despite a slow start to the snow season, large storms in February and March boosted the amount of water that will become available as mountain snow melts. The statewide snowpack had lagged behind the median until early March.
Colorado snowpack April 5, 2024 via the NRCS.
In Colorado, the major river basins in the state ranged between 104% and 112% of the 30-year median this week. At 119% above the median, the Arkansas River basin had the best year…
Snowpack in the Upper Colorado River Basin is at 114% of the median depth, which is critical for restoring water levels in Lake Mead and Lake Powell, the two major reservoirs in the Southwest. But even if snowpack is above average, the amount of water that reaches the reservoirs can be below average due to dry soil or high heat, said Dan McEvoy with the Western Regional Climate Center.
Snow levels are far lower in Montana, Idaho, Washington and northern Wyoming. Many river basins in those states sat at less than 70% of the median as of Sunday, the most current data show.
The latest National Climate Assessment warns of a shrinking snowpack and serious downstream consequences
A recent federal synthesis of climate change research paints a grim portrait of snow’s future in the American West and warns that the fast-growing region’s water supply is vulnerable.
“Climate change will continue to cause profound changes in the water cycle, increasing the risk of flooding, drought, and degraded water supplies for both people and ecosystems,” according to the Fifth National Climate Assessment (NCA5) released in November.
The congressionally mandated report concludes there is “widespread consensus” that warming will “decrease the proportion of US precipitation that falls as snow, decrease snow extents, advance the timing of snowmelt rates and pulses, increase the prevalence of rain-on-snow events,” and transform the runoff that is vital for farms, cities and ecosystems.
Climate change has already diminished the West’s snowpack, with warming global temperatures leading to earlier peaks and shorter seasons, especially at lower elevations and in areas closer to the coast.
In areas where snow is the dominant source of runoff, the volume of water stored in the snowpack may decrease by more than 24% by 2050 under some emissions scenarios, with “persistent low-snow conditions emerging within the next 60 years,” the report said.
“When we have less snow in the West, it can strain our water supplies,” said report co-author Steph McAfee, regional administrator of the U.S. Geological Survey’s Southwest Climate Adaptation Science Center. “We’ve tended to rely on the snowpack as a reservoir that didn’t need to be built and it doesn’t need to be maintained, so it’s been a key place for storing water. Having less snow directly means less water stored for use in the summer.”
NCA5 stresses that climate change’s reshaping of the water cycle and other impacts will exacerbate inequalities in U.S. society and pose a special threat to some marginalized communities.
“All communities will be affected,” the report said, “but in particular those on the frontline of climate change—including many Black, Hispanic, Tribal, Indigenous, and socioeconomically disadvantaged communities—face growing risks from changes to water quantity and quality due to the proximity of their homes and workplaces to hazards and limited access to resources and infrastructure.”
NCA5 describes itself as the federal government’s “preeminent report on climate change impacts, risks, and responses,” though it is required to steer clear of policy prescriptions.
The report is based on the latest science, but it is produced for decision-makers and the general public, so it is written in relatively accessible language, and data visualizations play a leading role in communicating the findings.
Below I use 10 visuals from NCA5—mostly maps but also charts, an infographic and a photo—to help summarize the report’s conclusions about climate, snow and water in the West, focusing on the more arid parts of the region.
Climate, snow and water
At one level, the story of snow and climate change is simple: in order for snow to fall and stick around, it has to be cold enough, so the warming of the planet is generally bad news for snow.
“I think the changes to snow and snowpack are changes that we have more confidence in than just about any other water parameter because of the direct effect of warming on snowpack and snow precipitation,” said Elizabeth Payton, NCA5’s Water Chapter Lead and a water resources specialist at the Western Water Assessment at the University of Colorado Boulder.
Co-author Ben Harding, senior water resources engineer at Lynker, summed up the report’s findings on snow this way:
“We’re going to see shorter periods of time with snow on the ground, the snow will start to accumulate later and it’ll start to melt earlier,” he said.
A smaller snowpack, a curtailed snow season and a new runoff regime will test the region’s complex water infrastructure of dams, aqueducts and canals, many of which were built in the early to mid-20th century, before climate change was recognized as a peril. The altered snowpack will also strain the West’s water laws and policies, many of which emerged in the 19th century, before some Western states were even admitted to the union.
But while climate change has already shrunk the snowpack in most parts of the world and will continue to take a toll as temperatures climb, there are exceptions that buck the trend. Total global precipitation is expected to increase due to warming, including in places where the snowpack shrivels. NCA5 predicts there will be worse droughts and floods.
For example, atmospheric rivers, which are pivotal for the West’s snowpack and water supply, are expected to strengthen in the years ahead. But beyond a certain point, warming makes it more likely that rain will fall instead of snow, even high in the mountains, raising the risk of flooding and a subpar snowpack.
As temperatures keep rising, increasing rates of melting and evaporation will play a key role. Another critical factor is how much moisture gets sucked up by plants and then transpired into the atmosphere. Some snow never becomes snowmelt and is “lost” to the atmosphere through sublimation, moving directly from the solid to the gaseous phase. Soil moisture is yet another essential element of the water cycle, impacting drought, flooding, agriculture and ecosystems.
But that’s not all. In Colorado, for example, dust-on-snow events are a big deal because the darker material reduces the snow’s reflectivity and causes it to absorb more heat, accelerating the meltout. Climate change threatens to worsen the dust problem as it continues to aridify parts of the West.
Warming is adjusting the dials on all of these factors, and the magnitude of these changes matter, but there’s yet another crucial dimension: timing. In spring, farmers, water managers and dam operators not only care deeply about the volume of the snowpack that will fill reservoirs, canals, ditches and pipes, but also are keenly interested in when that water will be entering the system.
“Having a pulse of snowmelt at the beginning of the growing season has been helpful to farmers and ranchers, and the timing of the snowmelt has been something that ecosystems have evolved to adapt to,” Payton said. “The timing is going to be shifting dramatically.”
Warming has already taken a toll on the West’s snowpack
While much of NCA5 focuses on the future, the report also looks back at how climate change has already transformed the nation. The graphic below depicts how the West’s snowpack has shifted in recent decades, with red circles indicating declines, blue circles showing increases and the circle scaled to the size of the change.
The figure’s title says it all: “Western snowpack is declining, peak snowpack is occurring earlier, and the snowpack season is shortening in length.”
Map “a” shows changes in the volume of the snowpack on April 1, a key date for water managers as they plan for the runoff season. About 93% of sites have experienced a decrease in April 1 snowpack since the 1950s, with the decline averaging about 23%. Map “b” concerns the timing of the snowpack’s peak, which has come nearly eight days earlier on average since 1982. Map “c” presents data on the length of the snow season, which has decreased by 18 days on average over the last four decades. (For more on these maps, including the underlying data, see this page from the Environmental Protection Agency.)
While the vast majority of circles in the figure are red, there are also some blue locations, such as in north-central Colorado. When I asked NCA5 co-authors about those sites, several noted that many of them lie at higher elevations—like those along the Continental Divide in Colorado—and the naturally colder conditions there can help preserve their snowpack in a warming world, up to a point.
“There are some parts of Alaska or some very high elevations that might have more snow when the snowpack is at its largest,” McAfee said. “They’re starting out really cold, so if it warms up some, it’s still cold enough to snow. If it warms up enough, then there’s the possibility for snow melting earlier or more of those storms bringing rain than snow.”
While some high-elevation locations may see their snowpack increase in coming years, it’s “by and large definitely not enough to compensate or offset the widespread losses in snow that are occurring everywhere else,” said co-author Justin Pflug, a scientist at the University of Maryland and NASA Goddard Space Flight Center.
How much warmer it gets will be crucial for the snowpack (and much else)
One of the challenges in producing a report like NCA5 is the uncertainty surrounding future greenhouse gas emissions. Innovation, geopolitics, consumer preferences and more make it hard to predict how rapidly the economy will decarbonize. As a result, scientists must use varying emissions scenarios, and it remains to be seen just how much temperatures will rise at a global level.
While the rate of future warming is uncertain, one thing that’s clear is that some parts of the planet will warm more than others and have already experienced much steeper temperature increases.
The graphic below, which maps the projected change in temperatures at various levels of global warming, shows that the effects are expected to be uneven across the United States. For example, at 2°C of global warming, parts of the Interior West would be more than 5°C warmer. Across the globe, researchers have found “growing evidence that the rate of warming is amplified with elevation,” according to a 2015 paper in Nature Climate Change.
Locations in Alaska would be even hotter than that, mirroring a global trend of much more rapid warming in the Arctic. A 2022 study in Communications Earth & Environment is titled “The Arctic has warmed nearly four times faster than the globe since 1979.”
“One of the key messages for us in the water chapter is that temperature really matters for water,” McAfee said. “Temperature influences whether or not we get rain or snow. It influences when the snowpack melts. It influences how big a sip the atmosphere takes from the water and all of that. So we can’t think about precipitation and we can’t think about our water systems separate from temperature.”
When people hear about droughts and water shortages, they naturally think of a lack of precipitation, which remains the primary driver of such dry times. But as NCA5 notes, “higher temperatures can cause drought to develop or become more intense than would be expected from precipitation deficits alone.”
In a “hot drought,” the atmosphere demands more moisture and desiccates the landscape. Warmer temperatures also contribute to “snow droughts” (discussed below), “flash droughts” that develop in a matter of weeks and “megadroughts” that can extend over decades.
NCA5 also emphasizes two other messages related to temperature: the degree of change matters greatly, and how hot the planet gets depends on the choices society makes now. [ed. emphasis mine]
“The more the planet warms, the greater the impacts—and the greater the risk of unforeseen consequences,” according to the report. “While there are still uncertainties about how the planet will react to rapid warming and catastrophic future scenarios that cannot be ruled out, the future is largely in human hands.”
Climate change is projected to increase global precipitation, but not necessarily in the Southwest
Scientists and their models can paint a much clearer picture of how temperatures will change compared to the projections for precipitation. That said, global warming is expected to increase overall precipitation on the planet because there will be higher evaporation rates and warmer air can hold more moisture.
The figure below shows projected changes in annual precipitation according to four different levels of warming, with greens indicating increases and browns depicting decreases. The hatching shows areas where 80% or more of the models agree on whether precipitation will increase or decrease.
Most of the country is expected to see more precipitation overall, with higher levels of warming generally leading to wetter conditions and more certainty about those changes. But in all of the maps, precipitation is expected to decrease in Southern California, much of Arizona, New Mexico and Texas, plus portions of Colorado.
“Precipitation changes also scale with global warming, but these projections vary by location and are less certain than temperature changes,” according to NCA5.
Payton said “there’s not a very strong signal” for total precipitation changes for the Southwest. “The atmosphere can hold more moisture when it’s warmer,” she said, “but that moisture has to come from somewhere, so over the Southwest, where it’s already dry, is it going to be able to suck up that additional amount of moisture that it can hold?”
While precipitation projections are cloudier, Westerners should expect a shift from snowflakes toward raindrops in many parts of the region: “it is virtually certain that less precipitation will fall as snow, leading to large reductions in mountain snowpack and decreases in spring runoff in the mountain West,” according to NCA5.
Overall, NCA5 concludes that “changes in future precipitation and temperature are expected to exacerbate drought across large portions of the US,” with projections showing “the strongest drying signal occurring in the Southwest.”
While drought and water scarcity are dominant themes in more arid parts of the West, these areas also contend with floods that can turn dry washes into raging torrents in a flash and threaten both lives and property.
“Warmer air is thirstier air, and that really raises the risk of higher-severity precipitation events,” Pflug said.
Flooding can also be caused by snowmelt, especially in years with a big snowpack, rapid thawing in spring or when it rains on top of snow.
“Due to climate change, snowmelt-driven flooding is expected to occur earlier in the year due to earlier runoff,” the report said. “Moreover, atmospheric rivers, which have driven much of historical flooding in the region, are expected to intensify under a warming climate.”
The graphic below shows the importance of atmospheric rivers to extreme precipitation in the Pacific Northwest, especially in winter (see my previous post for more on climate change and atmospheric rivers).
The West’s snowpack will store less water and runoff will change
The maps below depict how warming temperatures and changing precipitation patterns are expected to influence three crucial variables in the Southwest’s water cycle, with the top row of maps showing projections for 2036-2065 and the bottom row showing 2070 to 2099, both relative to the 1991-2020 period.
The leftmost maps show projected changes in soil moisture, a critical factor for agriculture and a host of ecological processes. While drier soils are expected in many parts of the Southwest, and especially in portions of the Four Corners states, other areas are expected to see increases in soil moisture.
The center maps depict projected changes in the maximum volume of snow water equivalent, a measure of the snowpack’s water content. Whereas the soil moisture picture is somewhat muddled, the story for snow is crystal clear: steep declines throughout the region, and especially in California’s mountains.
The rightmost maps show expected changes to runoff—the water that reaches streams, rivers, lakes, reservoirs and taps. As with soil moisture, the projections vary by location but many of the highest-elevation areas, such as the Sierra Nevada, the Southern Rockies and Utah’s Wasatch Range, are expected to see decreases in runoff.
The report’s co-authors stressed that the interactions between soil moisture, snowpack and runoff are complicated, and there is still considerable uncertainty about future precipitation patterns. With soil moisture, for instance, earlier snowmelt may lead to wetter conditions in spring but drier conditions later in the summer.
Because the changes will vary across the country, people should “look at results and data and projections for their own region and not necessarily take a message from elsewhere and assume that’s what’s happening where they live,” McAfee said. “Climate change will have different impacts in different places. So the fact that we might be concerned about reduced water supplies in the Colorado River doesn’t necessarily mean we have the same concerns in every river basin.”
In the Colorado River Basin, research has shown that “less snow means more evaporation, and this is because snow is really reflective,” McAfee said. “Anyone who’s ever been out skiing knows this: you can get that reflection up and the nose and chin sunburn, and if the snowpack melts early, the land gets more energy, which makes it possible to evaporate more water from the soils and streams and for the plants to get going earlier.”
One challenge for scientists and water managers is that it’s tough to calculate how much snow is out there. Snow accumulation can vary dramatically on a single run at a ski resort, not only from top to bottom due to thousands of feet of elevation difference, but even from one side of the run to the other due to trees, shading, rocks and wind.
Another vexing problem is tracing what happens to all those H20 molecules after they’ve fallen to earth.
“There’s still some uncertainties about where the snow is going hydrologically,” Pflug said.
In recent years, peak snowpack levels in the Rockies that were around normal have translated into below-average streamflows. Some scientists have pointed to deficits in soil moisture as the culprit for the disparity. Others are researching how warming temperatures are impacting sublimation, when snow converts directly into water vapor. A 2023 paper from Colorado State University scientists argued that spring and summer precipitation was important for explaining the discrepancy between snowpack levels and subsequent runoff.
Here’s how NCA5 sums up the situation for the Colorado River, which supplies some 40 million people in seven U.S. states and Mexico while also irrigating millions of acres of crops:
“Colorado River streamflow over the period 2000–2014 was 19% lower than the 20th-century average, largely due to a reduction in snowfall, less reflected sunlight, and increased evaporation. The period 2000–2021 in the Southwest had the driest soil moisture of any period of the same length in at least the past 1,200 years. While this drought is partially linked to natural climate variability, there is evidence that climate change exacerbated it, because warmer temperatures increase atmospheric ‘thirst’ and dry the soil. Droughts in the region are lasting longer and reflect not a temporary extreme event but a long-term aridification trend—a drier ‘new normal’ occasionally punctuated by periods of extreme wetness consistent with expected increases in precipitation volatility in a warming world.”
Some rural and Indigenous communities are especially vulnerable to the changing water cycle
The consequences of a thinner, less reliable snowpack and changing runoff patterns will be far-reaching, but they will be especially problematic for some rural communities dependent on farming and snow-related recreation.
The infographic below illustrates some of the downstream effects on agriculture, with snow droughts contributing to the stresses facing the sector and its workers. Reduced snowmelt for irrigation may cause farmers to lose money, generate more dust that harms both farmworkers and the snowpack, and lead to increasing use of dwindling underground aquifers as agriculture shifts from surface water to groundwater.
While the graphic above focuses on agriculture, climate change will also affect the water supply for cities, suburbs and businesses, plus the innumerable species that have evolved to depend on the snowpack and snowmelt.
Farmers who rely on direct flows from the river may have very senior water rights, but often they lack reservoirs to store the water, so as climate change shifts precipitation from snow to rain and starts the runoff season earlier, these water users—plus fish and other wildlife—face a growing risk of shortages later in the year.
“For communities that have storage rights, they’re less sensitive to the loss of snowpack if you still are getting precipitation in some form or another,” Payton said. “There are a lot of people and communities in the West who are just living on the edge, and they don’t have the storage, they don’t have the infrastructure to take advantage of when it’s there and are very much dependent on the regime that they’ve been used to.”
NCA5 highlights that “community-based snow-fed irrigation systems in high-elevation watersheds of New Mexico and Colorado, known as acequias, are particularly exposed to the shortfalls in annual snowpack.”
While building more reservoir storage is a potential solution, that strategy has three problems, Harding said. “One is people don’t like reservoirs, except for the people that are going to benefit and use the water. Two is they’re really expensive. And three is we’ve used up most of the really good reservoir sites, so that seems unlikely,” he said.
Even without the influence of climate change, many Indigenous communities in the West confront major hurdles in securing safe and adequate water supplies (see this 2021 paper for more on incomplete plumbing and poor water quality in U.S. homes).
The map below shows that many American Indian and Alaska Native homes already face serious problems with their water and sewer systems. At deficiency level 2, a water and sanitation system is in place but it needs upgrades or maintenance, while at level 5, the worst category, “there’s absolutely no water supply, no sanitation system in at all,” said co-author Heather Tanana, a visiting professor of law at the University of California-Irvine, in a webinar.
“As we’re experiencing increased changes in the water cycle, the water quality and quantity impacts are further being exacerbated in part because of aging infrastructure,” Tanana said. “So who is being the most affected? Again, it’s our under-resourced frontline communities.”
There are two types of snow drought to worry about: dry and warm
The report highlights two kinds of “snow drought” that can afflict the West (this page offers updates on the current status of snow droughts). In a “dry” snow drought, a lack of precipitation diminishes the snowpack. That’s what happened in California’s Sierra Nevada in the 2014/2015 winter, “resulting in the shallowest snow volume ever recorded there,” according to NCA5.
That same winter, but farther north in Oregon and Washington, there was another snow drought, but this one was a “warm” one. Winter precipitation was 77% to 113% of normal, yet because of higher temperatures, the precipitation shifted from snow to rain, leading to a reduction in the snowpack and higher winter snowmelt, but below-normal flows from April to August.
The graphic below illustrates the streamflow for two locations: Washington’s Ahtanum Creek and California’s Merced River. In each chart, the black line indicates flows during the 2015 water year (which began October 1, 2014), the gray lines show data from 1952 to 2021 and the dashed line plots the median for that period. The top chart shows that runoff spiked in February and again in March but was then mostly below average during the subsequent warmer months. By contrast, the Merced River’s flow was below normal for nearly the entire runoff season.
“In Oregon and Washington, irrigated crops—including valuable orchard crops—that depend on direct streamflow diversion water rights failed, but municipal water supplies that relied on storage rights that allow reservoirs to capture winter runoff were sufficient,” according to NCA5. “In California, total water supply was limited, resulting in severe or complete cutbacks to junior water rights and contract holders.”
The September 2015 photo below from NCA5 shows an apple orchard in the Roza Irrigation District, near Yakima, Washington, suffering the effects of the warm snow drought and reduced irrigation.
Warming will make the landscape “thirstier” in many locations
NCA5’s water chapter discusses a measure known as the “annual climatic water deficit.” In simple language, this metric describes the thirstiness of the landscape.
“This is a measure that I advocated for because I think it integrates the effects of everything,” said Harding, who defined the deficit as “how much water we’d have to add to the system to fully satisfy the needs of the plants.”
As shown in the maps below, the climatic water deficit is expected to increase by midcentury across much of the nation—and especially in the Southwest. Map “a” shows the average of the projections, while maps “b” and “c” report the average of the wettest and driest 20% of projections.
The region’s increasing dryness threatens to reinforce snow loss by increasing the amount of dust that lands on the snowpack, thereby accelerating its melting. As a result, NCA5 cautions that “under increasing aridity, agricultural practices such as fallowing and grazing on rangelands will need careful management to avoid increased wind erosion and dust production from exposed soils.”
Adding insult to injury, NCA5 warns that those soils will be more susceptible to blowing around because hotter summers will “degrade protective desert soil crusts formed by communities of algae, bacteria, lichens, fungi, or mosses.”
The Water Desk’s mission is to increase the volume, depth and power of journalism connected to Western water issues. We’re an editorially independent initiative of the Center for Environmental Journalism at the University of Colorado Boulder.
32% of the Lower 48 is short/very short; 8% more than last year at this time. Dry soils are most prevalent in NM and the North Central. The Southern Plains too, although in better shape than last year.
Drought-challenged U.S. communities are overlooking what could be a major source of relief: stormwater, which generates more water annually than is stored in lakes Mead and Powell, the largest reservoirs in the West.
But Colorado and other states with laws against collecting stormwater are likely to miss out on its potential.
Lakes Powell and Mead store some 49.4 million acre-feet, according to the U.S. Bureau of Reclamation.
That 59.5 million acre-feet of stormwater is roughly 93% of the water used by all U.S. cities and industry in 2015, according to the Pacific Institute. An acre-foot serves about two to three U.S. households for a year.
But because this source has never been fully analyzed or developed, it is not yet widely used.
“Our results indicate that there is a vast potential for stormwater capture all across the country,” said Bruk Berhanu, a lead author of the study and senior researcher in water efficiency and reuse at the Pacific Institute.
With climate change and warming, streamflows are projected to decline in Colorado and elsewhere in the coming years, and there is increasing pressure to find new sources and better use existing water supplies.
“As communities in the West face increasing strain on their water supplies, planners have been looking at strategies that use an ‘all of the above’ approach,” Berhanu said. “We aren’t suggesting stormwater could cover all of our future water supplies, but they can help fill the gap between our current water supplies and projected demands.”
Estimated annual urban stormwater runoff by state
Source: Pacific Institute, “Untapped Potential: An Assessment of Urban Stormwater Runoff Potential in the United States”
But use of stormwater comes with conditions. It would require major new facilities to capture, store and treat it if it is to be used for drinking water. If too much is captured, it could reduce water available for the environment, according to the report.
And in some places, such as Colorado, the practice isn’t allowed.
Under what’s known as the Prior Appropriation Doctrine, water users with the oldest, or most senior water rights, get their water first, even if their diversion point lies farther downstream than someone else’s. And stormwater, once it reaches the stream, becomes part of someone’s water right. If larger amounts were captured, it could jeopardize other water rights already in place.
The City of Aurora, and others, have actively worked for decades to find new ways to make their water supplies stretch further, but stormwater capture is not one of them.
“What works in some states, does not work in Colorado,” said Greg Baker, a spokesman for Aurora Water, referring to the legal prohibitions against the practice.
Could that change? Possibly.
Colorado has taken major strides in recent years to re-examine how water that falls from the sky may be collected and used in ways that don’t harm neighbors downstream. In 2009, for instance, the state passed a law that opened the door to rainwater harvesting in some rural areas and then in 2016 allowed homeowners across the state to use rain barrels to capture small amounts of water for use on gardens and lawns.
That state also created a pilot program to encourage more research. The Dominion Water and Sanitation District in Douglas County, to date, has been the only water district to participate in the pilot, according to Andrea Cole, Dominion’s general manager. Soon it may be able to legally capture rainwater when, later this year, it will ask a state water court to approve collecting rainwater commercially to serve parks and other public spaces in Sterling Ranch, one of the most water-efficient residential developments in the state.
To get to this point, Dominion spent 15 years tracking how much rain fell on the development before anything was built, and tracking how much more water was generated after new homes and roads were built and the water began falling on roofs and other solid surfaces, instead of the soil.
“In Colorado, water is precious, so every last drop is accounted for in somebody’s system. … But when you change the land from an open prairie to a development, the water no longer [sinks] into the soil, or makes its way to nearby streams,” Cole said.
Measuring the water has and will continue to be a meticulous process, she said.
“We can only capture that water [that falls on] Sterling Ranch. … If it is outside the ranch, we have to allow it to go back to the stream,” Cole said.
Sterling Ranch sharply limits outdoor water use, so lawns are scarce. The plan is to use the rainwater for parks and gardens so that homeowners with little of their own grass have a place to play and relax, Cole said.
The Pacific Institute’s Berhanu said he is hopeful that the new report will generate more interest in developing stormwater to help fill looming gaps in water supplies.
“In a state like Colorado, we would hope that this information builds the case for revisiting those policies and making adjustments to enable more stormwater capture,” Berhanu said.
The potential is there, Cole said.
“We are the first out of the chute, and being the first is always scary. But people are watching to see what we can get through water court,” she said. “Once there is a [legal] water right for it, we are going to see new developments trying to use this.”
More by Jerd SmithJerd Smith is editor of Fresh Water News. She can be reached at 720-398-6474, via email at jerd@wateredco.org or @jerd_smith.
Excavation and foundation preparation at Gross Dam wrapped up in April. The far side of the photo shows the new footprint of the dam. Photo credit: Denver Water.
“Over the past two years we’ve excavated 260,000 cubic yards of rock and placed 27,000 cubic yards of concrete to get the existing dam and the rock around it ready for expansion,” said Doug Raitt, Denver Water’s construction project manager for the Gross Reservoir Expansion Project.
The next phase of the multiyear project begins in May, when crews will begin the process of building 118 new concrete “steps” that will create the higher dam. Construction on the expansion project began in April 2022 and is scheduled to wrap up in 2027.
Roller-compacted concrete will be placed on top of the existing dam to raise it to a new height of 471 feet. A total of 118 new steps will make up the new dam. Image credit: Denver Water.
The steps will be made of roller-compacted concrete and around 800,000 cubic yards of concrete will be needed to build them.
So, to prepare for raising the dam, a team from Kiewit Barnard is building a sophisticated concrete batch plant near the top of the dam. At the plant, cement, fly ash, sand and aggregates will be mixed together to make the specific type of concrete mixture used to build the steps.
The batch plant will produce roller-compacted concrete on-site using rock quarried from around Gross Reservoir. Photo credit: Denver Water.
“Producing the roller-compacted concrete on-site really makes for an efficient process so we don’t have to haul it in from off-site,” Raitt said. “We’re also crushing rock that we quarried on-site as well.”
Learn more about the Gross Reservoir Expansion Project at grossreservoir.org.
Crews are also building an elaborate conveyor system that will carry the concrete from the batch plant to the dam.
Workers are building a conveyor system that will move concrete from the batch plant to the dam. Photo credit: Denver Water.
Once conveyed over the top of the dam, the concrete will slide to the bottom via a chute system, which also will be built this spring.
At the bottom of the dam, workers are creating a flat surface that will be the base for the new roller-compacted concrete steps.
Workers are building the base of the dam that will serve as a platform for the roller-compacted concrete steps. Photo credit: Denver Water.
“It’s an exciting time as we get ready for the actual dam raise phase of the project,” Raitt said. “Once the roller-compacted concrete process begins, it will take about three years to complete the expansion.”
Colorado transmountain diversions via the State Engineer’s office
Statewide snowpack on Tuesday [April 2, 2024] stood at 109% of median, according to the Natural Resources Conservation Service.
Snowpack, which is a measurement of the water equivalent of the snow, ranged Tuesday from 104% in the combined San Miguel/Dolores/Animas/San Juan river basins in southwest Colorado…
to 121% in the Arkansas River Basin.
The Colorado River Basin headwaters stood at 108% of normal,…
…and the Gunnison River Basin, 105%. Snowpack accumulation in southern Colorado basins typically peak around the start of April, and more northern basins usually peak days or weeks later. NRCS data shows snowpack at 85% of median at one site on Grand Mesa and 96% at two other sites there. Dave Kanzer, director of science and interstate matters for the Western Slope’s Colorado River District, said this year’s snowpack is spotty and highly variable…
Credit: Colorado Basin River Forecast Center
However, the Colorado Basin River Forecast Center’s latest forecast is projecting April-July flows into Lake Powell this year to be 85% of normal. That’s at a time when low water levels in Powell and downstream in Lake Mead due to long-term drought and heavy use of water are of dire concern to southwestern states, water users and the federal government.
In my last post, I reported that the water mavens of both the Upper and Lower Colorado River Basins had each presented the Bureau of Reclamation with plans for managing the river after 2026, when the current, amended ‘Interim Guidelines’ expire.
The Interim Guidelines had been implemented in 2007, remember, when it was obvious that the patchwork of existing ‘Law of the River’ (LOTR) guidelines, laws, treaties, compacts and other measures propping up the Colorado River Compact were failing to constructively guide the extensive storage and distribution systems imposed on the river through the turn-of-the-century drought that had begun six years earlier.
“New plot using the nClimGrid data, which is a better source than PRISM for long-term trends. Of course, the combined reservoir contents increase from last year, but the increase is less than 2011 and looks puny compared to the ‘hole’ in the reservoirs. The blue Loess lines subtly change. Last year those lines ended pointing downwards. This year they end flat-ish. 2023 temps were still above the 20th century average, although close. Another interesting aspect is that the 20C Mean and 21C Mean lines on the individual plots really don’t change much. Finally, the 2023 Natural Flows are almost exactly equal to 2019. (17.678 maf vs 17.672 maf). For all the hoopla about how this was record-setting year, the fact is that this year was significantly less than 2011 (20.159 maf) and no different than 2019” — Brad Udall
The Bureau and the seven states have since cobbled together – with help from a big snowpack in the 2023 water year and a rain of cash from the Biden administration’s infrastructure acts – a set of added interim actions to stagger through the remainder of the interim to 2026. The immediate emergency out of the way, the Bureau asked the water leaders of the seven states, and of the 30 First People nations in the river basin that will no longer allow the states to ignore them, to come up with a plan for managing the river works from 2027 through – well, another interim, maybe another 20 years. In a time of climate change and political chaos, we no longer think ‘in perpetuity’ (which never worked out anyway).
So the water leaders gathered for several meetings, to try to come up with a plan for managing the river after 2027. But they were not succeeding, so the predictable happened: they went home to the two Basins established by the 1922 River Compact, and each group prepared an ‘alternative plan’ for the management of the river.
I’ve created a fairly detailed side-by-side comparison of the actions each alternative proposes when triggered by diminishing levels of storage in the reservoirs; it would not, however, be readable in the format of these posts, so you can click here to bring up a readable copy. Meanwhile, here is a summary of some of the main points, similarities and differences between the two alternatives.
Both alternatives are similar conceptually: they operate on a measure of storage in some of the reservoirs on the river, with changes in the total content of the selected reservoirs triggering reductions in consumptive use by one or both Basins. Each alternative, however, uses a different set of reservoirs as the base – and a different date for measuring the content of the reservoirs.
The Lower Basin alternative wants the measuring standard to be the live storage of the major reservoirs in the river’s storage system: the four large Colorado River Storage Project reservoirs in the Upper Basin (Powell, Flaming Gorge, Blue Mesa and Navajo), and the three mainstem Lower Basin reservoirs (Mead, Mojave behind Davis Dam and Havasu behind Parker Dam) – a total of ~58 million acre-feet (maf) when they are full, which they currently are not. And they want the total system content to be measured on August 1 every year, a time when the reservoirs are still relatively full after runoff. (‘Live storage’ is the volume minus the ‘dead pools’ that cannot be delivered past the dams.)
Lake Mead key elevations. Credit: USBR
The Upper Basin alternative wants to measure only the live storage of Mead and Powell Reservoirs, minus an undefined ‘threshold volume’ for each of them – 4.2 and 4.7 maf respectively (probably the quantity required to keep the reservoir levels up to power-generating capacity?). This would probably be in the neighborhood of 40 maf when both reservoirs are full, which they are not. And they want the annual measure to be on October 1, the beginning of the new water year, a time when storage has been somewhat depleted by agricultural use.
The structural deficit refers to the consumption by Lower Basin states of more water than enters Lake Mead each year. The deficit, which includes losses from evaporation, is estimated at 1.2 million acre-feet a year. (Image: Central Arizona Project circa 2019)
Both alternatives are in agreement that reductions in use have to start with the Lower Basin cutting its use by the amount of the ‘structural deficit’ – the system losses through evaporation, riparian transpiration, et cetera, a total of ~1.5 maf. This decrease starts linearly when total storage as measured by the Lower Basin drops to 70 percent of full and ramps up to 1.5 maf when/if storage drops to 58 percent. The Upper Basin alternative has the Lower Basin starting its 1.5 maf reduction when its measure of storage is at 90 percent of full, and ramps up to 1.5 maf at 70 percent. With storage, however it is measured, chronically well down in the 30 percents these days, the Lower Basin could count on leaving 1.5 maf in Mead for the foreseeable future under either alternative.
The big difference between the two alternatives comes when or if storage drops to 38 percent by the Lower Basin’s measure of total system storage, and 20 percent of Powell-Mead storage by the Upper Basin measure. At that point – basically panic time – the Lower Basin wants both Basins to begin to ramp up to an additional 2.7 maf feet of reductions, to a total of 3.9 maf – basically the 4 maf in reductions the Bureau asked for in the panicky days of 2022.
The Upper Basin, however, wants the Lower Basin to do all of the 2.7 maf in reductions, on top of the 1.5 the Lower Basin will still be doing. Their justification: if river storage drops to those levels, then the Upper Basin, much of which has no storage to rely on, will alreadyhave had reductions at least that bad imposed by nature’s ‘hydrologic shortages.’ To make them do additional reductions to send more to the reservoirs would be the equivalent of double taxation.
The Upper Basin Alternative also throws a wild card into the game; it unilaterally grants itself the prerogative to ‘undertake parallel but separate activities that are not a part of this federal action or part of the [UB] Alternative. Parallel activities refer to actions in the Upper Basin that are beyond the scope of the Post-2026 Operations, but may complement those operations.’
The ‘parallel activities’ are briefly described as (but not limited to) activities like retaining the right move waters among the big Colorado River Storage Project reservoirs under pre-existing Records of Decision, and carrying out conservation programs like the Upper Basin’s Pilot System Conservation Program that pioneered the ‘paid reductions’ that are the core of the program to get the river system through 2026 (a pilot program partly paid for by large Lower Basin organizations). It may be too much read into this a kind of ‘declaration of independence’ for the Upper Basin, but it is an independent step toward adaptive management that might make the Lower Basin, accustomed to dependable deliveries from the Upper Basin a little nervous….
September 21, 1923, 9:00 a.m. — Colorado River at Lees Ferry. From right bank on line with Klohr’s house and gage house. Old “Dugway” or inclined gage shows to left of gage house. Gage height 11.05′, discharge 27,000 cfs. Lens 16, time =1/25, camera supported. Photo by G.C. Stevens of the USGS. Source: 1921-1937 Surface Water Records File, Colorado R. @ Lees Ferry, Laguna Niguel Federal Records Center, Accession No. 57-78-0006, Box 2 of 2 , Location No. MB053635.
And there’s one nice thing to see: both alternatives seem to bypass the Colorado River Compact mandate that the Upper Basin ‘will not cause the flow of the river at Lee Ferry to be depleted below’ an annual average of 7.5 maf, come hell or low water, or the big bad Lower Basin will come after your water to make it up. When the live storage drops to the low 20 percents in both alternatives, the releases from Powell drop to 6.0 maf – with no language implying a ‘call’ on the Upper Basin if that amount is unavailable. (Not that any such language ever existed in the Compact.)
Speaking of the Colorado River Compact. Yes, we cannot escape it. It is difficult to look at this situation and not see the Compact at work, and as usual, not in a constructive way.
Forty-seven years ago, in 1977, one of the Colorado River’s droughtier years – an estimated natural flow of 5.8 maf, third lowest since measuring began – I wrote an article about the Colorado River for a magazine that wanted ‘something about the drought.’ Figuring correctly that the drought emergency would be over by the time an article would be published, I wrote a long essay about how the drought was not a problem that year for the Lower Colorado River because of the huge storage it had – but how it could be facing problems in the future if it continued uncontrolled growth. (That article, ‘The Desert Empire,’ is archived on this site.)
The back of Glen Canyon Dam circa 1964, not long after the reservoir had begun filling up. Here the water level is above dead pool, meaning water can be released via the river outlets, but it is below minimum power pool, so water cannot yet enter the penstocks to generate electricity. Bureau of Reclamation photo.
But one thing I observed then as a possible source of future difficulty was the political division of the river into two basins. It was only a ‘paper division’ in the Compact, but it became concrete, as it were, when Glen Canyon Dam began to fill in 1963, finally finishing filling three years after this observation about its impact in that 1977 essay:
Glen Canyon Dam backs up a body of water … which amounts to nearly the equivalent of what flows down the Colorado River in two years. The amount of water that flows out of the lake reflects not the influx from upriver but demands from downriver.
This being the case, it seems just sentimental to continue to think of the Colorado River as a single entity. For all practical purposes there are now two rivers – interdependent, to be sure, but separate, and under separate management…. To describe the two rivers in the simplest possible manner: the Upper Colorado River is generally patterned after a ‘natural’ river, with many sources and a single destination. The Lower Colorado River, on the other hand, is patterned more after, say, a municipal waterworks, with a single primary source and many destinations. [ed. emphasis mine]
Now, a century after the Compact divided the river into two basins, and almost half a century after that observation about the post-dam river(s) – how can we look at this situation in which the water mavens from the (once) whole river sat down together to try to come up with a plan for managing the system imposed on the river(s), but after only a few days’ effort, withdrew to their ‘Upper and Lower Colorado Rivers’ to work out their River’s separate perspective on the problem? This may be the apotheosis of the Colorado River Compact, the completion of the division into two river basins whose users don’t always seem to remember they are all on the same river. Both alternatives express a willingness by their makers to reassemble as one group, but….
Map of the greater Colorado River Basin which encompasses the Colorado Plateau. Credit: GotBooks.MiraCosta.edu
The natural river itself encourages this kind of separation, with a region of mostly uninhabited (if often visited) canyons constituting close to a fourth of the length of the river, separating two regions of human activity. This kind of a ‘devoid’ in the middle part of a river basin is probably just nature in the middle of some of its endless work. The river probably began as two rivers, running off the Colorado Plateau in opposite directions, that eroded into each other and are still in the contentious process of becoming one river (as soon as they are able to completely eliminate the Colorado Plateau through all their magnificent work-in-progress erosions).
The two areas of human activity above and below the canyons have evolved over the past century and a half in ways consistent with the nature of the river that runs through them. Above the canyons, mountains dropping into piedmont plateaus, carved and deposited by many small streams flowing together into larger streams, all encouraging modest scales of cultural development, by individuals or small communities, a refuge for a time for Jefferson’s and Powell’s ‘agrarian counterrevolution.’
Back of Hoover Dam prior to first fill photo via Reclamation.
But the other river, below the canyons, flowed out of the canyons in a powerful seasonal flood or, later, a comparative trickle, a desert river, an anomaly doing nothing for the desert but moving its silt and sand farther toward the ocean. This was a river just waiting for the Industrial Revolution, the Anthropocene juggernaut of nature transformed to the service of humankind. And that revolution arrived, late in the 19th century, growing so fast in the desert that users in the agrarian states upstream feared the entire river might be appropriated out from under them. The Compact commission resulted, to try to quell those fears enough so the Bureau of Reclamation could build the big mainstem dam that would enable California to grow even faster….
The best the Compact commission could do was the division of the river into the two basins, linked only by the mandate for the Upper River water users to not dry up the Lower River users. This did nothing but formalize that ‘natural’ division created by the canyons – and also some of the problems innate to the cultural division between the industrial revolutionaries and the agrarian counterrevolutionaries (now enjoined with the environmental and recreational groups). The long descent toward breakdown, exacerbated by climate changes we never meant to cause, has culminated in the leaders of the two basins breaking off joint negotiations over the future, and going home to their own two rivers to draft up mandates for each other.
Yet they all appear to be committed to hanging onto the Compact, like a drowning man hangs onto a straw.
Meanwhile, however, the people who were here first in the two river basins, and the canyons too, have cleared their throats, and announced again that they will not be ignored in planning the future of the river. Sixteen of the First People nations have submitted their thoughts on the future of the river to the Commissioner of Reclamation, with a list of considerations they want answers for. We will look at that next post, and maybe muse a little further on how to make one river out of two, or thirty-two. Or should we just go with two or more? Suggested reading: Go to your Trump Bible and read First Kings 3:16-28.
Native America in the Colorado River Basin. Credit: USBR
During recent years I’ve had the great fortune to work with some amazing scientists on some really interesting research projects focused on water use and food production in the American West. Due to widespread concerns over water scarcity in this region, the papers resulting from our studies have captured a lot of media attention, including one published last week that has already been covered in 77 news stories.
The most common question that reporters ask about our research is, “Why are we growing so much alfalfa?”
This question emanates from some of the key findings in our papers:
Alfalfa farms consume 26% of the Colorado River’s water.
Alfalfa farming accounts for 20% of water consumed in the western 17 states
Alfalfa and other grass hays are the most water-consumptive crops in 57% of river basins in the western US (see map below)
Color coding indicates which crop consumes the most water in each river basin. Alfalfa and other grass hays are the most water-consumptive crops in 57% of river basins in the western US (from Richter and others, 2023)
So why ARE we growing so much alfalfa if we have a water scarcity problem?
My simple response to this question: Because farmers and ranchers produce what we want to eat and are willing to pay for.
No, we don’t eat alfalfa. Not directly. But we eat beef, and we eat dairy products, and those foods come from cows that eat alfalfa and other grass hays.
It’s also important to clarify who the “we” is here because reporters are also asking how much gets exported out of the US. As of 2022, we exported about 7% of all alfalfa produced, and virtually all of that was grown in the western US. The leading recipients of those exports include China, Japan, and Saudi Arabia (see graph below). The reasons why these countries need to import alfalfa from the US are quite interesting, but I’ll leave that for a future blog.
Countries receiving US exports of alfalfa in recent years. Source: US Department of Agriculture
Consumer demands for alfalfa
In our 2020 Nature Sustainability paper we estimated that 2/3 of all alfalfa and grass hay grown in the western US goes to beef production, and 1/3 goes to dairy. However, those stats combine alfalfa with other hays, and can be misleading in the aggregate because most grass hay goes to beef production, and most alfalfa goes to dairy production. In major dairy producing states such as California, Idaho, and New Mexico, 75-80% of alfalfa production goes to dairies.
Overall milk production in the US has grown by 35% since 2000. That’s not because Americans want to drink more milk; in fact, per capita milk drinking has dropped by 27%. Instead, much more milk is being produced to meet increased demands for yogurt (+378%) and cheese (+72%).
Beef consumption has remained steady but very high. Americans consume four times more beef per person than the global average. On average, we eat the equivalent of a quarter-pound hamburger every single day per person.
Alfalfa pays well too
Farmers and ranchers are constantly paying attention to which crops might be most profitable. That largely explains the recent growth in alfalfa production — with associated increases in water consumption — in some farming regions in the western US: the price is right.
Credit: Sustainable Waters
In our 2023 Nature Water paper we highlighted the fact that in some of our study areas, water consumption by alfalfa has been increasingly sharply (see blue traces in each graph below), placing a great deal of added stress on scarce water resources. Increased demand for alfalfa in dairies is creating a lot of water stress in these regions.
Credit: Sustainable Waters
As mentioned previously, one-quarter of all of the Colorado River’s water goes to alfalfa farming. In the Great Salt Lake basin, one-third of the river flow that could have replenished the vastly diminished lake goes to alfalfa.
So what should we do?
Media reporters also commonly ask about possible solutions: what should we do?
To start, there’s a lot we can do in our homes and businesses. Minimize how much water you use outdoors on lawns and gardens, and use rainwater capture for your outdoor water to the extent feasible. Make sure your toilets and other indoor appliances are as water-efficient as possible. Those actions can relieve the pressure on overtaxed water supplies such as the Colorado River, and we all need to do our part.
Importantly, we also need to stop blame-shaming farmers for their business decisions. Nor should we try to regulate what farmers can grow, or who they can sell to. As I said previously, they grow what we want to eat and are willing to pay for. If you care about the water crises in the West, perhaps you should think about what you’re eating: how much yogurt, how much cheese, how many burgers and steaks? Farmers will shift to growing other crops when our demands of them change.
Lastly, we need to insist that those individuals and agencies managing our water supplies do a much better job of planning for a secure, ecologically-sustainable water future. We’re stuck on reactive, short-term strategies such as forcing annual curtailments on water deliveries every time the water levels in our reservoirs or aquifers drop. This is no way to manage a water crisis. We need to quantify how much water is going to be reliably, sustainably available for our use over the long term and set a firm legal cap on that volume of consumption. Once we do that, our cities, industries, and farms will make the decisions and investments needed to thrive within nature’s limits.
Hayfield message to President Obama 2011 via Protect the Flows
An active early springtime pattern continued through late March and into the beginning of April. A pair of low pressure systems and trailing cold fronts tracked across the east-central contiguous U.S. (CONUS). A swath of 1 to 3 inches of precipitation supported improvements extending from parts of the Midwest to southeastern Kansa and northeastern Oklahoma. However, moderate drought (D1) was introduced to the lower Ohio Valley which has missed out on precipitation during the late winter and early spring. Increasing short-term dryness and periods of enhanced winds led to expansion of abnormal dryness (D0) and moderate drought (D1) in southwestern Kansas, northwestern Oklahoma, and western Texas. March was relatively wet across Arizona where additional improvements were warranted before a drier time of year sets in later this spring. Below-normal snowpack supported an increase in D1 across the northern Cascades of Washington. 7-day (March 26 to April 1) temperatures averaged below (above)-normal across the western and north-central (eastern) CONUS. Alaska remains drought-free, while leeward sides of Hawaii had a broad 1-category degradation. Following recent improvement across much of Puerto Rico, no changes were made this past week…
The northern to central Great Plains along with the central Rockies remained either status quo this week or had a 1-category improvement. Locally heavy precipitation (more than 1 inch) led to targeted improvements across southeastern Kansas. Lighter precipitation (0.25 to 1 inch) supported minor improvements to South Dakota. Based on SPIs at various time scales along with snow water equivalent close to average, improvements were necessary for parts of northern Colorado and southern Wyoming. 30-day SPEI and GRACE-based soil moisture supported a large increase in abnormal dryness (D0) across southwestern Kansas along with a slight expansion of moderate drought (D1) to the west of Wichita…
Colorado Drought Monitor one week change map ending April 2, 2024.
Multiple low pressure systems and enhanced onshore flow resulted in above-average precipitation for much of Arizona, Utah, Nevada, and California from March 26 to April 1. According to the California Department of Water Resources on April 2, snow water equivalent (SWE) averaged at or slightly above normal for the Sierra Nevada Mountains. A relatively wet March and widespread precipitation amounts of 0.5 to 1 inch, liquid equivalent, this past week supported improvements for Arizona. Given the recent precipitation, the drought impact was modified to reflect only long-term drought for most of Arizona. This region will be reevaluated next week and additional revisions may be warranted. Eastern and southern New Mexico have remained mostly dry during the past 30 days. According to USDA’s National Agricultural Statistics Service, 81 percent of New Mexico topsoil moisture is rated as short to very short. Washington, northern Idaho, and western Montana have below-normal SWE heading into early April. Abnormal dryness (D0) and moderate drought (D1) was expanded across the northern Cascade Mountains of Washington due to this low snowpack…
Major drought relief, associated with El Nino, occurred this past winter across the lower Mississippi Valley. However, there remains a lingering long-term drought across parts of western Tennessee and northern Mississippi. On April 1, locally heavy rainfall (more than 1.5 inch) resulted in small improvements to northeastern Oklahoma. Farther to the west across the southern high Plains, short-term dryness is increasing. Enhanced winds, elevated wildfire risk, and blowing dust have been quite frequent the past few weeks due to low pressure systems forming to the lee of the Rockies. Based on 30 to 60-day SPI, an expansion of abnormal dryness (D0) and moderate drought (D1) was warranted for parts of northwestern Oklahoma and western Texas…
Looking Ahead
During the next five days (April 4-8, 2024), drier weather is forecast to overspread the Midwest and East behind a cold front. Another low pressure system is forecast to track inland to the West with another round of rain and high-elevation snow from California east to the north-central Rockies. Later on April 8, precipitation is expected to develop across the southern Great Plains and lower Mississippi Valley.
The Climate Prediction Center’s 6-10 day outlook (valid April 9-13, 2024) depicts a pattern change by mid-April with a drying trend for the West. Below-normal precipitation is favored for this region along with the northern Great Plains. Elsewhere, across the central to southern Great Plains, Midwest, and East, above-normal precipitation is more likely. Above-normal temperatures are favored for much of the lower 48 states except for parts of New Mexico and western Texas where increased below-normal temperature probabilities are forecast.
US Drought Monitor one week change map ending April 2, 2024.
The final 100 miles of the Colorado River is a shell of its former self — nearly 10 miles wide at the turn of the century, steamboats would transport carriages and early-model cars from Mexicali to San Luis in Mexico’s Baja California state. Jaguars, beavers, deer and coyotes roamed the fertile riparian ecosystem and farmers had more water than they knew what to do with.
Now, a weave of concrete canals brings water to sprawling industrial farms situated in the Mexicali Valley, with much of the natural riverbed dry and the wildlife sparse. Tides still drive water from the Gulf of California into the valley a few times a year, but the days of a lush river delta in northern Mexico are long gone.
So, where did all the water go? Researchers on Thursday published one of the more comprehensive analyses of the Colorado River basin attempting to answer the question.
“What we’ve never had is a complete, holistic picture of where all of the Colorado River water goes,” said Brian Richter, president of Sustainable Waters and a lead author of the study.
Richter said that includes an accounting of how all the water in Mexico is used, water that’s exported out of the basin and water from the Gila River, a major tributary of the Colorado River that flows through parts of New Mexico and Arizona.
The answer will likely come as no surprise. According to the study, published in Communications Earth & Environment, irrigated agriculture is responsible for 52% of overall consumption in the basin, and 74% of direct human consumption.
Of that 52%, crops grown to feed cattle, like alfalfa, account for 32% of all water consumed from the Colorado River.
In the upper basin, which consists of Colorado, Wyoming, Utah and New Mexico, the study found crops grown to feed cattle use 90% of all water diverted toward irrigation — that’s three times the amount of water used for municipal, commercial or industrial use combined.
Richter’s team of researchers calculated the water budget for specific crops by using satellite imagery of agricultural land, then factoring in things like climate and length of growing season to determine consumption.
“If somebody is going to make a statement about how much of the Colorado River goes to irrigated farms, we wanted to make sure they have the right statistics,” Richter said.
The remaining 48% is broken down into three categories in the study — about 18% goes to municipal, commercial or industrial uses, while 11% is lost to evaporation in reservoirs.
Evapotranspiration accounts for the last 19%, which Richter essentially defines as water for the river ecosystem, consumed by riparian and wetland vegetation. It’s a novel approach to a study of this nature, Richter said.
“Usually when people do a water budget for a river system, they’re only paying attention to the human uses. We wanted to change that conversation,” he said.
Consider these other key findings from the study:
In Mexico, 80% of Colorado River water is used for agriculture, while just 7% is left for the river’s ecosystem and 13% for municipal, industrial or commercial use. The river was overconsumed, meaning more water was taken from the river than was supplied during spring runoff, in 16 of 21 years from 2000 to 2020. Users are overconsuming about 20% of the river’s water, the study found. The lower basin uses more water for agriculture than the upper basin — 54% of Colorado River water in the lower basin (Arizona, Nevada, California and Mexico) is used for crops and livestock, compared to 48% in the upper basin. In the upper basin, 24% of Colorado River water is consumed by the ecosystem compared to 14% in the lower basin. About 15% of the water in the upper basin is lost to evaporation in reservoirs — in the lower basin, that figure is at about 10%.
The study comes as water managers from Colorado River basin states are working on new management plans ahead of 2026, when current guidelines are set to expire. Negotiations are tense, and the states so far have yet to reach an agreement. Meanwhile, scientists estimate flows in the river have decreased by roughly 20% over the last century, with warming temperatures resulting in a 10% decrease in runoff.
Richter said he hopes the study can be of use as negotiations continue.
“We wanted to make sure those negotiators have the most accurate and the most complete estimates of where the water is going as a foundation,” he said.
“New plot using the nClimGrid data, which is a better source than PRISM for long-term trends. Of course, the combined reservoir contents increase from last year, but the increase is less than 2011 and looks puny compared to the ‘hole’ in the reservoirs. The blue Loess lines subtly change. Last year those lines ended pointing downwards. This year they end flat-ish. 2023 temps were still above the 20th century average, although close. Another interesting aspect is that the 20C Mean and 21C Mean lines on the individual plots really don’t change much. Finally, the 2023 Natural Flows are almost exactly equal to 2019. (17.678 maf vs 17.672 maf). For all the hoopla about how this was record-setting year, the fact is that this year was significantly less than 2011 (20.159 maf) and no different than 2019” — Brad Udall
WASHINGTON — The Department of the Interior today announced that up to $320 million is available under President Biden’s Investing in America agenda through the Bureau of Reclamation to assist federally recognized Tribes and Tribal organizations as they plan and construct domestic water infrastructure.
“Investing in water infrastructure projects is crucial to ensuring the health, safety and prosperity of Indigenous communities,” said Secretary Deb Haaland. “Through President Biden’s Investing in America agenda, we are making targeted investments throughout Indian Country to repair and revitalize key infrastructure facilities, which will help support our trust responsibilities, advance economic opportunities and expand access to clean, reliable drinking water for Indigenous communities.”
“Reclamation is working hard on projects that support water conservation and infrastructure improvements across Indigenous communities,” said Reclamation Commissioner Camille Calimlim Touton. “These efforts funded by the Investing in America agenda are integral to helping ensure Tribes have clean, reliable drinking water and upgraded infrastructure to support their communities.”
The Inflation Reduction Act invests an overall $550 million to expand domestic water supplies in historically disadvantaged communities. Projects may be funded for up to 100 percent of the cost of planning, design or construction. There is a maximum funding limit of up to $3 million for planning studies, including environmental compliance; up to $5 million for design projects, including environmental compliance; and up to $50 million for construction projects.
This funding is also advancing President Biden’s Justice40 Initiative, which aims to ensure that 40 percent of the overall benefits of certain climate, clean energy, and other federal investments flow to disadvantaged communities marginalized by underinvestment and overburdened by pollution.
This funding opportunity is open to Tribes in the 17 western U.S. states served by Reclamation, which will implement the program in two phases: phase one funding will be for planning, design or construction in fiscal year 2024; and phase two funding will be for construction in fiscal years 2027 and 2028. Receiving phase one funding is not a prerequisite for receiving phase two construction funding. However, all project proposals for construction must show that the planning and design have been successfully completed, and priority will be given to those funded under phase one. To be eligible, at least 80 percent of a project’s annual average deliveries must be for domestic water purposes.
Tribes interested in obtaining assistance under this program must submit a proposal to Reclamation’s Native American Affairs Office. Proposals will be accepted until August 4, 2024.
For more details on the application and award process, visit Reclamation’s Tribal Domestic Water Supply Projects Funding Announcement webpage.
Blanca Wetlands, Colorado BLM-managed ACEC Blanca Wetlands is a network of lakes, ponds, marshes and wet meadows designated for its recreation and wetland values. The BLM Colorado and its partners have made strides in preserving, restoring and managing the area to provide rich and diverse habitats for wildlife and the public. To visit or get more information, see: http://www.blm.gov/co/st/en/fo/slvfo/blanca_wetlands.html. By Bureau of Land Management – Blanca Wetlands Area of Critical Environmental Concern, Colorado, Public Domain, https://commons.wikimedia.org/w/index.php?curid=42089248
Colorado lawmakers will consider a fresh proposal to grant the state authority to oversee streams and wetlands left unprotected by a U.S. Supreme Court decision last year.
House Bill 24-1379, sponsored by House Speaker Julie McCluskie, D-Dillon, Rep. Karen McCormick, D-Longmont, and Sen. Dylan Roberts, D-Frisco, would allow the Colorado Department of Public Health and Environment (CDPHE) to oversee a wide array of industrial players, including home and road builders and mining companies, and determine what steps are necessary to minimize any damage to streams and wetlands caused by their activities.
In May, the U.S. Supreme Court issued a ruling in Sackett vs. EPA that sharply limits the streams and wetlands that qualify for protection under the Clean Water Act, a decision that water observers said had a particularly broad impact in the West. In Colorado and other Western states, vast numbers of streams are temporary, flowing only after major rainstorms and during spring runoff season, when the mountain snow melts.
Colorado Rivers. Credit: Geology.com
In addition, hundreds of Colorado wetlands lack an obvious surface connection to streams, in part because so many of the state’s streams don’t flow year-round.
“As a state we don’t want to let a good crisis go to waste,” McCluskie said in a briefing last week, referring to the Sackett decision and the regulatory gap that was created. “Our water is part of the romance and tradition of being a Coloradan. Protecting those waterways could not be more important. But we recognize there needs to be clarity and certainty for our industry partners. And we have tried to be very considerate of differing viewpoints.”
At issue is how the U.S. Environmental Protection Agency now defines so-called Waters of the United States, or WOTUS, which determines which waterways and wetlands are protected under the federal Clean Water Act. The definition has been heavily litigated in the nation’s lower courts since the 1980s and has changed dramatically under different presidential administrations.
The U.S. Supreme Court decided in May that the WOTUS definition that included wetlands adjacent to streams was too broad.
In its ruling, the court said only those wetlands with a direct surface connection to a stream or permanent body of water, for instance, should be protected.
The court’s decision in the WOTUS case means it will be up to Colorado and other states to decide whether and how to handle that regulation — including permitting — and enforcement.
And last month, Republican Sen. Barbara Kirkmeyer, of Brighton, introduced Senate Bill 24-127, also designed to fill the regulatory gap. The Kirkmeyer measure, which has broad industry support, is scheduled for its first hearing April 4, but it’s likely to meet stiff resistance in the Democratic-controlled General Assembly.
Among the key differences between the two measures is that Kirkmeyer’s proposal states that any new rules can’t be more restrictive than those in place prior to the Sackett decision, while McCluskie’s says protections should be “at least as protective” as those in place at that time, according to Jarrett Freedman, spokesman for the House Democrats.
Another difference is that Kirkmeyer’s bill would place the new oversight program within the Colorado Department of Natural Resources instead of the CDPHE. Kirkmeyer said a huge permitting backlog at CDPHE shows the agency would be unable to handle dredge-and-fill permitting required under her proposal.
McCluskie, however, believes the new program would be better housed within the state health department and that new funding would alleviate permitting delays.
The first hearing on the House Bill 24-1379 has not been scheduled, Freedman said.
A broad array of environmental groups has come out in favor of McCluskie’s measure.
Iron Fen. Photo credit from report “A Preliminary Evaluation of Seasonal Water Levels Necessary to Sustain Mount Emmons Fen: Grand Mesa, Uncompahgre and Gunnison National Forests,” David J. Cooper, Ph.D, December 2003.
“Wetlands are nature’s kidneys, they filter natural pollutants, they help reduce the severity of wildfires,” said Josh Kuhn, senior water campaign manager at Conservation Colorado who spoke on behalf of the Protect Colorado Waters Coalition.
“But the Sackett decision left many of those wetlands unprotected … and we have also lost protections for seasonal streams. If pollution is dumped into streams when snow melts and runs off, that pollution gets washed into the larger rivers. … If there is mining or development activity and they are dumping fill, or dirt, into dry streambeds, when there is water moving through those streambeds it is going to take those pollutants with it and pollute our water supply,” he said.
Farm, homebuilding and mining interests have been closely watching the bill, which includes extensive exemptions for agriculture for such things as irrigation ditch repair, and on-farm water management activities. It also includes some exemptions for mining operations.
But there is still concern about the regulatory burden the new program will place on those industries and the time it will take to write new regulations and launch the program.
House Bill 24-1379 stipulates that rules be written by May 31, 2025.
“The rulemakings that they are contemplating are going to be complicated and detailed, and it’s going to be a lot to accomplish in a short period of time,” said John Kolanz, a northern Colorado attorney who often represents developers and who is tracking the bill. “It seems like a tall task.”
More by Jerd SmithJerd Smith is editor of Fresh Water News. She can be reached at 720-398-6474, via email at jerd@wateredco.org or @jerd_smith.
Ephemeral streams are streams that do not always flow. They are above the groundwater reservoir and appear after precipitation in the area. Via Socratic.org
Click the link to read the article on the Vail Daily website (Scott Miller). Here’s an excerpt:
March 30, 2024
Lawns are nice. But they use a lot of water, can be expensive and often don’t make sense for many of us here in the high desert. The Beyond Lawn program wants to help. The program is a joint effort between the Eagle County Soil Conservation District, the local office of the Colorado State University Cooperative Extension Service and the Eagle River Coalition. The idea is to help residents responsibly replace their lawns with attractive, water-wise landscaping. Cooperative Extension will provide volunteers from the Master Gardener program to help put the right plants into the right soils. The Master Gardeners are also helping create demonstration gardens in Edwards, Eagle and Gypsum this spring.
The program will also offer turf conversion rebates to residents. Denyse Schrenker of the Cooperative Extension noted that the Eagle River Water & Sanitation District has had its own turf conversion program for a while now. The Beyond Lawn program will offer similar services to residents who aren’t customers of the water and sanitation district. To participate, residents can sign up for an evaluation through the Beyond Lawn website. Evaluations cost $100 and provide expert reports specific to a resident’s yard, including soil types and lists of plants that would work to replace turf grass in those yards…
Rose Sandell is the Eagle River Coalition’s Education and Outreach Coordinator. She said part of last year’s efforts included determining how to approach residents with what can be a big request.
“We’re trying to break down the scariness of it all … down to manageable pieces,” Sandell said. She said that a piece of a yard where it’s hard to keep grass growing could be a good place to start turf replacement.
Interested in methane and other greenhouse gas emissions near you? Check out http://climatetrace.org, which allows you to see emissions from oil and gas fields, large individual facilities, and more. You can also break it down by industry.
Final rule established after Hickenlooper and Bennet pushed federal government to follow Colorado’s lead
WASHINGTON – Today, U.S. Senators John Hickenlooper and Michael Bennet applauded the announcement of a final rule from the Bureau of Land Management (BLM) that will reduce methane emissions from the production of oil and gas on federal and Tribal lands, conserving billions of cubic feet of gas that might otherwise have been vented, flared, or leaked.
“Colorado has led the way in reducing methane emissions. Taking basic steps to cut harmful emissions will go a long way to slowing climate change and keep pollutants out of our atmosphere. Now, the rest of the country will follow Colorado’s lead so we can meet our climate goals,” said Hickenlooper.
“Colorado has led the nation in limiting methane emissions from the oil and gas industry, and has long recognized the harm caused by routine venting and flaring. These practices waste valuable natural resources, risk the health of surrounding communities, and pollute the environment,” said Bennet. “I’m glad BLM followed our state’s example and is taking steps to cut down on these wasteful practices on our public and Tribal lands.”
The final rule comes after Hickenlooper and Bennet urged the agency last year to follow Colorado’s lead by eliminating routine venting and flaring from oil and gas operations on public and Tribal lands. This final rule will conserve billions of cubic feet of gas and keep harmful methane emissions from entering our atmosphere, while generating more than $50 million in additional natural gas royalty payments each year. This conserved gas will be available to power American homes and industries.
Routine flaring is the practice of regularly burning off excess gas during oil and gas production and processing as a waste product; venting allows excess gas to escape directly into the atmosphere without burning it. Methane, a harmful climate pollutant many more times more potent than carbon dioxide, can be released into the atmosphere in pollution from flaring and venting. Human-caused methane emissions are responsible for at least 25 percent of the climate warming we are experiencing today.
As governor, Hickenlooper brought together environmentalists and the oil industry to create the world’s first methane regulations. Those regulations were used by President Obama as a model for national standards which in turn were used as a basis for the international methane pledge in 2021.
Hickenlooper and Bennet have consistently worked to cut methane emissions and strengthen federal oil and gas methane rules, modeled on Colorado’s. In 2021, Hickenlooper and Bennet led members of the Colorado congressional delegation to push the EPA for stronger methane regulations for the oil and gas sector. Last year, the senators urged the EPA to use data from innovative monitoring technologies like satellite imaging, and tighten restrictions on routine flaring to strengthen methane emission standards. In November, the senators urged the EPA to more accurately track methane emissions. In January, Hickenlooper celebrated the announcement of a conditional commitment from the Department of Energy for up to $189 million in loan guarantees from the Inflation Reduction Act to support the fabrication and installation of a real time methane emissions monitoring network across Texas, Oklahoma, Kansas, Colorado, North Dakota, and New Mexico.
Utah’s Bears Ears National Monument rarely leaves the news. The political tussle over this stunning expanse of red rock canyons exemplifies all the cultural dissonance in the rural West.
Three presidents have signed Bears Ears proclamations. Barack Obama established Bears Ears National Monument in 2016, but supporters were devastated when Donald Trump eviscerated the monument the following year, reducing its area by 85%. In 2021, President Joe Biden restored the original boundaries and then some.
Elders of the Bears Ears Inter-Tribal Coalition gather for an overnight ceremony.
Photo Credit: Dave Showalter
What’s clear is that Bears Ears remains reviled by Republican officials and cherished by Indigenous tribes and conservationists.
The monument, 1.36 million acres in southeast Utah, lies within San Juan County. The Navajo Nation covers 25% of the county, and Native people account for more than half of the 14,200-person population. Just 8% of the county is private land while another 5% is state trust land.
The rest — 62% of the county — is federal land owned by the people of the United States and administered by the Departments of Agriculture and Interior. This immense commons testifies to the sublime difficulty of the place — beautiful enough to warrant preservation as national parks, monuments and forests. But it’s also arid enough to attract only a few 19th-century settlers to what had been Indigenous homeland for millennia.
I think it’s fair to say that San Juan County’s white residents never envisioned challenges to their political power. But in 2009, the feds came down hard on generations of casual pothunting by local white families. Then, after a century of oppressing their Indigenous neighbors, lawsuits strengthened Native voting rights. The county commission became majority Navajo from 2018 to 2022.
Native influence keeps expanding. The five tribes of the Bears Ears Inter-Tribal Coalition first envisioned a national monument and became co-stewards for these 1.36 million acres. They have a champion in Secretary of the Interior Deb Haaland, an enrolled member of the Laguna Pueblo tribe, but such historic changes make the dominant culture uneasy.
In February, Utah Governor Spencer Cox dramatically withdrew from a Bears Ears land exchange poised for completion. This swap of state trust lands for Bureau of Land Management lands would hugely benefit the state. Details were already negotiated; each side compromised; the stakeholders were largely content.
But in 2024, Utah politics are stark, compounded by distrust and disinformation.
At statehood in 1896, Utah received four sections per township to support public schools and universities. The Utah Trust Lands Administration manages these scattered lands — blue squares on ownership maps — but blocking up these blue squares into manageable parcels means trading land with federal agencies.
Such trades aren’t rare and can be grand in scale. A 1998 negotiation between Interior Secretary Bruce Babbitt and Utah Governor Mike Leavitt traded Grand Staircase–Escalante National Monument’s 176,000 acres of school sections for BLM land elsewhere — along with a hefty $50 million payment to Utah from the U.S. Treasury. Utah Trust Lands still brags about the deal on its website.
Motorized vehicle limited and closed zones under the preferred alternative. It marks a fairly minor shift from the status quo, but significantly closes Arch Canyon to OHVs. Note the squares scattered about: They are sections of state land that would be traded out in a land exchange. Right now it is on hold, however, thanks to Utah lawmakers. Via Jonathan P. Thompson/The Land Desk
But the old guard is up in arms about the draft Bears Ears Resource Management Plan released for public comment on March 8. The BLM’s preferred alternative emphasizes traditional Indigenous knowledge and land health.
Any such gestures toward conservation elicit local outrage about the feds “destroying” the pioneer way of life. The subtext: the people long in charge don’t want to lose power.
Denouncing federal overreach is always a sure win for Utah politicians. In this year’s Republican primary, San Juan County-based legislator Phil Lyman is challenging the incumbent governor with fierce anti-public lands rhetoric. Governor Cox will need to protect his right flank.
Meanwhile, school trust lands within Bears Ears remain at risk. The tallest structure in Utah, a 460-foot telecom tower with blinking red lights, could rise on state land in the heart of the monument. It’s been approved by county planners, and the Trust Lands Administration could add poison pills on other lands proposed for exchange.
The elected leaders of Utah have decided that the monument’s integrity and the needs of the state’s children matter less than political gamesmanship.
Stephen Trimble: Photo credit: Writers on the Range
The five tribes of Bears Ears know better: “It is our obligation to our ancestors…and to the American people, to protect Bears Ears.” Their big hearts will win in the end.
Stephen Trimble is a contributor to Writers on the Range, writersontherange.org, an independent nonprofit dedicated to spurring lively conversation about the West. He lives in Utah and will publish the 35th anniversary edition of his book The Sagebrush Ocean: A Natural History of the Great Basin next winter.
Last week, on my way from Durango to southeastern Utah to get my sagebrush and slickrock fix, I drove through one of my favorite places anywhere: McElmo Canyon. The evening light, filtered through a series of spring squalls moving across the Great Sage Plain, lent a warm glow to the leafless cottonwoods and the red spikes of willow poking out of winter-dry cattails. The ditchcots — the feral apricot trees that cling to the edges of irrigation canals — were in full bloom. The beige fields were beginning to turn green. And newborn calves bounded clumsily among their slow-moving elder cows.
I may have screamed something about how beautiful it all was out the open window of my moving car. Yet I was also struck with a sense of melancholy, for I knew that the scene would not last, and that the McElmo Canyon landscape I so cherish will vanish, or at least change radically, in the not-so-distant future.
La Plata Mountains from the Great Sage Plain with historical Montezuma County apple orchard in the foreground.
It’s not climate change that threatens the place — at least not directly. It’s the fact that so much of what is appealing about McElmo Canyon is essentially artificial. It was made possible by large-scale, inefficient irrigation, by diverting water from the Dolores River and transplanting it into laterals and ditches that then flood alfalfa and hay fields — swatches of emerald green that juxtapose delightfully against sandstone cliffs in the heat of summer. Leaky ditches create mini-riparian zones (and ditchcot groves), bountiful with feral asparagus in the spring, where once were only dryland shrubs; flood-irrigation runoff pools into inadvertent wetlands that nurture cottonwoods and cattails, milkweed, willows, and boxelders.
McElmo Canyon this March, with the ditchcots in bloom. Jonathan P. Thompson photo.
This phenomenon isn’t unique. It’s repeated in valleys all over the arid West, where a stark dividing line between irrigated and non-irrigated lands is often evident. The settler-colonial project to harness and tame the West’s rivers and streams has not only allowed crops and cities to grow in places they couldn’t before, but it has also altered much of the landscape so thoroughly that many of us can’t even imagine what these valleys looked like in the days before industrial-scale irrigation.
Farmer’s Ditch in the North Fork Valley of western Colorado, which nurtures a mini-riparian environment of its own. Jonathan P. Thompson photo.
Richter’s tabulation confirmed and put more exact numbers to what we already knew: The Colorado River system is overtaxed and it’s shrinking. Since the largest user is agricultural irrigation, that’s whence the biggest cuts must come. Those cuts will indirectly affect McElmo Canyon and landscapes like it.
***
Richter and his colleagues published their first Western water accounting in 2020 under the telling title: “Water Scarcity and Fish Imperilment Driven by Beef Production.” This spring, Richter and his team released an update of sorts, this time focusing entirely on the Colorado River. It’s the first-ever complete accounting of the system, encompassing water use from the Gila River, a tributary in New Mexico and Arizona, and all the consumptive uses of the Colorado’s water, including reservoir evaporation and riparian and wetland evapotranspiration, as well as out-of-basin exports to places like Denver and the Rio Grande watershed, and water use in Mexico.
The findings included:
Irrigated agriculture is by far the dominant consumer of Colorado River water, accounting for 52% of overall consumption (which includes reservoir evaporation and riparian and wetland evapotranspiration) and 74% of direct human consumption.
Cattle-feed crops (alfalfa and other hay) consume more Colorado River water than any other crop category, accounting for 32% of all water from the basin; 46% of direct water consumption; and 62% of all agricultural water consumed.
Cattle-feed crops consume 90% of all the agricultural irrigation water in the Upper Basin — three times more than is consumed by municipal, commercial, and industrial uses combined.
19% of the water supports the natural environment through riparian and wetland vegetation evapotranspiration along river courses.
The Colorado River’s users collectively consume far more water than exists in the system and if demand is not balanced with supply, we face all kinds of woe. Most folks probably would like to see desert cities — and ostentatiously profligate water-users, such as golf courses and lawns and swimming pools — bear the burden of those cuts. After all, who values golf over food production?
But as the Land Desk has pointed out numerous times: The math just doesn’t support this solution. The cities and golf courses and even the energy industry, thirsty as they may be, don’t use enough water to make the necessary cuts. The biggest cuts are going to have to come from the biggest users: agriculture, specifically hay, alfalfa, and other forage for beef and dairy cows. “The only dial we have to work with is irrigated farming,” Richter said.
When the dilemma is considered in the abstract, based on a flow chart like the one pictured above, the solution seems straightforward: Cut off the irrigation to those vast swaths of perfect squares and circles of emerald green alfalfa in the southern California and Arizona deserts (and stop eating beef and cheese). It’s simple math. Of course, it’s also severe and would have major economic and cultural ramifications. A friendlier solution is to keep irrigating, but in a more efficient way: Pipe irrigation laterals and canals or line them so they stop leaking; end flood-irrigation to reduce waste (and irrigation runoff); and plant less water-intensive crops.
But any of these solutions would ripple beyond the canals and fields and into the irrigation-created landscapes many of us have grown to love. McElmo Creek likely would run only after snowmelt and monsoon storms, the leaky-ditch created wetlands would fade away, and many of the willows and cattails and cottonwoods and ditchcots that rely on irrigation runoff would perish. A new, more “natural” landscape would later emerge, but the transition period would be choked with invasive weeds and desiccated riparian vegetation.
It’s more than just the look or feel of the land and vegetation that will be affected when less or no water is delivered to the alfalfa and hay fields of the West. Ecosystems will feel the impacts as well. A program paying farmers to stop irrigating some fields in California’s Imperial Valley, for example, has been delayed because it could adversely affect endangered pupfish that have taken up residence in irrigation drains.
This is not an exhortation to continue dumping water on alfalfa fields to preserve the ecosystems and aesthetic that have risen up alongside them. It is merely a lament. To save the West’s streams and rivers, sacrifices must be made. That they are necessary doesn’t make them any less heartbreaking.
An irrigated hay field juxtaposed against sandstone in McElmo Canyon. Jonathan P. Thompson photo.
🌵 Public Lands 🌲
You know how we’ve been reporting about new management plans for Grand Staircase-Escalante and Bears Ears National Monuments over the past several months? You may not have noticed, but we have NOT been reporting on management plans for Gold Butte and Basin and Range National Monuments in Nevada. Why? Because the Bureau of Land Management hasn’t formulated them, yet, even though it’s been nearly a decade since they were established.
This has set up a sort of nightmare scenario: The areas are receiving national monument-level visitation, but only the usual federal land protections. The result, according to a lawsuit filed by the Center for Biological Diversity recently, is a mess. The lack of toilets or garbage receptacles has led to human waste, toilet paper, and trash scattered around popular sites. Cattle grazing is occurring with little to no management — including by Cliven Bundy’s infamous cows, which continue to graze illegally in Gold Butte — degrading desert tortoise habitat.
The lawsuit seeks to force the agency to establish management plans for both national monuments
***
There’s also good news for national monuments: The U.S. Supreme Court has declined to take up the timber industry’s lawsuit seeking to nullify the 2017 expansion of Cascade-Siskiyou National Monument in Oregon. While the case was focused on a specific national monument, it also challenged the authority of presidents to protect places under the Antiquities Act of 1906.
Three timber advocacy groups sued the federal government shortly after President Obama added 48,000 acres to the existing national monument near the end of his second term. Read more in OPB.
***
Labyrinth Canyon. Copyright Ray Bloxham/SUWA
Along those same lines: A federal court rejected motorized groups’ lawsuit seeking to block the implementation of a new travel management plan for the Labyrinth Rims/Gemini Bridges area northwest of Moab. That will allow the BLM to move forward with the plan, which closes 317 miles of roads and trails to motorized use on about 468 square miles of public land, and leaves 800 miles of routes open to OHVs.
A fresh coating of snow covers the West Needles in southwestern Colorado in March. Spring storms have brought the region’s snowpack to “normal” levels after a slow start to winter. Jonathan P. Thompson photo.

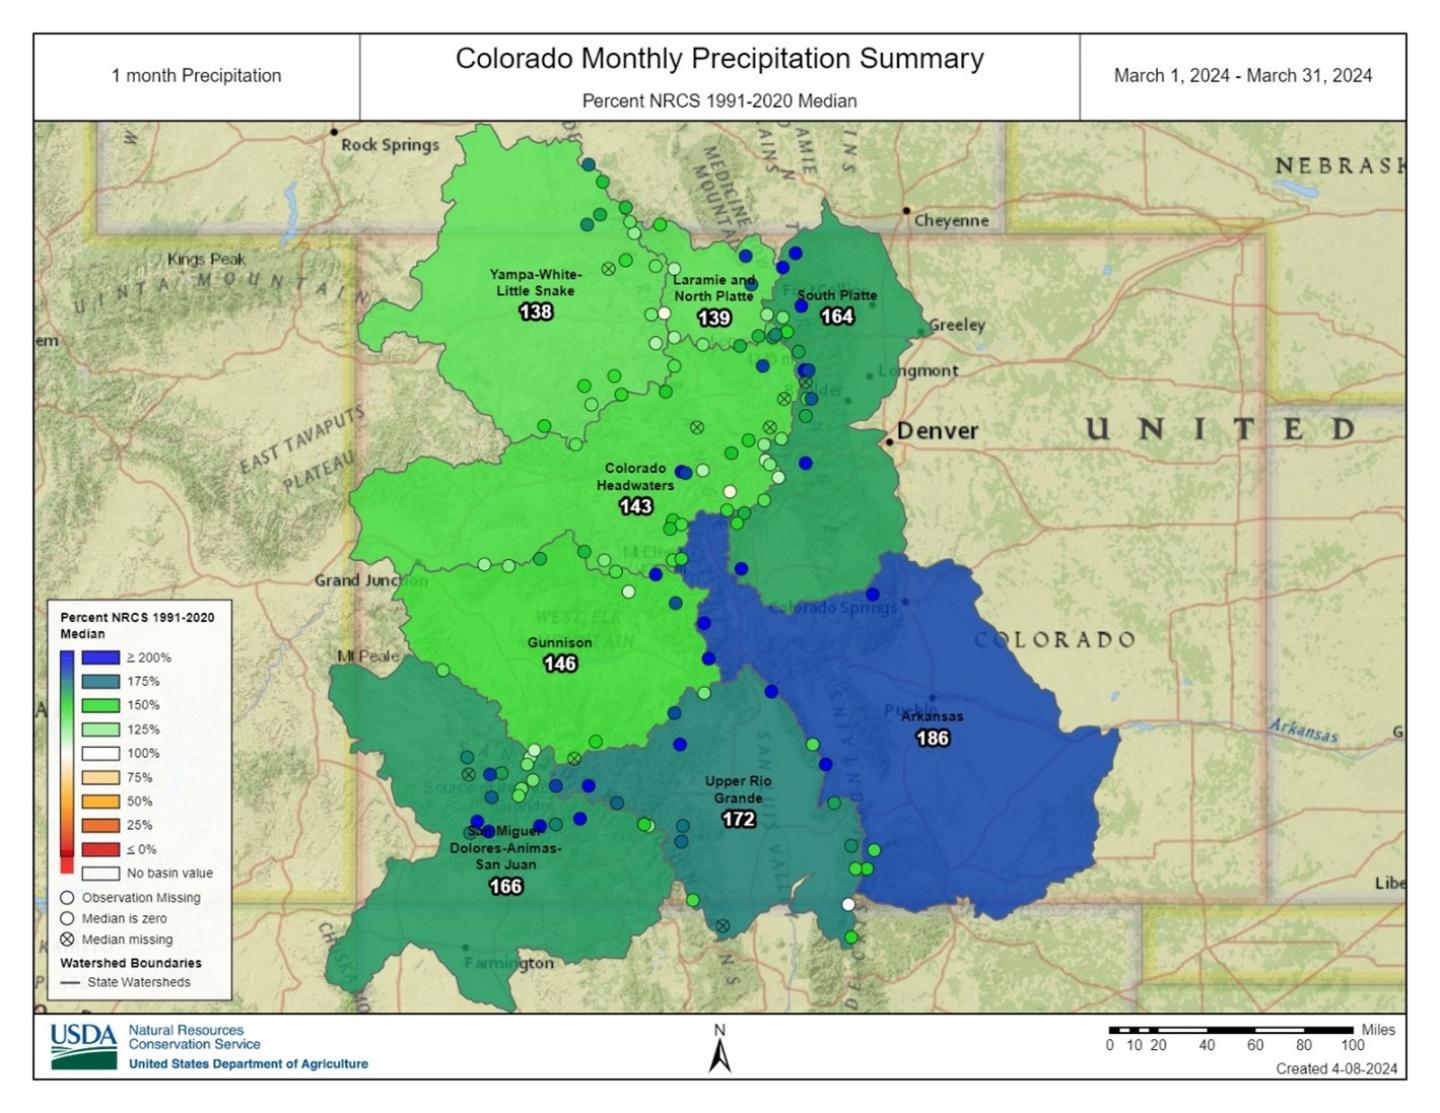
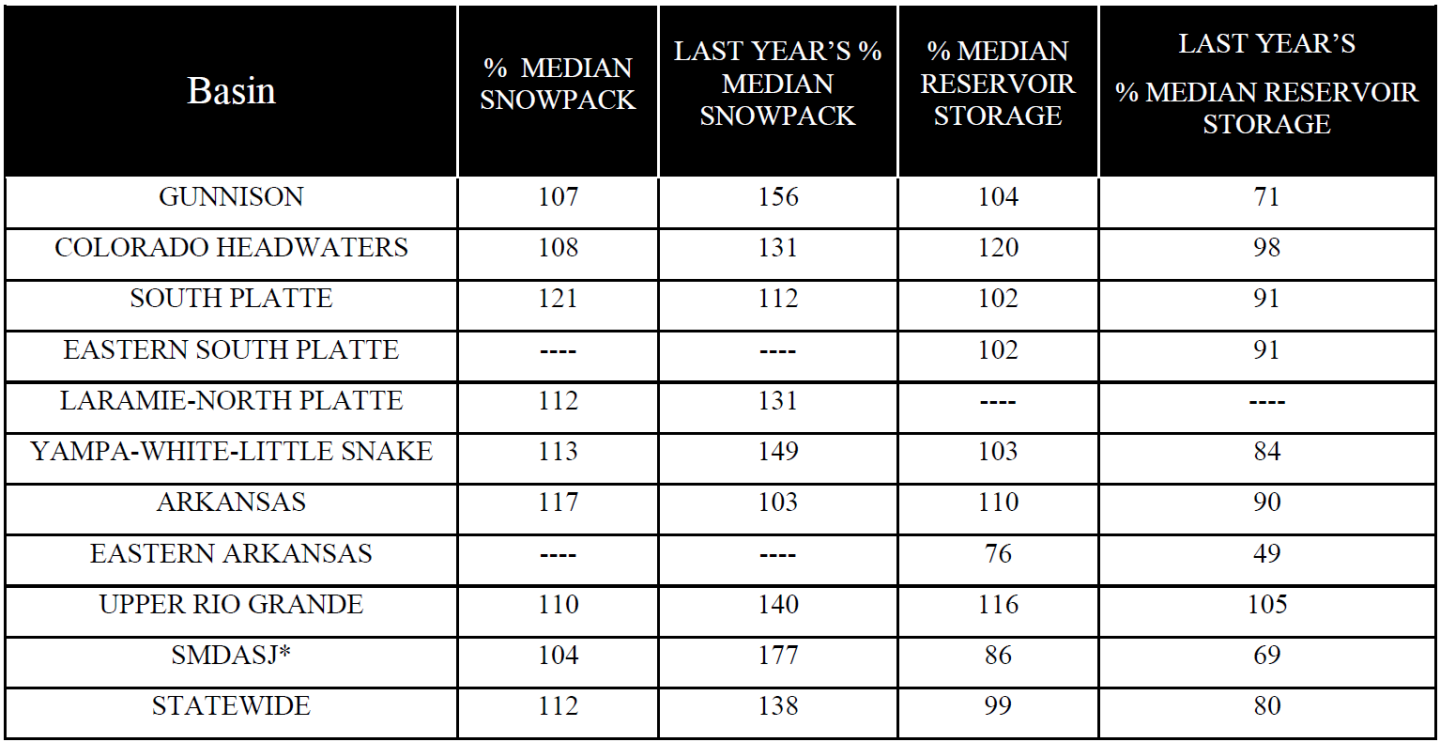


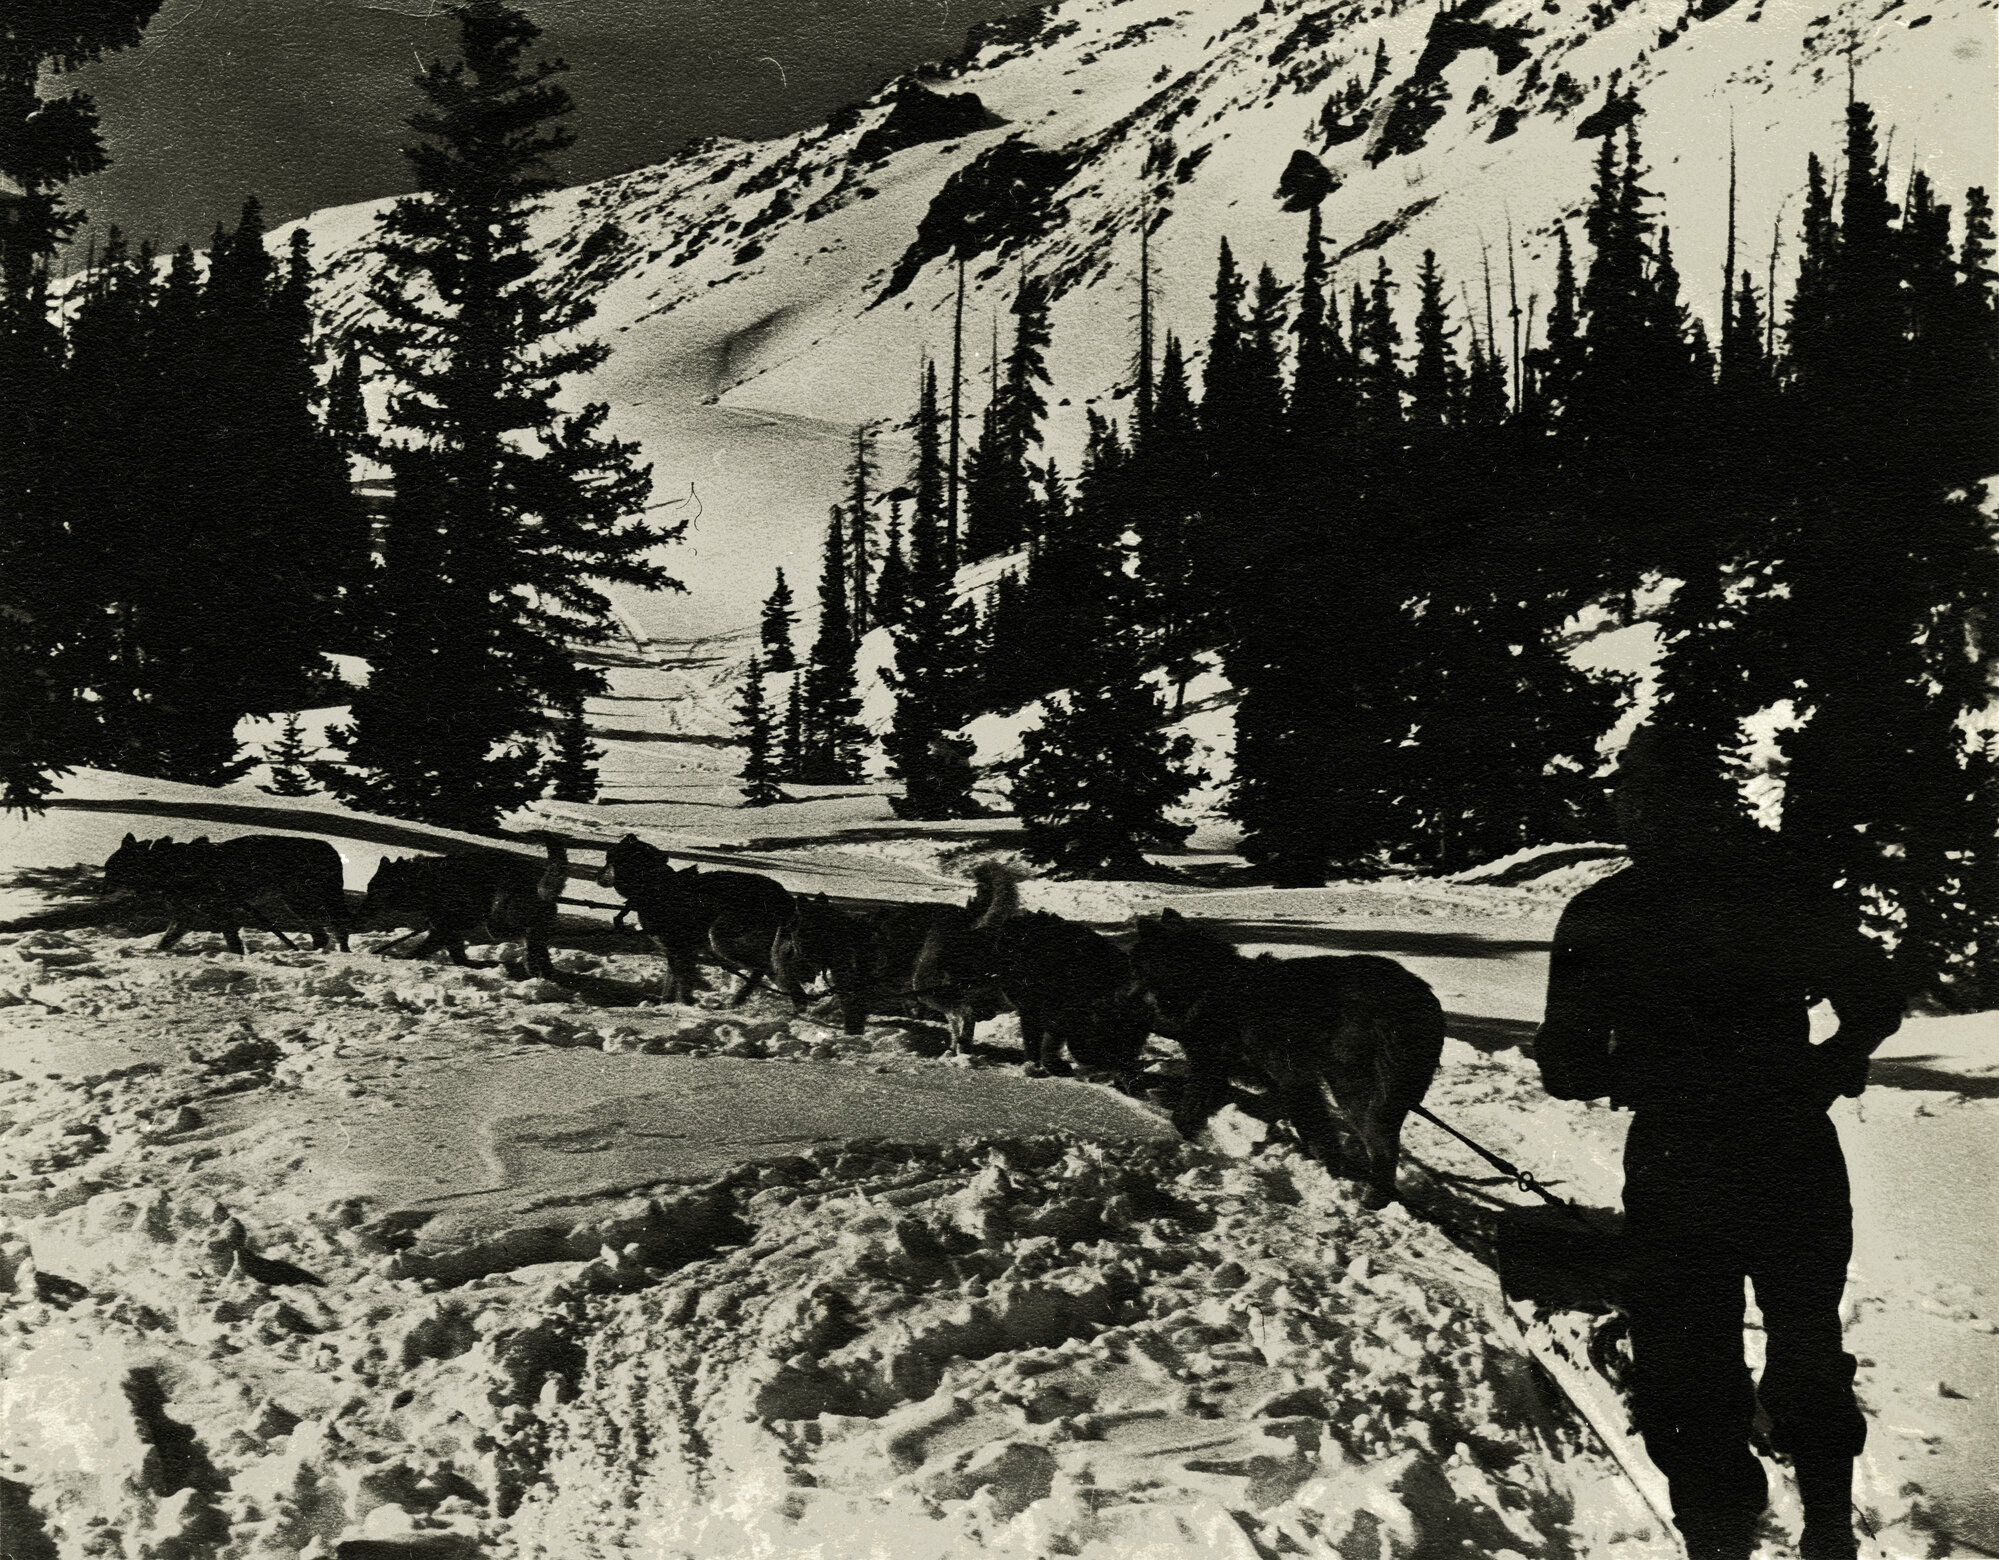


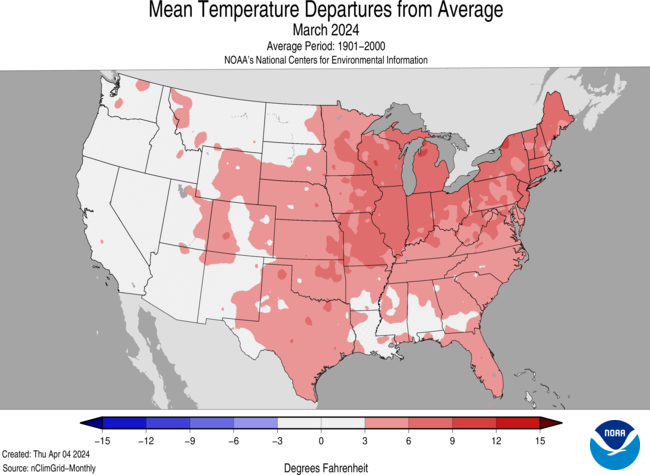
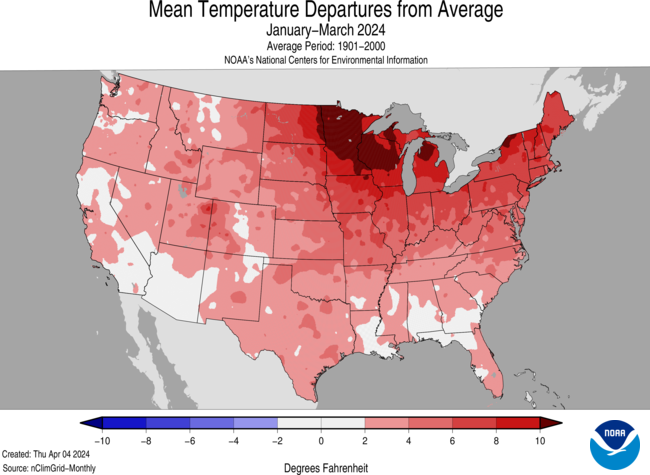
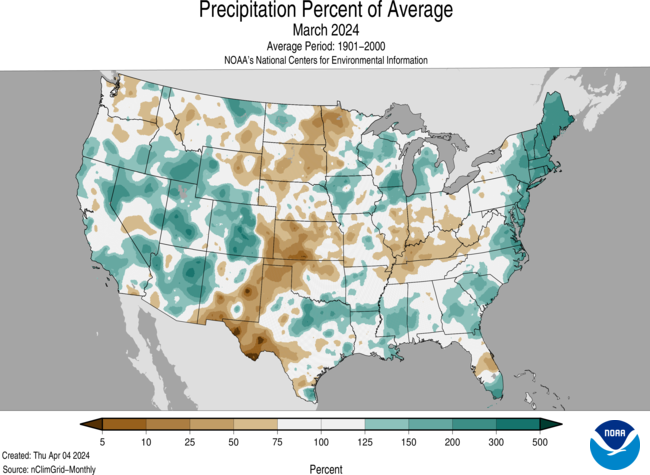
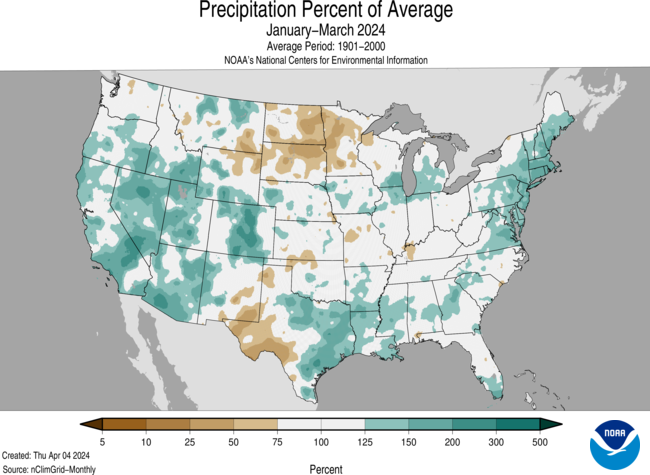

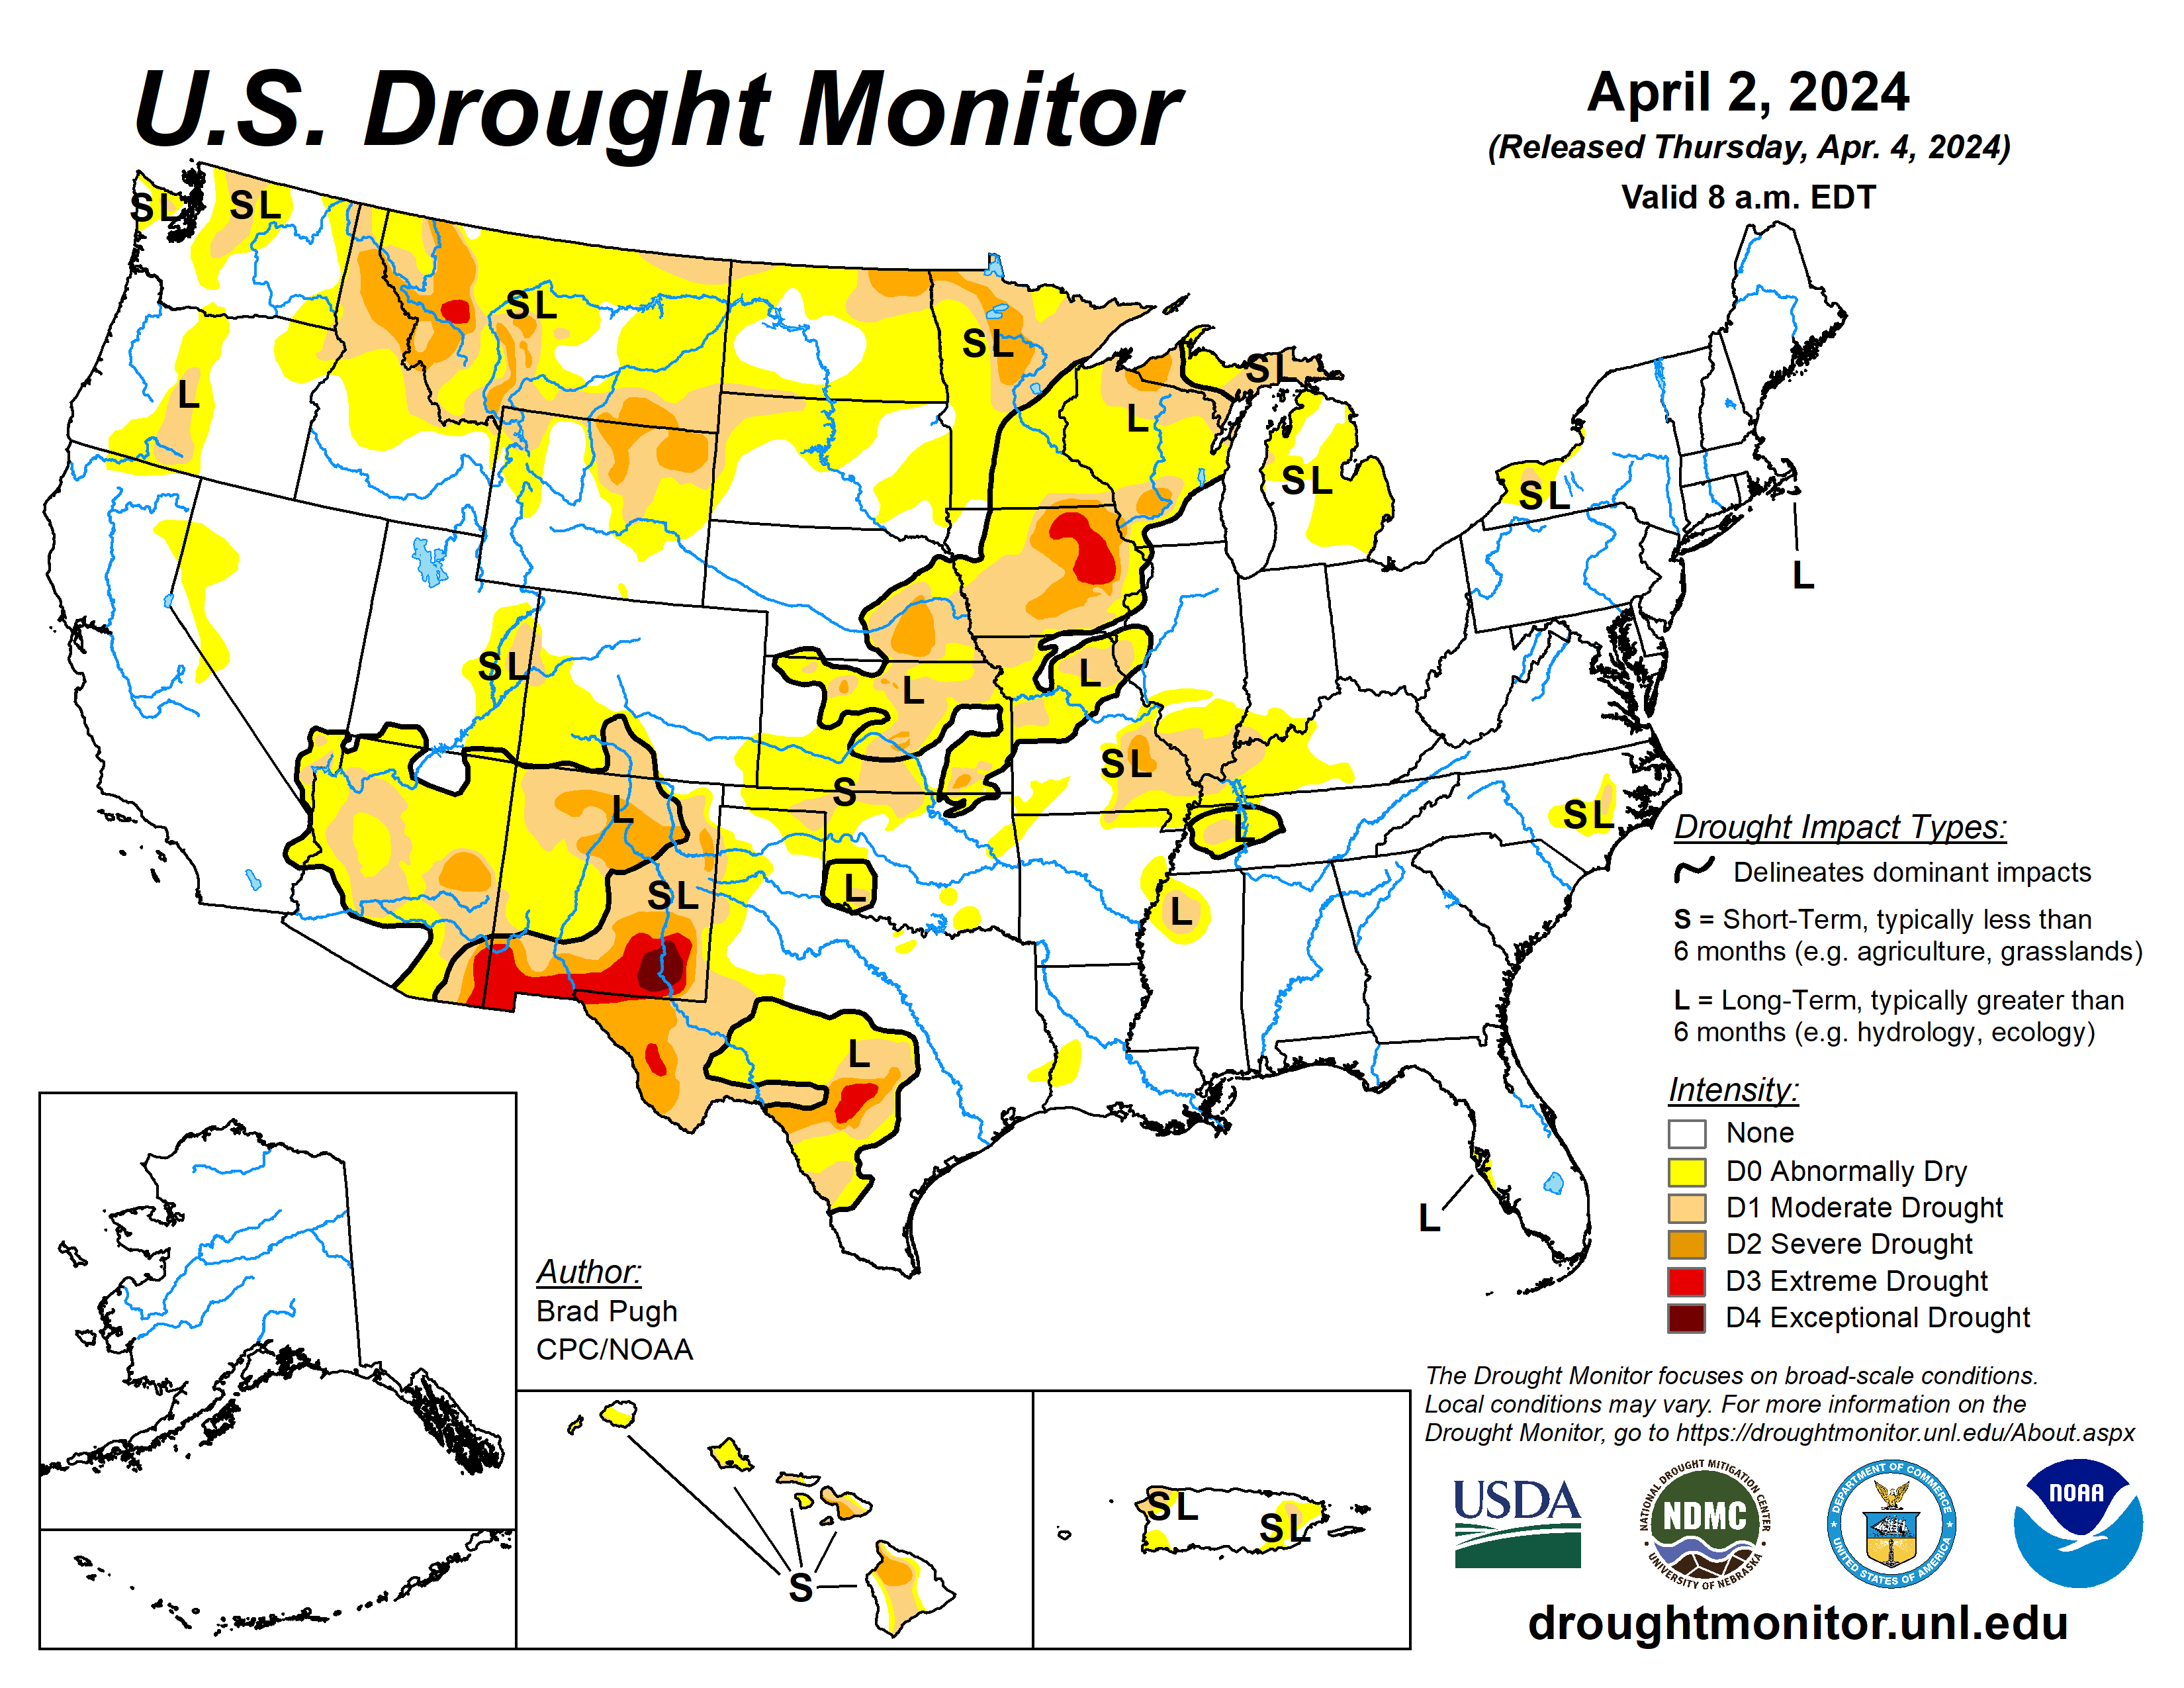
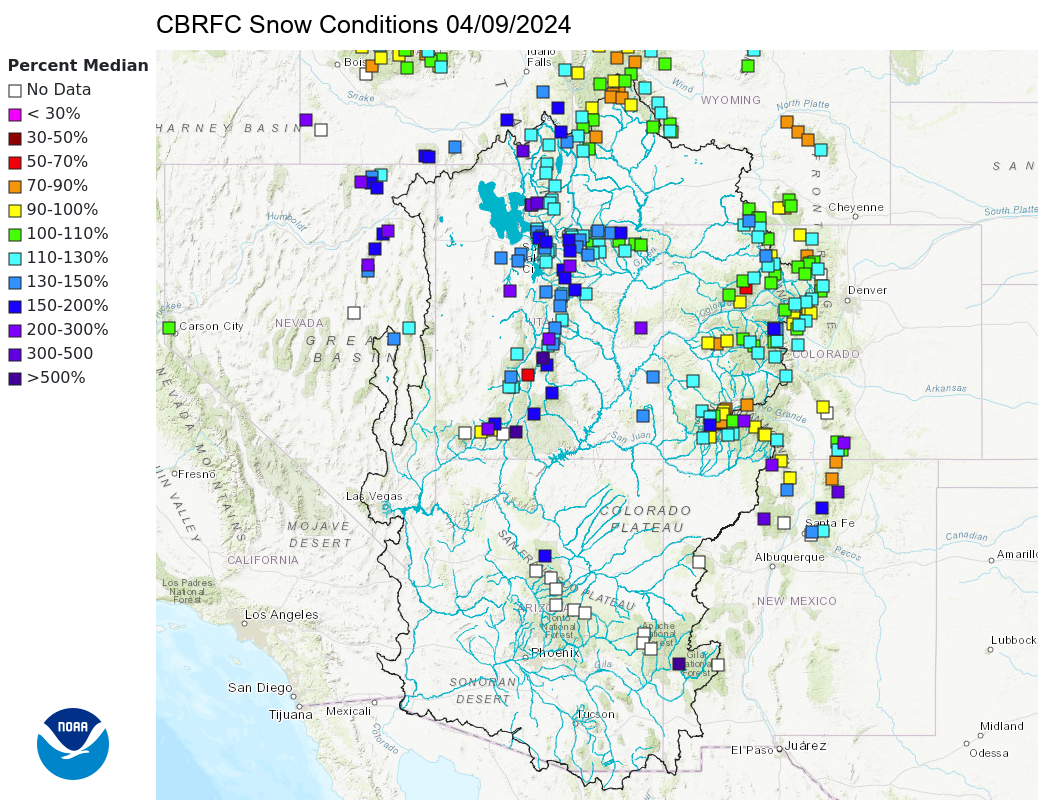

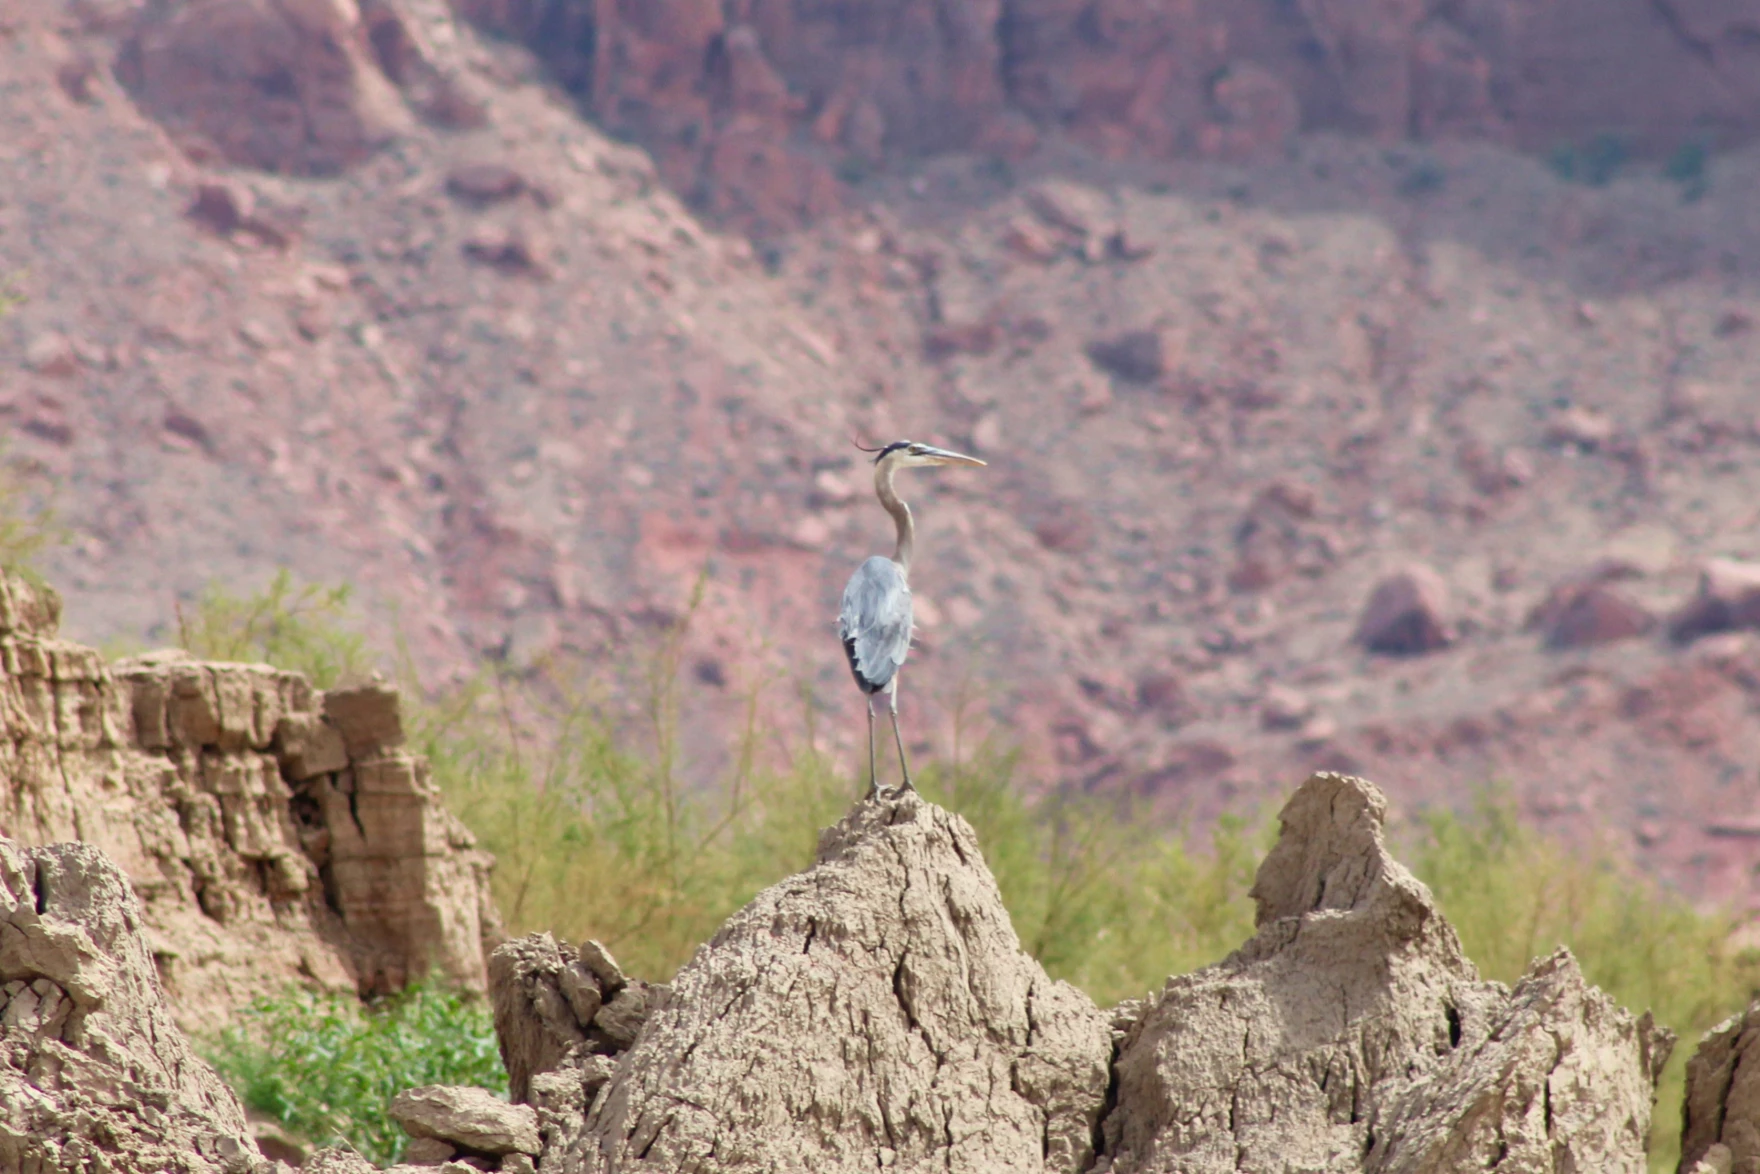


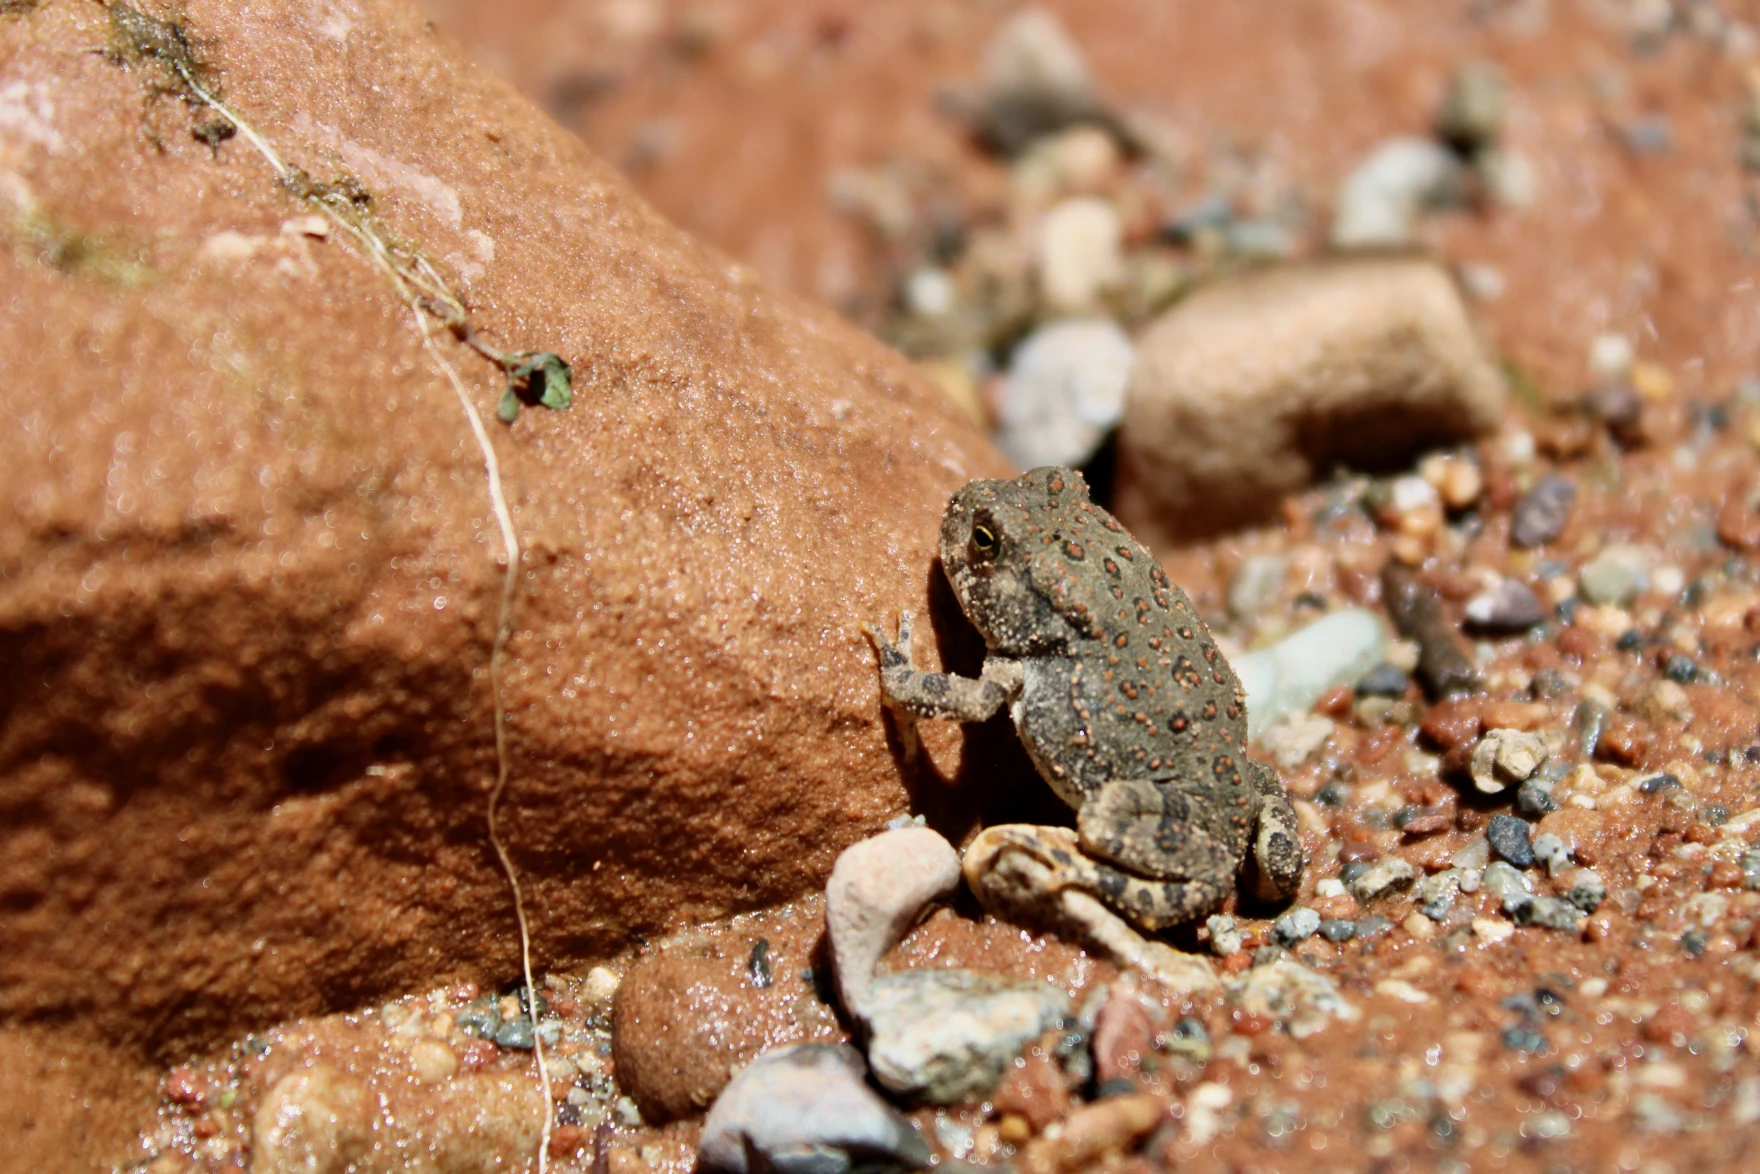


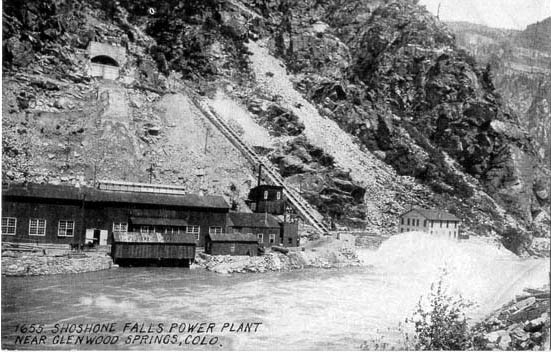
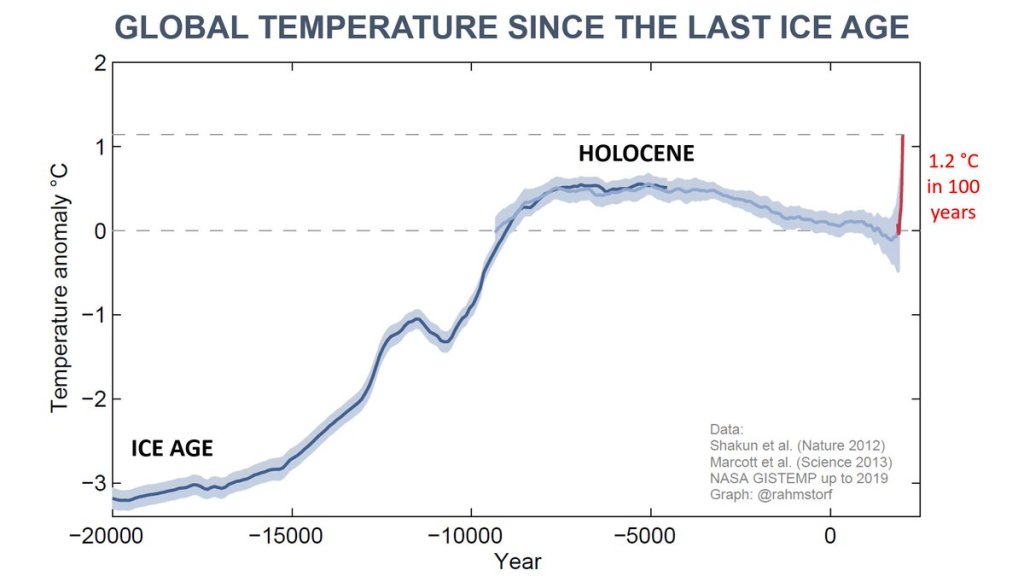
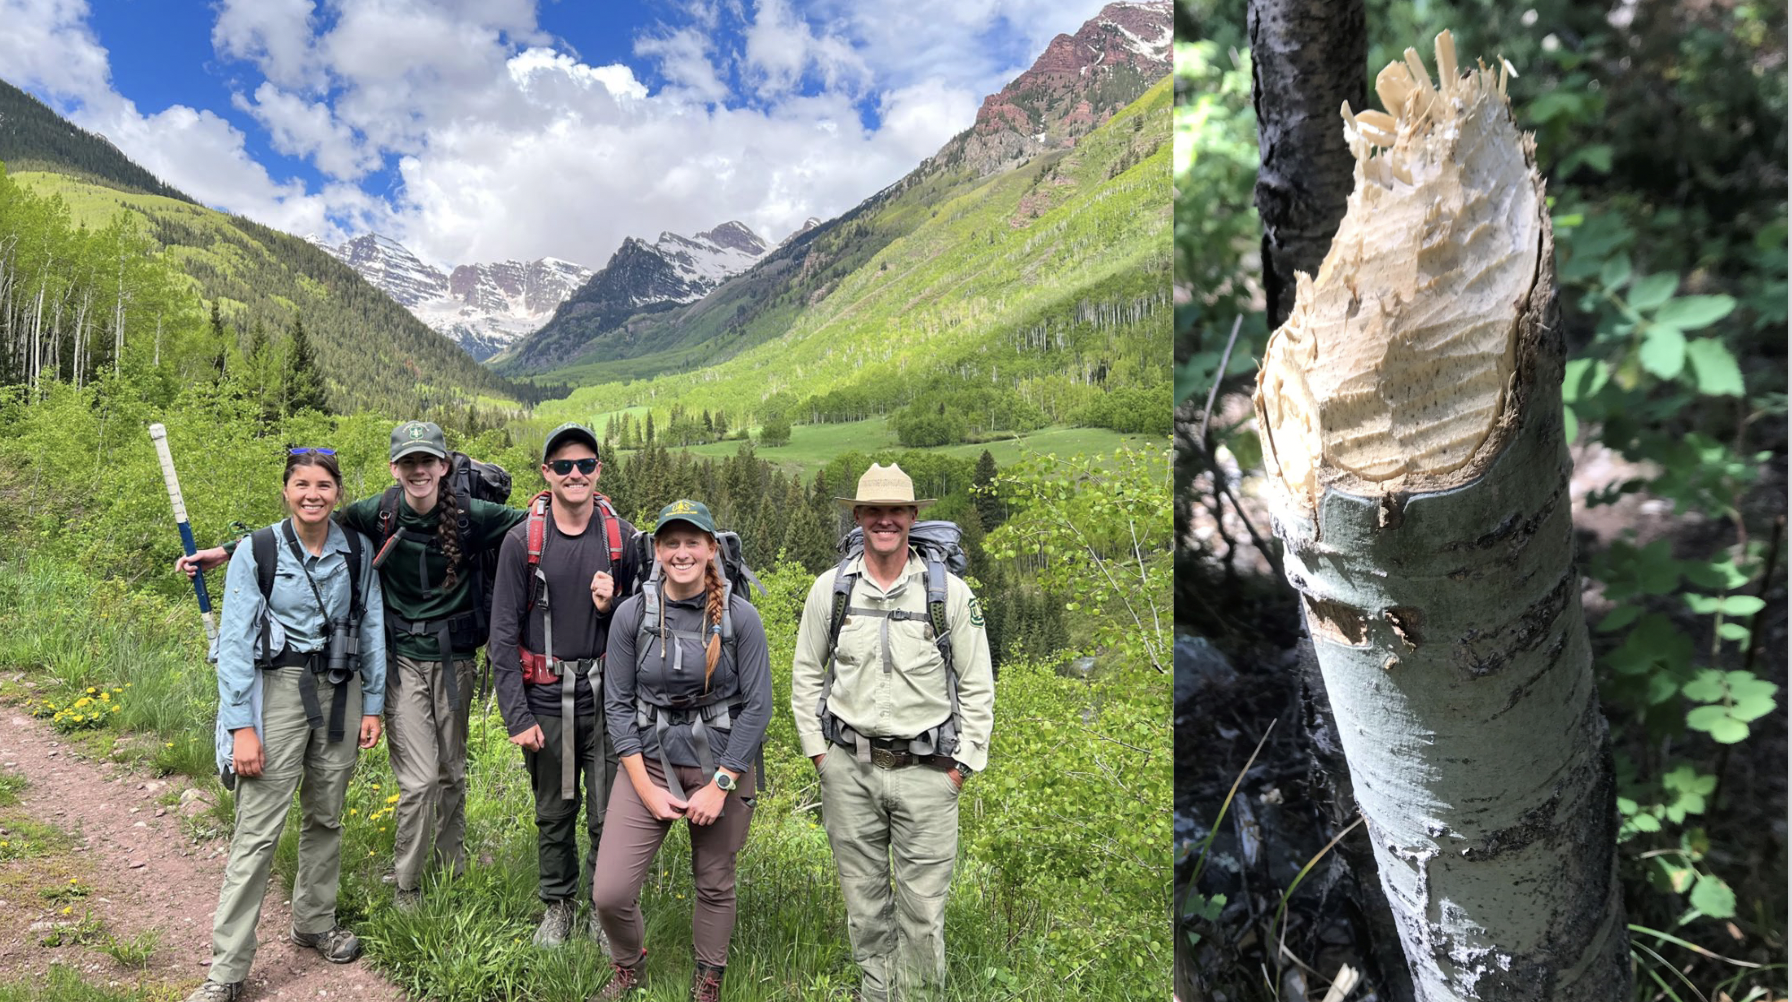


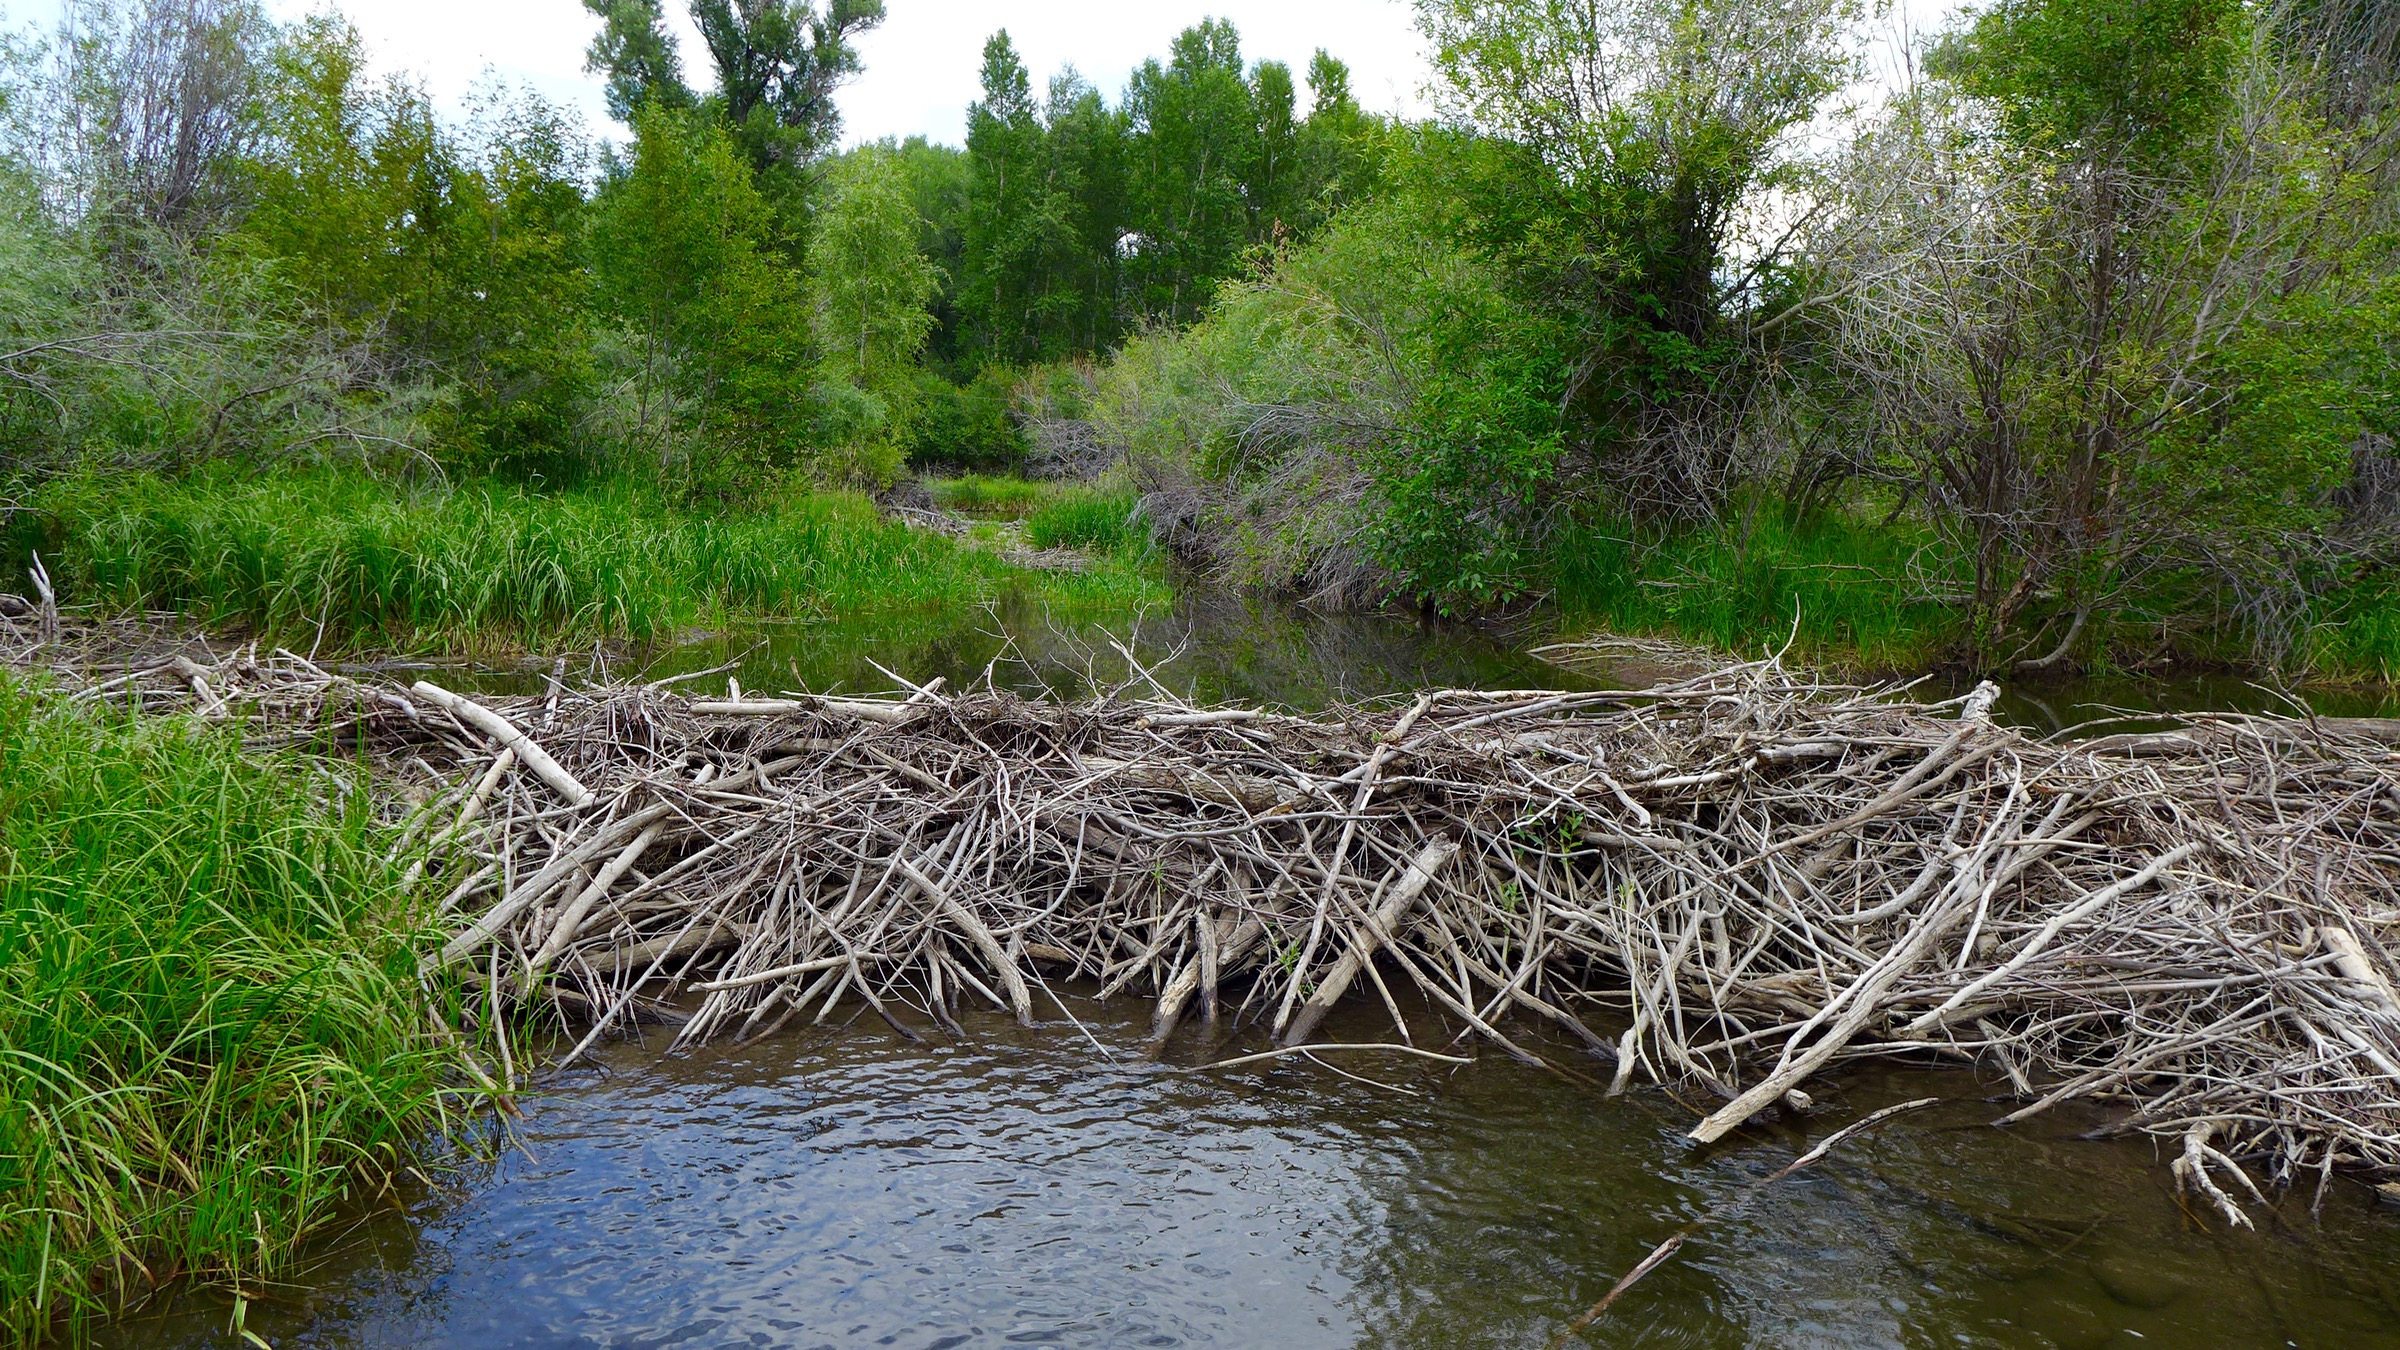

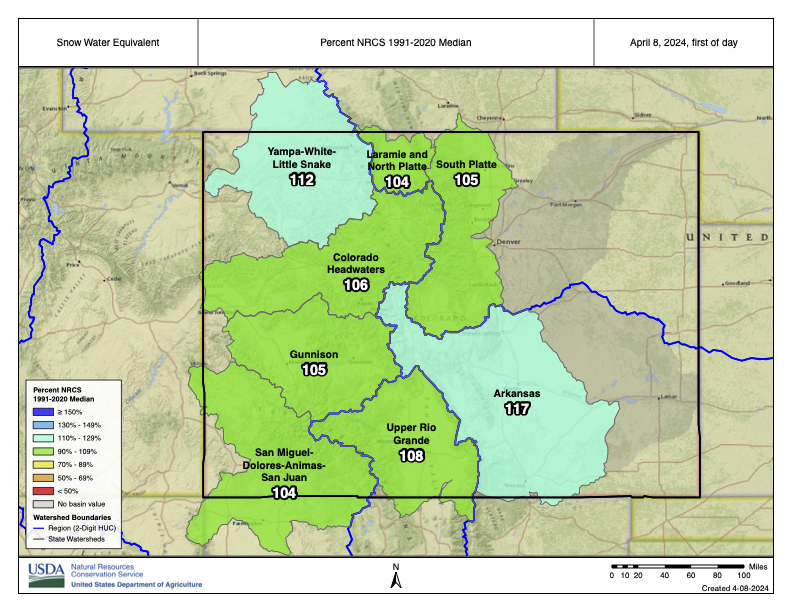
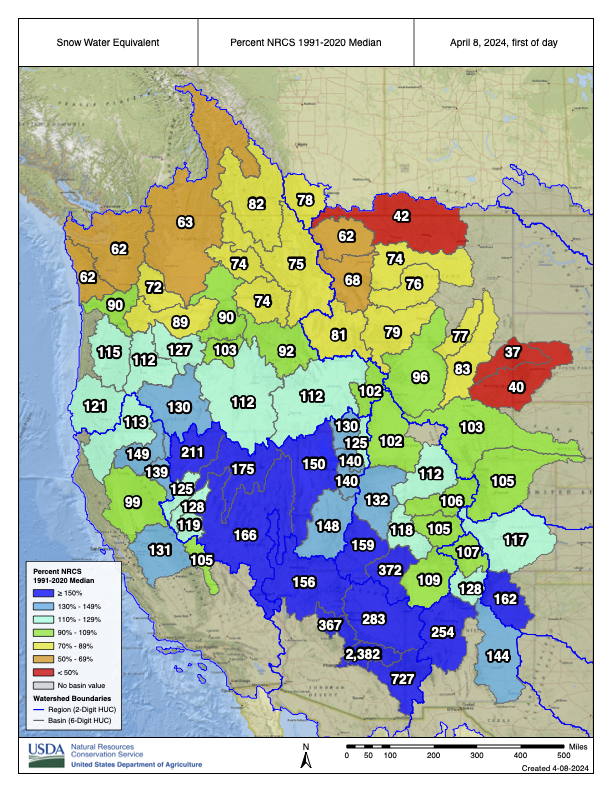
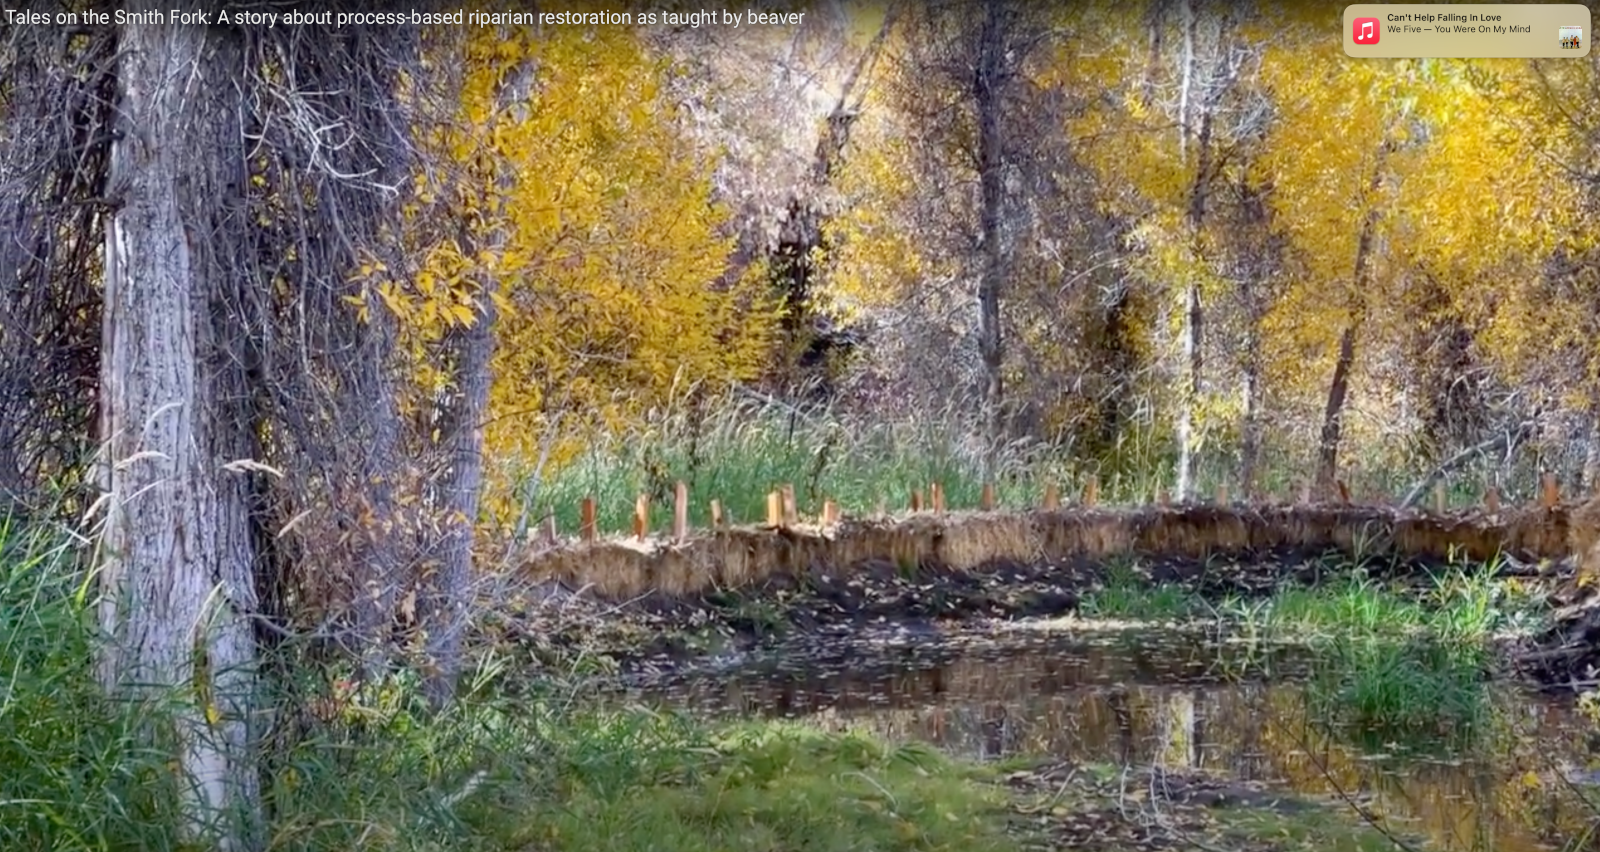


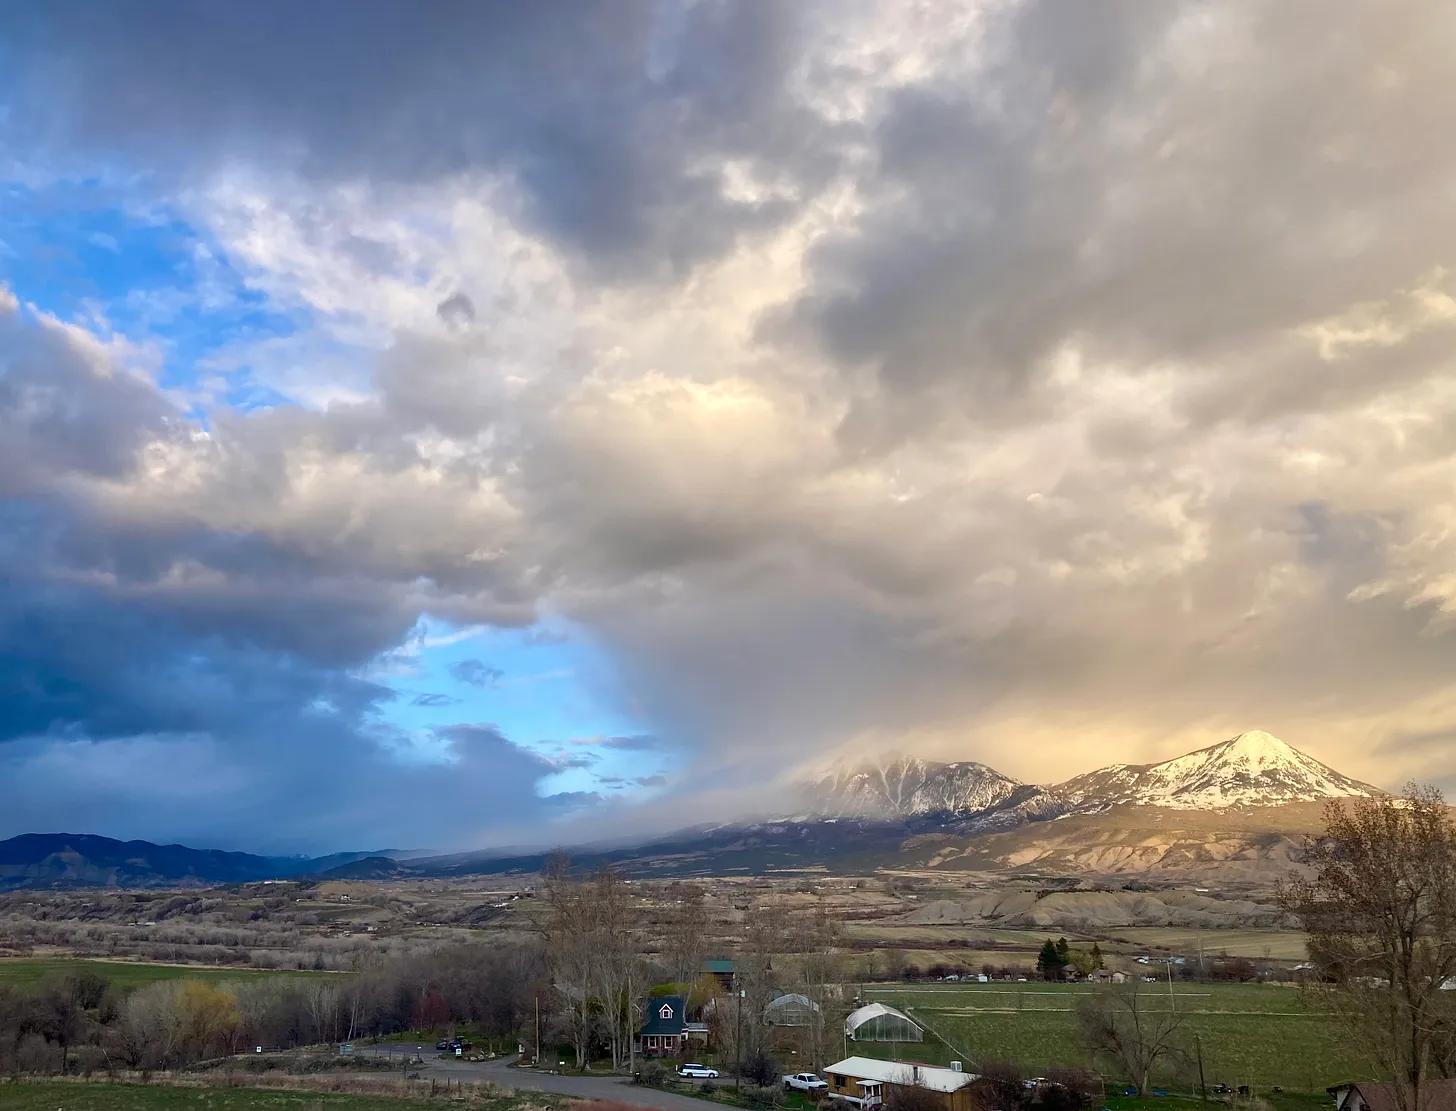

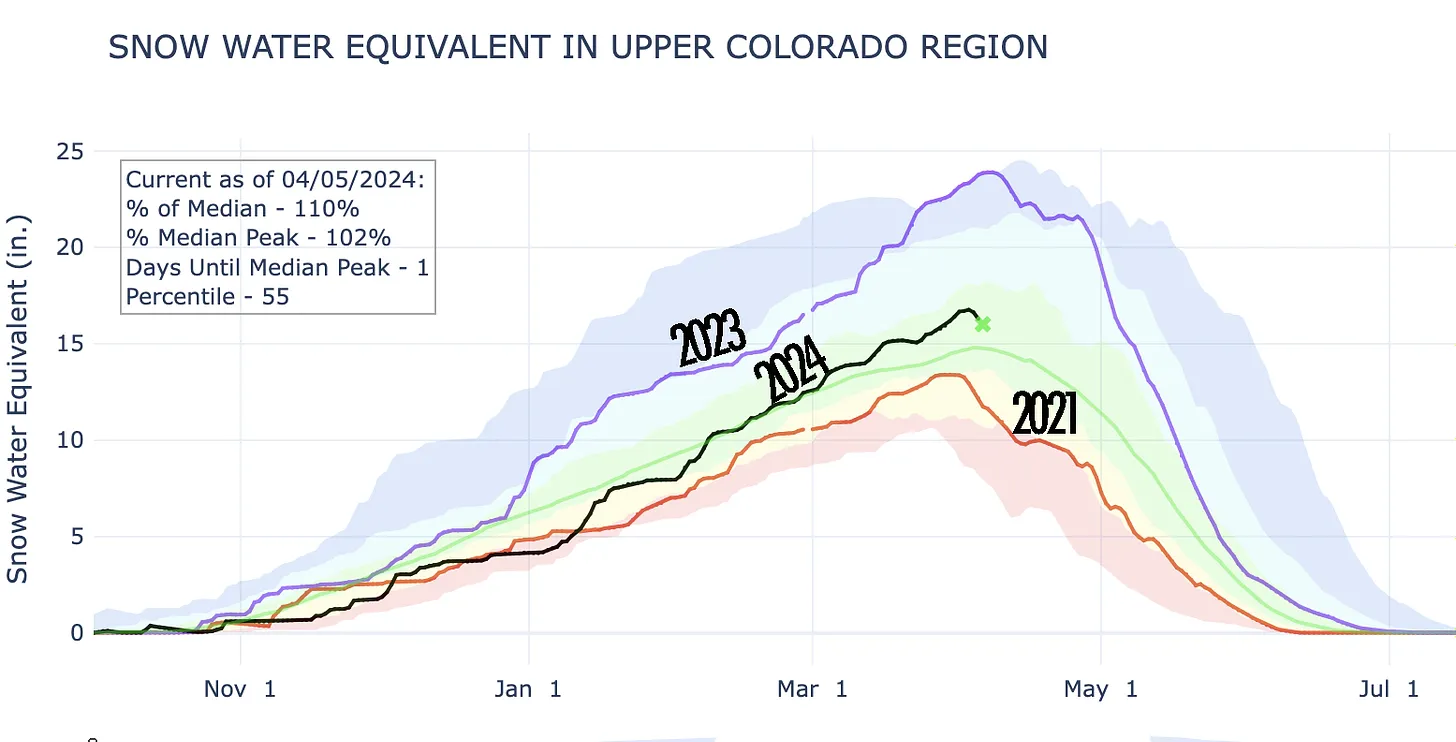
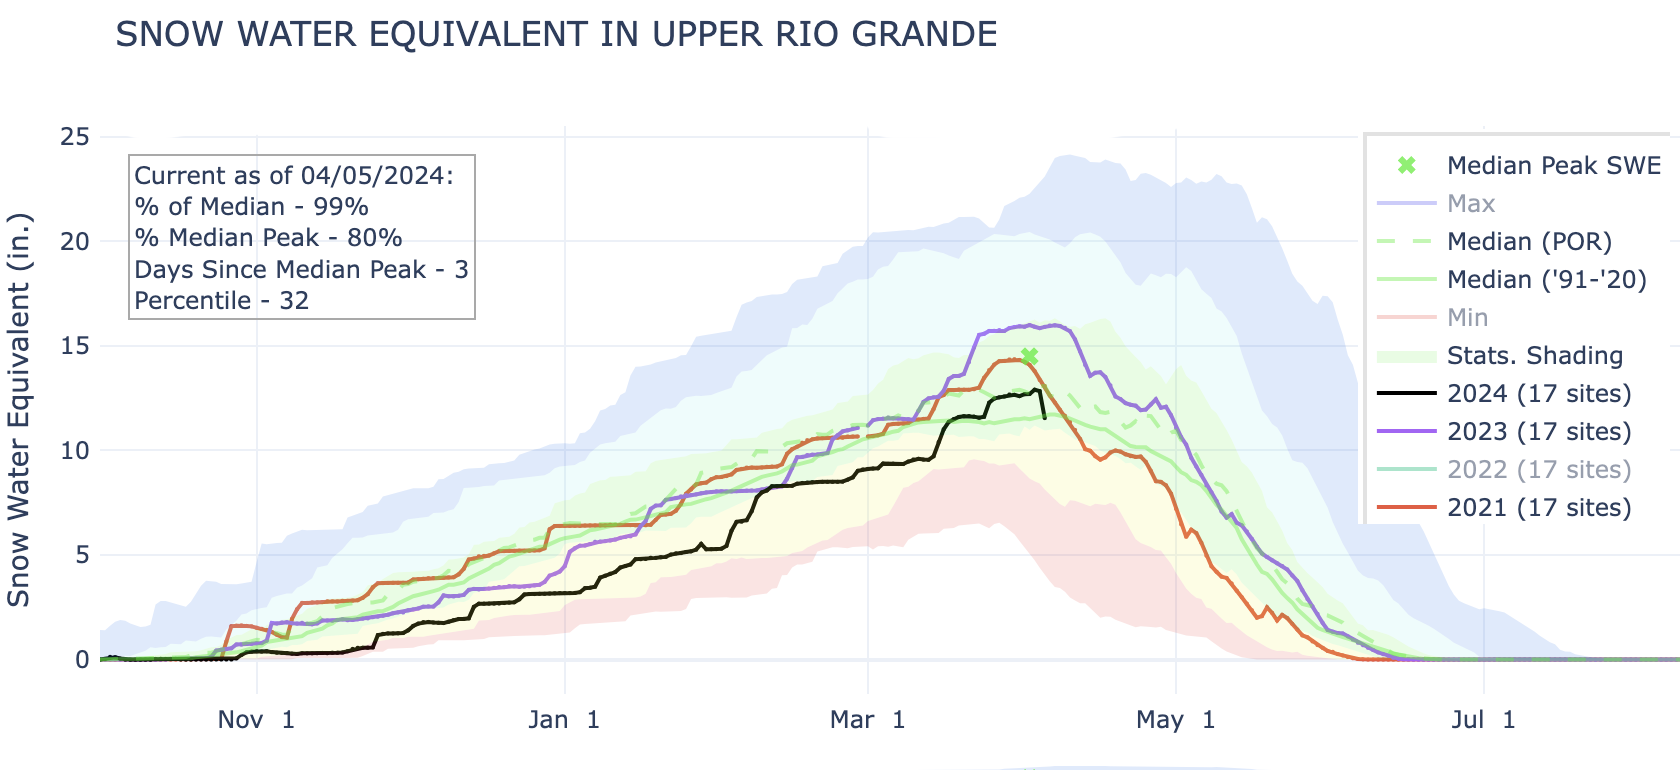

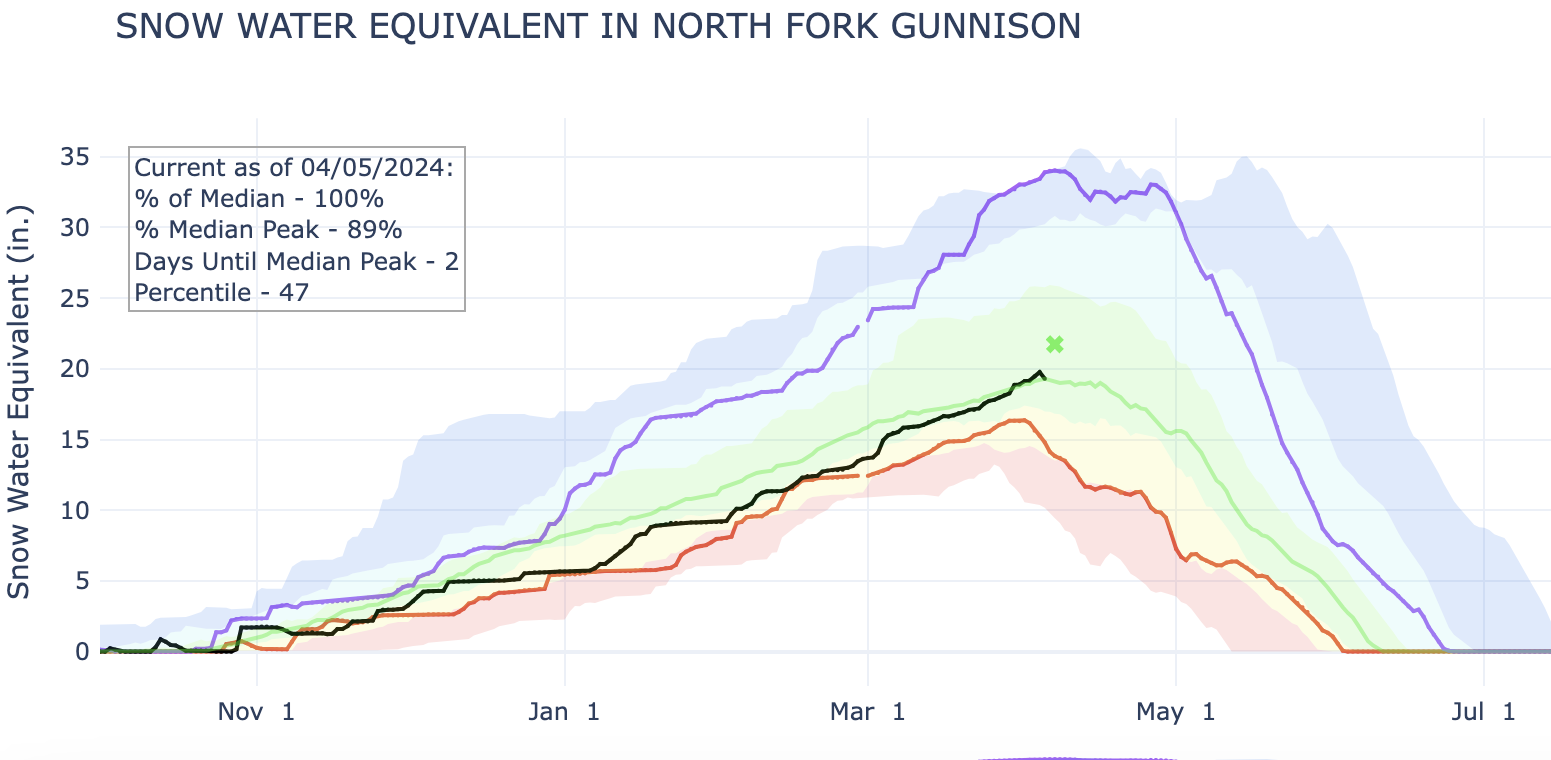
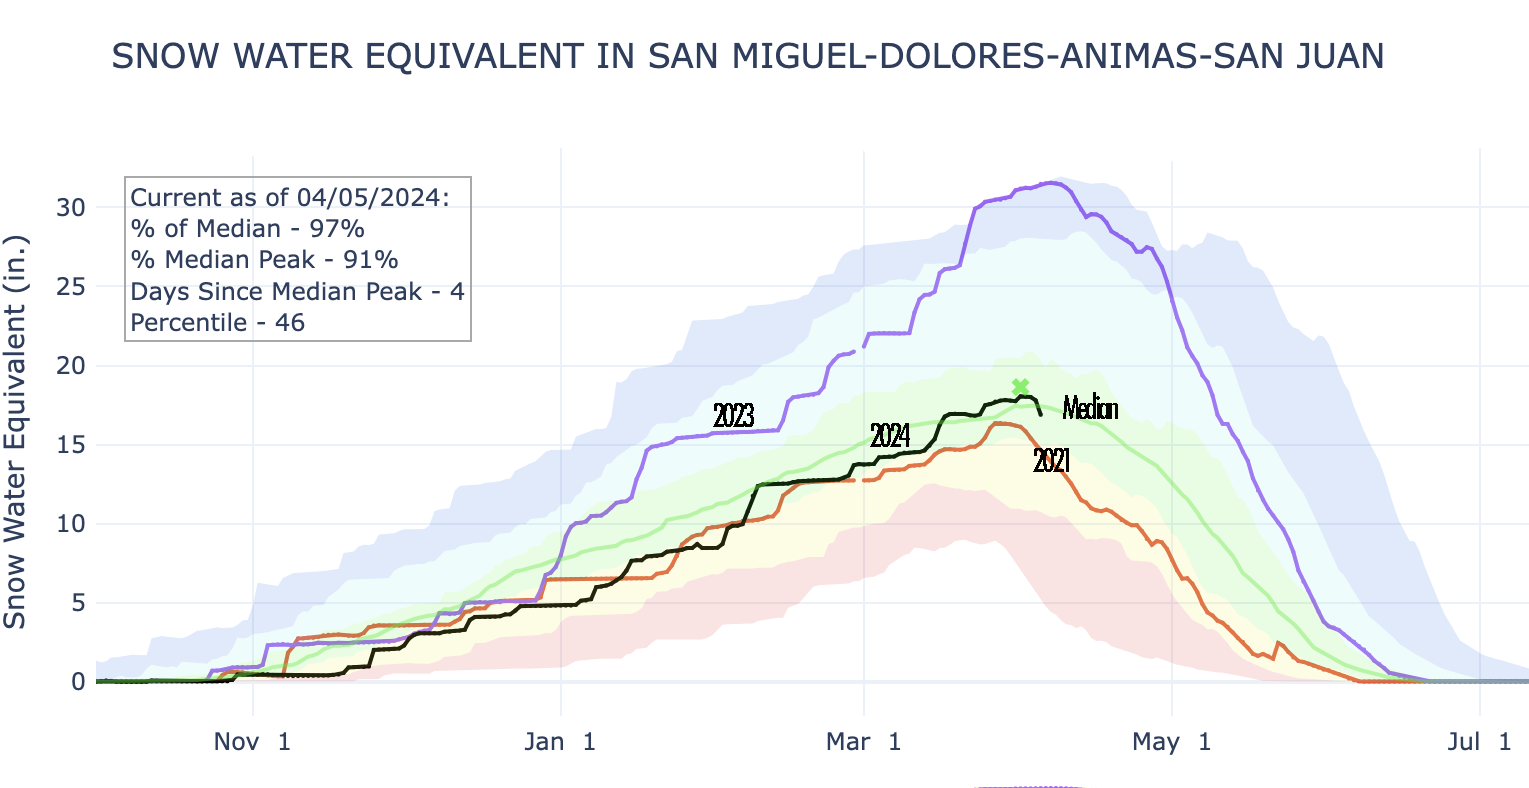


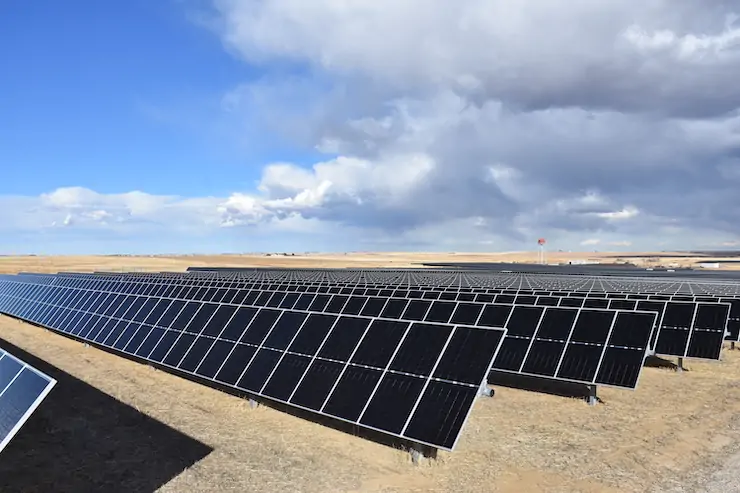
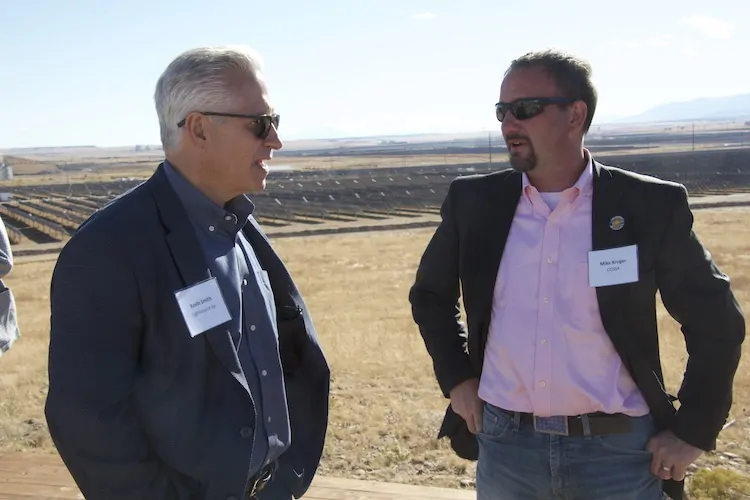

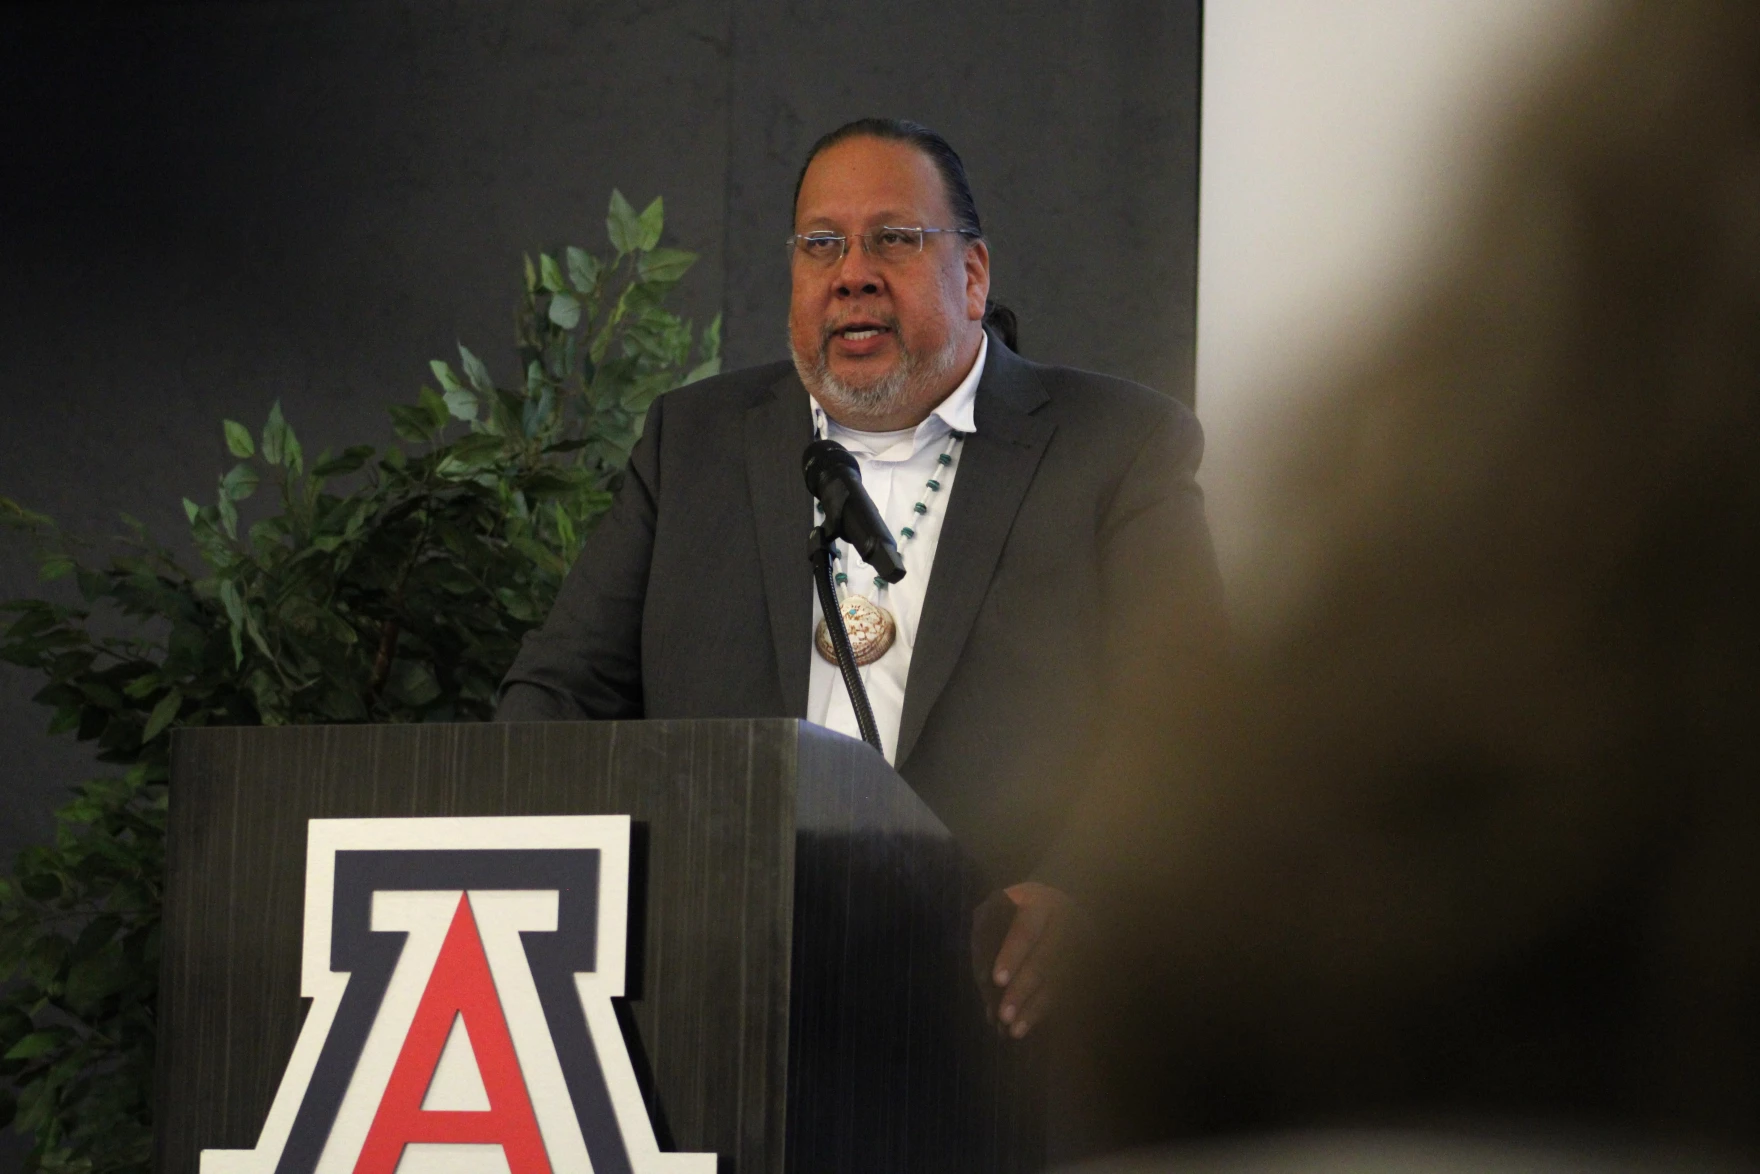


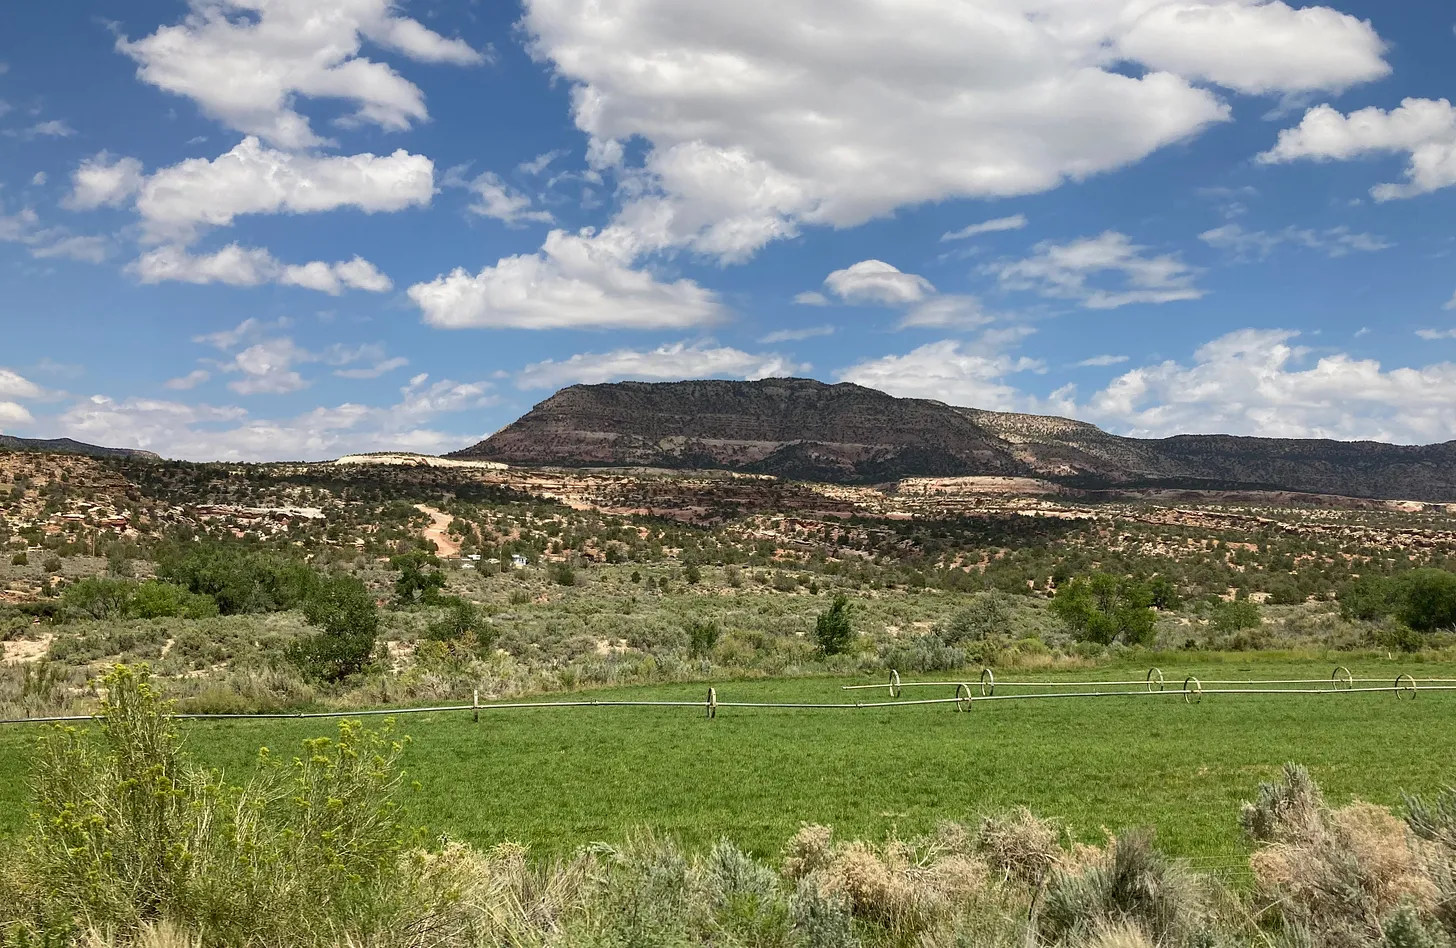


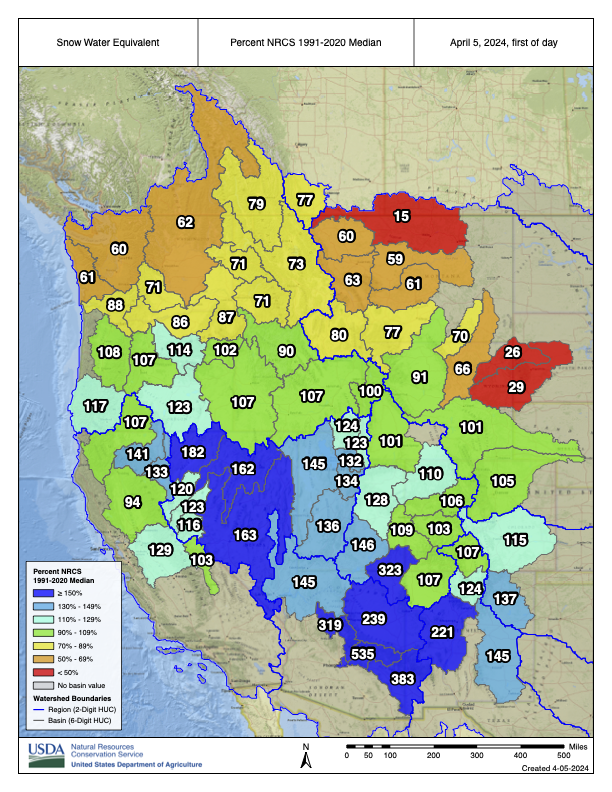

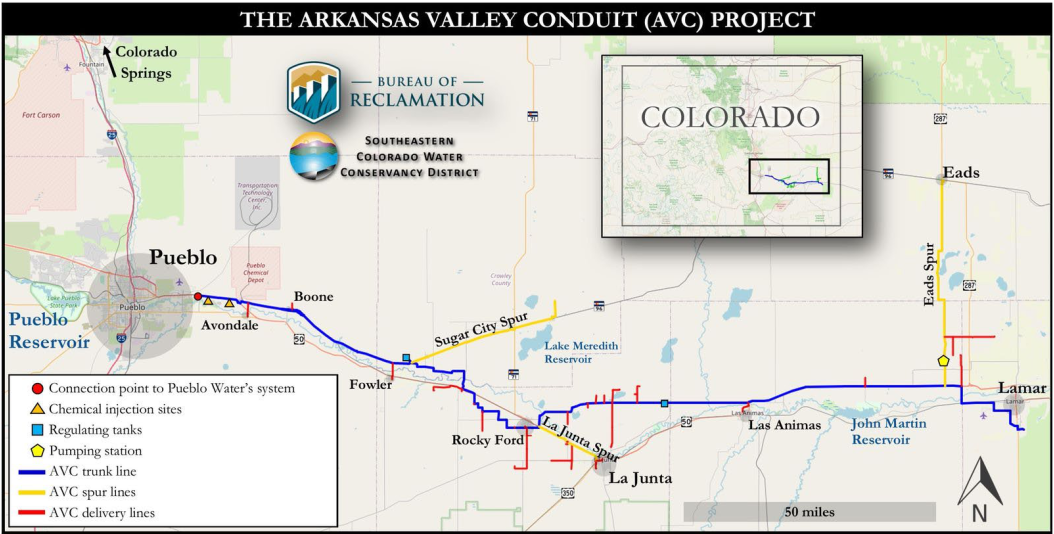
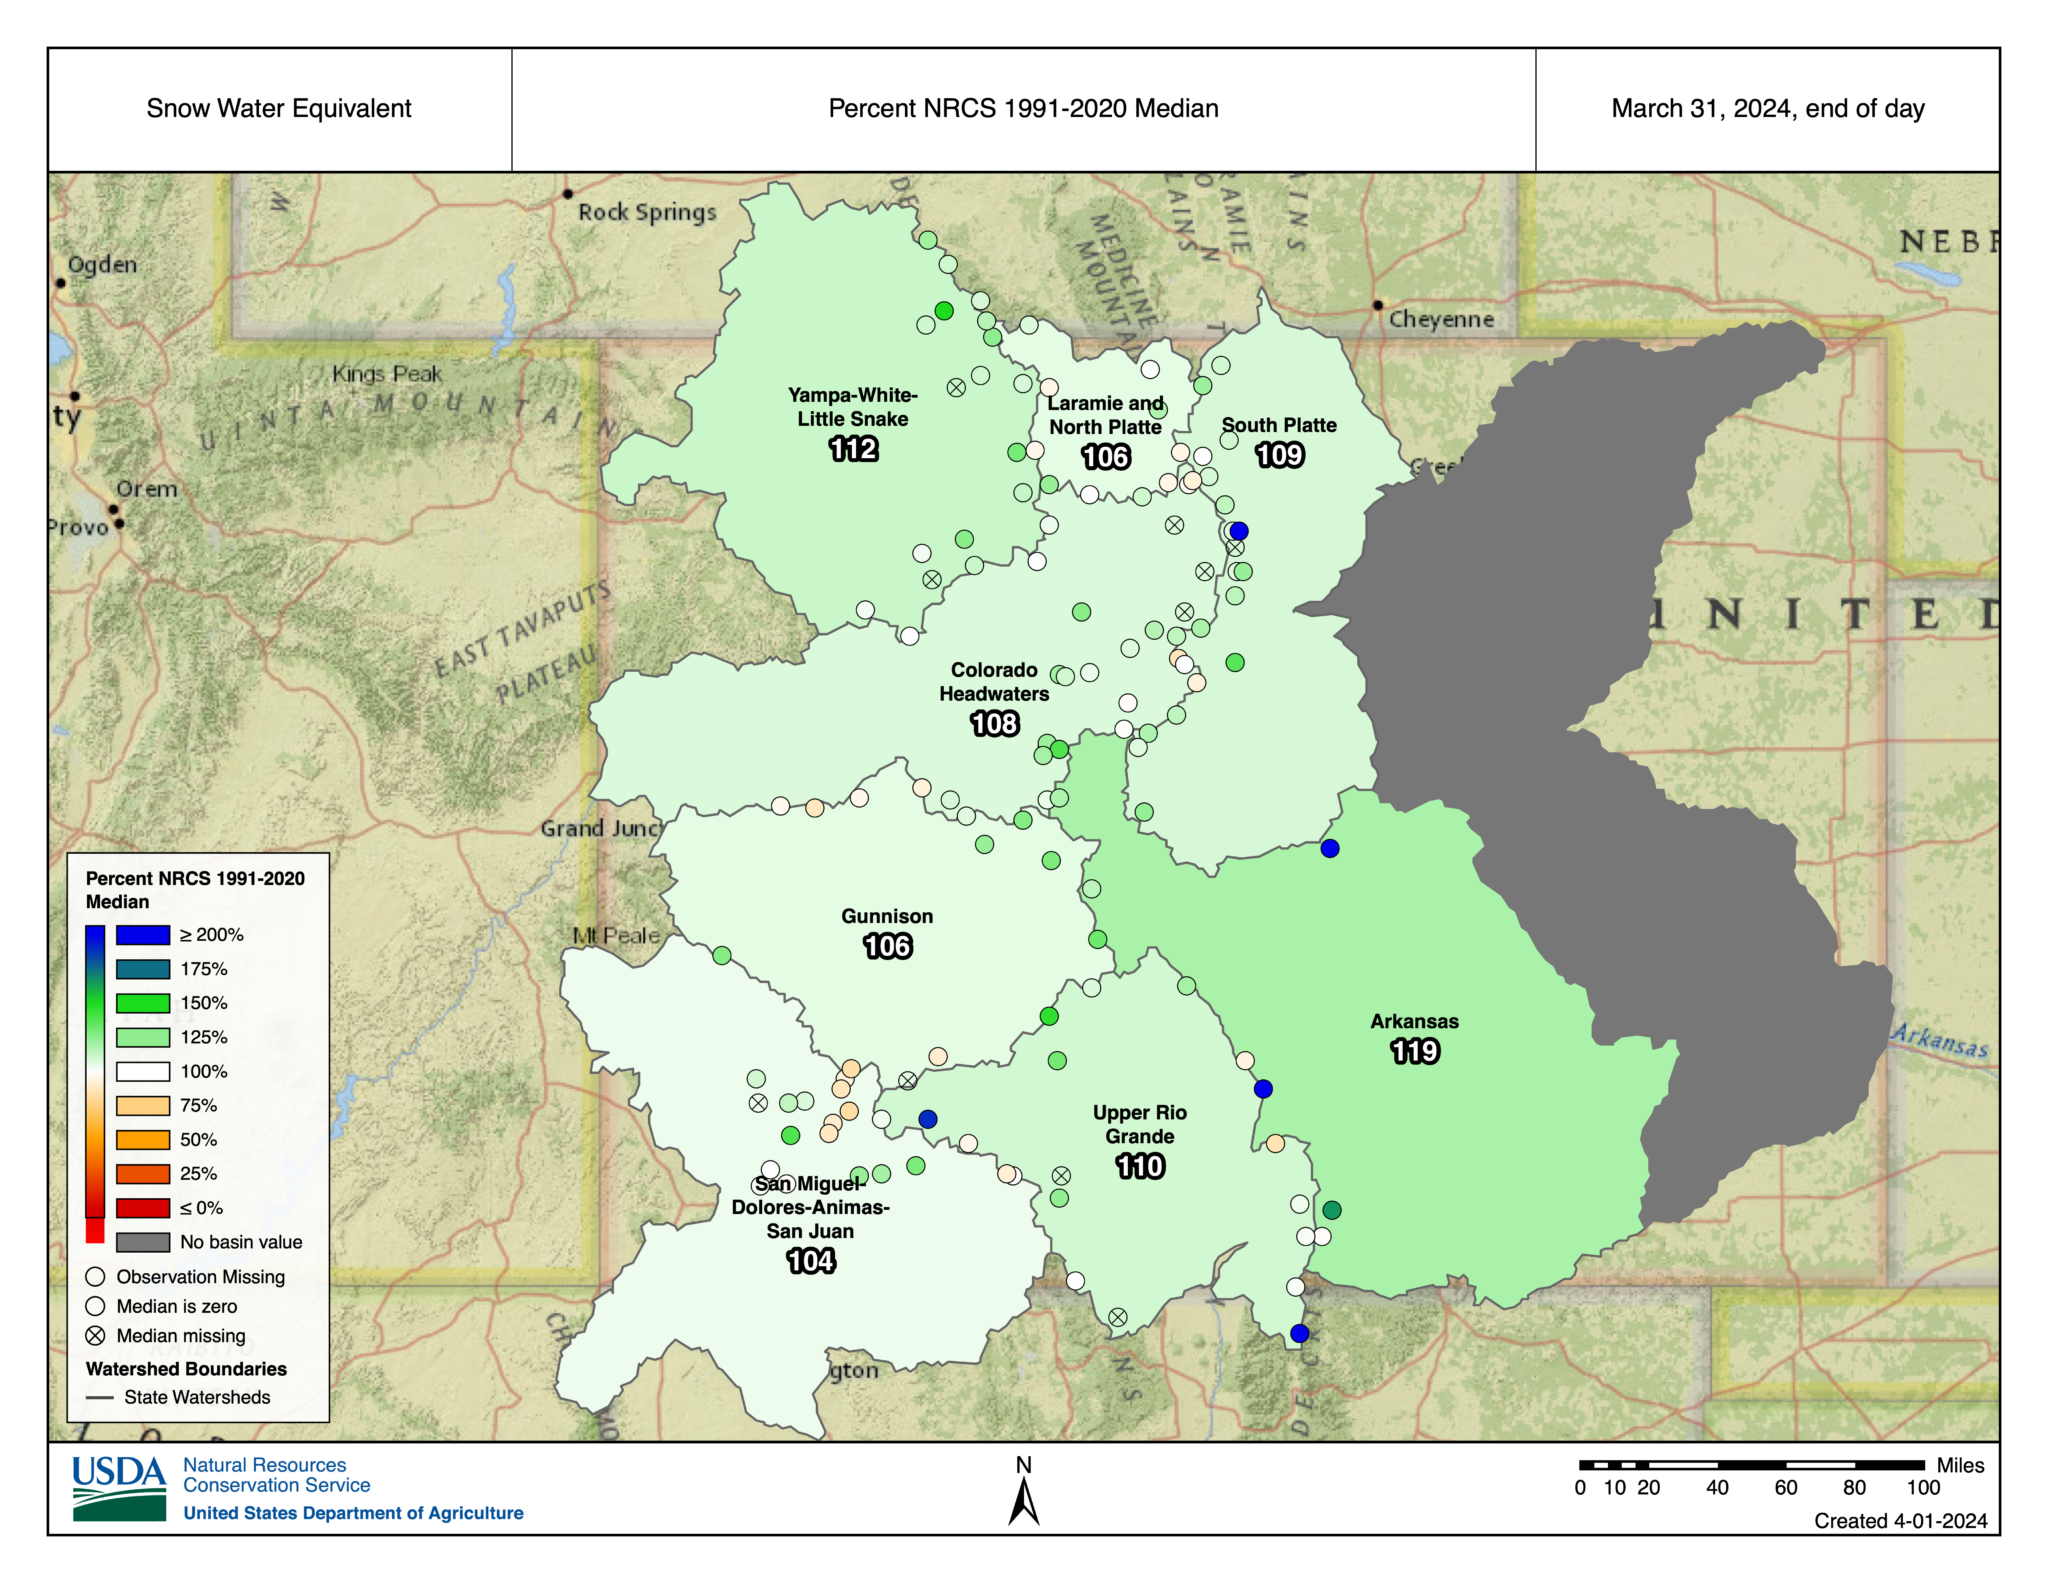
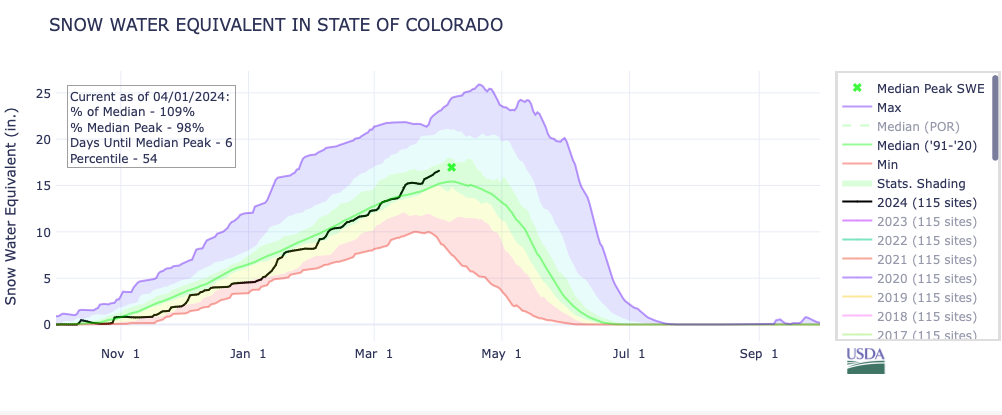
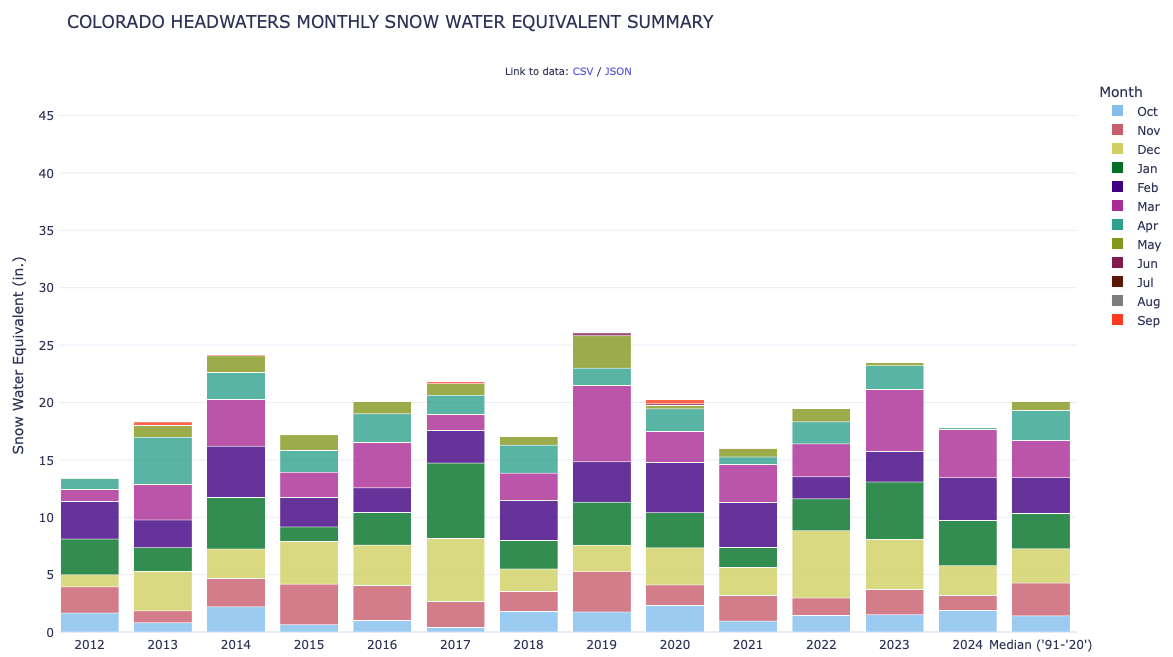

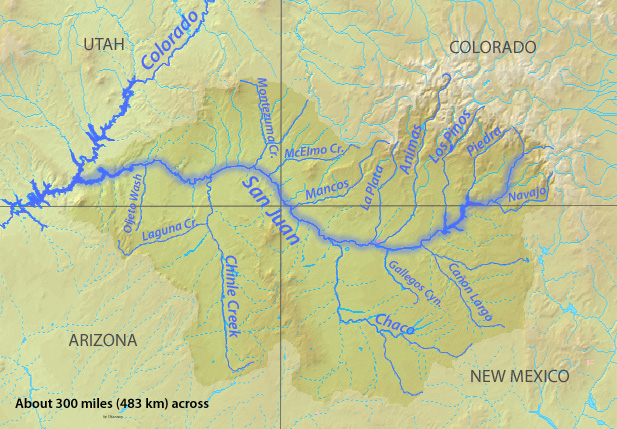
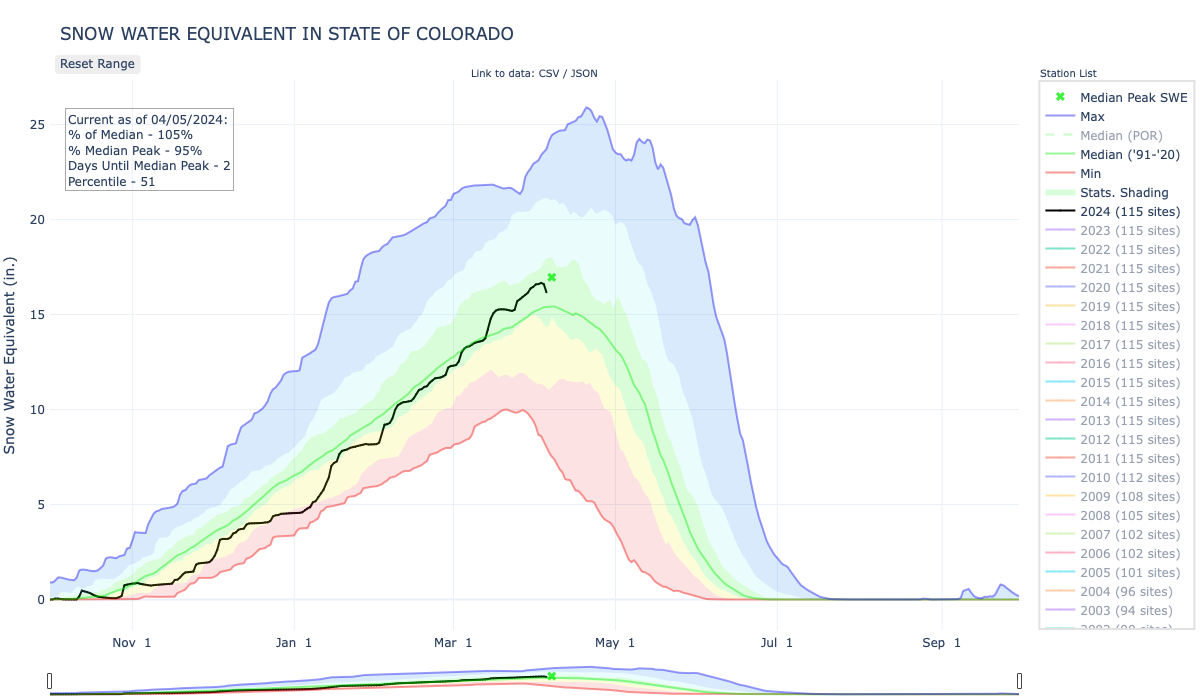

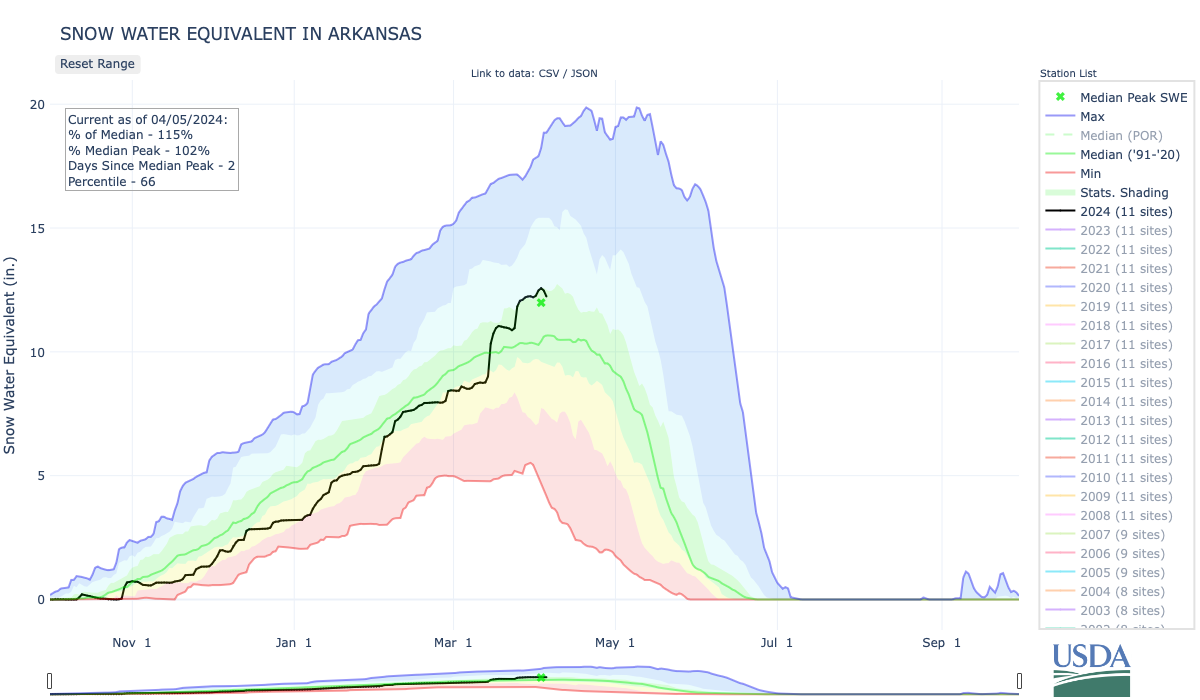
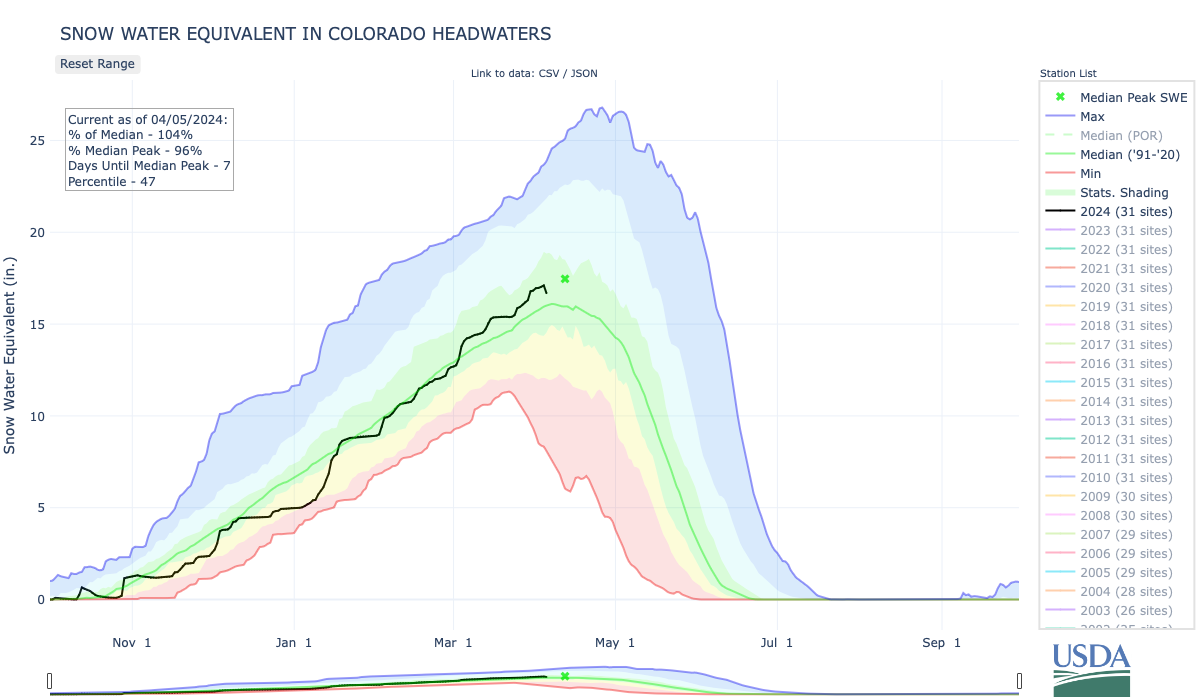

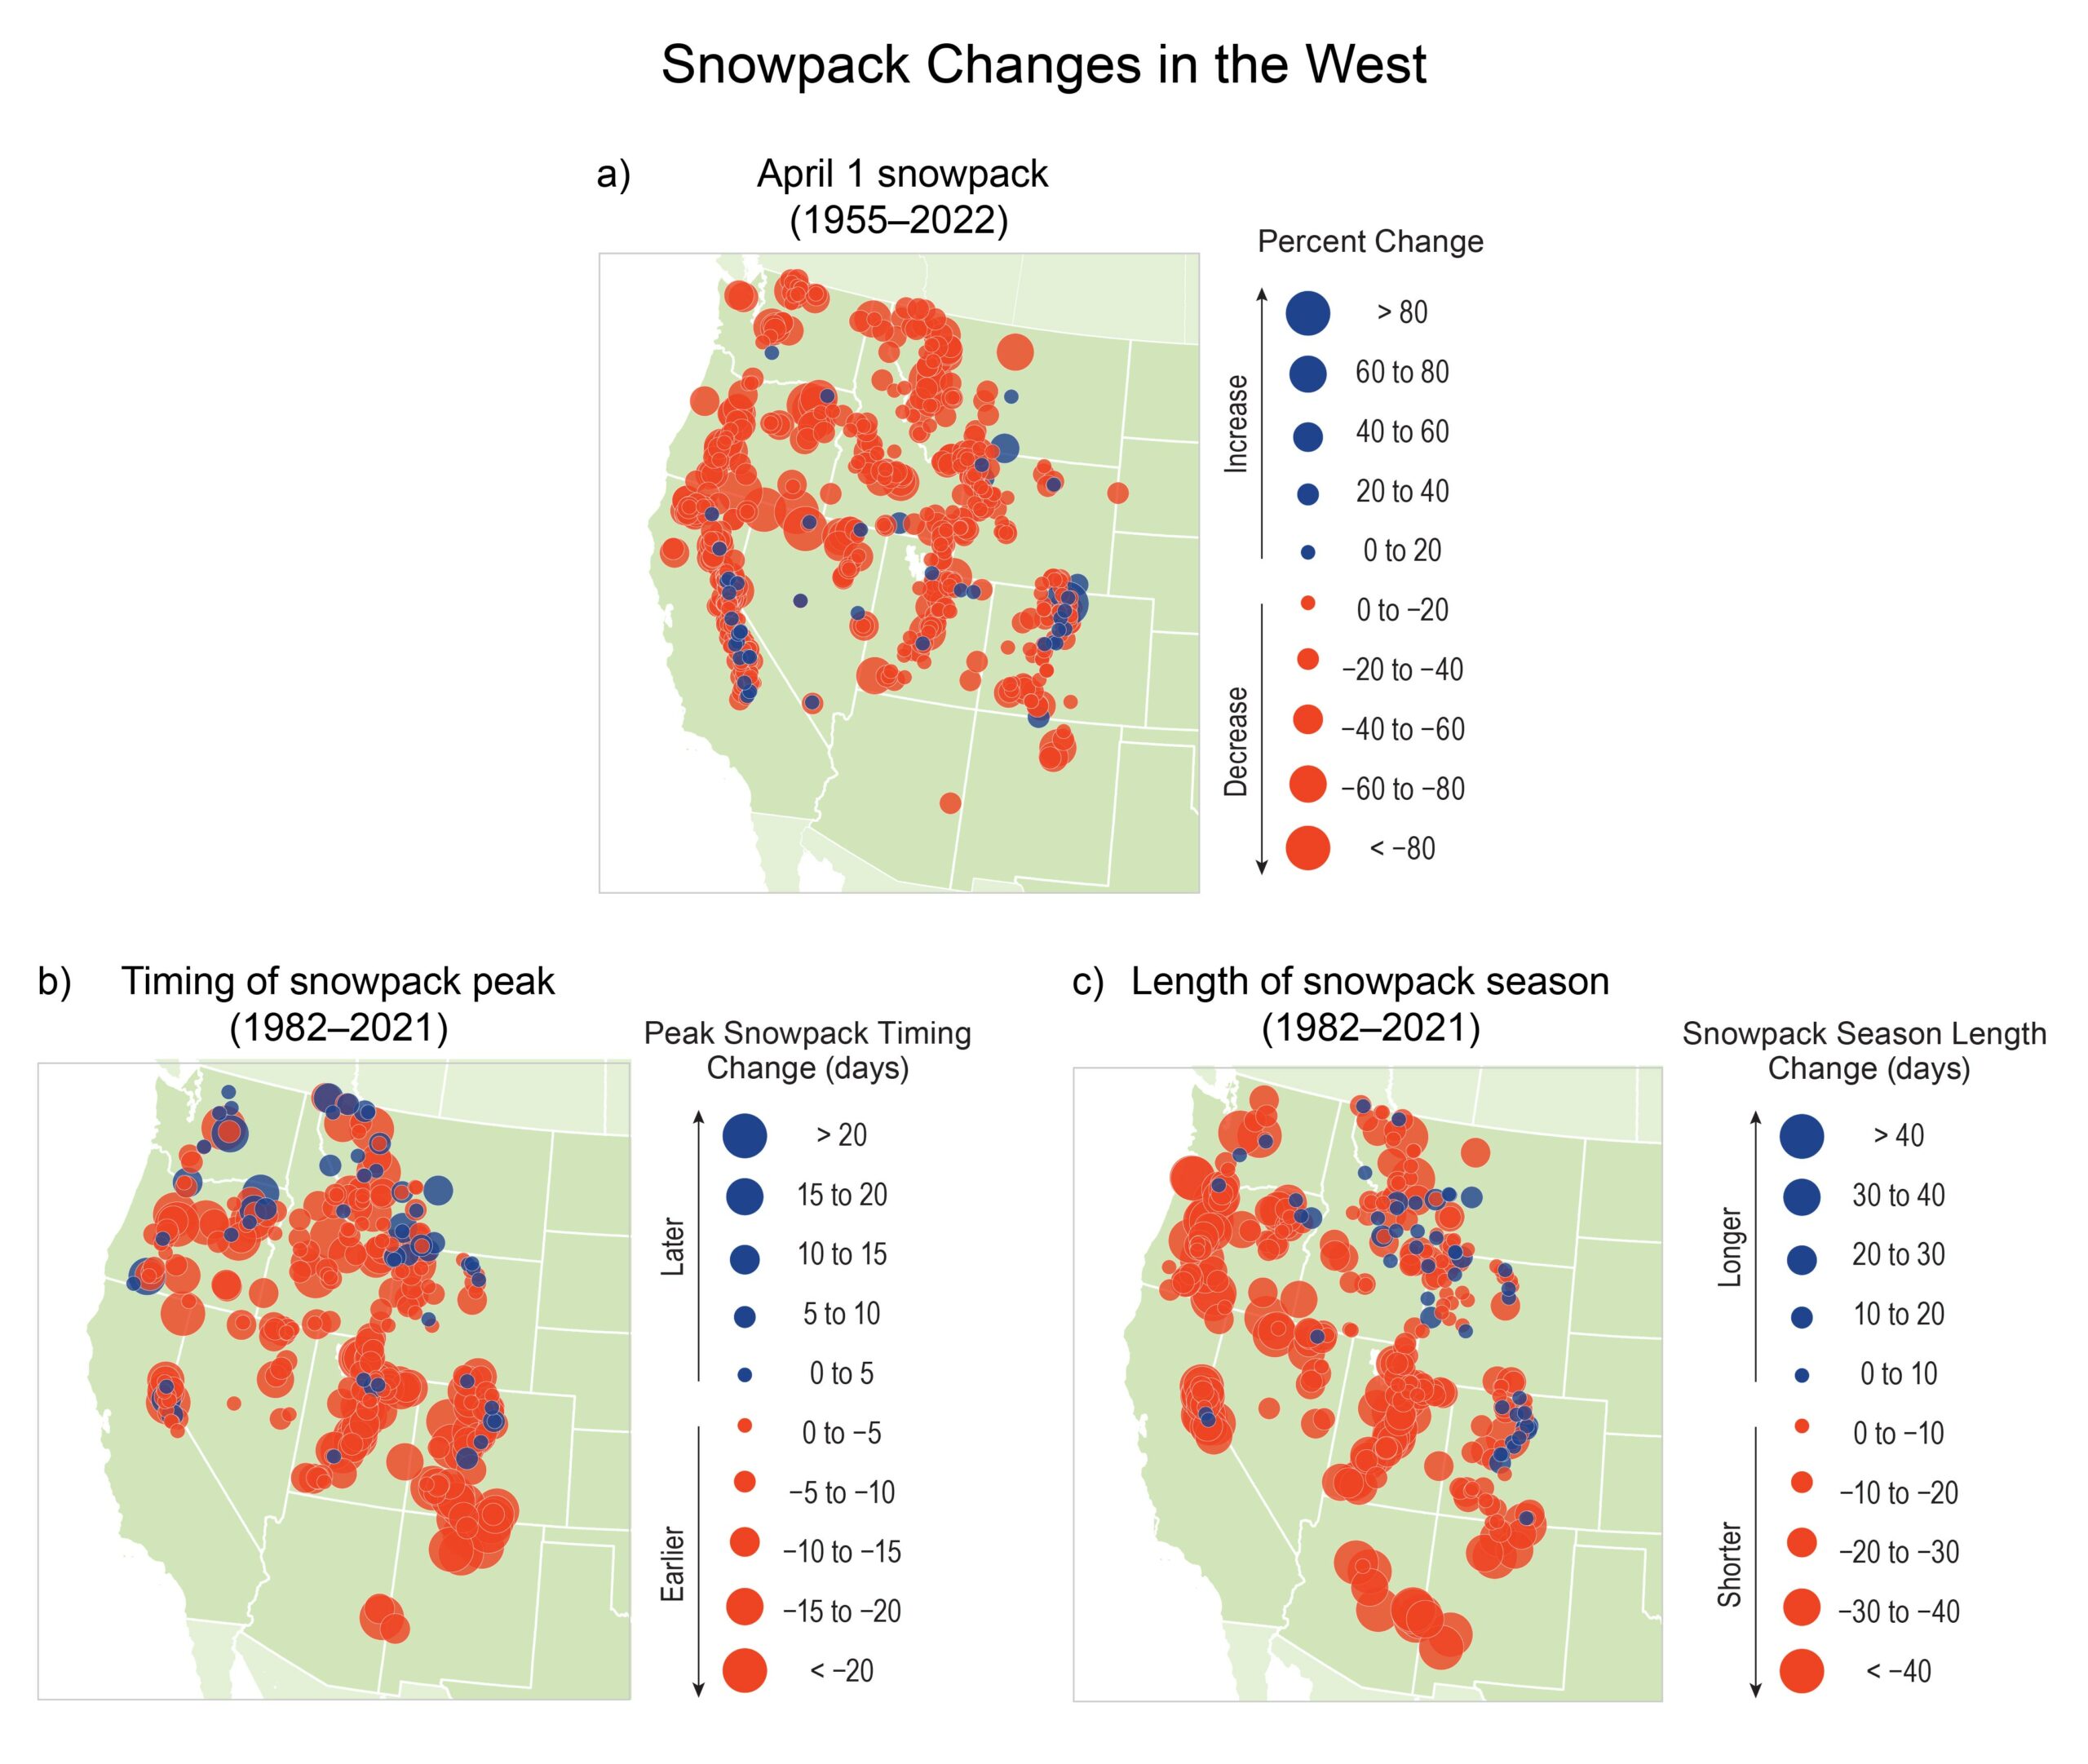
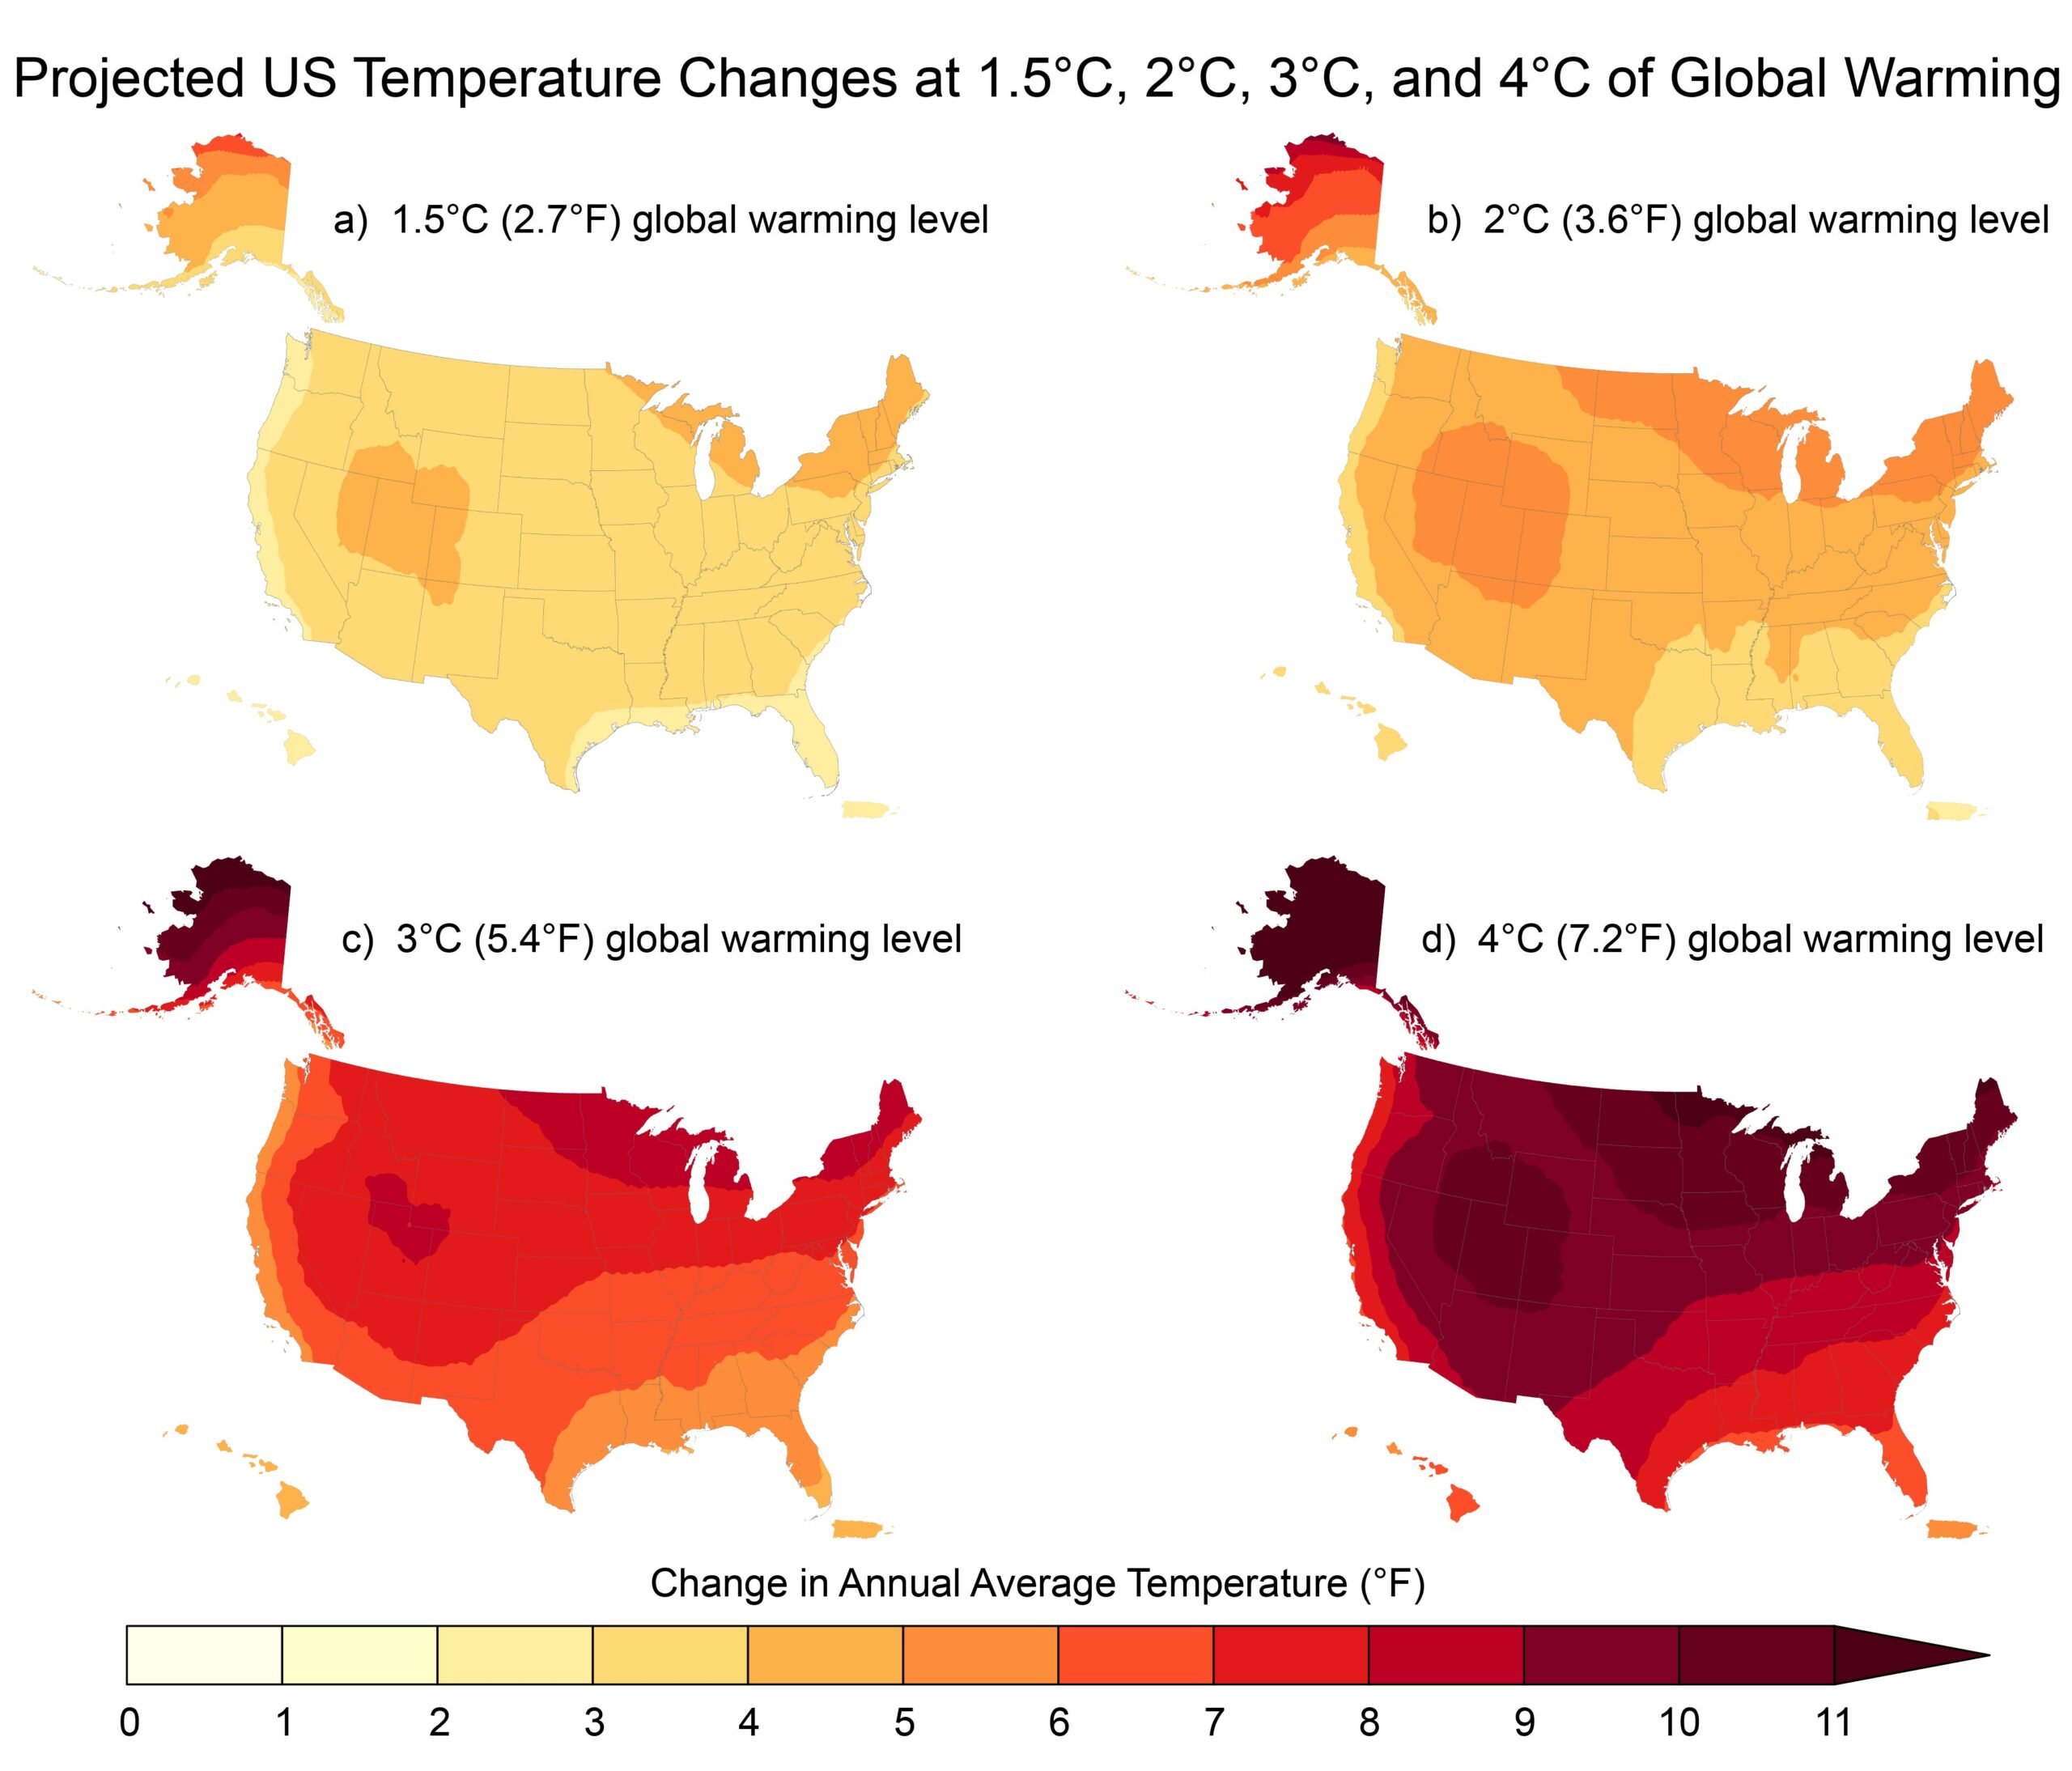
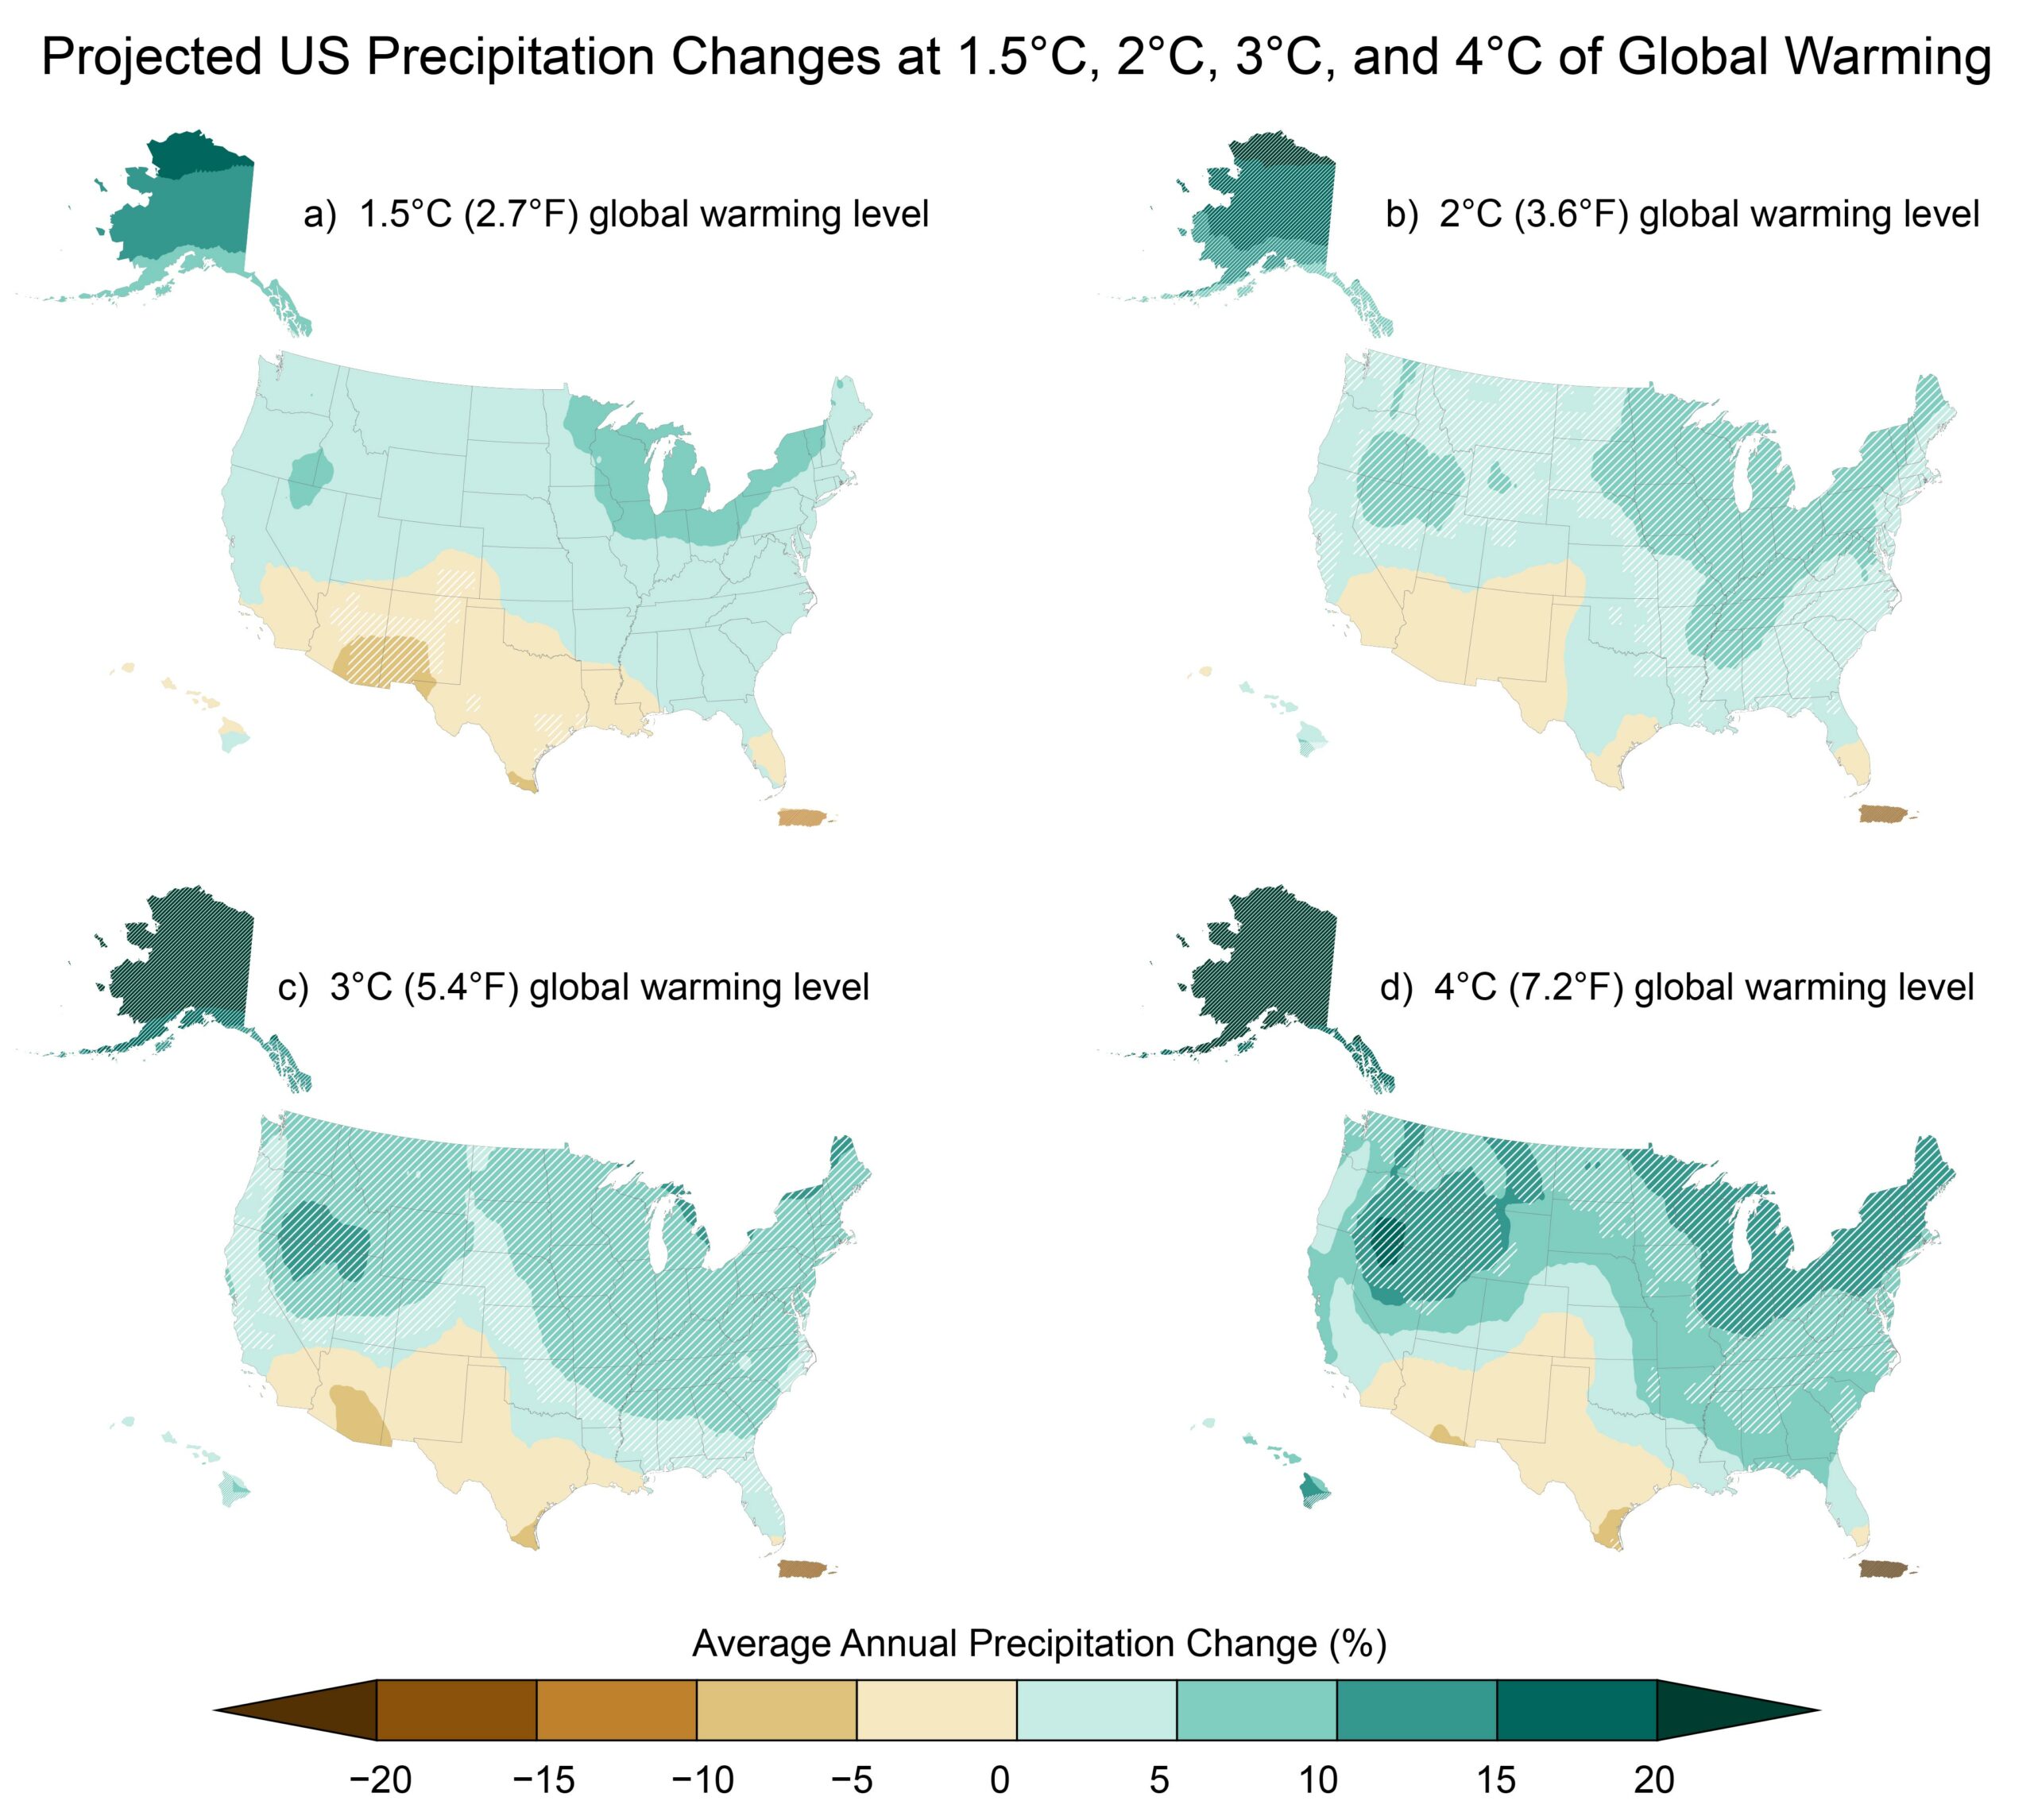
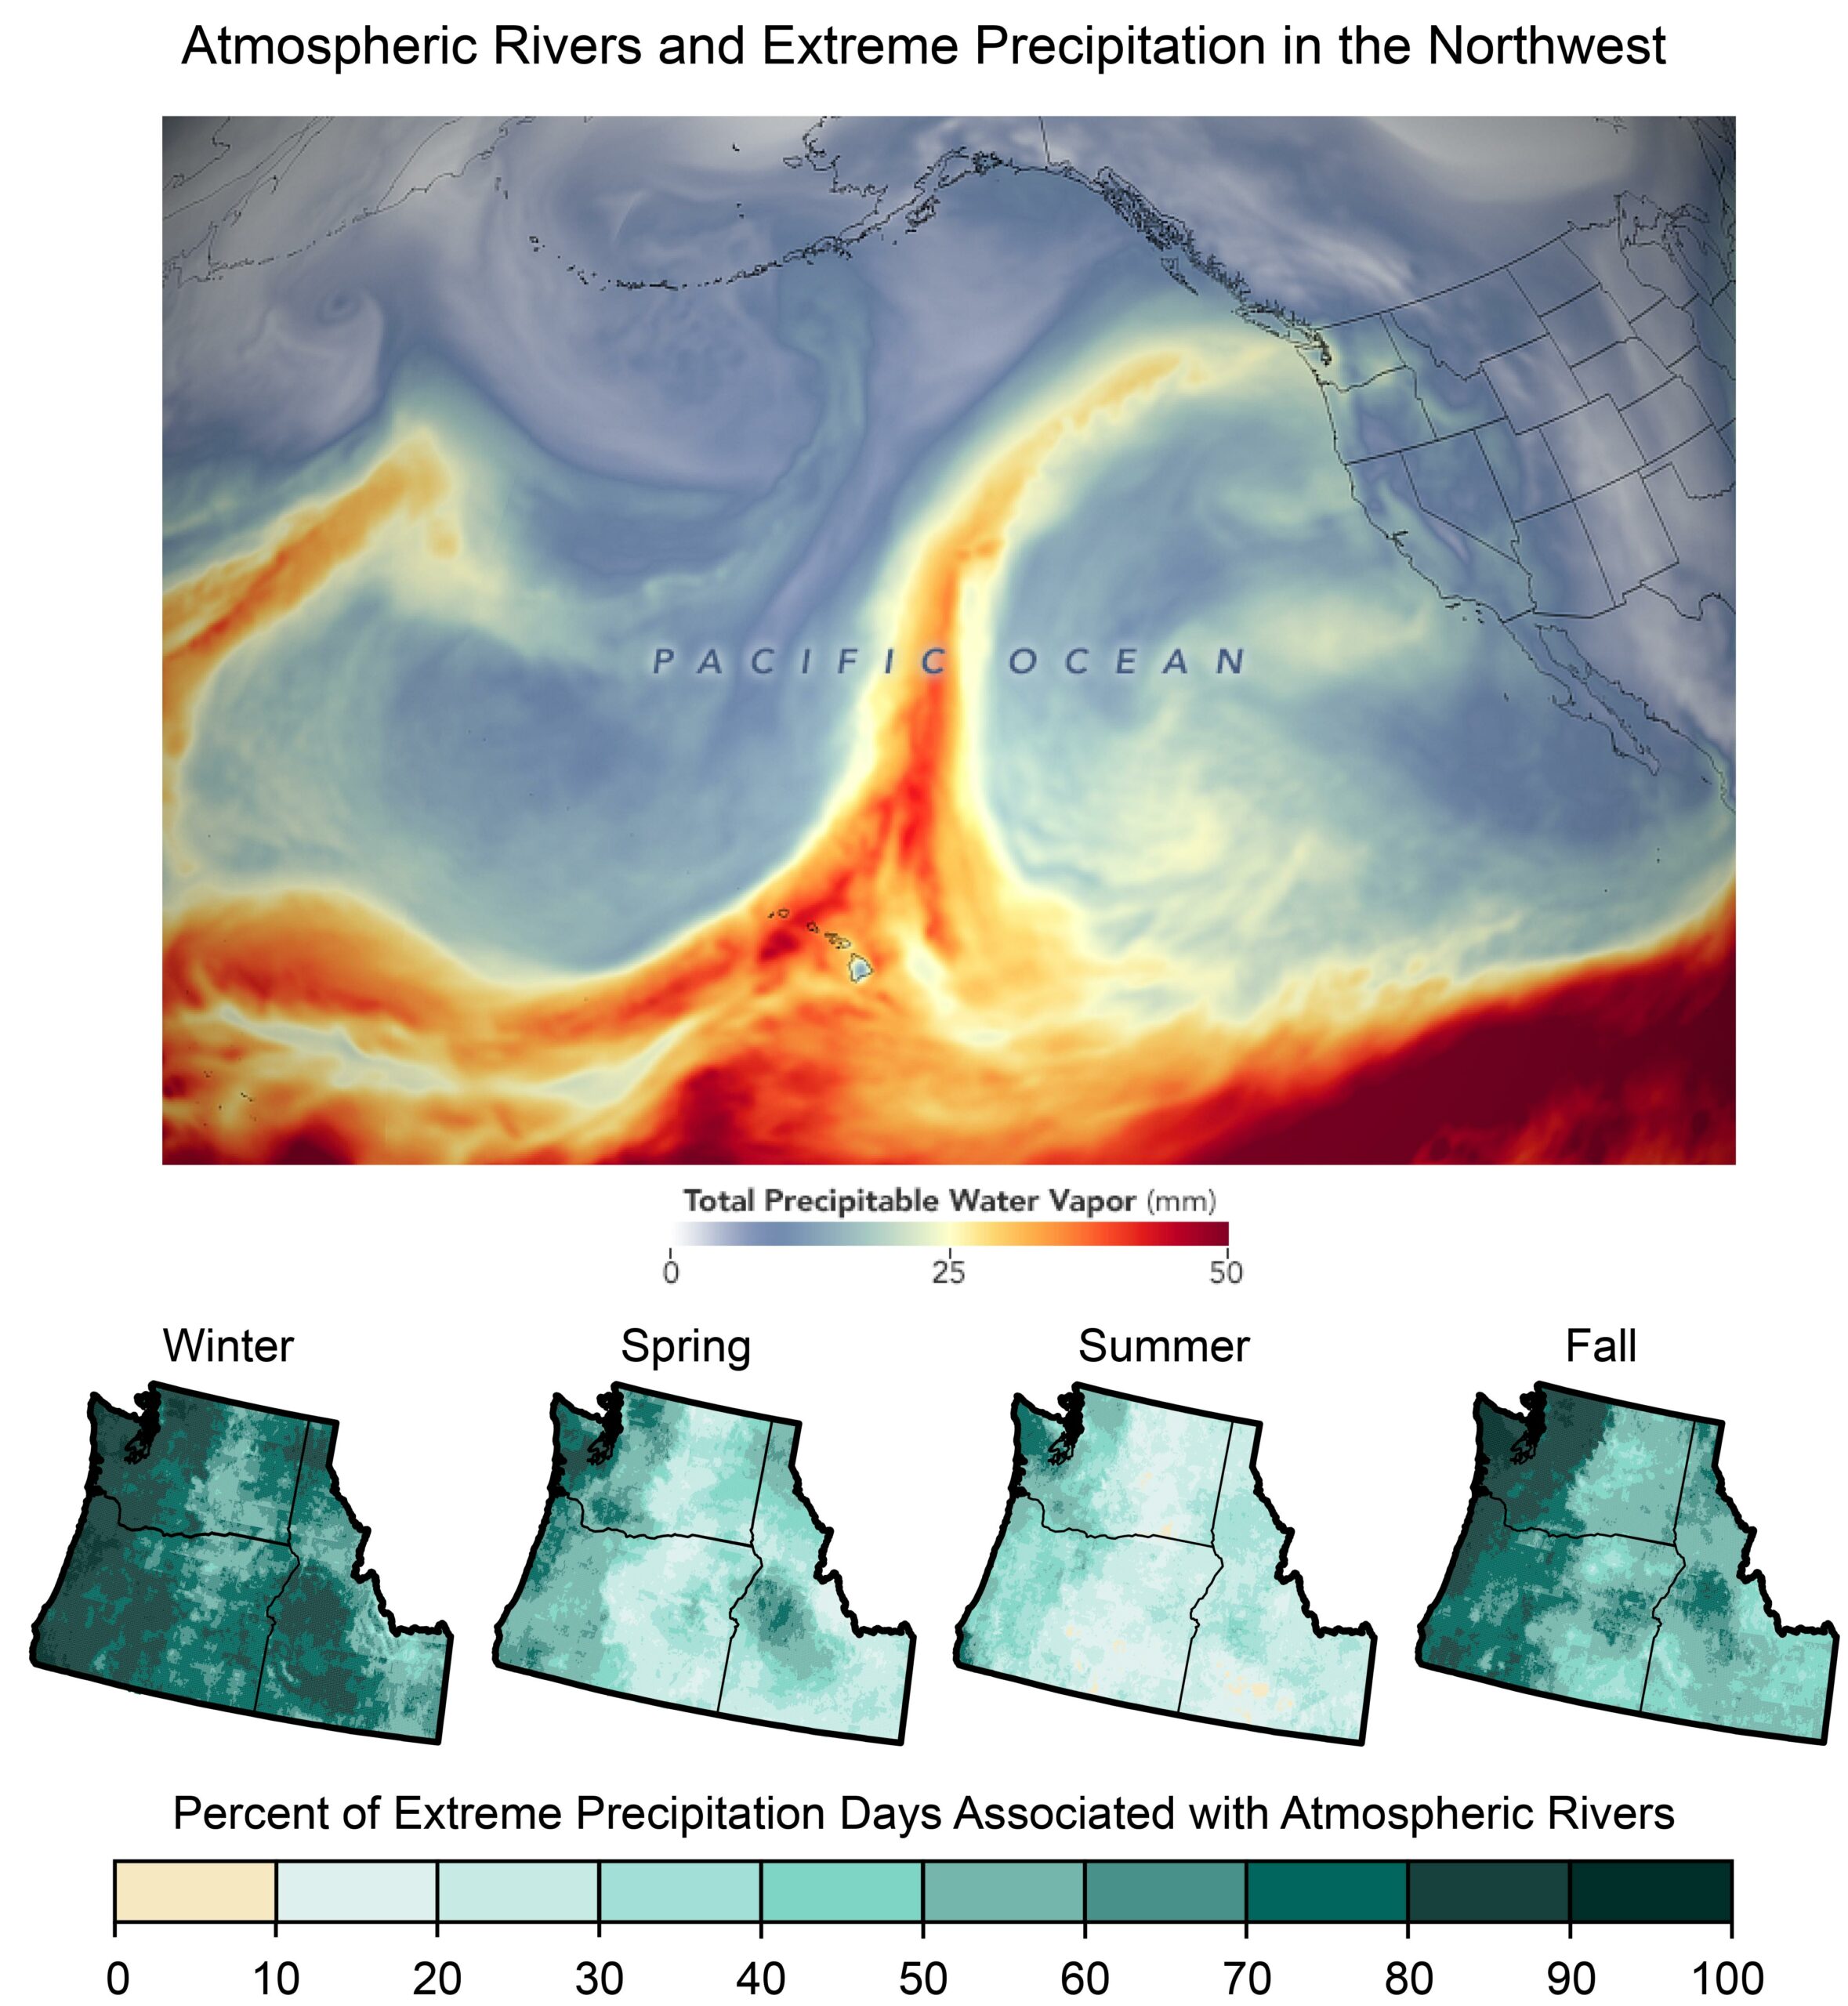
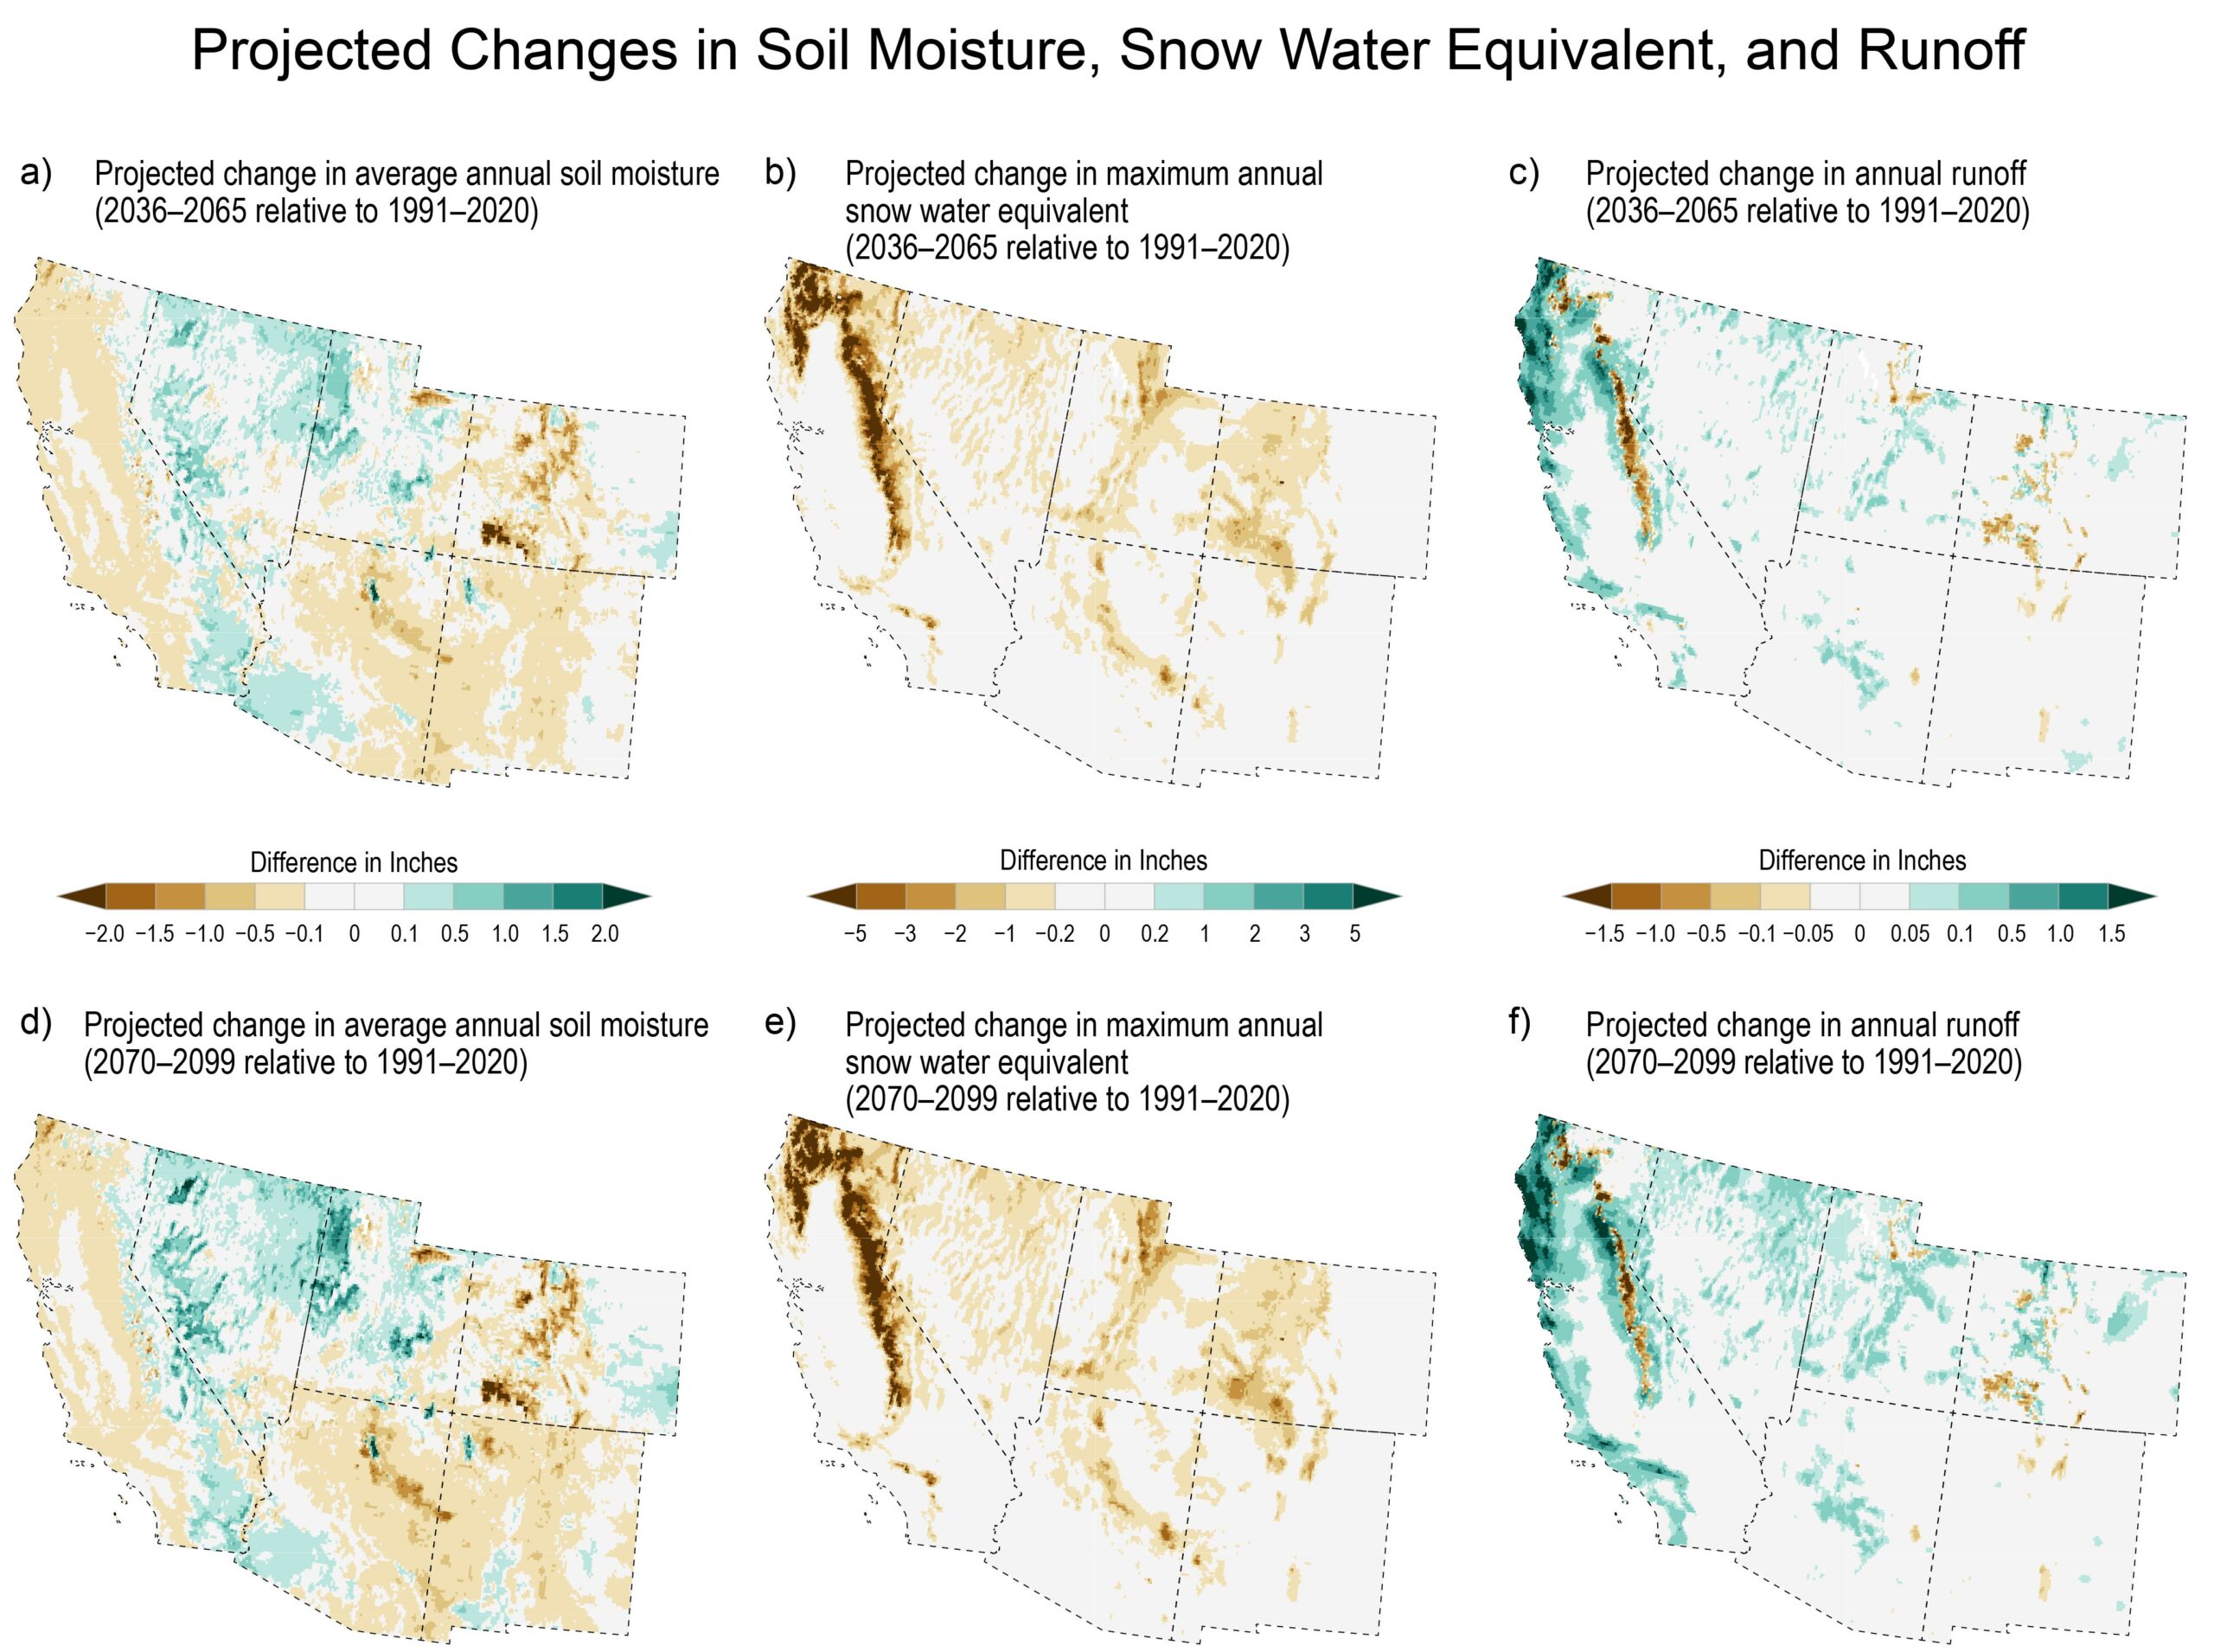
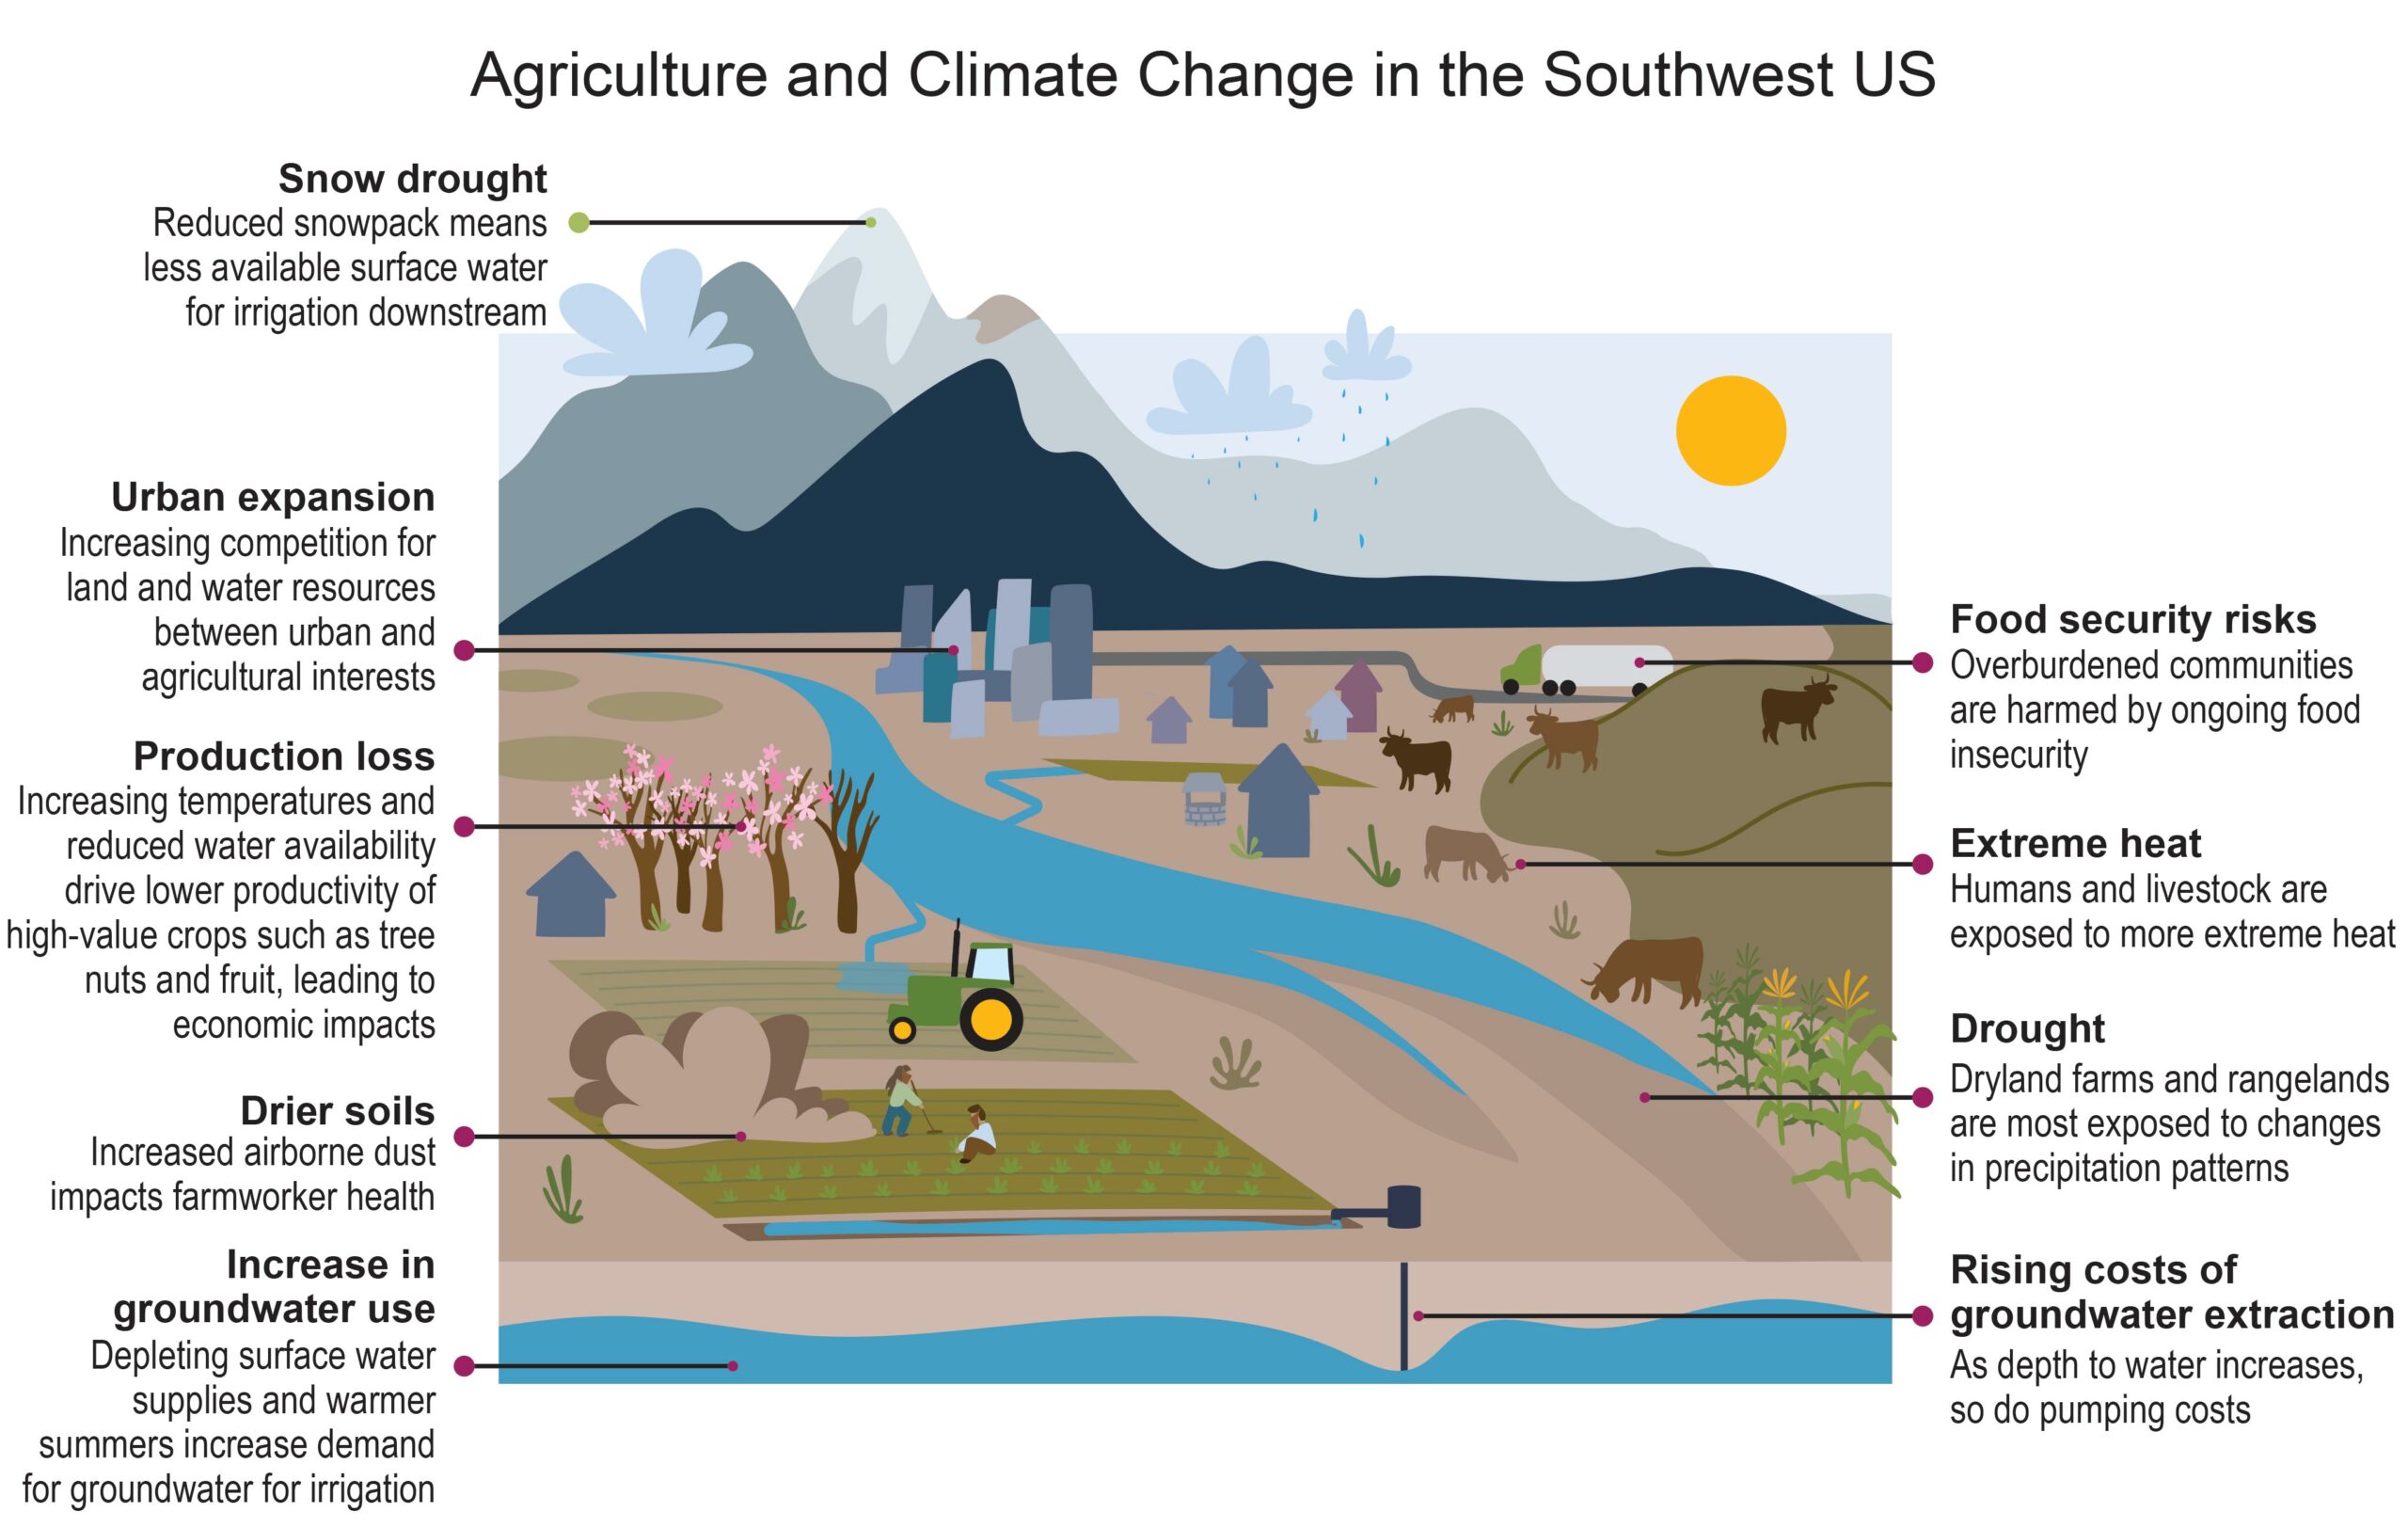
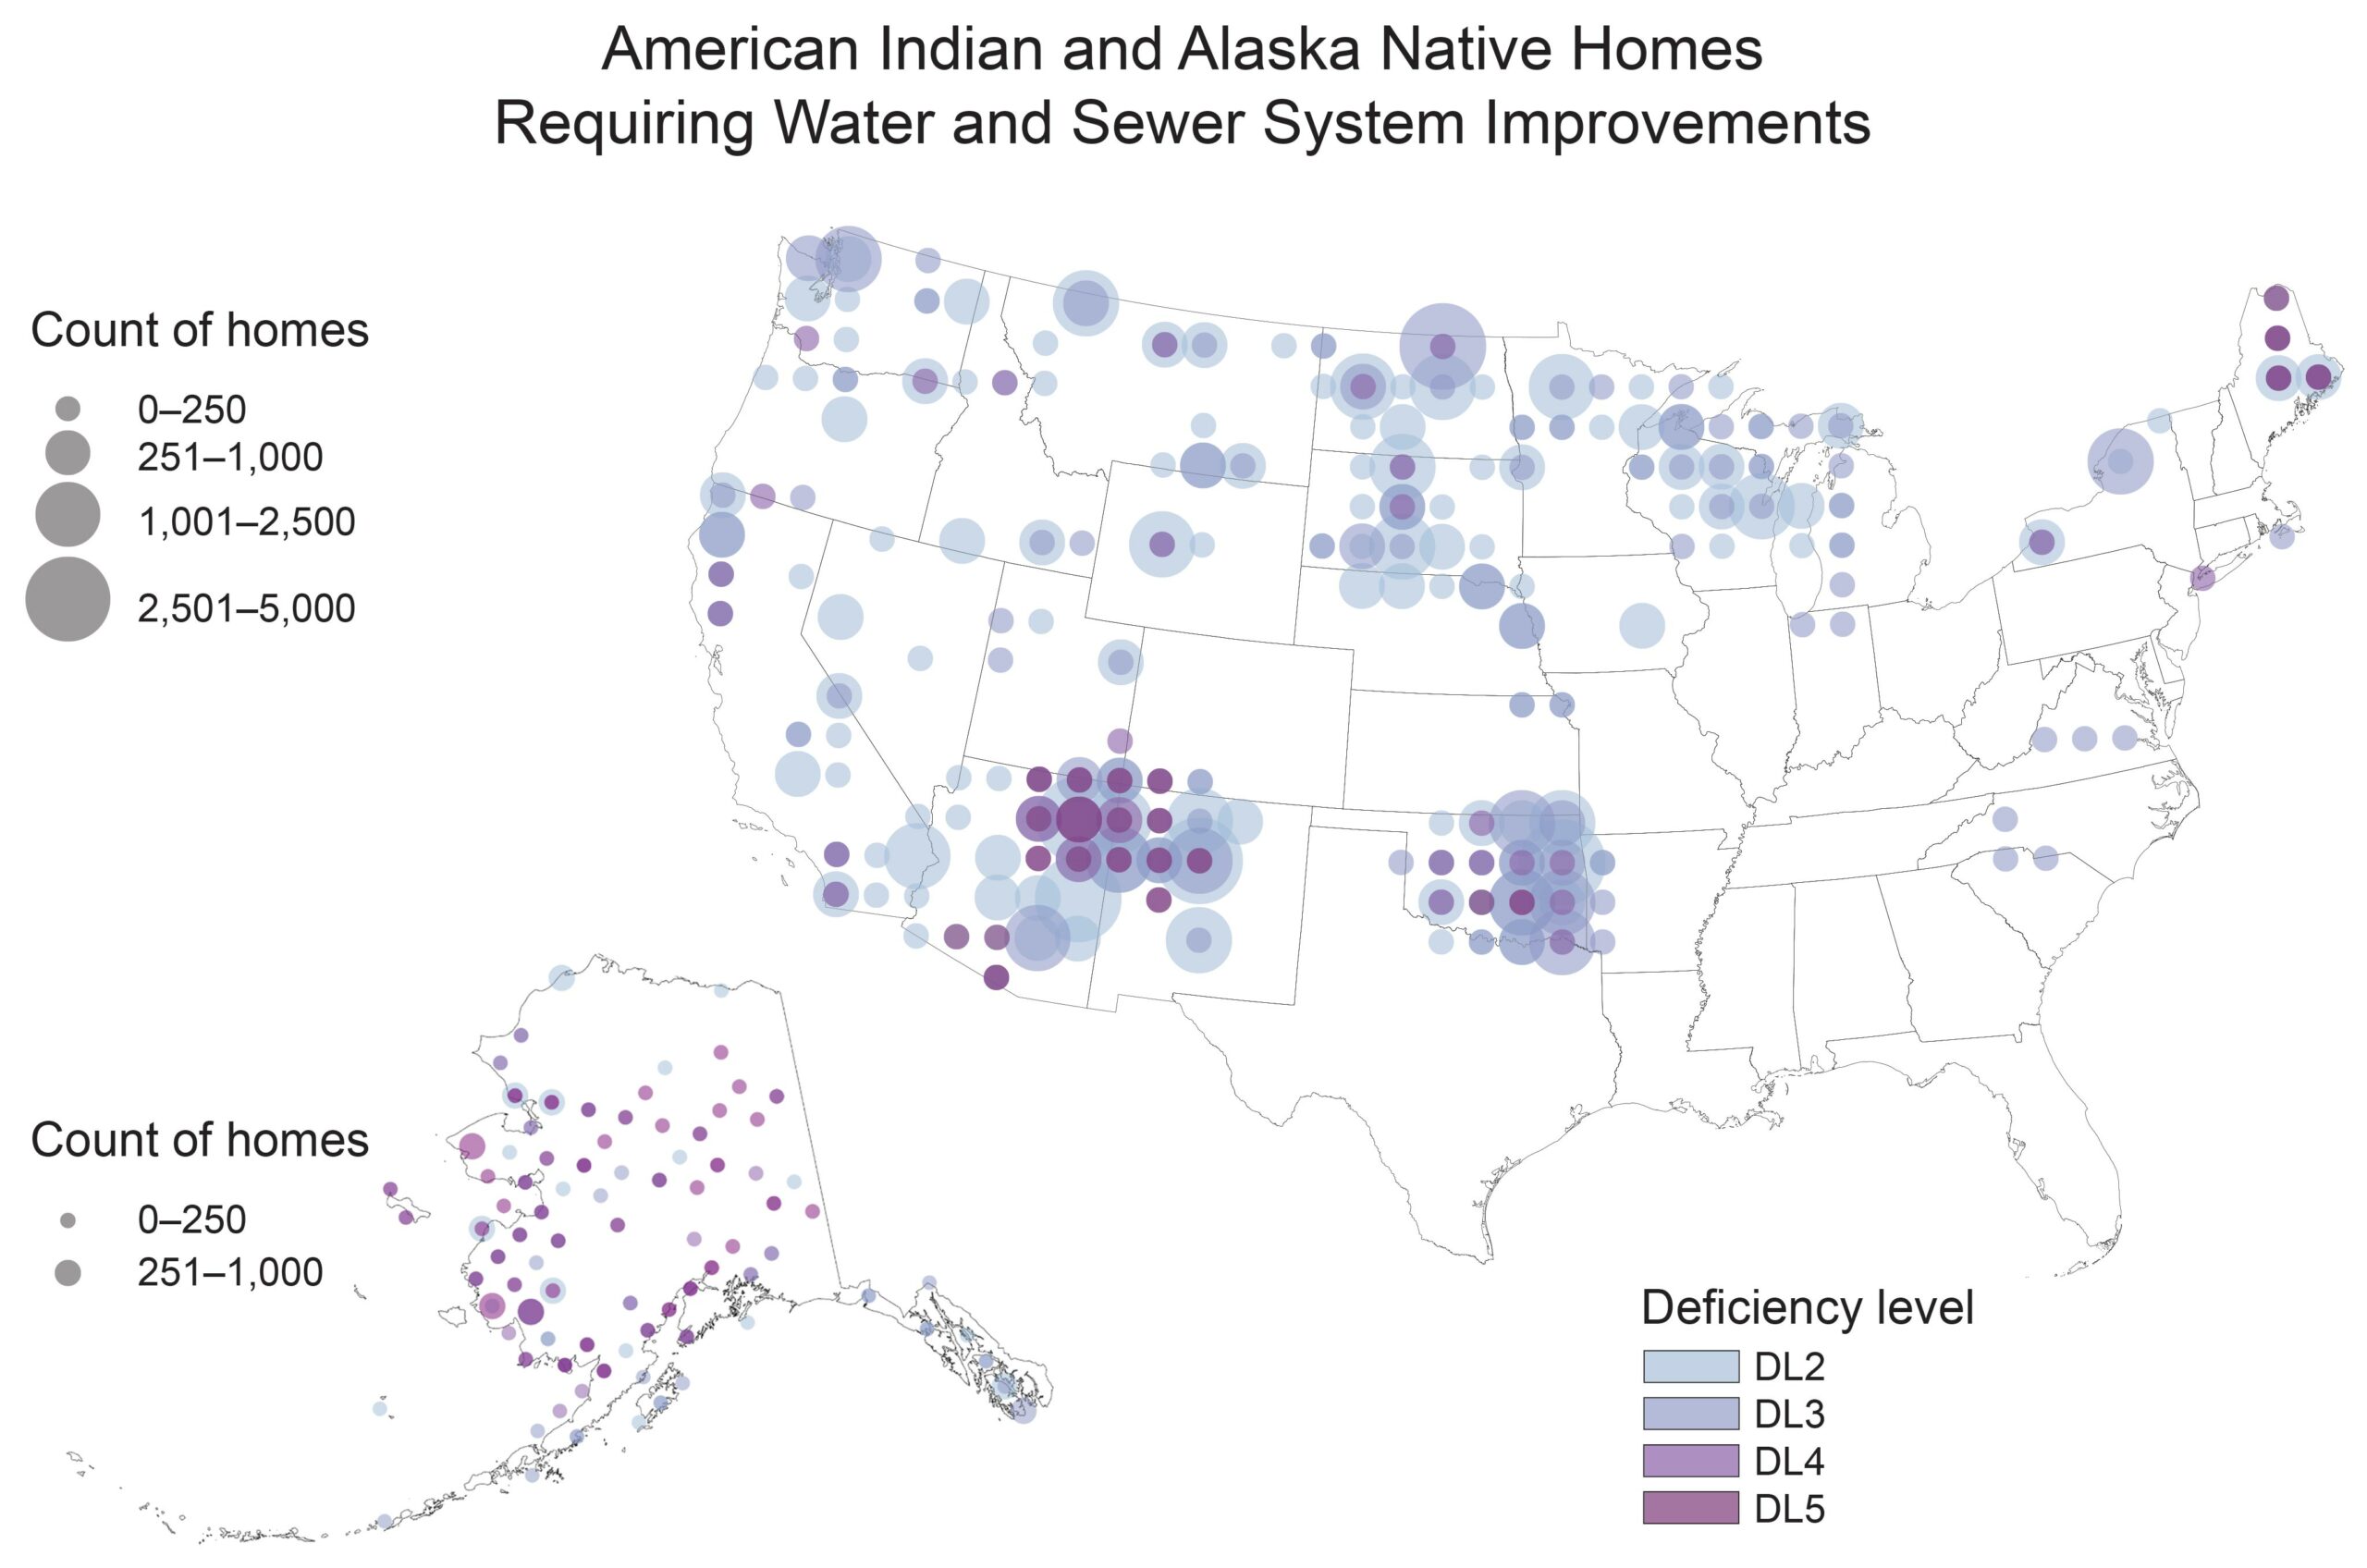
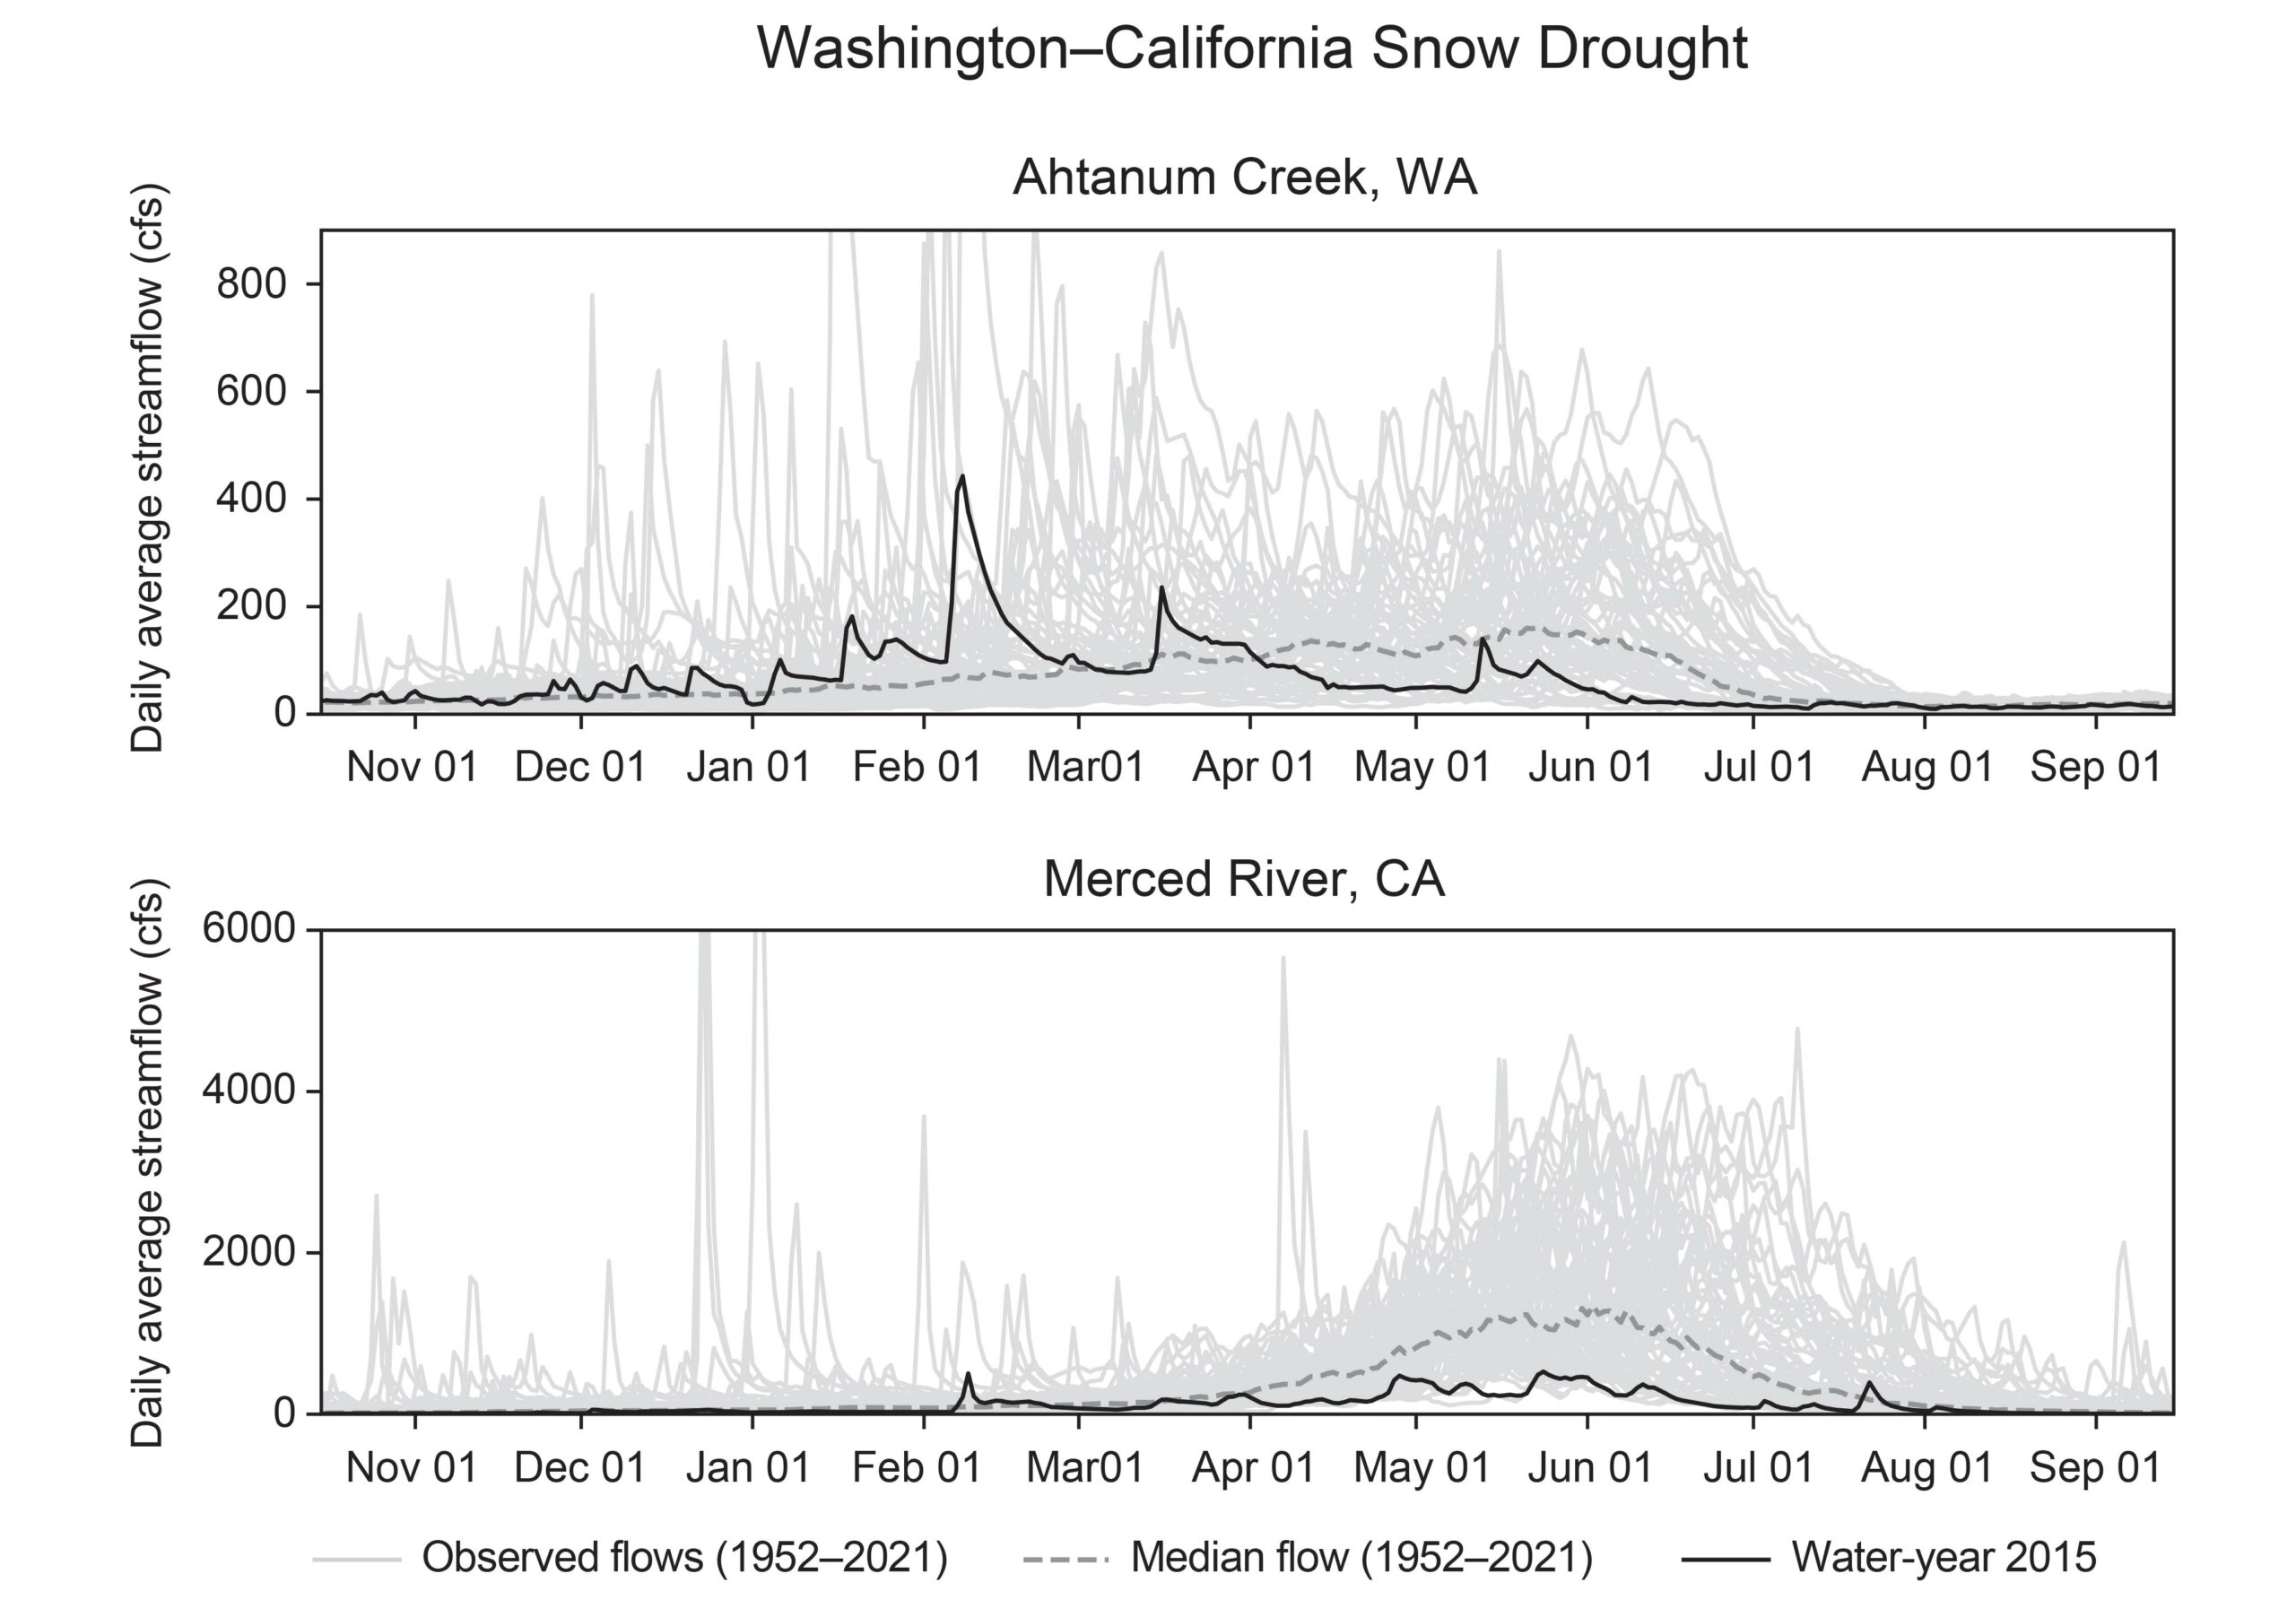
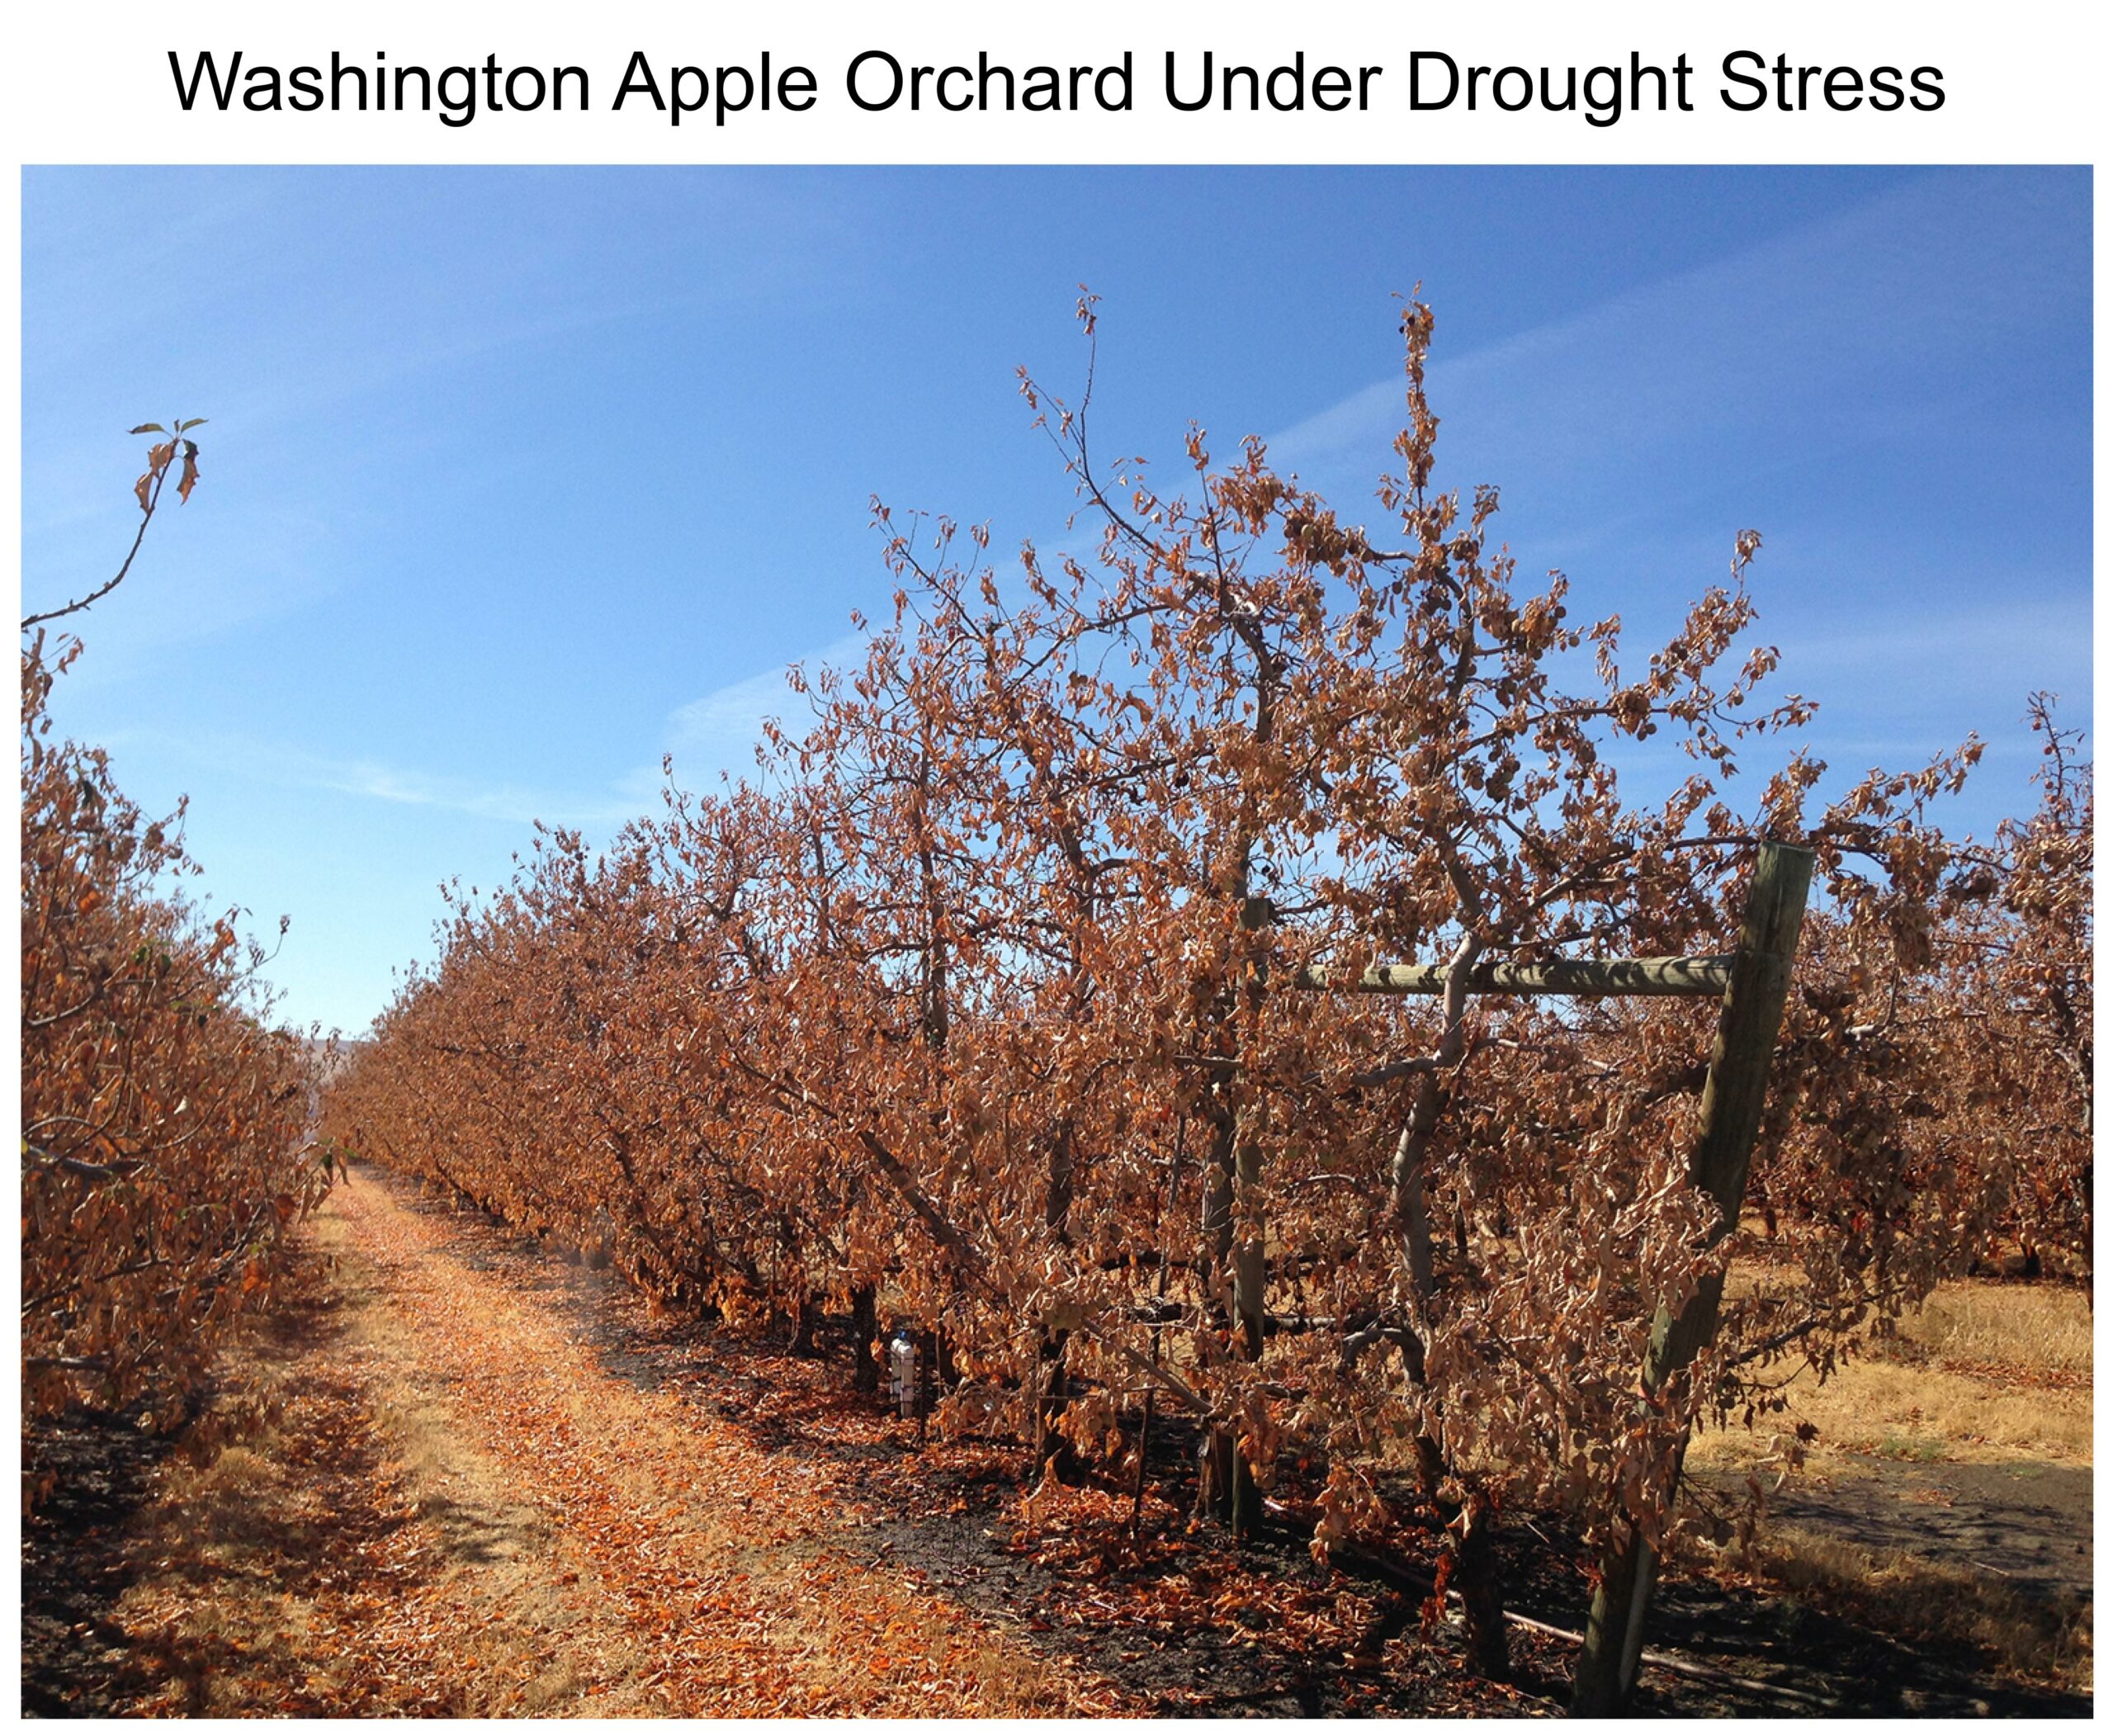
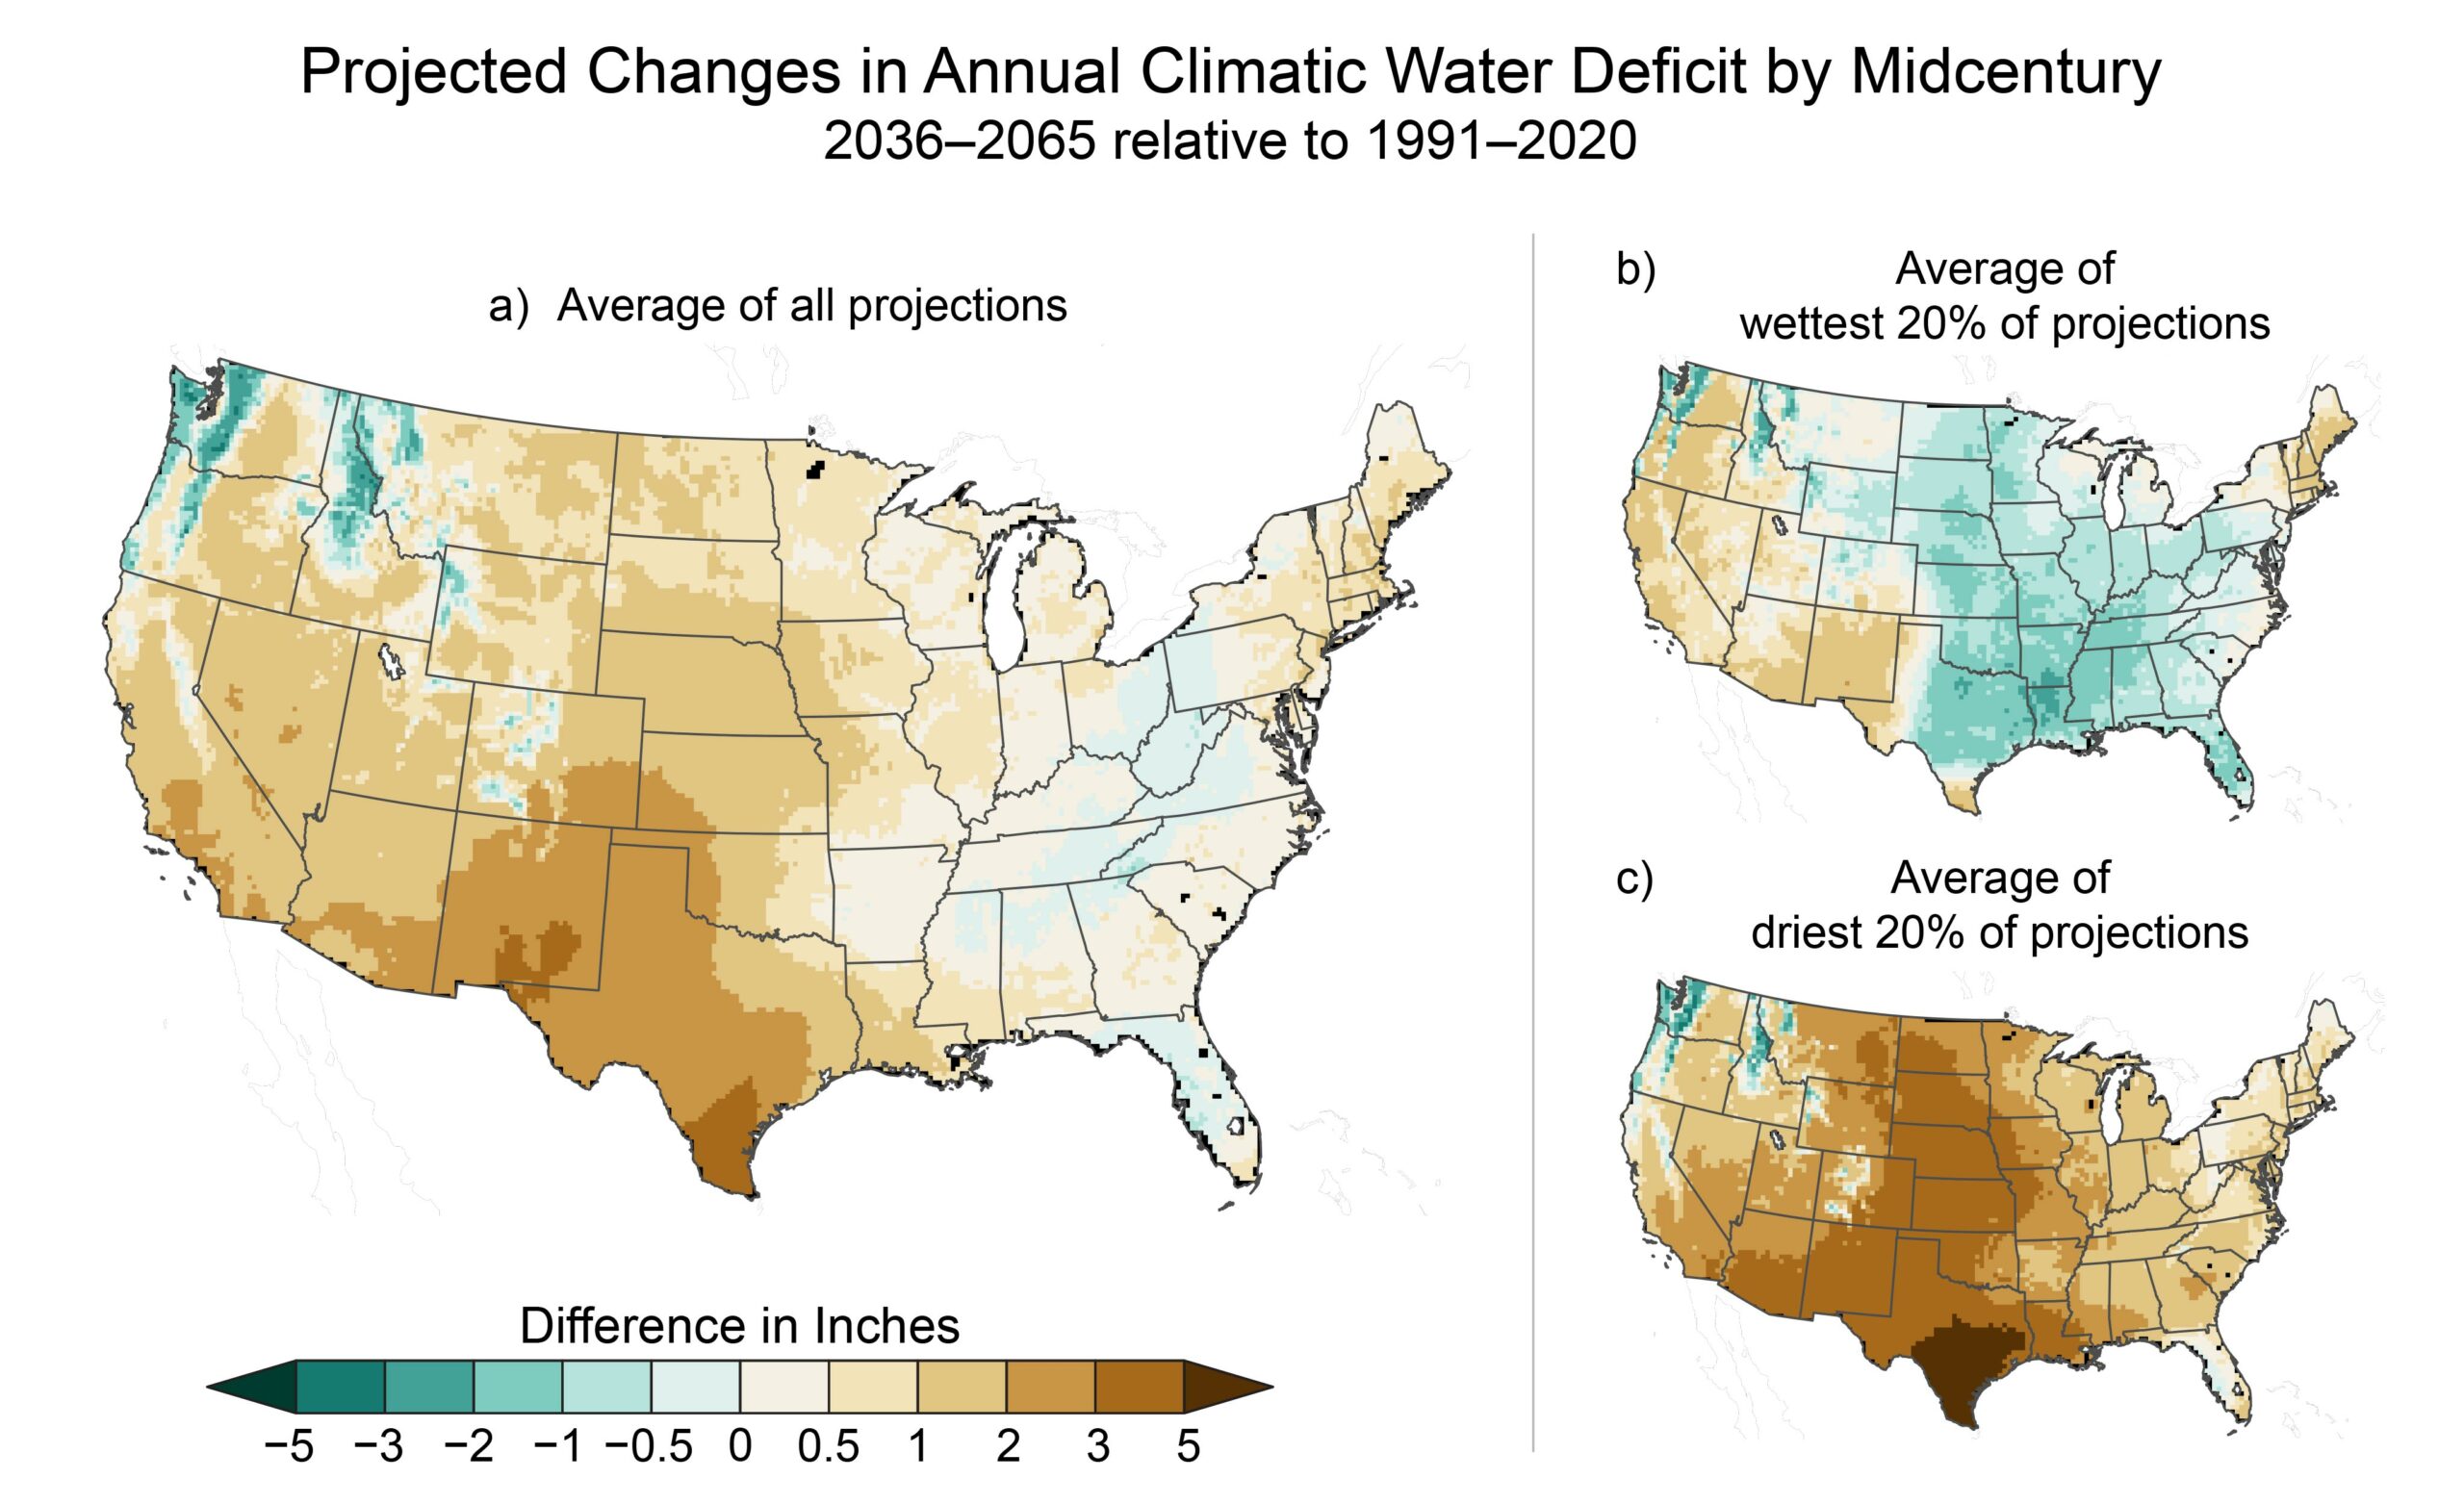
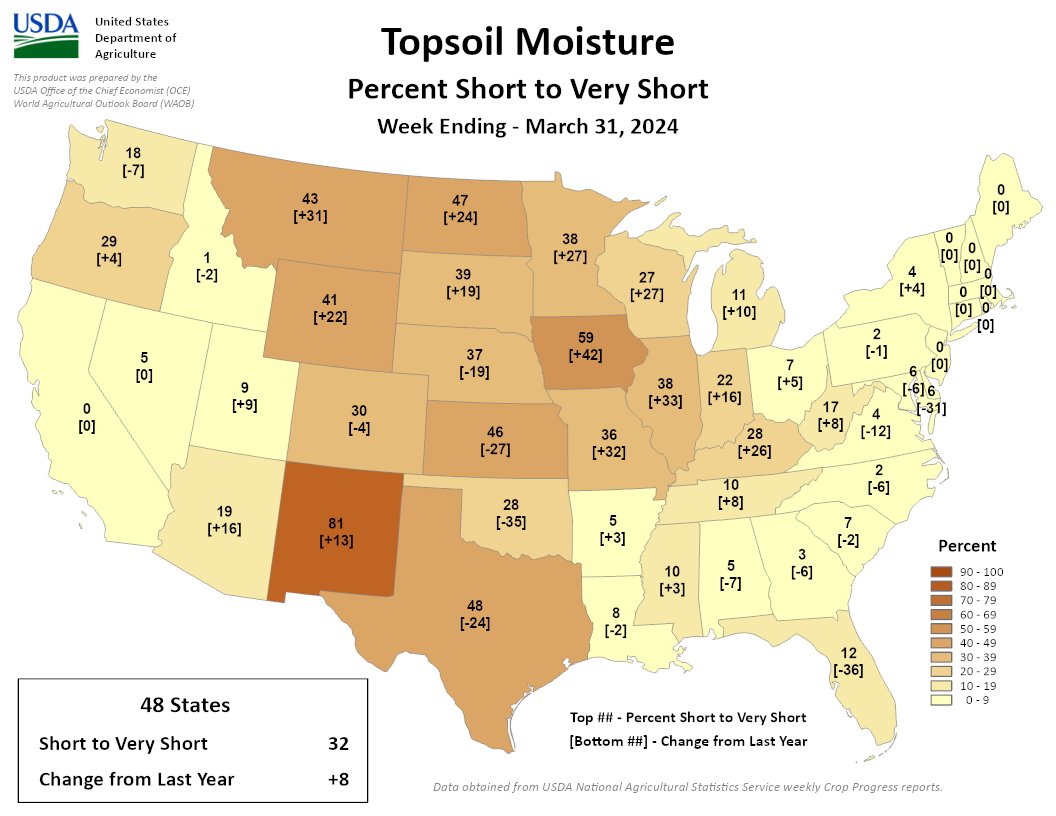

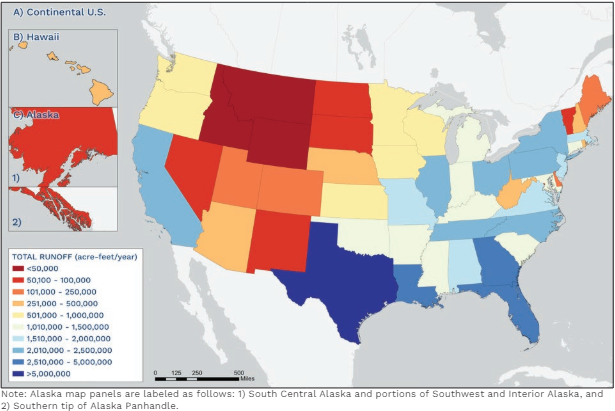
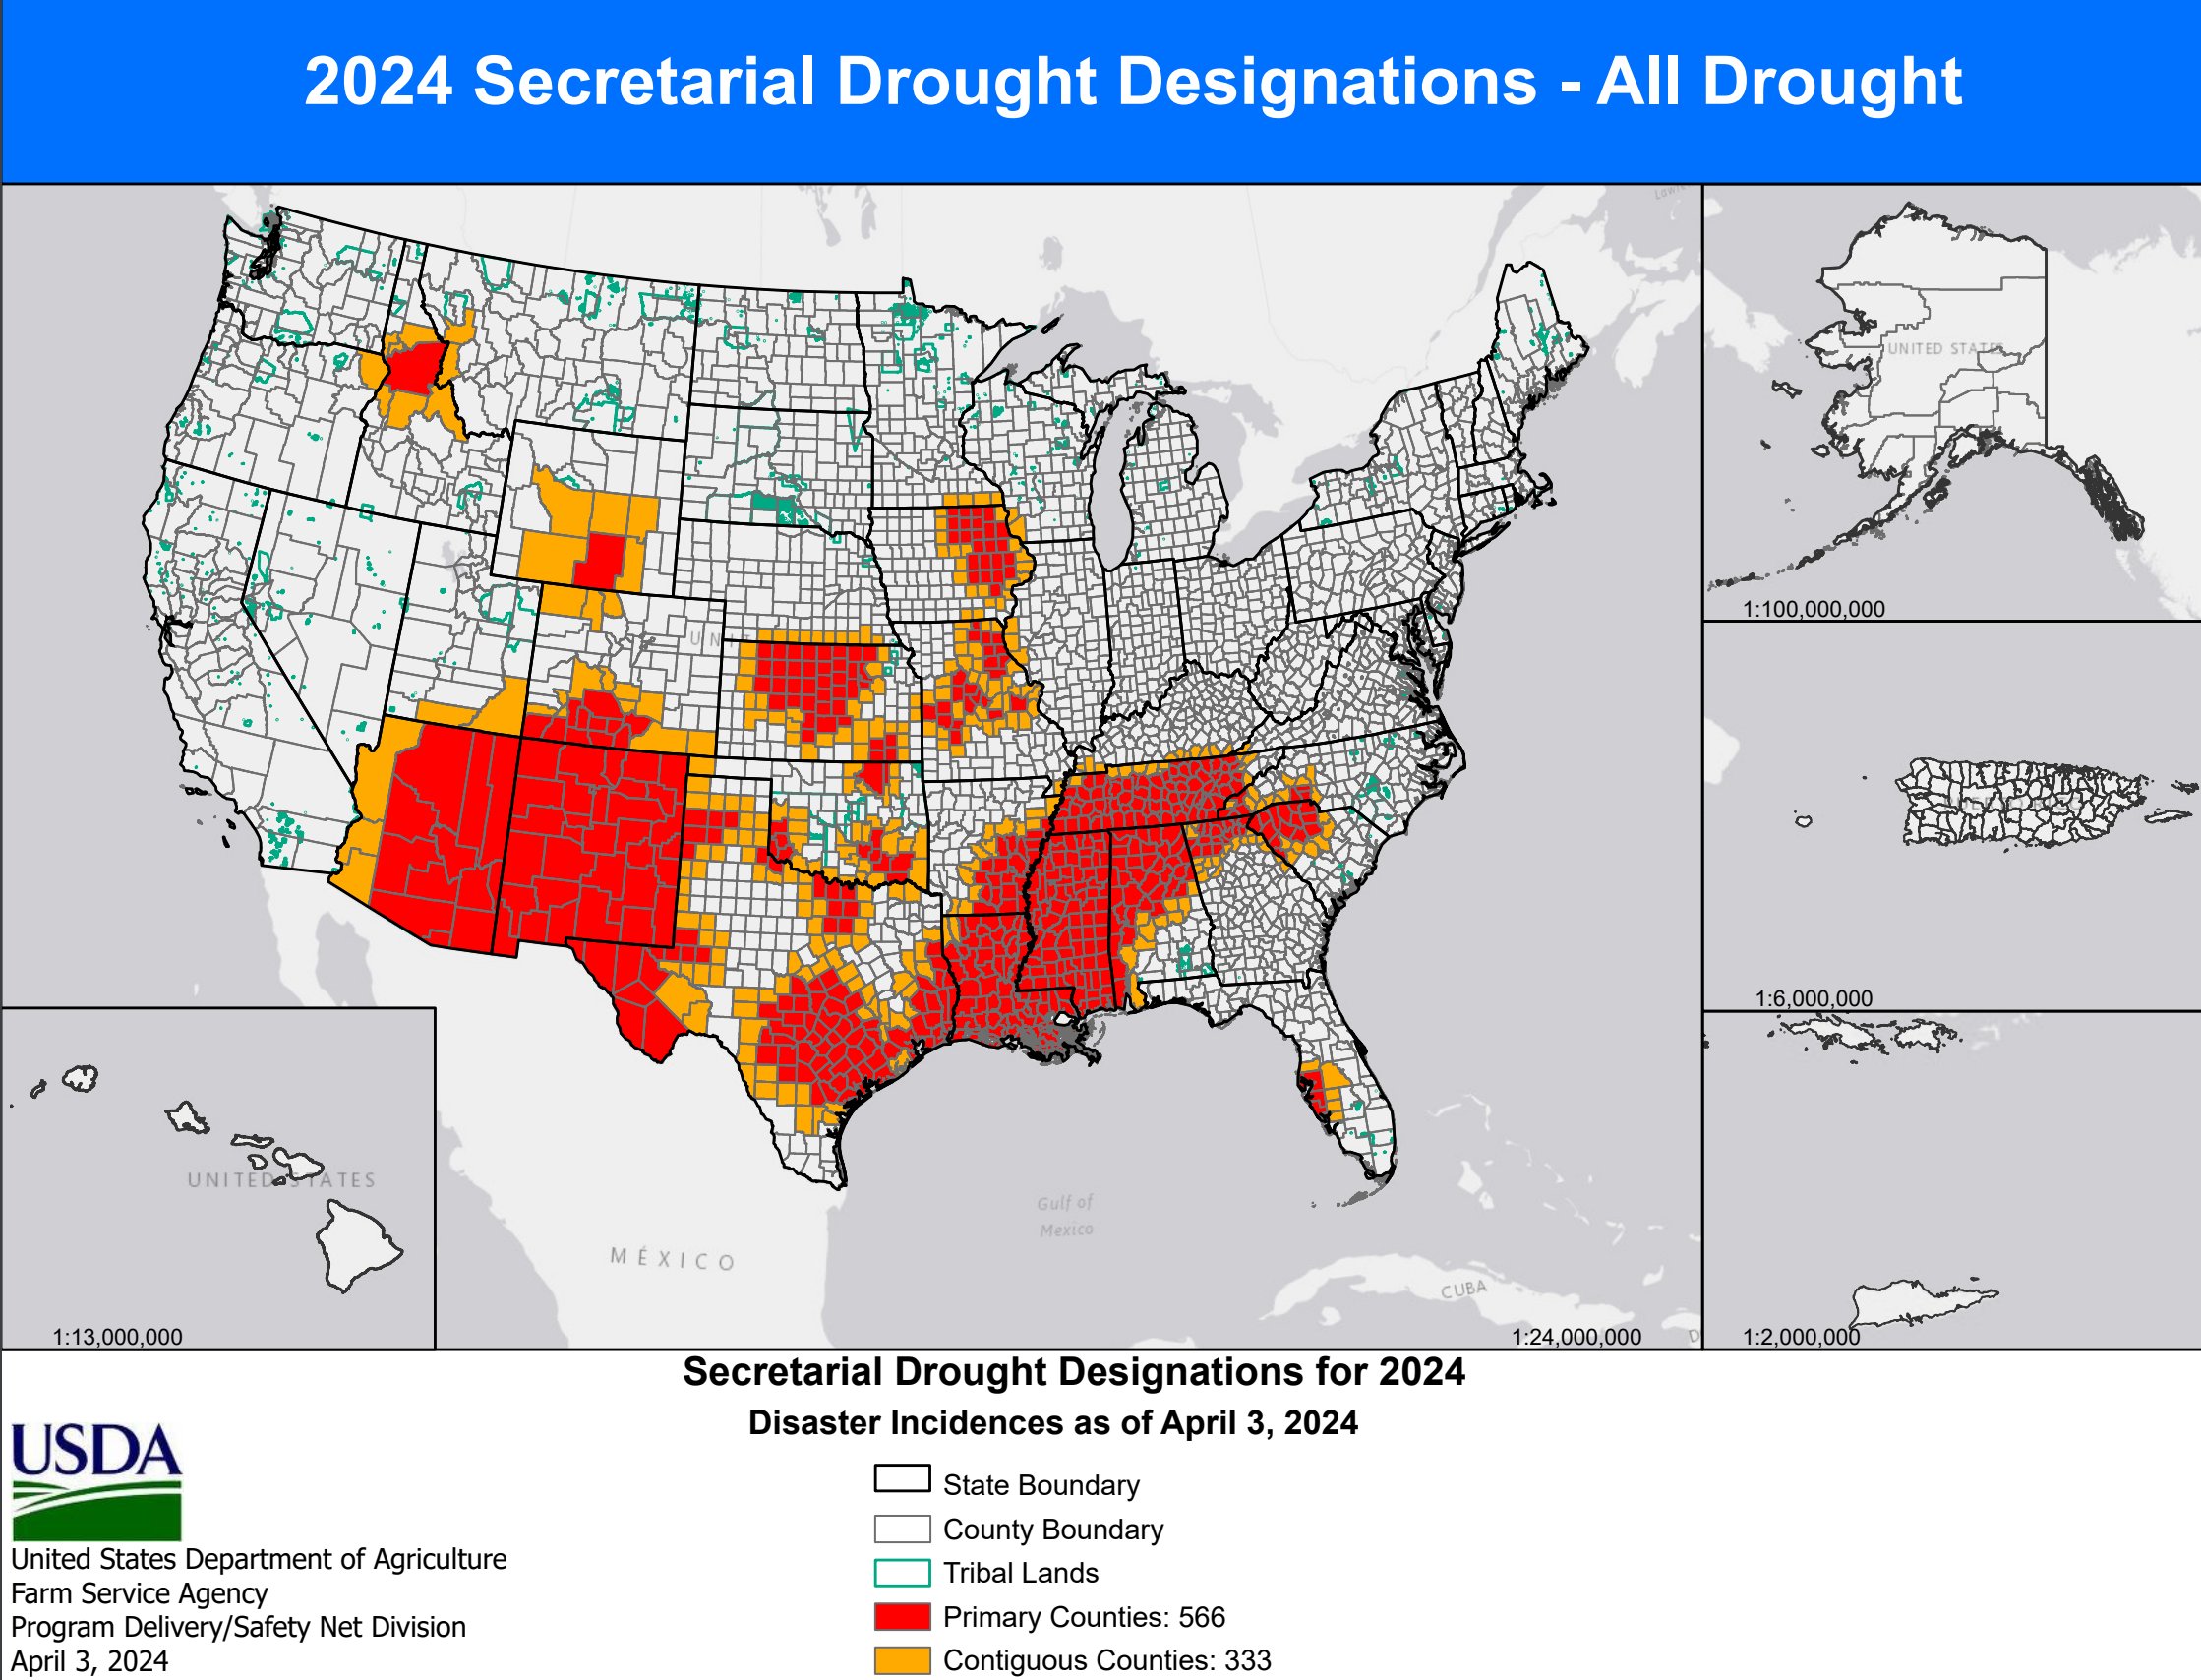

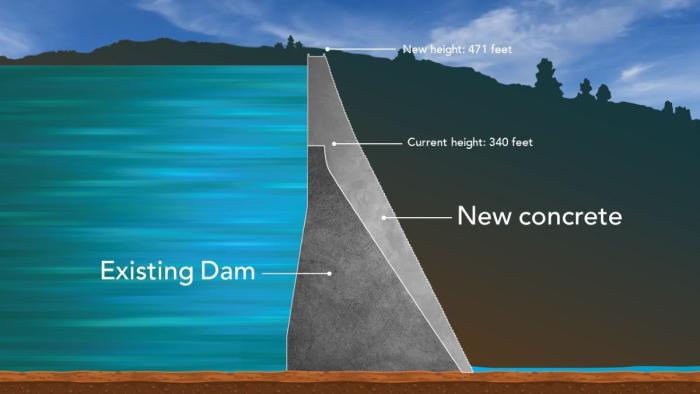


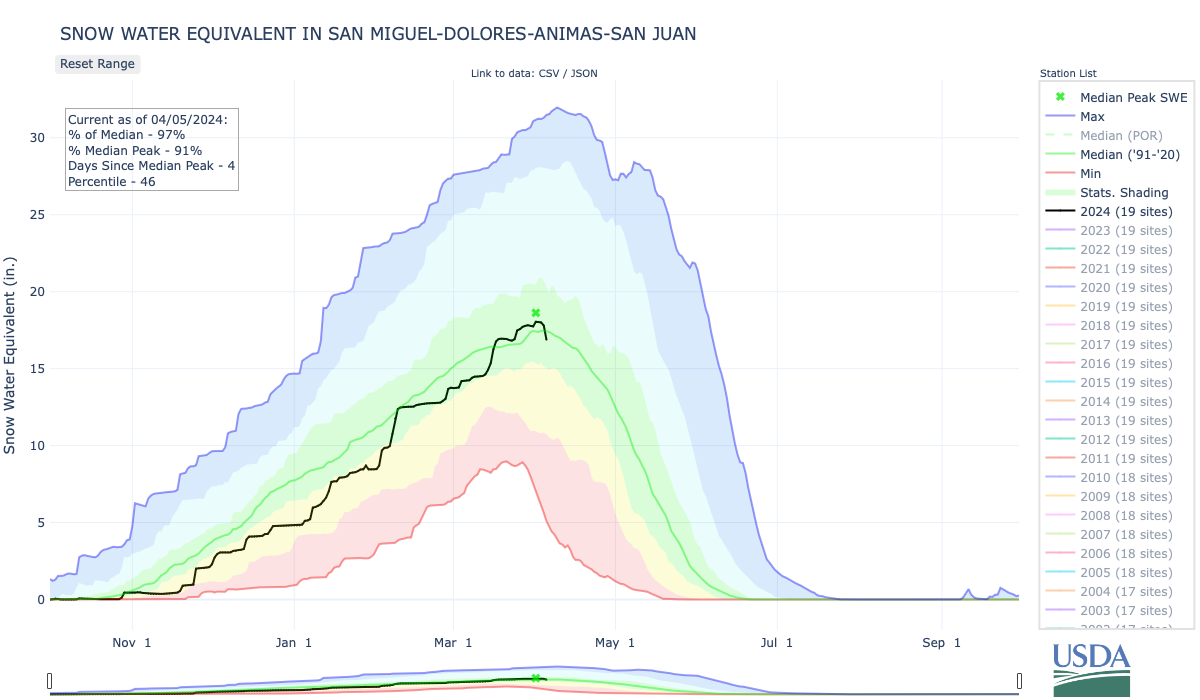


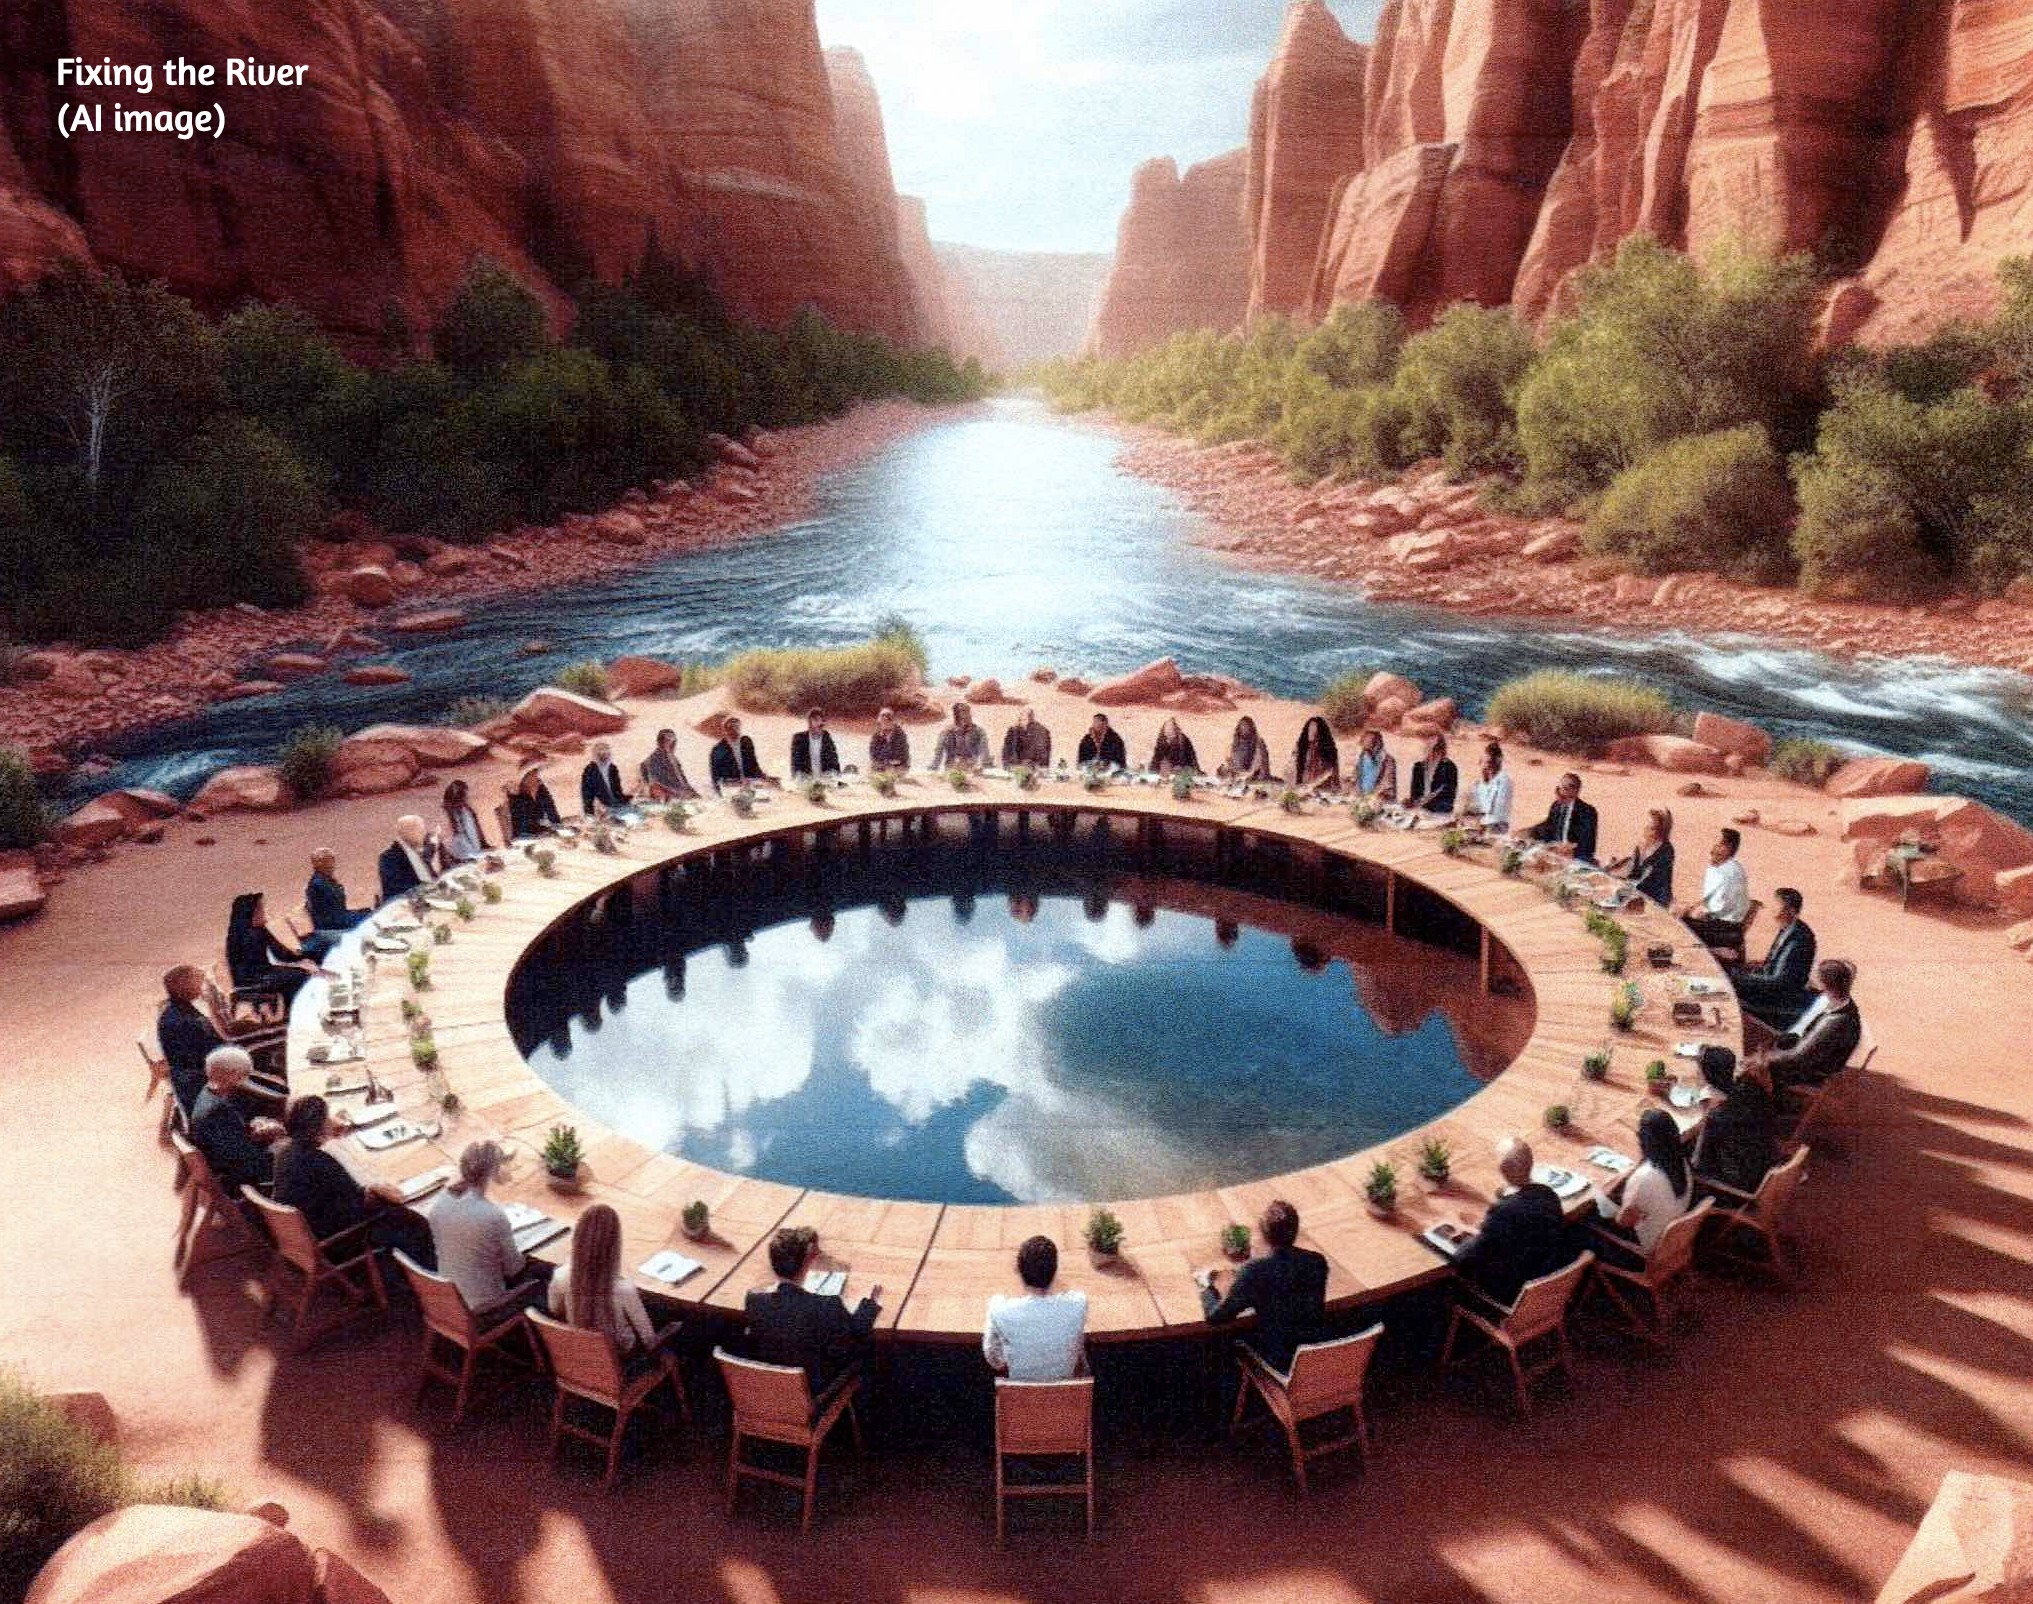

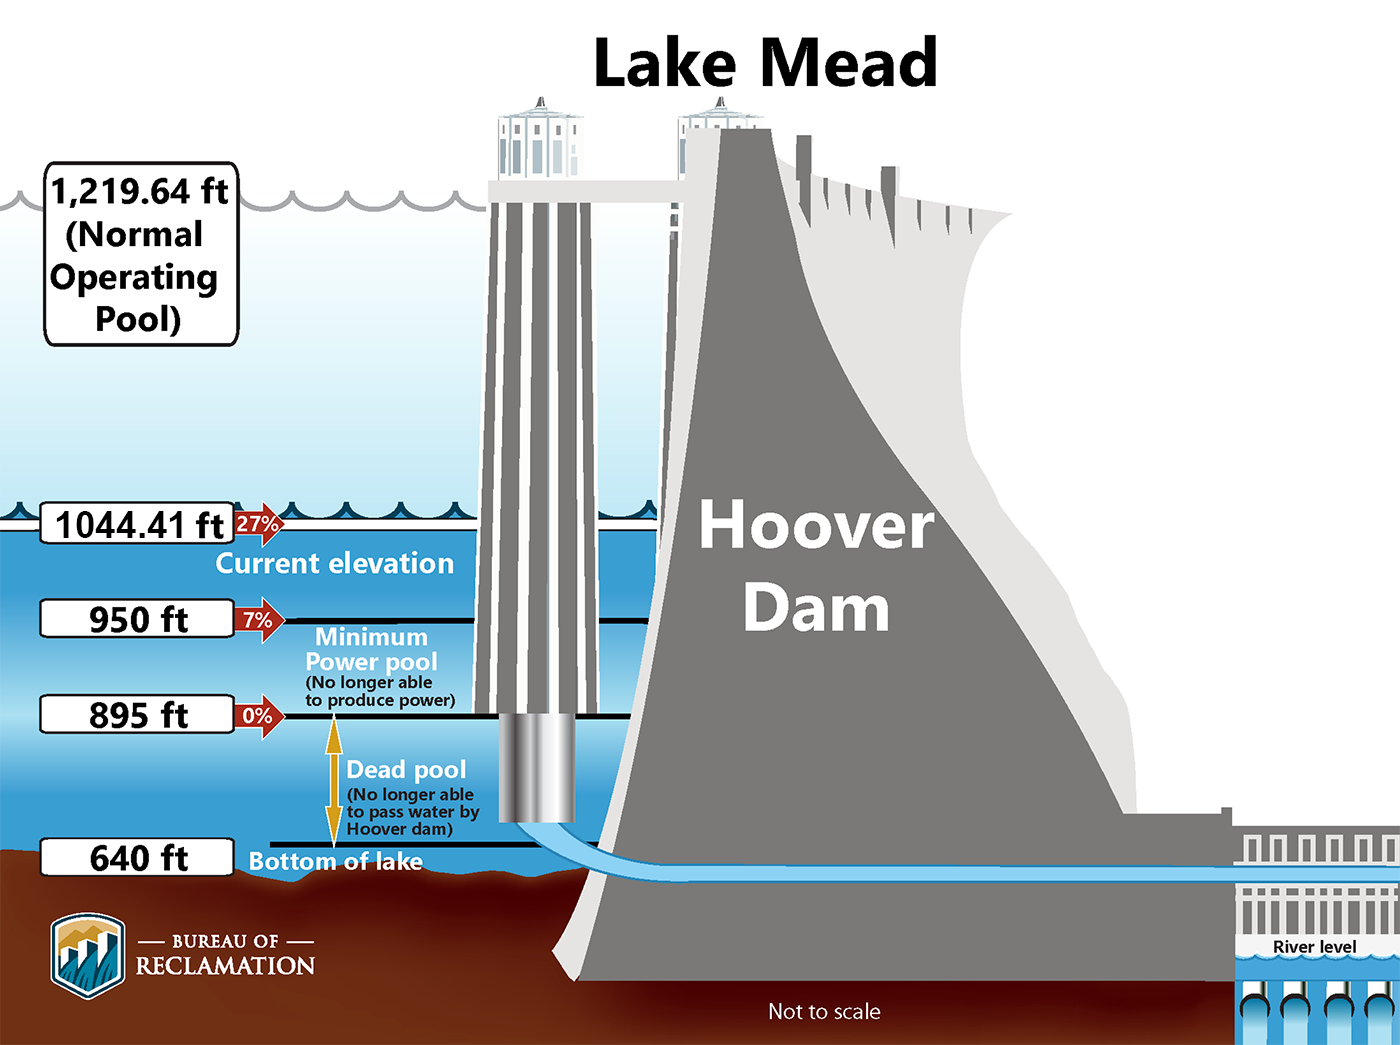


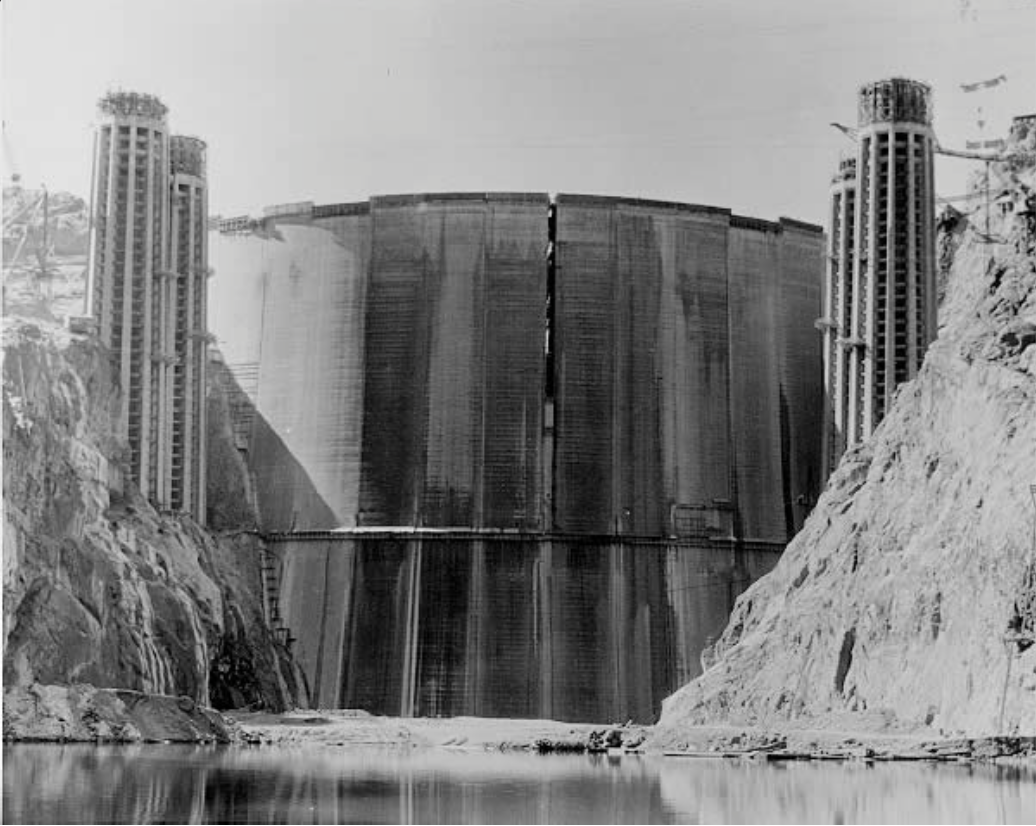
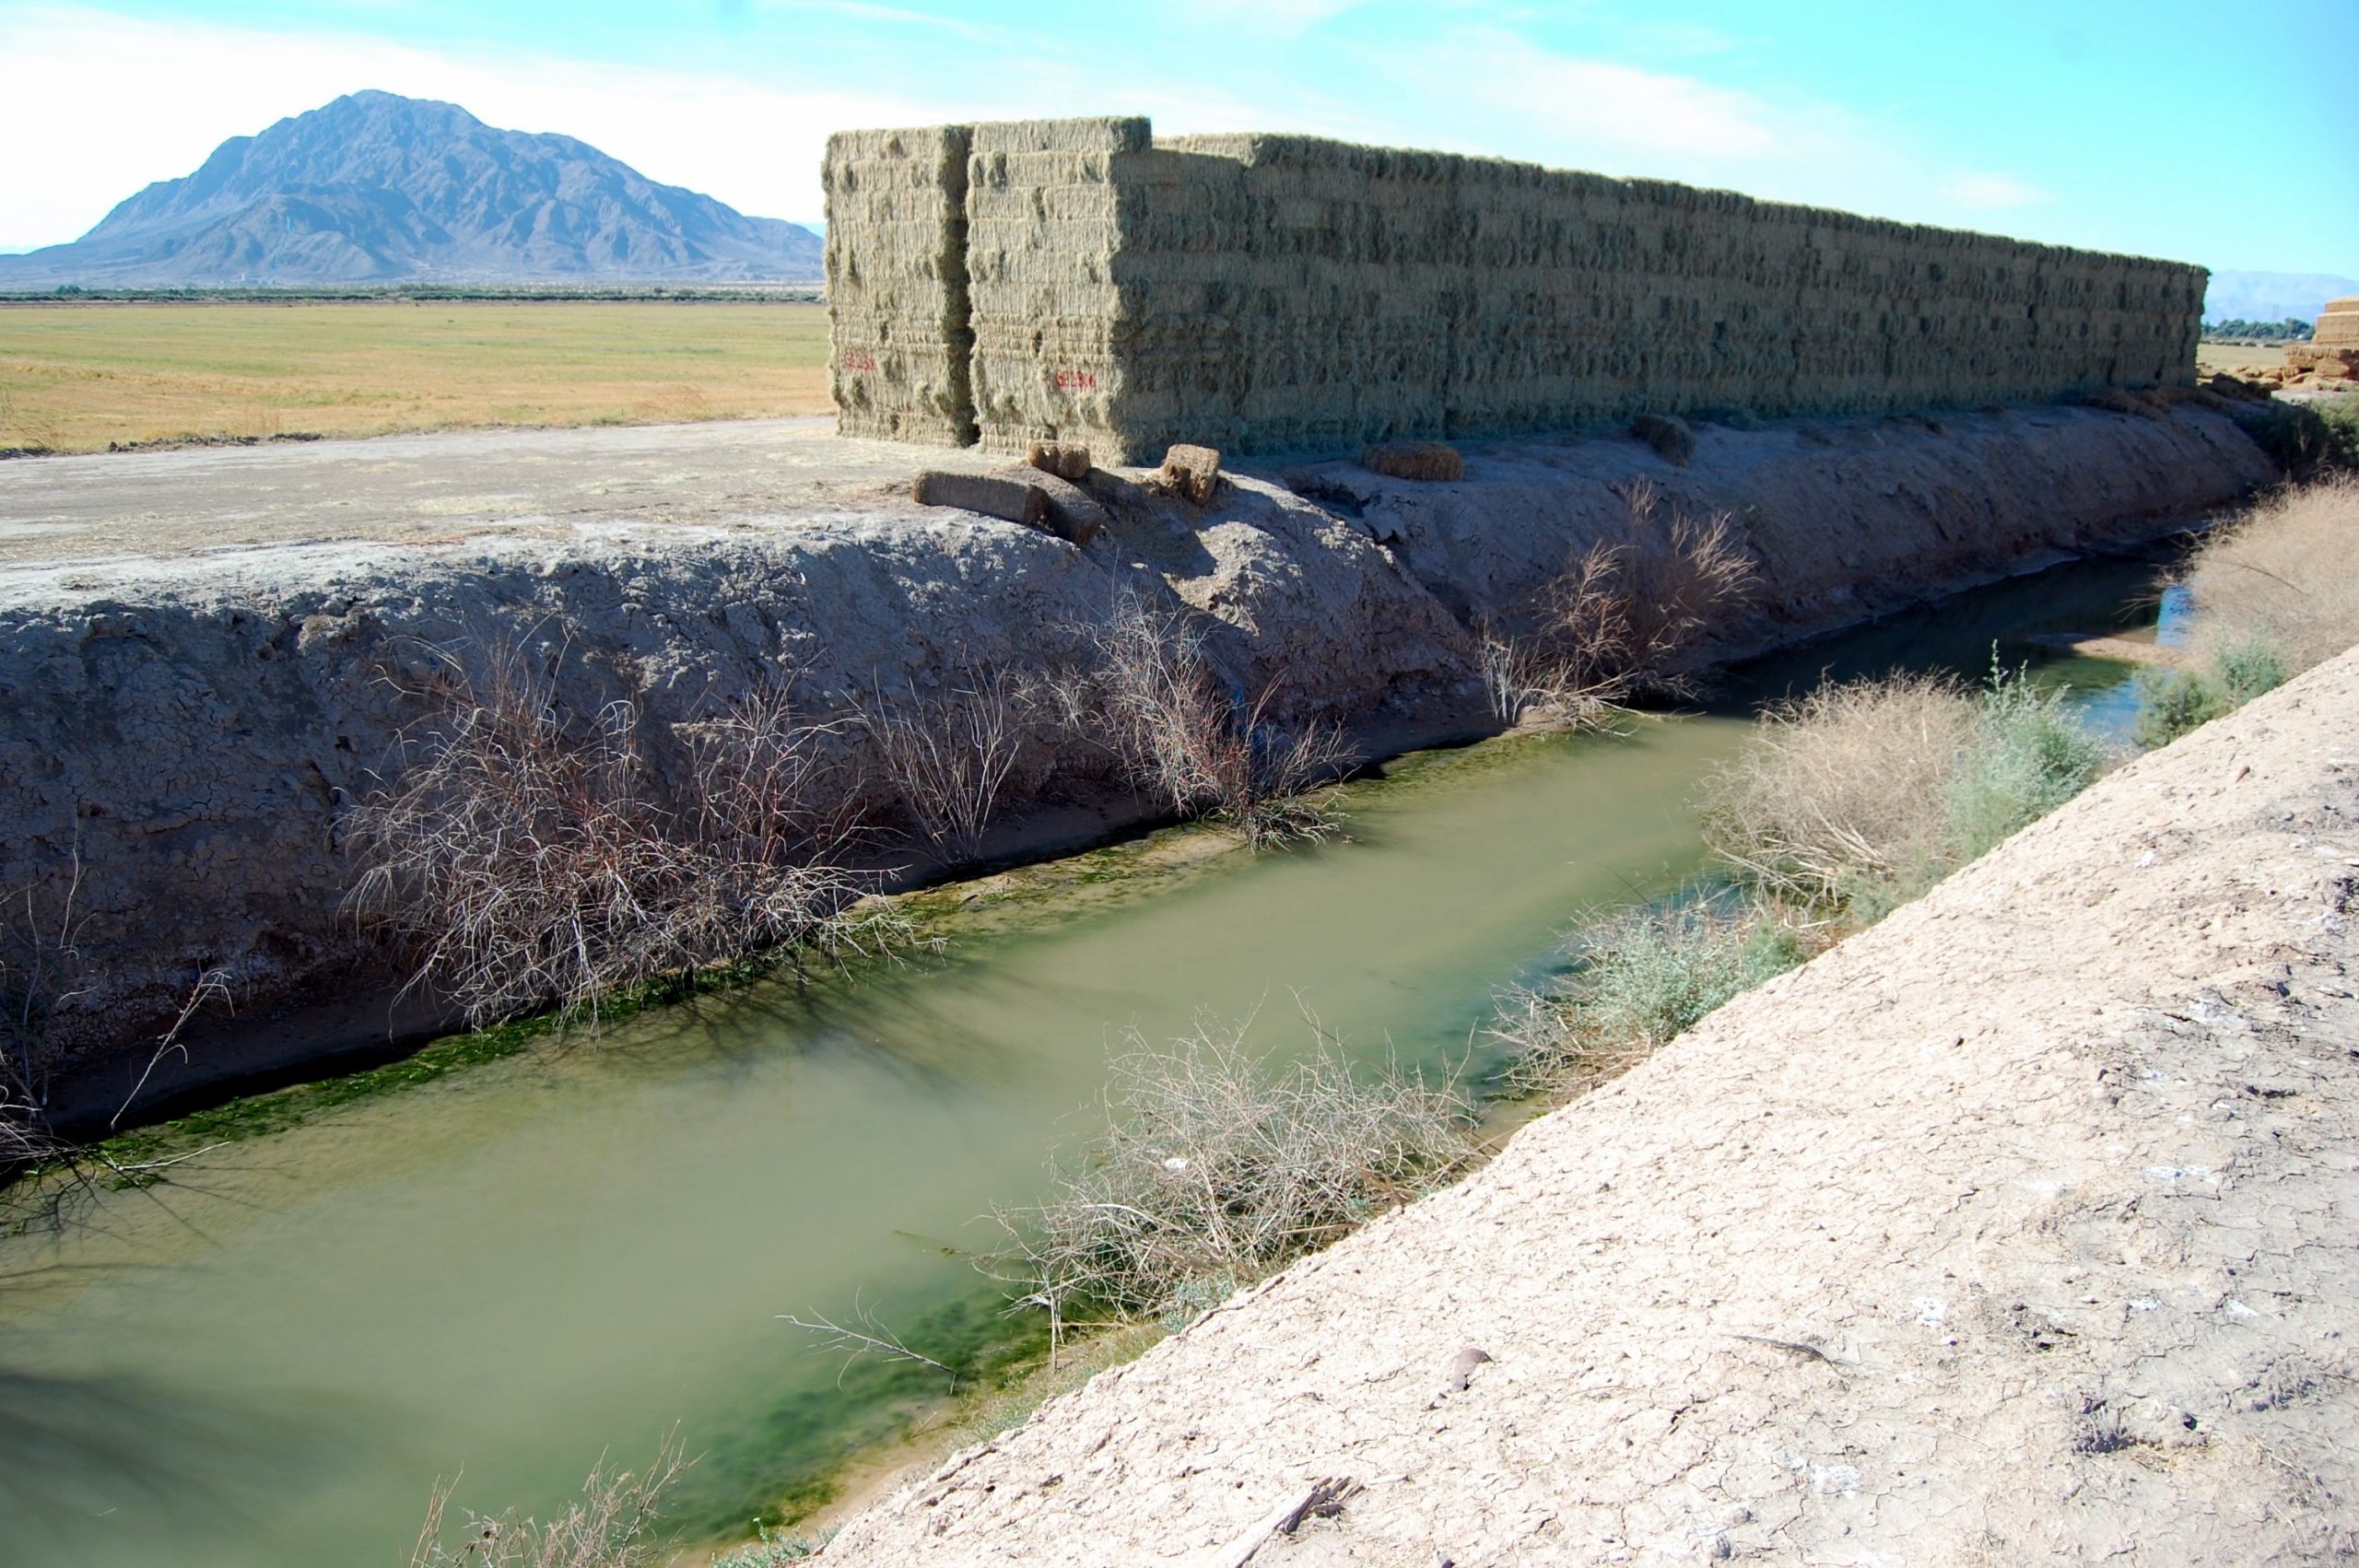


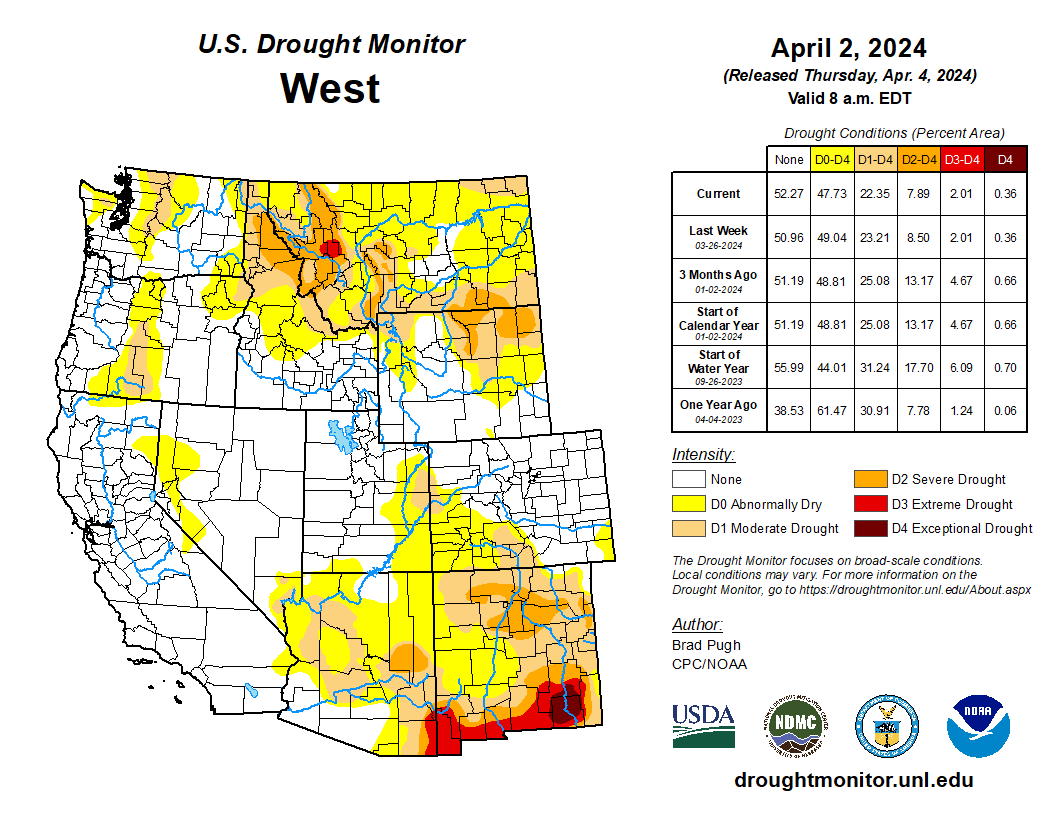

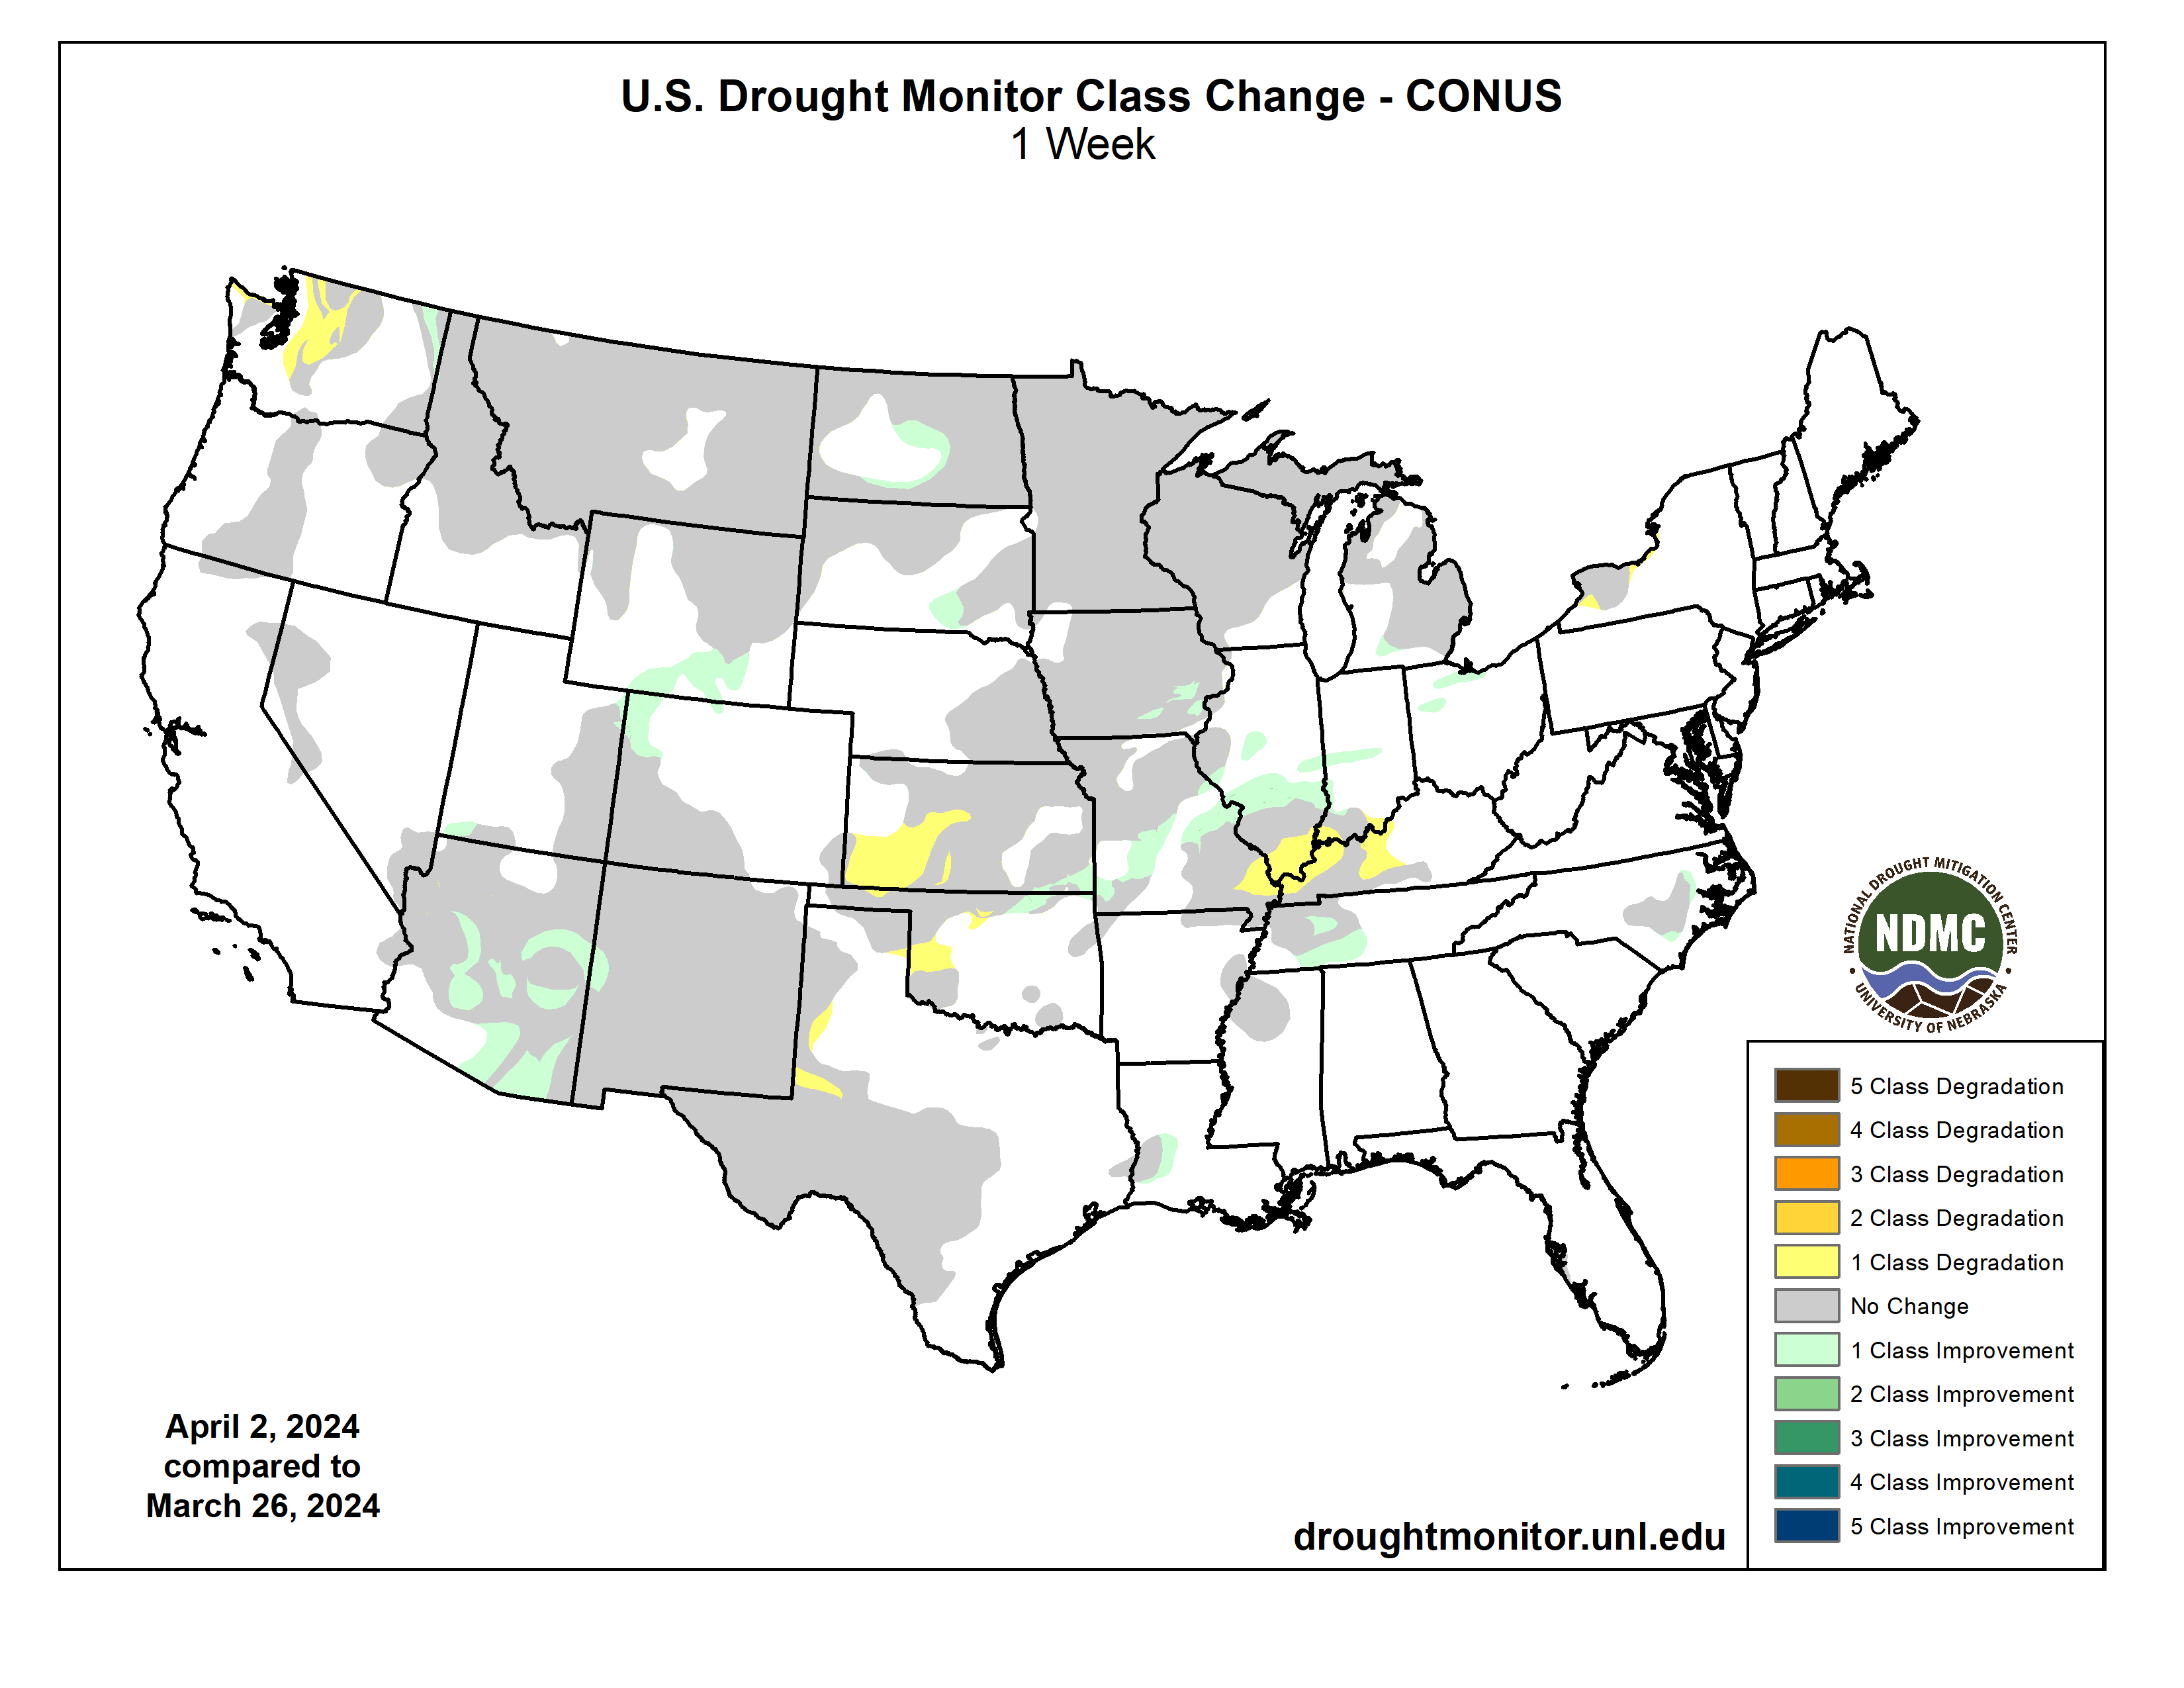
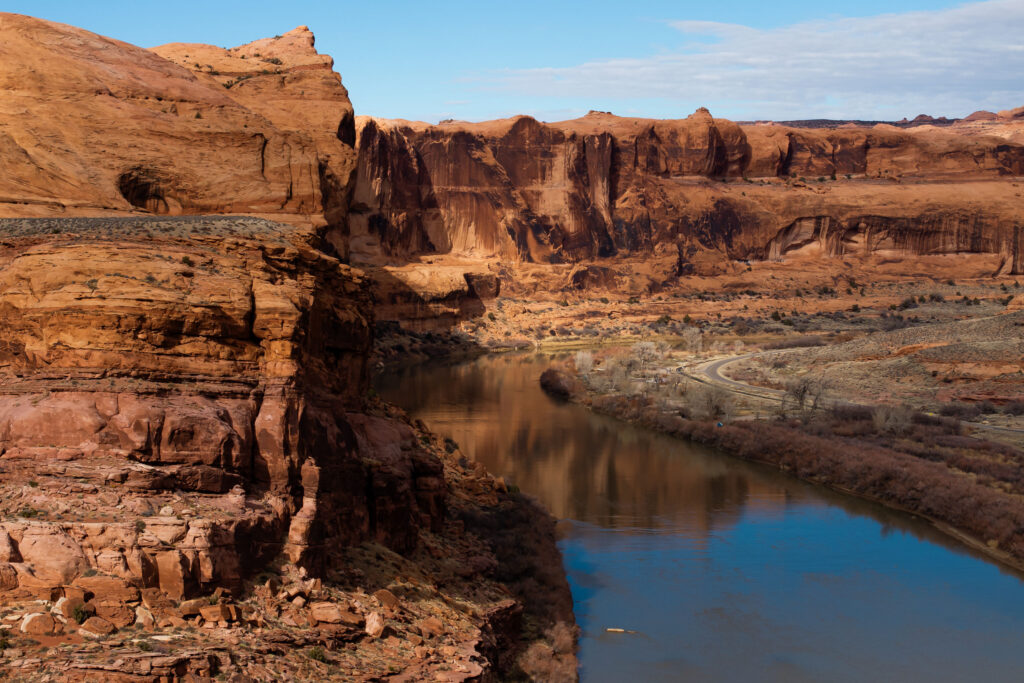
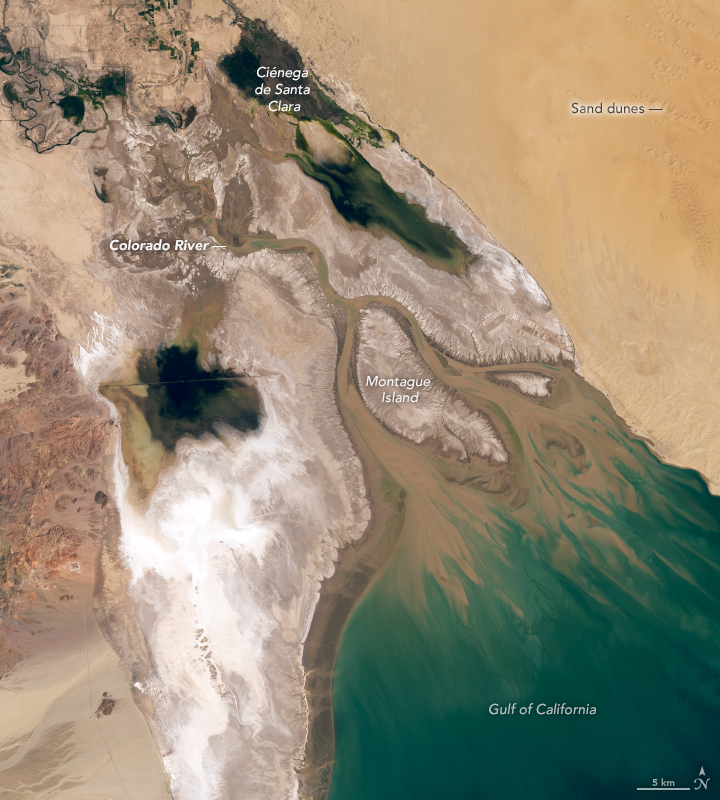


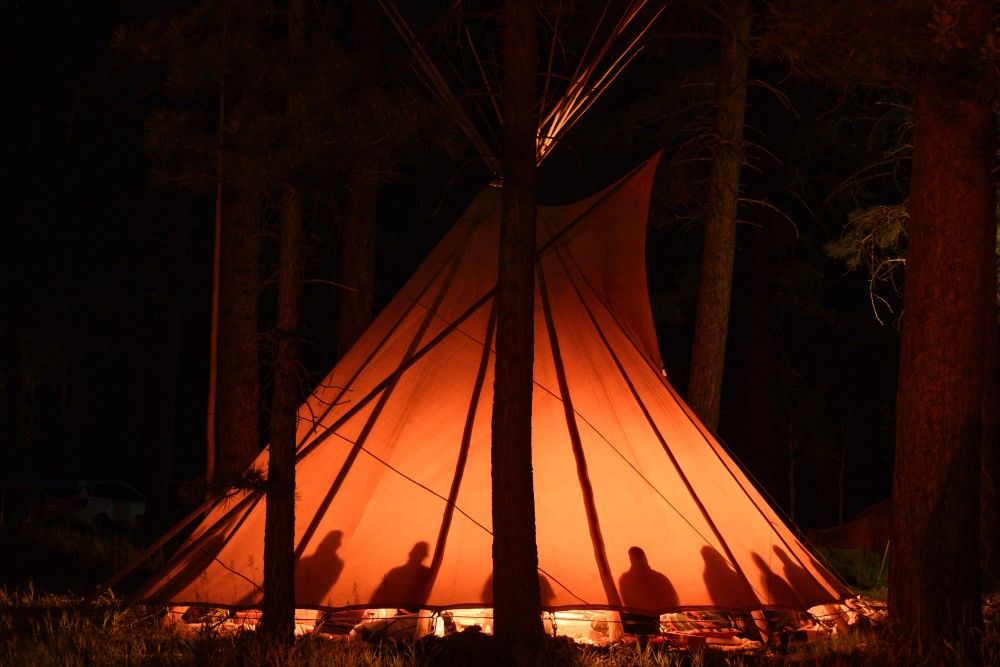
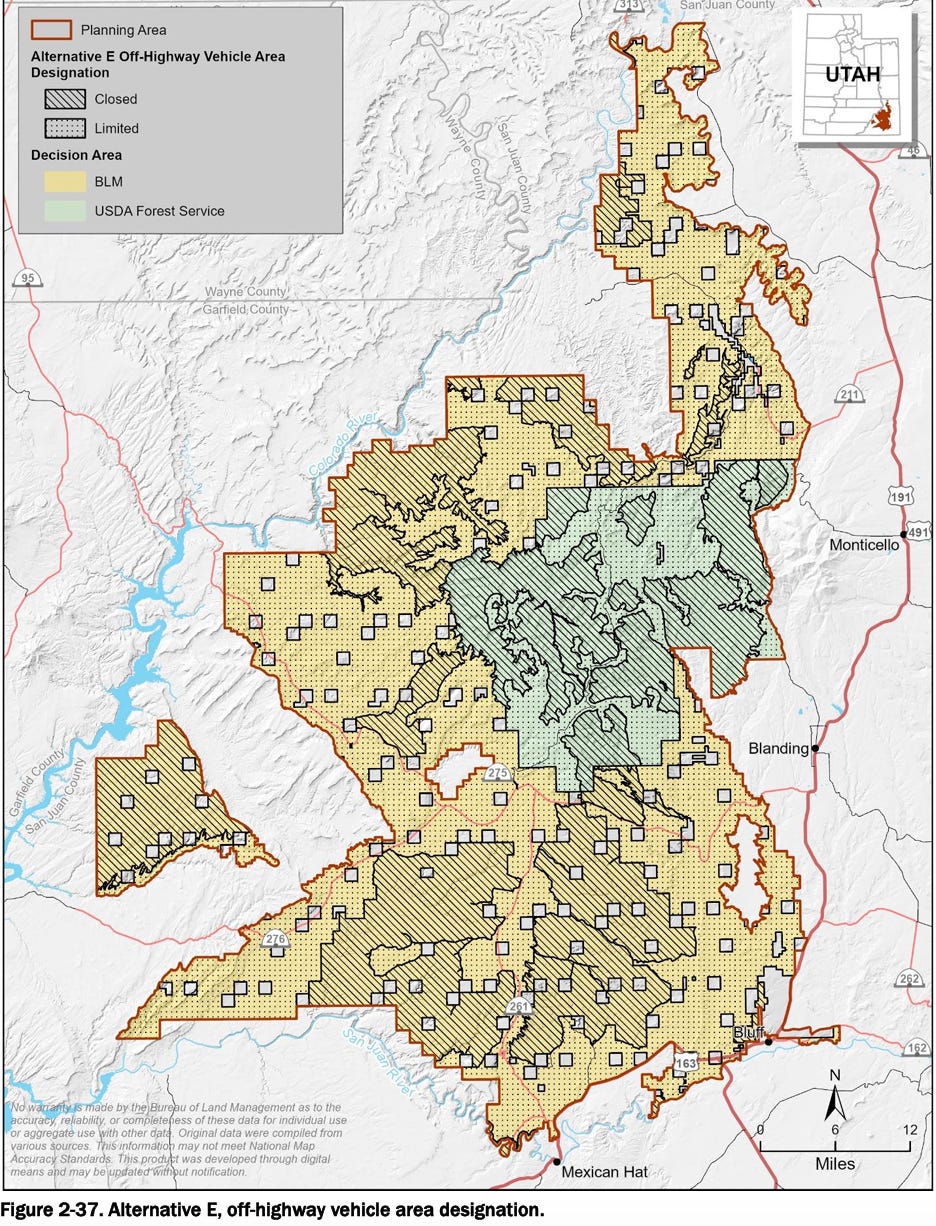


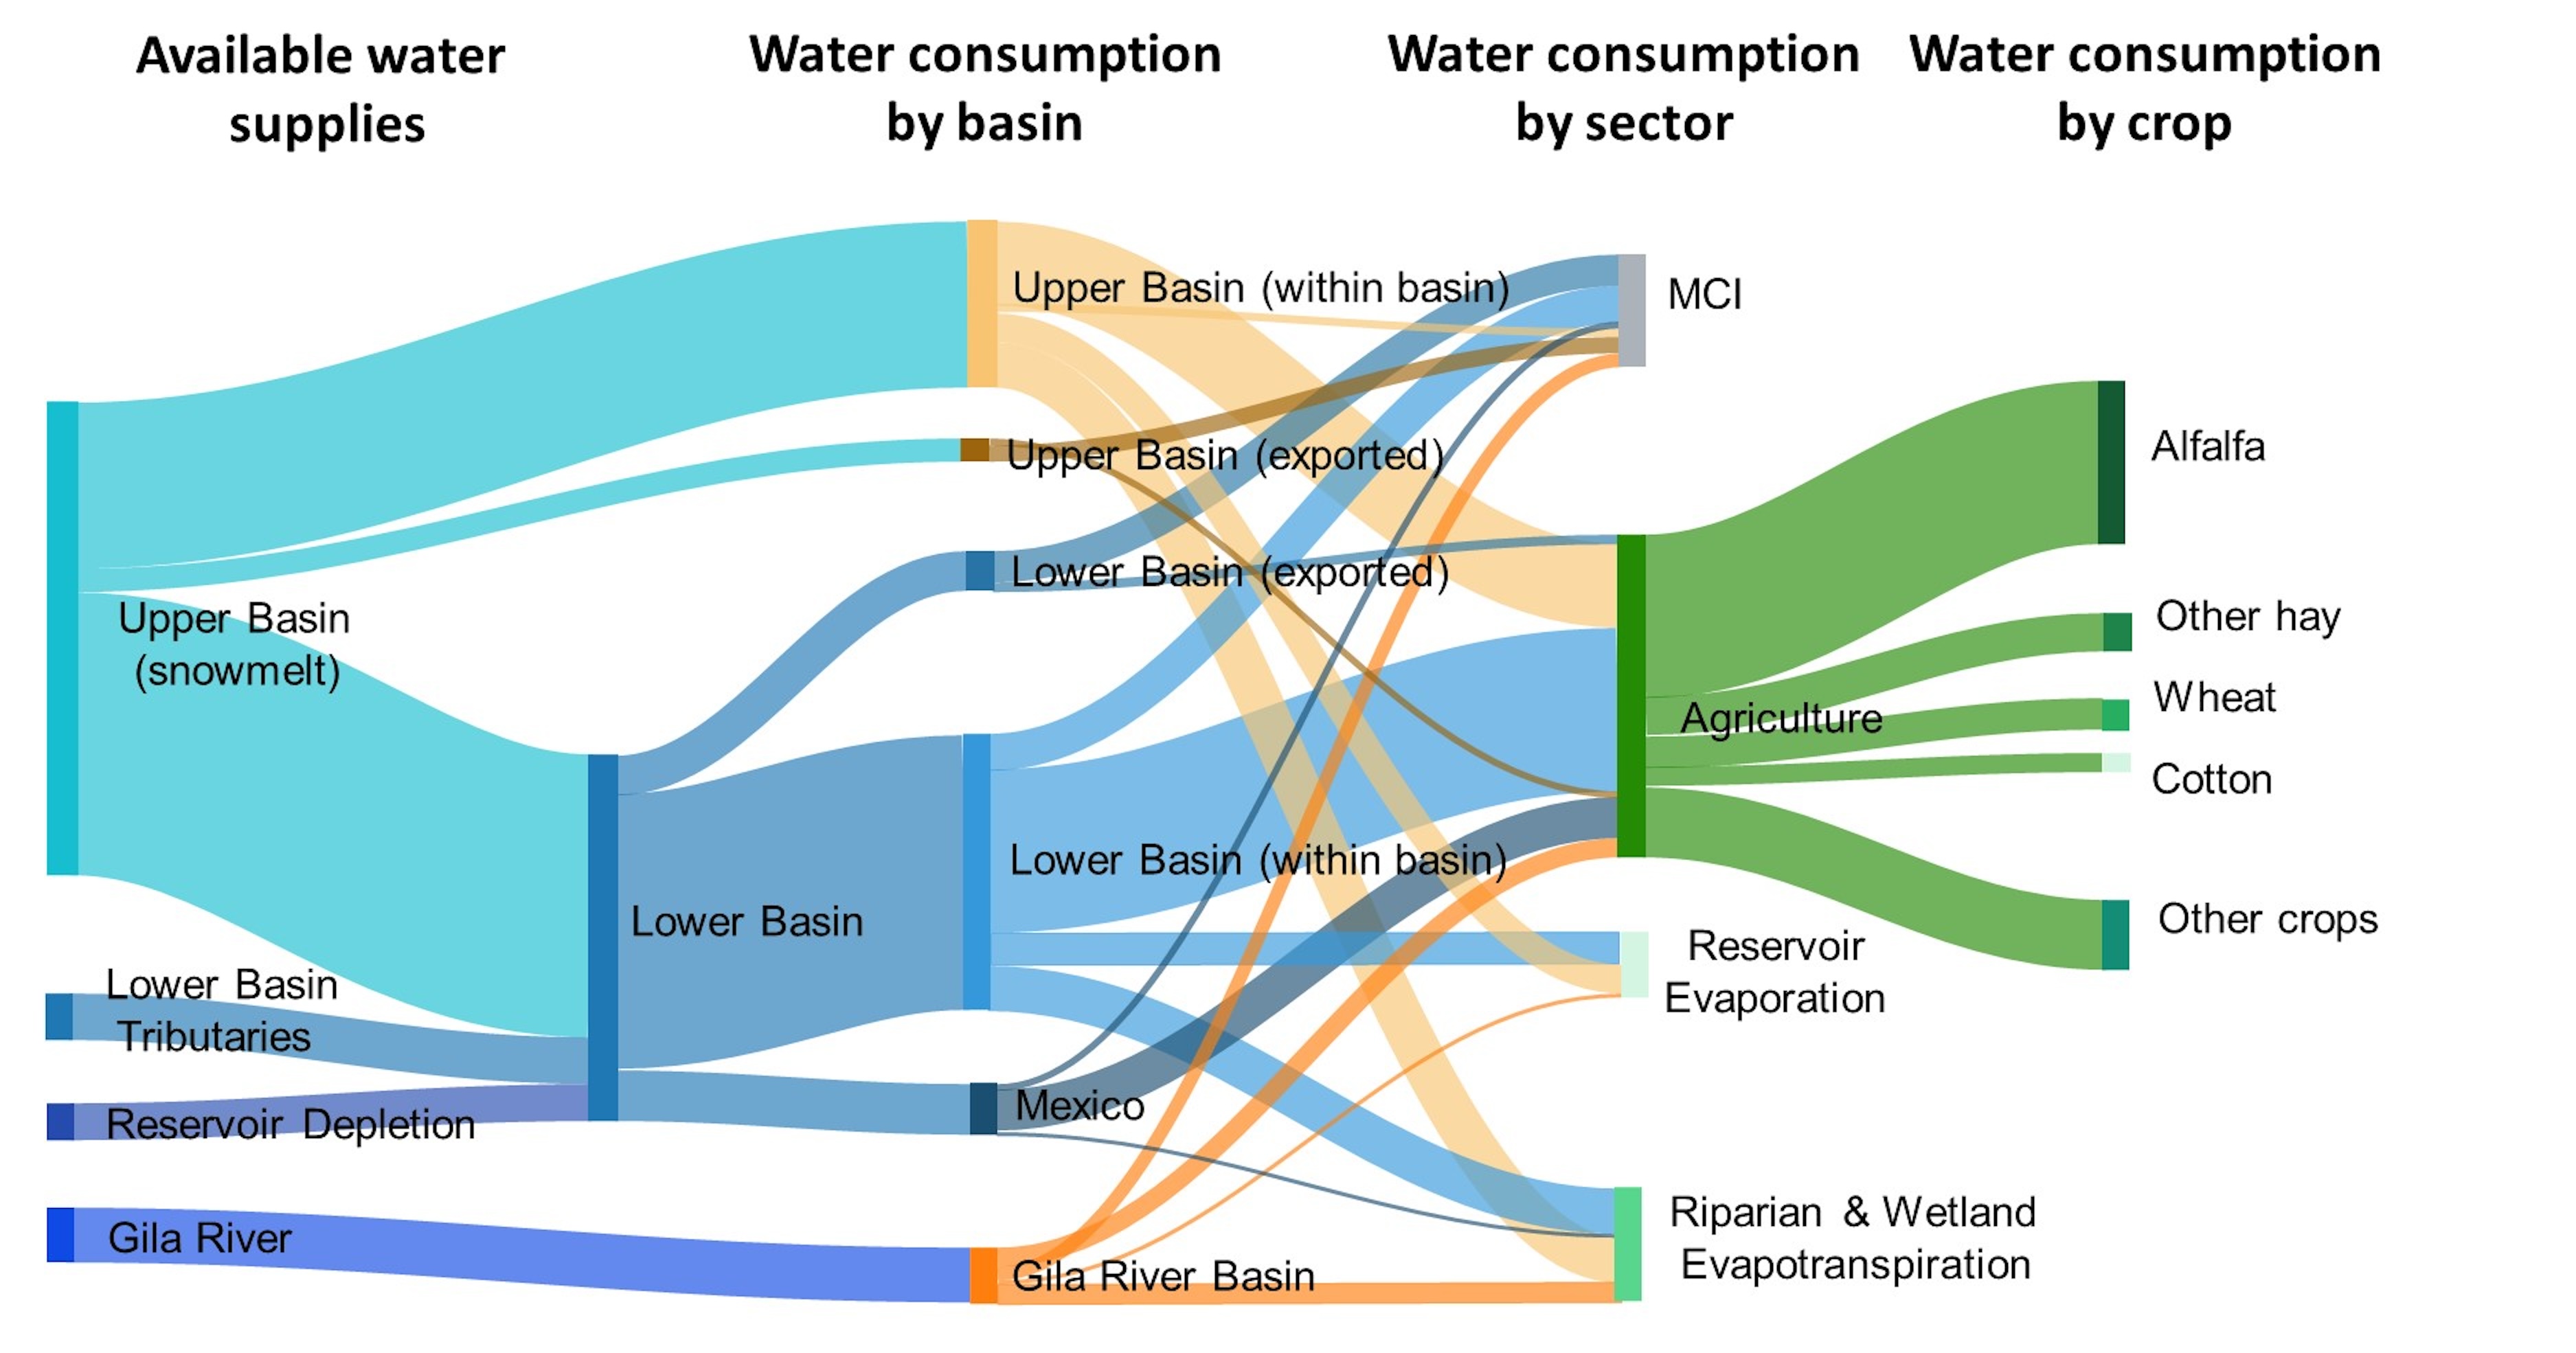
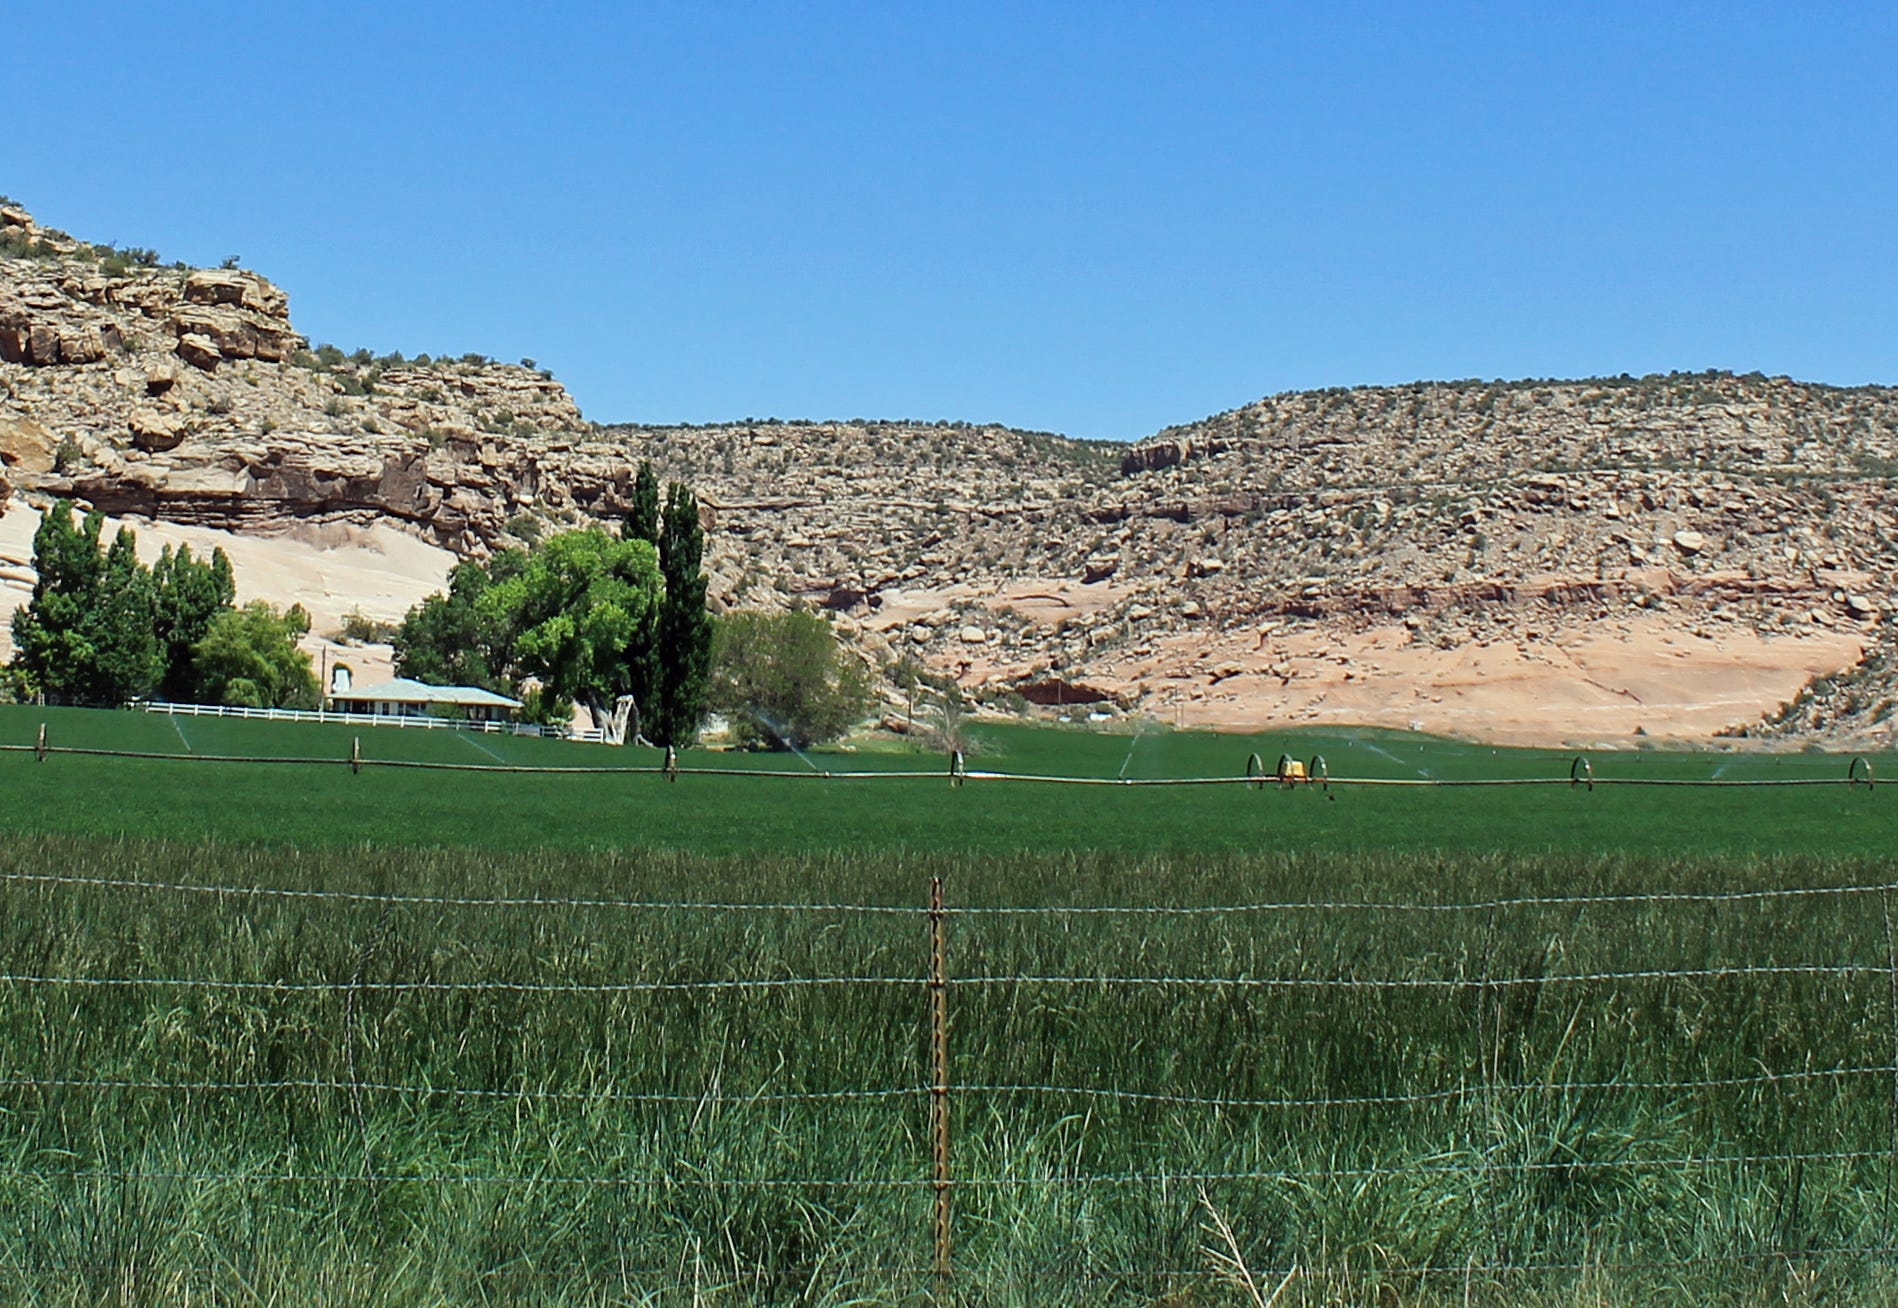
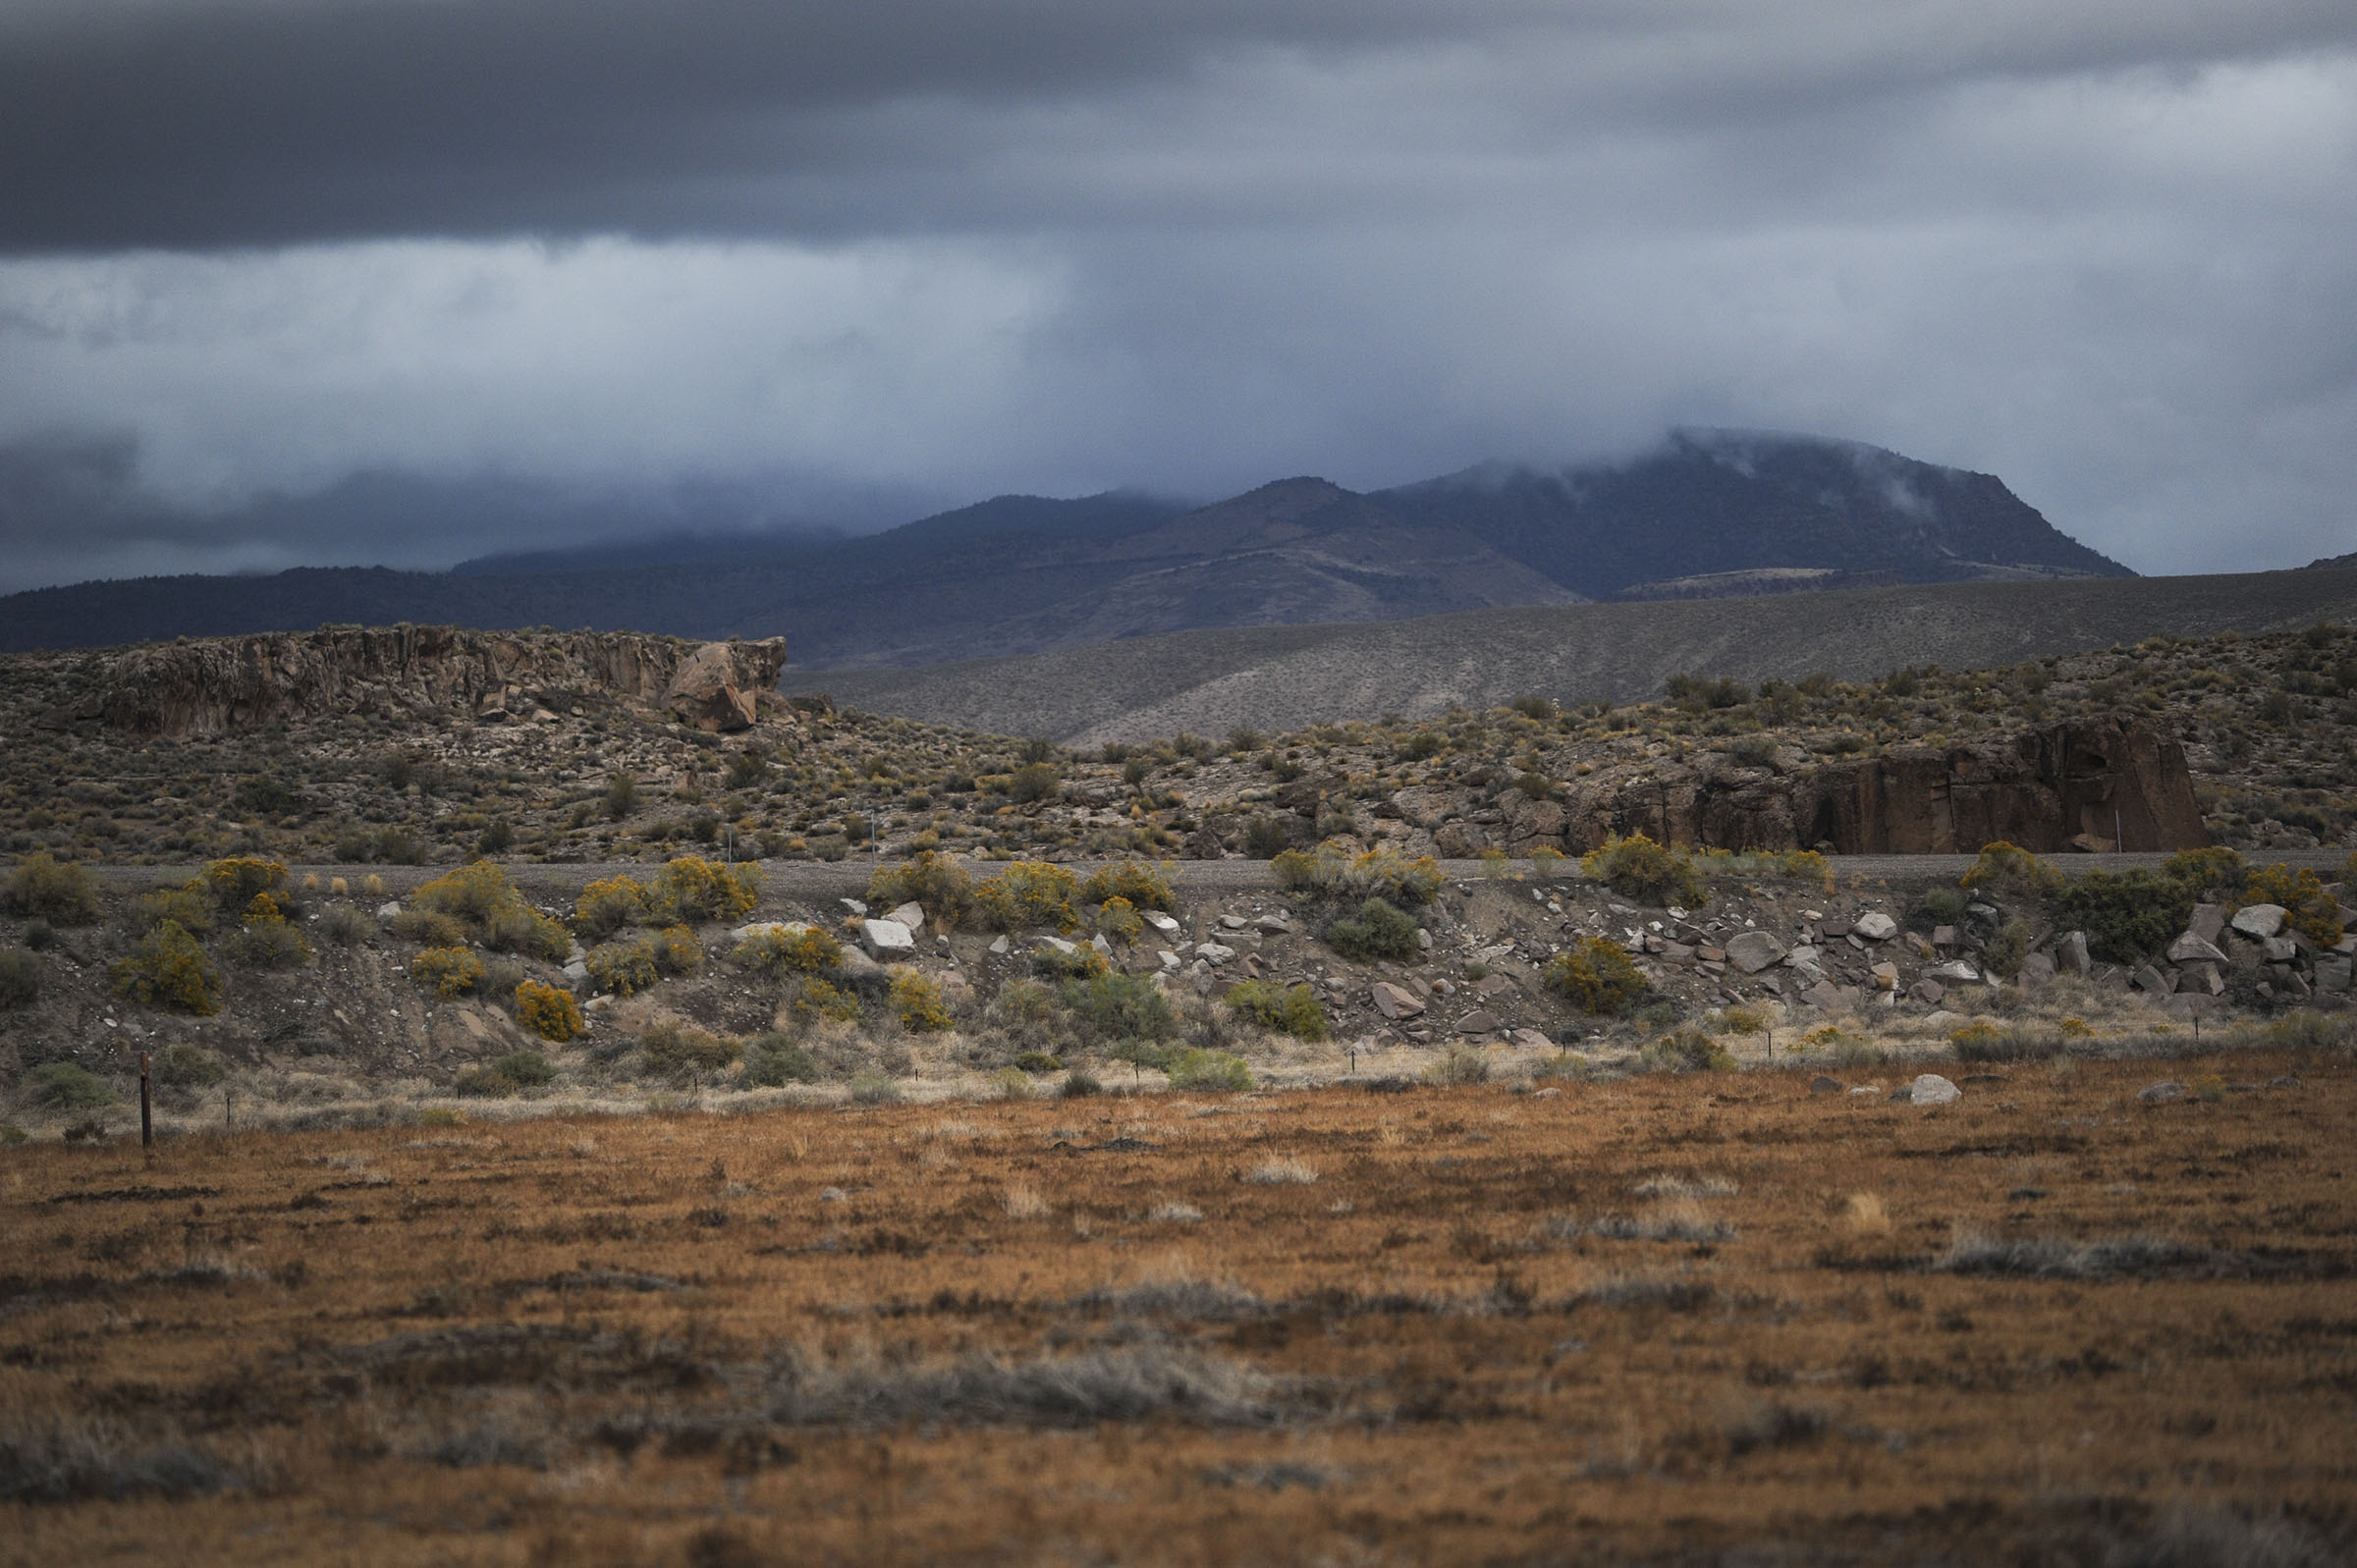

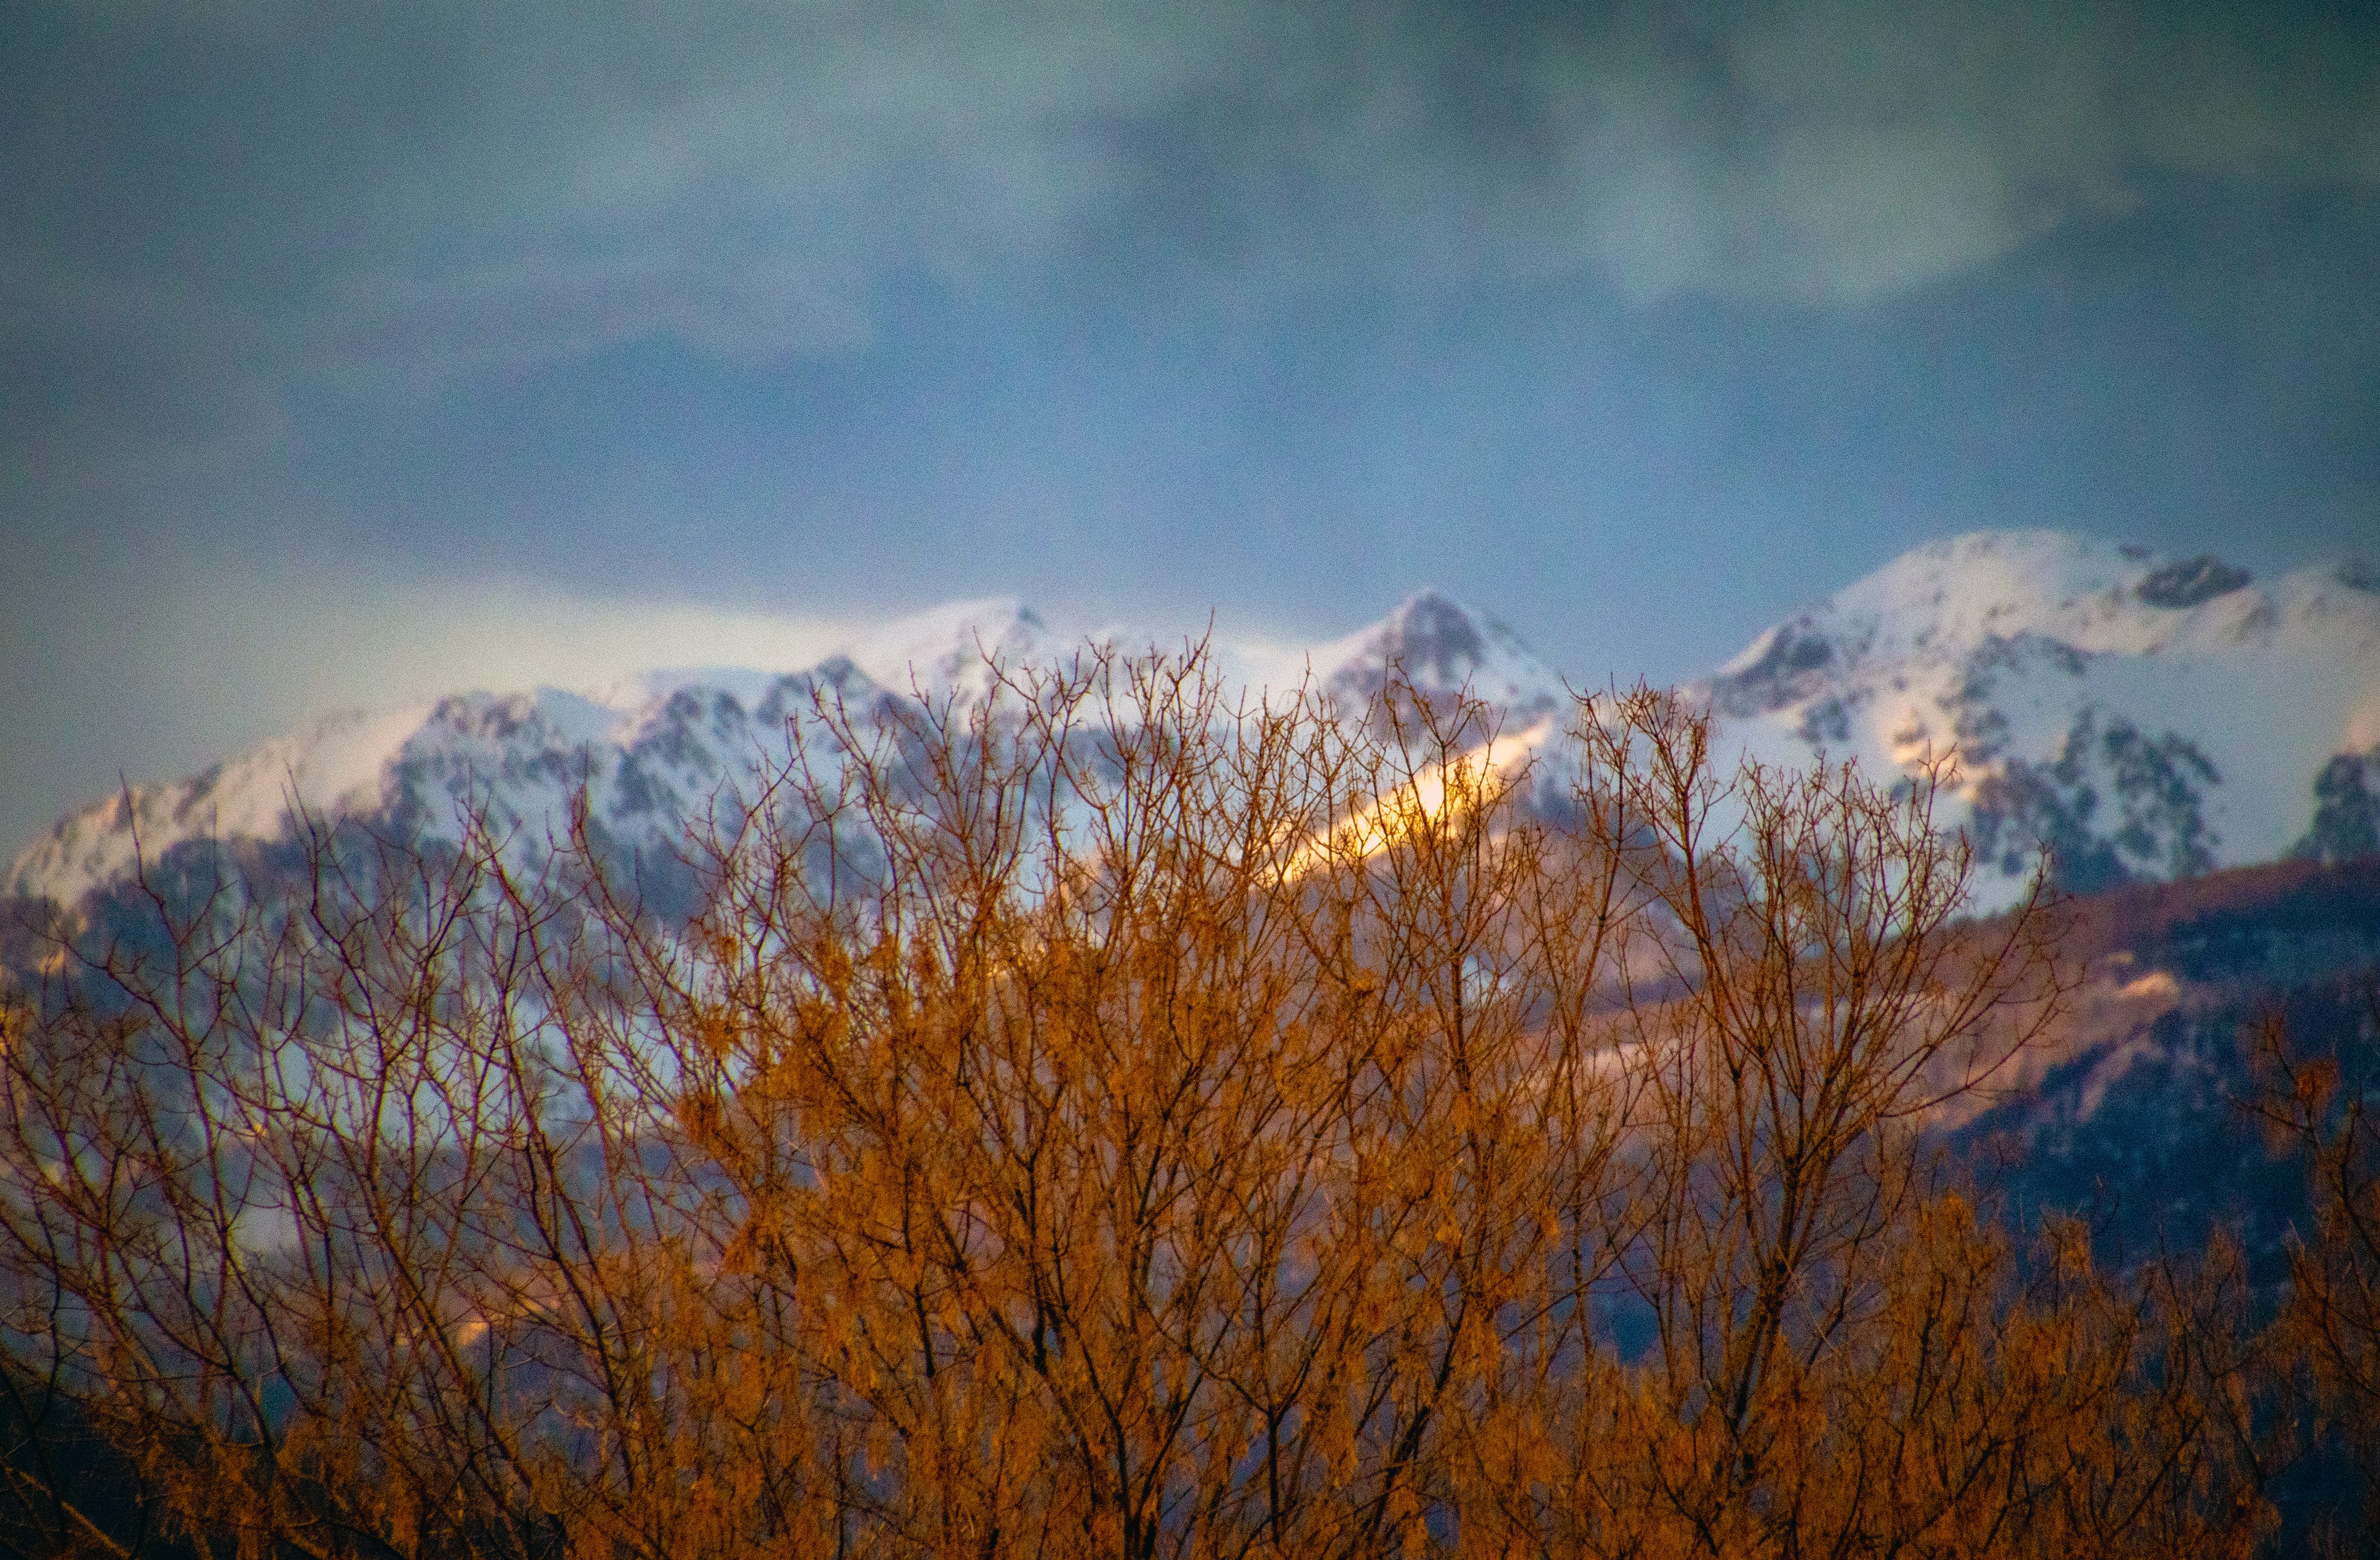
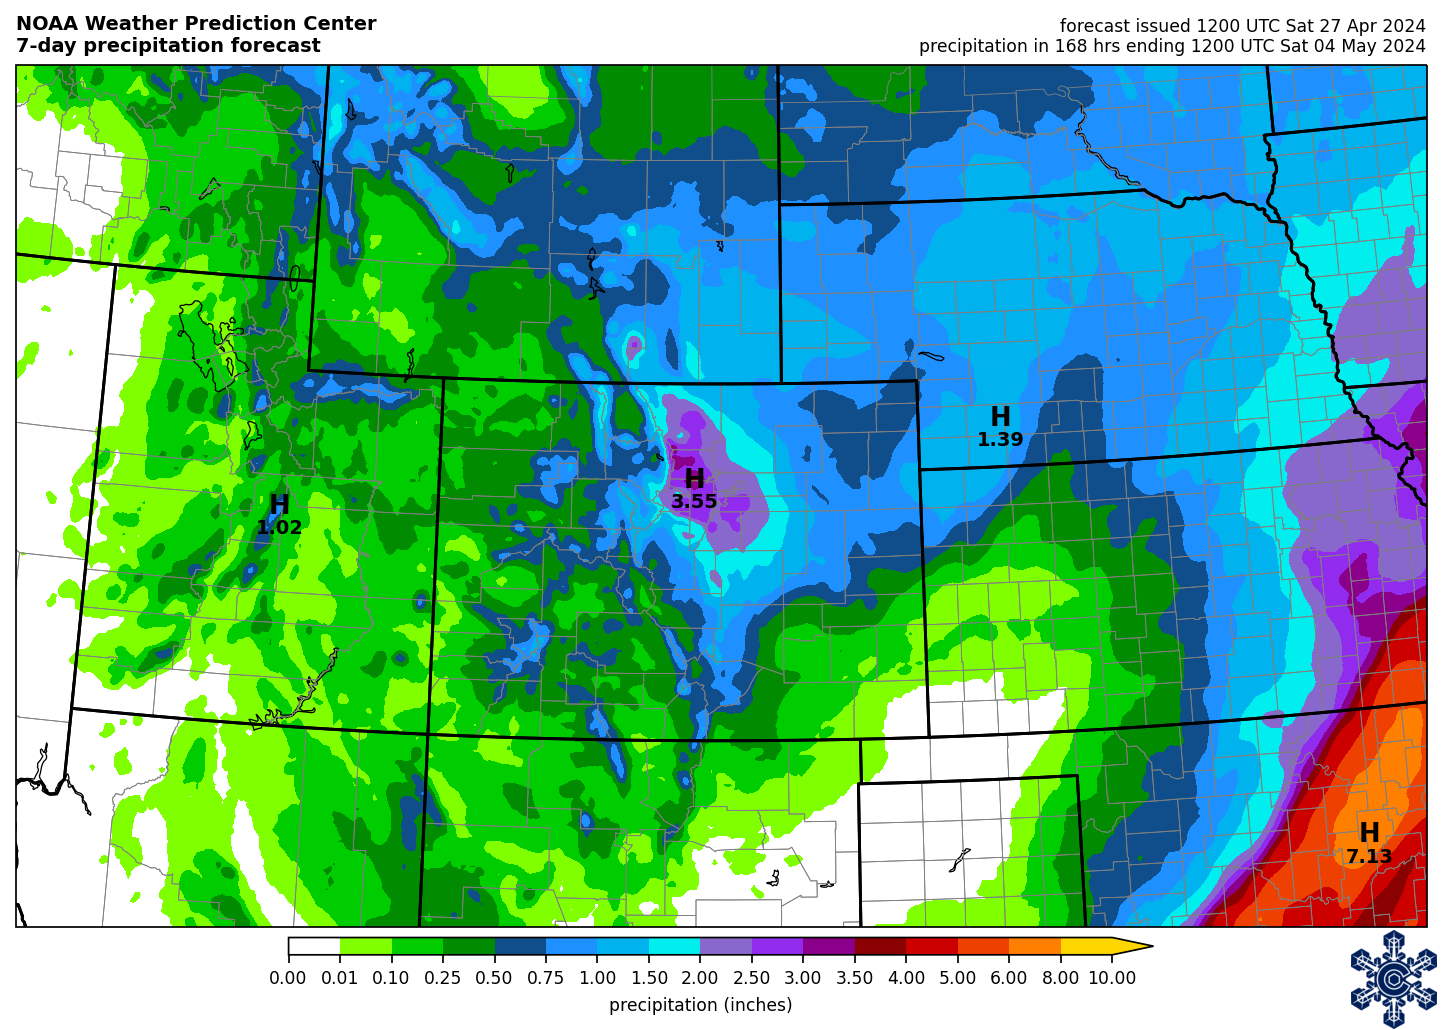