Hot Takes on a warming world — Jonathan P. Thompson (@Land_Desk)

North of Dove Creek, Abajo Mountains in the distance. Photo credit: Jonathan P. Thompson/The Land Desk

Click the link to read the article on The Land Desk website (Jonathan P. Thompson):

January 12, 2024

According to the myriad press releases I receive from the industrial self-care complex, we are in the thick of January Blues season — the downtime that follows the month of consumerism, er, the holidays. I don’t know about that, but I do know that ol’ Mother Snow must be feeling a little blue about the news these days. 

Sure, it finally snowed a fair amount in the Four Corners region, blanketing high and even lowlands with white, slicking up the roads, and freshening up the slopes.

In Durango, enough snow accumulated to allow nordic skiing at the Hillcrest golf course, my favorite winter health indicator. And, because the new snow fell on a weak, faceted base layer, it elevated avalanche hazard in some areas, including at the Palisades Tahoe ski resort in eastern California.

Placer County Sheriff’s Office on Instagram: “OLYMPIC VALLEY, Calif. — At approximately 9:30 a.m. today at Palisades Tahoe, an avalanche occurred on the Palisades side of the ski resort, specifically above the GS bowl area of KT-22. Olympic Valley Fire Department responded to Palisades Tahoe for word of an avalanche in the ski area. OVFD contacted ski patrol, who confirmed an avalanche in the GS Bowl of KT 22. OVFD began recruiting allied agencies and pooling resources in support of Palisades Ski Patrol efforts: OVFD, PCSO, and Palisades Tahoe. Placer County Sheriff’s Office assisted Olympic Valley Fire and Palisades Tahoe with the search and rescue operation. Tahoe Nordic Search and Rescue was activated along with allied agency partners and assets from the west side. PCSO is investigating the coroner’s case. The avalanche caused one fatality and one injury. Our thoughts and prayers are with their family members at this difficult time. No further missing persons have been reported. More than 100 Palisades personnel participated in a beacon search, and two probe lines have been completed. The mountain is closed for the remainder of the day. The avalanche debris field is approximately 150 feet wide, 450 feet long and 10 feet deep. We will update with more information as it becomes available. A press conference will be scheduled at 2:30 p.m. at Basecamp at Palisades Tahoe. WHAT: Palisades Tahoe avalanche incident press conference WHO: Olympic Valley Fire Department Chief Brad Chisholm, Placer County Sheriff’s Office Sgt. Dave Smith, Placer County Sheriff’s Office Lt. Don Nevins, Placer County District 5 Supervisor Cindy Gustafson WHERE: Palisades Tahoe, Basecamp Conference Room, 1960 Olympic Vly Rd, Olympic Valley, CA 96146 WHEN: Wednesday, Jan. 10, 2:30 p.m. #palisadestahoe #olympicvalley” JANUARY 12, 2024

And yet, it will take a constant barrage of such storms to pull much of the West out of the snow drought. Even if that does happen (and it’s still possible), the science is indicating that the winters we once knew are a thing of the past, and the snowpack — and water supplies — will keep getting thinner, on average, with each passing decade. So here are the hot takes on the hot world:

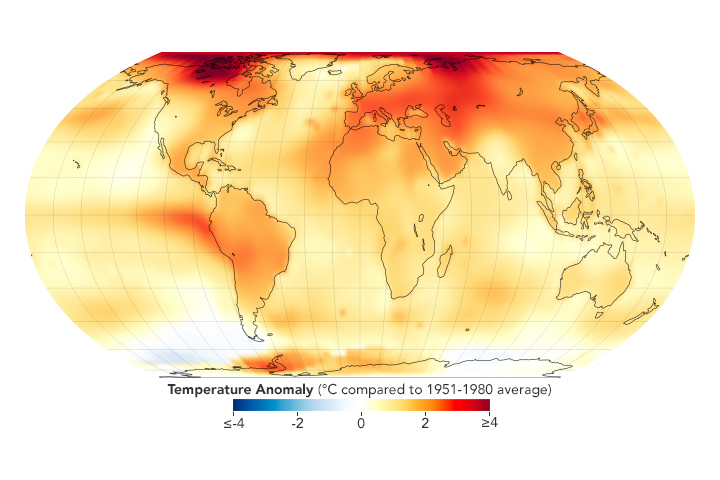
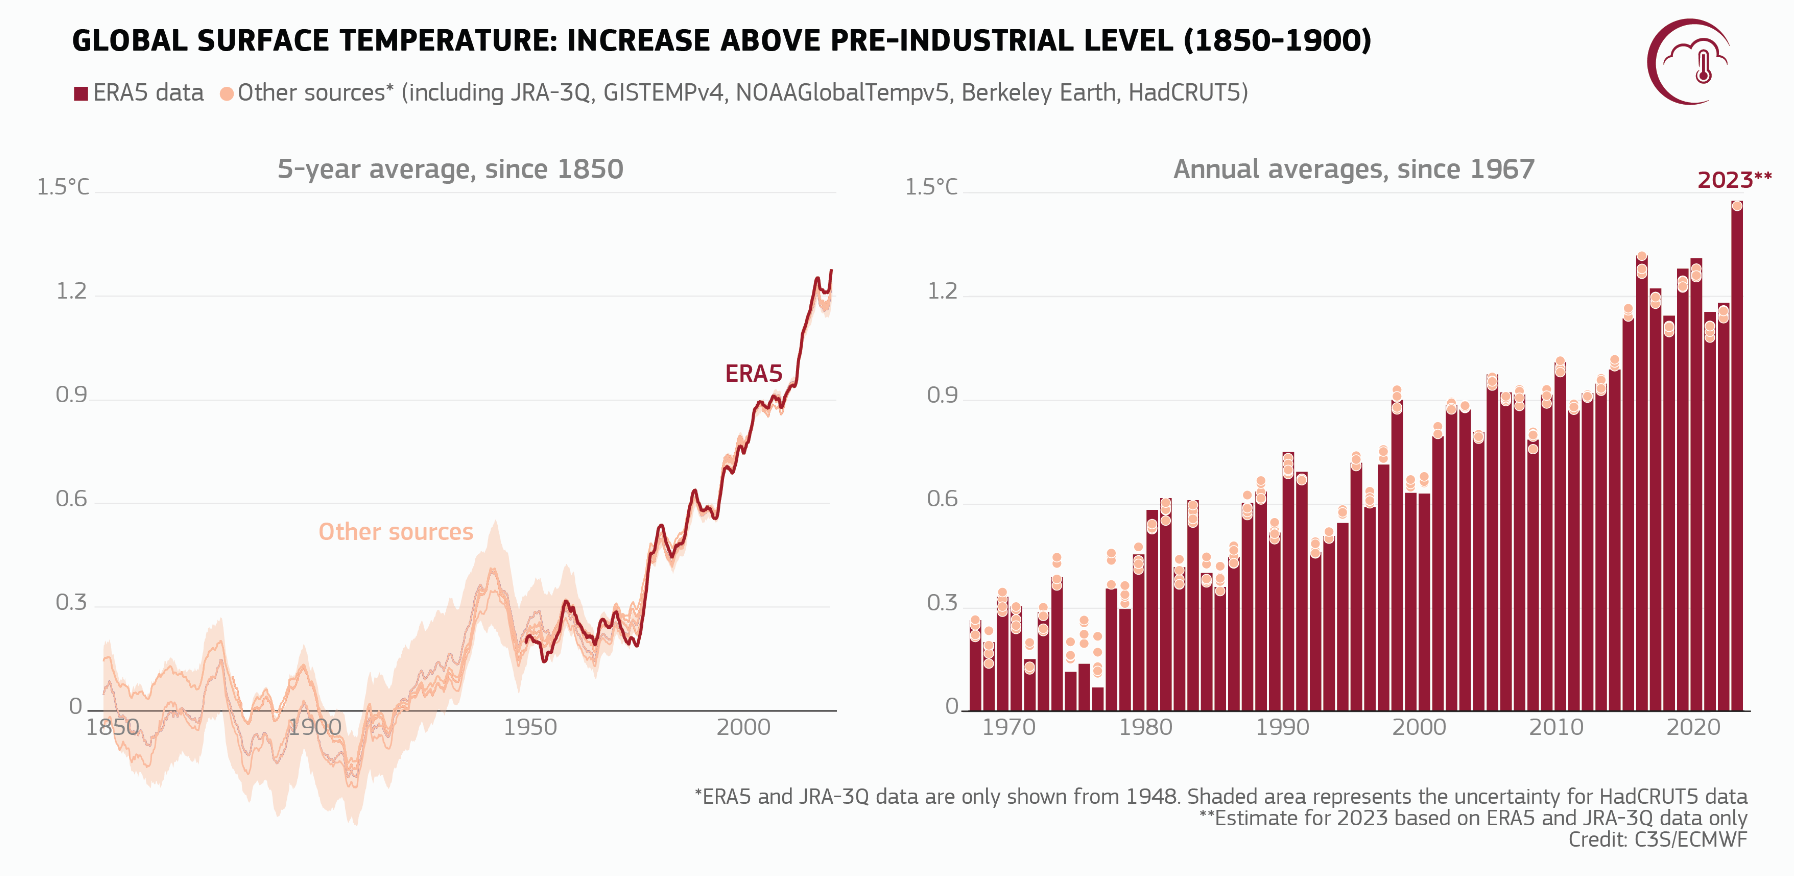
It’s now official: 2023 was the planet’s hottest year on record (going back to 1850). That’s according to the Copernicus Climate Change Service, which keeps tracks of this sort of thing. It was also the “first time on record that every day within a year has exceeded 1°C above the 1850-1900 pre-industrial level.” Some days in November were even 2 °C above the pre-industrial level. Yikes.

Earth was record warm in 2023.

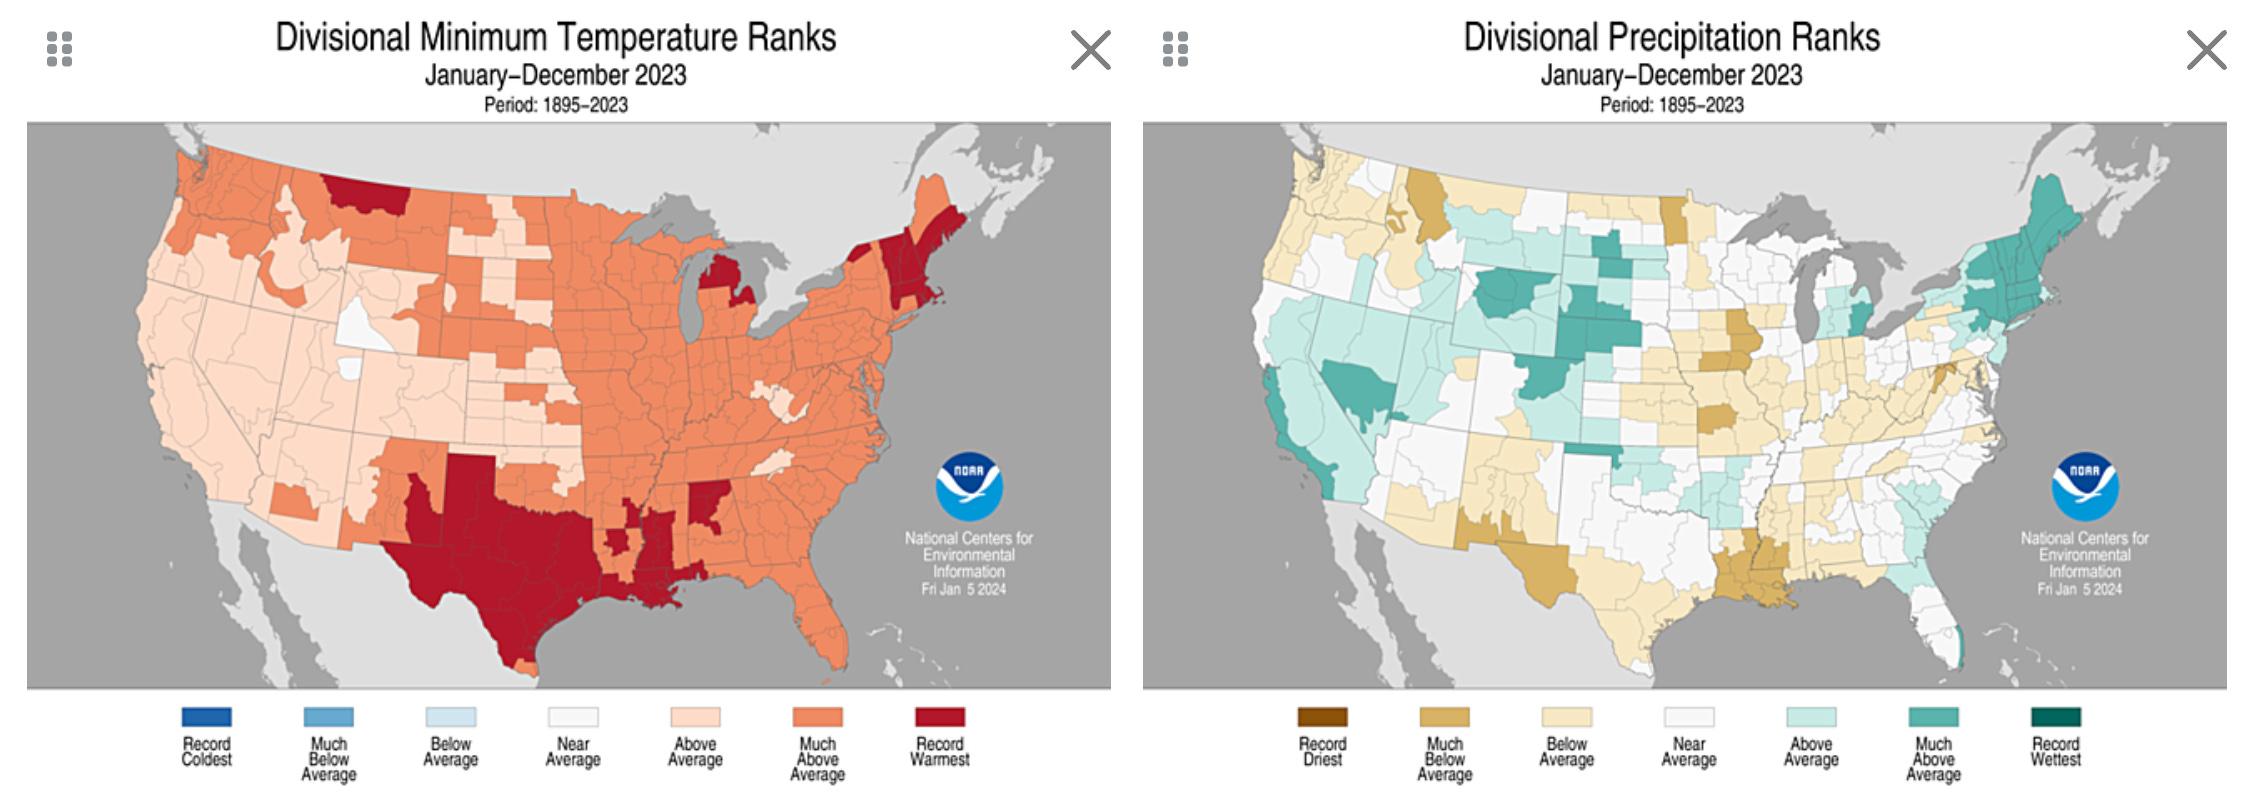
The U.S. didn’t experience its hottest year ever, but it was warmer than average(especially from July onward). The Western side of the country actually had it a bit better than Texas and the East; we were merely “above average” for the year. Balancing it out, much of the West also got above average precipitation. Unfortunately the Four Corners, after a bountiful winter, got robbed of the big monsoon come summer, bringing levels down to average and even below that in New Mexico, where the drought persists. December was especially warm and dry across most of the West and was even the hottest December ever in the Upper Midwest and Northern Rockies.

Overnight, minimum temperatures keep getting warmer, even more so than the maximum daytime highs. Source: NOAA

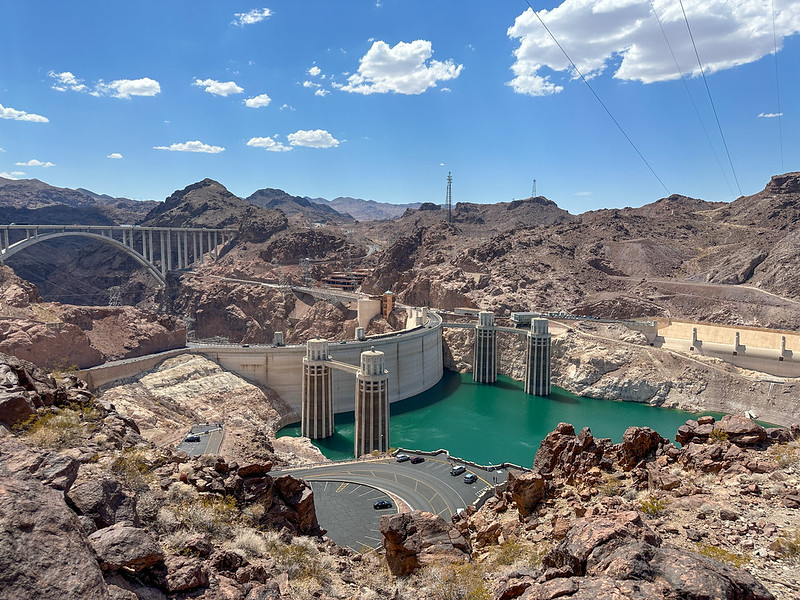
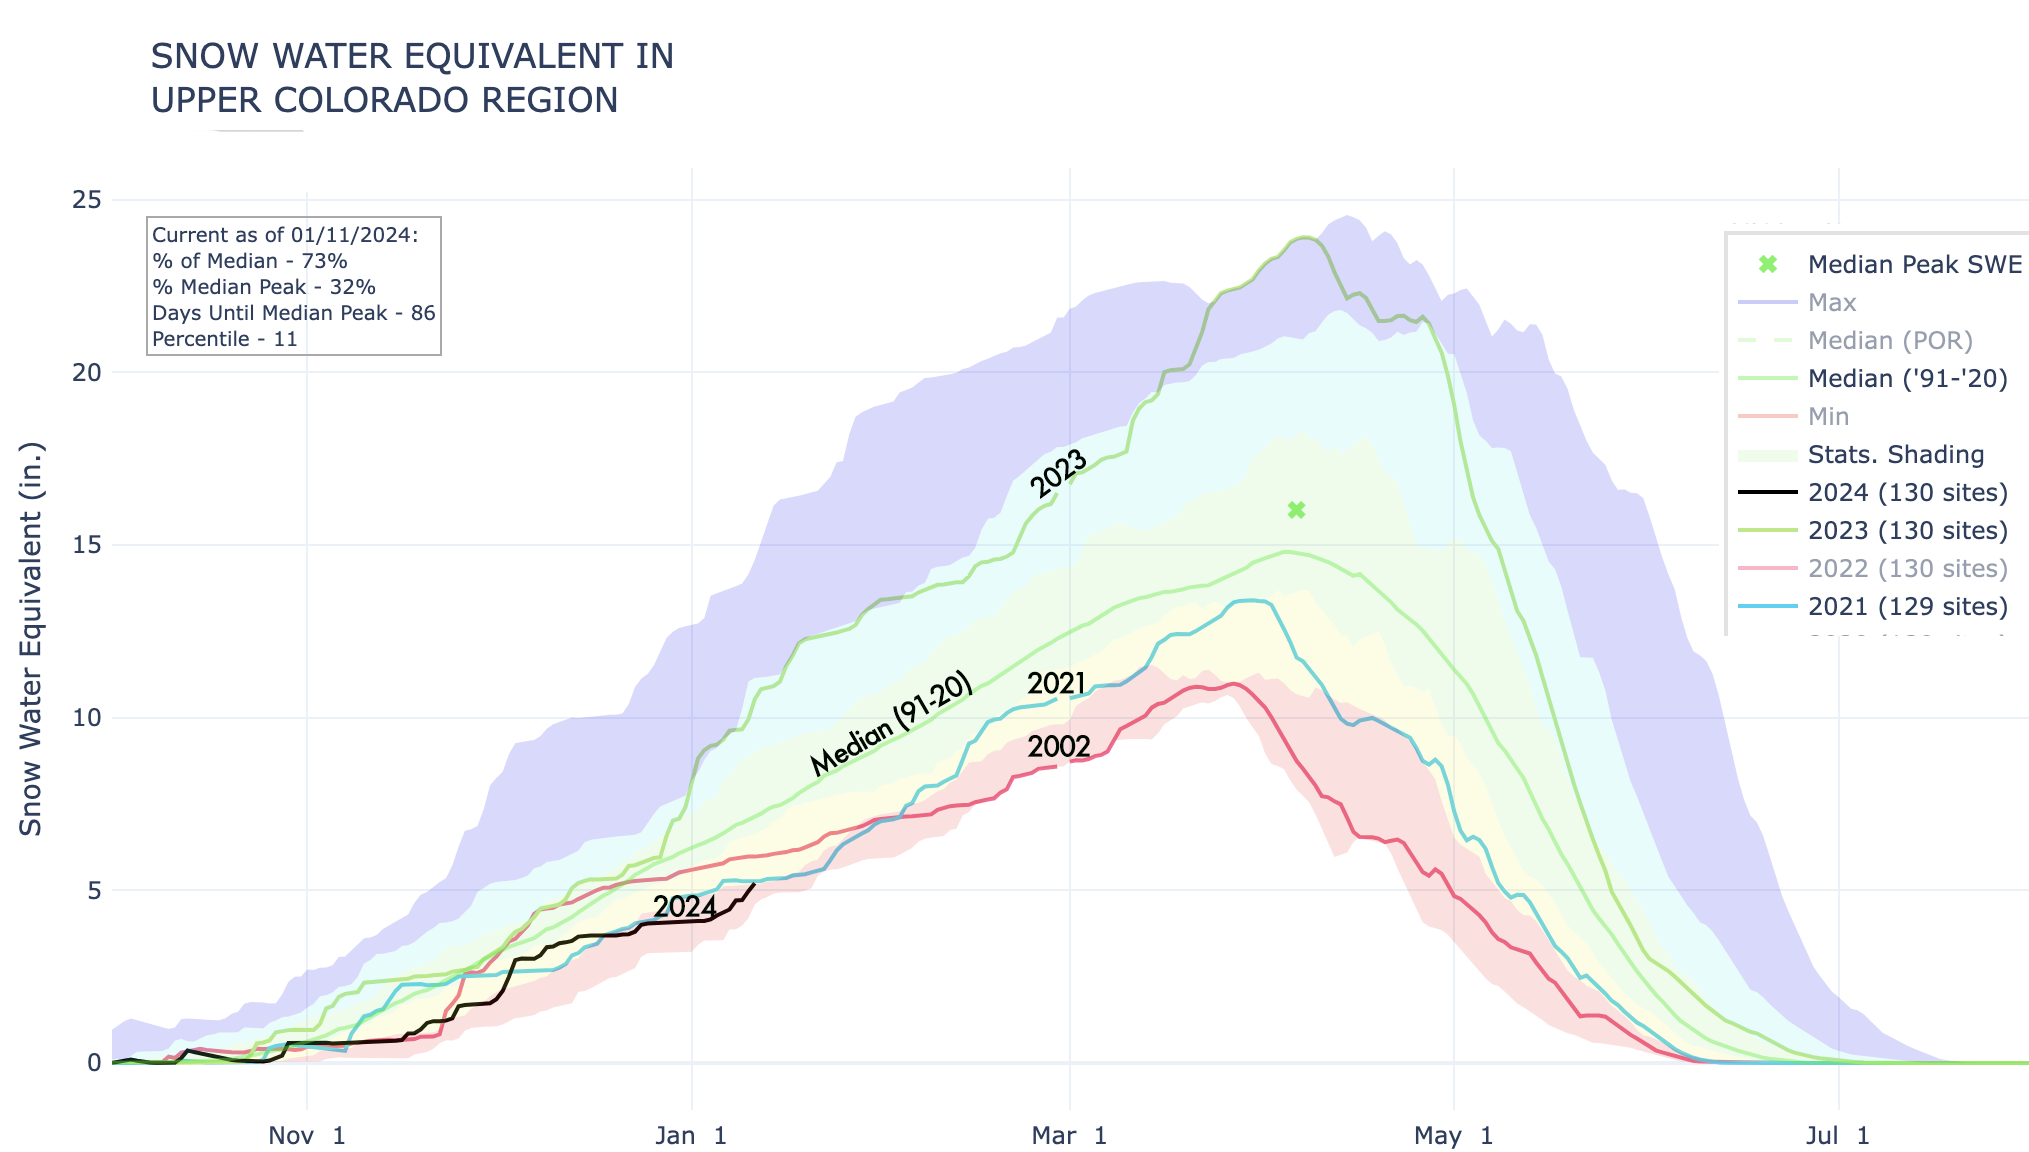
And a warm and dry December brings the January snowpack blues to the mountains that feed the Colorado River. The 130 SNOTEL stations in the Upper Colorado River Basin are recording a snowpack on a par with the dismally dry 2021 winter, which brought Lake Powell down to crisis levels. The snowpack is even thinner than it was on this date in 2002. Ack! Still, check out the trajectory for 2023: After an average beginning, winter really took off from January into about mid-April. So there’s still time for a recovery. Really.

Overnight, minimum temperatures keep getting warmer, even more so than the maximum daytime highs. Source: NOAA

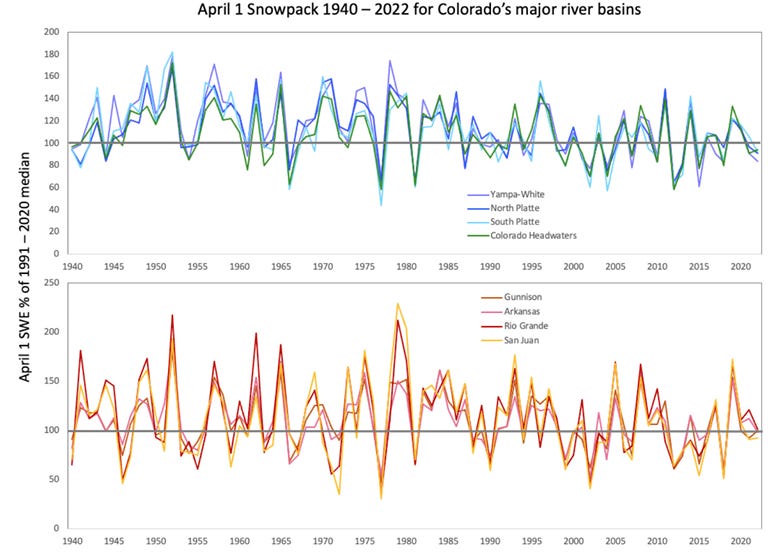
That aligns with the findings of a new peer-reviewed study recently published in Nature, showing that human-caused warming has been shrinking mountain snowpacks globally since at least 1981. The findings are nuanced: The shrinkage isn’t happening everywhere (colder areas are less vulnerable to the rising temperatures, so far), it’s happening at different rates in different places, and it isn’t always attributable to human-caused global warming. In fact, while the Rio Grande has “suffered large historical snowpack declines of over 10% per decade … there is little agreement that forced temperature and precipitation changes have caused those declines, reinforcing the notion that low-frequency variability can overwhelm forced signals in snow and hydroclimate, even on multidecadal timescales.” The Colorado River Basin’s snowpack has also shrunk at a rapid rate, and in that case the authors did find a link to anthropogenic global warming. And because of the nonlinear sensitivity of snow to warming, the future may be even less snowy. I’ll let the authors explain:

Under Shared Socioeconomic Pathway (SSP) 2–4.5, a ‘middle-of-the-road’ emissions scenario, the most highly populated basins are expected to see strong declines in spring runoff as a result of nonlinear snow loss, even in the face of relatively modest warming projected in those regions. The western USA, for example, is poised to see particularly sharp spring runoff declines in the upper Mississippi (84 million people, 30.2% spring runoff decline), Colorado (14 million, 42.2%), Columbia (8.8 million, 32.7%) and San Joaquin (6.8 million, 40.9%) river basins.

And, yes, Colorado’s snows and streamflows will be a victim of this same phenomenon, according to the latest climate change report for the Colorado Water Conservation Board. The report finds:

  • Statewide annual average temperatures warmed by 2.3°F from 1980-2022 — with a strong link to human influence on climate — with the greatest warming occurring in the south-central and southwestern parts of the state, and during the fall.
  • By 2050 statewide temperatures are projected to warm by 2.5°F to 5.5°F compared to the 1971 baseline, making the average year in the 2050s and beyond warmer than the hottest years on record now. 
  • Precipitation has decreased 22% in southwestern Colorado and 20% in northwestern Colorado since the 1951-2000 period, but the future trends are less clear than temperatures — precipitation may even increase by as much as 7%, with the largest gains during winter, though more of it is likely to fall as rain. 
  • Snowpack has also decreased and future warming likely will lead to further reductions, even if precipitation increases, and the seasonal snowpack peak is projected to shift earlier by as much as several weeks by 2050, which could be accelerated by increased dust-on-snow events.
April 1st snowpack by major river basin. Credit: The Land Desk
  • A shrinking snowpack and earlier runoff will further diminish streamflows. 
  • Soil moisture has generally been on the decline in high-elevations since 1980 and future warming is expected to lead to future decreases in summer soil moisture, which can, in turn, exacerbate warming. 
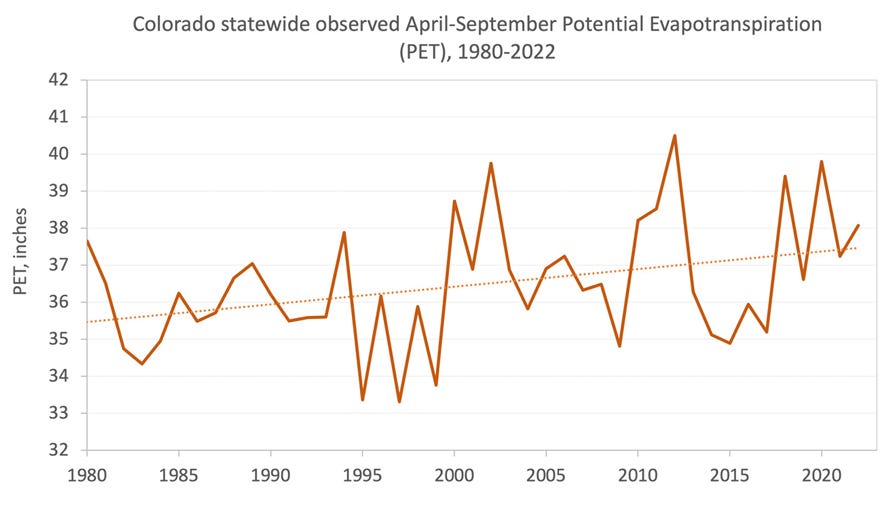
  • Warming has driven greater evaporative demand — or atmospheric thirst — over the last four decades, this means crops will need more irrigation to thrive, increasing water consumption even as water supplies dwindle.
Potentail Evapotraspiration (PET) 1980-2022. Credit: The Land Desk

Well, if you didn’t already have the January Blues (or didn’t even know such a malady existed), you just might have them now. I’m sorry, but it will help to go up to the golf course and do some nordic skiing, I promise. And for more on the Colorado climate report read Heather Sackett’s excellent piece for Aspen Journalism.

Five Factors to Explain the Record Heat in 2023 — NASA Earth Observatory

Earth was record warm in 2023. Credit: NASA Earth Observatory

Click the link to read the article on the NASA Earth Observatory website:

NASA announced that 2023 was the hottest year on record, according to an analysis of annual global average temperatures by the Goddard Institute for Space Studies. Scientists who maintain the temperature record, which begins in 1880, calculate a global temperature anomaly each year to determine how much temperatures have changed compared to temperatures from 1951–1980.

Every month from June through December 2023 came in as the hottest month on record. July ranked as the hottest month ever recorded.

But what caused 2023, especially the second half of it, to be so hot? Scientists asked themselves this same question. Here is a breakdown of primary factors that scientists considered to explain the record-breaking heat.

The long-term rise in greenhouse gases is the primary driver.

For more than 100 years, humans have been burning fossil fuels such as coal, gas, and oil to power everything from lightbulbs and cars to factories and cities. These actions, along with changes in land use, have led to a rise in greenhouse gases in the atmosphere. Greenhouse gases act like a blanket trapping heat around the planet. The more of them you add, the thicker that blanket becomes, further heating Earth.

Carbon Dioxide swirling around the Earth. Credit: NASA Earth Observatory

In May 2023, carbon dioxide concentrations in the atmosphere peaked at 424 parts per million at NOAA’s Mauna Loa Observatory, Hawaii. The annual peak has been steadily rising since measurements began in 1958. (Other global carbon measurement projects showed similarly high numbers.) Extending the record back even further with ice cores, carbon dioxide concentrations are the highest they have been in at least 800,000 years.

“We’re going to continue to have records be broken because the baseline temperature is moving up all the time,” said Gavin Schmidt, director of NASA’s Goddard Institute for Space Studies in New York City. “The cause of that warming trend over the last 50 to 60 years is dominated by our changes to greenhouse gases, particularly carbon dioxide and methane.”

The return of El Niño added to the heat.

On top of the long-term global warming trend are natural variations in the climate. One of the largest sources of such year-to-year variability is the El Niño Southern Oscillation (ENSO), which occurs in the tropical Pacific.

June 1 – 10, 2023. Credit: NASA Earth Observatory

ENSO transitions between three phases: El Niño, La Niña, and neutral, or average. During El Niño, trade winds weaken; that is, winds that normally blow from east to west in the tropical Pacific weaken. The sea surface around the equator in the central and eastern Pacific near South America also becomes warmer (and higher) than normal. El Niño often coincides with the warmest years in the global average.

During La Niña, the opposite happens: the trade winds strengthen and the sea surface temperatures in the eastern Pacific are cooler than normal. This can help offset some of the rising temperatures from long-term global warming.

From 2020–2022, the Pacific saw three years of La Niña conditions. Then El Niño returnedbeginning in May 2023. This El Niño has not yet been as strong as those in 2015–2016 or 1997–1998, both of which caused large global average temperature spikes. However, when you add this ocean warming to the long-term warming trend from greenhouse gases, the start of El Niño helped temperatures jump enough to create a new record for heat.

“For the most part, it’s us and El Niño,” said Josh Willis, a climate scientist at NASA’s Jet Propulsion Laboratory. “At the end of the day, humans are heating the planet, and El Niño is dancing on our heads.”

Globally, long-term ocean warming and hotter-than-normal sea surface temperatures played a part.

Looking more broadly, the tropical Pacific wasn’t the only part of the ocean that was hotter than normal this year. The global sea surface temperature set new records in 2023, with the North Atlantic and other parts of the ocean experiencing several marine heat waves.

August 21, 2023. Credit: NASA Earth Observatory

“Just like global temperatures, ocean temperatures are on the rise,” said Willis. “They have been rising for the last century or more, and they are not slowing down. If anything, they are speeding up.”

What’s behind the rise in ocean temperatures? Greenhouse gases warming the planet. Around 90 percent of the heat trapped by rising greenhouse gases is absorbed by the ocean. That means that as greenhouse gases continue to increase, so will ocean temperatures, which raises temperatures across the globe.

Aerosols are decreasing, so they are no longer slowing the rise in temperatures.

Another global trend that scientists are monitoring is a change in aerosols in the atmosphere. Aerosols are small particles in the air—such as smoke, dust, volcanic gases, sea spray, air pollution or soot—that can impact the climate. Airborne particles can either reflect sunlight, causing a slight cooling of the air, or absorb sunlight, causing a slight warming of it.

June 26, 2023. Credit: NASA Earth Observatory

As governments have passed regulations to reduce air pollution and improve air quality, the abundance of aerosols has been decreasing in most areas. Many of these human-produced particles are the type that cool the climate slightly, so with less of them in the air, the result is a slight warming effect. But this contribution is quite small in comparison to the much greater warming from rising greenhouse gases.

Scientists at NASA and around the world are investigating how a reduction in aerosols from new shipping regulations potentially change how much solar energy is reflected back into space. While these changes can be notable on regional scales, the global impact is likely small, Schmidt said.

Scientists found that the Hunga Tonga-Hunga Ha‘apai volcanic eruption did not substantially add to the record heat.

In January 2022, the eruption of the Hunga Tonga-Hunga Ha‘apai undersea volcano blasted an unprecedented amount of water vapor and fine particles, or aerosols, into the stratosphere. Water vapor, a greenhouse gas, can produce a warming effect on the atmosphere, so scientists investigated the impact of the eruption on the global temperature. Sulfate aerosols from eruptions, on the other hand, have sometimes led to some global cooling events.

Hunga Tonga-Hunga Ha‘apai volcanic eruption. Credit: NASA Earth Observatory

recent study found that the volcanic sulfate aerosols reflected some sunlight away from Earth’s surface, leading to a slight cooling of less than 0.1 degrees in the southern hemisphere following the eruption. Essentially, the warming that occurred from the increase in water vapor in the stratosphere was offset by the cooling caused by volcanic sulfate aerosols leading to a slight cooling lower in the atmosphere. This means the eruption likely did not add to the record heat in 2023.

“We are very interested in the weather and extremes of any particular year because those are the things that impact us,” said Schmidt. “But the key difference between this decade and the ones before is that the temperatures keep rising because of our activities, principally the burning of fossil fuels.”

NASA Earth Observatory map (top) by Lauren Dauphin, based on data from the NASA Goddard Institute for Space StudiesCarbon dioxide animation by Helen-Nicole Kostis, NASA’s Scientific Visualization Studio. Sea surface height anomaly map by Lauren Dauphin, using modified Copernicus Sentinel data (2023) processed by the European Space Agency and further processed by Josh Willis, Severin Fournier, and Kevin Marlis/NASA/JPL-Caltech. Sea surface temperature anomaly map by Lauren Dauphin, using data from the Multiscale Ultrahigh Resolution (MUR) project. Wildland fire smoke image by Lauren Dauphin, using Terra MODIS data from NASA EOSDIS LANCE and GIBS/WorldviewEruption image courtesy of NOAA and the National Environmental Satellite, Data, and Information Service (NESDIS). Story by Angela Colbert (NASA JPL), with Sally Younger (NASA JPL).

References & Resources

Understanding Water Supply Forecast Error on the #ColoradoRiver — NOAA #COriver #aridification

The current water level of Lake Mead behind the Hoover Dam July 2023. Photo credit: Reclamation

Click the link to read the article on the NOAA website (Peter Goble, Russ Schumacher):

January 9, 2024

The Colorado River is perhaps the most critical resource to the southwestern United States, providing water to over 40 million people. In an average year, over half of this water comes from western Colorado, primarily in the form of snowmelt when high-elevation seasonal snowpack dissipates in the spring.

The Colorado River has been managed with a large series of reservoirs. Seasonal water supply forecasts made by agencies like the Colorado Basin River Forecast Center (CBRFC) and the National Resources Conservation Service (NRCS) using data from high-elevation Snowpack Telemetry (SNOTEL) stations offer water managers insight into how much water to expect each year. These forecasts allow for less uncertainty and better management of these important reservoirs. 

However, 2020 and 2021 were low water supply years, much lower than one would expect based on snowpack values alone. Researchers from the Colorado Climate Center questioned whether very low, if not record low, soil moisture levels at high elevation were causing a smaller fraction of snowmelt to runoff than in a normal year, and further,  whether these conditions are likely to occur more frequently in a warmer climate. “On the Sources of Water Supply Forecast Error in Western Colorado” is the result of a research project funded by NOAA’s National Integrated Drought Information System (NIDIS) to explore this question.

The research team created hindcasts of April–August streamflows using SNOTEL snowpack and precipitation data from 1981–2021, inputting modeled soil moisture and groundwater data to predict streamflow. In this case, “hindcast” refers to a prediction of streamflow in a previous subset of years using a statistical model that was trained based on a separate subset of years. In this way, the researchers mimicked an actual water supply forecasting environment without including the known answer into the model (See the AMS article for a more detailed explanation of the methods).

The researchers paid special attention to hindcasts using the data available on April 1. April 1 is near peak snowpack season, and these numbers have historically been used as a benchmark for how much water to expect in the coming spring. In 2021, for instance, adding soil moisture data from the Western Land Data Assimilation System’s km resolution land surface model reduced April 1 streamflow hindcast in all four major basins, and lowered hindcast error across the board. 

Results indicate that a much larger fraction of the error in the hindcast is attributable to the weather that occurs after April 1 and 2021 was no exception. While antecedent soil moisture conditions were record-low in western Colorado, 2021 also had a much drier-than-normal spring for western Colorado with a record dry April. This was not well predicted or incorporated in operational streamflow forecasts. April 1 numbers do not tell the whole story, because what happens before the snowpack season, and what happens from April 1 through early June, also have a marked impact on the year’s water supply. 

The findings from this study are important because they establish a ceiling for how skillful we can expect water supply forecasts to be without significant, successful investments in sub-seasonal to seasonal forecasting over the Intermountain West. Soil moisture data can be implemented more effectively in the future and incrementally lower water supply forecast error for this crucial region. However, with time, larger-scale errors in sub-seasonal to seasonal prediction will need to be addressed to create a consistently accurate forecast of water supplies.