Assessing the U.S. #Climate in 2024 — NOAA #ActOnClimate

Image Courtesy of Jake Fortune, NOAA NCEI

Click the link to read the article on the NOAA website:

January 10, 2025

2024 was the warmest year on record for the contiguous U.S.; Hurricane Helene was the seventh-most-costly Atlantic hurricane on record

Key Points:

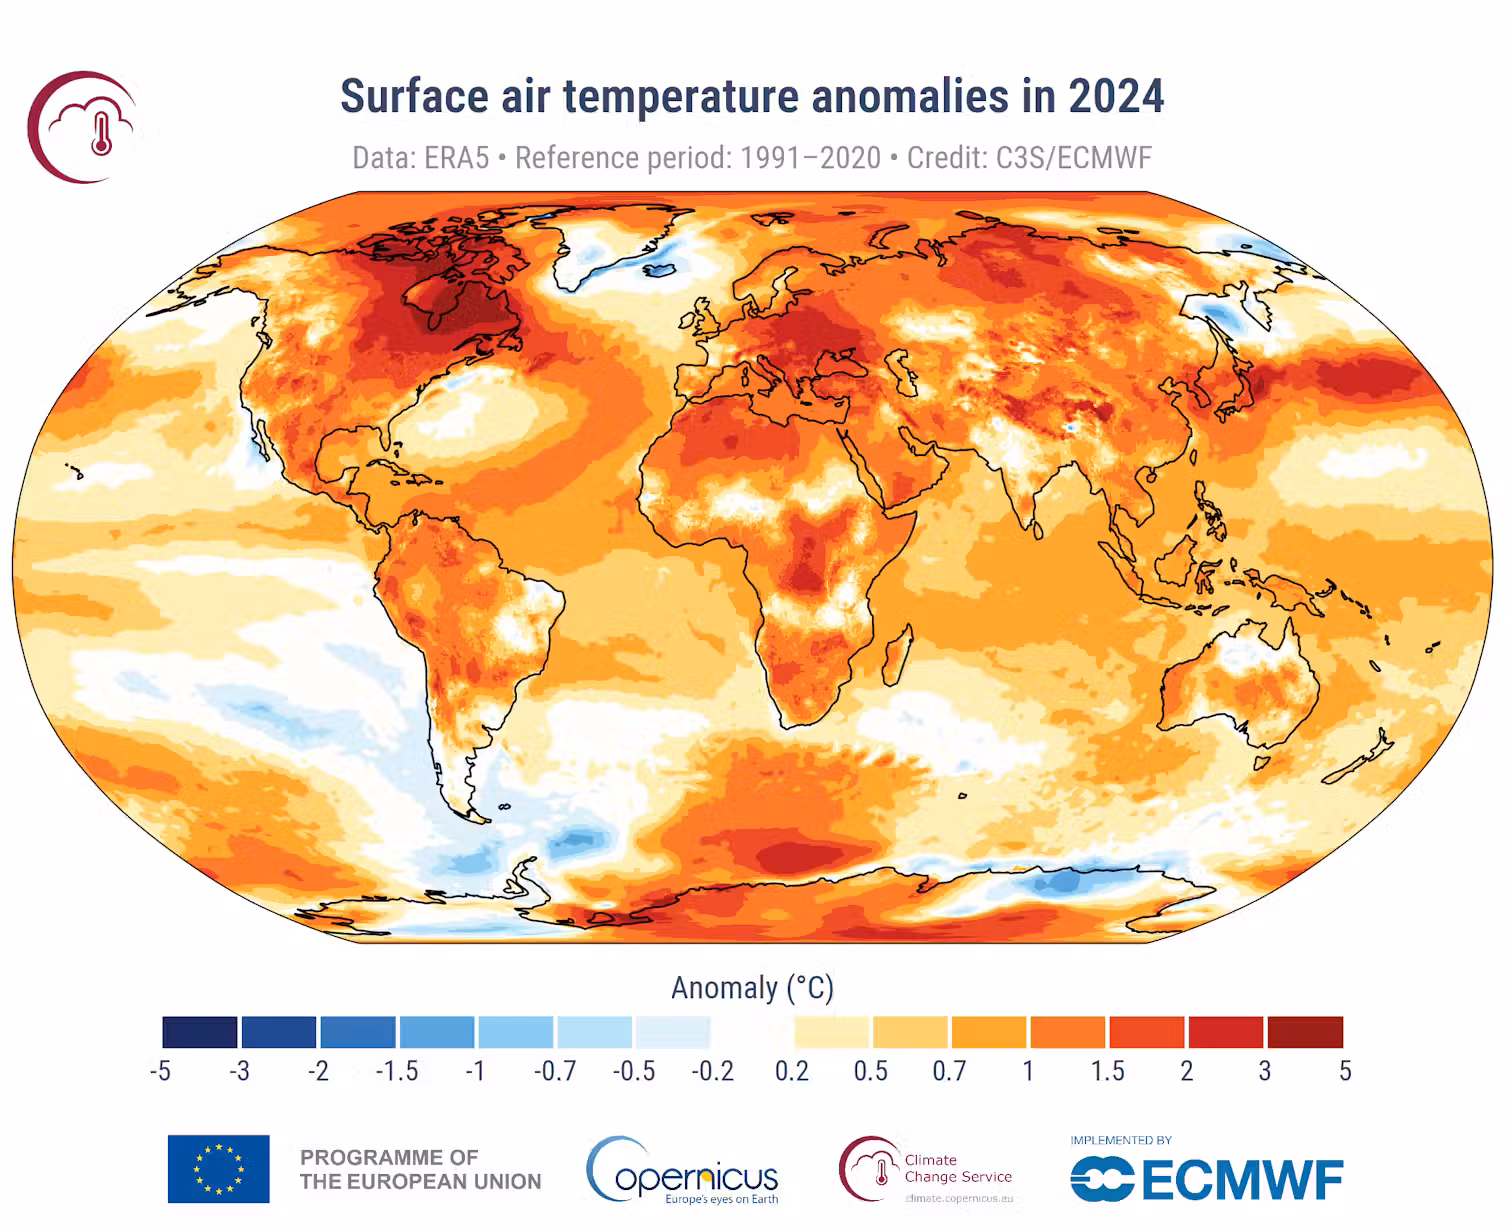
  • The average annual temperature of the contiguous U.S. was 55.5°F, 3.5°F above average and the warmest in the 130-year record. 
  • Annual precipitation for the contiguous U.S. was 31.58 inches, 1.66 inches above average, ranking in the wettest third of the historical record (1895–2024). 
  • The Atlantic basin saw 18 named tropical cyclones and five landfalling hurricanes during 2024—an above-average season. Hurricane Helene was the seventh-most-costly Atlantic hurricane on record.
  • The tornado count for 2024 was second highest on record behind 2004 (1,817 tornadoes) with at least 1,735 confirmed tornadoes. When looking at EF-2+ tornadoes, 2024 was the most active year since the historic 2011 season.
  • Hurricane Helene’s extensive damage topped the list of 27 separate billion-dollar weather and climate disaster events identified during 2024—the second-highest annual disaster count in the 45-year record. 
  • Drought coverage across the contiguous U.S. ranged from a minimum extent of 12 percent on June 11—the smallest contiguous U.S. footprint since early 2020—to a maximum coverage of 54 percent on October 29.

Other Highlights:

Temperature

For the year, temperatures were much-above average across nearly the entire contiguous U.S., with record warm temperatures across parts of the Southwest, Deep South and from the Upper Midwest to the central Appalachians and into the Northeast. Seventeen states (Texas, Oklahoma, Minnesota, Wisconsin, Michigan, Indiana, Ohio, Kentucky, Tennessee, West Virginia, Virginia, Pennsylvania, Maryland, New York, Vermont, New Hampshire and Maine) ranked warmest on record while all but two remaining states across the Lower 48 ranked as one of the warmest five years on record. The U.S. Climate Reference Network (USCRN) also indicated that 2024 was the warmest year on record (2005–24).

The Alaska January–December temperature was 28.9°F, 2.9°F above the long-term average, ranking in the warmest third of the 100-year record for the state. Much of the state had temperatures that were above average for the 12-month period with pockets of near average conditions in the southern and eastern mainland as well as the Panhandle.dle.

Precipitation

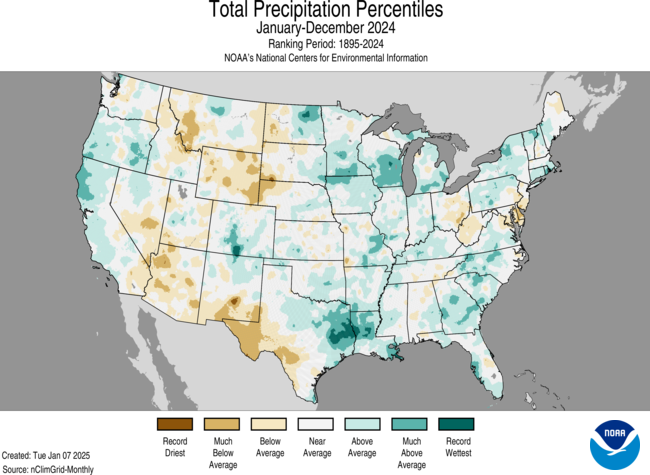
Precipitation was above average across portions of the West, central Rockies, Deep South, Upper Midwest, Great Lakes, Southeast and Northeast. Precipitation was below average across much of the Northern Rockies and Plains, parts of the Southwest and portions of the Ohio Valley and Mid-Atlantic region. Louisiana ranked 10th wettest for this 12-month period.

January–December 2024 ranked near the middle of the 100-year record for Alaska, with below-average precipitation observed across parts of the Aleutians, Northwest Gulf, Cook Inlet, Northeast Gulf and much of the Panhandle region. Average- to above-average precipitation occurred throughout much of the rest of the state.

Billion-Dollar Weather and Climate Disasters

The Billion-Dollar Weather and Climate Disasters update is a quantification of the weather and climate disasters that in 2024 led to more than $1 billion in collective damages for each event. During 2024, the U.S. experienced 27 weather and climate disasters each incurring losses that exceeded $1 billion. 2024 ranked second highest for the number of billion-dollar disasters in a calendar year. These disasters included: 17 severe storms, five tropical cyclones, two winter storms, one flooding event, one drought/heat wave and one wildfire event.

The U.S. cost for these disasters in 2024 was $182.7 billion and was fourth highest on record. The total annual cost may rise by several billion as additional costs from identified events are reported over time. There were at least 568 fatalities associated with these events—the eighth-highest number of fatalities on record. The costliest events in 2024 were:

  • Hurricane Helene was the costliest event in 2024. It made landfall as a Category 4 storm in the Big Bend region of Florida on September 26, caused catastrophic flash flooding and power outages impacting millions of people from Florida to North Carolina and resulted in at least 219 fatalities. Helene was the deadliest Atlantic hurricane since Maria (2017) and the deadliest to strike the U.S. mainland since Katrina (2005). The current estimated total cost of this disaster was $78.7 billion.
  • Category 3 Hurricane Milton made landfall near Tampa, Florida on October 9, caused widespread power outages and flooding and spawned tornadoes across the state. The current estimated total cost of this disaster was $34.3 billion.

Over the last 10 years (2015–24), 190 separate billion-dollar disasters have killed at least 6,300 people and cost approximately $1.4 trillion in damage.

This is also a record 14th consecutive year where the U.S. experienced 10 or more billion-dollar disasters and the fifth consecutive year (2020–24) where 18 or more billion-dollar disasters impacted the U.S.

Since records began in 1980, the U.S. has sustained 403 separate weather and climate disasters where overall damages/costs reached or exceeded $1 billion (based on the CPI adjustment to 2024) per event. The total cost of these 403 events exceeds $2.915 trillion.

Tropical Cyclones

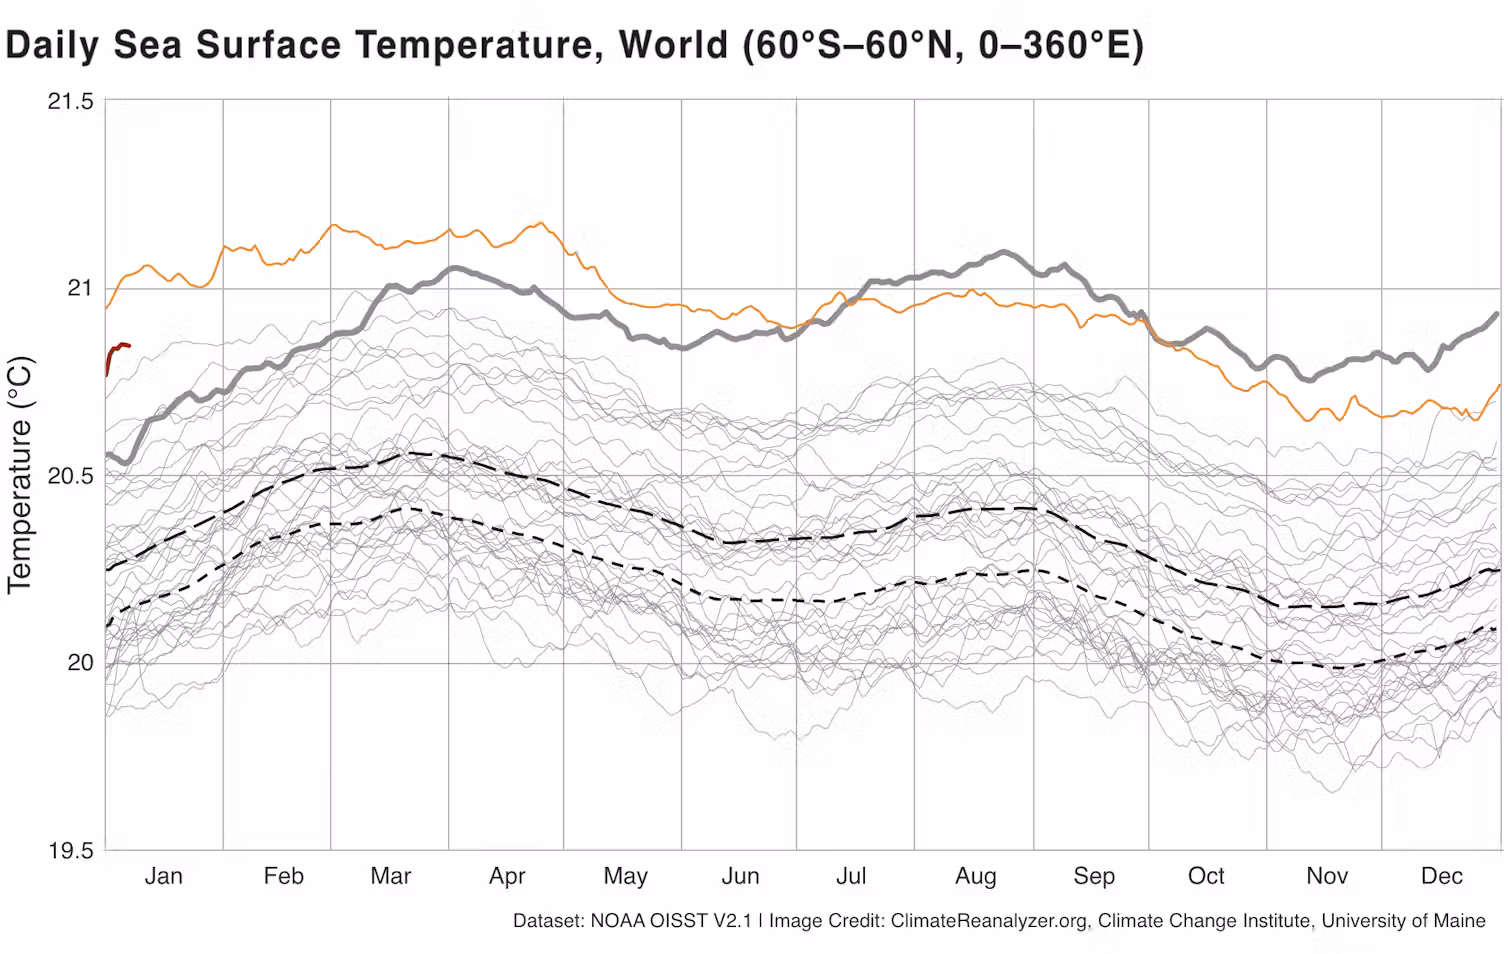
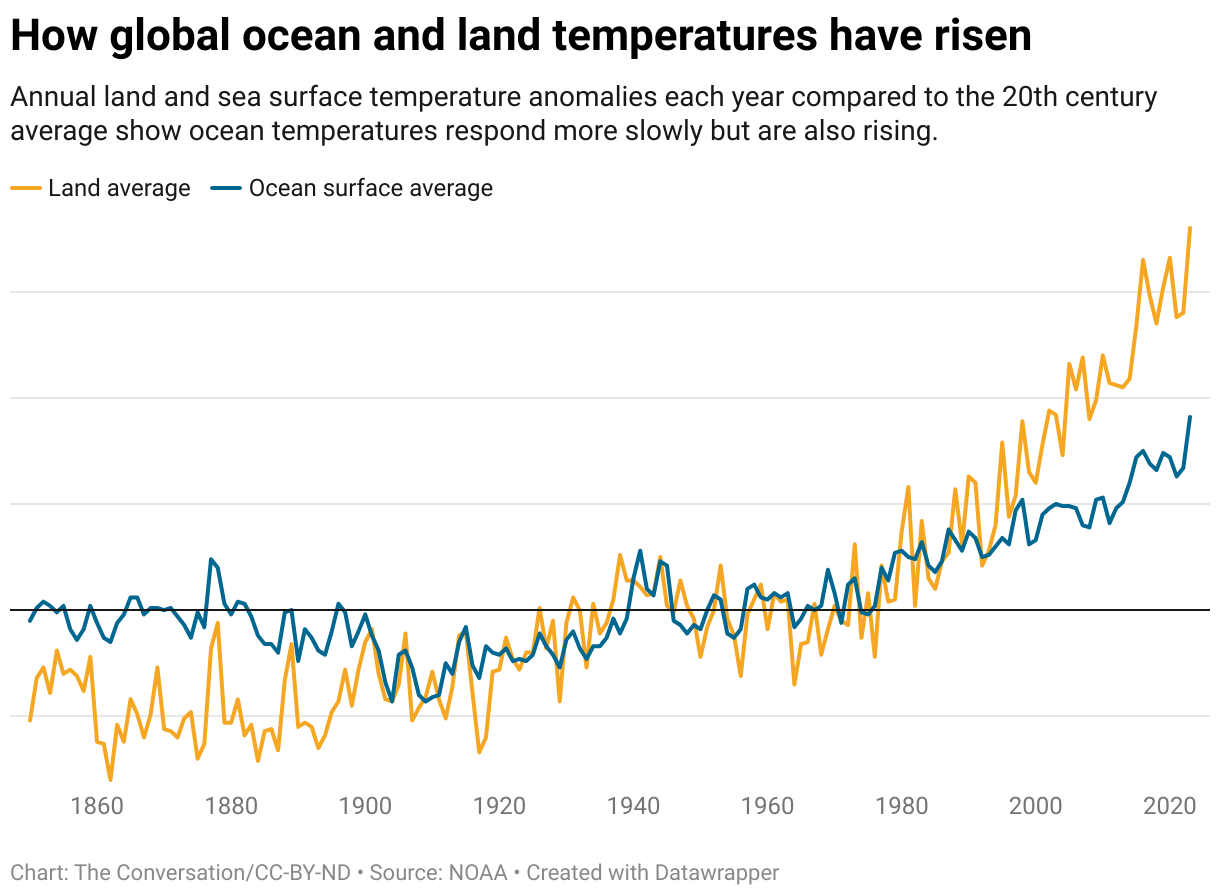
Record- to near-record sea surface temperatures in the Atlantic basin helped fuel the active season that formed 18 named tropical systems during 2024. Eleven of these storms were hurricanes (tied with 1995 for fifth highest on record), including five that intensified to major hurricanes (tied with 1995, 1999, 2008 and 2010 for sixth highest), two of which were Category 5 storms. Five of these 11 hurricanes made landfall in the U.S. (tied with 1893, 2004 and 2005 for fourth highest) and include: Hurricanes Beryl, Debby, Francine, Helene and Milton. Hurricane Helene was the seventh-most-costly Atlantic hurricane on record.

Tornadoes

As the Storm Prediction Center continues to confirm the tornadoes that occurred during 2024, the current count is 1,735, which is the second-highest number of confirmed tornadoes on record (2004 had 1,817) and 142 percent of the 30-year (1991–2020) average of 1,225. Four EF-4 tornadoes were confirmed during 2024 and occurred in: Elkhorn, Nebraska (April 26), Marietta, Oklahoma (April 27), Barnsdall, Oklahoma (May 6) and Greenfield, Iowa (May 21).

Wildfires

The number of wildfires in 2024 was approximately 90 percent of the 20-year (2001–20) average with more than 61,000 wildfires reported over the year. The  total number of acres burned from these wildfires—8.8 million acres—was 26 percent above the 20-year average of nearly seven million acres. The Park Fire, the fourth-largest wildfire in California history, burned nearly 430,000 acres and destroyed over 600 structures.

Alaska saw a below average wildfire year, with approximately 667,000 acres burned during the 2024 fire season—about two-thirds of the state’s seasonal average.

Drought

The year began with approximately 33 percent of the contiguous U.S in drought. Drought coverage shrank as the year progressed and reached the minimum extent for the year at 12 percent on June 11—the smallest contiguous U.S. drought footprint since early 2020. As the summer progressed, hot and dry conditions led to the expansion of drought across the Southeast and Mid-Atlantic as well as across the Plains. By October 29, the extent of drought peaked for the year with more than half of the contiguous U.S. (54 percent) in drought, covering significant portions of the Northwest, Southwest, northern and central Rockies, Plains, Great Lakes, the western and central Gulf Coast states as well as the central Appalachians, Mid-Atlantic and portions of the Northeast.  

Snowfall

The 2023–24 snow season was above average across the southern Cascades, Sierra Nevada, Bitterroots, central and southern Rockies as well as portions of the Adirondack, Green and White mountains in the Northeast. Seasonal snowfall was at least three or more feet below average across parts of the northern Cascades, northern Rockies, the northern Plains as well as much of the Great Lakes and Northeast.

The 2024–25 snowfall season to-date from October 1–December 31, 2024 saw above-average snowfall for locations along the West Coast impacted by early-season atmospheric river events. This includes much of the Cascades, northern Sierra Nevada range, Bitterroots as well as the highest elevations of the central Rockies and adjacent Plains along with locations downwind of the Great Lakes. Snowfall deficits prevailed across the southern Sierra Nevada range and from the northern Rockies to the Upper Midwest and across portions of New England.

Climate Extremes Index

The U.S. Climate Extremes Index (USCEI) for 2024 was more than double the average value, ranking highest in the 115-year record. Extremes in warm maximum and minimum temperatures were both highest on record and the primary contributors to this elevated USCEI value for the nation as well as the regions. In addition, all nine climate regions’ USCEI values ranked in the top-10 percent of extremes. Annual extremes across the Southeast and South regions were highest and second highest on record, respectively, and can also be attributed to extremes in one-day precipitation. Near-record extremes across the Upper Midwest were also due to elevated extremes in one-day precipitation and ranked third highest. Across the Northeast, wet Palmer Drought Severity Index (PDSI) values and the number of days with precipitation were elevated and across the Northwest, extremes in one-day precipitation and days with precipitation contributed to the much-above average USCEI values for 2024. The USCEI is an index that tracks extremes (falling in the upper or lower 10 percent of the record) in temperature, precipitation, drought and landfalling tropical cyclones across the contiguous U.S.

This annual summary from NOAA National Centers for Environmental Information is part of the suite of climate services NOAA provides to government, business, academia and the public to support informed decision-making. For more detailed climate information, check out our comprehensive Annual 2024 U.S. Climate Report. For additional information on the statistics provided here, visit the Climate at a Glance and National Maps webpages.

#Snowmass board looks to conserve water, protect #ColoradoRiver: Water Resources manager says landscape irrigation causes water waste — The #Aspen Times #RoaringForkRiver #COriver #aridification

Cold Mountain Rancher Bill Fales turns the headgate of the Lowline Ditch. Fales is participating in a non-diversion agreement with the Colorado Water Trust to keep more water in the Crystal River. CREDIT: HEATHER SACKETT/ASPEN JOURNALISM

Click the link to read the artilcle on The Aspen Times website (Skyler Stark-Ragsdale). Here’s an excerpt:

January 11, 2025

Irrigation is a major source of water waste in Snowmass, a critical issue as the town draws entirely from local streams. Once diverted, much of the water never follows its natural course to the Colorado River, according to Water Resource Manager Darrell Smith, who presented to the Environmental Advisory Board earlier this week. 

“Water is a scarce resource on the Western Slope and in the Colorado Basin as a whole,” Smith told The Aspen Times on Thursday. “So it’s part of doing our part to not use the water we have available to excess.”

Many second homeowners expect their lawn is green, and plants are watered by the time they arrive for the summer months, Smith said. The top 10% of Snowmass irrigators triple the average rate of water use…The Roaring Fork Valley watershed provides 10% of the total water volume to the Colorado River Basin, according to the Roaring Fork Conservancy. But the river no longer reaches the Pacific Ocean. It dries up in Northwestern Mexico due to human water usage, according to USGS. The Colorado River is predicted to drop 29% by 2050 in the Upper Colorado River Basin due to a hotter and drier climate, according to a 2021 USGS study...When temperatures increase, plants need more water, and people irrigate more, drawing more from the watershed, according to him…

As it stands, 35% of annual water usage in single family Snowmass residences comes from irrigation, primarily between June and September, he said. The top 10% of irrigators use 2,100 gallons per day — three times the 700 gallons used by the average Snowmass irrigator. While 95% of indoor water use returns to streams, only 20% of irrigated water returns, according to Smith.

2024’s extreme ocean heat breaks records again, leaving 2 mysteries to solve — Annalisa Bracco (The Conversation) #ActOnClimate

Click the link to read the article on The Conversation website (Annalisa Bracco):

January 9, 2025

The oceans are heating up as the planet warms.

This past year, 2024, was the warmest ever measured for the global ocean, following a record-breaking 2023. In fact, every decade since 1984, when satellite recordkeeping of ocean temperatures started, has been warmer than the previous one.

A warmer ocean means increased evaporation, which in turn results in heavier rains in some areas and droughts in others. It can power hurricanes and downpours. It can also harm the health of coastal marine areas and sea life – coral reefs suffered their most extensive bleaching event on record in 2024, with damage in many parts of the world.

Warming ocean water also affects temperatures on land by changing weather patterns. The EU’s Copernicus Climate Change Service announced on Jan. 10 that data showed 2024 had also broken the record for the warmest year globally, with global temperatures about 2.9 degrees Fahrenheit (1.6 Celsius) above pre-industrial times. That would mark the first full calendar year with average warming above 1.5 C, a level countries had agreed to try to avoid passing long-term.

Many regions of the world were much warmer than the 1991-2020 average in 2024, including large areas of ocean. C3S / ECMWF, CC BY

Climate change, by and large, takes the blame. Greenhouse gases released into the atmosphere trap heat, and about 90% of the excess heat caused by emissions from burning fossil fuels and other human activities is absorbed by the ocean.

But while it’s clear that the ocean has been warming for quite some time, its temperatures over the past two years have been far above the previous decades. That leaves two mysteries for scientists.

It’s not just El Niño

The cyclic climate pattern of the El Niño Southern Oscillation can explain part of the warmth over the past two years.

During El Niño periods, warm waters that usually accumulate in the western equatorial Pacific Ocean move eastward toward the coastlines of Peru and Chile, leaving the Earth slightly warmer overall. The latest El Niño began in 2023 and caused global average temperatures to rise well into early 2024.

Sea surface temperatures have been running well above average when compared with all years on record, starting in 1981. The orange line is 2024, dark grey is 2023, and red is 2025. The middle dashed line is the 1982-2011 average. ClimateReanalyzer.org/NOAA OISST v2.1, CC BY

But the oceans have been even warmer than scientists expected. For example, global temperatures in 2023-2024 followed a similar growth and decline pattern across the seasons as the previous El Niño event, in 2015-2016, but they were about 0.36 degrees Fahrenheit (0.2 Celsius) higher at all times in 2023-2024.

Scientists are puzzled and left with two problems to solve. They must figure out whether something else contributed to the unexpected warming and whether the past two years have been a sign of a sudden acceleration in global warming.

The role of aerosols

An intriguing idea, tested using climate models, is that a swift reduction in aerosols over the past decade may be one of the culprits.

Aerosols are solid and liquid particles emitted by human and natural sources into the atmosphere. Some of them have been shown to partially counteract the impact of greenhouse gases by reflecting solar radiation back into space. However, they also are responsible for poor air quality and air pollution.

Many of these particles with cooling properties are generated in the process of burning fossil fuels. For example, sulfur aerosols are emitted by ship engines and power plants. In 2020, the shipping industry implemented a nearly 80% cut in sulfur emissions, and many companies shifted to low-sulfur fuels. But the larger impact has come from power plants reducing their emissions, including a big shift in this direction in China. So, while technologies have cut these harmful emissions, that means a brake slowing the pace of warming is weakened.

Is this a warming surge?

The second puzzle is whether the planet is seeing a warming surge or not.

Temperatures are clearly rising, but the past two years have not been warm enough to support the notion that we may be seeing an acceleration in the rate of global warming.

Analysis of four temperature datasets covering the 1850-2023 period has shown that the rate of warming has not shown a significant change since around the 1970s. The same authors, however, noted that only a rate increase of at least 55% – about half a degree Celsius and nearly a full degree Fahrenheit over one year – would make the warming acceleration detectable in a statistical sense.

Chart: The Conversation/CC-BY-NDSource: NOAAGet the dataEmbed Download imageCreated with Datawrapper

From a statistical standpoint, then, scientists cannot exclude the possibility that the 2023-2024 record ocean warming resulted simply from the “usual” warming trend that humans have set the planet on for the past 50 years. A very strong El Niño contributed some natural variability.

From a practical standpoint, however, the extraordinary impacts the planet has witnessed – including extreme weather, heat waves, wildfires, coral bleaching and ecosystem destruction – point to a need to swiftly reduce carbon dioxide emissions to limit ocean warming, regardless of whether this is a continuation of an ongoing trend or an acceleration.

Saving the #GreatSaltLake by Rebalancing Its Water Budget — Brian Richter (SustainableWaters.org)

Exposed shoreline of the Great Salt Lake in Utah (USA). The lake’s level has dropped 14 feet (4.2 meters) over the past three decades, creating an enormous public health threat from windblown dust, placing global seafood production at risk, and disrupting a continental migratory flyway. Photo by Brian Richter

Click the link to read the article on the Sustainable Waters website (Brian Richter):

January 8, 2025

In recent years I’ve had the great fortune to be able to work with some amazing teams of researchers to explore the causes of water scarcity across many geographies, including the Colorado River, the Rio Grande, the Western US, and around the globe. Importantly, we’ve gone beyond just documenting the problems or threats caused by water shortages and have offered effective, proven solutions for sustainably rebalancing over-drafted water budgets. Our studies have looked at ways of conserving water in irrigated agriculture through crop shifting and other on-farm strategies as well as ways to conserve water in cities and industries.

Our just-published study of the Great Salt Lake in Utah (USA) was one of the most fascinating and enjoyable projects I’ve been involved with. I learned a great deal from our research!

I came to appreciate the hydrologic hyper-sensitivity of endorheic (lacking outflow) lakes. The Great Salt Lake is the largest saline lake in North America and the eighth largest in the world. Other big ones include the Aral Sea in Kazakhstan and Uzbekistan and Lake Urmia in Iran. All of these lakes teeter on a delicate balance between river inflows and evaporative losses from the lakes. The Great Salt Lake began to slip into long-term deficit way back in the mid-1800s when Mormon settlers from the eastern US began to capture the inflowing water from tributary rivers to expand their irrigated farms. The ensuing slow shrinkage of the lake was briefly interrupted by huge snowfalls in the 1980s and 1990s, but climate warming began to accelerate the lake’s demise since 2000. The lake dropped 14 feet (4.2 meters) and lost two-thirds of its volume during the past three decades.

The primary cause of the lake’s decline is the diversion of nearly two-thirds of the inflowing water for use in cities, industries, and irrigated farming. Farms are by far the biggest anthropogenic water consumer, accounting for 71% of water consumption, and 80% of this farm water goes to irrigated cattle-feed crops (alfalfa and grass hay). Credit: Brian Richter
Credit: Brian Richter/Sustainable Waters

The outsized contribution of irrigated cattle-feed crops to water shortages is repeated in most other river basins in the western US, and in many other water-scarce regions of our planet. As I’ve said in previous blogs, farmers and ranchers grow these crops for a simple business reason: our beef and dairy demands create a price for these crops that is quite attractive to farmers. In the past two decades, dairy consumption in the US has risen by 12%, driven mostly by increased demand for yogurt (+220%) and cheese (+28%).

In our paper, we took a close look at a variety of ways to rebalance the Great Salt Lake’s water budget by reducing production of these cattle-feed crops, along with urban and industrial water conservation. We concluded that saving the Great Salt Lake will require an overall reduction of consumptive water use by 35%; a reduction of 15% is needed to stabilize the lake to keep it from declining further, and another 20% will be needed to replenish the lake to an ecologically safe level.

Saving the Great Salt Lake will come with an eye-popping price tag: it will take at least $100 million per year for a decade to get the lake back to a safe level. However, when you put that cost in perspective, it translates to about $29 per Utah resident per year, or far less than 1% of the state’s annual budgets.

The challenges of water scarcity are growing rapidly with climate warming in many regions of the globe. Given that nearly 90% of all “blue” water (from rivers, lakes, aquifers) consumed in the world goes to irrigated agriculture, resolving water scarcity and keeping pace with climate change is going to necessarily require not just unprecedented levels of urban water conservation but also a massive transformation of what we grow on farms, and how we grow it. Because these agricultural changes commonly elicit fierce political resistance and high costs, political leaders are loathe to touch it. However, illustrative success stories are emerging around the world, demonstrating that with proper consideration of farmer needs, values, and cultures, and with financial compensation and technical support to ease difficult transitions, we can meet these challenges.

It begins by acknowledging the nature and size of the challenge, and demanding bold leadership from our decision makers. We can only run from water shortages and climate change for so long before truly disastrous consequences befall us.

Sunset from the western shore of Antelope Island State Park, Great Salt Lake, Utah, United States.. Sunset viewed from White Rock Bay, on the western shore of Antelope Island. Carrington Island is visible in the distance. By Ccmdav – Own work, Public Domain, https://commons.wikimedia.org/w/index.php?curid=2032320