Atlantic Ocean is headed for a tipping point āˆ’ once melting glaciers shut down the Gulf Stream, we would see extreme climate change within decades, studyĀ shows

Too much fresh water from Greenland’s ice sheet can slow the Atlantic Ocean’s circulation. Paul Souders/Stone via Getty Images

February 9, 2024

RenƩ van Westen, Utrecht University; Henk A. Dijkstra, Utrecht University, and Michael Kliphuis, Utrecht University

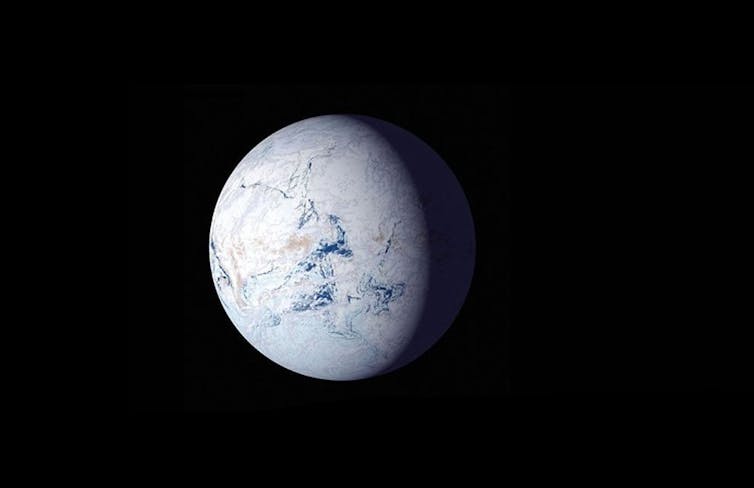
Superstorms, abrupt climate shifts and New York City frozen in ice. That’s how the blockbuster Hollywood movie ā€œThe Day After Tomorrowā€ depicted an abrupt shutdown of the Atlantic Ocean’s circulation and the catastrophic consequences.

While Hollywood’s vision was over the top, the 2004 movie raised a serious question: If global warming shuts down the Atlantic Meridional Overturning Circulation, which is crucial for carrying heat from the tropics to the northern latitudes, how abrupt and severe would the climate changes be?

Twenty years after the movie’s release, we know a lot more about the Atlantic Ocean’s circulation. Instruments deployed in the ocean starting in 2004 show that the Atlantic Ocean circulation has observably slowed over the past two decades, possibly to its weakest state in almost a millennium. Studies also suggest that the circulation has reached a dangerous tipping point in the past that sent it into a precipitous, unstoppable decline, and that it could hit that tipping point again as the planet warms and glaciers and ice sheets melt.

In a new study using the latest generation of Earth’s climate models, we simulated the flow of fresh water until the ocean circulation reached that tipping point.

The results showed that the circulation could fully shut down within a century of hitting the tipping point, and that it’s headed in that direction. If that happened, average temperatures would drop by several degrees in North America, parts of Asia and Europe, and people would see severe and cascading consequences around the world.

We also discovered a physics-based early warning signal that can alert the world when the Atlantic Ocean circulation is nearing its tipping point.

The ocean’s conveyor belt

Ocean currents are driven by winds, tides and water density differences.

In the Atlantic Ocean circulation, the relatively warm and salty surface water near the equator flows toward Greenland. During its journey it crosses the Caribbean Sea, loops up into the Gulf of Mexico, and then flows along the U.S. East Coast before crossing the Atlantic.

Two illustrations show how the AMOC looks today and its weaker state in the future
How the Atlantic Ocean circulation changes as it slows. IPCC 6th Assessment Report

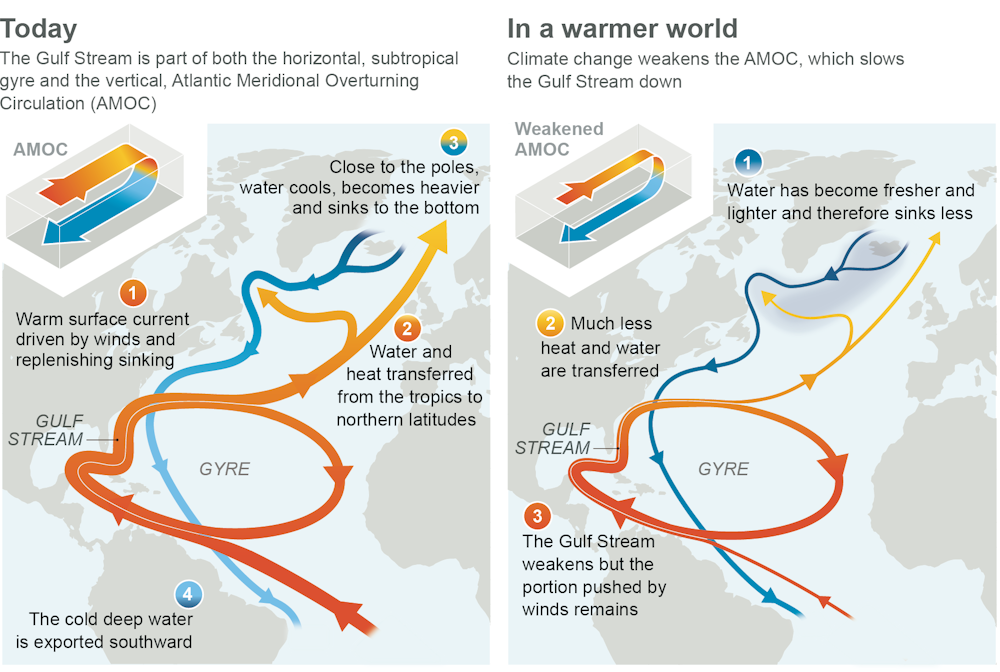
This current, also known as the Gulf Stream, brings heat to Europe. As it flows northward and cools, the water mass becomes heavier. By the time it reaches Greenland, it starts to sink and flow southward. The sinking of water near Greenland pulls water from elsewhere in the Atlantic Ocean and the cycle repeats, like a conveyor belt.

Too much fresh water from melting glaciers and the Greenland ice sheet can dilute the saltiness of the water, preventing it from sinking, and weaken this ocean conveyor belt. A weaker conveyor belt transports less heat northward and also enables less heavy water to reach Greenland, which further weakens the conveyor belt’s strength. Once it reaches the tipping point, it shuts down quickly.

What happens to the climate at the tipping point?

The existence of a tipping point was first noticed in an overly simplified model of the Atlantic Ocean circulation in the early 1960s. Today’s more detailed climate models indicate a continued slowing of the conveyor belt’s strength under climate change. However, an abrupt shutdown of the Atlantic Ocean circulation appeared to be absent in these climate models. https://www.youtube.com/embed/p4pWafuvdrY?wmode=transparent&start=0 How the ocean conveyor belt works.

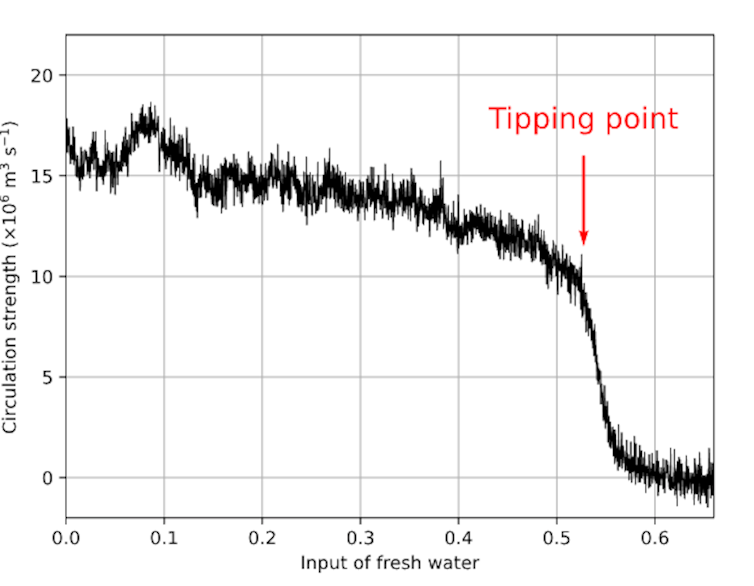
This is where our study comes in. We performed an experiment with a detailed climate model to find the tipping point for an abrupt shutdown by slowly increasing the input of fresh water.

We found that once it reaches the tipping point, the conveyor belt shuts down within 100 years. The heat transport toward the north is strongly reduced, leading to abrupt climate shifts.

The result: Dangerous cold in the North

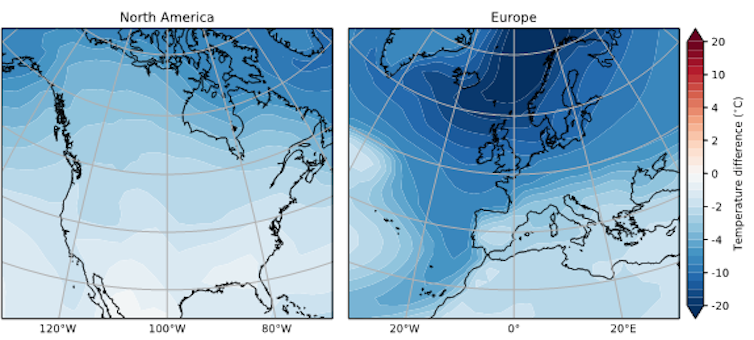
Regions that are influenced by the Gulf Stream receive substantially less heat when the circulation stops. This cools the North American and European continents by a few degrees.

The European climate is much more influenced by the Gulf Stream than other regions. In our experiment, that meant parts of the continent changed at more than 5 degrees Fahrenheit (3 degrees Celsius) per decade – far faster than today’s global warming of about 0.36 F (0.2 C) per decade. We found that parts of Norway would experience temperature drops of more than 36 F (20 C). On the other hand, regions in the Southern Hemisphere would warm by a few degrees.

Two maps show US and Europe both cooling by several degrees if the AMOC stops.
The annual mean temperature changes after the conveyor belt stops reflect an extreme temperature drop in northern Europe in particular. RenƩ M. van Westen

These temperature changes develop over about 100 years. That might seem like a long time, but on typical climate time scales, it is abrupt.

The conveyor belt shutting down would also affect sea level and precipitation patterns, which can push other ecosystems closer to their tipping points. For example, the Amazon rainforest is vulnerable to declining precipitation. If its forest ecosystem turned to grassland, the transition would release carbon to the atmosphere and result in the loss of a valuable carbon sink, further accelerating climate change.

The Atlantic circulation has slowed significantly in the distant past. During glacial periods when ice sheets that covered large parts of the planet were melting, the influx of fresh water slowed the Atlantic circulation, triggering huge climate fluctuations.

So, when will we see this tipping point?

The big question – when will the Atlantic circulation reach a tipping point – remains unanswered. Observations don’t go back far enough to provide a clear result. While a recent study suggested that the conveyor belt is rapidly approaching its tipping point, possibly within a few years, these statistical analyses made several assumptions that give rise to uncertainty.

Instead, we were able to develop a physics-based and observable early warning signal involving the salinity transport at the southern boundary of the Atlantic Ocean. Once a threshold is reached, the tipping point is likely to follow in one to four decades.

A line chart of circulation strength shows a quick drop-off after the amount of freshwater in the ocean hits a tipping point.
A climate model experiment shows how quickly the AMOC slows once it reaches a tipping point with a threshold of fresh water entering the ocean. How soon that will happen remains an open question. RenƩ M. van Westen

The climate impacts from our study underline the severity of such an abrupt conveyor belt collapse. The temperature, sea level and precipitation changes will severely affect society, and the climate shifts are unstoppable on human time scales.

It might seem counterintuitive to worry about extreme cold as the planet warms, but if the main Atlantic Ocean circulation shuts down from too much meltwater pouring in, that’s the risk ahead.

This article was updated on Feb. 11, 2024, to fix a typo: The experiment found temperatures in parts of Europe changed by more than 5 F per decade.

RenƩ van Westen, Postdoctoral Researcher in Climate Physics, Utrecht University; Henk A. Dijkstra, Professor of Physics, Utrecht University, and Michael Kliphuis, Climate Model Specialist, Utrecht University

This article is republished from The Conversation under a Creative Commons license. Read the original article.

The 2024 Water Year summary is hot off the presses from Western Water Assessment: Average temperatures during the 2024 water year were much above average for the entire region

Click the link to read the summary on the Western Water Assessment website:

Water Year 2024 Summary

Regional water year precipitation for 2024 was near normal. In Colorado, statewide 2024 water year precipitation was 101% of median, 99% of median in Utah and 94% of median in Wyoming. The two largest basins in our region also experienced near normal water year precipitation with the Upper Colorado River Basin receiving 99% of median precipitation and the Great Salt Lake receiving 105% of median precipitation. On a smaller geographic scale, 2024 brought near to above normal precipitation to northern Utah, central Colorado and northern Wyoming. Areas that were notably dry in 2024 include northeastern Colorado, southern Utah and eastern Wyoming.

Average temperatures during the 2024 water year were much above average for the entire region. The majority of the region experienced average temperatures that were up to 2ĀŗF above average. Water year average temperature was 2-4ĀŗF above average for several areas including southwestern Utah, eastern Utah, western Colorado and eastern Wyoming. Record high average temperatures during the last 9 months of the water year (January 2024-September 2024 were observed in Fillmore, UT and Laramie, WY. Several other small areas of record hot temperatures were observed throughout the region).

Snowpack in 2024 was near to above average for the entire region except for northeastern Wyoming where snowpack was much below average. Statewide April 1st snow water equivalent (SWE) was near or above average across the region with Colorado receiving 112% of average SWE, Utah with 132% of average SWE and Wyoming with 100% of average SWE. Snowpacks were deepest in the lower San Juan (288% average SWE) and the Dirty Devil River (152% average SWE) Basins and shallowest in the Belle Fouche (38% average SWE) and Cheyenne River (35% average SWE) Basins in northeastern Wyoming. Much of Colorado and Wyoming received near to slightly above average SWE. April 1st SWE was above average for all Utah river basins.

Despite near to above average snowpack throughout most of the region, April-July observed runoff volume ranged from slightly below average in the Wyoming river basins (Big Horn, Upper Green and Powder) and southern river basins (Dirty Devil, Dolores, Rio Grande and San Juan) to above average in the Great Basin (Bear, Great Salt Lake, Jordan and Weber) and Escalante River Basin. Much below average seasonal runoff was observed in northeastern Wyoming’s Cheyenne River Basin. The Weber River Basin observed the highest relative runoff at 132% of average seasonal runoff volume. A rough measure of runoff efficiency, or the proportion of snowpack that makes its way into runoff, was calculated as percent average of observed April-July runoff volume divided by percent average of April 1st SWE. Overall, regional runoff efficiency was relatively high with more than 90% of seasonal snowpack making its way into runoff in the Arkansas, South Platte, Yampa, Bear, Jordan, Price, Weber, Bighorn, Powder, Tongue and Yellowstone Rivers. Low runoff efficiency was observed in the Dolores, Rio Grande and Virgin River Basins. Low runoff efficiency in southwestern Colorado is likely attributed to continued long-term impacts of the drought that began in 2000.

The 2024 water year began with only 9% of the region in drought, largely due to the much above average 2023 water year. By the end of the water year, 36% of the region was in drought. Coverage of drought in Colorado and Utah remained relatively unchanged from the beginning to the end of the 2024 water year. Wyoming, however, experienced a sharp increase in coverage of drought; Wyoming was drought-free at the start of the 2024 water year, but 71% of the state was in drought by October 2024. Development of drought across Wyoming was driven by below normal water year precipitation across most of the state, especially eastern Wyoming, despite average April 1 snowpack conditions. Slightly above average water year temperatures likely exacerbated drought and the water year ended with July-September temperatures that were 2-4 degrees above average.

After a very wet 2023 water year, much of the region began the 2024 water year with soil surface moisture above the 80th percentile of NASA GRACE satellite observations, particularly in Utah, western Wyoming and southern Colorado. Areas with notably dry soil moisture to begin the 2024 water year included most of the Colorado Rockies, northeastern Colorado, southwestern Wyoming, and the Bighorn, Uinta and Wind River Mountains. By the end of the 2024 water year, surface soil moisture across most of the region was very low with most locations in the 5th percentile of all years of observation. Only south-central and northeastern Colorado has near average soil moisture conditions. Observations of near surface soil moisture (2ā€ depth) from the NRCS SCAN network indicate similar patterns of wet soils to begin the 2024 water year, especially in the western portion of the region and very dry soils by September 2024. SCAN soil moisture observations indicated much below average soil moisture at the end of the 2024 water year for all river basins except for the Arkansas, Gunnison, Upper Rio Grande and Upper San Juan River Basins. Particularly troubling for the 2025 water year is extremely low soil moisture in the Upper Colorado (33% of median) and Upper Green River (28% of median) Basins.

Regional reservoir storage declined slightly from the beginning of the 2024 water year, but remains near median capacity. Reservoir storage is greatest in Utah where reservoirs are at 114% of median capacity, only slightly lower than in October 2023. Despite the onset of drought in Wyoming, reservoir storage is currently at 94% of median capacity, down from 103% in October 2023. The greatest declines in reservoir capacity were found in eastern Wyoming, especially in the Belle Fouche, Bighorn and North Platte River Basins. Storage in large Upper Colorado River Basin reservoirs remains near median capacity except for McPhee, Navajo and Lake Powell. Reservoir storage in Lake Powell was relatively stable during 2024 despite remaining at a low 38% of total storage capacity.

Evidence from Snowball Earth found in ancient rocks on Colorado’s Pikes Peak – it’s a missingĀ link

Rocks can hold clues to history dating back hundreds of millions of years. Christine S. Siddoway

November 21, 2024

Liam Courtney-Davies, University of Colorado Boulder; Christine Siddoway, Colorado College, and Rebecca Flowers, University of Colorado Boulder

Around 700 million years ago, the Earth cooled so much that scientists believe massive ice sheets encased the entire planet like a giant snowball. This global deep freeze, known as Snowball Earth, endured for tens of millions of years.

Yet, miraculously, early life not only held on, but thrived. When the ice melted and the ground thawed, complex multicellular life emerged, eventually leading to life-forms we recognize today.

The Snowball Earth hypothesis has been largely based on evidence from sedimentary rocks exposed in areas that once were along coastlines and shallow seas, as well as climate modeling. Physical evidence that ice sheets covered the interior of continents in warm equatorial regions had eluded scientists – until now.

In new research published in the Proceedings of the National Academy of Sciences, our team of geologists describes the missing link, found in an unusual pebbly sandstone encapsulated within the granite that forms Colorado’s Pikes Peak.

An illustration of an icy earth viewed from space
Earth iced over during the Cryogenian Period, but life on the planet survived. NASA illustration

Solving a Snowball Earth mystery on a mountain

Pikes Peak, originally named TavĆ” Kaa-vi by the Ute people, lends its ancestral name, Tava, to these notable rocks. They are composed of solidified sand injectites, which formed in a similar manner to a medical injection when sand-rich fluid was forced into underlying rock.

A possible explanation for what created these enigmatic sandstones is the immense pressure of an overlying Snowball Earth ice sheet forcing sediment mixed with meltwater into weakened rock below.

A hand holds a rock with dark seams through it and other colors.
Dark red to purple bands of Tava sandstone dissect pink and white granite. The Tava is also cross-cut by silvery-gray veins of iron oxide. Liam Courtney-Davies

An obstacle for testing this idea, however, has been the lack of an age for the rocks to reveal when the right geological circumstances existed for sand injection.

We found a way to solve that mystery, using veins of iron found alongside the Tava injectites, near Pikes Peak and elsewhere in Colorado.

A cliff side showing a long strip of lighter color Tava cutting through Pikes Peak Granite. The injectite here is 5 meters tall
A 5-meter-tall, almost vertical Tava dike is evident in this section of Pikes Peak granite. Liam Courtney-Davies

Iron minerals contain very low amounts of naturally occurring radioactive elements, including uranium, which slowly decays to the element lead at a known rate. Recent advancements in laser-based radiometric dating allowed us to measure the ratio of uranium to lead isotopes in the iron oxide mineral hematite to reveal how long ago the individual crystals formed.

The iron veins appear to have formed both before and after the sand was injected into the Colorado bedrock: We found veins of hematite and quartz that both cut through Tava dikes and were crosscut by Tava dikes. That allowed us to figure out an age bracket for the sand injectites, which must have formed between 690 million and 660 million years ago.

So, what happened?

The time frame means these sandstones formed during the Cryogenian Period, from 720 million to 635 million years ago. The name is derived from ā€œcold birthā€ in ancient Greek and is synonymous with climate upheaval and disruption of life on our planet – including Snowball Earth.

While the triggers for the extreme cold at that time are debated, prevailing theories involve changes in tectonic plate activity, including the release of particles into the atmosphere that reflected sunlight away from Earth. Eventually, a buildup of carbon dioxide from volcanic outgassing may have warmed the planet again. https://www.youtube.com/embed/PLZze4Yok98?wmode=transparent&start=0 University of Exeter professor Timothy Lenton explains why the Earth was able to freeze over.

The Tava found on Pikes Peak would have formed close to the equator within the heart of an ancient continent named Laurentia, which gradually over time and long tectonic cycles moved into its current northerly position in North America today.

The origin of Tava rocks has been debated for over 125 years, but the new technology allowed us to conclusively link them to the Cryogenian Snowball Earth period for the first time.

The scenario we envision for how the sand injection happened looks something like this:

A giant ice sheet with areas of geothermal heating at its base produced meltwater, which mixed with quartz-rich sediment below. The weight of the ice sheet created immense pressures that forced this sandy fluid into bedrock that had already been weakened over millions of years. Similar to fracking for natural gas or oil today, the pressure cracked the rocks and pushed the sandy meltwater in, eventually creating the injectites we see today.

Clues to another geologic puzzle

Not only do the new findings further cement the global Snowball Earth hypothesis, but the presence of Tava injectites within weak, fractured rocks once overridden by ice sheets provides clues about other geologic phenomena.

Time gaps in the rock record created through erosion and referred to as unconformities can be seen today across the United States, most famously at the Grand Canyon, where in places, over a billion years of time is missing. Unconformities occur when a sustained period of erosion removes and prevents newer layers of rock from forming, leaving an unconformable contact.

Unconformity in the Grand Canyon is evident here where horizontal layers of 500-million-year-old rock sit on top of a mass of 1,800-million-year-old rocks. The unconformity, or ā€˜time gap,’ demonstrates that years of history are missing. Mike Norton via Wikimedia, CC BY-SA

Our results support that a Great Unconformity near Pikes Peak must have been formed prior to Cryogenian Snowball Earth. That’s at odds with hypotheses that attribute the formation of the Great Unconformity to large-scale erosion by Snowball Earth ice sheets themselves.

We hope the secrets of these elusive Cryogenian rocks in Colorado will lead to the discovery of further terrestrial records of Snowball Earth. Such findings can help develop a clearer picture of our planet during climate extremes and the processes that led to the habitable planet we live on today.

Liam Courtney-Davies, Postdoctoral Research Associate in Geological Sciences, University of Colorado Boulder; Christine Siddoway, Professor of Geology, Colorado College, and Rebecca Flowers, Professor of Geological Sciences, University of Colorado Boulder

This article is republished from The Conversation under a Creative Commons license. Read the original article.

#Drought news January 2, 2025: Abnormal dryness was expanded in parts of #California, #Arizona, #Utah, #Colorado and #NewMexico this week

Click on a thumbnail graphic to view a gallery of drought data from the US Drought Monitor website.

Click the link to go to the US Drought Monitor website. Here’s an excerpt:

This Week’s Drought Summary

Precipitation fell across much of the U.S. this week, with heavier amounts (> 1 inch) falling across large portions of the Northwest U.S. and from south-central U.S. to the Ohio Valley. Coastal areas of the Pacific Northwest, from Washington to northern California, reported weekly rainfall totals between 2 to 15 inches, while precipitation totals of 2 to 10 inches were reported in areas from eastern Texas to Alabama, as well as parts of the Ohio Valley and the Southeast. Above-normal precipitation supported drought improvements across large portions of the South and Midwest, and in parts of the Pacific Northwest, Midwest and Southeast. Conversely, weekly precipitation totals were below normal in areas of the southwestern U.S., Mid-Atlantic and Northeast. Drought and abnormal dryness were expanded or intensified in portions of the Southwest and in small pockets of the High Plains. Temperatures were above normal across much of the U.S. this week. Areas along the Northern Tier, from northern portions of the West, to the Midwest observed temperatures 10 to 25 degrees above normal. Below-normal temperatures were reported across northern portions of the Northeast, from northern New Jersey to Maine, where departures were up to 5 degrees F below normal this past week. Below-normal temperatures were also observed in small pockets of the Southeast this week…

High Plains

Warm temperature dominated the High Plains this week, with departures ranging up to 20 degrees F above normal, especially along the northern portions of the region. Precipitation fell across much of the region this week, but amounts were not large enough to justify large improvement across much of the High Plains. Extreme drought was expanded in northern Nebraska, while moderate drought was expanded in southeast Kansas. Abnormal dryness was expanded in southwest Colorado, where weekly rainfall totals are 5% to 20% of normal for the week. Small areas of the region did observe heavy rainfall, where rainfall totals were more than an inch above normal. This above-normal precipitation allowed for improvements to be made in South Dakota and along the Wyoming-Colorado border. Moderate to extreme drought were improved in northern Colorado and southern Wyoming, while severe drought was improved in western South Dakota. Abnormal dryness was also improved in areas along the Wyoming-Colorado border this week…

Colorado Drought Monitor one week change map ending December 31, 2024.

West

Average temperatures were above normal across nearly the entire region this week, while small pockets of below-normal temperatures were observed in northern California and along the southern coast of California, where temperatures were between 1 to 3 degrees F below normal. Conversely, Montana observed temperatures ranging between 6 to 15 degrees F above normal this week. Precipitation varied across the region this week, with heavy amounts falling in northern portions, while some areas in the southern portions of the region observed no precipitation. In the north, precipitation amounts of 1 inch or greater fell across much of the Pacific Northwest and northern California, with some areas receiving up to 8 inches above normal for the week. Moderate to severe drought were improved in western Montana and eastern Idaho, while moderate drought was removed in southeast Oregon and trimmed in the northeastern part of the state. Abnormal dryness was improved in northeast Oregon and in small parts of eastern Washington and southern Idaho. In the southern part of the region, above-normal temperatures and below-normal precipitation resulted in expansion of drought in Arizona, California and Nevada. Extreme drought was expanded in southern Arizona, while severe drought was expanded in southern and northwestern parts of the state. Moderate drought was expanded in western and eastern Nevada, southern California and across parts of Arizona, while abnormal dryness was expanded in parts of California, Arizona, Utah, Colorado and New Mexico this week…

South

Heavy rainfall was observed across much of the South this week, with precipitation totals ranging between 1 to 8 inches above normal. Above-normal rainfall, with amounts up to 600% above normal, along with improvements shown in short-term SPI/SPEI, streamflow and soil moisture data, supported widespread improvements to drought made from eastern Texas to Mississippi this week. Severe drought was removed along the Oklahoma-Texas and Louisiana-Arkansas borders, as well as from southern Mississippi, and improved in central Texas. Moderate drought was improved over large portions of Arkansas, eastern Texas, and in parts of Oklahoma, Louisiana and Mississippi. Conversely, western portions of Oklahoma and Texas observed below-normal precipitation this week. Moderate drought and abnormal dryness were expanded in small parts of western Texas. Temperatures were above normal across the entire region this week, with departures ranging between 1 to 15 degrees F above normal…

Looking Ahead

During the next five days (December 31, 2024–January 4, 2025), A low pressure system tracking from the Ohio Valley into the Northeast will spread precipitation across those regions Tuesday-Wednesday. Precipitation should fall as rain for most of the Ohio Valley to the coastal areas/lower elevations of the Northeast. Snow is likely in the higher elevation areas of the Interior Northeast like the Adirondacks and the Green and White Mountains. The Pacific Northwest will see a relative break in precipitation on Tuesday after a steady train of atmospheric rivers into the region. But by Tuesday night or Wednesday moist inflow may get renewed there and rounds of precipitation are likely to continue through late week and at times farther east into the northern Rockies. The eastern U.S. can expect one more day of above average temperatures (by 10-15F) on Tuesday, before upper troughing pushes along a series of cold fronts that gradually cool temperatures to near normal on Wednesday and gradually below normal into late week. High temperatures by Saturday are forecast to be around 10-15F below normal for the Ohio Valley to Appalachians and Mid-Atlantic while lows should be 5-10F below average. Colder than normal temperatures will also impact the north-central U.S., and lows could reach 10-15F below zero over northern North Dakota and Minnesota by Friday and/or Saturday. Meanwhile, the amplifying upper ridge over the West will promote warming, with temperatures generally 5-10F above average increasing in coverage by the second half of the week. Locally higher anomalies are likely in the Southwest and highs could reach well into the 70s. Highs of 5-15F above normal may reach into the southern High Plains by next Saturday.

The Climate Prediction Center’s 6-10 day outlook (valid January 5–9, 2025) favors above-normal precipitation across much of the U.S., with below-normal precipitation favored in portions of the Southwest and Northeast, as well as parts of northern Alaska and on southern parts of the Big Island. Increased probabilities for above-normal temperatures are forecast for Hawaii and across much of the West and Alaska, while below-normal temperatures are likely from the northern Rockies to the East Coast, and in northern parts of Alaska.

US Drought Monitor one week change map ending December 31, 2024.