Interior secretary manages vast lands that all Americans share − and can sway the balance between conservation and development — The Conversation

Visitors trek the Sand to Snow National Monument in Southern California, a popular area for camping, hiking, hunting and other activities. Bob Wick, BLM/Flickr

Emily Wakild, Boise State University

The Department of the Interior was created in 1849 as the United States was rapidly expanding and acquiring territory. It became known as “the department of everything else” for its enormous portfolio of missions, which ranged from western expansion to oversight of the District of Columbia jail.

Interior handles natural resources and domestic affairs – primarily managing 480 million acres (200 million hectares) of federal lands and developing the assets that they hold. Many of these lands are officially open for multiple uses, including energy development, mining, logging, livestock grazing and recreation. Those activities have numerous constituencies, whose interests can clash.

U.S. map showing public lands controlled by the Interior Department and data on their use.
The Interior secretary oversees many types of activities on and beneath lands that represent about 21% of the total surface area of the United States. U.S. Department of the Interior

The Interior secretary’s main job is to promote thoughtful planning that balances resource development and conservation. One strategic role has been expanding energy production, including oil, natural gas, wind and solar power, on federal lands.

Under Republican administrations, the focus often swings toward resource development. Democratic administrations often put greater emphasis on conservation and nonextractive land uses, such as recreation. The secretary’s actions can play a big role in setting direction for the agency.

Since Interior controls access to valuable natural resources, secretaries also get sued a lot over issues ranging from endangered species protection to water rights.

A motley collection of bureaus

Interior has about 70,000 employees whose missions fall largely into three buckets: managing public lands and wildlife; meeting U.S. trust responsibilities to Native American communities; and regulating energy, water and mining resources on federal lands and in federal waters offshore.

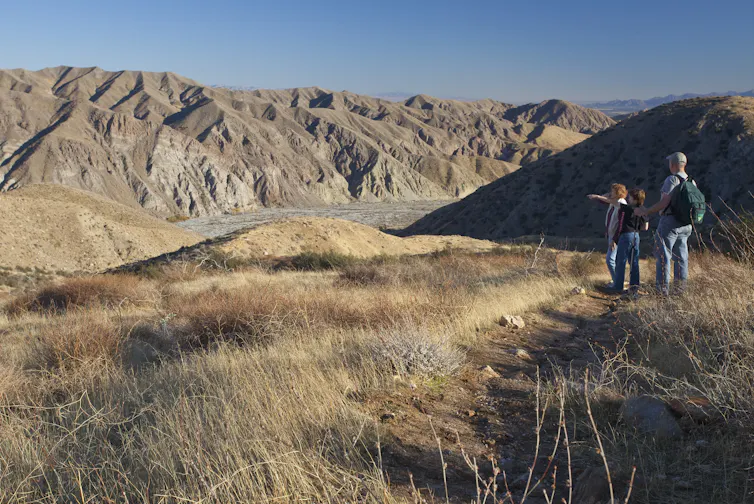
These functions are spread among 11 bureaus whose activities can conflict. For example, there has been heated debate within Interior about how to manage the scenic Bears Ears National Monument in Utah. This site was designated as a monument by President Barack Obama in 2016, drastically reduced by President Donald Trump in 2017, and then restored to its original size by President Joe Biden in 2021. Reflecting these shifts, Interior’s priorities for Bears Ears have toggled between opening it for mining, co-managing it with area tribes and preserving it for public enjoyment.

Many of Interior’s offices have changed dramatically over time in response to evolving environmental and cultural values. For example, the Bureau of Land Management was widely known for years as the “Bureau of Livestock and Mining” because its decisions closely reflected the interests of those industries.

Even now, ranchers can graze sheep and cattle on public lands at rates generally lower than comparable fees on state or private ranges. And mining companies don’t pay royalties to the Treasury for producing gold, silver, copper and other valuable minerals on federal lands.

However, today the bureau also manages land for conservation – including a 35 million-acre (14 million-hectare) system of National Conservation Lands. In 2024, the agency adopted a public lands rule that explicitly recognizes the importance of protecting clean water, managing for land health and restoring degraded lands.

Filling up the West

When Congress created the Interior Department, the young United States was in the process of nearly doubling its size after the U.S.-Mexican War. Gold had just been discovered in California, triggering a huge migration west. The scramble to occupy these lands and convert them into stable revenue sources drove Interior’s early activities.

As the U.S. government removed Native peoples from their ancestral homes and folded largely arid and unsettled lands into the public domain, Interior became a landlord and an agent of development in the West. The federal government gave millions of acres to white settlers in an effort to populate these new territories.

But not all lands met settlers’ needs, especially in dry zones. As a result, much of the arid West remained under federal control. Given this legacy, it is not surprising that most senior officials at Interior have come from western states.

U.S. national parks, monuments, wildlife refuges and other Interior lands have become economic engines for many western towns, attracting private ranches, hotels, restaurants and businesses. In this way, federal lands return tremendous wealth to adjacent communities, particularly with the growth of the outdoor recreation industry.

Nonetheless, many western states resent federal control over broad swaths of territory within their borders and periodically make claims to these lands. Since states don’t have the financial resources to manage roads or fight fires on such large expanses, it is likely that they would sell off large portions of these lands, privatizing them.

For this reason, many conservation groups and outdoor sporting organizations oppose transferring federal lands to the states. Interior secretaries may be called on to mediate these disputes or defend federal interests in court. https://www.youtube.com/embed/iUnV9CLsbO8?wmode=transparent&start=0 The state of Utah is suing the U.S. government for control over 18.5 million acres of federal land – about one-third of the territory in the state.

Over the past half-century, there has been ongoing debate about whether the royalties and fees the agency charges for federal land use return fair value to taxpayers, or if the agency has been “captured” by extractive industries such as mining, ranching, logging, and oil and gas production. The secretary can send important signals about which way an administration tilts.

Indian Affairs and trust responsibilities

Another central Interior role is managing U.S. government relations with American Indian and Alaska native tribes. The department’s Bureau of Indian Affairs, created in 1824, works with 574 federally recognized tribes with more than 2 million enrolled members.

Interior manages 55 million acres of land and 57 million acres of subsurface mineral rights in trust for the tribes. This essentially means that Interior agencies earn revenue and disperse funds to tribal members, in part to make up for depriving Native Americans of their rightfully held resources over 150 years of displacement.

Even after federal policy became more supportive of Tribal governance and self-determination in the 1970s, Interior did a poor job of fulfilling its key trust responsibilities. In 2009 the agency settled a US$3.4 billion class-action lawsuit, acknowledging that for decades the federal government had mismanaged tribal resources and failed to pay revenues to Indian landowners for resources produced from their lands.

Well into the 1970s, Interior also was charged with trying to assimilate Native Americans into U.S. society by forcibly removing children from their homes and families and placing them in boarding schools. These institutions punished children for speaking native languages and separated them from their cultural traditions.

Starting in 2021, under Secretary Deb Haaland – the first Native American to lead the Interior Department – the agency launched an initiative to document and interpret the experiences of survivors and the intergenerational effects of this policy on Native Americans whose ancestors were sent to the schools. https://www.youtube.com/embed/Ui9jCp1yuws?wmode=transparent&start=0 In a 2022 report, the U.S. government acknowledged for the first time its role in carrying out forced assimilation of Native American children at government-run boarding schools.

This land is your land

Interior’s reach is vast, but the resources that it controls and the investments it makes in keeping large landscapes connected provide tremendous services. Debate about the merits of public versus private management of these lands is likely to continue.

Growing interest in outdoor recreation and the rise of remote work are putting new pressure on public lands. Finding solutions will require many different land users, as well as state governments and gateway towns, to collaborate. The Interior secretary can play an important role in helping strike those balances.

This story is part of a series of profiles of Cabinet and high-level administration positions.

Emily Wakild, Cecil D. Andrus Endowed Chair for the Environment and Public Lands, Boise State University

This article is republished from The Conversation under a Creative Commons license. Read the original article.

Local drought could impact the West’s water supply: Western Slope has a vital role in water supply for #ColoradoRiver Basin — The #Telluride Daily Planet #COriver #aridification

West Drought Monitor map January 7, 2025.

Click the link to read the article on the Telluride Daily Planet website (Sophie Stuber). Here’s an excerpt:

January 7, 2025

Although Telluride is in the depths of winter, states are still negotiating a new agreement for the Colorado River basin. About 85% of the Colorado River begins as snow in Colorado and Wyoming’s mountains. The 1,450-mile river provides water to about 40 million people in the U.S. and Mexico and is key to the $5 billion annual agriculture economy. Across the state, snowpack is at 97% of the median. Locally, in the San Miguel-Dolores-Animas-San Juan River Basin, snow water equivalent is at 75% of median.

Map of the Colorado River drainage basin, created using USGS data. By Shannon1 Creative Commons Attribution-Share Alike 4.0

Colorado’s Western Slope river basins are essential to the health of the whole basin as well the economy and natural environment. Regional water managers often compete for water demands for agriculture, environmental flows and downstream deliveries to Lake Powell and Lake Mead, which store much of the region’s water. The current operational guidelines for the Colorado River will expire at the end of 2026. Drought in the Western Slope can significantly impact both local water use and deliveries to Lake Powell, and drought is likely to become more prevalent with climate change…A recent study, published in Nov. 2024, analyzed local drought vulnerability in Western Slope and the consequences for the region, going into the Colorado River basin. “Streamflow declines driven by an optimistic climate change scenario can transition the system to a drier regime and increase drought impacts,” the study’s authors write. The study developed a model to create streamflow scenarios and the potential impacts of drought in the region. The model showed elevated drought risks to downstream water users, agriculture and the environment…

The San Miguel Watershed Coalition recently released a new planning document for the whole watershed, including floodplain reconnection and beaver-based restoration projects. Much of this work involves federal land managers because more than 50% of the watershed is federally owned…Other important research includes how to better predict how snowpack is transformed into snowmelt and runoff into watersheds, collaborating with Airborne Snow Observatories (ASO), which provides basin-wide measurements of snow water equivalent and forecasts of snowmelt runoff.

The view from an Airborne Snow Observatory plane as it flies over a mountainous region to capture data on the snowpack. Photo credit: Airborne Snow Observatories Inc.

Global Warming Surges Well Past 1.5-Degree Mark in 2024: International agencies coordinate release of annual climate data to highlight the past year’s “exceptional”—and dangerous—climate conditions — Bob Berwyn (Inside #Climate News)

Sunset September 10, 2024 in the San Luis Valley. Photo credit: Alamosa Citizen

Click the link to read the article on the Inside Climate News website (Bob Berwyn):

January 9, 2024

Nearly all major global climate datasets agree that, in 2024, human-caused global warming for the first time pushed Earth’s average surface temperature to more than 1.5 degrees Celsius above the pre-industrial average for a full calendar year, a level that countries around the world had agreed to do all they could to avoid.

And when last year is averaged with 2023, both years together also exceed that level of warming, which was noted as a red line marking dangerous climate change by 196 countries in the 2015 Paris Agreement. A 2018 special report by the Intergovernmental Panel on Climate Change showed that warming beyond that limit threatens to irreversibly change major parts of the physical and biological systems that sustain life on Earth, including forests, coral reefs and rainforests, as well as oceans and their major currents.

The temperature figures were seen as so significant that the new annual climate data for 2024 was presented Thursday night as part of the first-ever internationally coordinated release by several institutions that track global temperatures, in part to mark the “exceptional conditions experienced in 2024,” according to a report published today by Copernicus, the European Union’s climate change service. 

On Friday, the National Oceanic and Atmospheric Administration, NASA and the World Meteorological Organization will follow up with similar reports, all of which will emphasize not only the record global temperatures, but also the record amount of water vapor in the atmosphere that contributed to severe and record flooding in some parts of the world last year, and also helped supercharge tropical cyclones and hurricanes.

Rather than being fatigued by the barrage of news about heat records and other climate extremes, people should see the information as an opportunity to be thankful that we are not flying blind into dangerous climate change, said Carlo Buontempo, director of the Copernicus Climate Change Service

Thanks to international science, “We do know something about what’s happening,” he said. “We can make some predictions about what’s coming in the future. So rather than being overwhelmed … we should also take this as an opportunity to do something about it, to react to and to inform our decisions in the best possible way with facts and evidence.”

Even with those facts, he added, “We are facing a very new climate and new challenges that our society is not prepared for. … This is a monumental challenge for society.”

According to the Copernicus data, 2024 didn’t just edge past the previous record-warm year, 2023, but surged more than a tenth of 1 degree Celsius all the way to 1.6 degrees Celsius (2.8F) above the pre-industrial level. That was one of the biggest year-on-year jumps on record, said Samantha Burgess, co-director of Copernicus. 

She said some of the other global datasets may actually still show the 2024 warming relative to the pre-industrial 1850-1900 average at just below 1.5 degrees Celsius (2.7F), but that the global synthesis of six major datasets by the World Meteorological Organization will also come out to more than 1.5.

Still, she said, that doesn’t mean the limit set by the Paris Agreement has been broken, because it refers to a long-term average over 10 to 30 years. 

If the 1.6 degrees Celsius of warming over the pre-industrial average doesn’t seem like a huge deal to some people, she said human bodies provide a good analogy.

“The temperature of the human body is around 37 [degrees Celsius],” she said. “If we have a fever at 39 degrees, it doesn’t sound like much, but the body responds in very negative ways, and we feel terrible. We’re feverish, and the body is doing everything possible to fight that infection.

“The reality is that at a global average change of 1.5 degrees, the frequency and the intensity of extreme events gets more likely,” she said. “Extreme events like wildfires, heat waves, severe storms, droughts, are likely to get more frequent, and they’re likely to be more intense. This is why, when you’ve got this small number but over a very large global average, it’s incredibly important.”

The Copernicus scientists said that the world’s oceans, in particular, were one of the biggest factors driving Earth’s overall annual temperature to a new record. That ocean warmth also had direct impacts like a global wave of coral bleaching and reef die-offs, as well as mass die-offs of marine mammals and seabirds

On land, the persistently high global fever of the last few years led to deadly heat waves, with more than 47,000 heat-related deaths in Europe alone during 2023. Final figures for the number of such deaths in 2024 are yet to be calculated.

The new data on record warmth comes at a time when some governments and companies are already rolling back previous climate action pledges. The internationally coordinated release of global climate data could also be seen as an acknowledgment that global warming isn’t going to slow down and wait for humanity to solve other vexing social, political and economic problems.

Asked if those rollbacks in the face of record heat are worrying to him as a climate scientist, Buontempo said that, “From a physical point of view, the mechanism is well explained. What drives this warming temperature is, to a very large extent, increasing greenhouse gases.”

If the goal is to stabilize the global temperature, then governments need to move toward reducing emissions to zero “in the most rapid possible way,” he said.

What will the future of the warming stripes be?2024 could be the start of a stabilisation of global temperatures, or it might appear to be a cool year.Which one of these stories becomes reality depends on our choices today, and every day until then.We are likely to regret not acting sooner.

Ed Hawkins (@edhawkins.org) 2025-01-10T11:13:06.384Z

January 2025 update: La Niña is here — NOAA #ENSO

Click the link to read the article on the NOAA website (Emily Becker):

January 9, 2025

La Niña conditions emerged in the tropical Pacific in December. There’s a 59% chance La Niña will persist through February–April, followed by a 60% chance of neutral conditions in March–May. Read on for the recent observations that led us to declare the (long-awaited) onset of La Niña and lots of details for current and potential upcoming conditions.

Just the facts, ma’am

A quick briefing, if you’re just joining us—La Niña is one phase of the El Niño/Southern Oscillation (ENSO), a pattern of sea surface temperature and atmospheric changes in the tropical Pacific Ocean. La Niña’s signature is cooler-than-average surface water in the east-central Equatorial Pacific, while its counterpart, El Niño, features warmer-than-average surface water. The atmospheric circulation over the tropical Pacific, called the Walker circulation, exhibits characteristic changes during La Niña and El Niño, so we call ENSO a “coupled” ocean-atmosphere system. ENSO is a seasonal phenomenon, meaning it lasts for several months in a row. The atmospheric changes of ENSO are communicated all around the world, changing temperature and rain/snow patterns in known ways.

Time to get down to brass tacks

Ok! We’ve been expecting La Niña to show up since last spring. While she’s dragged her heels, all the pieces came together this past month.

The tropical Pacific sea surface temperature loitered in ENSO-neutral since April 2024, with our primary ENSO monitoring index, the Niño-3.4 index, within 0.5 °C of the long-term average. In December, however, the Niño-3.4 index was -0.6 °C, according to the ERSSTv5, our most reliable long-term sea surface temperature dataset.

2-year history of sea surface temperatures in the Niño-3.4 region of the tropical Pacific for all La Nina events since 1950 (gray lines) and the recent (2024-25) event (purple line). After staying in neutral for most of 2024, the Niño-3.4 index passed the La Niña threshold in December 2024. Graph by Emily Becker based on monthly Niño-3.4 index data from CPC using ERSSTv5.

With the Niño-3.4 Index exceeding the La Niña threshold of -0.5 °C, we can move on to the second box on our flowchart—do we think the Niño-3.4 index is going to stay in La Niña territory for the next several seasons? (“Seasons” here means any 3-month-average period.) The consensus among our computer climate models is yes. Also, there is a substantial amount of cooler-than-average water under the surface of the tropical Pacific, which will provide a source for the surface over the next few months.  

So, we’re on to the third box, which has actually been checked for a while now (more on that later). The atmosphere has been looking La Niña-ish for months, with stronger-than-average trade winds, more clouds and rain over Indonesia, and drier conditions over the central Pacific—all hallmarks of an amped-up Walker circulation. In December, the Equatorial Southern Oscillation Index (EQSOI), which measures the difference in surface pressure between the western and eastern Pacific, was 1.5 (positive values indicate a stronger Walker circulation). In fact, this is the 5th-strongest December EQSOI in the historical record. Drumroll… La Niña conditions have developed.

This animation shows weekly sea surface temperatures in the Pacific Ocean compared to average from October 14 2024–January 5 2025. Orange and red areas were warmer than average; blue areas were cooler than average. The sea surface temperature in the key ENSO-monitoring region of the tropical Pacific (outlined with black box) was slightly below average for many weeks, but the cooler-than-average region has strengthened lately. NOAA Climate.gov animation, based on Coral Reef Watch Data and maps from NOAA View. View the full-size version in its own browser window.

Break it down for me

There are a lot of different tidbits I want to tell you about this month, so let’s go Q&A-style.

How long will La Niña last?

There’s a reason our flowchart says “the next several seasons” instead of providing a specific number: we can make predictions, but it’s impossible to know ahead of time exactly how long La Niña conditions will last. To be categorized as a La Niña event in our historical record, the three-month-average Niño-3.4 Index (the Oceanic Niño Index) needs to stay at least 0.5 °C below average for at least five consecutive, overlapping seasons. Current odds are 60% that the March–May Oceanic Niño Index will be neutral, which would make this event last fewer than five. That’s not to say it’s impossible for this La Niña to last longer, of course—nature is always full of surprises!  There is a ~40% chance for La Niña to persist into March-May 2025.

How strong will La Niña be?

It’s very likely this La Niña will be weak, with the Niño-3.4 index unlikely to reach -1.0 °C for a season. This is based on computer model guidance and how late in the year La Niña conditions emerged. ENSO events peak in the northern Hemisphere winter, and there’s just not a lot of time for La Niña to strengthen.

Can La Niña still affect our winter climate?

Sure can, although a weak La Niña tends to have a weaker influence over temperature and precipitation patterns.

Why was La Niña so slow to develop?

The short answer to this is “we don’t yet know.” The emergence of La Niña-like atmospheric conditions before substantial tropical Pacific Ocean surface cooling was unusual, though. The global oceans have been running much, much warmer than average for more than a year, which might have had a hand in La Niña’s delay. When we calculate the Niño-3.4 index but account for the temperature of the tropical oceans (the “Relative Niño-3.4 index”) we get an index that’s been in La Niña territory for months. Only this past year or so has the difference between the traditional and relative Niño-3.4 indexes been so large, and we’re still researching this new measurement and all the implications for ENSO development and impacts in a warmer world.

Has La Niña had any impact on temperature and rain patterns yet?

La Niña affects global climate primarily through atmospheric changes, and since the tropical atmosphere has been looking like La Niña for a while, this is a reasonable question! The global climate is incredibly complicated, and even a big factor like ENSO is only one player. Other climate patternsclimate change trends, and random variability can have a strong influence on overall seasonal patterns. That said, it’s interesting that the October–December 2024 temperature and rain/snow patterns over the U.S. resemble the expected patterns from previous La Niña events. See the October–December La Nina temperature and rain/snow maps, and here’s the general page if you would like to poke around.

Map showing the difference from average precipitation during October–December 2024. Green areas received more rain and snow than the 1991–2020 average, while brown areas received less. The pattern here resembles what we would expect in October–December during La Niña. Map by climate.gov from CPC data.

Temperature has a strong influence from climate trends, and the October–December 2024 temperature pattern over the U.S. is clearly dominated by more warmth.

Map showing the difference from average temperature during October–December 2024. Orange areas were warmer than the 1991–2020 average. The pattern here resembles what we would expect in October–December from combined climate trends and La Nina. Map by climate.gov from CPC data.

You’re running out of column inches. Any last tidbits?

Thanks for asking! Speaking of La Niña impacts, you might recall there’s a link between La Niña and active Atlantic hurricane seasons. In brief, La Niña reduces vertical wind shear—the difference between near-surface winds and upper-level winds—and makes it easier for hurricanes to grow. Interestingly, the August–October 2024 wind shear in the Atlantic Main Development Region (an area of the Atlantic where hurricanes tend to develop) was the weakest since 1950 (h/t NOAA’s Matt Rosencrans). We can’t say how much of it was related to La Niña, but given the relative Niño-3.4 index has been in La Niña territory for a while now, it’s an interesting situation that bears more research.

The bottom line

As this unusual La Niña progresses, we’ll be here to keep you updated on all things ENSO!

Here are the typical outcomes from both El Niño and La Niña for the US. Note each El Niño and La Niña can present differently, these are just the average impacts. Graphic credit: NWS Salt Lake City office