Citizen Scientists Document a Recovering #ColoradoRiver: The Returning Rapids Project charts a resurgent waterway and its surrounding ecosystems — Smithsonian Magazine #COriver #aridification

January 25, 2024

Click the link to read the article on the Smithsonian Magazine website (Margaret Osborne):

Sitting around a fire at a campsite along the Colorado River in Utah, boater Mike DeHoff flips through old photos of the area. Scientists from the United States Geological Survey circle around him and peer interestedly over his shoulder. He points to an old picture of the North Wash boat ramp, where the group is camped. The ramp was built about 20 years ago as a temporary take out for boaters running Cataract Canyon, a popular section for whitewater rafting, flowing through Canyonlands National Park upstream of Lake Powell. But in the past few decades, the ramp has deteriorated rapidly as water levels receded in the lake and the river here cut away at the land.

DeHoff, a welder based in Moab, Utah, runs the Returning Rapids Project, which documents annual changes in a section of the Colorado river called Cataract Canyon. The project brings external scientists out to survey species, measure sediment changes in the riverbed and examine the geology of newly exposed rock formations. The team presents this information, along with their own observations, to various organizations across the region and to the public. DeHoff and his team do this work, in part, to help provide important information before officials make crucial water management decisions regarding the river.

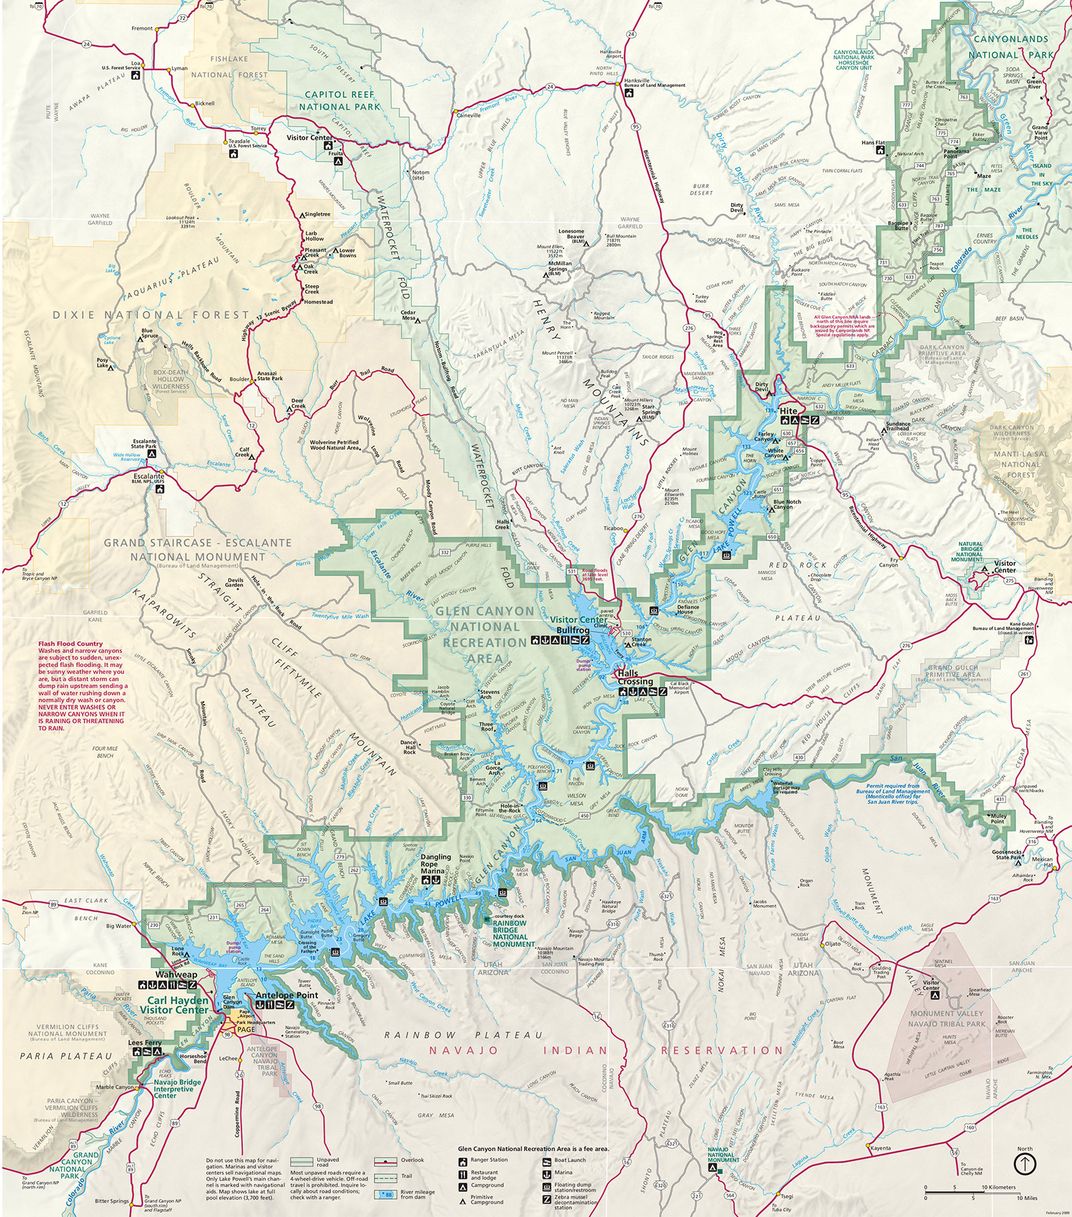
DeHoff is helping coordinate this March sediment survey with the USGS’s Grand Canyon Monitoring and Research Center, in a portion of the river that was once part of Lake Powell, the nation’s second-largest reservoir. In the past few decades, drought, climate change and the overuse of water have caused the lake level to drop, spurring a crisis for the millions of people who rely on it for water and hydropower. But as the lake receded, DeHoff began noticing something unexpected: The river upstream flourished.

DeHoff helps USGS researchers take out their boat at the eroded North Wash ramp—a task that requires rollers, winches and a team of several people. Margaret Osborne

DeHoff started seeing changes in Cataract Canyon in 2002—about when the region’s drought started. Lower water levels led rapids to form. Cottonwoods and seep willows sprouted in areas that were once underwater. As Lake Powell shrunk, the river cut through the layers of sediment left behind—dams halt the flow of rivers and stop sediment from moving freely. Yet, despite these rapid changes, DeHoff saw little scientific research or public attention focused on this section of the river. Instead, he says, efforts went downstream to the Grand Canyon, on the other side of the lake.

Glen Canyon National Recreation Area map from the official brochure National Park Service via Wikimedia Commons / Public Domain

A brief history

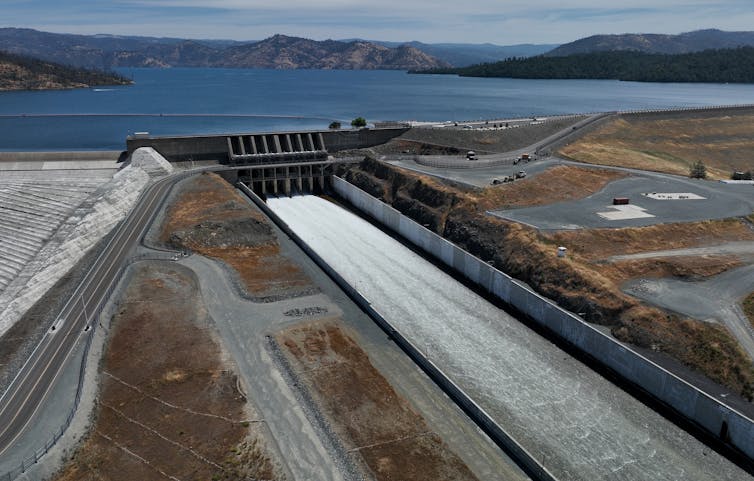
Before engineers dammed the river, Cataract Canyon was notorious for its massive, churning rapids—earning it the nickname “The Graveyard of the Colorado.” In 1964, Glen Canyon Dam was built near what’s now Page, Arizona, to supply power to areas of the West and to form the Lake Powell reservoir. In the United States, the Lake Powell reservoir is second in size only to Lake Mead, which is located 360 river miles downstream.

Raft in the Big Drop Rapids, Cataract Canyon. By National Park Service – National Park Service, Public Domain, https://commons.wikimedia.org/w/index.php?curid=8327636

Seventeen years after the construction of the Glen Canyon Dam was built, the reservoir hit full capacity—or “full pool”—and stretched 186 miles long. It inundated a stretch of river called Glen Canyon, which is sometimes referred to as “America’s lost national park.” The canyon was once home to a variety of plant and animal species as well as unique rock spires, arches, slot canyons and more than 3,000 ancient ruins. Just upstream of Glen Canyon, 65 percent of Cataract Canyon was also flooded, and many of its fearsome rapids disappeared.

The dam has also trapped millions of tons of sediment behind it in Lake Powell, which deprives the Grand Canyon downstream of sand and silt. The sediment holds critical nutrients for life and can form and replenish beach habitats that are important for plants and animals—and campsites for the 27,000 yearly Grand Canyon boaters.

A dwindling supply of water

The West is in the middle of its worst mega-drought in 1,200 years. In just the past few decades, Lake Powell has dropped more than 100 feet. This past March, when the USGS was completing its sediment survey, the reservoir sat at about 22 percent of full pool, just 30 feet above the amount needed to continue producing power.

“New plot using the nClimGrid data, which is a better source than PRISM for long-term trends. Of course, the combined reservoir contents increase from last year, but the increase is less than 2011 and looks puny compared to the ‘hole’ in the reservoirs. The blue Loess lines subtly change. Last year those lines ended pointing downwards. This year they end flat-ish. 2023 temps were still above the 20th century average, although close. Another interesting aspect is that the 20C Mean and 21C Mean lines on the individual plots really don’t change much. Finally, the 2023 Natural Flows are almost exactly equal to 2019. (17.678 maf vs 17.672 maf). For all the hoopla about how this was record-setting year, the fact is that this year was significantly less than 2011 (20.159 maf) and no different than 2019” — Brad Udall

States, tribes, legislators, the public and other stakeholders are all competing for the dwindling water in the Colorado River, which was originally divided up in the 1923 Colorado River Compact. This agreement among the federal government and Arizona, California, Colorado, New Mexico, Nevada, Utah and Wyoming was based on science that overestimated the amount of water that would be available in the years to come. And it left Native American tribes and Mexico out of the deal altogether. Over the years, subsequent agreements, court decisions and decrees have been added to the 100-year-old document to determine how water is split up. But at the end of 2026, some of these guidelines governing the system will expire and need to be renegotiated. Experts say deep cuts will need to be made to water usage. It may even mean drilling bypass tubes around the dam, which would essentially drain Lake Powell—one of the solutions the Bureau of Reclamation proposed last year.

The research facilitated by the Returning Rapids Project could help give officials a more holistic view of how their decisions will affect the entire river system. “Everybody knows that there’s going to have to be big decisions made about how we manage the Colorado River,” DeHoff says. “The way we’re using the river, and how we’re storing its water, is outdated.”

Environmentalists have proposed decommissioning Glen Canyon dam for decades to restore the health of the river and help conserve water. Some proponents, including the nonprofit Glen Canyon Institute, advocate to “Fill Lake Mead First,” a proposal that would combine the water from both reservoirs into Lake Mead. The proposal includes the construction of diversion tunnels around Glen Canyon Dam, allowing the river to flow freely through it and restoring Glen Canyon to its picturesque glory. According to a study commissioned by the institute, filling Lake Mead first would save about 300,000 acre-feet of water per year that would have otherwise been lost to ground seepage or evaporation in Lake Powell—about the amount allocated yearly to the state of Nevada. But a 2016 study from Utah State University has put this number closer to 50,000 acre-feet.

Record-breaking snowfall last winter in Utah has caused water levels to rise again. Lake Powell is now around 35 percent full. But scientists caution the drought is not over, and the precipitation is just a temporary fix to the region’s longstanding water shortage.

DeHoff chats with researchers about the river. Margaret Osborne

How the project formed

The shop DeHoff founded, Eddyline Welding in Moab, welds boats, frames and equipment for river runners. Private, commercial, USGS and National Park Service boaters gather there to swap stories and information.

Around 2017 or 2018, Peter Lefebvre, a longtime raft guide, began chatting with DeHoff about his observations in Cataract Canyon. “It was like, ‘Oh, so have you seen this rock sticking out of the river over here?’” Lefebvre says. The two formed the Returning Rapids Project with another local, Bego Gerhart. They wanted to investigate when the rapids would return to Cataract Canyon as Lake Powell receded. So far, they’ve documented the return of 11 rapids.

DeHoff and his partner, Meg Flynn, who’s the assistant director of the local library, have spent hours finding archival photos of the river upstream from Lake Powell. Project members pinpoint where the photos were taken and return to the same spots via raft, by motorboat or on foot to snap images, often at the same time of day and year, to compare the river and the landscape.

“It’s a treasure hunt,” Flynn says. “It’s super fun to figure out.”

Peter Lefebvre takes a photo to match an image taken previously. Margaret Osborne

The project soon grew, and in 2019, the Glen Canyon Institute, which advocates for a free-flowing river through the dam, took the Returning Rapids Project under its wing, allowing it to receive donations. The project now has four core part-time investigators: DeHoff, Flynn, Lefebvre and Chris Benson, a geologist, pilot and former raft guide. They’ve also recently involved some younger members in research and boat operations.

“All these government offices and agencies were kind of all doing their own thing and not really paying attention to this,” Benson says. “With all this change, all this worry about levels and drought, people weren’t really studying this.”

But scientists have now published multiple papers based on data collected with the help of the Returning Rapids Project.

Returning Rapids has also given presentations to various groups, including the Utah Geological Association, the Utah State University Center for Colorado River Studies, the Colorado Plateau River Guides and classes of university students. They’ve shared their findings with National Park superintendents, decision makers at the Bureau of Reclamation and Utah raft guides. In Moab, they’ve spoken at local events and even given a talk for visiting high school students from California.

The team’s observations, historical research and photo matching are published in yearly field binders for the public to read. Commercial river guides sometimes share the binders with passengers on their trips.

“It’s gone from having a conversation in the welding shop to being a part of meetings of every superintendent who has anything to do with the Colorado River with the National Park Service,” DeHoff says. “And trying to help them think about it, which is nuts.”

In the field

Back at the campsite, the USGS researchers listen as DeHoff chats more about the history of the area. In the morning, the scientists set up equipment and board research vessels, which will collect data on sediment in the riverbank that they can compare to previous surveys.

One boat carries a sonar device with 512 beams to map the floor of the river and a lidar instrument, which uses lasers to scan the riverbank. The team spends the day motoring up and down a section of the river—“mowing the lawn” they call it—near the Dirty Devil confluence. On two computer screens, raw data appears as textured images of the riverbed. “This mossy-colored, brown-looking texture is indicative of sand,” researcher Katie Chapman says, pointing to the screen.

Researchers Katie Chapman and Paul Grams collect data on the USGS boat. Margaret Osborne

Between 2020 and May 2022, USGS geomorphologist Paul Grams saw the river scour the riverbed 36 feet deeper, and the water is now encountering resistant bedrock. In this section, the river is flowing along a different path than its historical channel. Grams says a waterfall or rapid could form here if the water level continued to drop, which would change how sediment moves in the river and shift the river dynamics and ecosystems upstream. A waterfall could also act as a barrier for migrating fish and affect infrastructure decisions, such as where to build a boat ramp.

As the USGS group mows the lawn, Returning Rapids motors around the river to match photos and measure river depth using a fish-finder device.

In a follow-up survey in the early summer, Grams documented an even more dramatic scouring—about 33 feet in just six months—thanks to the season’s high water flows.

DeHoff uses a fish finder to figure out the depth of the river. Margaret Osborne

Making a big scientific impact

A few months before this trip, back in the library in Moab, DeHoff pulled out an 11-foot-long map of the Colorado River and laid it flat on the table in front of him. He pointed out areas that have changed over the years. “We’ve seen all kinds of like native flora and fauna come in and repopulate the areas where the river has restored itself,” he said.

Ecologist Seth Arens of the University of Colorado’s Western Water Assessment, who organized the first Returning Rapids science trip in 2019, says the region is a fascinating natural laboratory. Arens was inspired to research the Lake Powell area because of conversations with DeHoff on a private trip. He’s been conducting plant surveys in side canyons and says he’s the first to research the terrestrial landscape that was once underwater, an area that’s about 100,000 acres.

So far, Arens has documented shrubs, cottonwood trees, native grasses, wildflowers, early signs of cryptobiotic soil crusts and unique vertical ecosystems called hanging gardens—all of which have appeared in the last few years. He says this knowledge could be useful for understanding how landscapes change in arid regions as reservoirs dry and dams are removed.

A USGS boat “mows the lawn.” Margaret Osborne

Arens makes it clear he is not advocating for the removal of Glen Canyon Dam, but he says his research should be taken into account when officials make their decisions around future water management. Though he hasn’t published his data yet, he says he’s submitted comments to the Bureau of Reclamation. If Lake Powell refills, it will come at a cost, he adds.

“There will be ecological resources that are again submerged and lost,” he says. “I think it’s fair for that information to be part of that decision-making process.”

Cari Johnson, a geologist and geophysicist at the University of Utah, has also been on several Returning Rapids science trips. She says the Returning Rapids Project has made her research on sediments safer and more efficient. The group has helped her get permits, work with management agencies and provided practical knowledge about boating.

“I wouldn’t be able to do any of the science that I have done so far without [DeHoff],” she says. “He has been incredibly effective at getting smart people all together.”

The stratosphere is talking down to the troposphere, but will it listen? — NOAA

January 30, 2024

Click the link to read the article on the NOAA website (Amy Butler and Laura Ciasto):

With the occurrence of a major disruption to the polar vortex (or sudden stratospheric warming) on January 16 2023 [footnote 1], one of the first questions everyone asks is “How can a disruption way up in the Arctic stratosphere affect the winds and weather far below in the troposphere?”.

A stratospheric traffic accident

Scientists have a pretty good understanding of how a reversal of the winds ~19 miles above the Arctic influences the winds at lower altitudes, at least down to about the tropopause (the altitude where the troposphere transitions to the stratosphere, ~6-8 miles above earth’s surface at the poles). As we mentioned in this post, huge planetary-scale waves in the atmosphere can travel into the stratosphere, but only when the stratospheric winds are blowing west-to-east, as is generally the case during winter.

Imagine cars on a highway that suddenly find the road blocked by a giant concrete wall (since we’re imagining, let’s say they are driverless cars, so no humans are injured in this analogy). The first car crashes into the roadblock and stops; but the next car runs into that car, slightly further back from the roadblock, and so on and so forth until you have a massive traffic collision that extends for miles.

Analogously, a major sudden stratospheric warming can cause a similar chain reaction throughout the depth of the stratosphere. By definition, when one of these events occurs, the winds ~19 miles altitude reverse direction and now flow east-to-west. Winds that are blowing east-to-west essentially act as a roadblock to large atmospheric waves. So the next big wave that tries to travel into the stratosphere after a major warming will hit this roadblock, and the wave will break, slowing or reversing the winds just below the initial wind reversal. Then we rinse and repeat: the next wave will hit the roadblock of east-to-west winds slightly lower than before, slowing the winds at the next level down, until wind changes way up in the mid-stratosphere work their way all the way down to the bottom of the stratosphere.

Under normal wintertime conditions, when the wind blows from west-to-east, the largest atmospheric waves can travel through the stratosphere. However, if a major disruption of the stratospheric polar vortex occurs, the winds in the middle stratosphere reverse direction and blow from east-to-west, and the temperature warms. Large atmospheric waves cannot travel through winds blowing in this direction, so the next wave to travel into the stratosphere breaks just below where the reversal occurred. This “wave breaking” can reverse the winds in this lower layer, so that again, the next wave to travel into the stratosphere breaks even lower. In this way, the changes in the winds and temperatures in the middle stratosphere can descend to the tropopause, which represents the transition between the stratosphere and the troposphere. NOAA Climate.gov image.

The breaking waves also accelerate the transport of stratospheric air that sinks over the pole, which causes the air to warm and to build up atmospheric mass or pressure. If we look at a “paint drip” plot averaged over all observed major sudden stratospheric warming events, above the tropopause we can see a rapid increase in atmospheric thickness over the polar cap that occurs shortly after the disruption at 10 hPa (~19 miles). This increase in atmospheric thickness descends to the lower stratosphere over a period of days to a couple of weeks.

Differences from average atmospheric thickness (standardized geopotential height anomalies) in the column of air over the Arctic from the troposphere to the stratosphere for (left panel) the average over all observed major sudden stratospheric warmings and (right panel) recent observations and forecasts from the Global Forecast System (GFS) model. On average (left panel), increased atmospheric thickness (orange shading) is observed from the middle stratosphere to the tropopause after warming occurs on day 0. Atmospheric thickness is also enhanced below the tropopause but the magnitude is smaller and more intermittent in nature. In recent observations (right panel), atmospheric thickness was enhanced from the surface to the stratosphere for most of mid-January, but in the last 10 days has been lower than normal (purple shading) in the troposphere. Forecasts suggest the enhanced thickness associated with the major warming in mid-January is descending to the tropopause and may re-emerge in the troposphere in February. NOAA Climate.gov image adapted from original by Amy Butler (left panel) and Laura Ciasto (right panel).

While the polar vortex in the middle stratosphere tends to spring back into shape quickly after a major warming, any effects that reach the lower stratosphere can stay there for many weeks. We will explain the reasons for this in another post, but this persistence is a key element to why the stratosphere is such an important player for predictability on timescales of weeks to months.

Competing graffiti artists

Once the wind reversal in the middle stratosphere works its way down to the tropopause, our understanding of the physical mechanism for how it affects our weather becomes much foggier (weather nerd joke alert!). One thing that’s clear though is that below the tropopause, the increased atmospheric thickness over the pole becomes intermittent (they look like drips of paint, hence the name of the plots). These “drips” correspond to enhanced high pressure over the Arctic which can nudge the tropospheric jet stream southward, and they are not consistent in timing or magnitude from one major stratospheric warming to another.

This pattern suggests that, while the stratosphere exerts a predictable downward influence on the atmosphere, often for many weeks after a major warming, it’s not the only graffiti artist in town. The troposphere adds its own paint on top of what the stratosphere laid down; its processes and weather patterns can either enhance or destroy the stratosphere’s contribution of increased atmospheric thickness over the pole. For some major warmings, this means that we see almost no “paint drips” after the event [footnote 2].

There are additional characteristics of the coupling from the lower stratosphere to the surface that scientists don’t fully understand, such as why the polar atmospheric thickness increases more near the surface compared to the middle troposphere. It seems likely that atmospheric waves in the troposphere help to reinforce the wind changes coming from above, but even this additional reinforcement isn’t enough to fully explain the amplification of the signal at the surface that we observe.

What is the atmospheric graffiti art looking like now?

While we can get a clear overall picture of how the stratosphere influences the troposphere by averaging over many major sudden warmings, individual sudden warming events are often unique, because the troposphere is adding its own paint strokes and sprays to the stratosphere’s work of art. As we mentioned in the last post, the stratosphere and troposphere were coupled through most of mid-January, but this appears more related to the minor warming around January 5th and to the somewhat unusual nature of the major warming on January 16th when the stratospheric polar vortex was disrupted from the troposphere upwards.

Since the major warming, the stratosphere’s mark on the atmosphere has been covered up by whatever masterpiece the troposphere has in mind. The negative anomalies in polar atmospheric thickness in the troposphere that have stuck around since ~Jan 20th tend to keep the tropospheric jet stream shifted poleward, promoting warmer than normal temperatures across North America and parts of Europe. However, forecasts suggest that the paint colors added by the major warming will re-emerge as we head into February, perhaps bringing colder than normal temperatures over these regions back into the picture.

NOAA’s Global Ensemble Forecasting System (GEFS for short) predicts that the Northern Hemisphere polar vortex will strengthen to slightly above average wind speeds in early February (heavy magenta line), following a major sudden stratospheric warming on January 16 (where heavy purple line fell below 0 meters per second wind speed). The spread of the individual forecasts (thin magenta lines) remains wide in mid- to late-February. A couple individual forecasts predict another polar vortex reversal and major warming, while one individual forecast predicts record strong winds near the end of the forecast period. Climatology of highest and lowest daily values is from Climate Forecast System Reanalysis. NOAA Climate.gov graph, adapted from original by Laura Ciasto.

Meanwhile in the middle stratosphere, the polar vortex winds have already recovered after the major disruption, back to near average wind speeds. The vortex looks to strengthen somewhat in early February, but after that there is large uncertainty about what the stratosphere will throw on the atmospheric canvas next.

Footnotes

[1] This is the date the reversal occurred according to NASA’s GEOS FP assimilation system, but the exact date can depend on which “reanalysis” product is used; see for example: https://csl.noaa.gov/groups/csl8/sswcompendium/majorevents.html

Reanalysis products take multiple observational sources like satellite and balloon measurements and assimilate them into a model to create a product that is both temporally and spatially complete at each grid space of the model, and is constrained by observations. These products are widely used to study the stratosphere, though they can have significant biases; for an extensive evaluation of stratospheric reanalyses, see here: https://s-rip.github.io/report/structure.html

[2] It’s been found that only about ⅔ of observed major sudden stratospheric warmings have an apparent downward influence on the surface. The other ⅓ of major warmings likely either (a) weren’t strong enough disruptions to reach the lower stratosphere, which is key to having an influence on the troposphere, or (b) had an effect but the troposphere was creating stronger anomalies in the opposite direction. Notably, if we look at computer model simulations of thousands of major warmings, the “paint drip” plots cease to look drippy, suggesting that the “drippiness” is largely arising from all the variations caused by weather in the troposphere.

Reference

Baldwin, M. P., Ayarzagüena, B., Birner, T., Butchart, N., Butler, A. H., Charlton-Perez, A. J., et al. (2021). Sudden stratospheric warmings. Reviews of Geophysics, 59, e2020RG000708.https://doi.org/10.1029/2020RG000708

What is an atmospheric river? A hydrologist explains the good and bad of these flood-prone storms and how they’re changing — The Conversation

A satellite image shows a powerful atmospheric river hitting the Pacific Northwest in December 2023. Darker greens are more water vapor. Lauren Dauphin/NASA Earth Observatory

Qian Cao, University of California, San Diego

A series of atmospheric rivers is bringing the threat of heavy downpours, flooding, mudslides and avalanches to the Pacific Northwest and California this week. While these storms are dreaded for the damage they can cause, they are also essential to the region’s water supply, particularly in California, as Qian Cao, a hydrologist at the University of California, San Diego, explains.

What are atmospheric rivers?

An atmospheric river is a narrow corridor or filament of concentrated water vapor transported in the atmosphere. It’s like a river in the sky that can be 1,000 miles long. On average, atmospheric rivers have about twice the regular flow of the Amazon River.

When atmospheric rivers run up against mountains or run into local atmospheric dynamics and are forced to ascend, the moisture they carry cools and condenses, so they can produce intense rainfall or snowfall. https://www.youtube.com/embed/w3rtYM0HtIM?wmode=transparent&start=0 A satellite view of atmospheric rivers.

Atmospheric rivers occur all over the world, most commonly in the mid-latitudes. They form when large-scale weather patterns align to create narrow channels, or filaments, of intense moisture transport. These start over warm water, typically tropical oceans, and are guided toward the coast by low-level jet streams ahead of cold fronts of extratropical cyclones.

Along the U.S. West Coast, the Pacific Ocean serves as the reservoir of moisture for the storm, and the mountain ranges act as barriers, which is why the western sides of the coastal ranges and Sierra Nevada see so much rain and snow.

Why are back-to-back atmospheric rivers a high flood risk?

Consecutive atmospheric rivers, known as AR families, can cause significant flooding.

The first heavy downpours saturate the ground. As consecutive storms arrive, their precipitation falls on soil that can’t absorb more water. That contributes to more runoff. Rivers and streams fill up. In the meantime, there may be snowmelt due to warm temperatures, further adding to the runoff and flood risk.

California experienced a historic run of nine consecutive atmospheric rivers in the span of three weeks in December 2022 and January 2023. The storms helped bring most reservoirs back to historical averages in 2023 after several drought years, but they also produced damaging floods and debris flows.

An animation shows filaments of water heading toward the coast.
Atmospheric rivers forming over the tropical Pacific Ocean head for the U.S. West Coast. NOAA

The cause of AR families is an active area of research. Compared with single atmospheric river events, AR families tend to be associated with lower atmospheric pressure heights across the North Pacific, higher pressure heights over the subtropics, a stronger and more zonally elongated jet stream and warmer tropical air temperatures.

Large-scale weather patterns and climate phenomena such as the Madden-Julian Oscillation, or MJO, also play an important role in the generation of AR families. An active MJO shift occurred during the early 2023 events, tilting the odds toward increased atmospheric river activity over California.

A truck drives through muddy streets that fill a large section of town. People stand on one small patch of pavement not flooded.
An aerial view shows a flooded neighborhood in the community of Pajaro in central California on March 11, 2023, after a series of atmospheric rivers. Josh Edelson/AFP via Getty Images

A recent study by scientists at Stanford and the University of Florida found that storms within AR families cause three to four times more economic damage when the storms arrive back to back than they would have caused by themselves.

How important are atmospheric rivers to the West Coast’s water supply?

I’m a research hydrologist, so I focus on hydrological impacts of atmospheric rivers. Although they can lead to flood hazards, atmospheric rivers are also essential to the Western water supply. Atmospheric rivers have been responsible for ending more than a third of the region’s major droughts, including the severe California drought of 2012-16.

Atmospheric rivers provide an average of 30% to 50% of the West Coast’s annual precipitation.

They also contribute to the snowpack, which provides a significant portion of California’s year-round water supply.

In an average year, one to two extreme atmospheric rivers with snow will be the dominant contributors to the snowpack in the Sierra Nevada. Together, atmospheric rivers will contribute about 30% to 40% of an average season’s total snow accumulation there.

A dam spillway with a full reservoir behind it.
After several winter storms brought record snowfall to California’s Sierra Nevada in early 2023, Lake Oroville, California’s second-largest reservoir, was at 100% capacity. The previous year, much of the state had faced water restrictions. Justin Sullivan/Getty Images

That’s why my colleagues at the Center for Western Weather and Water Extremes at the Scripps Institution of Oceanography, part of the University of California, San Diego, work on improving atmospheric river forecasts and predictions. Water managers need to be able to regulate reservoirs and figure out how much water they can save for the dry season while still leaving room in the reservoirs to manage flood risk from future storms.

How is global warming affecting atmospheric rivers?

As global temperatures rise in the future, we can expect more intense atmospheric rivers, leading to an increase in heavy and extreme precipitation events.

My research also shows that more atmospheric rivers are likely to occur concurrently during already wet conditions. So, the chance of extreme flooding also increases. Another study, by scientists from the University of Washington, suggests that there will be a seasonal shift to more atmospheric rivers earlier in the rainy season.

There will likely also be more year-to-year variability in the total annual precipitation, particularly in California, as a study by my colleagues at the Center for Western Weather and Water Extremes projects.

Qian Cao, Hydrologist, Center For Western Weather and Water Extremes, University of California, San Diego

This article is republished from The Conversation under a Creative Commons license. Read the original article.

2024 #COleg: Clipping thirsty grasses at the margins in #Colorado — Allen Best (@BigPivots)

Wide green median in Erie. Photo credit: Allen Best/Big Pivots

Click the link to read the article on the Big Pivots website (Allen Best):

January 30, 2024

Relatively minor pushback in Colorado Senate to proposed limits to new water-thirsty grasses in urban areas that get little or no foot traffic

Colorado legislators in 2022 passed a bill that delivered $2 million for programs across the state for removal of thirsty turf classified as non-functional, meaning that the grass is mainly ornamental, to be seen but not otherwise used.

This morning [January 30, 2024] the Colorado Senate will review a bill that, if approved, will extend the concept.

“This bill is about not putting (in) that non-functional turf in the first place,” explained Sen. Dylan Roberts, D-Frisco, in introducing SB24-005 to the Senate Agriculture and Water Committee last Thursday. “If you don’t put it in the first place, you don’t have to replace it.”

The committee approved the bill, titled “Prohibit Landscaping Practices for Water Conservation,” in a 4-1 vote.

The Colorado Municipal League registered opposition, but tellingly, no representatives of towns or cities showed up to argue against the bill. Instead, support was expressed by representatives of several local jurisdictions, including the Eagle River Water and Sanitation District, the second largest water provider on the Western Slope, as well as the special district that provides water for Pueblo West.

The bill takes aim at Kentucky bluegrass and other species imported from wetter climatic zones that are planted along streets and in medians, amid parking lots, in front of government buildings as well as the expanses you often see around office parks and many business and industrial areas. The imported species can use far more water than buffalo grass and other species indigenous to Colorado’s more arid climate.

Residential property is unaffected. Worried about a public backlash, legislators amended the bill to make that exemption doubly clear.

The bill also bars use of plastic turf in lieu of organic vegetation for landscaping.

Originally reviewed by an interim legislative committee in October, the bill was subsequently modified based on input of stakeholders. Functional and non-functional turf were clarified. The bill was also modified to give cities and counties flexibility to determine areas of “community, civic and recreational” turf grasses, in effect letting them decide what is functional in some instances. The revised bill language also made it clear that installing native species of grass or those hybridized species that use less water would be OK. The revised bill also give municipalities and counties until Jan. 1, 2026, to review and revise their landscaping code and development review processes.

Part of the impetus to reduce water devoted to urban landscapes is a desire to protect water for agriculture in the San Luis Valley and other farm areas of Colorado. Photo/Allen Best

Sen. Cleave Simpson, R-Alamosa, a co-sponsor, called the bill a “natural extension” of the turf-buy-back bill from 2022. He said he was surprised at the reaction in Alamosa to that funding. The water district he manages began getting inquiries about how to participate. “It kind of inspired me that there’s more room for improvement here in this space,” he told committee members.

Simpson also said he was motivated to help prevent water grabs by Front Range cities from the San Luis Valley, what locals sometimes call Colorado’s South Slope. Three separate attempts have been made in the last 35 years to divert water from the San Luis Valley, a place already being forced to trim irrigated agriculture as necessary to meet requirements of the Rio Grande Compact.

“That’s largely my motivation to be part of this conversation and doing everything we can to reduce that pressure on my rural constituents and our way of life,” said Simpson.

Nobody argues that the limits on expansion of what the bill calls non-functional turf will solve Colorado’s water problems. Municipalities use only 7% of the state’s water, and outdoor use constitutes roughly half of municipal use. Agriculture uses nearly 90% of the state’s water.

But developing water for growing cities, particularly along the Front Range but even in the headwaters’ communities, has become problematic as the climate has veered hotter and, in most years of the 21stcentury, drier.

The result, as was detailed in a five-part collaboration during 2023 between Big Pivots and Aspen Journalism, has been a growing consensus about the need to be more strategic and sparing about use of water in urban landscapes.

See also:

Part V: Colorado River crisis looms over state’s landscape decisions

Part IV: Why these homeowners tore out their turf

Part III: How bluegrass lawns became the default for urban landscapes

Part II: Enough water for lawns at the headwaters of the Colorado River?

Part I: Colorado squeezing water from urban landscapes

Disagreements remain about whether the state should create a state-wide standard, as is proposed in this legislation, or whether local governments should figure out their own solutions.

It’s a familiar arguing point in Colorado, but rarely are the divisions neat and simple. That’s also true in this case. Colorado Springs, the state’s second largest city, has a robust program for urban landscape transformation but was hesitant about the bill’s approach, wanting to ensure local flexibility.

Denver is fully behind the bill. Denver Water, which provides water to 1.6 million people, including the city’s 720,000 residents as well as many suburban jurisdictions, has committed to reducing the water devoted to urban turf in coming years by 30%, or roughly 6,000 acres. It says it doesn’t want to become parsimonious with its water only to see water used lavishly in new settlements.

Andrew Hill, the government affairs manager for Denver Water, called the bill a “moderate approach” in creating a new waterwise landscaping standard, one in which imported grasses are not the default.

“It makes real changes statewide, but it’s narrow enough to only apply to areas (where) I think a consensus exists,” said Hill at the committee hearing.

Local governments can go further, and many have already. Colorado has 38 turf replacement programs, and Western Resource Advocates found last fall that 17 of the jurisdictions already limit new turf and another 9 plan to do so.

Aurora and Castle Rock, late-blooming municipalities in the metropolitan areas, have adopted among the most muscular regulations in Colorado, even taking aim at water devoted to front yards. Both expect to continue growing in population, and together they plan to pursue importations of water currently used for farming along the South Platte River in northeastern Colorado. Aurora also still owns water rights in the Eagle River that it has been trying to develop for the last 40 years.

The Colorado Municipal League, a consortium of 270 towns and cities, insists that the proposal represents state overreach of one-size-fits-all policies for local landscapes. Heather Stauffer, CML’s legislative advocacy manager, cited the regulations of Aurora, Greeley, and Aspen as examples of approaches created to meet specific and local needs.

“We would advocate that the state put more money into funds that address turf removal programs that have been very successful among municipalities across the state,” Stauffer said. In 2023, Boulder-based Resource Central completed 604 lawn-replacement projects along the Front Range. With aid of state funding, it plans to expand its turf-removal and popular Garden In A Box programs to the Western Slope this year.

The Colorado River Drought Task Force recommended legislators allocate $5 million annually for turf removal programs. Some legislators have indicated they plan to introduce legislation to do just that.

Removal of turf, such as at this library in Lafayette, has become more common in Colorado. Photo/Allen Best

Witnesses at the committee hearing repeatedly echoed what Roberts said in introducing the bill. Paying for turf removal is “inefficient and not cost-effective” if water-thirsty grass species continue to be planted in questionable places said Lindsay Rogers, policy manager for municipal conservation at Western Resource Advocates, which helped shape the bill.

Rogers said passing the bill would build the momentum to “help ensure that Coloradans live within our water means and particularly in the context of a growing state and worsening drought conditions.”

The Associated Landscape Contractors of Colorado, which represents 400 Colorado landscape and supplier companies, testified in support of the bill but hinted at future discussions as the bill goes through legislative sausage-making. Along with sod growers, they quibble over the dichotomous phrasing of “non-functional vs functional turf. They prefer the words recreational and utility.

On the flip side of these changes, some home gardeners might well find buffalo and other indigenous grasses, if more conserving of water, less appealing. Buffalo grass, for example, greens up a month or so later in spring and browns up a month earlier in autumn.

Water in urban landscapes is also on the agenda for three programs this week at the annual meeting of the Colorado Water Congress, the state’s preeminent organization for water providers. Included may be a report from a task force appointed by Gov. Jared Polis last February that met repeatedly through 2023 to talk about ways to reduce expansion of water to urban landscapes.

Aspinall Unit Forecast for Operations January 30, 2024 #GunnisonRiver #ColoradoRiver #COriver #aridification

From email from Reclamation (Erik Knight):

Click the link to view the forecast graphics.