
January 30, 2024
Click the link to read the article on the NOAA website (Amy Butler and Laura Ciasto):
With the occurrence of a major disruption to the polar vortex (or sudden stratospheric warming) on January 16 2023 [footnote 1], one of the first questions everyone asks is “How can a disruption way up in the Arctic stratosphere affect the winds and weather far below in the troposphere?”.
A stratospheric traffic accident
Scientists have a pretty good understanding of how a reversal of the winds ~19 miles above the Arctic influences the winds at lower altitudes, at least down to about the tropopause (the altitude where the troposphere transitions to the stratosphere, ~6-8 miles above earth’s surface at the poles). As we mentioned in this post, huge planetary-scale waves in the atmosphere can travel into the stratosphere, but only when the stratospheric winds are blowing west-to-east, as is generally the case during winter.
Imagine cars on a highway that suddenly find the road blocked by a giant concrete wall (since we’re imagining, let’s say they are driverless cars, so no humans are injured in this analogy). The first car crashes into the roadblock and stops; but the next car runs into that car, slightly further back from the roadblock, and so on and so forth until you have a massive traffic collision that extends for miles.
Analogously, a major sudden stratospheric warming can cause a similar chain reaction throughout the depth of the stratosphere. By definition, when one of these events occurs, the winds ~19 miles altitude reverse direction and now flow east-to-west. Winds that are blowing east-to-west essentially act as a roadblock to large atmospheric waves. So the next big wave that tries to travel into the stratosphere after a major warming will hit this roadblock, and the wave will break, slowing or reversing the winds just below the initial wind reversal. Then we rinse and repeat: the next wave will hit the roadblock of east-to-west winds slightly lower than before, slowing the winds at the next level down, until wind changes way up in the mid-stratosphere work their way all the way down to the bottom of the stratosphere.

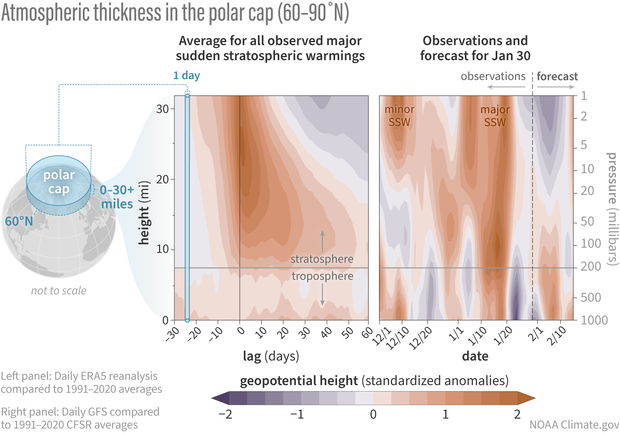
The breaking waves also accelerate the transport of stratospheric air that sinks over the pole, which causes the air to warm and to build up atmospheric mass or pressure. If we look at a “paint drip” plot averaged over all observed major sudden stratospheric warming events, above the tropopause we can see a rapid increase in atmospheric thickness over the polar cap that occurs shortly after the disruption at 10 hPa (~19 miles). This increase in atmospheric thickness descends to the lower stratosphere over a period of days to a couple of weeks.
While the polar vortex in the middle stratosphere tends to spring back into shape quickly after a major warming, any effects that reach the lower stratosphere can stay there for many weeks. We will explain the reasons for this in another post, but this persistence is a key element to why the stratosphere is such an important player for predictability on timescales of weeks to months.
Competing graffiti artists
Once the wind reversal in the middle stratosphere works its way down to the tropopause, our understanding of the physical mechanism for how it affects our weather becomes much foggier (weather nerd joke alert!). One thing that’s clear though is that below the tropopause, the increased atmospheric thickness over the pole becomes intermittent (they look like drips of paint, hence the name of the plots). These “drips” correspond to enhanced high pressure over the Arctic which can nudge the tropospheric jet stream southward, and they are not consistent in timing or magnitude from one major stratospheric warming to another.
This pattern suggests that, while the stratosphere exerts a predictable downward influence on the atmosphere, often for many weeks after a major warming, it’s not the only graffiti artist in town. The troposphere adds its own paint on top of what the stratosphere laid down; its processes and weather patterns can either enhance or destroy the stratosphere’s contribution of increased atmospheric thickness over the pole. For some major warmings, this means that we see almost no “paint drips” after the event [footnote 2].
There are additional characteristics of the coupling from the lower stratosphere to the surface that scientists don’t fully understand, such as why the polar atmospheric thickness increases more near the surface compared to the middle troposphere. It seems likely that atmospheric waves in the troposphere help to reinforce the wind changes coming from above, but even this additional reinforcement isn’t enough to fully explain the amplification of the signal at the surface that we observe.
What is the atmospheric graffiti art looking like now?
While we can get a clear overall picture of how the stratosphere influences the troposphere by averaging over many major sudden warmings, individual sudden warming events are often unique, because the troposphere is adding its own paint strokes and sprays to the stratosphere’s work of art. As we mentioned in the last post, the stratosphere and troposphere were coupled through most of mid-January, but this appears more related to the minor warming around January 5th and to the somewhat unusual nature of the major warming on January 16th when the stratospheric polar vortex was disrupted from the troposphere upwards.
Since the major warming, the stratosphere’s mark on the atmosphere has been covered up by whatever masterpiece the troposphere has in mind. The negative anomalies in polar atmospheric thickness in the troposphere that have stuck around since ~Jan 20th tend to keep the tropospheric jet stream shifted poleward, promoting warmer than normal temperatures across North America and parts of Europe. However, forecasts suggest that the paint colors added by the major warming will re-emerge as we head into February, perhaps bringing colder than normal temperatures over these regions back into the picture.
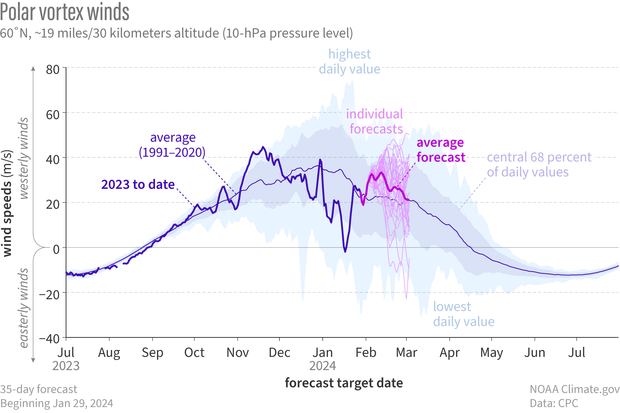
Meanwhile in the middle stratosphere, the polar vortex winds have already recovered after the major disruption, back to near average wind speeds. The vortex looks to strengthen somewhat in early February, but after that there is large uncertainty about what the stratosphere will throw on the atmospheric canvas next.
Footnotes
[1] This is the date the reversal occurred according to NASA’s GEOS FP assimilation system, but the exact date can depend on which “reanalysis” product is used; see for example: https://csl.noaa.gov/groups/csl8/sswcompendium/majorevents.html
Reanalysis products take multiple observational sources like satellite and balloon measurements and assimilate them into a model to create a product that is both temporally and spatially complete at each grid space of the model, and is constrained by observations. These products are widely used to study the stratosphere, though they can have significant biases; for an extensive evaluation of stratospheric reanalyses, see here: https://s-rip.github.io/report/structure.html
[2] It’s been found that only about ⅔ of observed major sudden stratospheric warmings have an apparent downward influence on the surface. The other ⅓ of major warmings likely either (a) weren’t strong enough disruptions to reach the lower stratosphere, which is key to having an influence on the troposphere, or (b) had an effect but the troposphere was creating stronger anomalies in the opposite direction. Notably, if we look at computer model simulations of thousands of major warmings, the “paint drip” plots cease to look drippy, suggesting that the “drippiness” is largely arising from all the variations caused by weather in the troposphere.
Reference
Baldwin, M. P., Ayarzagüena, B., Birner, T., Butchart, N., Butler, A. H., Charlton-Perez, A. J., et al. (2021). Sudden stratospheric warmings. Reviews of Geophysics, 59, e2020RG000708.https://doi.org/10.1029/2020RG000708