John Brumwell MayallOBE (29 November 1933 – 22 July 2024) was an English blues and rock musician, songwriter and producer. In the 1960s, he formed John Mayall & the Bluesbreakers, a band that has counted among its members some of the most famous blues and blues rock musicians. A singer, guitarist, harmonica player, and keyboardist, he had a career that spanned nearly seven decades, remaining an active musician until his death aged 90. Mayall has often been referred to as the “godfather of the British blues“, and was inducted into the Rock and Roll Hall of Fame in the musical influence category in 2024…
Mayall died at his home in California on 22 July 2024, at the age of 90.
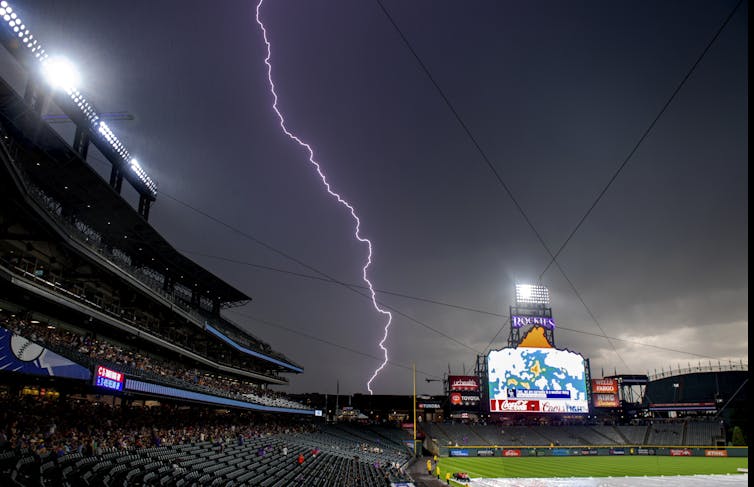
As the weather warms, people spend more time outdoors, going to barbecues, beaches and ballgames. But summer isn’t just the season of baseball and outdoor festivals – it’s also lightning season.
For as often as lightning occurs – there are only a few days each year nationwide without lightning – there are still a lot of misunderstandings about nature’s largest spark. Because of this, a lot of people take unnecessary risks when thunderstorms are nearby.
I am a meteorologist who studies lightning and lightning safety, and a member of the National Lightning Safety Council. Here are some fast facts to keep your family and friends safe this summer.
What is lightning, and where does it come from?
Lightning is a giant electric spark in the atmosphere and is classified based on whether it hits the ground or not.
In-cloud lightning is any lightning that doesn’t hit ground, while cloud-to-ground – or, less commonly, ground-to-cloud – is any lightning that hits an object on the ground. Cloud-to-ground lightning accounts for only 10% to 50% of the lightning in a thunderstorm, but it can cause damage, including fires, injuries and fatalities, so it is important to know where it is striking.
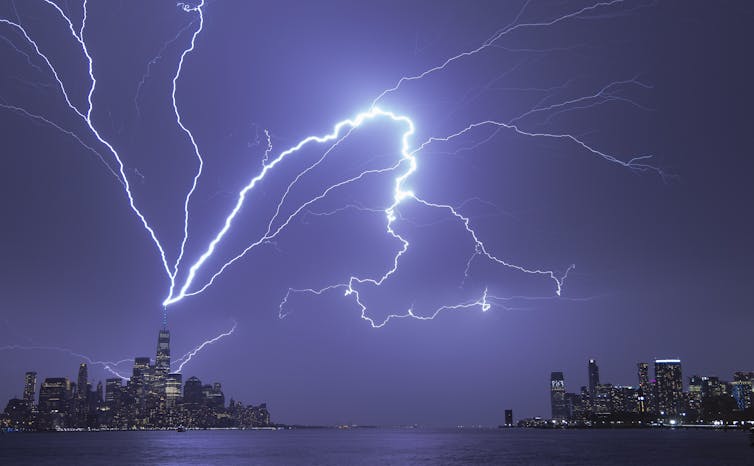
Lightning strikes One World Trade Center in New York City and carries through clouds over the Hudson River in April 2023. Gary Hershorn/Getty Images
When these precipitation particles collide, they exchange electrons, which creates an electric charge in the cloud. Because most of the electric charge exists in the clouds, most lightning happens in the clouds. When the electric charge in the cloud is strong, it can cause an opposite charge to build up on the ground, making cloud-to-ground lightning possible. Exactly what initiates a strike is still an open question.
When and where does lightning happen?
Lightning can happen any time the conditions for thunderstorms – moisture, atmospheric instability, and a way for air to rise – are present.
There is a seasonality to lightning: Most lightning in the United States strikes in June, July or August. In just those three months, more than 60% of the year’s lightning typically occurs. Lightning is least common in winter, but it can still happen. About 2% of yearly lightning occurs during winter.
No state is immune from lightning, but it is more common in some states than others.
Texas, Florida, Oklahoma, Louisiana and Mississippi are often among the leaders in total lightning strikes, but more than 30 states regularly see at least 1 million in-cloud and cloud-to-ground lightning events each year.
How to stay safe from lightning
Almost three-quarters of U.S. lightning fatalities occur between June and August. Luckily, staying safe from lightning is easy.
Keep an eye on the forecast and reconsider outdoor plans if thunderstorms are expected, especially if those plans take you near the water. Beaches are dangerous because lightning tends to strike the highest object, and water is a good conductor of electricity, so you don’t want to be in it.
Remember: No place outside is safe during a thunderstorm, so when thunder roars – go indoors. When you see the clouds building up, hear thunder or see a flash of lightning, it’s time to dash inside to a lightning-safe place.
What is a lightning-safe place?
There are two safe places to be during a thunderstorm: a substantial building or a fully enclosed metal vehicle.
A substantial building is a house, store, office building or other structure that has four walls and a roof, and where the electrical wiring and plumbing are protected inside the walls. If lightning strikes the building or near it, the electricity from the lightning travels through the walls and not through you. Dugouts, picnic shelters and gazebos are not safe places.
If you’re in a fully enclosed metal vehicle during a thunderstorm and lightning strikes, the electricity travels through the metal shell, which keeps you safe. It’s not the rubber tires that protect you – that’s a common myth. So, golf carts and convertibles won’t keep you safe if lightning strikes.
When you’re outdoors and lightning approaches, head to a lightning-safe place, even if it’s a distance away. Stay away from trees, especially tall and isolated ones, and don’t crouch in place – it doesn’t make you safer and just keeps you in the storm for longer.
Stay safe this summer
While you’re enjoying your summer plans, keep lightning safety in mind.
Leading up to the weekend of July 12-14, weather forecasts were indicating the potential for extreme heat in parts of Colorado. I was getting messages from people saying that their weather apps were showing that all-time records would be broken by multiple degrees (which mostly warranted an eye-roll.) On both Saturday the 13th and Sunday the 14th, there were just enough afternoon clouds and showers to keep the temperatures from reaching historic highs. But it was still a noteworthy heat wave, especially along the Front Range. Fort Collins reached a high of 102°F on Friday the 12th, one degree shy of the all-time record, and only the 7th time in over 130 years of records it had been that warm. That same day, Colorado Springs reached 100°F for only the 12th time, also one degree shy of the all-time record.
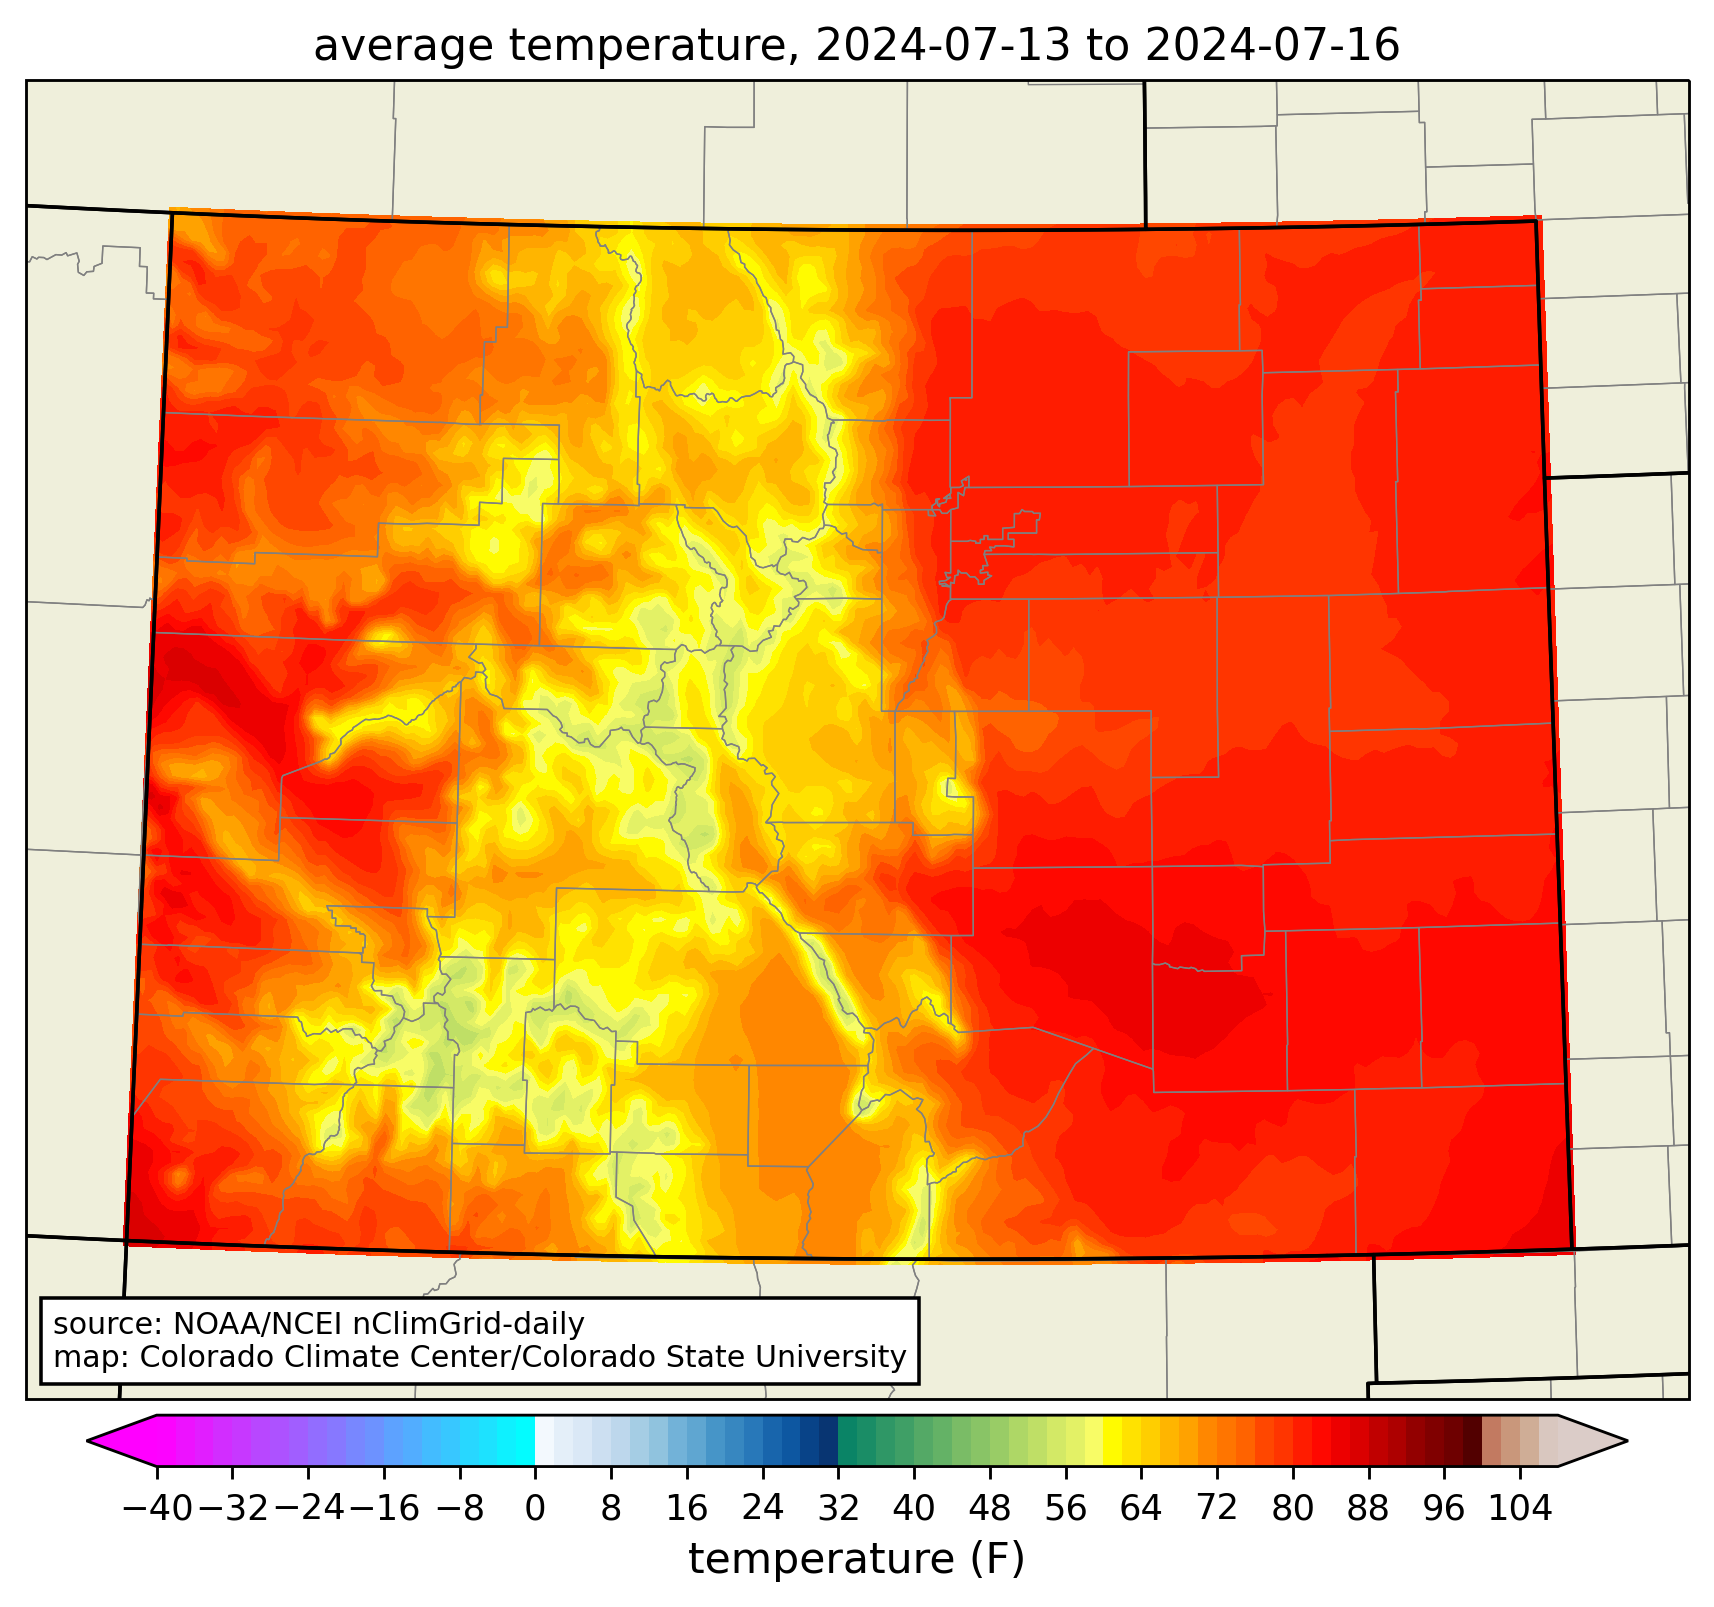
Below are maps of the average temperature for the four-day period from the morning of Friday the 12th through the morning of Tuesday the 16th, and how it compares to the 30-year “normal” for those four days.
Average temperature from NOAA’s nClimGrid dataset, for 13-16 July 2024. nClimGrid defines days as ending in the early morning, so this includes the period from the morning of the 12th through the morning of the 16th. Credit: Russ Schumacher/Colorado Climate Center
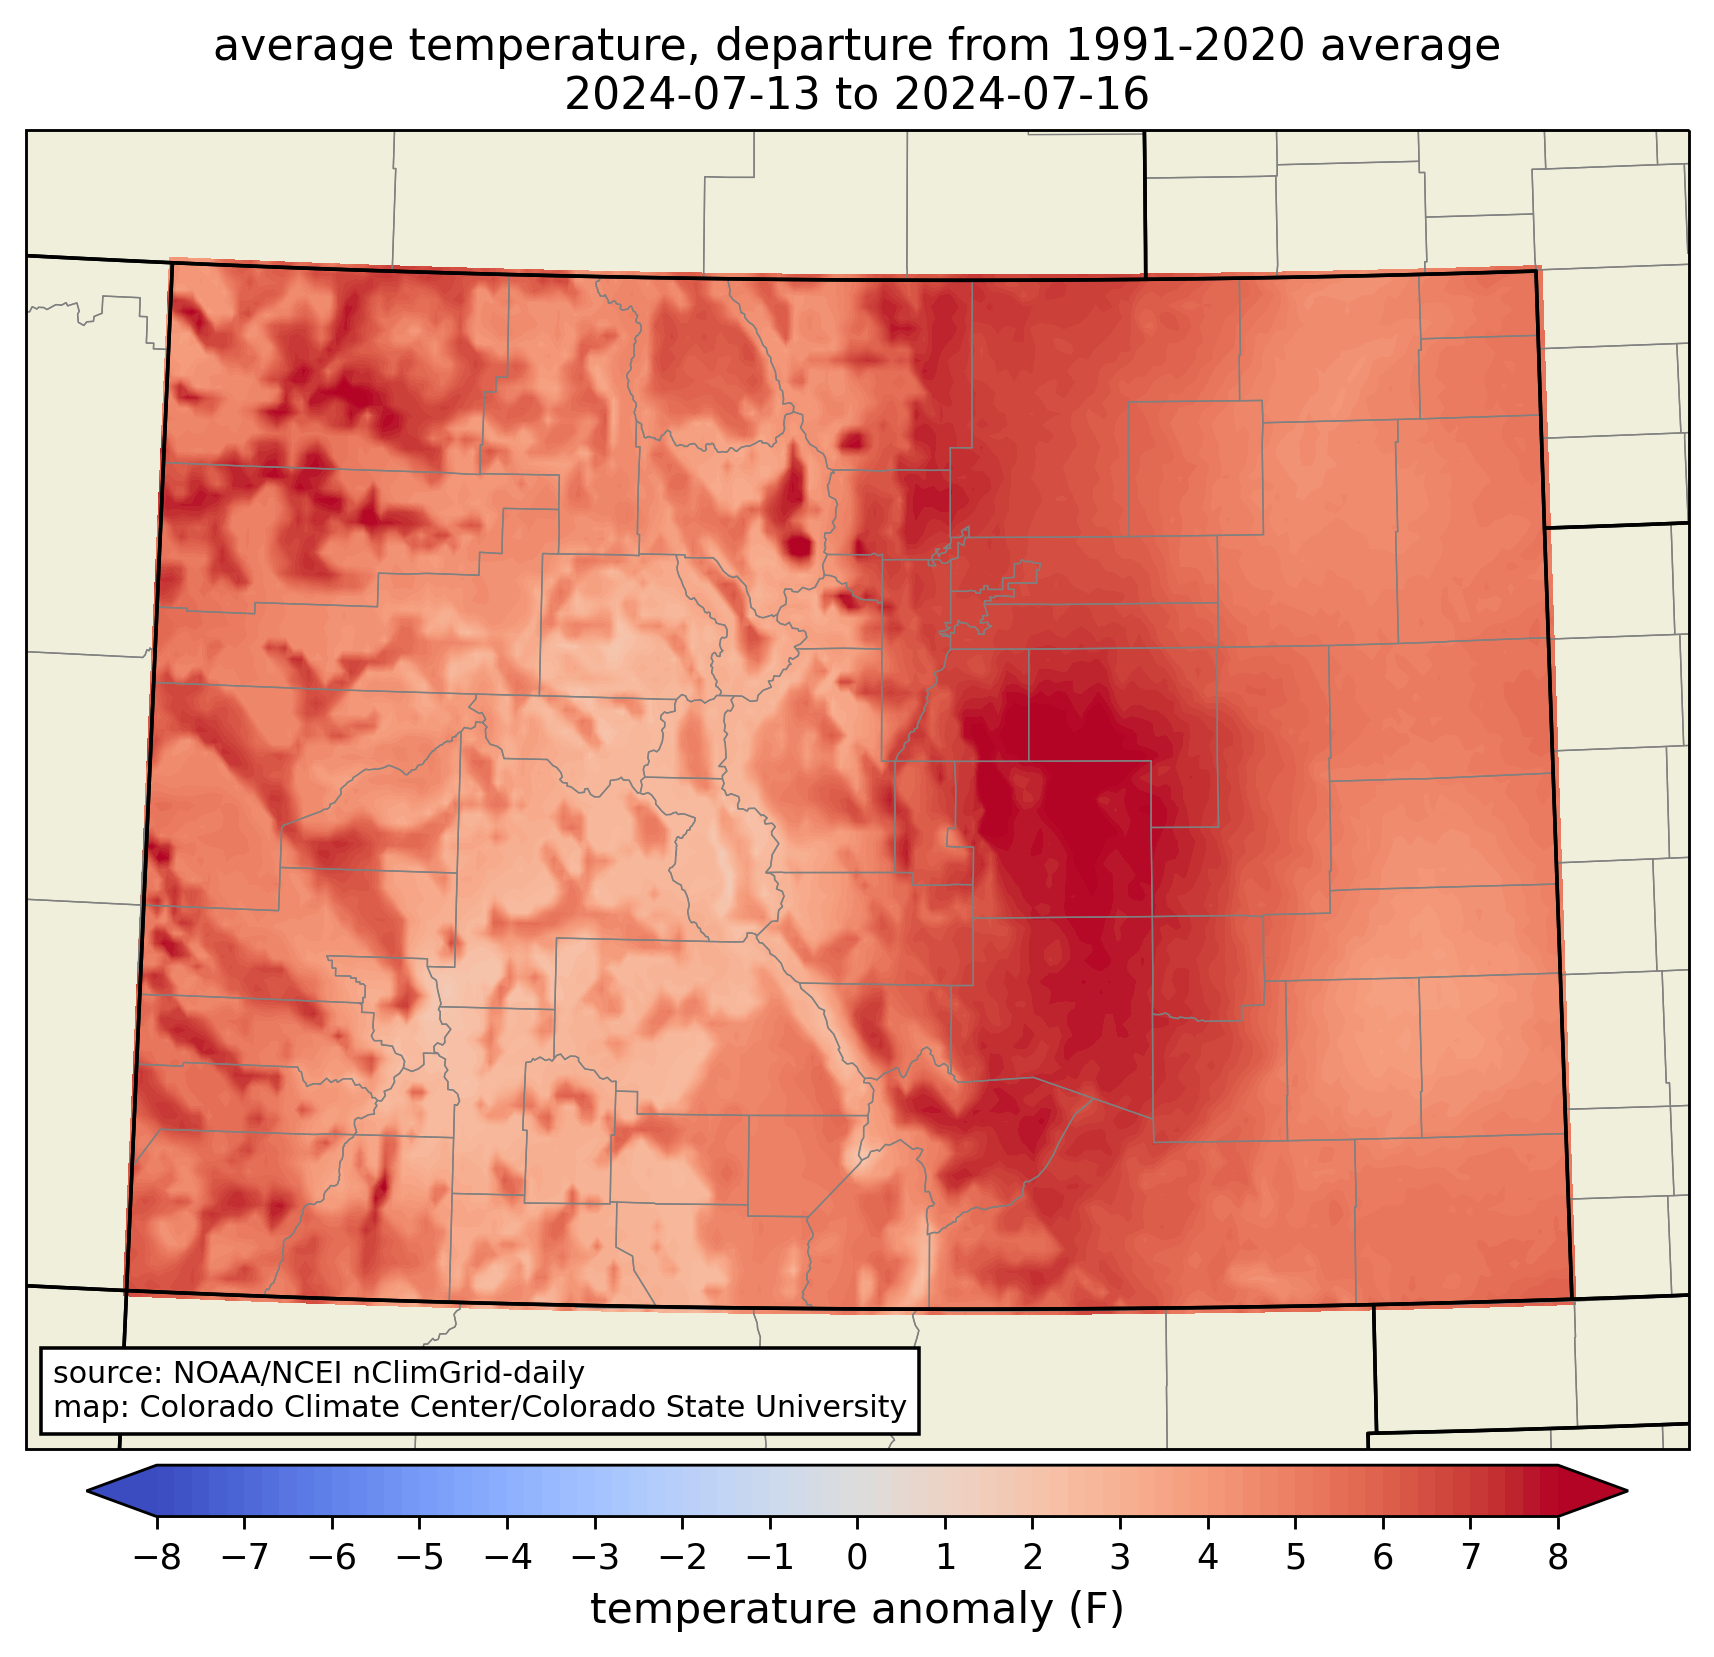
Temperature departure from average from NOAA’s nClimGrid dataset, for 13-16 July 2024. nClimGrid defines days as ending in the early morning, so this includes the period from the morning of the 12th through the morning of the 16th. Credit: Russ Schumacher/Colorado Climate Center
The very highest temperatures over this period were in some of the usual places at lower elevations, like the Arkansas Valley in southeast Colorado, and the Grand Valley on the western slope. But because these are Colorado’s usual hot spots, the heat wave wasn’t as extreme compared to average in those areas. The mountains provided their usual respite from the heat. (The long-term station at Dillon made it up to 84°F, which is pretty warm for a location that has never recorded a 90-degree day.) The temperature anomaly map shows that the Urban Corridor saw the most unusually hot conditions. From the Palmer Divide down through Pueblo County, most locations were more than 8°F above average over these four days.
How does this compare to past heat waves?
To address this question, we will build upon the analysis in the Climate Change in Colorado report, which looked at trends in four-day heat waves using NOAA’s nClimGrid-daily dataset, which goes back to 1951. In that analysis, we divided up Colorado into 11 alternate climate divisions, which better represent climate variability than the official divisions that are defined by river basins. (Interested in the details on this? We just had a paper published describing the method and results.) The map below shows where this heat wave ranked in those alternate climate divisions.
Map showing the ranking of the mid-July 2024 heat wave in different regions of Colorado, based on the nClimGrid-daily dataset going back to 1951. Overlapping time periods have been removed. If no ranking is shown in a region, the mid-July 2024 heat wave did not rank in the top 15. Credit: Colorado Climate Center
It wasn’t a record-breaker in any of the regions, but in the Northern Front Range and Pikes Peak regions, it was a top-10 four-day heat wave. Averaged across the entire state, it ranked as the 14th hottest 4-day heat wave since 1951. So, perhaps not one for the history books, but still worthy of the attention it received. You might then wonder, when were the heat waves that ranked at the top?
Rankings of the top 15 four-day heat waves for Colorado statewide, and for the Pikes Peak and Northern Front Range climate divisions. Based on NOAA nClimGrid-Daily, with overlapping periods removed. Credit: Colorado Climate Center
Pretty much everywhere in the state, the top-ranked four-day heat wave was from June 24-27, 2012. During this time period, multiple intense wildfires were raging across the state, including the Waldo Canyon fire that devastated neighborhoods on the west side of Colorado Springs. In second place statewide and in both the Pikes Peak and Northern Front Range climate divisions was in July 2005. Fort Collins set its all-time record high of 103°F during this heat wave. Mid-July of 1954 also shows up on these lists: many Front Range stations had their longest streaks of 100-degree days during that heat wave, although the nighttime lows were a bit cooler than the others so it doesn’t rank at the top overall.
What about the 1930s? What about climate change?
The nClimGrid-daily dataset, which features consistent data processing to allow for analysis of long-term changes, only goes back to 1951, which means it does not include the “dust bowl” era of the 1930s, during which intense heat and drought afflicted the Great Plains. At some individual long-term stations on Colorado’s eastern plains, heat waves in July of 1934 and 1936 still rank as hotter than those in more recent years (although at other stations, those records were surpassed by the June 2012 heat wave.) Grand Junction’s hottest 4-day period came in late July of 1931. Bob Henson and Jeff Masters at Yale Climate Connections recently published an insightful article on why the 1930s were so hot in North America, which includes the effects of poor soil management practices in the Great Plains.
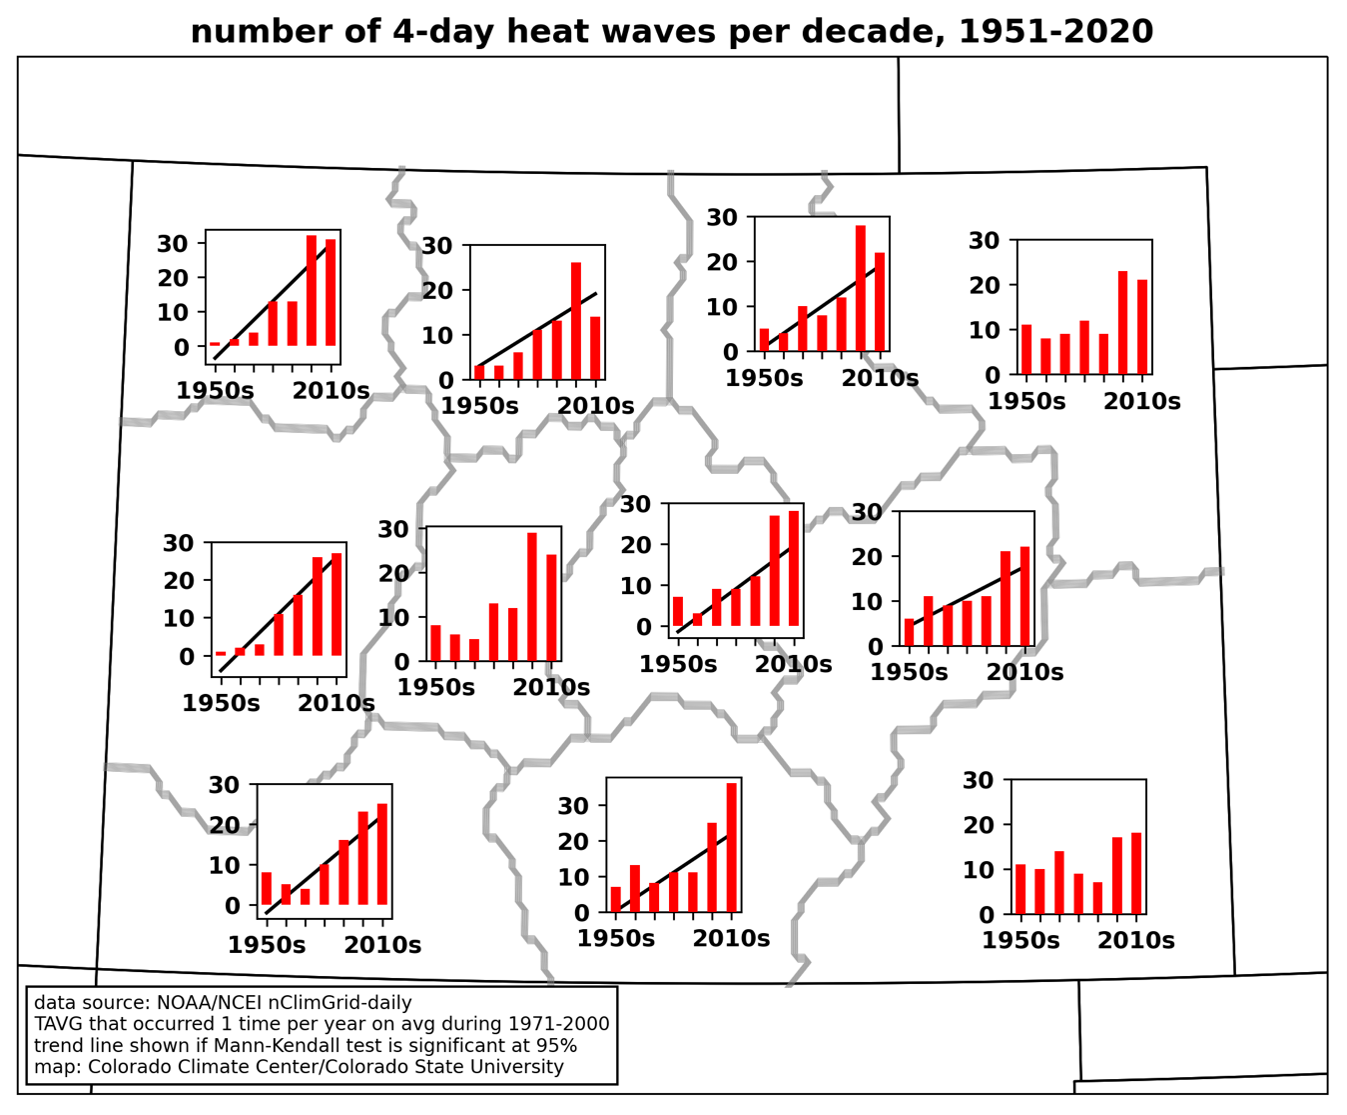
We also know that the climate is warming, and that the frequency of heat waves is increasing in the western US. Most regions of Colorado saw significant increases in the number of heat waves from 1951-2020 (the exceptions being the central mountains, and the northeastern and southeastern plains). And these trends continue: the right panel below shows an updated graph for the Pikes Peak region through the present. The first 3+ years of the 2020s already had 12 heat waves in this region, which is more than than any full decade between the 1950s and 1990s. Future climate projections show that the frequency of heat waves is expected to increase much more, even in a moderate-emissions scenario.
Figure 4.2 of Climate Change in Colorado. Time series of the number of 4-day heat waves per decade from 1951-2020 for each climate division. Heat waves are defined as a 4-day period in which the daily mean temperature (the sum of the daily maximum and minimum temperatures divided by two), averaged over the four days, exceeds the 4-day average temperature that was exceeded on average once per year during 1971-2000. Credit: Colorado Climate Center
Updated version for the Pikes Peak region through the mid-July 2024 heat wave. Note that the rightmost bar represents less than 4 years (2021-present) while the other bars are full decades. Credit: Colorado Climate Center
Overall, what we’ve seen in Colorado isn’t that the most-extreme heat waves are getting more extreme. Record-smashing events are very rare even in a warming climate, and when air masses are hot enough aloft to have the potential for record-breaking heat, they often have just enough moisture to produce clouds and storms that reduce the surface temperature by a degree or two. Instead, what we’re seeing is a steady increase of heat: heat waves that would have been few and far between in the 20th century are now becoming commonplace. (I was able to do an extended interview on this topic on Colorado Public Radio’s Colorado Matters program that you can listen to here.)
A concluding note is that even with this heat wave in the middle of the month, July as a whole has not actually been especially warm across Colorado. Many stations are near to even a little below normal for temperature for the month, with the refreshing weather around the 4th of July and the cooler, wetter conditions this past weekend. However, the last week of the month looks like it will bring more hot, dry weather. This may end up putting July above average for temperature when the month concludes, and could add to the tally of heat waves in Colorado as well.
Click the link to read the article on the NOAA website (Derek Lemoine):
July 26, 2024
This is a guest post by Dr. Derek Lemoine, who is APS Professor of Economics at the University of Arizona’s Eller College of Management and a Research Associate of the National Bureau of Economic Research. Dr. Sarah Kapnick, currently the NOAA Chief Scientist, collaborated with Dr. Lemoine on NOAA CPO-funded research while at the NOAA Geophysical Fluid Dynamics Laboratory.
As regular readers of the ENSO blog know, the National Oceanic and Atmospheric Administration (NOAA) issues forecasts of the large-scale climate patterns that we may see many months later. But they may not know that the El Niño Southern Oscillation (ENSO) Outlook is but one of the seasonal climate outlooks that NOAA produces. Creating and disseminating these outlooks requires a large investment in monitoring and forecasting systems, scientists, forecasters, and, of course, climate.gov bloggers. Do these outlooks matter in the financial world?
In a new paper published in Nature Communications, Dr. Sarah Kapnick and I (an atmospheric scientist and economist odd couple, in work done before she became NOAA Chief Scientist) show that they matter to investors in financial markets. And, importantly, some matter more than others.
But first…options!
To test whether seasonal outlooks influence the market, we examined how the prices of options on stocks changed when a seasonal outlook was released. Why test option prices rather than stock prices? We have a clear prediction for how option prices should move on average when an outlook is released, whereas we lack this clear prediction for stock prices (footnote #1).
An option gives you the right—but not the obligation—to either buy or sell a particular company’s stock at a predefined “strike” price by a predefined “expiration” date. Let’s imagine that you’ve bought an option to buy stock and the expiration date is upon you. Should you exercise the option? If the stock’s price is now above the strike price, then yes: you get to buy the stock cheaply and can, if you want, immediately sell it at the market price for a profit. If the stock’s price is below the strike price, then no: just buy the stock on the open market if you want it, since you would pay more than necessary by exercising the option.
Earlier on, before the expiration date draws nigh, you have a lot of upside from holding the option because the actual stock price could end up way above your strike. And you have no corresponding downside because you can always walk away and let your option expire unexercised if the stock price ends up below your strike. Who doesn’t like upside risk when it’s not contaminated with downside risk?
So, you like holding an option. Now consider how much you would pay to acquire it. You tend to be willing to pay more to buy an option when you are more uncertain about what the stock’s price on the expiration date will be, because you get more of that sweet upside risk still without bitter downside risk. Conversely, the more certain you are about the future price of the stock, the less you are willing to pay for the option. So, the current price of an option tells us how uncertain investors must be about the future stock price. This measure of uncertainty is called “implied volatility,” as it is implied by market data. All else equal, higher prices for options imply more expected volatility; lower prices imply less.
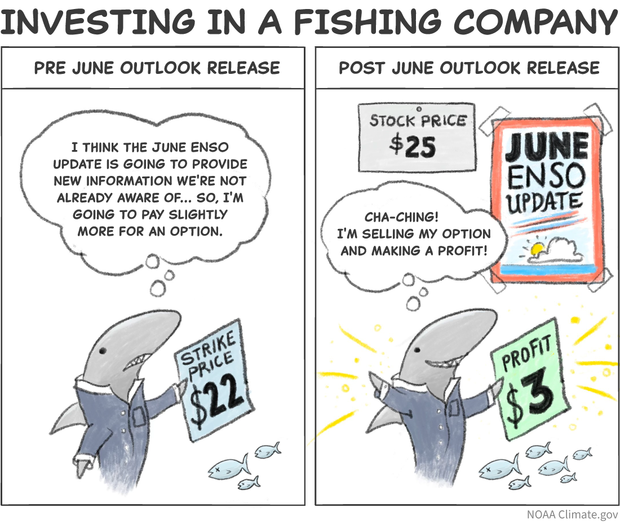
This cartoon shows a case where the investor made a profit, but a different pathway is plausible as well. It is possible when the expiration date arrives, it turns out the investor paid too much for the option and the strike price is larger than the price of the fishing stock. In which case the investor may decide to not exercise the option. Cartoon Credit: Anna Eshelman, climate.gov.
You too can bet on outlooks
Our work shows that, on average, the implied volatility will fall when a seasonal outlook is released, but ONLY IF investors think that the seasonal outlook might say something relevant to the firm’s stock price (footnote #2). If investors think the seasonal outlook is either worthless as a forecast or irrelevant to a particular firm, then the firm’s stock and option prices will not be affected by the outlook. If they instead believe the outlook is both skillful and potentially relevant to that firm, then, before the outlook is released, the firm’s stock and option prices should reflect investors’ expectations of what the outlook will say.
Once a relevant outlook is released, the firm’s stock and option prices change to reflect the new information in the outlook. A particular outlook could increase uncertainty about the company’s future stock price by forecasting an especially unpredictable climate. However, once we average over many outlook releases, uncertainty about the company’s future stock price (in the form of implied volatility) falls upon the release of outlooks, simply because investors are no longer uncertain about what an outlook will say once they have the outlook in hand.
An example
Imagine that you are investing in a fishing company whose profits are affected by the state of ENSO. Its stock price should already incorporate investors’ expectations about what NOAA’s upcoming ENSO Outlook will say. For instance, they may already think an El Niño is coming, based on past months’ outlooks. If you think that an upcoming monthly update is unlikely to have much new to say, then that upcoming monthly update does not make you willing to pay much more for an option on the firm’s stock. But what if, instead, you think that an upcoming monthly update could offer additional news about how strong that El Niño will be? The greater the potential for news that is relevant to the value of the fishing company, the more uncertain you are about what its stock price will be once the monthly update is released. You are then willing to pay more for an option to take advantage of uncertainty about the firm’s stock price induced by the ENSO Outlook.
Once the seasonal outlook is released, uncertainty about the outlook’s contents vanishes. You may still be uncertain about what the seasonal climate will be, but you are no longer uncertain about what the outlook will say about it or how the outlook will affect the company’s stock price. If the outlook did not contain much new information about the coming El Niño, then you are now not willing to pay as much as before for the option on the fishing company. If other investors make similar assessments, the price of the option will fall.
Our study tested whether the degree of uncertainty implied by option prices (“implied volatility” again!) did indeed fall on average when seasonal outlooks were released from 2010–2019. If implied volatility did tend to decline, then some fraction of investors must have judged these climate outlooks to be skillful at forecasting patterns that are relevant to firms’ valuations—and thus to their stock prices.
June ENSO Outlook affects option prices throughout the economy
We find that, across approximately three thousand firms traded in U.S. markets, implied volatility does fall when NOAA releases the ENSO Outlook in June and the Winter Outlook in October. Investors do not know what the ENSO and Winter Outlooks will say ahead of the release, but they apparently believe they could say something relevant to firms’ stock prices. We do not detect a response to NOAA’s May Hurricane Outlook or to two less skillful outlooks: Colorado State University’s April Hurricane Outlook or the Farmers’ Almanac’s August Winter Outlook (footnote #3).
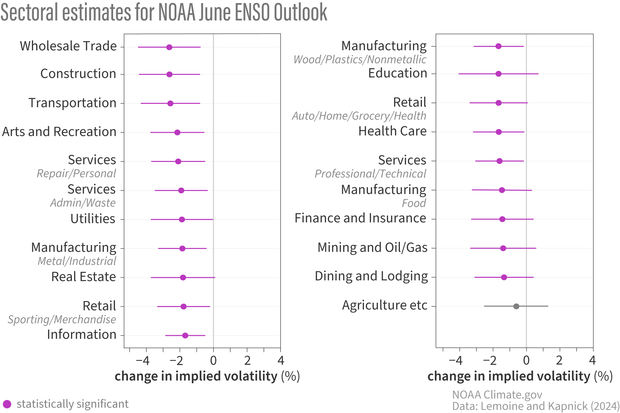
Because options are tied to particular companies, we can drill down on how broadly outlooks matter to different parts of the economy. When finely classifying firms into “industry groups”, we find that around 90% of industry groups see their implied volatility fall when NOAA releases the June ENSO Outlook. When we aggregate these industry groups into 21 broader “sectors”, we find significant effects of the June ENSO Outlook in an amazing 20 of them.
How much the June ENSO outlook matters to different sectors of the economy. Purple lines indicate a statistically significant change. Credit: Climate.gov, adapted from original by Lemoine and Kapnick.
Whether these economy-wide effects represent broad impacts of ENSO or instead represent impacts to particular firms rippling through trade networks, investors apparently believe ENSO has broad reach (footnote #4).
Overall, the June ENSO Outlook affects firms worth $13 trillion. An upcoming June ENSO Outlook incentivizes traders to pay an extra $12 million [95% confidence interval: $3.6–$20 million] to hold options. Traders seem to find this spending worth it in order to hedge the risk of what the outlook may say.
But what about other months’ ENSO Outlooks? The June ENSO Outlook was of most interest to us because it is the month when we’re most sure to be past the spring barrier and the accuracy of the ENSO Outlook increases. When we test each month’s ENSO Outlook, we indeed find that implied volatility falls by the largest amount upon the release of the June ENSO Outlook. In fact, that is the only month’s outlook for which the change in implied volatility is statistically significant.
Showing the change in implied volatility (%) by calendar month as a response to the ENSO outlook. The range shown in purple is statistically significant because all values of the 95% confidence interval (from top whisker to bottom whisker) are less than zero. The other months have ranges that overlap into positive values and, therefore, positive or zero change cannot be ruled out. Credit: Climate.gov, adapted from original by Lemoine and Kapnick.
We calculate how much traders value the increase in skill from the May to June Outlooks. We find that the more skillful June outlook carries an option market premium that is $9.4 million [95% confidence interval: -$1.6–$20.5 million] larger than the May outlook. Combining this additional premium with the difference in skill from this paper, we infer that a 1% improvement in ENSO prediction skill induces traders to spend an additional $1.8 million [95% confidence interval: -$0.31–$3.9 million] annually hedging news about seasonal climate.
Adaptation must not be a silver bullet
In practice, seasonal outlooks are even more valuable than what we estimate here. Traders have access to earlier forecasts of seasonal climate from forecasters besides NOAA and also from prior ENSO outlooks. This pre-existing information waters down the value of any specific month. Moreover, any value we do estimate remains only that from the financial sector (footnote #3 again).
It is important to understand what our estimates mean. We do not measure the impact of exposure to seasonal climate. We instead capture exposure to the forecasted portion of seasonal climate. If firms could costlessly and perfectly adjust to seasonal outlooks, then their stock and option prices would not be affected by the outlook’s contents. But this is not what we see. Therefore, adaptation based on these outlooks must be incomplete and/or costly: firms are exposed to the seasonal climate despite the early warning (perhaps because the information in the outlook is not actionable), and/or firms do adjust their exposure but only at some nontrivial cost that affects their value on the stock market. Seasonal outlooks are valuable, but they transform risk rather than eliminate it.
Lead Editor: Michelle L’Heureux (NOAA CPC)
Footnotes:
To test whether the outlooks influence the market, you might think about looking at stock prices and seeing whether they move when a seasonal outlook is released. However, if you look at only one year’s outlooks this way, then you couldn’t be sure that stock prices did or didn’t move due to some other news released that day. If you instead look at the average movement over many years’ releases, then (in theory) you should not find any average change in stock prices, even if the market did respond to the outlooks. Sometimes an outlook’s news goes in one direction, and sometimes it goes in the opposite direction. If investors form proper expectations of what the outlook will say, then these two types of news should cancel each other over time, leaving no net effect on average.
Technical point: Options’ prices and their implied volatilities are closely linked, but there is a subtle difference when talking about average changes in prices or implied volatilities. Ignoring one wrinkle that reflects aversion to risk, investors should never expect the price of an asset to move on average. Otherwise, they could make money on average by buying or selling it just before that movement, and such free opportunities to make money should not persist in a liquid market. It is possible for an option’s implied volatility to decline on average without its price changing on average because the level of the price reflects other factors that change over time, such as the price of the underlying stock and the time to expiration. This logic is why we test for changes in implied volatility, not in raw option prices.
This is not to say that these other outlooks do not matter or are worthless. We estimate only the value broadly reflected in financial markets. These outlooks may matter to smaller sets of firms, may matter to firms not traded in financial markets, and may matter for people in all sorts of ways that do not show up in stock prices.
Interestingly, the only sector for which we find no effect is agriculture, which is the sector one might have expected to be most exposed to weather. This exception may reflect ENSO being primarily linked to winter weather in the Northern Hemisphere and thus maybe not strongly linked to growing season weather (but see this post for a finer discussion) for the firms we study, which are listed in U.S. markets.