Another blast of Arctic air: this time, with a stretched but strong polar vortex — NOAA

Click the link to read the article on the NOAA website (Amy Butler and Laura Ciasto):

January 16, 2025

Weโ€™re briefly popping in because another surge of very cold air looks to drop down from the Arctic over a large region of the central US this weekend and into early next week. We know that the question will be asked: is the cold related to the polar vortex this time? So here we are to provide some answers.

There are two points we want to emphasize:

1. The polar vortex strength, as measured by the speed of the winds around the 60N latitude circle and 10 hPa pressure level, remains stronger than average, and is currently forecast by most models to return to near-record strong wind speeds into early February.

Observed and forecasted (NOAA GEFSv12) wind speed in the polar vortex compared to the natural range of variability (faint blue shading). Since mid-November, the winds at 60 degrees North (the mean location of the polar vortex) have been stronger than normal. According to the GEFSv12 forecast issued on January 15 2025, those winds are forecast to remain stronger than normal for at least the next few weeks (bold red line). NOAA Climate.gov image, adapted from original by Laura Ciasto.

Normally, if the polar vortex is communicating with the surface, which it finally has been in the last couple of days, a strong polar vortex would be associated with persistent warmth over much of Europe, Asia, and the eastern US. (A strong polar vortex is usually associated with a northward shifted jet stream that keeps the coldest air corralled over the pole.) Europe and Asia are indeed anticipating warmer than average conditions next week, but not the US. So something else is going on over the US that is overwhelming the โ€œstrong polar vortexโ€ signal.

2. We discussed how we didnโ€™t think the shape or stretching of the polar vortex contributed to the last cold air outbreak, because in the lower stratosphere the vortex was shifted towards Asia and not stretched over North America. However, in this case, the vortex is actually forecast to stretch throughout its entire depth (10-30 miles above the surface) over Canada and the Hudson Bay. So unlike last week, this time the stretched out polar vortex may be associated with the forecasted southward shift of the jet stream, which allows the troposphereโ€™s cold Arctic air to spill into the continental US.

The forecasted structure of the tropospheric jet stream (yellow) and several levels of the stratospheric polar vortex from the lower stratosphere to the upper stratosphere in the NOAA GFS model for 17 January 2025 (initialized on 16 January 2025). The contours show how the stretched polar vortex corresponds to the southward shift of the jet stream over North America. NOAA Climate.gov image, adapted from original by Laura Ciasto.

However, we want to reemphasize that โ€œassociated withโ€ still does not mean one thing caused another, and in this case, itโ€™s still difficult to understand what is causing what. Additionally, a strong ridge of high pressure has been building up simultaneously near Alaska, which can also help force the jet stream to dive down south over the continental US and bring cold Arctic air with it, independent of the polar vortex.

Downstream of a “ridge” over Alaska, the jet stream (the winds at the 250-millibar pressure level) is forecasted to make a deep dip (known as a “trough” to meteorologists) into the United States over the weekend of January 18, 2025, according to NOAA’s Global Forecast System. NOAA Climate.gov animation based on a screen recording from theย Earth Null School website.

To sum up: Unlike last time (Jan 5-7), the stretching of the polar vortex is extending through the entire column and is โ€œin-syncโ€ with the extension of the jet. But we donโ€™t know the directionality (what caused what), and other tropospheric factors like the strong Alaskan ridging are definitely big players. And while things are more in-line this time, cold air outbreaks donโ€™t only happen because of the polar vortex.

#Colorado in 2024: fourth warmest year on record: Just 2 all-time lows compared to 120 all-time highs — Allen Best (BigPivots.com) #ActOnClimate

Click the link to read the article on the Big Pivots website (Allen Best):

January 11, 2025

It was another warm year in Colorado, part of a theme. Russ Schumacher, the state climatologist, reports 2024 was the 4th warmest on record, 3 degrees warmer than the 20th century average when temperatures across the state were averaged for the year.

Eight of the 10 warmest years in Coloradoโ€™s recorded history have been since 2012.

From his base in Akron, 115 miles northeast of Denver, Joel Schneekloth observed temperatures that fit in with this trend.

โ€œWe really had warm days but even warmer nights,โ€ reported Schneekloth, who is a regional water specialist with the Colorado Water Institute. โ€œBut we didnโ€™t have a string of 100 degree days like we had in 2012 and 2002. We had 100 just once or twice this year.โ€

To be clear, it can still get cold in Colorado. This is not quite up to Lake Wobegon standards, where all the children are above average. But all the action has been on the high side of the thermometer โ€” or on the lack of cold.. That was particularly true in December.

The Colorado Climate Center reported 120 new all-time high temperatures along with 25 tied records. Nights, as Schneekloth noted, were also warm. There were 129 records for the high minimum temperature.

On the flip side, it had two all-time cold temperatures.

Notable was the warmth of December. โ€œIt was very warm across Colorado, or perhaps more accurately, there was a distinct lack of cold,โ€ Schumacher wrote.

โ€œIt really was the lack of any real cold in December that led to the record-breaking temperatures for the month,โ€ he told Big Pivots.

โ€œHighs in the low 70s arenโ€™t especially remarkable in December, but many stations set records for the warmest low temperature for December. For example, at Sedgwick, the lowest temperature in December was 11F โ€“ the previous warmest low temperature for December was 9F. This is true at numerous stations in northeastern Colorado. Fort Collins only got down to 15 in December. The previous record  was 12 Akron only got to 10; the previous record was 8.โ€

At many stations, the second or third warmest low for December was just the previous year (2023), a December with a similar lack of cold.

Precipitation, on the other hand, was above average statewide but not abnormally so, 35th wettest in records across the past 130 years. The story of rain and snow, however, was not uniform. The southern San Luis Valley had its wettest calendar year on record. Lands north of Fort Collins and Greeley, along the Wyoming border, much drier than average.

Congressional delays cause uncertainty for water conservation program: Upper #Colorado River Commission not yet accepting applications for System Conservation in 2025 — Heather Sackett (AspenJournalism.org) #ColoradoRiver #COriver #aridification #CRWUA2024

These hay bales stand ready to be collected on a ranch outside of Carbondale in July 2024. A program that pays irrigators in the Upper Colorado River Basin to cut back is facing uncertainty in 2025 because of Congressional delays.ย Credit:ย Heather Sackett/Aspen Journalism

Click the link to read the article on the Aspen Journalism website (Heather Sackett):

January 11, 2025

A federally funded water conservation program in the Upper Colorado River Basin is facing uncertainty for 2025 after the bill to authorize funding for it stalled in Congress late last year.

On Friday, Upper Colorado River Commission Executive Director Chuck Cullom said the commission planned to communicate to participants in the 2024 System Conservation Pilot Program that the UCRC is not accepting applications at this time for a 2025 program. Officials will let people know later this month if and when the application process will open for 2025. 

According to a post on the UCRCโ€™s website, which has since been removed, applications were potentially going to be available Jan. 9, with a now-cancelled informational webinar scheduled for Jan. 10. 

Officials are holding out hope that the program can still get federal authorization in time for water users โ€” mostly farmers and ranchers โ€” in Colorado, New Mexico, Utah and Wyoming to conserve water during the upcoming growing season. 

โ€œThe commission recognizes that SCPP has been an important and useful tool for the Upper Basin to understand the opportunities and issues that conservation programs represent,โ€ Cullom said. โ€œWe are hopeful we will have that tool available in 2025 and again in 2026.โ€

The System Conservation Pilot Program, which pays water users who volunteer to cut back, was restarted in 2023 as part of the Upper Basinโ€™s 5-Point Plan, designed to protect critical infrastructure from plummeting reservoir levels. Over two years, the program spent about $45 million to save about 101,000 acre-feet of water. Funding for SCPP comes from $125 million allocated through the Inflation Reduction Act.

The U.S. Bureau of Reclamationโ€™s authorization to spend this money expired in December and now must be renewed if the program is to continue.

Anthony Rivera-Rodriguez, a press secretary with the office of U.S. Sen. John Hickenlooper, D-Colo., said lawmakers plan to introduce a new bill for funding authorization in the next couple of weeks. He said funding for Western drought programs has not been controversial and has received bipartisan support. The authorization didnโ€™t pass in December, he said, because lawmakers simply ran out of time before the end of the session. The Colorado Sun reported last month that the Senate passed the Colorado River Basin System Conservation Extension Act, but the House of Representatives โ€œleft it on the chopping block as lawmakers raced to pass legislation to avoid a government shutdown.โ€

โ€œWe are trying to get this authorized as soon as we possibly can,โ€ Rivera-Rodriguez said.

SCPP has been dogged by controversy since it was rebooted in 2023. The program originally took place from 2015 to 2018. 

SCPP has been criticized for aย lack of transparencyย in the 2023 program, not measuring and tracking how much of the conserved water eventually makes it to Lake Powell, and for its potential negative impacts, in general, to the agricultural communities of the Western Slope and, in particular, to anย irrigation company in the Grand Valley. In response to the second criticism, officials are working on how Upper Basin states could โ€œget creditโ€ for conserved water through aย memorandum of understandingย with the U.S. Bureau of Reclamation.

Delta County farmer Paul Kehmeier kneels by gated pipes in his familyโ€™s alfalfa field. Kehmeier participated in the 2024 System Conservation Pilot Program and said he would again in 2025 if funding is reauthorized by Congress. Credit: Natalie Keltner-McNeil/Aspen Journalism

Whether reauthorization will come quickly enough for Upper Basin agricultural producers to participate in the upcoming irrigation season remains to be seen. Short notice and a hasty rollout of SCPP for the 2023 growing season meant low participation numbers for that year, with just 66 water-saving projects and about 38,000 acre-feet conserved across the four Upper Basin states. The number of projects in 2024 jumped to 109, with about 64,000 acre-feet conserved.

A last-minute reprieve for the program wouldnโ€™t be a problem for one Delta County rancher who participated in SCPP in 2024. Paul Kehmeier enrolled 58 acres of his ranch in the program last year and said he plans to participate again if the program is extended. 

โ€œThere are two reasons that Iโ€™m planning to participate,โ€ Kehmeier said. โ€œOne is that the money is very good, and second is that I donโ€™t think we in the Upper Basin can stick our heads in the sand on all this big river stuff. โ€ฆ My irrigation season starts April 1, so anytime up until the last day of March, if I had a chance to participate, I would jump at the chance.โ€

The reauthorization of System Conservation comes at a pivotal moment for water users on the Colorado River. Negotiations between the Upper Basin states and the Lower Basin states (California, Arizona, Nevada) on how shortages will be shared after 2026 have ground to a halt. Lower Basin water managers say all seven states that use the Colorado River must share cuts under the driest conditions, while Upper Basin officials maintain they already take cuts in dry years because they are squeezed by climate change and canโ€™t rely on the massive storage buckets of Lake Powell and Lake Mead for their water supply. Upper Basin leaders also maintain that they shouldnโ€™t have to share additional cuts because their states have never used the entire 7.5 million-acre-foot apportionment given to them by the Colorado River Compact, while the Lower Basin regularly uses its full allotment.

But there has been a recognition in recent months by some Upper Basin officials that their states will have to participate in some kind of future conservation program โ€” SCPP or otherwise โ€” on a river whose flows have declined over the past two decades due to drought and climate change. 

โ€œAs we get more familiar with this, maybe that can be ramped up to 100,000, 200,000 (acre-feet), I donโ€™t know,โ€ Esteban Lopez, the UCRC commissioner from New Mexico, told attendees at the December Colorado River Water Users Association Conference in Las Vegas. โ€œMaybe we can get there, maybe we canโ€™t. But the point is: We will conserve and we will commit to conserve what we can conserve when thereโ€™s water available and put it in an account in Lake Powell.โ€

This story ran in the Jan. 12 edition of The Aspen Times and SkyHi News.

Map of the Colorado River drainage basin, created using USGS data. By Shannon1 Creative Commons Attribution-Share Alike 4.0

U.S. Representative Joe Neguse Announces $2.4 Million in Infrastructure Funding for Water Resiliency & Restoration Projects in Grand and Boulder Counties

Colorado Rivers. Credit: Geology.com

January 10, 2025

Lafayette, CO โ€” Today, House Assistant Minority Leader Joe Neguse, Co-Chair of the Colorado River Caucus, announced $2.4 million from the Bipartisan Infrastructure Law for two projects in Coloradoโ€™s 2nd District aimed at restoring and improving the ecological conditions of local waterways and aquatic habitat near the communities of Granby and Boulder. These investments were allocated by the Bureau of Reclamationโ€™s WaterSMART Environmental Water Resources Projects program.

โ€œLocal communities are instrumental in protecting and restoring Coloradoโ€™s rivers and streams. This important funding will support locally driven projects that enhance watershed health and resiliency, restore ecological conditions, and embody the spirit of ecological stewardship,โ€ said Assistant Leader Neguse. 

โ€œColorado is focused on protecting our vital water sources so that there is plenty of clean water for our communities and environment. I applaud Rep. Neguse’s leadership in Congress to pass federal legislation that is delivering for Colorado, and thank our State agencies and Coloradans carrying out these important projects,โ€ said Governor Jared Polis.

Projects in Coloradoโ€™s 2nd Congressional District include the Upper Colorado River Ecosystem Enhancement Project, managed by the Grand County Learning By Doing Cooperative Effort (LBD), and the Boulder Creek Headwaters Resiliency Project, led by the Boulder Watershed Collective. Additional information on both can be found HERE and below: 

  • $1,425,859ย for the Upper Colorado River Ecosystem Enhancement Project, to restore two stream reaches on the Fraser River and Willow Creek near the community of Granby.ย 
  • $954,204ย for the Boulder Creek Headwaters Resiliency Project, to restore and improve the ecological condition of 181 acres of degraded aquatic and riparian habitat, and 2.8 miles of wet meadow streams throughout the Boulder Creek Watershed near Boulder.ย 

โ€œThis is just another great example of the successful collaboration taking place in Grand County across a wide range of stakeholders that is resulting in very tangible improvements in the ecological health of the Colorado River headwaters,โ€ according to a statement from the Grand County Learning By Doing Management Committee. 

โ€œThe projects selected are working through a collaborative process to achieve nature-based solutions for the health of our watersheds and river ecosystems to increase drought resiliency,โ€ said Reclamation Commissioner Camille Calimlim Touton. โ€œThis historic investment from the Bipartisan Infrastructure Law gives Reclamation the opportunity to continue to collaborate with our stakeholders to leverage funds for these multi-benefit projects.โ€

โ€œDenver Water is proud to support ongoing stream improvement projects like those to be funded in this latest round of federal funding. Congratulations to Grand County Learning by Doing on this award. We look forward to working with our partners on the upcoming restoration work to Willow Creek and the Fraser River to benefit the Colorado River Basin,โ€ said Rick Marsicek, Chief of Water Resource Strategy at Denver Water.

Background

Assistant Leader Joe Neguse, whose district includes the headwaters of the Colorado River, has been steadfast in his efforts to address water-related issues, working to enact significant bills that invest in drought resilience and water management, while providing environmental benefits. Most recently, President Joe Biden signed his bill to extend authorization for the highly successful Upper Colorado and San Juan River Basins Endangered Fish Recovery Programs into law. Neguse also recently enacted the Drought Preparedness Act and Water Monitoring and Tracking Essential Resources (WATER) Data Improvement Act

As co-founder and Co-Chair of the Congressional Colorado River Caucus, Neguse has brought together a bipartisan mix of lawmakers each representing a state along the Colorado River Basin. The group is working to build consensus on critical issues plaguing the river and support the work of the Colorado River Basin states on how best to address the worsening levels of drought in the Colorado River Basin. 

The Rocky Mountains have gotten near-average snow this year. So, why are forecasts for #LakePowell inflows so low? — The Salt Lake Tribune #snowpack #runoff

Westwide SNOTEL basin-filled map January 16, 2025 via the NRCS.

Click the link to read the article on The Salt Lake Tribune website (Anastasia Hufham). Here’s an excerpt:

January 15, 2025

Snowpack levels across the Upper Colorado River Basin are close to average for this time of year, but forecasters say that might not translate to a comfortable year for the Colorado River…Moser reported that snow levels above Lake Powell, which straddles Utahโ€™s shared state line with Arizona, are 94% of average as of Jan. 1. (โ€œAverage,โ€ in forecasting, refers to the average precipitation between 1991 and 2020.) But forecasters currently predict that runoff into the reservoir between April and July will only be 81% of the thirty-year average. Thatโ€™s a drop from theย December forecast, which projected inflows of 92% of average…

Utahโ€™s soil moisture is also below average and worse than it was this time last year. That could impact how much water reaches the Colorado River and Lake Powell, since dry soil absorbs melting snow, leaving less water to run off mountains and into reservoirs this spring. In terms of actual water, 81% of normal runoff into Lake Powell between April and July is 5.15 million acre-feet; the median runoff over the last thirty years has been 6.13 million acre-feet.

Video: “Shoshone: The River’s Sentinel” — The #ColoradoRiver District #COriver #aridification

The Shoshone hydro plant in Glenwood Canyon. The River District has made a deal with Xcel Energy to buy the water rights associated with the plant to keep water flowing on the Western Slope. Credit: Heather Sackett/Aspen Journalism

The century-old water rights of the Shoshone Power Plant are essential to maintaining the flow and vitality of Colorado’s namesake river. The Colorado River District, alongside a diverse coalition of supporters, is working tirelessly to safeguard this critical resource, ensuring its benefits endure for ecosystems, communities, and future generations across Coloradoโ€™s Western Slope. Learn more at keepshoshoneflowing.org Learn more about the Colorado River District at ColoradoRiverDistrict.org

#Drought news January 16, 2025: D1 was expanded across southwestern #Colorado due to low snow water equivalent and 60-day SPI

Click on a thumbnail graphic to view a gallery of drought data from the US Drought Monitor website.

Click the link to go to the US Drought Monitor website. Here’s an excerpt:

This Week’s Drought Summary

On January 9 and 10, a low pressure system tracked along the Gulf Coast and resulted in widespread precipitation (1 to 2.5 inches, liquid equivalent) from eastern Texas and the Lower Mississippi Valley east to the Florida Panhandle. On the northern extent of this storm, snow blanketed areas from Oklahoma and Arkansas to north Georgia. This precipitation during the second week of January supported drought improvement. However, drought expanded and intensified for the Florida Peninsula, eastern North Carolina, west-central Texas, and the Southwest. During the first two weeks of January, multiple Arctic surface highs shifted south from Canada and temperatures (January 1-13) averaged 4 to 8 degrees F below normal for much of the Great Plains, Middle to Lower Mississippi Valley, and Southeast. A very dry start to the wet season continued to affect southern California with worsening drought conditions, periodic Santa Ana winds, and large wildfires. Enhanced trade winds, typical during a La Niรฑa winter, resulted in improving drought for the windward side of the Hawaiian Islands…

High Plains

The Central High Plains continued to have worsening drought conditions and moderate drought (D1) was expanded across portions of southwestern Nebraska using 60-day SPI, soil moisture below the 10th percentile, and the NDMC short-term blend. Although light precipitation (less than 0.5 inch, liquid equivalent) fell across parts of south-central to southeastern Kansas, this precipitation was too low to justify any improvements. Elsewhere, across the Central to Northern Great Plains, no changes were made as early to mid-January is a dry time of year. D1 was expanded across southwestern Colorado due to low snow water equivalent and 60-day SPI…

Colorado Drought Monitor one week change map ending January 14, 2025.

West

Severe drought (D2) was expanded to include all of southern California due to the very dry start to the water year to date (WYTD) from October 1, 2024 to January 13, 2025. The D2 coverage coincides with where WYTD precipitation has averaged less than 5 percent of normal. [ed. emphasis mine] A number of locations, including San Diego, are having their driest start to the water year. The D2 covers Los Angeles and Ventura counties which are being affected by periodic Santa Ana winds drying out vegetation and large wildfires. Following the two wet winters, the large reservoirs throughout California are at or above-normal. Based on 90-day SPI, declining soil moisture, and low snow water equivalent, a 1-category degradation was warranted for parts of Arizona and southwestern Utah. A mix of improvements and degradations were made to Idaho and the depiction is generally consistent with the 2024-2025 WYTD precipitation and snowpack. Eastern Washington and much of Oregon are drought-free, but low snowpack supports moderate drought (D1) along the northern Cascades of Washington. A 1-category improvement was justified for a portion of central Montana, based on 90-day SPEI along with snow water equivalent (SWE) above the 75th percentile. As of January 14, SWE was above-normal (period of record: 1991-2020) across the southern Cascades along with eastern Oregon and southwestern Idaho. SWE varies for the Sierra Nevada Mountains, those numbers are beginning to decrease after a drier-than-normal start to January. SWE remained well below-normal across the Four Corners Region…

South

More than 1 to 1.5 inches of precipitation (liquid equivalent) supported improvements for portions of eastern Texas, Arkansas, Louisiana, and Mississippi. The small areas of severe drought (D2) were discontinued in northeastern Mississippi due to: 28-day average streamflows near the 20th percentile, soil moisture recovery, and a consensus of SPIs in D1 at worst. In addition, there is no support for maintaining D2 in the NDMC short- and long-term blends. Precipitation during the first two weeks of January resulted in a slight reduction in extreme drought (D3) across south-central Tennessee. For central Texas which received generous precipitation for this time of year, low 28-day streamflows (below the 20th percentile in D1 and 10th percentile in D2) precluded a larger area for a 1-category improvement. D2 to D3 drought was expanded across the Edwards Plateau of Texas due to 28-day average streamflows below the 10th and 5th percentile, respectively…

Looking Ahead

Another Arctic air outbreak is forecast for the central and eastern U.S. during mid-January as surface high pressure shifts south from Canada. By January 20, subzero minimum temperatures are expected as far south as the Central Great Plains, Middle Mississippi Valley, and Ohio Valley. During January 16-20, little to no precipitation is forecast from the West Coast to the Mississippi Valley with light to moderate precipitation amounts (0.5 to 1 inch) limited to the Southeast. These amounts, however, have been sufficient for rainfall to almost keep up with demand, and the near-normal amounts the past 2 weeks have kept the area out of D0 conditions for the time being, but the situation needs to be closely monitored for signs of increasing dryness impacts. Daily rainfall reports are not available for Mili since the start of January 2025, but 45.59โ€ fell during October-December 2024, above the normal of 36.55โ€ and well above the amount needed to keep up with demand, which is sufficient to keep D0 conditions at bay regardless the rainfall during the past 2 weeks.

The Climate Prediction Centerโ€™s 6-10 day outlook (valid January 21-25, 2025) favors below-normal temperatures to persist for much of the contiguous U.S. with the largest below-normal temperature probabilities (exceeding 80 percent) extending from the Mid-Atlantic and Ohio Valley south to the Gulf Coast. Elevated above-normal precipitation probabilities are forecast for the northern Great Plains, Gulf Coast, and portions of the Southeast. Below-normal precipitation is favored for the West, Central Great Plains, Midwest, and New England.

US Drought Monitor one week change map ending January 14, 2025.

Record precipitation in 2024 gave little relief to irrigators: Most of the water ended up in the soil, not the unconfined aquifer — @AlamosaCitizen #RioGrande #SanLuisValley

Gauging station near Mogote on the Conejos River. Record precipitation did not translate to record river flows. Credit: The Citizen

Click the link to read the article on the Alamosa Citizen website:

January 15, 2025

Alamosa never gets 16 inches of total precipitation in a year. Never. Ever. Except that it did in 2024. 

Turns out, 2024 was among the wettest on record across the San Luis Valley going back to 1895, with all six counties registering historic levels of precipitation. Here are the precipitation totals by county, according to data from the NOAA National Centers for Environmental Information:

  • Alamosa County, 16.75 inches
  • Conejos County, 24.29 inches
  • Costilla County, 22.53 inches
  • Mineral County, 32.60 inches
  • Rio Grande County, 19.66 inches
  • Saguache County, 21.86 inches

The headscratching is how so much moisture was realized in a year when the unconfined aquifer of the Upper Rio Grande Basin dropped to near its lowest level, which became problematic for irrigators who are under orders by the state of Colorado to reduce their groundwater pumping to help recover the ailing aquifer.

โ€œTwo things,โ€ said Cleave Simpson, general manager of the Rio Grande Water Conservation District and local hay grower. โ€œWe didnโ€™t have continuous steady snowpack in the winter months that put us in a good position, and then the volume of snow we got was on top of drier conditions last fall where moisture, instead of showing up in a stream, ends up in the ground in soil conditions.

โ€œSo to that end, this year at my farm in October, I get an inch and a half of rain, in October. That never, ever happens. So the hope is then, that nice soil moisture that we got in October will set us up for success.โ€

Craig Cotten, division engineer for the Colorado Division of Water Resources, said the wet 2024 was a boon to local farmers and their efforts to recover the Valleyโ€™s aquifers. What it didnโ€™t do was increase the amount of water stored in reservoirs.

โ€œThe reservoirs in the Rio Grande Basin in Colorado typically store water in winter when the senior priority ditches are shut off. The reservoirs can also store during the irrigation season, but only if there is a significant amount of water in the rivers to serve not only the irrigation ditches but the reservoirs as well,โ€ said Cotten.

โ€œThis typically requires very high river flows, which did not occur in 2024 even with the rain events that were the primary reason for the high precipitation total in 2024. The significant rains in the Rio Grande Basin did increase the river flows, but not enough to get the reservoirs into priority. The increase in reservoir storage in 2024 was about typical of what occurs in an average year.โ€

Without the high levels of precipitation in 2024, the critical unconfined aquifer was in danger of falling to a level of storage nobody was expecting to see after years of irrigators working to reduce their groundwater pumping.

Colorado precipitation for the 12 months ending January 15, 2024. Credit: High Plains Regional Climate Center.

โ€œThe large amount of precipitation in the Rio Grande Basin during the summer of 2024 helped the unconfined aquifer in multiple ways,โ€ said Cotten. โ€œThis precipitation increased the streamflow in the Rio Grande throughout the summer, allowing the ditches and canals to divert more water than they otherwise would have.

โ€œThis increased diversion in turn allowed delivery of a higher amount of water into recharge pits and the aquifer. The precipitation also helped to meet the irrigation needs of the crops, allowing the farmers to not pump their wells as much as they would otherwise.โ€

The hope among local farmers is that the wet fall months of 2024, when October and November delivered more than 11 inches of snow, will translate into an above-average spring runoff and give a boost to surface water coming into the Valley in 2025.

Rio Grande and Pecos River basins. Map credit: By Kmusser – Own work, Elevation data from SRTM, drainage basin from GTOPO [1], U.S. stream from the National Atlas [2], all other features from Vector Map., CC BY-SA 3.0, https://commons.wikimedia.org/w/index.php?curid=11218868

Research letter: Crowdsourced Data Reveal Shortcomings in Precipitation Phase Products for Rain and Snow Partitioning — AGU

Figure 1: The sample size and spatial distribution of the MRoS data across ecoregions within CONUS. The gray shaded area represents the high-resolution (250 m) global mountains version 3 derived from terrain characteristics (Karagulle et al., 2017; referred to as K3 mountains). The level-3 code for each ecoregion is also shown and they are: 1-Coast Range, 2-Puget Lowlands, 3-Willamette Valley, 4-Cascades, 5-Sierra Nevada, 8-Southern California Mountains, 9-Eastern Cascade Slopes and Foothills, 12-Snake River Plain, 13-Central Basin and Range, 14-Mojave Basin and Range, 15-Northern Rockies, 16-Idaho Batholith, 17-Middle Rockies, 18-Wyoming Basin, 20-Colorado Plateaus, 21-Southern Rockies, 25-High Plains, 26-Southwestern Tablelands, 43-Northwestern Great Plains, 58-Northeastern Highlands, 59-Northeastern Coastal Zone, 60-Northern Allegheny Plateau, 78- Klamath Mountains, and 83-Eastern Great Lakes Lowlands.

Click the link to access the letter on the AGU website (Guo Yu,ย Keith S. Jennings,ย Benjamin J. Hatchett,ย Anne W. Nolin,ย Nayoung Hur,ย Meghan Collins,ย Anne Heggli,ย Sonia Tonino,ย Monica M. Arienzo). Here’s the abstract:

December 23, 2024

Reanalysis products support our understanding of how the precipitation phase influences hydrology across scales. However, a lack of validation data hinders the evaluation of a reanalysis-estimated precipitation phase. In this study, we used a novel dataset from the Mountain Rain or Snow (MRoS) citizen science project to compare 39,680 MRoS observations from January 2020 to July 2023 across the conterminous United States (CONUS) to assess three precipitation phase products. These products included the Global Precipitation Measurement (GPM) mission Integrated Multi-satellitE Retrievals for GPM (IMERG), the Modern-Era Retrospective Analysis for Research and Applications (MERRA-2), and the North American Land Data Assimilation System (NLDAS-2). The overall critical success indices for detecting rainfall (snowfall) for IMERG, MERRA-2, and NLDAS-2 were 0.51 (0.79), 0.49 (0.77), and 0.54 (0.53), respectively. These indices show that IMERG and MERRA-2 reasonably classify snowfall, whereas NLDAS-2 overestimates rainfall. All products performed poorly in detecting subfreezing rainfall and snowfall above 2ยฐC. Therefore, crowdsourced data provides a unique validation source to improve the capabilities of reanalysis products.

Key Points

  • The Mountain Rain or Snow citizen science project collected a novel dataset of 39,680 observations of precipitation phases across the US
  • The precipitation reanalysis products performed poorly in detecting subfreezing rainfall and snowfall above 2ยฐC
  • The crowdsourced data provides a unique validation source to improve the capabilities of reanalysis products

Plain Language Summary

Distinguishing between rain and snow is challenging. This study used a unique crowdsourced dataset from the Mountain Rain or Snow (MRoS) project to allow researchers to better assess the accuracy of reanalysis products used to differentiate rain from snow. We compared the citizen science data with results from three reanalysis products. We found that these reanalysis products all performed poorly in detecting rainfall at subfreezing rainfall or snowfall at warmer air temperatures. Crowdsourced data could help enhance methods used to determine precipitation phases and improve real-time weather forecasts.

Floating #Solar Panels Could Support US Energy Goals: New Study Shows Federally Controlled Reservoirs Could Host Enough Energy To Power Approximately 100 Million US Homes a Year — NREL #ActOnClimate

For the first time, researchers have used more detailed criteriaโ€”like water depth and temperatureโ€”to get a more accurate idea of how many floating solar panels some U.S. reservoirs could hold. Even in their most conservative estimates, the country’s reservoirs offer huge potential for future development and could host projects with capacities of up to 77,000 megawatts. Floating solar array via the Colorado Times Recorder.

Click the link to read the release on the NREL website:

January 14, 2025

Federal reservoirs could help meet the countryโ€™s solar energy needs, according to a new study published in Solar Energy.

For the study, Evan Rosenlieb and Marie Rivers, geospatial scientists at the U.S. Department of Energy National Renewable Energy Laboratory (NREL), as well as Aaron Levine, a senior legal and regulatory analyst at NREL, quantified for the first time exactly how much energy could be generated from floating solar panel projects installed on federally owned or regulated reservoirs. (Developers can find specific details for each reservoir on the website AquaPV.)

And the potential is surprisingly large: Reservoirs could host enough floating solar panels to generate up to 1,476 terawatt hours, or enough energy to power approximately 100 million homes a year.

โ€œThatโ€™s a technical potential,โ€ Rosenlieb said, meaning the maximum amount of energy that could be generated if each reservoir held as many floating solar panels as possible. โ€œWe know weโ€™re not going to be able to develop all of this. But even if you could develop 10% of what we identified, that would go a long way.โ€

Levine and Rosenlieb have yet to consider how human and wildlife activities might impact floating solar energy development on specific reservoirs. But they plan to address this limitation in future work.

This study provides far more accurate data on floating solar powerโ€™s potential in the United States. And that accuracy could help developers more easily plan projects on U.S. reservoirs and help researchers better assess how these technologies fit into the countryโ€™s broader energy goals.

Floating solar panels, also known as floating PV, come with many benefits: Not only do these buoyed power plants generate electricity, but they do so without competing for limited land. They also shade and cool bodies of water, which helps prevent evaporation and conserves valuable water supplies.

โ€œBut we havenโ€™t seen any large-scale installations, like at a large reservoir,โ€ Levine said. โ€œIn the United States, we don’t have a single project over 10 megawatts.โ€

Previous studies have tried to quantify how much energy the country could generate from floating solar panels. But Levine and Rosenlieb are the first to consider which water sources have the right conditions to support these kinds of power plants.

In some reservoirs, for example, shipping traffic causes wakes that could damage the mooring lines or impact the float infrastructure. Others get too cold, are too shallow, or have sloping bottoms that are too steep to secure solar panels in place.

And yet, some hydropower reservoirs could be ideal locations for floating solar power plants. A hybrid energy system that relies on both solar energy and hydropower could provide more reliable and resilient energy to the power grid. If, for example, a drought depletes a hydropower facilityโ€™s reservoir, solar panels could generate energy while the facility pauses to allow the water to replenish.

And, to build new pumped storage hydropower projectsโ€”which pump water from one reservoir to another at a higher elevation to store and generate energy as neededโ€”some developers create entirely new bodies of water. These new reservoirs are disconnected from naturally flowing rivers, and no human or animal depends on them for recreation, habitat, or food (at least not yet).

In the future, the researchers plan to review which locations are close to transmission lines or electricity demand, how much development might cost at specific sites, whether a site should be avoided to protect the local environment, and how developers can navigate state and federal regulations. The team would also like to evaluate even more potential locations, including other, smaller reservoirs, estuaries, and even ocean sites.

The research was funded by the Solar Energy Technologies Office and the Water Power Technologies Office in DOEโ€™s Office of Energy Efficiency and Renewable Energy (EERE).

Access the study to learn more about the immense potential for floating solar plants in the United States, or visit AquaPV to dig into the data on specific reservoirs.

NREL is the U.S. Department of Energy’s primary national laboratory for renewable energy and energy efficiency research and development. NREL is operated for DOE by the Alliance for Sustainable Energy LLC.

Forecast: #ColoradoRiver flow to #LakePowell will only reach 81% of normal in 2025 — 8NewsNow.com #COriver #aridification #GunnisonRiver

A Reclamation map, released January 10, 2025, of the upper basin showed snowpack levels โ€” more specifically, snow water equivalent (SWE) levels โ€” at 93% of normal for this time of year.

Click the link to read the article on the 8NewsNow.com website (Greg Haas). Here’s an excerpt:

January 10, 2025

An early season forecast indicates Lake Powell will get only about 81% of its normal water flow because of dry conditions around much of the Upper Colorado River Basin. Officials emphasized that forecasts this early can be inaccurate, and they represent the โ€œmost probableโ€ conditions identified by the Colorado Basin River Forecast Center (CBRFC), part of the National Weather Service. The forecast was based on data collected up until Jan. 1. Lake Powell, the nationโ€™s second-largest reservoir, is currently 37% full, according to the U.S. Bureau of Reclamation…

The Lake Powell forecast is a summary of the hydrologic conditions throughout the entire Upper Colorado River Basin,โ€ Cody Moser, a hydrologist with CBRFC said. โ€œLake Powell forecasting 5,150 KAF โ€” or thousand-acre-feet โ€” which is 81% of the 1991 through 2020 normal.โ€ Graphics showed the normal flow at 6,300 KAF.

The CBRFC briefing on Friday estimated the flow into Lake Powell would be below normal levels, despite good conditions in two regions that are crucial to the Colorado Riverโ€™s water supply โ€” the Colorado Headwaters and the Gunnison region.

#Colorado to start regulating emission of 5 air toxics that make people sick: The new regulations will be rolled out in phases over the course of 2025 and into 2026 — The #Denver Post

Metro wastewater plant in Denver.

Click the link to read the article on The Denver Post website (Noelle Phillips). Here’s an excerpt:

January 13, 2025

Five new compounds soon will be listed as priority toxic air contaminants in Colorado and, over the next two years, the stateโ€™sย Department of Public Health and Environmentย andย Air Quality Control Commissionย will determine out how to regulate them. The stateโ€™sย Air Pollution Control Divisionย will recommend five compounds to be regulated to the commission during its two meetings that begin Thursday. The creation of the list of toxic air contaminants is the result of a years-long effort from environmentalists and public health advocates who want the state to do more to protect people from the pollution that can cause cancers, such as leukemia and lymphoma, and lung diseases, such as asthma, and can harm womenโ€™s reproductive health. For years, environmentalists have complained that air pollution permits issued by the federal and state governments allow companies to pollute with little attention given to how much of those contaminants are dangerous to human health…

The five toxic air contaminants beingย proposed for regulationย are:

  • Acrolein, which is created when fossil fuels are burned by wood-burning, industrial boilers and reciprocating engines, and it is also used to make a polymer for paints, coatings and adhesives. Acute, short-term inhalation can cause eye and respiratory tract irritation. It is not considered a cancer risk.
  • Benzene, a carcinogen released when fossil fuels are burned, including in car exhaust and oil and gas extraction and production. It also is created by cement manufacturing, waste disposal and wood burning. Acute exposure may cause drowsiness, dizziness and headaches, as well as eye, skin and respiratory tract irritation, and unconsciousness at high levels. Chronic inhalation has caused cancer, various blood disorders and affects womenโ€™s reproductive organs, the Environmental Protection Agency has reported.
  • Ethylene oxide, which is used to make other products such as antifreeze, textiles, adhesives, plastics and detergents. Itโ€™s used to sterilize medical equipment, including atย Terumo BTC in Lakewood to sanitize medical equipment. It causes cancers in humans, including lymphoma, myeloma, leukemia and breast cancer.
  • Hydrogen sulfide, highly toxic gas that smells like rotten eggs. It is released by wastewater treatment facilities, meat processing facilities, petroleum refining, manufacturing of asphalt and roofing material and places where large quantities of manure are stored. It can cause people to pass out due to high exposure. Low exposure can cause headaches, memory loss, balance problems and fatigue. It is not considered a carcinogen but data is limited on how it affects childrenโ€™s health or womenโ€™s reproductive health, according to the EPA.
  • Hexavalent chromiumย is a by-product of industrial processes such as metal fabricating and by burning coal for electricity. It can leak into water systems and into the air. It can cause cancer and impact the respiratory system, kidneys, liver, skin and eyes, the EPAโ€™s website says.

Meet the Navajo professor mapping the impact of climate change on Indigenous land — Boise State Public Radio

Michael Charles. Photo credit: Cornell University

Click the link to read the article on the Boise State Public Radio website (Daniel Spaulding). Here’s an excerpt:

January 13, 2025

Rising seas are forcing Indigenous communities to move. Higher temperatures are causing drought and loss of traditional foods. Michael Charles, a Navajo professor at Cornell University, is trying to quantify the impact of climate change on Indigenous life in North America. Our Living Lands producer Daniel Spaulding spoke to Charles about his work. Charlesโ€™ย researchย includes a number of environmental issues impacting Indigenous communities, including air pollution, mining, and migration. To do this, Charles is focusing on Indigenous knowledge of traditional foods, land, and climate patterns.

โ€œWe’ll continue to see those knowledge systems evolving, but we’re also going to see continued disconnect on how well we can use our past knowledge systems,โ€ Charles said. โ€œSo it’s going to be an interesting path forward to see how we adapt and evolve.โ€

Peggy Mott selected to lead Reclamationโ€™s Dam Safety Program: Reclamationโ€™s Dam Safety Program evaluates existing dams for safety concerns and implements proactive solutions when needed

Peggy Mott, P.E. Photo credit: Reclamation

Click the link to read the release on the Reclamation website:

January 13, 2025

DENVER โ€” The Bureau of Reclamation selected Peggy Mott, P.E., as the chief of dam safety. Mott will oversee Reclamationโ€™s Dam Safety Program and is responsible for Reclamationโ€™s high hazard potential dams. If these dams were to fail or were improperly operated could result in loss of life or significant economic loss. This oversight ensures Reclamationโ€™s dams do not present an unreasonable risk to people, property or the environment. 

Key for the success for Reclamationโ€™s Dam Safety Program is leveraging relationships throughout Reclamation and with stakeholders. One close relationship the Dam Safety Office maintains is with the Asset Management Division, another office within the Dam Safety and Infrastructure Directorate. 

โ€œThe Dam Safety and Infrastructure Directorate provides reliable stewardship and oversight of Reclamationโ€™s diverse infrastructure portfolio. We effectively manage risk and maximize the value of Reclamationโ€™s assets for our stakeholders and American public,โ€ said Dam Safety and Infrastructure Director Miguel Rocha. โ€œPeggyโ€™s experience across multiple domains will be valuable as she takes on this important role leading the program and working with our local, regional, and national partners.โ€  

Mott joined Reclamation 2019 in the Dam Safety Office as a program manager and supervisory civil engineer. Prior to joining Reclamation, Mott was a regional dam safety officer with the U.S. Fish and Wildlife Service. Prior to joining federal government, she worked with dams and dam safety with the Colorado Department of Natural Resources. She also served as the State Buildings Delegate for the capital construction and controlled maintenance program for the Colorado Department of Human Services. Mott began her career as a systems engineer for Lockheed-Martin. 

Mott earned a Bachelor of Science in Engineering Physics from the Colorado School of Mines and a Master of Science in Civil Engineering from the University of Colorado. She is a licensed professional engineer in the state of Colorado. 

Supreme Court rejects #Utah, #Wyoming claims on federal public lands — Angus M. Thuermer Jr. (WyoFile.com)

US Flag at Hoover Dam as the Olympic Torch passed over the dam in 1996

Click the link to read the article on the WyoFile.com website (Angus M. Thuermer Jr.):

January 14, 2025

It took the U.S. Supreme Court 12 words and one period to dismiss more than 300 pages of legal arguments in which Utah, Wyoming and other Western states sought to establish control and ownership of millions of acres of federally managed public land.

Utah, Wyomingโ€™s lone U.S. Rep. Harriet Hageman, state legislators, Gov. Mark Gordon and many others sought an emergency hearing to argue that the federal government illegally owns property that rightfully belongs to Western states. Wyoming and other parties filed briefs of their own supporting the Beehive Stateโ€™s assertion that federal ownership was detrimental to those commonwealths.

The filings appear to be unappreciated by the justices.

โ€œThe motion for leave to file a bill of complaint is denied,โ€ the court said in an order filed Monday.

Utahโ€™s petition generated another 424 pages of legal entreaties by its supporters and critics, a count that includes rebuttals by the United States and the Ute Tribe.

Utah claimed the federal government could not own and control โ€œunappropriated lands,โ€ which are those not specifically designated for use by an enumerated federal power. Utah targeted 18.5 million acres of Bureau of Land Management property belonging to all Americans.

Beehivers first said they wanted the court to โ€œdisposeโ€ of the BLM property, then clarified that the state just wanted the court to say it is unconstitutional for the government to hold โ€œunappropriatedโ€ acreage.

Hageman claimed that federal ownership is an occupation equivalent to a casus belli, a situation that justifies war or conflict between nations. โ€œ[T]he standard is whether the federal governmentโ€™s actions would amount to an invasion and conquest of that land ifโ€”assuming a counterfactualโ€”Utah were a separate sovereign nation,โ€ Hagemanโ€™s filing states.

Twenty-six Wyoming lawmakers also saddled up for Utah, urging the court to take up the case and saying their support does not mean they will not seek other federal property for the Equality State. The perturbed posse said its claims could extend to โ€œall former federal territorial lands โ€ฆ now held by the United States โ€ฆ [including] parks, monuments, wilderness, etc.โ€

Six of the sympathetic signatories โ€” Sens. Tim French (R-Powell), Larry Hicks (R-Baggs), Bob Ide (R-Casper), John Kolb (R-Rock Springs), Dan Laursen (R-Powell) and Cheri Steinmetz (R- Lingle) โ€” voted for a draft bill that would allocate $75 million for the Legislature, independent of the executive branch or other state entities, to litigate against the federal government. Senate File 41 โ€œFederal acts-legal actions authorizedโ€ will be considered when the Legislature convenes today.

Gordon was more reserved in Wyomingโ€™s official state plea, alleging โ€œharms that federal ownership โ€ฆ uniquely imposes on western States on a daily basisโ€ as a reason for the Supreme Court to immediately take up the case.

The next coordination meeting for the operation of the Navajo Unit is scheduled forย Tuesday, January 21st 2025, at 1:00 pm

The outflow at the bottom of Navajo Dam in New Mexico. Photo: Brent Gardner-Smith/Aspen Journalism

From email from Reclamation (Susan Novak Behery):

January 13, 2025

This meeting is open to the publicย and will be held as a virtual-only meeting.

CLICK HERE TO JOIN AT THE MEETING TIME

This link should open in any smartphone, tablet, or computer browser, and does not require a Microsoft account.  You will be able to view and hear the presentation as it is presented.   

A copy of the presentation and meeting summary will be distributed to this email list and posted to our website following the meeting. If you are unable to connect to the video meeting, feel free to contact me (information below) following the meeting for any comments or questions.  

The meeting agenda will include a review of operations and hydrology since August, current soil and snowpack conditions, a discussion of hydrologic forecasts and planned operations for remainder of this water year, updates on maintenance activities, drought operations, and the Recovery Program on the San Juan River.    If you have any suggestions for the agenda or have questions about the meeting, please call Susan Behery at 970-385-6560, or email sbehery@usbr.gov.  Visit the Navajo Dam website at https://www.usbr.gov/uc/water/crsp/cs/nvd.html for operational updates.

The next coordination meeting for the operation of the Aspinall Unit is scheduled for Thursday, January 23rd 2025, at 1:00 pm #GunnisonRiver

Crystal Dam, part of the Colorado River Storage Project, Aspinall Unit. Credit Reclamation.

From email from Reclamtion (Erik Knight):

This meeting will be held at the Western Colorado Area Office in Grand Junction, CO. There will also be an option for virtual attendance via Microsoft Teams. A link to the Teams meeting is below. 

The meeting agenda will include updates on current snowpack, forecasts for spring runoff conditions and spring peak operations, the weather outlook, and planned operations for the remainder of the year. 

Handouts of the presentations will be emailed prior to the meeting.

Microsoft Teams Need help?

Join the meeting now

Meeting ID: 277 950 010 81

Passcode: nY7qX7sr

The December 2024 briefing is hot off the presses from Western Water Assessment

Click the link to read the briefing on the Western Water Assessment website:

January 10, 2025 – CO, UT, WY

Despite below average precipitation and warm temperatures during December, snow water equivalent (SWE) is near-normal for about half the region. Below average SWE conditions exist in northern Wyoming, southwestern Colorado and southern Utah, especially in the Escalante and Virgin River Basins where SWE is less than 45% of average. The first seasonal streamflow forecasts suggest near-average runoff in Colorado (90-100%), below average runoff in Utah (80-90%) and much below average runoff in Wyoming (50-80%). Drought conditions were relatively stable during December and cover 39% of the region. Previous forecasts of emerging La Niรฑa conditions did not prove correct; Pacific Ocean temperatures remain near-average (ENSO-neutral) and are expected to remain so through spring. NOAA seasonal forecasts suggest the possibility of above average precipitation in northern Colorado, northern Utah and Wyoming during January and in Wyoming for January-March.

December precipitation in Colorado, Utah and Wyoming was below to much below average except for portions of northern Utah and western Wyoming that saw slightly above average precipitation. Large areas of southern Utah, southern Colorado and central to southeastern Wyoming received less than 50% of December precipitation. In eastern Colorado, many locations received record-low December precipitation. Central Colorado, central Utah and western Wyoming received slightly below average December precipitation.

Regional temperatures were at least 3 degrees above average across all locations. Large areas of Colorado and Utah experienced temperatures that were 6-9 degrees above average. In Wyoming, nearly all locations were 6-9 degrees above average during December and central Wyoming average temperatures were 9-12 degrees above average. Record hot December temperatures were recorded in northern Wyoming.

Snow water equivalent was near-normal (median) for about half of the region on January 1, including most of the Upper Colorado River and Great Basins. Below normal January 1st SWE conditions prevailed in southern Utah, southwestern Colorado and northern Wyoming. The majority of river basins in Colorado and Utah saw a significant decrease in SWE conditions relative to median during December. On a statewide basis, January 1st SWE conditions in Colorado and Utah were near normal (95%) and below normal in Wyoming (83%). Southern Utah is currently experiencing the worst snow drought conditions with the Virgin River Basin at 39% normal and the Escalante River Basin at 43% normal. Six snotel sites in southwestern Utah had no snow on January 1st which set or tied the lowest SWE totals on record. An additional 3 snotel sites in Wyoming had their lowest January 1st SWE conditions on record and an additional 4 sites in Wyoming had the second lowest January 1st SWE value.

The first seasonal streamflow forecasts of the 2025 water year suggest near-average runoff in Colorado river basins and below average runoff in all other regional river basins. In Colorado, seasonal streamflow forecasts suggest between 90-100% of average runoff for all river basins. Runoff in most Utah river basins is forecasted at 80-90% of average except for the Upper Bear (94%), Lower Bear (77%), Escalante (60%) and Virgin (50%). In Wyoming, the seasonal streamflow forecast for the Upper Green, North Platte, Snake and Yellowstone is 70-80% while streamflow forecasts for the Bighorn, Cheyenne, Powder and Tongue River Basins range from 50-60% of average. Except for Blue Mesa Reservoir, below average inflow is forecasted for all other major Upper Colorado River Reservoirs including Lake Powell (81%), Flaming Gorge (69%), McPhee (76%) and Navajo (78%).

Regional drought coverage continued a decreasing trend in December and now covers 39% of the region, compared to 42% of the region in early December. Wyoming remains the epicenter of regional drought with 88% of the state experiencing drought conditions and 26% of the state in extreme drought. The area of extreme drought in the Snake River basin expanded in December. In Colorado, abnormal dry (D0) conditions emerged in the San Juan Mountains and D1 drought conditions were removed near the headwaters of the Arkansas and Colorado Rivers. Drought conditions in Utah were relatively unchanged during December.

West Drought Monitor map January 7, 2025.

Despite previous forecasts indicating the formation of La Niรฑa conditions in the Pacific Ocean, December Pacific Ocean sea-surface temperatures were consistent with ENSO-neutral conditions and there is a 60-80% probability of ENSO-neutral conditions persisting through spring 2025. NOAA monthly forecasts for January suggest an increased probability of above average precipitation for Wyoming, northern Colorado and northern Utah. There is an increased probability of below average precipitation for southern Utah and southwestern Colorado. NOAA forecasts also suggest an increased probability for above average temperatures for the entire region during January. On the three-month timescale, there is an increased probability of above average precipitation for Wyoming and below average precipitation for southern Utah and southern Colorado. The NOAA seasonal forecast for January-March indicates an increased probability of below average temperatures in Wyoming and above average temperatures for southern Utah and southern Colorado.

The New Experimental Winter Forecast is a tool that projects December-March precipitation in the western United States using Pacific and Atlantic Ocean temperatures. The most current forecast uses October – November ocean temperatures and indicates slightly above average winter precipitation for much of the region. The regional pattern of precipitation reflects average Pacific Ocean and warm Atlantic Ocean temperatures. Slightly above average winter precipitation is forecasted for most of the region with the highest precipitation relative to average in southern Utah and the lowest in central Wyoming and eastern Colorado.

December Climate Almanac.ย Much above average to record hot December temperatures in Wyoming are reflected in the temperature extremes. The highest daily maximum, the minimum maximum and minimum temperatures in the region were observed in Wyoming where temperatures are typically colder than Colorado and Utah.

AI has an environmental problem. Hereโ€™s what the world can do about that — United Nations Environment Programme #ActOnClimate

Click the link to read the article on the UN Environment Programme website:

September 21, 2024

There are high hopes that artificial intelligence (AI) can help tackle some of the worldโ€™s biggest environmental emergencies. Among other things, the technology is already being used to map the destructive dredging of sand and chart emissions of methane, a potent greenhouse gas.  

But when it comes to the environment, there is a negative side to the explosion of AI and its associated infrastructure, according to a growing body of research. The proliferating data centres that house AI servers produce electronic waste. They are large consumers of water, which is becoming scarce in many places. They rely on critical minerals and rare elements, which are often mined unsustainably. And they use massive amounts of electricity, spurring the emission of planet-warming greenhouse gases.  

โ€œThere is still much we donโ€™t know about the environmental impact of AI but some of the data we do have is concerning,โ€ said Golestan (Sally) Radwan, the Chief Digital Officer of the United Nations Environment Programme (UNEP). โ€œWe need to make sure the net effect of AI on the planet is positive before we deploy the technology at scale.โ€  

This week, UNEP released an issue note that explores AIโ€™s environmental footprint and considers how the technology can be rolled out sustainably. It follows a major UNEP report, Navigating New Horizons, which also examined AIโ€™s promise and perils. Hereโ€™s what those publications found. 

First of all, what is AI? 

AI is a catch-all term for a group of technologies that can process information and, at least superficially, mimic human thinking. Rudimentary forms of AI have been around since the 1950s. But the technology has evolved at a breakneck pace in recent years, in part because of advances in computing power and the explosion of data, which is crucial for training AI models. 

Why are people excited about the potential of AI when it comes to the environment? 

The big benefit of AI is that it can detect patterns in data, such as anomalies and similarities, and use historic knowledge to accurately predict future outcomes. That could make AI invaluable for monitoring the environment, and helping governments, businesses and individuals make more planet-friendly choices. It can also enhance efficiencies. UNEP, for example, uses AI to detect when oil and gas installations vent methane, a greenhouse gas that drives climate change.  

Advances like those are fostering hope that AI could help the world tackle at least some aspects of the triple planetary crisis of climate changenature and biodiversity loss, and pollution and waste

So how is AI problematic for the environment? 

Most large-scale AI deployments are housed in data centres, including those operated by cloud service providers. These data centres can take a heavy toll on the planet. The electronics they house rely on a staggering amount of grist: making a 2 kg computer requires 800 kg of raw materials. As well, the microchips that power AI need rare earth elements, which are often mined in environmentally destructive ways, noted Navigating New Horizons.  

The second problem is that data centres produce electronic waste, which often contains hazardous substances, like mercury and lead.  

Third, data centres use water during construction and, once operational, to cool electrical components. Globally, AI-related infrastructure may soon consume six times more water than Denmark, a country of 6 million, according to one estimate. That is a problem when a quarter of humanity already lacks access to clean water and sanitation.  

Finally, to power their complex electronics, data centres that host AI technology need a lot of energy, which in most places still comes from the burning of fossil fuels, producing planet-warming greenhouse gases. A request made through ChatGPT, an AI-based virtual assistant, consumes 10 times the electricity of a Google Search, reported the International Energy Agency. While global data is sparse, the agency estimates that in the tech hub of Ireland, the rise of AI could see data centres account for nearly 35 per cent of the countryโ€™s energy use by 2026.

Driven in part by the explosion of AI, the number of data centres has surged to 8 million from 500,000 in 2012, and experts expect the technologyโ€™s demands on the planet to keep growing. 

Some have said that when it comes to the environment, AI is a wildcard. Why is that?  

We have a decent handle on what the environmental impacts of data centres could be. But itโ€™s impossible to predict how AI-based applications themselves will affect the planet. Some experts worry they may have unintended consequences. For example, the development of AI-powered self-driving cars could cause more people to drive instead of cycling or taking public transit, pushing up greenhouse gas emissions. Then there are what experts call higher-order effects. AI, for example, could be used to generate misinformation about climate change, downplaying the threat in the eyes of the public. 

Is anybody doing anything about the environmental impacts of AI? 

More than 190 countries have adopted a series of non-binding recommendations on the ethical use of AI, which covers the environment. As well, both the European Union and the United States of America have introduced legislation to temper the environmental impact of AI. But policies like those are few and far between, says Radwan. 

โ€œGovernments are racing to develop national AI strategies but rarely do they take the environment and sustainability into account.โ€ฏThe lack of environmental guardrails is no less dangerous than the lack of other AI-related safeguards.โ€ 

How can the world rein in the environmental fallout from AI? 

In the new issue note, UNEP recommends five main things. Firstly, countries can establish standardized procedures for measuring the environmental impact of AI; right now, thereโ€™s a dearth of reliable information on the subject. Secondly, with support from UNEP, governments can develop regulations that require companies to disclose the direct environmental consequences of AI-based products and services. Thirdly, tech companies can make AI algorithms more efficient, reducing their demand for energy, while recycling water and reusing components where feasible. Fourthly, countries can encourage companies to green their data centres, including by using renewable energy and offsetting their carbon emissions. Finally, countries can weave their AI-related policies into their broader environmental regulations.

UNEP is focused on helping the world better navigate the environmental challenges of tomorrow. To do that, we have ramped upย our work on strategic foresight, scanning the horizon for emerging threats to the planet. This process culminated in the development ofย Navigating New Horizons โ€“ A Global Foresight Report on Planetary Health and Human Wellbeing, which was published earlier this year.ย  Produced in collaboration with the International Science Council, it examined eight global shifts accelerating the triple planetary crisis of climate change, nature and biodiversity loss, and pollution and waste.ย 

#Colorado #snowpack approaching normal levels — The #PagosaSprings Sun

Click the link to read the article on the Pagosa Springs Sun website (Garrett Fevinger). Here’s an excerpt:

January 9, 2025

As of Jan. 8, the statewide snowpack pack stood at 95 percent of the 30-year median, according to data from the Natural Resources Conservation Service (NRCS) โ€” an improvement from weeks earlier when those levels tracked significant lower.

The San Miguel, Dolores, Animas, and San Juan basins measured to be at 84 percent of its 30-year median snowpack as Individual local levels were slightly lower, with the Upper San Juan area at 73 percent of its median snowpack, the Piedra area at 79 percent, and the Conejos area at 60 percent of its median. As of Jan. 8, 45 inches of snow were measured atop the Wolf Creek summit, which sits at 68 percent of its median snowpack, according to the NRCS.

River flows

The San Juan River was flowing at a rate of 42.9 cubic feet per second (cfs) through Pagosa Springs as of 9 a.m. Wednesday, according to the U.S. Geological Survey. Based on 89 years of water records, the median flow for the same date is 54 cfs, with a record high flow of 112 cfs in 1987. The lowest recorded flow for the date is 28 cfs in 1990.

Southern Ute Indian Tribe awarded more than $4 million in federal grants to prepare for #ClimateChange — #Colorado Public Radio #ActOnClimate

Much of the irrigation infrastructure and technology on the Southern Ute Reservation in Colorado is antiquated. The channel on the right looks much as it did in the 1950s photo on the left. Source: Tribal Water Study Basic projects, like expanding a water treatment plant or installing a new drinking water pipeline, can advance at a glacial pace, as tribes must deal with a variety of different federal agencies to get them approved. Even when funding is available, it can be difficult to launch projects as tribes often lack the resources to navigate the various regulations, fees and environmental reviews. Credit: Water Education Foundation

Click the link to read the article on the Colorado Public Radio website (Ishan Thakore). Here’s an excerpt:

Jan. 10, 2025

The federal government awarded $4.25 million to the Colorado-based Southern Ute Indian Tribe this week to defend tribal water resources from climate-related challenges. The Bureau of Indian Affairs Tribal Community Resilience branch distributed grants to 124 projects nationwide, with funding pooled from the Bipartisan Infrastructure Law, the Inflation Reduction Act and the 2024 federal budget…

Across the state, warming fueled by climate change is ratcheting up average temperatures, which can lead to drought conditions. Southcentral and southwestern Colorado โ€“  where the Southern Ute Indian Reservation is located โ€“ have seen the largest temperature increases statewide, according to Colorado State Universityโ€™s 2024 State of the Climate report.  Spring rain in southwest Colorado has also decreased by over 20 percent compared to 1951-2000, according to the report

The federal funding will support two projects to restore the ecology of waterways on the reservation and fortify irrigation systems.

A $250,000 grant will support the tribeโ€™s environmental programs department to assess, and eventually restore, the Pine River watershed, which is facing impacts from drought and sediment pollution. The funding will allow the tribe to undertake a detailed assessment and devise a treatment plan for several waterways. Another $4 million grant to the tribeโ€™s water resources division will shore up an irrigation system that delivers water to around 4,000 acres. The funding will allow the tribe to replace old infrastructure and construct new weirs โ€” or low barriers built across waterways โ€” on seven sites on the Pine River canal. The goal is to help the tribe maintain consistent water levels for irrigation, even as a lack of rain and increased evaporation dip into water supplies. 

Animas River. Photo credit: The Southern Ute Indian Tribe

Assessing the U.S. #Climate in 2024 — NOAA #ActOnClimate

Image Courtesy of Jake Fortune, NOAA NCEI

Click the link to read the article on the NOAA website:

January 10, 2025

2024 was the warmest year on record for the contiguous U.S.; Hurricane Helene was the seventh-most-costly Atlantic hurricane on record

Key Points:

  • Theย average annual temperature of the contiguous U.S.ย was 55.5ยฐF, 3.5ยฐF above average and the warmest in the 130-year record.ย 
  • Annual precipitationย for the contiguous U.S. was 31.58 inches, 1.66 inches above average, ranking in the wettest third of the historical record (1895โ€“2024).ย 
  • The Atlantic basin saw 18 named tropical cyclones and five landfalling hurricanes during 2024โ€”an above-average season. Hurricane Helene was the seventh-most-costly Atlantic hurricane on record.
  • The tornado count for 2024 was second highest on record behind 2004 (1,817 tornadoes) with at least 1,735 confirmed tornadoes. When looking at EF-2+ tornadoes, 2024 was the most active year since the historic 2011 season.
  • Hurricane Heleneโ€™s extensive damage topped the list of 27 separateย billion-dollar weather and climate disasterย events identified during 2024โ€”the second-highest annual disaster count in the 45-year record.ย 
  • Drought coverage across the contiguous U.S. ranged from a minimum extent of 12 percent on June 11โ€”the smallest contiguous U.S. footprint since early 2020โ€”to a maximum coverage of 54 percent on October 29.

Other Highlights:

Temperature

For the year,ย temperaturesย were much-above average across nearly the entire contiguous U.S., with record warm temperatures across parts of the Southwest, Deep South and from the Upper Midwest to the central Appalachians and into the Northeast. Seventeen states (Texas, Oklahoma, Minnesota, Wisconsin, Michigan, Indiana, Ohio, Kentucky, Tennessee, West Virginia, Virginia, Pennsylvania, Maryland, New York, Vermont, New Hampshire and Maine) ranked warmest on record while all but two remaining states across the Lower 48 ranked as one of the warmest five years on record. Theย U.S. Climate Reference Network (USCRN)ย also indicated that 2024 was theย warmest year on recordย (2005โ€“24).

The Alaska Januaryโ€“December temperature was 28.9ยฐF, 2.9ยฐF above the long-term average, ranking in the warmest third of the 100-year record for the state. Much of the state had temperatures that were above average for the 12-month period with pockets of near average conditions in the southern and eastern mainland as well as the Panhandle.dle.

Precipitation

Precipitationย was above average across portions of the West, central Rockies, Deep South, Upper Midwest, Great Lakes, Southeast and Northeast. Precipitation was below average across much of the Northern Rockies and Plains, parts of the Southwest and portions of the Ohio Valley and Mid-Atlantic region. Louisiana ranked 10th wettest for this 12-month period.

Januaryโ€“December 2024 ranked near the middle of the 100-year record for Alaska, with below-average precipitation observed across parts of the Aleutians, Northwest Gulf, Cook Inlet, Northeast Gulf and much of the Panhandle region. Average- to above-average precipitation occurred throughout much of the rest of the state.

Billion-Dollar Weather and Climate Disasters

The Billion-Dollar Weather and Climate Disasters update is a quantification of the weather and climate disasters that in 2024 led to more than $1 billion in collective damages for each event. During 2024, the U.S. experienced 27 weather and climate disasters each incurring losses that exceeded $1 billion. 2024 ranked second highest for the number of billion-dollar disasters in a calendar year. These disasters included: 17 severe storms, five tropical cyclones, two winter storms, one flooding event, one drought/heat wave and one wildfire event.

The U.S. cost for these disasters in 2024 was $182.7 billion and was fourth highest on record. The total annual cost may rise by several billion as additional costs from identified events are reported over time. There were at least 568 fatalities associated with these eventsโ€”the eighth-highest number of fatalities on record. The costliest events in 2024 were:

  • Hurricane Helene was the costliest event in 2024. It made landfall as a Category 4 storm in the Big Bend region of Florida on September 26, caused catastrophic flash flooding and power outages impacting millions of people from Florida to North Carolina and resulted in at least 219 fatalities. Helene was the deadliest Atlantic hurricane since Maria (2017) and the deadliest to strike the U.S. mainland since Katrina (2005). The current estimated total cost of this disaster was $78.7 billion.
  • Category 3 Hurricane Milton made landfall near Tampa, Florida on October 9, caused widespread power outages and flooding and spawned tornadoes across the state. The current estimated total cost of this disaster was $34.3 billion.

Over the last 10 years (2015โ€“24), 190 separate billion-dollar disasters have killed at least 6,300 people and cost approximately $1.4 trillion in damage.

This is also a record 14th consecutive year where the U.S. experienced 10 or more billion-dollar disasters and the fifth consecutive year (2020โ€“24) where 18 or more billion-dollar disasters impacted the U.S.

Since records began in 1980, the U.S. has sustained 403 separate weather and climate disasters where overall damages/costs reached or exceeded $1 billion (based on the CPI adjustment to 2024) per event. The total cost of these 403 events exceeds $2.915 trillion.

Tropical Cyclones

Record- to near-record sea surface temperatures in the Atlantic basin helped fuel the active season that formed 18 named tropical systems during 2024. Eleven of these storms were hurricanes (tied with 1995 for fifth highest on record), including five that intensified to major hurricanes (tied with 1995, 1999, 2008 and 2010 for sixth highest), two of which were Category 5 storms. Five of these 11 hurricanes made landfall in the U.S. (tied with 1893, 2004 and 2005 for fourth highest) and include: Hurricanes Beryl, Debby, Francine, Helene and Milton. Hurricane Helene was the seventh-most-costly Atlantic hurricane on record.

Tornadoes

As the Storm Prediction Center continues to confirm the tornadoes that occurred during 2024, the current count is 1,735, which is the second-highest number of confirmed tornadoes on record (2004 had 1,817) and 142 percent of the 30-year (1991โ€“2020) average of 1,225. Four EF-4 tornadoes were confirmed during 2024 and occurred in: Elkhorn, Nebraska (April 26), Marietta, Oklahoma (April 27), Barnsdall, Oklahoma (May 6) and Greenfield, Iowa (May 21).

Wildfires

The number of wildfires in 2024 was approximately 90 percent of the 20-year (2001โ€“20) average with more than 61,000 wildfires reported over the year. The  total number of acres burned from these wildfiresโ€”8.8 million acresโ€”was 26 percent above the 20-year average of nearly seven million acres. The Park Fire, the fourth-largest wildfire in California history, burned nearly 430,000 acres and destroyed over 600 structures.

Alaska saw a below average wildfire year, with approximately 667,000 acres burned during the 2024 fire seasonโ€”about two-thirds of the stateโ€™s seasonal average.

Drought

The year began with approximately 33 percent of the contiguous U.S in drought. Drought coverage shrank as the year progressed and reached the minimum extent for the year at 12 percent on June 11โ€”the smallest contiguous U.S. drought footprint since early 2020. As the summer progressed, hot and dry conditions led to the expansion of drought across the Southeast and Mid-Atlantic as well as across the Plains. By October 29, the extent of drought peaked for the year with more than half of the contiguous U.S. (54 percent) in drought, covering significant portions of the Northwest, Southwest, northern and central Rockies, Plains, Great Lakes, the western and central Gulf Coast states as well as the central Appalachians, Mid-Atlantic and portions of the Northeast.  

Snowfall

The 2023โ€“24 snow season was above average across the southern Cascades, Sierra Nevada, Bitterroots, central and southern Rockies as well as portions of the Adirondack, Green and White mountains in the Northeast. Seasonal snowfall was at least three or more feet below average across parts of the northern Cascades, northern Rockies, the northern Plains as well as much of the Great Lakes and Northeast.

The 2024โ€“25 snowfall season to-date from October 1โ€“December 31, 2024 saw above-average snowfall for locations along the West Coast impacted by early-season atmospheric river events. This includes much of the Cascades, northern Sierra Nevada range, Bitterroots as well as the highest elevations of the central Rockies and adjacent Plains along with locations downwind of the Great Lakes. Snowfall deficits prevailed across the southern Sierra Nevada range and from the northern Rockies to the Upper Midwest and across portions of New England.

Climate Extremes Index

The U.S. Climate Extremes Index (USCEI) for 2024 was more than double the average value, ranking highest in the 115-year record. Extremes in warm maximum and minimum temperatures were both highest on record and the primary contributors to this elevated USCEI value for the nation as well as the regions. In addition, all nine climate regionsโ€™ USCEI values ranked in the top-10 percent of extremes. Annual extremes across the Southeast and South regions were highest and second highest on record, respectively, and can also be attributed to extremes in one-day precipitation. Near-record extremes across the Upper Midwest were also due to elevated extremes in one-day precipitation and ranked third highest. Across the Northeast, wet Palmer Drought Severity Index (PDSI) values and the number of days with precipitation were elevated and across the Northwest, extremes in one-day precipitation and days with precipitation contributed to the much-above average USCEI values for 2024. The USCEI is an index that tracks extremes (falling in the upper or lower 10 percent of the record) in temperature, precipitation, drought and landfalling tropical cyclones across the contiguous U.S.

This annual summary from NOAA National Centers for Environmental Information is part of the suite of climate services NOAA provides to government, business, academia and the public to support informed decision-making. For more detailed climate information, check out our comprehensive Annual 2024 U.S. Climate Report. For additional information on the statistics provided here, visit the Climate at a Glance and National Maps webpages.

#Snowmass board looks to conserve water, protect #ColoradoRiver: Water Resources manager says landscape irrigation causes water waste — The #Aspen Times #RoaringForkRiver #COriver #aridification

Cold Mountain Rancher Bill Fales turns the headgate of the Lowline Ditch. Fales is participating in a non-diversion agreement with the Colorado Water Trust to keep more water in the Crystal River. CREDIT: HEATHER SACKETT/ASPEN JOURNALISM

Click the link to read the artilcle on The Aspen Times website (Skyler Stark-Ragsdale). Here’s an excerpt:

January 11, 2025

Irrigation is a major source of water waste in Snowmass, a critical issue as the town draws entirely from local streams. Once diverted, much of the water never follows its natural course to the Colorado River, according to Water Resource Manager Darrell Smith, who presented to the Environmental Advisory Board earlier this week.ย 

โ€œWater is a scarce resource on the Western Slope and in the Colorado Basin as a whole,โ€ Smith told The Aspen Times on Thursday. โ€œSo itโ€™s part of doing our part to not use the water we have available to excess.โ€

Many second homeowners expect their lawn is green, and plants are watered by the time they arrive for the summer months, Smith said. The top 10% of Snowmass irrigators triple the average rate of water use…The Roaring Fork Valley watershed provides 10% of the total water volume to the Colorado River Basin, according to the Roaring Fork Conservancy. But the river no longer reaches the Pacific Ocean. It dries up in Northwestern Mexico due to human water usage,ย according to USGS. The Colorado River is predicted to drop 29% by 2050 in the Upper Colorado River Basin due to a hotter and drier climate, according to aย 2021 USGS study...When temperatures increase, plants need more water, and people irrigate more, drawing more from the watershed, according to him…

As it stands, 35% of annual water usage in single family Snowmass residences comes from irrigation, primarily between June and September, he said. The top 10% of irrigators use 2,100 gallons per day โ€” three times the 700 gallons used by the average Snowmass irrigator. While 95% of indoor water use returns to streams, only 20% of irrigated water returns, according to Smith.

2024โ€™s extreme ocean heat breaks records again, leaving 2 mysteries toย solve — Annalisa Bracco (The Conversation) #ActOnClimate

Click the link to read the article on The Conversation website (Annalisa Bracco):

January 9, 2025

The oceans are heating up as the planet warms.

This past year, 2024, was the warmest ever measured for the global ocean, following a record-breaking 2023. In fact, every decade since 1984, when satellite recordkeeping of ocean temperatures started, has been warmer than the previous one.

A warmer ocean means increased evaporation, which in turn results in heavier rains in some areas and droughts in others. It can power hurricanes and downpours. It can also harm the health of coastal marine areas and sea life โ€“ coral reefs suffered their most extensive bleaching event on record in 2024, with damage in many parts of the world.

Warming ocean water also affects temperatures on land by changing weather patterns. The EUโ€™s Copernicus Climate Change Service announced on Jan. 10 that data showed 2024 had also broken the record for the warmest year globally, with global temperatures about 2.9 degrees Fahrenheit (1.6 Celsius) above pre-industrial times. That would mark the first full calendar year with average warming above 1.5 C, a level countries had agreed to try to avoid passing long-term.

Many regions of the world were much warmer than the 1991-2020 average in 2024, including large areas of ocean. C3S / ECMWF, CC BY

Climate change, by and large, takes the blame. Greenhouse gases released into the atmosphere trap heat, and about 90% of the excess heat caused by emissions from burning fossil fuels and other human activities is absorbed by the ocean.

But while itโ€™s clear that the ocean has been warming for quite some time, its temperatures over the past two years have been far above the previous decades. That leaves two mysteries for scientists.

Itโ€™s not just El Niรฑo

The cyclic climate pattern of the El Niรฑo Southern Oscillation can explain part of the warmth over the past two years.

During El Niรฑo periods, warm waters that usually accumulate in the western equatorial Pacific Ocean move eastward toward the coastlines of Peru and Chile, leaving the Earth slightly warmer overall. The latest El Niรฑo began in 2023 and caused global average temperatures to rise well into early 2024.

Sea surface temperatures have been running well above average when compared with all years on record, starting in 1981. The orange line is 2024, dark grey is 2023, and red is 2025. The middle dashed line is the 1982-2011 average. ClimateReanalyzer.org/NOAA OISST v2.1, CC BY

But the oceans have been even warmer than scientists expected. For example, global temperatures in 2023-2024 followed a similar growth and decline pattern across the seasons as the previous El Niรฑo event, in 2015-2016, but they were about 0.36 degrees Fahrenheit (0.2 Celsius) higher at all times in 2023-2024.

Scientists are puzzled and left with two problems to solve. They must figure out whether something else contributed to the unexpected warming and whether the past two years have been a sign of a sudden acceleration in global warming.

The role of aerosols

An intriguing idea, tested using climate models, is that a swift reduction in aerosols over the past decade may be one of the culprits.

Aerosols are solid and liquid particles emitted by human and natural sources into the atmosphere. Some of them have been shown to partially counteract the impact of greenhouse gases by reflecting solar radiation back into space. However, they also are responsible for poor air quality and air pollution.

Many of these particles with cooling properties are generated in the process of burning fossil fuels. For example, sulfur aerosols are emitted by ship engines and power plants. In 2020, the shipping industry implemented a nearly 80% cut in sulfur emissions, and many companies shifted to low-sulfur fuels. But the larger impact has come from power plants reducing their emissions, including a big shift in this direction in China. So, while technologies have cut these harmful emissions, that means a brake slowing the pace of warming is weakened.

Is this a warming surge?

The second puzzle is whether the planet is seeing a warming surge or not.

Temperatures are clearly rising, but the past two years have not been warm enough to support the notion that we may be seeing an acceleration in the rate of global warming.

Analysis of four temperature datasets covering the 1850-2023 period has shown that theย rate of warming has not shown a significant changeย since around the 1970s. The same authors, however, noted that only a rate increase of at least 55% โ€“ about half a degree Celsius and nearly a full degree Fahrenheit over one year โ€“ would make the warming acceleration detectable in a statistical sense.

Chart: The Conversation/CC-BY-NDSource: NOAAGet the dataEmbed Download imageCreated with Datawrapper

From a statistical standpoint, then, scientists cannot exclude the possibility that the 2023-2024 record ocean warming resulted simply from the โ€œusualโ€ warming trend that humans have set the planet on for the past 50 years. A very strong El Niรฑo contributed some natural variability.

From a practical standpoint, however, the extraordinary impacts the planet has witnessed โ€“ including extreme weather, heat waves, wildfires, coral bleaching and ecosystem destruction โ€“ point to a need to swiftly reduce carbon dioxide emissions to limit ocean warming, regardless of whether this is a continuation of an ongoing trend or an acceleration.

Saving the #GreatSaltLake by Rebalancing Its Water Budget — Brian Richter (SustainableWaters.org)

Exposed shoreline of the Great Salt Lake in Utah (USA). The lakeโ€™s level has dropped 14 feet (4.2 meters) over the past three decades, creating an enormous public health threat from windblown dust, placing global seafood production at risk, and disrupting a continental migratory flyway. Photo by Brian Richter

Click the link to read the article on the Sustainable Waters website (Brian Richter):

January 8, 2025

In recent years Iโ€™ve had the great fortune to be able to work with some amazing teams of researchers to explore the causes of water scarcity across many geographies, including the Colorado River, the Rio Grande, the Western US, and around the globe. Importantly, weโ€™ve gone beyond just documenting the problems or threats caused by water shortages and have offered effective, proven solutions for sustainably rebalancing over-drafted water budgets. Our studies have looked at ways of conserving water in irrigated agriculture through crop shifting and other on-farm strategies as well as ways to conserve water in cities and industries.

Our just-published study of the Great Salt Lake in Utah (USA) was one of the most fascinating and enjoyable projects Iโ€™ve been involved with. I learned a great deal from our research!

I came to appreciate the hydrologic hyper-sensitivity of endorheic (lacking outflow) lakes. The Great Salt Lake is the largest saline lake in North America and the eighth largest in the world. Other big ones include the Aral Sea in Kazakhstan and Uzbekistan and Lake Urmia in Iran. All of these lakes teeter on a delicate balance between river inflows and evaporative losses from the lakes. The Great Salt Lake began to slip into long-term deficit way back in the mid-1800s when Mormon settlers from the eastern US began to capture the inflowing water from tributary rivers to expand their irrigated farms. The ensuing slow shrinkage of the lake was briefly interrupted by huge snowfalls in the 1980s and 1990s, but climate warming began to accelerate the lakeโ€™s demise since 2000. The lake dropped 14 feet (4.2 meters) and lost two-thirds of its volume during the past three decades.

The primary cause of the lakeโ€™s decline is the diversion of nearly two-thirds of the inflowing water for use in cities, industries, and irrigated farming. Farms are by far the biggest anthropogenic water consumer, accounting for 71% of water consumption, and 80% of this farm water goes to irrigated cattle-feed crops (alfalfa and grass hay). Credit: Brian Richter
Credit: Brian Richter/Sustainable Waters

The outsized contribution of irrigated cattle-feed crops to water shortages is repeated in most other river basins in the western US, and in many other water-scarce regions of our planet. As Iโ€™ve said in previous blogs, farmers and ranchers grow these crops for a simple business reason: our beef and dairy demands create a price for these crops that is quite attractive to farmers. In the past two decades, dairy consumption in the US has risen by 12%, driven mostly by increased demand for yogurt (+220%) and cheese (+28%).

In our paper, we took a close look at a variety of ways to rebalance the Great Salt Lakeโ€™s water budget by reducing production of these cattle-feed crops, along with urban and industrial water conservation. We concluded that saving the Great Salt Lake will require an overall reduction of consumptive water use by 35%; a reduction of 15% is needed to stabilize the lake to keep it from declining further, and another 20% will be needed to replenish the lake to an ecologically safe level.

Saving the Great Salt Lake will come with an eye-popping price tag: it will take at least $100 million per year for a decade to get the lake back to a safe level. However, when you put that cost in perspective, it translates to about $29 per Utah resident per year, or far less than 1% of the stateโ€™s annual budgets.

The challenges of water scarcity are growing rapidly with climate warming in many regions of the globe. Given that nearly 90% of all โ€œblueโ€ water (from rivers, lakes, aquifers) consumed in the world goes to irrigated agriculture, resolving water scarcity and keeping pace with climate change is going to necessarily require not just unprecedented levels of urban water conservation but also a massive transformation of what we grow on farms, and how we grow it. Because these agricultural changes commonly elicit fierce political resistance and high costs, political leaders are loathe to touch it. However, illustrative success stories are emerging around the world, demonstrating that with proper consideration of farmer needs, values, and cultures, and with financial compensation and technical support to ease difficult transitions, we can meet these challenges.

It begins by acknowledging the nature and size of the challenge, and demanding bold leadership from our decision makers. We can only run from water shortages and climate change for so long before truly disastrous consequences befall us.

Sunset from the western shore of Antelope Island State Park, Great Salt Lake, Utah, United States.. Sunset viewed from White Rock Bay, on the western shore of Antelope Island. Carrington Island is visible in the distance. By Ccmdav – Own work, Public Domain, https://commons.wikimedia.org/w/index.php?curid=2032320

Can โ€œFloating Poolsโ€ be the template for future management of the #ColoradoRiver? — Jack Schmidt and Eric Kuhn (InkStain.net) #COriver #aridification #CRWUA2024

Attendees of the Colorado River Water Users Association watch negotiators Estevan Lรณpez of New Mexico and Becky Mitchell of Colorado speak on a panel Thursday, December 5, 2024, at the Paris Hotel and Casino. The Upper and Lower basin states are at an impasse about how cuts will be shared and reservoirs operated after 2026. CREDIT: LUKE RUNYON/THE WATER DESK

Click the link to read the article on the InkStain.net website (Jack Schmidt and Eric Kuhn):

January 9, 2024

The press coverage of the December 2024 Colorado River Water Users Association (CRWUA) meeting mostly focused on the ongoing stalemate between representatives of the Upper and Lower Division States over their competing proposals for how the Colorado River Systemsโ€™ big reservoirs will be operated after the 2007 Interim Guidelines terminate in 2026.  The headlines included words such as โ€œturbulentโ€, โ€œbitterโ€, โ€œblusterโ€, and โ€œsparโ€. Indeed, there was tension in the air, and the potential for interstate litigation was a topic of much discussion both on the formal agenda and in the hallways where, traditionally, progress is often made between competing interests.

While the press focus on the tension and divisiveness was unavoidable, I believe that there were good reasons for some guarded optimism.

For the ongoing effort to renegotiate the post-2026 operating guidelines, a consortium of seven environmental NGOs has also made a detailed proposal.  Their proposal is referred to as the โ€œCooperative Conservationโ€ proposal. One of the four action alternatives that Reclamation will analyze, Alternative #3, is patterned after the NGO submittal.  At CRWUA, John Berggren of Western Resource Advocates, who along with Jennifer Pitt and others prepared the proposal, made a presentation on the proposal.  Like the other submitted proposals, the cooperative conservation alternative proposes sophisticated operational rules for Lakes Mead and Powell based on combined system storage and actual hydrology. Where the Cooperative Conservation proposal breaks new ground is the concept of a Conservation Reserve Pool, and this idea could lead the basin toward a practical on-the-ground solution. Indeed, the Gila River Indian Community introduced at CRWUA a similar concept in the form of a Federal Protection Pool made up of stored water in both Lake Powell and Lake Mead. These proposals, taken separately, together, or in some combined and moderated form, might serve as a catalyst for compromise.

As proposed, both the Conservation Reserve Pool and the Federal Protection Pool would be filled with water conserved by reductions in consumptive use and perhaps augmentation from programs in both basins and this water could be stored anywhere in the system. This water would be โ€œoperationally neutralโ€ and thus invisible to the underlying system management operating rules. From an accounting perspective, this Pool would โ€œfloatโ€ above other water in the reservoirs. Floating Pools operate separately from and above the prior appropriation system of water allocation on the Lower River and are invisible to the rules that dictate annual releases from Glen Canyon Dam. Thus, these proposals impart important operational flexibility.  In many ways, Floating Pools split the babyโ€”they incentivize innovative conservation measures that allow participants to find value they would not have been able to realize under the prior appropriation systemโ€”yet they insulate the prior appropriation system and thus are more protective of higher-priority water users than operationally non-neutral ICS.  Itโ€™s a stretch to say there is something here for everyone, but there may be enough to kick-start otherwise stalled conversations.

In their proposal, the Lower Division States have offered to take up to 1.5 maf/year of mainstem shortages. Where the two basins remain deadlocked is what happens in those years when shortages exceed the amount the Lower Division States are willing to accept.  The Lower Division States have proposed that the two basins share the additional required shortages up to a maximum shortage of 3.9 maf/year.  The Upper Division States have said, โ€œNo, because we already suffer large hydrologic shortages in dry years, and we have not used our full compact entitlement; the Lower Division should cover all of the shortages.โ€ In their presentation, however, the Upper Division Commissioners (UCRC members) left the door open for continuing discussions between the two divisions. In his remarks, New Mexico Commissioner Estevan Lopez stated that under what he referred to as โ€œparallel activitiesโ€, the Upper Division States might be willing to discuss conserving โ€œ100,000, maybe 200,000 acre-feet per year.โ€

Water in Floating Pools could be used for a variety of purposes including environmental management, fostering binational programs, and supplementing scheduled water deliveries. During his CRWUA presentation, John Berggren mentioned an obvious use for this pool.  Water stored in the Pool by conserved consumptive use programs in the Upper Division States could be used as an Upper Division contribution during years when mainstem shortages to the Lower Division States exceed a negotiated amount.  Of course, the Lower Basin is unlikely to accept Upper Basin creation of Floating Pools made up of water for which there is no current consumptive use. This water is already โ€œsystem waterโ€ and is now being used by existing Lower Basin water agency. Thus, it would be necessary to develop a program to account for and certify savings in the Upper Basin.  Further, the thorny problem of shepherding (legally protecting the conserved water so that it ends up in system storage) needs to be overcome. For a perspective on this issue, see Heather Sacket. Undeveloped Tribal water is a controversial sticking-point in this regard, with strong feelings and strong arguments on all sides.

If the Upper Division States were to conserve 200,000 acre-feet per year for five years and deposit that saved water in a conservation reserve โ€œFloating Poolโ€, something like 900,000 acre-feet could be available for shortage sharing (after accounting for reservoir evaporation). (We use 900,000 af as an example only, how much water the Upper Division States would have to contribute and maintain in a Floating Pool would have to be negotiated between the two divisions.)  In their presentation, the Lower Division principals pointed out that had their proposal been in place beginning in 2007, there has yet to be a year when shortage sharing would have been required. Note, this conclusion is very sensitive to โ€œinitial conditions.โ€ In 2007, total storage in Lake Mead and Lake Powell was about 8 maf more than it is today. If the 21st century hydrology continues, shortages greater than 1.5 maf/year are likely to occur.

What would the Upper Division States get in return?  During the term of the new post-2026 operating guidelines (which we all assume will also be โ€œinterimโ€), the Upper Division would benefit by the Lower Division agreeing to remove the threat of litigation over a โ€œcompact call.โ€ For a perspective on the potential impacts of a โ€œcallโ€ in Colorado see The Risks and Potential Impacts of a Colorado River Compact Curtailment on Colorado River In-Basin and Transmountain Water Rights Within Colorado.

Carefully crafted with appropriate guardrails, Floating Pool concepts can be a catalyst for compromise between the two divisions that give both parties something they need.

How do Floating Pool alternatives fit with the Schmidt, Kuhn, Fleck management approach?  Based on our conversations with the authors of the cooperative conservation proposal, we believe the two approaches agree โ€” that our management proposal fits on top of and complements their proposal quite well.  In my presentation at CRWUA, I emphasized that, like future hydrology, there is great uncertainty in the future needs of the riverโ€™s ecosystem and societyโ€™s values.  Itโ€™s almost a certainty that in the future, prescribed annual releases from Glen Canyon Dam will cause an unacceptable and unanticipated outcome to some river or reservoir resource. When that happens, our flexible management approach and accounting system keeps the basins โ€œwhole.โ€

Is using the concept of Floating Pools as a catalyst to break the stalemate between the two basins without warts? โ€“ of course not.  There are important considerations regarding the use of undeveloped waterโ€”Tribal or otherwise, and the devil is in the details when it comes to developing appropriate guardrails for annual and total accumulation in such a Pool, the number and type of participants, annual debits, and other important qualifications. Even conserving 100,000 acre-feet per year in the Upper Division States, with acceptable verification, could be a stretch, especially if there is less federal money in the future, as there almost certainly will be.  Finally, it might put off addressing fundamental problems with the law of the river until the new post-2026 operating rules again expire. When they do, the 1922 Compact and 1944 Treaty with Mexico will still be in place, and these agreements collectively allocate 17.5 maf/year of consumptive use on a river that is only producing 13-13.5 maf/year of water at the international boundary (and runoff continues to decline).  What the Floating Pool concept might accomplish is to significantly reduce the temptation and threat of unpredictable interstate litigation, keep the basinโ€™s stakeholders talking to each other, and give us time to move toward more foundational change in how the river is managed.

Map of the Colorado River drainage basin, created using USGS data. By Shannon1 Creative Commons Attribution-Share Alike 4.0

Hay is sucking the Great Salt Lake dry: New study finds cattle-feed irrigation is primary culprits in water body’s shrinkage — Jonathan P. Thompson (LandDesk.org) #aridification

Click the link to read the article on the Land Desk website (Jonathan P. Thompson):

January 7, 2025

๐Ÿฅต Aridification Watch ๐Ÿซ

Detail from an 1852 map of the Great Salt Lake by J.W. Gunnison and Charles Preuss.

About 18,000 years ago, Lake Bonneville spread across about 20,000 square miles of what is now northwestern Utah. It was some 1,000 feet deep in places during its maximum extent, was fed by snowmelt and runoff from the mountains, and discharged into the Snake River in Idaho. Over the millennia, climate change shrunk the lake, leaving behind the Great Salt Lake and vast salt flats โ€” shimmering plains of light and ghosts of that ancient water body.

In 1847, upon seeing the remnants of Lake Bonneville, Brigham Young declared it the โ€œright placeโ€ for the nascent Church of Jesus Christ of Latter Day Saints to set up its base. Perhaps that was simply because he and his followers were tired of traveling, or maybe he sensed the more-than-passing resemblance to the Dead Sea in the Judeo-Christian holy lands. In any event, the new settlers eventually introduced large-scale agriculture, a rapidly growing population, and industry to the valley โ€” all of which consumed water that would otherwise run into the lake โ€” and eventually the Great Salt Lake began shrinking yet again. In 2022 it reached a record low level, covering just 860 square miles, compared to 2,500 back in the late 1980s.

The Great Salt Lake in 1987 and in 2021. The water dropped so low that Antelope Island ceased being an island. Source: Google Earth.

One culprit is the climate change-exacerbated mega-drought that has dragged on for over two decades. The other is the same infliction that plagues nearly every other Western water body: overconsumption. And a new, detailed accounting of consumption on the lakeโ€™s feeder streams finds that the biggest consumer is agriculture, and the crops responsible for guzzling the most water are cattle feed crops such as alfalfa and grass hay.

Though itโ€™s not surprising, itโ€™s always a bit of a downer to be reminded that my Chunky Monkey, green-chile cheeseburger, and yogurt habits are contributing to the depletion of not just the Colorado River, but also the Great Salt Lake.

Source: โ€œReducing Irrigation of Livestock Feed is Essential to Saving Great Salt Lakeโ€ by Brian Richter, et al.

The new study, โ€œReducing irrigation of livestock feed is essential to saving Great Salt Lake,โ€ by Brian D. Richter, Kat F. Fowler, et al, and published in Environmental Challenges, builds upon other works, including โ€œEmergency measures needed to rescue Great Salt Lake from ongoing collapse,โ€ by Benjamin W. Abbot et al. The titles say it all: The largest saline lake in the Western hemisphere, which nourishes a rich ecosystem, is a major stop along the Pacific Flyway, and supports some 9,000 jobs and $2.5 billion in economic output each year, is in serious trouble.

And rescuing it, the authors say, will โ€œrequire a massive transformation of agricultural production in the basin, particularly in cattle-feed production. Failure to implement the agricultural adjustments needed to arrest the decades-long decline of the lake will lead to serious and escalating threats to regional-scale public health, a continental-scale migratory flyway, and global-scale shocks in seafood production.โ€

The new studyโ€™s findings include:

  • โ€œThe lakeโ€™s shrinkage is attributable toย anthropogenic consumption of 62% of river waterย that would have otherwise reached and replenished the lake.โ€
  • The Great Salt Lake reached its highest level in more than a century in 1987, following a series of extremely wet winters, but has been dropping by about four inches per year on average since then. From 1989 to 2022, the lakeย lost 10.2 million acre-feetย and the surface level dropped 14 feet.
  • Lake shrinkage is bad for human health because itย mobilizes dust containing toxic heavy metals such as arsenic, copper, lead, zinc, cadmium, mercury and other metals, many of them from mining runoff.
  • Great Salt Lake is theย worldโ€™s largest supplier of brine shrimp eggs,ย a key food source for the aquaculture industry. As the lake shrinks, salinity increases, stressing the brine shrimp and lower production.
  • The lake is aย crucial nexus within Pacific Flyway, and the birds eat brine shrimp and brine flies. Wilsonโ€™s Phalaropes and Eared Grebes are threatened by the decline of GSL, and they could be listed under the Endangered Species Act, which could impact industry around the lake.
  • Aggregate water consumption from both anthropogenic and environmental (riparian evapotranspiration and lake evaporation) sourcesย exceeded lake inputs from river inflows and direct precipitationย by 309,664 acre-feet per year on average from 1989-2022.
  • Irrigated farms now cover 791 square miles within the basin, with 70% of the acreage dedicated to growing cattle feed crops. Thereโ€™s also public land grazing leases, which cover more than half of the 21,000-square-mile Great Salt Lake basin and provide additional forage for about 10% of all cattle in the basin.
  • The 2022 U.S. Agricultural Census countedย nearly 1 million cattleย within the basin; about 70% were beef and 30% dairy.
  • Alfalfa farms within GSL basinย produce an average of 3.7 tons per acre, for a total of 951,889 tons per year, or a little over half of all the alfalfa grown in Utah.
  • Alfalfa water use per year is estimated at 617,034 acre-feetย and other hay use 291,695 acre-feet, for a grand total of more than 900,000 acre-feet (or about 57% of all anthropogenic uses in the basin).
  • About 38% of the cattle feed grown in the basin stays in the basin, with about 25% exported to the Snake River basin in Idaho, andย 13% going to California, the nationโ€™s leading milk producer. An estimated 17% is exported internationally, primarily to China and the Middle East.
  • Cattle feed crops in the basinย produced an estimated $162 million in cash receiptsย in 2021, or about .07% of Utahโ€™s GDP. But alfalfa prices jumped about 85% between 2000 and 2021, mainly driven by rising demand from dairy as Americans eat more yogurt and cheese. That makes alfalfa a more lucrative crop for its growers, andย ceasing production would have an outsized local impact.

Currently the lake is suffering from an annual water deficit of about 310,000 acre-feet. But researchers believe the strains of climate change will keep driving the deficit higher, and point to the need to bring the lake back up from its diminished levels. Some are pushing for up to 1 million acre-feet in consumption cuts per year, but Richter and company are suggesting a more politically palatable 650,000 acre-feet per year. Still, thatโ€™s a boatload of water.

So how to get there? Once again the obvious solution โ€” stop growing alfalfa โ€” is also the most contentious, and far more complicated than it appears. The economic impact would be devastating locally, and would also change the communitiesโ€™ cultures. Farmers tend to hold the most senior water rights, meaning they legally can continue to use that whatever however they please. And paying farmers to fallow that much land would not only be prohibitively expensive, but also would create other problems, such as dust and noxious weed proliferation.

The authors present a range of less drastic, but still ambitious โ€” and painful โ€” options, including:

  • They found they couldย reduce crop water consumption by 91,500 acre-feet per yearย by replacing alfalfa with winter wheat. Split-season irrigation, or reducing the number of cuttings from three to one, couldย save another 477,130 acre-feetย (but would reduce alfalfa and hay production by 61%).
  • Combining split-season irrigation and partial fallowing could achieve the 650,000 acre-feet target, but it wouldย cost $76 million per yearย for foregone alfalfa production plus $21 million for reduced grass hay production.
  • If the municipal and industrial and mineral extraction sectors cut consumption by 20%, it couldย reduce the deficit by about 110,000 acre-feet,ย leaving agriculture to pick up the remaining 550,000 acre-feet through the above strategies.
  • Temporary leasing of agricultural water rights wouldย cost as much as $423 millionย annually, but would give farmers more flexibility over what they do with the land (and it would only be temporary).

โ€œUltimately the debate about whether to save the GSL will be about cultural issues, not economics or food security,โ€ the authors conclude. โ€œThe potential solutions outlined here implicate lifestyle changes for as many as 20,000 farmers and ranchers in the basin. In this respect the GSL serves as a microcosm of the socio-cultural changes facing many river basin communities in the increasingly water-scarce wester U.S. and around the globe.โ€

Think like a watershed: Interdisciplinary thinkers look to tackle dust-on-snow

Jonathan P. Thompson

November 5, 2024

๐Ÿฅต Aridification Watch ๐Ÿซ

Read full story

The January 10, 2025 #Colorado Water Supply Report is hot off the presses from the NRCS

Click the link to read the report on the NRCS website. Here’s an excerpt:

#Colorado Water Supply Outlookย – January 10, 2025: Early Accumulation in Southern Basins, Sustained Development in Northern Colorado — NRCS #snowpack

Sheep Mountain. Photo credit: NRCS

Click the link to read the release on the NRCS website:

January snowpack conditions reveal contrasting trends across Colorado, with early season storms boosting accumulation in the southern basins before tapering off, while northern basins were favored through December and received a notable boost from early January storms.


Denver, CO โ€“ January 10th, 2025 โ€“ Statewide snow water equivalent (SWE) is 108 percent of the 1991-2020 median as of January 7th. For context, SWE at this time last year was 76 percent of median, reflecting very different early season conditions. A notable storm during the first week of January 2025 delivered higher amounts of snowfall to northern basins. SNOTEL site Tower recorded impressive gains, with a SWE increase of 6.3 inches. Statewide, streamflow forecasts at the 50 percent exceedance probability are 99 percent of median. Water year to date precipitation as of January 1st is above normal at 104 percent of median and jumped to 108 percent of median on January 7th.  

Early season storms brought snowfall to southern basins, leading to above average accumulation by mid-November. The combined San Miguel-Dolores-Animas-San Juan (SMDASJ) reached 171 percent of median by mid-November before tapering to 87 percent of median following several dry weeks. Despite recent dry weeks, late season monsoonal precipitation improved soil moisture levels, enhancing the basinโ€™s overall runoff efficiency. At the start of the 2025 water year, soil moisture levels in southern basins ranged from 90 percent to 130 percent of median.  The Upper Rio Grande also had a strong early season start and peaked at 203 percent of median snowpack in November and is now at 82 percent of median. The Arkansas basin is currently at 103 percent of median, maintaining above normal snowpack levels through December.  

Between October and early November, statewide precipitation reached 110 percent of median, with southern basins benefitting most from consistent storms. During this period, basins like the SMDASJ and Upper Rio Grande were well above normal at 186 and 168 percent of median, respectively. In contrast, the South Platte and Laramie-North Platte basins received 55 and 65 percent of October median precipitation, respectively. November precipitation continued a varied trend highlighting a boost in eastern basins such as the South Platte at 167 percent of median and the Arkansas at 209 percent of median. Although December conditions remained dry for most basins, with statewide 30-day precipitation at 74 percent of median on January 1st, northern regions received relatively higher precipitation. For this 30-day period on January 1st the South Platte is at 100 percent of median, the Laramie-North Platte at 103 percent and the Yampa-White-Little Snake at 95 percent of median.  

Streamflow forecasts range from 82 percent in the Laramie-North Platte to 107 percent in the Arkansas basin at the 50 percent exceedance probability. While many forecasts remain near or slightly below median, the range of exceedance probabilities illustrates varying levels of uncertainty across basins. โ€œJanuary forecasts also have the widest range of exceedance probabilities, given that there is still much snow accumulation season to come, so as always we encourage you to consider the full suite of exceedance probabilities in addition to the 50%,โ€ noted Karl Wetlaufer, NRCS forecast hydrologist, emphasizing the importance of monitoring future conditions. Another good reminder to consider the full suite of exceedance forecasts rather than focusing solely on median values when interpreting potential outcomes. 

As of January 2025, reservoir storage across Colorado stands at 93 percent of median statewide, a slight decline from the same time last year but not drastically lower. Reservoir levels reflect carryover from last season, with many basins showing relatively stable conditions. The Arkansas and Upper Rio Grande basins, report 114 and 124 percent of median storage, respectively, highlighting increased storage compared to the previous year. Conversely, the Gunnison and SMDASJ basins report below median storage. โ€œReservoir levels at this time of year are more of a baseline rather than a predictor, as they depend on upcoming snowmelt contributions during spring runoff,โ€ notes Nagam Gill, NRCS hydrologist. 

* San Miguel-Dolores-Animas-San Juan River basinย 
* *For more detailed information about January mountain snowpack refer to the ย January 1stย Colorado Water Supply Outlook Report.ย For the most up to date information about Colorado snowpack and water supply related information, refer to theย Colorado Snow Survey website.ย ย 

Interior secretary manages vast lands that all Americans share โˆ’ and can sway the balance between conservation andย development — The Conversation

Visitors trek the Sand to Snow National Monument in Southern California, a popular area for camping, hiking, hunting and other activities. Bob Wick, BLM/Flickr

Emily Wakild, Boise State University

The Department of the Interior was created in 1849 as the United States was rapidly expanding and acquiring territory. It became known as โ€œthe department of everything elseโ€ for its enormous portfolio of missions, which ranged from western expansion to oversight of the District of Columbia jail.

Interior handles natural resources and domestic affairs โ€“ primarily managing 480 million acres (200 million hectares) of federal lands and developing the assets that they hold. Many of these lands are officially open for multiple uses, including energy development, mining, logging, livestock grazing and recreation. Those activities have numerous constituencies, whose interests can clash.

U.S. map showing public lands controlled by the Interior Department and data on their use.
The Interior secretary oversees many types of activities on and beneath lands that represent about 21% of the total surface area of the United States. U.S. Department of the Interior

The Interior secretaryโ€™s main job is to promote thoughtful planning that balances resource development and conservation. One strategic role has been expanding energy production, including oil, natural gas, wind and solar power, on federal lands.

Under Republican administrations, the focus often swings toward resource development. Democratic administrations often put greater emphasis on conservation and nonextractive land uses, such as recreation. The secretaryโ€™s actions can play a big role in setting direction for the agency.

Since Interior controls access to valuable natural resources, secretaries also get sued a lot over issues ranging from endangered species protection to water rights.

A motley collection of bureaus

Interior has about 70,000 employees whose missions fall largely into three buckets: managing public lands and wildlife; meeting U.S. trust responsibilities to Native American communities; and regulating energy, water and mining resources on federal lands and in federal waters offshore.

These functions are spread among 11 bureaus whose activities can conflict. For example, there has been heated debate within Interior about how to manage the scenic Bears Ears National Monument in Utah. This site was designated as a monument by President Barack Obama in 2016, drastically reduced by President Donald Trump in 2017, and then restored to its original size by President Joe Biden in 2021. Reflecting these shifts, Interiorโ€™s priorities for Bears Ears have toggled between opening it for mining, co-managing it with area tribes and preserving it for public enjoyment.

Many of Interiorโ€™s offices have changed dramatically over time in response to evolving environmental and cultural values. For example, the Bureau of Land Management was widely known for years as the โ€œBureau of Livestock and Miningโ€ because its decisions closely reflected the interests of those industries.

Even now, ranchers can graze sheep and cattle on public lands at rates generally lower than comparable fees on state or private ranges. And mining companies donโ€™t pay royalties to the Treasury for producing gold, silver, copper and other valuable minerals on federal lands.

However, today the bureau also manages land for conservation โ€“ including a 35 million-acre (14 million-hectare) system of National Conservation Lands. In 2024, the agency adopted a public lands rule that explicitly recognizes the importance of protecting clean water, managing for land health and restoring degraded lands.

Filling up the West

When Congress created the Interior Department, the young United States was in the process of nearly doubling its size after the U.S.-Mexican War. Gold had just been discovered in California, triggering a huge migration west. The scramble to occupy these lands and convert them into stable revenue sources drove Interiorโ€™s early activities.

As the U.S. government removed Native peoples from their ancestral homes and folded largely arid and unsettled lands into the public domain, Interior became a landlord and an agent of development in the West. The federal government gave millions of acres to white settlers in an effort to populate these new territories.

But not all lands met settlersโ€™ needs, especially in dry zones. As a result, much of the arid West remained under federal control. Given this legacy, it is not surprising that most senior officials at Interior have come from western states.

U.S. national parks, monuments, wildlife refuges and other Interior lands have become economic engines for many western towns, attracting private ranches, hotels, restaurants and businesses. In this way, federal lands return tremendous wealth to adjacent communities, particularly with the growth of the outdoor recreation industry.

Nonetheless, many western states resent federal control over broad swaths of territory within their borders and periodically make claims to these lands. Since states donโ€™t have the financial resources to manage roads or fight fires on such large expanses, it is likely that they would sell off large portions of these lands, privatizing them.

For this reason, many conservation groups and outdoor sporting organizations oppose transferring federal lands to the states. Interior secretaries may be called on to mediate these disputes or defend federal interests in court. https://www.youtube.com/embed/iUnV9CLsbO8?wmode=transparent&start=0 The state of Utah is suing the U.S. government for control over 18.5 million acres of federal land โ€“ about one-third of the territory in the state.

Over the past half-century, there has been ongoing debate about whether the royalties and fees the agency charges for federal land use return fair value to taxpayers, or if the agency has been โ€œcapturedโ€ by extractive industries such as mining, ranching, logging, and oil and gas production. The secretary can send important signals about which way an administration tilts.

Indian Affairs and trust responsibilities

Another central Interior role is managing U.S. government relations with American Indian and Alaska native tribes. The departmentโ€™s Bureau of Indian Affairs, created in 1824, works with 574 federally recognized tribes with more than 2 million enrolled members.

Interior manages 55 million acres of land and 57 million acres of subsurface mineral rights in trust for the tribes. This essentially means that Interior agencies earn revenue and disperse funds to tribal members, in part to make up for depriving Native Americans of their rightfully held resources over 150 years of displacement.

Even after federal policy became more supportive of Tribal governance and self-determination in the 1970s, Interior did a poor job of fulfilling its key trust responsibilities. In 2009 the agency settled a US$3.4 billion class-action lawsuit, acknowledging that for decades the federal government had mismanaged tribal resources and failed to pay revenues to Indian landowners for resources produced from their lands.

Well into the 1970s, Interior also was charged with trying to assimilate Native Americans into U.S. society by forcibly removing children from their homes and families and placing them in boarding schools. These institutions punished children for speaking native languages and separated them from their cultural traditions.

Starting in 2021, under Secretary Deb Haaland โ€“ the first Native American to lead the Interior Department โ€“ the agency launched an initiative to document and interpret the experiences of survivors and the intergenerational effects of this policy on Native Americans whose ancestors were sent to the schools. https://www.youtube.com/embed/Ui9jCp1yuws?wmode=transparent&start=0 In a 2022 report, the U.S. government acknowledged for the first time its role in carrying out forced assimilation of Native American children at government-run boarding schools.

This land is your land

Interiorโ€™s reach is vast, but the resources that it controls and the investments it makes in keeping large landscapes connected provide tremendous services. Debate about the merits of public versus private management of these lands is likely to continue.

Growing interest in outdoor recreation and the rise of remote work are putting new pressure on public lands. Finding solutions will require many different land users, as well as state governments and gateway towns, to collaborate. The Interior secretary can play an important role in helping strike those balances.

This story is part of a series of profiles of Cabinet and high-level administration positions.

Emily Wakild, Cecil D. Andrus Endowed Chair for the Environment and Public Lands, Boise State University

This article is republished from The Conversation under a Creative Commons license. Read the original article.

Local drought could impact the West’s water supply: Western Slope has a vital role in water supply for #ColoradoRiver Basin — The #Telluride Daily Planet #COriver #aridification

West Drought Monitor map January 7, 2025.

Click the link to read the article on the Telluride Daily Planet website (Sophie Stuber). Here’s an excerpt:

January 7, 2025

Although Telluride is in the depths of winter, states are still negotiating a new agreement for the Colorado River basin. About 85% of the Colorado River begins as snow in Colorado and Wyomingโ€™s mountains. The 1,450-mile river provides water to about 40 million people in the U.S. and Mexico and is key to the $5 billion annual agriculture economy. Across the state, snowpack is at 97% of the median. Locally, in the San Miguel-Dolores-Animas-San Juan River Basin, snow water equivalent is at 75% of median.

Map of the Colorado River drainage basin, created using USGS data. By Shannon1 Creative Commons Attribution-Share Alike 4.0

Coloradoโ€™s Western Slope river basins are essential to the health of the whole basin as well the economy and natural environment. Regional water managers often compete for water demands for agriculture, environmental flows and downstream deliveries to Lake Powell and Lake Mead, which store much of the regionโ€™s water. The current operational guidelines for the Colorado River will expire at the end of 2026. Drought in the Western Slope can significantly impact both local water use and deliveries to Lake Powell, and drought is likely to become more prevalent with climate change…A recent study, published in Nov. 2024, analyzed local drought vulnerability in Western Slope and the consequences for the region, going into the Colorado River basin. โ€œStreamflow declines driven by an optimistic climate change scenario can transition the system to a drier regime and increase drought impacts,โ€ the studyโ€™s authors write. The study developed a model to create streamflow scenarios and the potential impacts of drought in the region. The model showed elevated drought risks to downstream water users, agriculture and the environment…

The San Miguel Watershed Coalition recently released a new planning document for the whole watershed, including floodplain reconnection and beaver-based restoration projects. Much of this work involves federal land managers because more than 50% of the watershed is federally owned…Other important research includes how to better predict how snowpack is transformed into snowmelt and runoff into watersheds, collaborating with Airborne Snow Observatories (ASO), which provides basin-wide measurements of snow water equivalent and forecasts of snowmelt runoff.

The view from an Airborne Snow Observatory plane as it flies over a mountainous region to capture data on the snowpack. Photo credit: Airborne Snow Observatories Inc.

Global Warming Surges Well Past 1.5-Degree Mark in 2024: International agencies coordinate release of annual climate data to highlight the past yearโ€™s โ€œexceptionalโ€โ€”and dangerousโ€”climate conditions — Bob Berwyn (Inside #Climate News)

Sunset September 10, 2024 in the San Luis Valley. Photo credit: Alamosa Citizen

Click the link to read the article on the Inside Climate News website (Bob Berwyn):

January 9, 2024

Nearly all major global climate datasets agree that, in 2024, human-caused global warming for the first time pushed Earthโ€™s average surface temperature to more than 1.5 degrees Celsius above the pre-industrial average for a full calendar year, a level that countries around the world had agreed to do all they could to avoid.

And when last year is averaged with 2023, both years together also exceed that level of warming, which was noted as a red line marking dangerous climate change by 196 countries in the 2015 Paris Agreement. A 2018 special report by the Intergovernmental Panel on Climate Change showed that warming beyond that limit threatens to irreversibly change major parts of the physical and biological systems that sustain life on Earth, including forests, coral reefs and rainforests, as well as oceans and their major currents.

The temperature figures were seen as so significant that the new annual climate data for 2024 was presented Thursday night as part of the first-ever internationally coordinated release by several institutions that track global temperatures, in part to mark the โ€œexceptional conditions experienced in 2024,โ€ according to a report published today by Copernicus, the European Unionโ€™s climate change service. 

On Friday, the National Oceanic and Atmospheric Administration, NASA and the World Meteorological Organization will follow up with similar reports, all of which will emphasize not only the record global temperatures, but also the record amount of water vapor in the atmosphere that contributed to severe and record flooding in some parts of the world last year, and also helped supercharge tropical cyclones and hurricanes.

Rather than being fatigued by the barrage of news about heat records and other climate extremes, people should see the information as an opportunity to be thankful that we are not flying blind into dangerous climate change, said Carlo Buontempo, director of the Copernicus Climate Change Service

Thanks to international science, โ€œWe do know something about whatโ€™s happening,โ€ he said. โ€œWe can make some predictions about whatโ€™s coming in the future. So rather than being overwhelmed โ€ฆ we should also take this as an opportunity to do something about it, to react to and to inform our decisions in the best possible way with facts and evidence.โ€

Even with those facts, he added, โ€œWe are facing a very new climate and new challenges that our society is not prepared for. โ€ฆ This is a monumental challenge for society.โ€

According to the Copernicus data, 2024 didnโ€™t just edge past the previous record-warm year, 2023, but surged more than a tenth of 1 degree Celsius all the way to 1.6 degrees Celsius (2.8F) above the pre-industrial level. That was one of the biggest year-on-year jumps on record, said Samantha Burgess, co-director of Copernicus. 

She said some of the other global datasets may actually still show the 2024 warming relative to the pre-industrial 1850-1900 average at just below 1.5 degrees Celsius (2.7F), but that the global synthesis of six major datasets by the World Meteorological Organization will also come out to more than 1.5.

Still, she said, that doesnโ€™t mean the limit set by the Paris Agreement has been broken, because it refers to a long-term average over 10 to 30 years. 

If the 1.6 degrees Celsius of warming over the pre-industrial average doesnโ€™t seem like a huge deal to some people, she said human bodies provide a good analogy.

โ€œThe temperature of the human body is around 37 [degrees Celsius],โ€ she said. โ€œIf we have a fever at 39 degrees, it doesnโ€™t sound like much, but the body responds in very negative ways, and we feel terrible. Weโ€™re feverish, and the body is doing everything possible to fight that infection.

โ€œThe reality is that at a global average change of 1.5 degrees, the frequency and the intensity of extreme events gets more likely,โ€ she said. โ€œExtreme events like wildfires, heat waves, severe storms, droughts, are likely to get more frequent, and theyโ€™re likely to be more intense. This is why, when youโ€™ve got this small number but over a very large global average, itโ€™s incredibly important.โ€

The Copernicus scientists said that the worldโ€™s oceans, in particular, were one of the biggest factors driving Earthโ€™s overall annual temperature to a new record. That ocean warmth also had direct impacts like a global wave of coral bleaching and reef die-offs, as well as mass die-offs of marine mammals and seabirds

On land, the persistently high global fever of the last few years led to deadly heat waves, with more than 47,000 heat-related deaths in Europe alone during 2023. Final figures for the number of such deaths in 2024 are yet to be calculated.

The new data on record warmth comes at a time when some governments and companies are already rolling back previous climate action pledges. The internationally coordinated release of global climate data could also be seen as an acknowledgment that global warming isnโ€™t going to slow down and wait for humanity to solve other vexing social, political and economic problems.

Asked if those rollbacks in the face of record heat are worrying to him as a climate scientist, Buontempo said that, โ€œFrom a physical point of view, the mechanism is well explained. What drives this warming temperature is, to a very large extent, increasing greenhouse gases.โ€

If the goal is to stabilize the global temperature, then governments need to move toward reducing emissions to zero โ€œin the most rapid possible way,โ€ he said.

What will the future of the warming stripes be?2024 could be the start of a stabilisation of global temperatures, or it might appear to be a cool year.Which one of these stories becomes reality depends on our choices today, and every day until then.We are likely to regret not acting sooner.

Ed Hawkins (@edhawkins.org) 2025-01-10T11:13:06.384Z

January 2025 update: La Niรฑa is here — NOAA #ENSO

Click the link to read the article on the NOAA website (Emily Becker):

January 9, 2025

La Niรฑa conditions emergedย in the tropical Pacific in December. Thereโ€™s a 59% chance La Niรฑa will persist through Februaryโ€“April, followed by a 60% chance of neutral conditions in Marchโ€“May. Read on for the recent observations that led us to declare the (long-awaited) onset of La Niรฑa and lots of details for current and potential upcoming conditions.

Just the facts, maโ€™am

A quick briefing, if youโ€™re just joining usโ€”La Niรฑa is one phase of the El Niรฑo/Southern Oscillation (ENSO), a pattern of sea surface temperature and atmospheric changes in the tropical Pacific Ocean. La Niรฑaโ€™s signature is cooler-than-average surface water in the east-central Equatorial Pacific, while its counterpart, El Niรฑo, features warmer-than-average surface water. The atmospheric circulation over the tropical Pacific, called the Walker circulation, exhibits characteristic changes during La Niรฑa and El Niรฑo, so we call ENSO a โ€œcoupledโ€ ocean-atmosphere system. ENSO is a seasonal phenomenon, meaning it lasts for several months in a row. The atmospheric changes of ENSO are communicated all around the world, changing temperature and rain/snow patterns in known ways.

Time to get down to brass tacks

Ok! Weโ€™ve been expecting La Niรฑa to show up since last spring. While sheโ€™s dragged her heels, all the pieces came together this past month.

The tropical Pacific sea surface temperature loitered in ENSO-neutral since April 2024, with our primary ENSO monitoring index, the Niรฑo-3.4 index, within 0.5 ยฐC of the long-term average. In December, however, the Niรฑo-3.4 index was -0.6 ยฐC, according to the ERSSTv5, our most reliable long-term sea surface temperature dataset.

2-year history of sea surface temperatures in the Niรฑo-3.4 region of the tropical Pacific for all La Nina events since 1950 (gray lines) and the recent (2024-25) event (purple line). After staying in neutral for most of 2024, the Niรฑo-3.4 index passed the La Niรฑa threshold in December 2024. Graph by Emily Becker based on monthly Niรฑo-3.4 index data from CPC using ERSSTv5.

With the Niรฑo-3.4 Index exceeding the La Niรฑa threshold of -0.5 ยฐC, we can move on to the second box on our flowchartโ€”do we think the Niรฑo-3.4 index is going to stay in La Niรฑa territory for the next several seasons? (โ€œSeasonsโ€ here means any 3-month-average period.) The consensus among our computer climate models is yes. Also, there is a substantial amount of cooler-than-average water under the surface of the tropical Pacific, which will provide a source for the surface over the next few months.  

So, weโ€™re on to the third box, which has actually been checked for a while now (more on that later). The atmosphere has been looking La Niรฑa-ish for months, with stronger-than-average trade winds, more clouds and rain over Indonesia, and drier conditions over the central Pacificโ€”all hallmarks of an amped-up Walker circulation. In December, the Equatorial Southern Oscillation Index (EQSOI), which measures the difference in surface pressure between the western and eastern Pacific, was 1.5 (positive values indicate a stronger Walker circulation). In fact, this is the 5th-strongest December EQSOI in the historical record. Drumrollโ€ฆ La Niรฑa conditions have developed.

This animation shows weekly sea surface temperatures in the Pacific Ocean compared to average from October 14 2024โ€“January 5 2025. Orange and red areas were warmer than average; blue areas were cooler than average. The sea surface temperature in the key ENSO-monitoring region of the tropical Pacific (outlined with black box) was slightly below average for many weeks, but the cooler-than-average region has strengthened lately. NOAA Climate.gov animation, based on Coral Reef Watch Data and maps from NOAA View. View the full-size version in its own browser window.

Break it down for me

There are a lot of different tidbits I want to tell you about this month, so letโ€™s go Q&A-style.

How long will La Niรฑa last?

Thereโ€™s a reason our flowchart says โ€œthe next several seasonsโ€ instead of providing a specific number: we can make predictions, but itโ€™s impossible to know ahead of time exactly how long La Niรฑa conditions will last. To be categorized as a La Niรฑa event in our historical record, the three-month-average Niรฑo-3.4 Index (the Oceanic Niรฑo Index) needs to stay at least 0.5 ยฐC below average for at least five consecutive, overlapping seasons. Current odds are 60% that the Marchโ€“May Oceanic Niรฑo Index will be neutral, which would make this event last fewer than five. Thatโ€™s not to say itโ€™s impossible for this La Niรฑa to last longer, of courseโ€”nature is always full of surprises!  There is a ~40% chance for La Niรฑa to persist into March-May 2025.

How strong will La Niรฑa be?

Itโ€™s very likely this La Niรฑa will be weak, with the Niรฑo-3.4 index unlikely to reach -1.0 ยฐC for a season. This is based on computer model guidance and how late in the year La Niรฑa conditions emerged. ENSO events peak in the northern Hemisphere winter, and thereโ€™s just not a lot of time for La Niรฑa to strengthen.

Can La Niรฑa still affect our winter climate?

Sure can, although a weak La Niรฑa tends to have a weaker influence over temperature and precipitation patterns.

Why was La Niรฑa so slow to develop?

The short answer to this is โ€œwe donโ€™t yet know.โ€ The emergence of La Niรฑa-like atmospheric conditions before substantial tropical Pacific Ocean surface cooling was unusual, though. The global oceans have been running much, much warmer than average for more than a year, which might have had a hand in La Niรฑaโ€™s delay. When we calculate the Niรฑo-3.4 index but account for the temperature of the tropical oceans (the โ€œRelative Niรฑo-3.4 indexโ€) we get an index thatโ€™s been in La Niรฑa territory for months. Only this past year or so has the difference between the traditional and relative Niรฑo-3.4 indexes been so large, and weโ€™re still researching this new measurement and all the implications for ENSO development and impacts in a warmer world.

Has La Niรฑa had any impact on temperature and rain patterns yet?

La Niรฑa affects global climate primarily through atmospheric changes, and since the tropical atmosphere has been looking like La Niรฑa for a while, this is a reasonable question! The global climate is incredibly complicated, and even a big factor like ENSO is only one player. Other climate patternsclimate change trends, and random variability can have a strong influence on overall seasonal patterns. That said, itโ€™s interesting that the Octoberโ€“December 2024 temperature and rain/snow patterns over the U.S. resemble the expected patterns from previous La Niรฑa events. See the Octoberโ€“December La Nina temperature and rain/snow maps, and hereโ€™s the general page if you would like to poke around.

Map showing the difference from average precipitation during Octoberโ€“December 2024. Green areas received more rain and snow than the 1991โ€“2020 average, while brown areas received less. The pattern here resembles what we would expect in Octoberโ€“December during La Niรฑa. Map by climate.gov from CPC data.

Temperature has a strong influence from climate trends, and the Octoberโ€“December 2024 temperature pattern over the U.S. is clearly dominated by more warmth.

Map showing the difference from average temperature during Octoberโ€“December 2024. Orange areas were warmer than the 1991โ€“2020 average. The pattern here resembles what we would expect in Octoberโ€“December from combined climate trends and La Nina. Map by climate.gov from CPC data.

Youโ€™re running out of column inches. Any last tidbits?

Thanks for asking! Speaking of La Niรฑa impacts, you might recall thereโ€™s a link between La Niรฑa and active Atlantic hurricane seasons. In brief, La Niรฑa reduces vertical wind shearโ€”the difference between near-surface winds and upper-level windsโ€”and makes it easier for hurricanes to grow. Interestingly, the Augustโ€“October 2024 wind shear in the Atlantic Main Development Region (an area of the Atlantic where hurricanes tend to develop) was the weakest since 1950 (h/t NOAAโ€™s Matt Rosencrans). We canโ€™t say how much of it was related to La Niรฑa, but given the relative Niรฑo-3.4 index has been in La Niรฑa territory for a while now, itโ€™s an interesting situation that bears more research.

The bottom line

As this unusual La Niรฑa progresses, weโ€™ll be here to keep you updated on all things ENSO!

Here are the typical outcomes from both El Niรฑo and La Niรฑa for the US. Note each El Niรฑo and La Niรฑa can present differently, these are just the average impacts. Graphic credit: NWS Salt Lake City office

#Drought news January 9, 2025: Based on 30 to 60-day SPI along with a lack of early season snowpack, a 1-category degradation was made to southwestern #Colorado, SWE was below-normal across the Four Corners Region

Click on a thumbnail graphic to view a gallery of drought data from the US Drought Monitor website.

Click the link to go to the US Drought Monitor website. Here’s an excerpt:

This Week’s Drought Summary

On January 4 and 5, a low pressure system developed across the Central Great Plains and then tracked eastward to the Mid-Atlantic. Along its track, widespread precipitation (1 to 2 inches, liquid equivalent) was observed throughout eastern Kansas, Missouri, the Ohio and Tennessee Valleys, Central Appalachians, and Mid-Atlantic. Total snowfall amounts were near or more than a foot in portions of these areas. This winter storm also resulted in freezing rain for the Ohio Valley and parts of Virginia and West Virginia. Drought improvements were generally made to portions of the central and eastern U.S. where precipitation amounts exceeded 1 or 1.5 inches, liquid equivalent. Drought coverage and intensity continued its decline for the Upper Ohio Valley and New England. After the winter storm exited the East Coast, an arctic air outbreak overspread the eastern two-thirds of the lower 48 states. A favorable start to the wet season coupled with above-normal snowpack supported a decrease in drought coverage across the Pacific Northwest. Conversely, drought worsened for southern California and the Southwest. Alaska and Puerto Rico remained drought-free, while short-term drought intensified across Hawaii…

High Plains

Based on 30 to 60-day SPI along with a lack of early season snowpack, a 1-category degradation was made to southwestern Colorado. Farther to the north across northwestern Colorado, improving snowpack resulted in a minor reduction in abnormal dryness (D0). Southwestern Nebraska has received little to no precipitation during the past 7 weeks, prompting an expansion of D0. In addition, above-normal temperatures during the late fall and into the early winter exacerbated increasing short-term dryness. Heavy precipitation (more than 1 inch, liquid equivalent) for this time of year resulted in a 1-category improvement to northeastern Kansas. No changes were made to the Dakotas and early January is one of the driest times of the year…

Colorado Drought Monitor one week change map ending January 7, 2025.

West

A dry start to the winter and using 90-day SPI and soil moisture, moderate drought (D1) was expanded across southern California. The NDMC short-term blend, 90-day SPI, and many 28-day average streamflows below the 10th percentile supported the addition of severe drought (D2) to portions of southern California. The Santa Ana winds during early January are likely to exacerbate the worsening drought conditions. Consistent with the NDMC short-term blend along with 30 to 120-day SPI, D2 was expanded for portions of southeastern Arizona and southwestern New Mexico. Based on water year to date (WYTD: October 1, 2024 to January 6, 2025) precipitation averaging above normal and snow water equivalent (SWE) above the 80th percentile, a 1-category improvement was made to southwestern Idaho, eastern to central Oregon, eastern Washington and a small part of northwestern Montana. This 1-category improvement is also supported by NDMC drought blends and SPIs at various time scales. As of January 7, SWE was above-normal (period of record: 1991-2020) across the southern Cascades along with eastern Oregon and southwestern Idaho. SWE was highly variable for the Sierra Nevada Mountains and below-normal across the Four Corners Region…

South

Based on 30 to 120-day SPI, 28-day streamflow, and soil moisture, a 1-category degradation was made to portions of the Edwards Plateau of Texas. SPIs at various time scales and soil moisture supported a 1-category degradation as well for parts of the Rio Grande Valley. Heavy rainfall during late December supported additional improvements across southeastern Texas. Recent rainfall (1 to 2 inches) prompted a 1-category improvement to parts of Mississippi and Tennessee. Despite the recent rainfall, 28-day average streamflow and 90-day SPI support a continuation of D1-D3 intensity for the Tennessee Valley. Although precipitation was lighter this past week, the lack of any support among the indicators for D0 and D1 led to improvements to much of Arkansas…

Looking Ahead

A low pressure system is forecast to develop along the western Gulf Coast by January 10 with a rapid eastward track offshore of the Mid-Atlantic one day later. A large area of 1 to 2.5 inches of rainfall is expected for eastern Texas and the Lower Mississippi Valley, while accumulating snow occurs from the southern Plains east to the Tennessee Valley and Southern Appalachians. High elevation snow is forecast to shift east from the Cascades to the northern Rockies on January 10 and 11. Farther south across California, dry weather is likely to persist through mid-January. On January 13, another Arctic high is forecast to shift south from Canada to the Great Plains.

The Climate Prediction Centerโ€™s 6-10 day outlook (valid January 14-18, 2025) favors below-normal temperatures for a majority of the lower 48 states. The largest below-normal temperature probabilities (exceeding 80 percent) are forecast for the Southeast. An increased chance of above-normal temperatures is limited to the Dakotas and Minnesota. Below-normal precipitation is most likely across the Pacific Northwest, Great Basin, and much of California. Elevated above-normal precipitation probabilities are forecast for the Southwest, Texas, and High Plains, while below-normal precipitation is slightly favored along the East Coast.

US Drought Monitor one week change map ending January 7, 2025.

Just for grins here’s a slideshow of early January US Drought Monitor maps for the past few years.

Cleanup of abandoned uranium mines set to start after Navajo Nation, EPA reach agreement — AZCentral.com

Graphic credit: Environmental Protection Agency

Click the link to read the article on the AZCentral.com website (Arlyssa D. Becenti). Here’s an excerpt:

January 8, 2025

After years of demanding the cleanup of uranium waste at the Kerr-McGee Quivira Mines on the Navajo Nation community advocates got the news this week that the Environmental Protection Agency will remove waste rock from three areas of the site and move it to a new off-site repository. The removal of over 1 million cubic yards of radioactive waste from the sites about 20 miles northeast of Gallup will begin in early 2025, the EPA said. The waste will be taken to a new off-site repository at Red Rocks Landfill east of Thoreau, N.M. The process, including permitting, construction, operation and closure of the repository, is expected to take 6-8 years.

โ€œI feel as though our community finally has something of a win,โ€ said Teracita Keyanna, a member of the executive committee for Red Water Pond Road Community Association. โ€œRemoving the mine waste from our community will protect our health and finally put us back on a positive track to Hรณzhวซ.โ€

Commercial exploration, development, and mining of uranium at Quivira Mines began in the late 1960s by the Kerr-McGee Corporation and later its subsidiary. The mine sites are the former Church Rock 1 (CR-1) mining area; the former Church Rock 1 East (CR-1E) mining area; and the Kerr-McGee Ponds area. The mines were in operation from 1974 to the mid-1980s and had produced about 1.2 million tons of ore, making them among the 10 highest producing mines on the Navajo Nation…From World War II until 1971, the U.S. government was the sole purchaser of uranium ore, driving extensive mining operations primarily in the southwestern United States. These efforts employed many Native Americans and others in mines and mills. Between 1944 and 1986, nearly 30 million tons of uranium ore were extracted from Navajo lands under leases with the Navajo Nation. With over 500 abandoned uranium mines โ€” many say the total could be in the thousands โ€” clean up of mines has always been a battle.

Arkansas Valley Conduit awarded an additional $250 million — Chris Woodka (Southeastern #Colorado Water Conservancy District) #ArkansasRiver

Reclamation Commissioner Camille Calimlim Touton greets several members of the Southeastern District Board, from left, Bill Long, Kevin Karney, Howard โ€œBubโ€ Miller, Andy Colosimo and Justin DiSanti. Photo credit: Southeastern Colorado Water Conservancy District

January 8, 2025

Camille Calimlim Touton, Commissioner of the U.S. Bureau of Reclamation, traveled to Pueblo on Wednesday, January 8, to announce an additional $250 million for construction of the Arkansas Valley Conduit.

โ€œWe are proud to see the work underway because of President Bidenโ€™s Investing in America agenda,โ€ Commissioner Touton said. โ€œBut thereโ€™s much more work to be done and we are again investing in this important project to bring safe drinking water to an estimated 50,000 people in 39 rural communities along the Arkansas River.โ€

The $250 million is funded through the Bipartisan Infrastructure Law and is part of a $514 package of water infrastructure investments throughout the western United States under the BIL.

The additional funding brings the total federal investment in the AVC to almost $590 million since 2020, along with state funding guarantees of $90 million in loans and $30 million in grants.

โ€œAfter 25 years, I still almost canโ€™t believe itโ€™s happening, but I drive by and can see it with my own eyes,โ€ Southeastern Water Conservancy District President Bill Long told Commissioner Touton. โ€œThere are so many people who have worked so hard who would be so proud to see it being built. This money will get us to the area that has seen the most problems.โ€

The Southeastern District is the sponsor for the AVC, which is part of the 1962 Fryingpan-Arkansas Project Act. The 130-mile pipeline to Lamar will bring water to 50,000 people being served by 39 water systems when complete.

Several Southeastern Board members attended Wednesdayโ€™s announcement.

โ€œYou and your team are the ones who have gotten this off the ground,โ€ said Kevin Karney, a La Junta rancher, and at-large Board member.

โ€œPeople said it would never get built, but now weโ€™re getting it done,โ€ said Howard โ€œBubโ€ Miller, who represents Otero County on the Board.

The AVC will help 18 water systems that face enforcement action for naturally occurring radionuclides in their groundwater supplies, as well as communities struggling to meet drinking water and wastewater discharge standards.

Construction of the AVC began in 2023, and three major construction contracts have been awarded.

โ€œThis money really gets us further down the valley. It is very much appreciated,โ€ Long said.

Here is a link to the Bureau of Reclamation News Release: https://www.usbr.gov/newsroom/news-release/5074.

Below is a news release from Coloradoโ€™s Senators: https://www.bennet.senate.gov/2025/01/08/bennet-hickenlooper-welcome-additional-250-million-from-bipartisan-infrastructure-law-for-arkansas-valley-conduit/

Hickenlooper, Bennet Welcome Additional $250 Million for Ark Valley Conduit

Funding awarded from the senatorsโ€™ Bipartisan Infrastructure Law

In total, Hickenlooper and Bennet have helped secure $500 million in funding for the project

WASHINGTON โ€“ Today, Colorado U.S. Senators John Hickenlooper and Michael Bennet welcomed the Bureau of Reclamation (BOR)โ€™s announcement of $250 million in new funding from the Bipartisan Infrastructure Law for continued construction of the Arkansas Valley Conduit (AVC).

โ€œWe passed the Bipartisan Infrastructure Law to finally deliver on promises to rural communities,โ€ said Hickenlooper. โ€œIn Colorado that means finishing the long-awaited Ark Valley Conduit and bringing clean, reliable drinking water to 50,000 people.โ€

โ€œFor decades, Iโ€™ve worked to secure investments and pass legislation to ensure the federal government keeps its word and finishes the Arkansas Valley Conduit,โ€ said Bennet. โ€œThis major Bipartisan Infrastructure Law investment will be critical to get this project across the finish line to provide safe, clean water to tens of thousands of Coloradans along the Arkansas River.โ€

John F. Kennedy at Commemoration of Fryingpan Arkansas Project in Pueblo, circa 1962.

The AVC is a planned 130-mile water-delivery system from the Pueblo Reservoir to communities throughout the Arkansas River Valley in Southeast Colorado. This funding will continue ongoing construction. The AVC is the final phase of the Fryingpan-Arkansas Project, which Congress authorized in 1962.

Hickenlooper and Bennet have consistently and successfully advocated for increased funding for the AVC. Last year, Hickenlooper and Bennet wrote to President Biden to urge him to prioritize funding for the AVC in his fiscal year 2025 budget. The senators also called on Senate Appropriations leaders to provide more funding for the project. In January 2023, Hickenlooper and Bennet urged BOR to allocate additional resources through annual appropriations and Bipartisan Infrastructure Law funding.

As a result of their efforts, the senators have helped deliver $500 million from the Bipartisan Infrastructure Law for the AVC, including $90 million in 2024, $100 million in 2023, and $60 million in 2022. They also secured an additional $10.1 million in fiscal year 2024 and $10.1 million in fiscal year 2023 through the annual government funding bills.

More information on the funding is available HERE.

Arkansas Valley Conduit map via the Southeastern Colorado Water Conservancy District (Chris Woodka) June 2021.

Romancing the River: To Halve and Have Naught — George Sibley #ColoradoRiver #COriver #aridification

Graphic credit: The Colorado River water crisis its origin and future Jock Schmidt, Eric Kuhn, Charles Yackulic.

January 7, 2025

Belated seasonโ€™s greetings, dear readers! The season being the long dark days as our turning planet slowly tilts our part of the planet again toward the star we circle โ€“ moving us into a new year-cycle that will probably again be โ€˜one of the ten warmest years in recorded climate historyโ€™ โ€“ if not โ€˜the warmestโ€™ again.

But we are officially no longer going to be concerned about that, right? The voters have spoken, with the usual one-percent victory taken by the winner to be a landslide mandate. And what the voters decided, by that one-percent margin, is that we, as a nation, the Untied States of America, shall officially cease to believe that we are changing the climate; weโ€™ve given ourselves license to linger in the denial and anger stages โ€“ denial that it is happening, and anger at anyone who wants to blame us for that which we can now officially refuse to believe is happening.

And we will not just lie back leisurely, relaxing in our denial, doing nothing about what we believe is not happening. No, we are going to try to break all previous production records of those fossil fuels that we can now officially refuse to believe are changing the climate โ€“ yes, even coal too, to shovel into the industrial juggernaut, which will grow as all those factories that moved overseas will sheepishly return home, once the tariffs are working their magic in bending the rest of the world to our willโ€ฆ. We are promised this will be the official national Reality According To Trump (RATT).

Meanwhile, however, back along the Colorado River, it is a little harder to make the RATT logic compute. The sequence of successively warmer years has had an undeniable, measurable, negative impact on our usable water supply: something like a 5-7 percent loss of surface water for every degree of rise in the annual average temperatures. Itโ€™s not necessarily that thereโ€™s less water; itโ€™s just that more of the water is shifting into the uncontrollable vapor state rather than the manageable liquid state we earthlings need. The bottom line is a measurably diminishing supply, over the past several decades, of the surface water on which 35 million city dwellers and the irrigators of five million acres of desert land depend to some degree.

Udall/Overpeck 4-panel Figure Colorado River temperature/precipitation/natural flows with trend. Lake Mead and Lake Powell storage. Updated through Water Year 2024. Credit: Brad Udall

Where are we right now with the management planning process for the river? In mid-November 2024, the Bureau of Reclamation issued five mix-and-match alternatives for managing the Colorado River in the future โ€“ meaning the decade or so beyond the 2026 expiration of the 2007 Interim Guidelines (and the 2019 Interim Interim Guidelines, and the 2023 Interim Interim Interim Guidelines).

These alternatives are the Bureauโ€™s effort to break the stalemate in the stalled negotiations between the four states of the Upper Colorado River Basin and the three states of the Lower Colorado River Basin. Large cuts in use will be necessary to keep the storage and distribution systems operational, and each Basin wants the other Basin to take a larger share of those cuts proscribed by โ€˜the river we have, not the river we dream for,โ€™ as Coloradoโ€™s chief negotiator Becky Mitchell put it. (See the graphic at the beginning.)

The Bureauโ€™s five alternatives, for which they plan to do the required Environmental Impact analysis this year, all focus primarily on managing the two main reservoirs, Mead and Powell, although other reservoirs in the system may by used to bolster storage in the two big ones. The five alternatives run a gamut from the NEPA mandatory โ€˜No Actionโ€™ alternative (continue business as usual), through two varying levels of federal management if the states are unable to reach a working agreement, to an alternative based primarily on a plan submitted by conservation groups, to a final alternative that is mostly pieced together from the conflicting plans proposed by the two basins, assuming the two basins can find the necessary compromises to make the two plans into one plan that might work.

Native America in the Colorado River Basin. Credit: USBR

All alternatives except the one by conservationists (#4) include notice that โ€˜there would be explicit accounting of unused/undeveloped quantified Tribal water.โ€™ This means that the settled or decreed water rights of the First Peoples would finally be acknowledged in the river accounting, noting where and by whom their undeveloped water was being used โ€“ the first step, as one tribal member observed, in eventually either getting the water back for their own use, or getting paid by others for the continued use of their water. The First People are getting closer to being at the table. (It is worth noting that the Gila River Indian Community, south of Phoenix, is the first user organization to sign a post-2026 contract with the Bureau to leave some of its water in Mead Reservoir, water that will be conserved through projects to be funded with infrastructure money, if that survives the RATT.)

That is the broad overview; if you wish for more specifics, you can find more detailed descriptions of all five alternatives here, but there is probably no real need for us citizens to get down in the weeds of detail just yet, since we are just passive participants at that level anyway.

Instead, I want to encourage us to think on the larger level of considering alternatives not part of the Bureauโ€™s five choices. Why not? There is, after all, a large minority of us who do not drink the small majorityโ€™s RATT kool-aid. For those of you who fit that description, my seasonโ€™s greeting to you are two quotations I encountered recently that kind of rang my bell:

The first is a poet calling for poets to โ€˜give us imagination of peace, to oust the intense, familiar imagination of disaster.โ€™ โ€˜Peaceโ€™ is given the negative-space definition of โ€˜not only the absence of warโ€™: something more, or other, than mere truce. The โ€˜familiar imagination of disaster,โ€™ on the other hand, is a major element of the RATT: a nation overrun  by immigrant murderers, inflation out of control, an economy gone to hell, cities awash in crime, et cetera โ€“ thatโ€™s the virulent and violent imaginings that became the principal election strategy of the Repugnicans (as distinguished from the real but very timid Republicans). They call it  โ€˜flooding the zone with shit,โ€™ so much imagining of fictitious disaster that one wave of lies cannot be seriously addressed and challenged before the next wave rolls over us. This was a successful campaign strategy, with the naive cooperation of the national media serving as their trumpet: when the fact meets the RATT, print the RATT โ€“ reserving the last couple paragraphs for quotes citing the facts that contradict the RATT, thus itโ€™s fair and balanced!

But when we come to our river โ€“ how are the poets to โ€˜imagine the peaceโ€™? And the call for poets does not necessarily preclude the hydrologists, politicians, water managers and others who manage โ€˜the river we have.โ€™  Just to say, for example, as Becky Mitchell said, โ€˜We need to plan for the river we have, not the river we dream for,โ€™ moves the discourse into the poetโ€™s realm of analogy and metaphor, not denying but augmenting the scientistโ€™s world of evidential causation and consequence, en route to testable hypotheses.

The second quote, however, by the author of 1984 โ€“  the book describing the fully devolved RATT worldview that we are flirting with now โ€“ cautions us that โ€˜the imagination, like certain wild animals, will not breed in captivity.โ€™ Is that same as saying the realm of the imagination lies in โ€˜thinking outside the boxโ€™? Like we keep saying we need to be doing?

Well, moving forward with that assumption โ€“ Orwell seems to be suggesting that the imagination canโ€™t kick into gear if we are, consciously or unconsciously, holding it โ€˜in captivityโ€™ inside some box of dominant conventional weltanschauung โ€“ โ€˜world viewโ€™ in translation, ideology, or just โ€˜our way of doing things.โ€™ But the word is so much more heavily evocative in German of the mass and weight of the box, the height of the sidewalls that discouraging climbing up to look over and beyondโ€ฆ. Orwell was aware of the flywheel power of the boxes a society builds around itself โ€“ and the extent to which that power depends on the unquestioning, often only semi-conscious, acceptance of those who dwell within the box as โ€˜the way it is and thatโ€™s it.โ€™ Even if โ€˜the way it isโ€™ is not that great.

That would suggest that unleashing our imagination to such tasks as the โ€˜imagination of peace,โ€™ even just regional peace along a modest and shrinking desert river, has to begin by becoming aware of the box that we need to be trying to think outside of.

What I think we have in the Colorado River region are at least two nested boxes. Whenever we hear someone intone, โ€˜The foundation of the Law of the River is the Colorado River Compact,โ€™ or, โ€˜The Colorado River Compact cannot be (tinkered with, changed to fit reality, or discarded as irrelevant),โ€™ we can assume that their imagination is held captive in the Colorado River Compact Box. When Becky Mitchell says, โ€˜We have to plan for the river we have, not the river we dream for,โ€™ she has at least hiked herself up onto the edge of the Compact Box โ€“ a Compact that was written for a mythic river half-again larger than the river we have now. She might even be looking beyond the Compact for resolution (although she can probably not say that out loud yet).

Prior appropriation example via Oregon.gov

If we hike ourselves up onto the edge of Compact Box, we will find ourselves looking at a larger and more intimidating box: the Prior Appropriation Box. This, not the Compact, is clearly the โ€˜foundationโ€™ of all law regarding the use of the river: first come, first served, and seniority rules. All seven of the Colorado River states had embraced the Appropriation Doctrine as the foundation of their water law by the early 20th century. (New Mexico and Arizona did not become states until 1912.)

But those of us captive in the Compact Box tend to forget that the Compact Commission came together in 1922 to try to override the appropriation doctrine at the interstate level, among the seven states. California was growing so fast, with Arizona not far behind, that the high desert and mountain states above the riverโ€™s canyon region โ€“ growing much more slowly due to the erratic ebb and flow of the mining industry โ€“ feared there would be no unappropriated water left when they hit their stride. And none of the states really wanted a seven-state horserace of helter-skelter โ€˜defensive appropriationโ€™ to avoid being left high and dry.

The water managers in the states also knew that the only way to โ€˜civilizeโ€™ the Colorado River was to control and store the annual spring flood of mountain snowmelt, for release as needed throughout the rest of the year. And because it was an interstate river, and because the cost of big mainstream structures was beyond their means, they knew the federal government, through its Bureau of Reclamation, would have to take a lead role in that regional development. But what they did not want was for the feds to take over all the development and operation of โ€˜theirโ€™ riverโ€™s water.

Members of the Colorado River Commission, in Santa Fe in 1922, after signing the Colorado River Compact. From left, W. S. Norviel (Arizona), Delph E. Carpenter (Colorado), Herbert Hoover (Secretary of Commerce and Chairman of Commission), R. E. Caldwell (Utah), Clarence C. Stetson (Executive Secretary of Commission), Stephen B. Davis, Jr. (New Mexico), Frank C. Emerson (Wyoming), W. F. McClure (California), and James G. Scrugham (Nevada) CREDIT: COLORADO STATE UNIVERSITY WATER RESOURCES ARCHIVE via Aspen Journalism

So the Compact Commission assembled in January of 1922 to develop an interstate compact that would โ€˜provide for the equitable division and apportionment of the use of the waters of the Colorado River Systemโ€™ โ€“ a seven-way division of the waters to give each state the right to use, in its own good time, the water needed to develop its land and resources. When a state was ready to use it, their share of the riverโ€™s water would be there for them, protected from prior appropriation by other faster-growing states.

That was the vision anyway: the โ€˜Compact Boxโ€™ nested in the โ€˜Prior Appropriation Boxโ€™ was to be an interstate refuge from the prior appropriation doctrine. โ€˜First come, first servedโ€™ could by the law within the states โ€“ but only up to the quantity allotted for each state.

They failed to realize that vision, however, after several days of trying โ€“ mostly for reasons of vagueness about, first, the flow of the river itself, and second, their own over-optimistic estimates of their own futures. Only the persuasive power of the federal representative on the Commission, Herbert Hoover โ€“ an engineer by training who really wanted to see the big mainstream structures built โ€“ kept them on task until they patched together, ten months later, the two-basin division for the use of the riverโ€™s water.

That substitute division was immediately rejected by the State of Arizona, and is now clearly failing at its original intent to transcend the appropriation doctrine between states: California is applying the prior appropriation doctrine against the other states in the Lower River Basin (as Arizona knew they would eventually). And the Lower Basin is threatening โ€˜Compact callsโ€™ against the Upper Basin states if they do not get their 75 million acre-feet over any ten-year period as defined in Article III(d) of the Compact, as though the division into two basins had given them a big โ€˜prior appropriation.โ€™

The โ€˜Compact Boxโ€™ is basically just a โ€˜shadow box,โ€™ a failed effort to do what was really a pretty good idea โ€“ an imagination of peace among the states. The question now is: would it be possible to revive that idea of an โ€˜equitable divisionโ€™ among the seven states โ€“ as something that is already somewhat accomplished? Thatโ€™s a thread weโ€™ll pluck at next post.

Map of the Colorado River drainage basin, created using USGS data. By Shannon1 Creative Commons Attribution-Share Alike 4.0

ย Can new sprinklers save the #ColoradoRiver? This #Utah program could be a blueprint for the West — David Condos (KUNC) #COriver #aridification

Rancher Andy Rice picks a handful of plants from one of his pastures in southern Utah on Aug. 21, 2024. His ranch is part of a state program aimed at conserving water that helps cover the cost of modernizing irrigation equipment. David Condos/KUER

Click the link to read the article on the KUNC website (Dave Condos):

January 3, 2025

This story is part of ongoing coverage of the Colorado River, produced by KUER in Utah, distributed by KUNC in Colorado, and supported by the Walton Family Foundation. It was also produced as part of the Colorado River Collaborative. KSL TV photographer Mark Wetzel contributed to this story.

Southern Utah is not your typical farm country. At a glance, there appears to be more red rock than green fields.

To make a go of it, farms often huddle around the precious few rivers that snake across the sun-baked landscape. Thatโ€™s the case for rancher Andy Rice, who raises hundreds of hungry goats and sheep in the town of Boulder โ€” population 227 โ€” just outside Grand Staircase-Escalante National Monument.

In a bright green meadow packed with more than a dozen types of grasses, clovers and flowers, Rice reached down to pluck a makeshift bouquet. He has intentionally planted diverse species here over the years to improve the ranchโ€™s sustainability.

โ€œIsn’t that beautiful?,โ€ he said, holding up a handful of flora. โ€œOn top of everything else that’s cool about it, it’s just really pretty.โ€

But this is still the dry Southwest. The edges of his lush pasture give way to a rugged sandstone ridge. So this grazing smorgasbord is dependent upon irrigation.

The ranch draws water from Boulder Creek, which flows to nearby Lake Powell, the nationโ€™s second-largest reservoir and a pivotal piece of the Colorado River system. Between drought, climate change and competition for that river, however, Rice knows the West faces a precarious future.

โ€œWe will have less water. Forever,โ€ Rice said. โ€œWe have to accept that and โ€ฆ it’s up to us to be more efficient.โ€

Thatโ€™s why he applied for funding from Utahโ€™s Agricultural Water Optimization Program, a $276 million push to help farmers and ranchers modernize their irrigation systems.

Andy Rice holds one of the nozzles on a center pivot sprinkler system his ranch was able to install thanks to state money, on Aug. 21, 2024. Utahโ€™s Agricultural Water Optimization Program has put millions of dollars into helping farmers and ranchers modernize their irrigation systems since 2019. David Condos/KUER

Agriculture uses between 70-80% of the Colorado Riverโ€™s water, so a lot of ideas about saving the shrinking river rely on getting farmers and ranchers to cut back. The Utah program โ€” which covers half the cost of buying new, more efficient gear โ€” provides a case study that other Western states might look to as they search for solutions. However, itโ€™s not yet clear how big of a dent these types of efforts can make when it comes to saving water on a basin-wide scale.

Rice stood next to the automated center pivot sprinkler system the program helped buy and grabbed one of the dozens of spray nozzles that dangle a few feet above the ground. Compared to the efficiency of the equipment it replaced, he said, the difference is night and day.

โ€œThis farm alone has saved millions of gallons of water. We’re using millions less. And we are one tiny farm in one tiny region,โ€ Rice said.

Thatโ€™s the idea behind the Utah program. If state money lowers the financial barrier for producers to modernize, the water savings might add up to help Utah get more out of the little moisture it has.

Rice is just one example of the stateโ€™s approved projects โ€” 551 of them since the initiative began in 2019, said Program Manager Hannah Freeze. The Utah Legislature has set aside $276 million for the effort. As of late 2024, $108 million of that has been assigned to projects. A majority of the money is benefitting the Great Salt Lake, however. Only $23 million has been approved for 112 projects in Utahโ€™s portion of the Colorado River Basin so far.

Itโ€™s a good start, Freeze said, but a drop in the bucket compared to what it might take.

โ€œIf we were going to make a real dent or reach the majority of the farmers that we have, it’s more like a $2 billion number,โ€ she said.

That would require more time, too โ€” probably around three decades, Freeze said.

Growing the program that much wouldnโ€™t be easy. Some producers are hesitant to change farming practices. For others, equipment cost remains a barrier even with the subsidy.

Many also donโ€™t know that government incentives like the optimization program exist. A 2023 survey of irrigators across the Colorado River Basin by the Western Landowners Alliance and the University of Wyoming found a “stark lack of awareness” about state and federal funding meant to help them conserve water.

Eventually, farmers wonโ€™t have much of a choice, noted Freeze.

โ€œThere’s going to be water reductions that have to take place,โ€ she said. โ€œSo if we can come in first and say, โ€˜Let us help you get this improved irrigation system,โ€™ then our farmers can stay in business.โ€

Sprinklers spray water across farm fields in southern Utah on Aug. 22, 2024. Some research has suggested that improving irrigation efficiency ultimately depletes more water from local watersheds. David Condos/KUER

The Utah program offers a glimpse of what a state-funded program to help producers make that transition can look like.

Some science, however, contradicts the idea that installing new, more efficient irrigation systems automatically means saving water in the Colorado River.

New Mexico State University professor Frank Ward and his colleagues found in their research that applying less water is not the same thing as consuming less water.

Higher irrigation efficiency means a larger percentage of the applied water makes it to the roots of the plants, which is good for crop yields. But even if that lets a farmer decrease the total amount of water they apply to a field, it often increases the amount of water depleted from the local watershed.

Ultimately, he said upgrading sprinkler systems typically means less of the water applied as irrigation soaks into groundwater and returns to nearby rivers as run-off, disrupting the local water cycle.

โ€œDrip irrigation and center pivot are good things to do.They promote the goal of lower food prices, higher food production and farm income,โ€ Ward said. โ€œJust don’t call it investments in water conservation.โ€

To truly assess if a program like Utahโ€™s is saving water for the Colorado River Basin, he said, youโ€™d need to also calculate how much of the water applied to crops is lost to evapotranspiration, a measurement of the water that evaporates and is released into the air from plants.

In Wardโ€™s view, there are more effective ways a state could spend its money to conserve water in agriculture. Government funds could pay farmers to switch to less thirsty crops or water their fields less than what the crops need for optimal growth. Another option would be to pay growers to temporarily leave some land empty or switch sprinkler-fed farmland to a rain-fed ranching pasture.

A lot of these alternatives might not improve the agricultural economy, Ward said, but thatโ€™s a trade-off states need to consider if their ultimate goal is to save water.

Andy Rice explains how the irrigation system updates at his southern Utah ranch have changed the way he uses water on Aug. 21, 2024. David Condos/KUER

When it comes to the Utah optimization program, the results remain a bit hazy.

The state is just beginning to quantify how much water it saves, so comprehensive data isnโ€™t available yet. A legislative audit in 2023 criticized the program for not collecting detailed reports on the impact of its projects.

Early examples like Andy Riceโ€™s ranch, however, point to the potential role that irrigation modernization efforts could play across the West.

All told, Rice said the upgrades to the field with a new sprinkler represent a quarter of a million dollars. For family farms that buy irrigation equipment with the same money they use to keep the business afloat or buy their kidsโ€™ shoes, he said it can be hard to justify those costs.

If states across the Colorado River Basin help make it easier for farmers to take that leap, however, he believes that could have far-reaching impacts.

โ€œIf hundreds of farms can save millions of gallons of water, I mean, we can fix it,โ€ Rice said. โ€œAnd do I feel like we have a responsibility to do that? Yeah, hell yeah.โ€

Relentless warming is driving the water cycle to new extremes, the 2024 global water reportย shows

Albert Van Dijk, Australian National University

Last year, Earth experienced its hottest year on record โˆ’ for the fourth year in a row. Rising temperatures are changing the way water moves around our planet, wreaking havoc on the water cycle.

The 2024 Global Water Monitor Report released today shows how these changes are driving extreme events around the world. Our international team of researchers used data from thousands of ground stations and satellites to analyse real-time information on weather and water underground, in rivers and in water bodies.

We found rainfall records are being broken with increasing regularity. For example, record-high monthly rainfall totals were achieved 27% more frequently in 2024 than at the start of this century. Record-lows were 38% more frequent.

Water-related disasters caused more than 8,700 deaths and displaced 40 million people in 2024, with associated economic losses topping US$550 billion (A$885 billion). The number and scale of extreme weather events will continue to grow, as we continue pump greenhouse gases into an already overheated atmosphere. The right time to act on climate change was about 40 years ago, but itโ€™s not too late to make a big difference to our future.

Humanity in hot water

Warmer air can hold more moisture; thatโ€™s how your clothes dryer works. The paradoxical consequence is that this makes both droughts and floods worse.

When it doesnโ€™t rain, the warmer and drier air dries everything out faster, deepening droughts. When it rains, the fact the atmosphere holds more moisture means that it can rain heavier and for longer, leading to more floods.


A dam upgrade left one Colorado section of the #RioGrande dry in the winter. What will it take for water to flow again? Local group says state, irrigation district failed to fulfill promises in project — The #Denver Post

Rio Grande Reservoir release. Photo credit: Rio Grande Basin Roundtable

Click the link to read the article on The Denver Post website (Elise Schmelzer). Here’s an excerpt:

January 5, 2025

The mighty and fabled Rio Grande dwindles to barely a trickle in the winter west of Creede, exposing nearly a mile of rocky riverbed to dry under the weak sun. This section of the river near its headwaters wasnโ€™t supposed to be left dry in the winter, according to environmental groups. A rehabilitation project on the dam that createsย the Rio Grande Reservoirย was billed as an upgrade that would make the river healthier and improve recreation throughout the year. But even four years after the construction project concluded, those promises havenโ€™t materialized. Thatโ€™s because the damโ€™s new valves cannot safely release water during the winter, according to theย Committee for a Healthy Rio Grande, a group formed to push for more water releases from the reservoir for fishing, rafting and environmental health. The irrigation district that operates the dam closes the valves from November through March. The lack of water in the winter kills off aquatic insects and vegetation โ€” the base of the river ecosystemโ€™s food cycle…

A solution may be in the works. After four years, the San Luis Valley Irrigation District โ€” which owns and operates the reservoir โ€” on Dec. 1 applied for state grant money to study how the damโ€™s valves could be modified to work in the winter, said Cole Bedford, the chief operating officer of the Colorado Water Conservation Board

โ€œWe are developing a solution that will safely provide low-flow releases during the winter,โ€ San Luis Valley Irrigation District Superintendent Rob Phillips said in an emailed statement.  โ€œAnd, we look forward to continuing our work with those water users and organizations in the San Luis Valley who have a unique and valued history of working together to find constructive solutions.โ€

The issue is part of a larger challenge: How should Colorado balance the different uses of its water as climate change shrinks supplies and adds volatility to decades-old climate patterns?

Summit County currently has one of the highest snowpack medians in the state — The Summit Daily #snowpack

Westwide SNOTEL basin-filled map January 6, 2024 via the NRCS.

Click the link to read the article on the Summit Daily website (Kit Geary). Here’s an excerpt:

January 5, 2025

Summit and Eagle counties are poised to get a consistent dusting of powder nearly everyday this week heading into next weekend, according to National Weather Service meteorologists.ย Meteorologist Zach Hiris said there will be a โ€œfairly active pattern across the mountainsโ€ on Monday, Jan. 6, and Tuesday, Jan. 7, which is likely bring a few inches of snow to the slopes. He said โ€œa bunch of weak systemsโ€ could follow from Wednesday through Saturday and these are slated to bring a couple more inches. Summitโ€™s mountains are anticipated see anywhere from 3-6 inches and its valley areas could see 1-3 inches of snow by Wednesday morning, Hiris said.ย Wednesday, Thursday and Friday could bring an inch or two each, but it will be more sporadic than the snowfall delivered by Monday and Tuesdayโ€™s storms, he said.

ย 

Hiris said the Blue River Basin is currently at 129% of its snowpack median.ย 

According to theย United States Department of Agriculture, the Colorado Headwaters river basin is currently at 104% of its median snowpack, the Eagle area is at 113% of its median snowpack and the Roaring Fork area is at 109%ย  of its median snowpack.ย 

The #RioGrande cutthroat trout and the Endangered Species Act — John Fleck (InkStain.net)

Rio Grand Cutthroat distribution 2016. Courtesy New Mexico Department of Game and Fish

Click the link to read the article on the InkStain website (John Fleck):

December 26, 2024

The US Fish and Wildlife Service earlier this month (December 2024) once again declined to list the Rio Grande cutthroat trout as โ€œendangered.โ€

Itโ€™s a native species endangered (in the colloquial sense, not the legal sense) by both anthropogenic habitat changes (warm temperatures, less water, dams and stuff) and non-native immigrant species.

USFWS identified non-native hybridization and competition as the most significant threat, and concluded that collective action by a collaborative effort including federal, state, and tribal governments, along with NGOs, has successfully stabilized the fishโ€™s population since discussion about possible listing first began a quarter century ago.

“The 119 populations are distributed across a wide geographic area, providing sufficient redundancy to reduce the likelihood of large-scale extirpation due to a single catastrophic event. Furthermore, the Rio Grande cutthroat trout Conservation Team has a demonstrated track record of responding to negative events to protect and even expand populations in the aftermath of large-scale changes to streams. Populations cover the breadth of the historical range, ensuring retention of adaptive capacity (i.e., representation) to promote short-term adaption to environmental change. The SSA report describes the uncertainties associated with potential threats and the subspeciesโ€™ response to these potential threats, but the best available information indicates the risk of extinction is low. Therefore, we conclude that the Rio Grande cutthroat trout is not in danger of extinction throughout all of its range and does not meet the definition of an endangered species.”

ESA questions

Iโ€™ve not followed the Rio Grande cutthroat trout saga closely. My primary interest is in its value in highlighting broader issues around the ESA that my Utton Center colleagues and I have been discussing of late.

Collective action

Collective action by a broad coalition of stakeholders before ESA listing seems to have been key in protecting whatโ€™s left of the species and avoiding listing.

Question: Is this driven by a societal environmental value (We love this fish and the ecosystems on which it depends, and want to protect them!) or a desire to avoid the messiness of ESA listing and the resulting land and water management craziness that would result therefrom?

In the new book, we note a clear distinction between these two types of cases in the history of Albuquerqueโ€™s relationship with the Rio Grande: environmental actions growing out of collective community values, and environmental actions driven by statutory (in this case ESA) mandates.

Charisma

Charismatic?

We know that charismatic species get more societal love. (Woe is our diminutive Rio Grande silvery minnow.) The Rio Grande cutthroat trout is charismatically beloved. Does this help explain the energetic collective action weโ€™ve seen?

Loper Bright for the โ€œforeseeable futureโ€

Reading the USFW federal register notice in light of the Supreme Courtโ€™s Loper Bright decision, is interesting. IANAL, but my shorthand for the decision is that the courts no longer must defer to an implementing agencyโ€™s interpretation of ambiguous statutory provisions. Hereโ€™s USFWS in the cutthroat trout decision:

Maybe language like that was always included in USFW Federal register notices? I expect a lot more post-Loper Bright debates about what Congress intended.

Cutthroat trout historic range via Western Trout

The #KlamathRiver Dam Removals: A Story of People and Possibility — Ann Willis (@AmericanRivers)

Free flowing Klamath River, California | Swiftwater Films, Shane Anderson

Click the link to read the article on the American Rivers website (Ann Willis):

September 24, 2024

As I stood on a bridge and looked upstream along the Klamath River, I felt confused. For over 15 years, I had stood in the same stop and gazed on the earthen face of Iron Gate Dam. But on this day, I sawโ€ฆspace. Framing the edges of that space, I saw canyon walls, river bed, floodplains and terraces, and miles of vista. 

I lost my dad last year, so I understand having the experience of noticing the absence of someone who had been monumental in my life โ€“ both physically and metaphorically. I understand the confusion that results from seeing a space where he used to be and being keenly aware of his absence. I noticed the absence of Iron Gate Dam in the same way โ€“ the loss of something that had been monumental in my life and in the lives of thousands of others. But unlike the absence of my dad, seeing the absence of Iron Gate Dam stirred feelings of wonder, joy, hope, and gratitude. 

Undammed: The KLamath River Story

The history of water in the West has been shaped by conflict, greed, and scarcity, but in a remote pocket of Southern Oregon and Northern California, a different Western water story is taking shape. The largest dam removal in history is on the verge of completion on the Klamath River. This moment is the result of a historic decades-long Tribally-led campaign to free the Klamath River and restore salmon and steelhead populations, which are core to Native traditions and foodways. This is undoubtedly a huge triumph.

The first episode of this in-depth podcast dives into the past, present, and future of the worldโ€™s largest dam removal project and features Dr. Ann Willis, American Riversโ€™ California Regional Director.

Spotify

Apple Podcasts

Feds to analyze proposed plans for #ColoradoRiver water use — The Las Vegas Sun #COriver #aridification

Carly Jerla speaking at the Colorado River Water User’s Association Conference December 5, 2024. Photo credit: USBR

Click the link to read the article on The Las Vegas Sun website (Ilana Williams). Here’s an excerpt:

December 18, 2024

Federal water officials are expected to provide further details in the coming weeks on four proposals for managing the dwindling Colorado River water supply. The current agreement among states expires next year…A pending analysis will detail the benefits and drawbacks of four different plans, said Carly Jerla, the senior program manager at the U.S. Bureau of Reclamation.ย The analysis will not include any recommendations. The states must reach an agreement on how to allocate the available water by August 2026…

The proposed alternatives include: protecting infrastructure by monitoring how much river water is delivered and using existing agreements when demand overwhelms the supply; adding delivery and storage for Lake Powell and Lake Mead, along with โ€œfederal and non-federal storageโ€ to boost system sustainability and flexibility; and a cooperative conservation approach aimed at managing and gauging water releases from Lake Powell amid โ€œshared contributions to sustain system integrity. The fourth proposal would add delivery and storage for lakes Powell and Mead, encourage conservation and agreements for water use among customers and โ€œafford the tribal and non-tribal entities the same ability to use these mechanisms.โ€

โ€œThe preferred alternative isnโ€™t any single one of these alternatives,โ€ Jerla said. โ€œThey were constructed to ensure that these concepts were grouped together to allow for the possibility to mix and match.โ€

[…]

Whatever management path the states agree on, a team of water officials has one concern: the annual set water releases at Glen Canyon Dam. Eric Kuhn, the retired general manager of the Colorado River Water Conservation District, partnered with other water leaders to author a letter to the Bureau of Reclamation asking it to stop the practice of determining water release quantities annually for Glen Canyon Dam in northern Arizona. They agree that water releases must continue. However, they donโ€™t want a set release amount, stressing the flexibility helps with maintaining the ecosystem around the river, specifically the ecosystem around the Grand Canyon…The management approach Kuhnโ€™s team prefers would create two pools: a Lower Basin pool in Lake Powell, the reservoir connected to Glen Canyon Dam; and an Upper Basin pool in Lake Mead, the reservoir connected to Hoover Dam. That would allow for changes in annual releases, if necessary, and offer flexibility, he said.

Map of the Colorado River drainage basin, created using USGS data. By Shannon1 Creative Commons Attribution-Share Alike 4.0

Endangered fish programs extension part of Congress-approved bill — The #GrandJunction Daily Sentinel

RAZORBACK SUCKER The Maybell ditch is home to four endangered fish species [the Humpback chub (Gila cypha), Bonytail (Gila elegans), Colorado pikeminnow (Ptychocheilus lucius), and the Razorback sucker (Xyrauchen texanus)] ยฉ Linda Whitham/TNC

Click the link to read the article on the Grand Junction Daily Sentinel website (Dennis Webb). Here’s an excerpt:

December 18, 2024

The Upper Colorado and San Juan River Basins Endangered Fish Recovery Programs Reauthorization Act was included in the fiscal year 2025 National Defense Authorization Act. The fish legislation extends programs that protect four threatened and endangered native fish species in the Upper Colorado and San Juan river basins. The defense bill now heads to the presidentโ€™s desk. The Senate version of the fish bill was sponsored by U.S. Sens. John Hickenlooper and Michael Bennet, both D-Colo., and Sen. Mitt Romney, R-Utah, among others. U.S. Rep. Lauren Boebert, R-Colo., carried a House version of the fish bill. A negotiated version of her bill and the Senate bill ended up being included in the defense bill. The Senate passed the defense bill Monday after passage by the House, despite controversy over a provision banning some gender-affirming care for transgender children of service members, according to a Reuters story.

The fish programs provide for studying, monitoring and stocking the four fish species, managing habitat and river flows, and combating invasive species through 2031. That provides certainty for Upper Basin water use and fulfills the federal governmentโ€™s trust responsibility to tribes, according to a news release from Hickenlooperโ€™s office…The fish bill language authorizes up to $92 million for the Bureau of Reclamation to contribute annual cost-shared funding for program implementation. It also adds up to $50 million to the authorization ceiling for capital projects, which will fund infrastructure improvements to benefit the fish.

Do homebuyers know enough about a propertyโ€™s water? What to ask the real estate agent — Fresh Water News

The downtown Denver skyline from Arvada. Photo credit: Allen Best/Big Pivots

Click the link to read the article on the Water Education Colorado website (Shannon Mullane):

January 2, 2025

Potential property owners are often not asking enough questions about water, experts say โ€” and it can end up being a costly mistake.

When someone buys a property in Colorado, they can find themselves thrust into the complicated world of Western water. People looking in towns and cities might need to learn about providers and rate changes. Those interested in empty lots, unincorporated areas of  counties or rural areas of the state might need to study up on water rights, wells and irrigation.

If theyโ€™re prepared, buyers will reach out to experts, and even attorneys, to understand the ins-and-outs of their new water supply before signing a deal. If theyโ€™re not, they could end up in the middle of a fight or with an expensive liability.

โ€œThere have been neighborly confrontations over water,โ€ said John Wells, a broker and owner of the Wells Group in Durango. โ€œIโ€™ve seen people turn other peopleโ€™s ditches off, locking their headgates, unlocking their headgates. It doesnโ€™t make for a good neighborly situation.โ€

Western water law is frequently confusing โ€” even for experts and real estate agents. Interested buyers coming from out of state are often used to a completely different system of managing water. Urban residents looking to move into rural Colorado might have little experience with ditches, ponds or water law.

โ€œMost brokers donโ€™t understand it because itโ€™s complicated and confusing, and it doesnโ€™t really impact their clientโ€™s ability to purchase a house,โ€ said Aaron Everitt, a Fort Collins-based broker and developer with The Group Real Estate.

But skipping past a thorough review of water assets can leave buyers with frustrating problems. They might face water bill increases, lead pipes, or leaky sprinklers. For more rural properties, a typo or missing signature in a water or land deed can take an extra month to fix. Ponds and reservoirs on a property might actually be illegal water storage โ€” which could take a court process or big dollars to resolve, said Bill Wombacher, an attorney with Nazarenus, Stack & Wombacher, who teaches a water law class for real estate agents.

New property owners might be surprised to see a stranger in their backyard clearing out a ditch โ€” or, as happened in 2022 in Kittredge, dozens of people using private property to access a popular creek running through private property, which prompted a local debate about public access.

It is easier to handle any water questions that come up before a deal is signed, and buyers might want to budget extra time in the purchase process for tasks like well inspections, said Amanda Snitker, chair of the market trends committee for Denver Metro Association of Realtors.

One piece of advice: โ€œBe sure theyโ€™re being thorough. Donโ€™t be afraid to ask questions, even though they might seem silly,โ€ Wells said. โ€œThereโ€™s no silly question when it comes to water.โ€

So what kind of questions should a buyer ask? [We] asked the experts to break it down.

I want to buy in an urban area. Where do I start?

People interested in buying a home, apartment or townhome in a more populated area โ€” like a town, city, special district or planned development โ€” should start by understanding their water supply and who provides it.

Is the property already connected to a main water system?

If so, it can save money for the buyer. Tap fees, the cost of adding a new connection, can be as low as $1,500 to $8,000, said Wells, who works in small towns and rural areas in southwestern Colorado. Or, the price of tapping into the local water system could be more like $50,000 in areas of the Front Range or $200,000 in some areas of the Western Slope where water supplies are tight, Wombacher said. Some water providers can also freeze adding new connections when their water system or supply is maxed out.

Who is the propertyโ€™s water provider? 

Some areas come with more established networks of pipes, canals, tunnels and reservoirs operated by a water provider. These water districts and utility providers are public entities, and buyers should know how functional or dysfunctional the organization is, Everitt said.

Itโ€™s also helpful to understand if the organization is planning to build new water infrastructure or has a backlog of needed repairs, Snitker said. The cost of water and related fees can vary depending on the water provider, and itโ€™s good to know those details up front, she said.

Graphic credit: EPA

The experts also recommended learning about wastewater systems, water quality and any water-related expenses that could come up for new owners. Here are some questions they recommended asking:

  • Can the seller provide 12 months of water bills?
  • Are there any broken sprinklers or leaky pipes?
  • Can buyersย add water-efficiency features, like systems that capture grey water or rain?
  • Has the property ever had any issues with galvanized pipes? Does it have any lead pipes?
  • What is the quality of the water, and are there any contaminants?
  • If there is a septic system, how old is it and where is it located?

Outside of a service area? Hereโ€™s how to begin.

Not all properties lie within an established service area for a water provider, like homes in unincorporated areas, rural counties and some new developments.

Homes, ranches and land in rural areas also might come with water rights โ€” a complicated part of how Coloradans access water.

When a buyer tours a property, they should keep an eye out for certain features to know what to ask: Look for wells, ponds, lakes, ditches, streams, irrigation systems and other outdoor water features, experts said.

This Parshall flume on Red Mountain measures the amount of water diverted by the Red Mountain Ditch. Pitkin County commissioners approved a roughly $48,000 grant to pipe the last 3,600 feet of the ditch in the Starwood neighborhood. CREDIT: HEATHER SACKETT/ASPEN JOURNALISM

Whatโ€™s up with ditches

Colorado is covered with a decades-old network of ditches that help transfer water to farmers, ranchers and communities around the state. These are often earthen, straight and clearly human-made, but they can also be easy to miss.

For Wombacher, ditch easements are the single most-frequent source of frustration among his clients, he said.

They are tied to a complicated system of water rights, which means ditch users have legal rights to receive a certain amount of water at specific times and locations during the year.

Ditch managers and users can move up and down the channel, even on private property, to do maintenance and manage water supplies.

That means property owners might see water flowing, but itโ€™s not theirs to use. They cannot disrupt the transfer of water, use ditch water or move the ditches (unless they go to water court). If that does happen? โ€œItโ€™s like an immediate lawsuit every single time,โ€ Wombacher said.

Questions to ask:
  • Is it actively used?
  • How might this impact what I can and canโ€™t do with the property?
  • If Iโ€™m not able to move the ditch, do I still want the property?
  • Who operates the ditch?
See a pond, get the papers

If a buyer sees a pond or lake on the property, they should ask for the water court decrees attached to the stored water.

This pond in Chaffee County near Salida is one of thousands in the Arkansas River Basin that is being evaluated by the Division 2 engineerโ€™s office as part of a new pond management program. Engineers say ponds without decreed water rights could injure senior water rights holders. Photo credit: Colorado Division of Natural Resources via Aspen Journalism

โ€œThere are quite a few unlawful uses going on out there, particularly with ponds and reservoirs,โ€ Wombacher said.

Property owners build water storage and sometimes do not go through the water court process to get a legal right to access, store and use the water.

โ€œJust because a seller has been able to get away with something for a long time, doesnโ€™t mean the buyer will,โ€ Wombacher said. โ€œAnytime thereโ€™s a water use going on on a property, you want to make sure as a buyer that itโ€™s a lawful use.โ€

Typical water well

What does it mean if thereโ€™s a well?

The state of Colorado regulates wells, and well permits come with specifications about how much water can be used and what it can be used for.

Interested buyers should start by learning about water court decrees and permits related to the well. The state has databases that can provide more information about a well using its permit number.

Adding new wells can be expensive and come with limitations based on the location and characteristics of a property, like whether it is larger or smaller than 35 acres, experts said. Buyers will also want to ask about any water quality, contamination or pressure issues in advance.

Questions to ask: 
  • If there is not a well โ€” and a buyer might want one โ€” what are the options for getting a well?
  • Can you provide a recent inspection report?
  • Does the well produce the amount of water stated in the permit? If not, the property might need aย cistern.

โ€œJust like you do a home inspection, you call someone and they do a well inspection,โ€ Snitker said.

What do I need to know about water rights?

Many properties, especially in rural areas, come with irrigation water supplies โ€” and therefore, water rights.

Water rights can add value to a property, but they also come with restrictions related to where, when and how much water can be used. These rights are legally tied to certain beneficial purposes, like farming, drinking, snowmaking, fire prevention and more.

โ€œI think a lot of lay people, and itโ€™s not their fault, think they can use water anytime they want,โ€ Wells said.

Some water rights are also more valuable than others: Under Colorado water law, more recently established โ€œjuniorโ€ rights get cut off first when water is short so older and more valuable โ€œseniorโ€ rights get their share.

Donโ€™t need irrigation water? A property owner has to go to water court to change details of a water right. And a new owner canโ€™t just own a water right and plan never to use the water for its intended purpose. If that happens, the state might analyze whether a right has been โ€œabandoned,โ€ which could dissolve the right.

Water rights are often transferred from one owner to another using a deed or a title. New buyers should check to make sure these documents are in good order, Wells said.

โ€œSometimes itโ€™s prudent to hire a water attorney to make sure that what is in the deed matches what youโ€™ll actually be sold,โ€ he said.

Questions to ask:
  • How much water can I use, when, where and for what purpose?
  • What year is the water right, and how senior is it compared with others on the same stream or river?
  • What is the supply like in periods of drought?
  • Does the water right match what Iโ€™d like to use the water for, or could I have to go to water court to change it?
  • Are the ditches, canals and other infrastructure that deliver the water well-maintained?
  • What fees come with the water supply?

More by Shannon Mullane

Northern Water Board Director Leads Panel Discussions at Annual #ColoradoRiver Gathering — @Northern_Water #COriver #aridification #CRWUA2024

Northern Water Board Director Jennifer Gimbel, left, leads a panel at the Colorado River Water Users Association this month in Las Vegas. L to R: Jennifer Gimbel, Gene Shawcroft, Estevan Lรณpez, and Brandon Gebhart. Photo credit: Northern Water

Click the link to read the release on the Northern Water website:

December 20, 2024

A member of the Northern Water Board of Directors played a large role at the annual gathering of Colorado River water officials this month in Las Vegas.

Jennifer Gimbel, who represents Larimer County on the Northern Water Board of Directors and is a senior water policy scholar at Colorado State University, moderated a pair of panel discussions at the Colorado River Water Users Association (CRWUA) annual conference about the current state of negotiations on new guidelines for the operations of Lake Powell and Lake Mead.

Gimbel helped negotiators from the Upper Basin states of Colorado, New Mexico, Utah and Wyoming outline their concerns, and in a second panel, did the same for negotiators for the Lower Basin states of Arizona, California and Nevada.

For the 1,000-plus attendees of the conference, it was an opportunity to learn more about what will guide future discussions about use of Colorado River water throughout the Southwestern United States.

Northern Water is a member of CRWUA and engages with other Colorado River users throughout the year.

In photo from second left: Gene Shawcroft of Utah, Estevan Lopez of New Mexico, Becky Mitchell of Colorado and Brandon Gebhart of Wyoming.

The new Farm Bill extension provides some relief for #Colorado producers, but leaves much unsettled — Colorado Public Radio

Photo credit: Jones Farms Organics

Click the link to read the article on the Colorado Public Radio website (Caitlyn Kim). Here’s an excerpt:

December 24, 2024

As part of a temporary stopgap government funding measure passed last week, Congress also approved a one-year extension of the Farm Bill. While the Farm Bill is seen as-must pass legislation by all sides in Congress, Congressional leaders still struggled to reach a compromise over the last two years, leaving farmers relying on outdated provisions approved in 2018, well before the COVID pandemic, the increases in operating costs, and a number of natural disasters.

Restoration project on West Fork of #DoloresRiver benefits trout habitat, ecosystem as a whole — The #Durango Herald

Cutthroat trout historic range via Western Trout

Click the link to read the article on The Durango Herald website (Cameryn Cass). Here’s an excerpt:

December 28, 2024

An area chapter of Trout Unlimited recently partnered with a landowner to restore a portion of the West Fork of the Dolores River their property borders…Besides the West Forkโ€™s beauty, itโ€™s the largest tributary of the Lower Dolores. Itโ€™s also home to all four kinds of trout, including the only one native to Colorado, the cutthroat…

Over time, modern practices and a change of land use along the riverbanks โ€“ such as ranching, grazing, or simply cutting out big fields โ€“ has resulted in less and less โ€œlarge woody debrisโ€ falling into the river, Rose said. That debris is not only a source of food, it also can be something of an anchor to slow down the water flow, and to offer fish and other critters a refuge.

In effect, the restoration project was in the name of something Rose called โ€œstructural complexity.โ€

โ€œThatโ€™s the most important term youโ€™ll pick up in this whole project,โ€ Rose said. โ€œIf you donโ€™t have complexity and have homogeneity, you donโ€™t have the richness you need to accommodate all of the aquatic co-evolutions.โ€

To create this structural complexity โ€“ and put simply โ€“ the project involved strategically arranging big boulders in different ways and places along the stretch of river.

Looming questions aboutย data centers — Allen Best (@BigPivots) #ActOnClimate

QTS Data Center Aurora June 2024. Photo credit: Allen Best/Big Pivots

Click the link to read the article on the Big Pivots website (Allen Best):

January 2, 2025

Gov. Polis and many utilities say that data centers can benefit just about everybody in Colorado. But others fear impacts to rates and potential setbacks in reduction of emissions.

Under the umbrella of the energy transition were dozens of interesting, important stories in Colorado duringย 2024, including:

  • Tri-State Generation and Transmission Association got the lifeline it so desperately needed toย make the transition from coal in the form of $679 million in assistance from the federal government.ย Sen. Michael Bennet โ€” a key partner in the Inflation Reduction Act sausage-makingย in D.C. in 2022 โ€”ย was there to commemorate it. And United Power, itself independent of Tri-State on May 1, is getting $261.6 million.
  • Pueblo talked a lot about nuclear โ€” and inexplicably began cleavingย itself from the renewable energy that had been very nearly the soleย bright spot of its economy in recent years.
  • Holy Cross Energy achieved 90% renewable generation for a month this fall.
  • United Power broke ground on a natural gas plant, and Platte River Power Authority and everybody else laid plans similar plans for natural gas.
  • Seeds were planted for geothermal to become a viable part of Coloradoโ€™s energy story in Vail, Steamboat and easily a dozen other places across Colorado.

Important stories โ€” these and many others in this energy transition. But easily surpassing them was the story of data centers and their voracious hunger for energy. Could their looming demand  derail Coloradoโ€™s decarbonization plans? Defenders say no, but they are not convincing. And will interests of ratepayers be protected?

Figuring out the public policy to balance public interests and private gain will be a major issue in the 2025 legislative session.

Three years ago, few people outside of Virginiaโ€™s data center alley were talking about data centers. In 2019, there was a half- or less-baked idea of a cryptocurrency mill in Pueblo. Later came a crypto outfit near Montrose.

The era of hyperscale data centers โ€” hyperscale is often defined as having โ€œmassiveโ€ power needs โ€” arrived in early 2022 when Microsoft purchased a 260-acre parcel in Aurora, south of DIA, for $63.5 million.

In February 2023, Mile High CRE, an online news site about commercial development, described the purchase as the first in metropolitan Denver for a hyperscale data center.

โ€œDenver has an edge over more established markets like Silicon Valley or Northern Virginia in that cost of power, cost of land, and cost of construction are lower, environmental risks are not as high, and the central location grants access to a plethora of networks,โ€ it said. What Colorado lacked, the article added, was a competitive incentive package.

In February 2024, State Sen. Kevin Priola introduced a bill that would have extended more tax breaks to data center developers. Big Pivots did write about that in a column that got broad play across Colorado. See: โ€œWhy do data center need tax breaks in Colorado? Theyโ€™re coming anyway.โ€ A few weeks later came news that the data center subsidy bill was postponed. It never got one committee hearing.

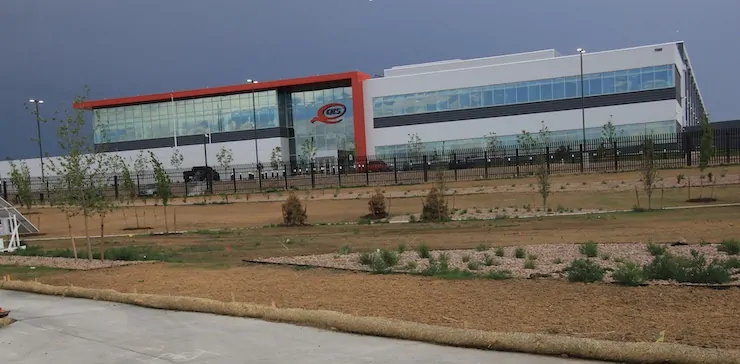
Colorado already has one hyperscale data center. Itโ€™s in Aurora, and Mark Jaffee of the Colorado Sun broke the story about QTS in October 2023. (Big Pivots was too busy on a series about water and urban landscapes to chase it).

Two guest columnists in Big Pivots weighed in on the value of data centers. Morey Wolfson, a one-time staffer at the Colorado Energy Office and at the PUC, in September argued against subsidies. Jeff Ackermann, a former chair of the PUC as well as director of the state energy office, in October argued that data centers can have upsides. Meanwhile, the Economist, the New York Times and the Washington Post began writing frequently about data centers โ€” including this story from last week: โ€œEnergy hungry AI firms bet on these moonshot technologies.โ€

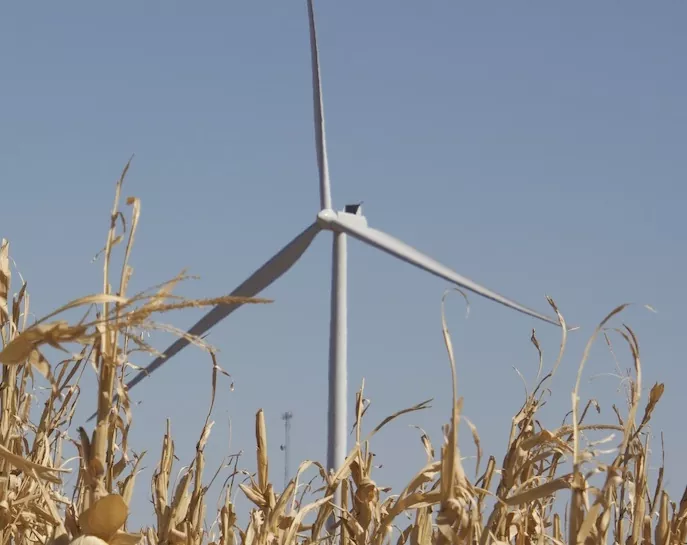
Xcel Energy in October delivered the statistics that made this a compelling Colorado story. The electrical utility, responsible for more than half of electrical sales in Colorado, said it needed a staggering 12,500 to 14,000 megawatts of new generation to meet rising demand. To put that into perspective, Rush Creek, Xcelโ€™s wind farm between Limon and Colorado Springs, has a capacity of 600 megawatts.

After average annual growth of 0.7% during the preceding five years, said Xcel, it projected 4% growth compounded annually from 2023 to 2031.

Data centers lie at the center of this projected growth, 62% for energy growth overall and 72% for peak demand, according to Xcelโ€™s Jack Ihle. In an Oct. 15 filing with Colorado regulators, he also said the same base-case forecast saw electric vehicles producing 19% and building electrification 12% of its new demand.

Even without this new demand, Xcel has had trouble getting renewable energy across the finish line. These are projects approved through the electric resource plan from 2021. Supply chain issues have something to do with that.

How will Xcel be able to meet burgeoning demand? And does this imperil Coloradoโ€™s drive to meet its 2030 goal of 50% economy wide reduction in emissions? The stateโ€™s existing modeling already showed the state falling short, and that was without the data centers becoming a major part of the equation. Now comes speculation โ€” and, at this point it is merely that, speculation โ€” that Xcel may find it necessary to keep Comanche 3, its newest and largest coal-fired unit, operating beyond 2030.

That speculation is not completely out of the blue. That is indeed what has happened in Virginia.

Here, I have described Xcel Energy. But data centers could be part of the stories of Tri-State and its members as well as Platte River Power Authority, Black Hills Energy and perhaps others. Even Fort Morgan โ€” a town of 12,000 northeast of Denver, which is supplied by electricity by the Municipal Energy Agency of Nebraska. A Wyoming company, Prometheus Energy, says it intends to create a data center there as well as in Pueblo in 2026, according to one report.

Chris Hansen, one of Coloradoโ€™s most important state legislators in the energy transition, told Big Pivots in November that one of his larger disappointments in leaving the Legislature to manage La Plata Electric was that he wouldnโ€™t be able to advance legislation to address the data center issue and help Colorado avoid the problems of Virginia. Hansen has handed the work off to State Rep. Kyle Brown, a Democrat from Louisville. Brown has a background in health care, and he will never have the adroit voice of a Chris Hansen or a Steve Fenberg, but he has demonstrated in his two years that he is a capable, solid legislator.

Yesterday, Gov. Jared Polis was in my neighborhood, and I got in a few minutes to talk with him about passenger rail and data centers. I asked him explicitly whether the growth in demand from data centers would imperil Coloradoโ€™s goal of achieving 50% economy wide decarbonization.

No, he said. Done right, growth in data centers can be a win-win for consumers and the utilities.

โ€œData centers are a broad category of electricity users, but I would say in the right time, in the right place, data centers can play a very important role in improving the reliability and sustainability of the grid, just like if theyโ€™re in the wrong place at the wrong time, they can add transmission costs,โ€ he replied. โ€œItโ€™s really about what, when and where, and how that factors into grid resiliency as we move towards clean energy.โ€

I persisted with a question about the need for legislation. He did not answer directly:

โ€œIf thereโ€™s a way to bring in more data centers working with some of the larger providers in areas that make sense, that help us reduce costs for Colorado consumers and improve grid resiliency, then we should explore those.โ€

I suspect Xcel would be happy with his phrasing. However, we are already seeing upward price pressures in renewables because of supply chain and other issues. If that upward migration coupled with rapid growth in demand produces sharply higher consumer costs, there could be strong pushback. That could delay Coloradoโ€™s progress toward its decarbonization goals. The debate in the PUC proceedings about Xcelโ€™s just transition electric-resource plan in coming months should be lively. That applies, too, to the debates in the Colorado Legislature.

Thereโ€™s lots of good journalism to be had here for Big Pivots going into 2025. Itโ€™s one of many good stories across Colorado deserving deeper dives.

Xcel was reluctant to go forward with its first major wind farm, completed in 2004, but now has much wind โ€” and will add far more in the next few yeas. Photo near Cheyenne Wells, Allen Best