#Drought news December 11, 2025: Despite snow falling across the Rocky Mountains, many stations continue to report that the snow water equivalent (SWE) is below the 30th percentile

Click on a thumbnail graphic to view a gallery of drought data from the US Drought Monitor website.

Click the link to go to the US Drought Monitor website. Here’s an excerpt:

This Week’s Drought Summary

This U.S. Drought Monitor week saw both improvements and degradations across the country, shaped largely by uneven precipitation and widespread colder-than-normal temperatures. Much of the nation was colder than normal, with the sharpest departures in the Midwest and Northeast, where most of the weekโ€™s moisture fell as snow and offered limited short-term help for soils and streams. In the West, storm systems delivered substantial rain and mountain snow to the Pacific Northwest and northern Rockies, improving conditions in parts of Washington, northwest Oregon, western Montana and eastern Idaho. However, areas that missed the heaviest precipitationโ€”especially central and southern Oregon, central Idaho and southwestern Montanaโ€”saw drought expand as snowpack remained well below normal. Parts of the Southwest, including southeastern California and western Arizona, continued to improve as moisture from earlier storms worked through the hydrologic system, while east-central Nevada saw worsening drought due to very low snowpack and long-term precipitation deficits. 

The central and southern Plains did not see any meaningful precipitation this week, leading to conditions remaining largely unchanged outside of localized areas. Short-term dryness worsened in southeastern Kansas and northeastern Oklahoma, where precipitation deficits continue to accumulate. In the east, several areas along the Gulf Coast and Southeast received 1 to 3 inches of rain, leading to widespread improvement short-term dryness and drought in southern Alabama, southern Georgia, the Florida Panhandle and portions of the Carolinas. Despite moderate precipitation in southern Florida and parts of the interior Southeast, longer-term precipitation deficits led to dryness continuing to intensify. In the Midwest and Northeast, cold temperatures and predominantly frozen precipitation led to limited improvements and degradations in areas that missed precipitation…

High Plains

Conditions across the High Plains changed very little this week as much of the region received only light precipitation and remained colder than normal. The Dakotas saw little meaningful moisture, and Nebraska saw none, leaving drought conditions unchanged. In Kansas, a lack of precipitation combined with continued short-term dryness led to an expansion of abnormal dryness (D0) that stretched into northeastern Oklahoma. 

In eastern Wyoming, dryness increased where precipitation was limited, resulting in some expansion of abnormal dryness. In eastern Colorado, light snowfall helped ease small pockets of abnormal dryness, though most areas saw little change…

Colorado Drought Monitor one week change map ending December 9, 2025.

West

Out West, there was a mixture of improvements and degradations. Improvements were seen in the Southwest despite no precipitation this week. Prior weeksโ€™ moisture has made its way into the hydrologic cycle, as seen in improving streamflows and soil moisture. Despite snow falling across the Rocky Mountains, many stations continue to report that the snow water equivalent (SWE) is below the 30th percentile. Snowpack levels in the northern Rockies are doing better, with many stations showing snowpack at 100 percent for this time of year, which was further improved with 1 to 2 feet of snow falling across western Montana and eastern Idaho. This moisture led to areas of improvement in northwest Montana. Improvements were also seen along the Idaho-Wyoming border where up to 2.5 feet of snow fell. Southwestern Montana and central Idaho, which are experiencing below-normal snowpack, missed out on the snow and saw the expansion of moderate drought (D1) across the border. Over the Pacific Northwest, storms brought upwards of 6 to 8 inches of precipitation, where many stations in the Cascades are reporting below snowpack below 50 percent of normal. Areas in central Washington into northwest Oregon saw improvements as some short-term metrics were more aligned with moderate drought (D1) conditions rather than severe drought (D2). Central and southern Oregon, which missed out on the heaviest precipitation, saw the expansion of abnormal dryness (D0) and moderate drought (D1)…

South

The South saw mostly improvements this week following a mixture of below-normal temperatures and heavy rainfall. One-class improvements were seen from far eastern Texas to Mississippi where 1.5 to 3 inches of rain fell, with parts of southern Louisiana recording 5 to 6 inches of rain. Areas of central Texas and the Panhandle that improved last week, continued to see improvements in soil moisture and streamflows, leading to further improvements this week. Isolated degradation did occur in Texasโ€™ southwestern Panhandle as well in northeastern Oklahoma as lack of precipitation continues to stress soils and lead to lower streamflows…

Looking Ahead

According to the National Weather Serviceโ€™s 5-day quantitative precipitation forecast (valid from Dec. 11 -16) the heaviest precipitation is forecast across the Pacific Northwest, especially along the coastal ranges of Washington, Oregon, and far northern California, where totals may exceed 5 to 10. Moderate precipitation is also expected across the northern Rockies and into the northern Plains and Upper Midwest, with widespread amounts between 0.5 and 2 inches and localized areas of higher amounts where terrain enhances moisture, such as elevation and lake-effect snow. Across the South and Southeast, a broad area of lighter but steady rain is anticipated from eastern Texas through the Gulf Coast states and into the Carolinas, generally ranging from 0.5 to 2 inches. The Northeast is also expected to pick up around 1 to 2 inches. In contrast, much of the Interior Westโ€”including the Great Basin, Southwest and central Rockiesโ€”shows little to no precipitation. 

The Climate Prediction Centerโ€™s 6 to 10 day outlook (valid Dec. 16โ€“20) favors widespread above- normal temperatures across most of the Lower 48, with the highest likelihood for above-normal temperatures centered over the Four Corners region and extending across the western and southern U.S. Much of the Midwest, Great Lakes and Northeast also lean warmer than average, while only a small pocket of near-normal temperatures is suggested in parts of the northern Plains. Cooler-than-normal conditions are limited to coastal New England and portions of Alaska, where the highest chances for below-normal temperatures appear. Precipitation patterns show more divide with wetter-than-normal conditions favored across the Pacific Northwest, the northern Rockies, the Upper Midwest and parts of Hawaii. In contrast, drier-than-normal conditions are likely across the central and southern Rockies, the central Plains and much of the Southeast, with the strongest dry signal centered over Arizona, New Mexico and western Texas. Near-normal precipitation is expected across broad sections of the Midwest, Mid-Atlantic and Interior West.

US Drought Monitor one week change map ending December 9, 2025.

CSUโ€™s The Audit: Yellow snow isnโ€™t the only kind we should avoid, #Colorado State University snow hydrologist says — Stacy Nick (Source.ColoState.edu)

Megan Sears and Wyatt Reis both research assistants in the Ecosystem Science and Sustainability Department in the Warner College of Natural Resources take snow hydro and depth probe samples at a research site near Chambers Lake in the Colorado mountains. January 10, 2022. Photo credit: Colorado State University

Click the link to read the article on the Colorado State University website (Stacy Nick):

November 18, 2025

Weโ€™ve all heard the phrase, โ€œDonโ€™t eat the yellow snow.โ€ But are there other things in snow that arenโ€™t so obvious? 

Colorado State University snow hydrologist Steven Fassnacht says absolutely. 

Snow has more surface area than rain, so it can pull more contaminants out of the air, Fassnacht recently said on CSUโ€™s The Audit podcast. That can be anything from forever chemicals to heavy metals and dust. 

Professor Steven Fassnachtโ€™s research focuses on studying water availability by looking at how snow and related environmental factors change over time and across different locations. Photo credit: Colorado State University

โ€œThe big ones that we see around here are nitrogen and sulfur-based,โ€ he said. โ€œThey come out of the tailpipe, out of the smokestack, et cetera. So, if youโ€™re downwind from a major industrial source of these, then the likelihood that you have these in the snowpack is a lot higher.โ€ 

While itโ€™s less obvious than a billowing smokestack, microplastics are another contaminant that researchers are studying in snow. 

โ€œThere are just so many little bits and pieces of plastic around,โ€ Fassnacht said. โ€œThink about going out in the snow. Youโ€™ve got plastic ski boots on and plastic skis and poles, and your jacket and all your equipment, thatโ€™s all plastic. Any breakdown of that โ€“ which will happen over time โ€“ is going to put  microplastics onto the snowpack.โ€ 

But all of this doesnโ€™t mean you should never catch another snowflake on your tongue, he said. Just be aware of where that snow is coming from. 

Fassnacht recommends avoiding snow from nearby roadways or industrial areas. Likewise, if thereโ€™s been a recent forest fire or dust storm. 

โ€œThere is a lot of physics and chemistry involved in what you get within the snowpack itself and where it comes from,โ€ Fassnacht said. โ€œSo, do you want to eat the snow? Maybe. Thatโ€™s not an answer that people want to hear. They want to hear โ€œyesโ€ or โ€œno.โ€ Most of the time youโ€™re probably OK, but you want to really be aware of where you are eating this snow from.โ€

Listen to this and other episodes of CSUโ€™s The Audit here or wherever you get your podcasts.

Audio transcriptย  (Lightly edited for clarity)ย 

INTRO: Weโ€™ve all heard the phrase, โ€œDonโ€™t eat the yellow snow.โ€ But with all the atmospheric contaminants out there โ€“ including forever chemicals from manufacturing facilities, heavy metals from car emissions and microplastics from virtually everything โ€“ should we really be eating any snow? 

To find out, we talked to Colorado State University snow hydrologist Steven Fassnacht. A professor with the Warner College of Natural Resources, Fassnachtโ€™s research focuses on studying water availability by looking at how snow and related environmental factors change over time and across different locations. 

We asked him about what contaminants are making their way into snow and how and where to find the cleanest snow if you decide to partake on an icy treat. 

HOST: So, really should we be eating any snow, not just avoiding the yellow kind? 

FASSNACHT:We really should be looking at the snow visually; thatโ€™s often the marker, so donโ€™t eat the yellow snow. And for other obvious visual  contaminants, things like dust and airborne pollutants and sand and things like that which are pretty obvious. Needles, you donโ€™t want to eat pine needles. But in terms of what you can find in the snow that you should really be concerned about, those are ones that we cannot see. So, that is more of an understanding of where you are and what the sources of some of those contaminants could be. 

The big ones that we see around here are nitrogen and sulfur-based. So, things that we call our NOx โ€“ our nitrates, nitrites โ€“ and our SOx โ€“ sulfates, sulfites, et cetera. We have our phosphorus-based equivalents as well, and these all come from emissions. They come out of the tailpipe, out of the smokestack, et cetera. So, if youโ€™re downwind from a major industrial source of these, then the likelihood that you have these in the snowpack is a lot higher. There is a lot of physics and chemistry involved in what you get within the snowpack itself and where it comes from. So, do you want to eat the snow? Maybe. Thatโ€™s not an answer that people want to hear. They want to hear โ€œyesโ€ or โ€œno.โ€ Most of the time youโ€™re probably OK, but you want to really be aware of where you are eating this snow. 

HOST: As you mentioned, a lot of contaminants are invisible to the naked eye, but things like dust can also be an issue. Thatโ€™s something that actually impacts snow melt and runoff rates too, correct? 

FASSNACHT: Dust on snow and other things that are dark on the snowpack really affect the melt rates. Here in Colorado, most of our snow melt is driven by the sun. We have 300-plus sunny days. Weโ€™re here in Colorado because we love the weather. We know that from the sunburns we get because the sunโ€™s coming at us and is reflecting off the really shiny snow. But at the same time, then you add dust, ash and black carbon from industrial sources, and that lowers the reflectivity of the surface, how shiny it is. Technically, we call that albedo. Our snowpack here in Colorado, that melt is really driven by the albedo, by the reflectivity. When we have dust coming in, that can lower it and make the snow melt a lot faster. The sources of dust are typically from the Four Corners area, the Colorado Plateau. So, in Northern Colorado, you see it a little less than you will in the San Juans, for example. 

HOST: So, is shinier snow better snow? 

FASSNACHT: Not necessarily. Shinier snow is just newer snow. Does that mean that itโ€™s better quality? Not necessarily. If you have dust on the snow, thatโ€™s going to be obvious. The snow, once itโ€™s on the ground, is going to become less shiny because itโ€™s just changing. Think of the snowflake that you cut out when you were in kindergarten, that piece of paper, that delicate nature of snow. Well, the snow doesnโ€™t last like that for very long. Itโ€™s going to end up being rounded, itโ€™s going to melt, so it may be less shiny, but it still could be of good quality. By that I mean you could still eat it without having a lot of contaminants in it. 

HOST: We also talk a lot about microplastics and forever chemicals in our drinking water. Iโ€™m assuming those can also be found in snow. 

FASSNACHT:ย Definitely. That is a relatively new area that people have been exploring. We see all this in our water. We see things like caffeine; we see things like pharmaceuticals. Those make a bit more sense to be in our water because of our water treatment plants. Whereas in the snow itโ€™s a little bit different in terms of pharmaceuticals or things that go through the human body. But we can have microplastics; we can have other forever chemicals. It depends on how they get there. So, that is part of the process as well. We typically think of dust and fine particles in the clouds when those snowflakes are forming. Thatโ€™s the core of a snowflake thatโ€™s coming down. But then as the snow falls, because think of the snow again, itโ€™s your kindergarten cut out of the piece of paper and all those different angles and all those shiny bits. That means that snow has a lot of surfaces. If you compare that to rain, rain is a ball, and the snow has many more surfaces. When it falls through the atmosphere, it can then pick up a lot more particles that are in the air. So, if you have anything thatโ€™s airborne โ€“ I think about the Cameron Peak fire of 2020 and how yellow and brown the air was โ€“ if you had rain and even more effectively if you had snow that was falling, it would wash all of those things out of the air and that then would end up in our snowpack. How do the forever chemicals and microplastics get into snow? That is not exactly known. The microplastics, there are just so many little bits and pieces of plastic around. We have the huge issue of the garbage island, the plastic island floating around the Pacific. Well, thatโ€™s big chunks of plastic, but microplastics can be anything. Just think of all the plastic we have in our lives. It can break off from whatever, and then you get these little, tiny bits. Theyโ€™re pretty light, and so they can easily end up in the air. Do you have a big cloud of microplastics? Probably not. But do you have those microplastics in the air? Sure. They come off of tires, they come off of car parts, they come off your Gore-Tex coat, et cetera. Thereโ€™s lots of sources. Think about going out in the snow. Youโ€™ve got plastic ski boots on and plastic skis and poles, and your jacket and all your equipment. Thatโ€™s all plastic. Any breakdown of that โ€“ which will happen over time โ€“ is going to put microplastics onto the snowpack. Where do we have microplastics? Well, probably lots of places. Where do they come from? Itโ€™s not quite as obvious as a big smokestack and something being blown downwind.ย 

HOST:ย What about the effects that those kinds of contaminants can have on the body when ingested?ย Iโ€™mย guessingย youโ€™dย have to eat a lot of snow to have it have an impact, but what could thatย possibly mean?ย 

FASSNACHT: Our snow in Colorado is stillย good quality.ย We donโ€™t have huge industrial sources that are bringing in all of these contaminants.ย So,ย can we eat the snow? Probably. What does that mean? Usually not very much. Microplastics tend to just go through your body or they bioaccumulate. Butย itโ€™sย not like mercury in fish.ย These are things that are not as hazardous, at least as far as we know now.ย I am not a microchemist.ย Iโ€™mย not a microbiologist.ย I donโ€™t know how this actually will impact the body, but if you donโ€™t have many, then itโ€™s going to be a bit less of a hazard.ย Itย doesnโ€™tย meanย youโ€™reย not going to have them. Ifย youโ€™reย going to go out and eat snow all the time and have that as your water source, then you want to think about how you can filter some of these things out. Microfiltration is one of the better methods of taking out a lot of these constituents, but you need to knowย whatโ€™sย in there before you can know what to take out.ย 

HOST:ย I recently saw a video on social media of a woman from the Appalachianย region,ย and she was making snow cream, which was a dessert made by mixing snow with milk,ย sugarย and vanilla. She made a point that it needed to be fresh snowfall. Butย Iโ€™mย wondering, one, is thatย a good idea,ย and,ย two, does having fresh snowfall really make that much of a difference? Her point was that it needed to beย really fresh, like within the last hour or so.ย 

FASSNACHTThatโ€™s not going to make a difference. Iโ€™m now familiar with snow cream. I was out in the field last winter with some students, and one of the students brought a big bowl and brought some powdered sugar and some condensed milk. I donโ€™t remember the vanilla part of it, but Iโ€™m sure you could add that. It was really tasty. Are you eating gallons and gallons? No, because think about the brain freeze, the ice cream headache you would have if you ate gallons and gallons of that, and how much sugar there would be in there. But getting back to the snow itself, to me it would be more of a texture issue. The texture of fresh snow, the characteristics, and the shape of that snow  compared to older snow. And itโ€™s just a bit more fun and itโ€™s a bit more joyous and festive. This doesnโ€™t have to be a holiday thing but being out in the woods and eating some of the snow, it just feels better to have this light fluffy powder. But from a contamination perspective, itโ€™s not going to make that big a difference. The density of fresh snow is much less than that of older snow. We think of the really light fluffy powder, the stuff you can blow off your hand or blow off your windshield. Itโ€™s going to be a lot less dense and because of that youโ€™re not necessarily having as much  contaminant per unit mass, so to speak. But itโ€™s more about texture, itโ€™s a feeling. Chemical wise, itโ€™s not really going to change anything. 

HOST: So, is there a stratum where you want to eat the top layer of snow versus the middle layer of snow versus near the bottom? Do the contaminants sink? 

FASSNACHT: The dissolved contaminants do get washed through the snow โ€“ our nitrogen, and phosphorus products, sulfur products. When the snow starts to melt, those get washed out first. So, if the snowpack is melting, those actually appear in the stream, and you see this big pulse of whateverโ€™s in the snowpack. Any of the larger particles that donโ€™t dissolve, our sand, our dust, et cetera, those stay within the snowpack, and what actually happens is the snowpack will melt down to them. We have a big dust storm in March that covers the landscape. Well, if weโ€™re high enough up, weโ€™ll get multiple snowstorms after that, and thatโ€™ll cover that dust layer. But then as the snow melts, it melts down to those physically visible layers. So, we get  accumulation that way. Are you going to eat that snow? Not really. So yeah, later in the season, and maybe this goes back to the womanโ€™s idea of eating fresh snow. Itโ€™s not going to have that accumulation where youโ€™ve combined different layers of dust and whatnot. 

HOST: Better or worse from an atmospheric contaminant perspective, catching a raindrop on your tongue or a snowflake? 

FASSNACHT: Itโ€™s likely that the raindrop is going to be cleaner than the snow. But it just depends on whatโ€™s in the air. It depends on what was in the clouds when the raindrop versus the snowflake formed, and then what is below the clouds. So, if itโ€™s a nice clean day and you donโ€™t have a lot of chemicals in the air, then it doesnโ€™t really matter because youโ€™re not pulling out those chemicals when itโ€™s raining or when itโ€™s snowing. I canโ€™t give you a solid answer. The conditions of whatโ€™s in the air are going to be a function of the temperature. Think of the front range and think of when do we have the haze, when do we have that brown cloud. There is some seasonality to it, so Iโ€™d be aware of that. Iโ€™d look around and think, what were the conditions when these clouds were forming? And whatโ€™s in the air? 

HOST: You mentioned earlier the idea of kids cutting out the snowflake, and the raindrop is the ball, and the snowflake has a lot more surface area. Does that have an impact? 

FASSNACHT: Yes. So, think of a ball. A ball is round and doesnโ€™t have a lot of surface area to mass. A polar bear is a big round ball of fur with legs so that they minimize how much heat loss they have. And then if you think about the  raindrop, thatโ€™s the same thing. Versus a snowflake which is a millipede, because it has all of these different arms. Thatโ€™s a bad analogy, but I think you know where Iโ€™m going with this. It just has a lot more area per unit of mass, orders of magnitude, a hundredfold or maybe even a thousandfold, depending on how ornate the snow is. So, if there are things in the air, thereโ€™s just more surfaces to pick up whatever those chemicals are. But if you donโ€™t have the chemicals in the air, if youโ€™re in a clean atmosphere, then itโ€™s not really a problem. The physics of what happens and then adding in the chemistry gets really complicated. You can have snow forming in the clouds, but then if it falls through a warm atmosphere, then itโ€™s going to melt. Itโ€™s going to start as snow but end up as rain. Is that different than if that snow didnโ€™t melt and you caught it with your tongue? Probably not. Again, depending on what it falls through. You can have the opposite too if you have rain forming in the clouds and then it freezes. If you have an inversion where the ground is colder than the air โ€“ it doesnโ€™t happen that often โ€“ then it would freeze. But thatโ€™s the same as hail. Do you want to capture balls of hail on your tongue? 

HOST: Ouch. I donโ€™t think so. 

FASSNACHT: I donโ€™t think so either. 

HOST: If you were going to eat snow, where would you go? Where would the safest, cleanest snow be? 

FASSNACHT: I would go further away from the Front Range because the Front Range has a lot of people living here; we have a lot of industry. And if the wind is blowing up the hill, we often get upslope events where theyโ€™re coming from the east and blowing up the hill, then thatโ€™s going to be bringing those chemicals into the air and into our snowpack. Research from Niwot Ridge behind Boulder and research from Loch Vale in Rocky Mountain National Park has shown that thereโ€™s elevated nitrogen and sulfur constituents there. Not all year round, but part of the year. Theyโ€™re downwind from these industrial sources, from the cars, from where all the tailpipes and the smokestacks are. So, I would shy away from areas like that. Can you eat a handful of snow? Yes. Do you want to subsist on snow coming out of the tailpipe of your car? No. If I were to go and pick a place, Iโ€™d go further away from industrial sources. I wouldnโ€™t go right to the side of the road because you have tailpipes. Iโ€™d hike a hundred or two hundred feet in where youโ€™re a little bit further away. 

HOST: Knowing everything you know, do you ever eat snow? 

FASSNACHT: I do eat snow. I take a lot of water with me when Iโ€™m out in the field, but Iโ€™ll eat a handful of snow. Yeah, Iโ€™ll eat fresh snow. For me itโ€™s a texture thing. That density, the fresh snow is so light that you can take a handful, and youโ€™re not getting a lot of water. Realistically, if you want a lot of water, you should stick your hand into the snow and get the older, rounder snow because youโ€™ll have a lot more water for a handful than you would for fresh snow. 

HOST: As a snow hydrologist, has your line of work changed how you see snow? Maybe while the rest of us are thinking about skiing or sledding or even shoveling, are you calculating snowpack properties and thinking about runoff rates? Does knowing so much about snow ruin the magic of it for you? 

FASSNACHT: Itโ€™s a different magic. Thereโ€™s science magic. Thereโ€™s curiosity. Thereโ€™s the questioning. During the pandemic, I told my spouse that I was going to shovel off the deck. She was looking for me a few hours later, and only half the deck โ€“ and the deck is 10 feet by 10 feet, like this is pretty small โ€“ but only half the deck was actually shoveled off because I was on my hands and knees measuring the snow properties because there were some really interesting melt features. I wanted to look at how the density and that amount of water changed because you had preferential melt, and there were certain areas in the shadows. So, yeah, Iโ€™m looking at snow from a science perspective, but thereโ€™s the curiosity, maybe not magic, but the curiosity. I spend a lot of time enjoying the snow, but from a different perspective than other people. 

HOST: Well, now I think our listeners will probably be looking at it from a different perspective, too. Stephen, thank you so much for your time. I really appreciate it. 

FASSNACHT: Yeah, youโ€™re welcome. Thanks for chatting with me. 

OUTRO: That was CSU snow hydrologist Steven Fassnacht speaking about the contaminants found in snow. Iโ€™m your host, Stacy Nick, and youโ€™re listening to CSUโ€™s The Audit. 

Snowflake photos by Snowflakes Bentley (Wilson Bentley), c.โ€‰1902, By Wilson Bentley – Plate XIX of “Studies among the Snow Crystals … ” by Wilson Bentley, “The Snowflake Man.” From Annual Summary of the “Monthly Weather Review” for 1902., Public Domain, https://commons.wikimedia.org/w/index.php?curid=22130

The Year in Water, 2025 โ€“ Power Shift — Brett Walton (circleofblue.org) #ColoradoRiver #COriver #aridification

Click the link to read the story map on the Circle of Blue website (Brett Walton). Here’s the Colorado River section:

December 9, 2025

The year is ending with the Colorado River at a critical juncture.

The big reservoirs Mead and Powell remain perilously low and the seven states that share the basin have been unable to agree on cuts that would reduce their reliance on the shrinking river.

Reservoir operating rules expire at the end of 2026. If no agreement is reached the federal government could step in, or the states could take their chances in court. Itโ€™s a risky move that no one in principle seems to want. Yet brinkmanship and entrenched positions have stymied compromise.

The basinโ€™s Indian tribes, which collectively have rights to more than a quarter of its recent average annual flow, are adamant that their interests โ€“ and more broadly, the river itself โ€“ be protected. โ€œAny progress made in the negotiations to date is merely rationing a reduced supply, not actively managing and augmenting it as a shared resource with strategies and tools that can benefit the entire basin,โ€ the leaders of the Gila River Indian Community wrote on November 12.

The Colorado River Indian Tribes, whose riverside reservation includes lands in Arizona and California, voted in November to extend legal personhood to the river under tribal law.

Native America in the Colorado River Basin. Credit: USBR

Think Natural Flows Will Rebound in the #ColoradoRiver Basin? Think Again — Jonathan Overpeck and Bradley Udall #COriver #aridification

From the report Colorado River Insights, 2025: Dancing With Deadpool (Jonathan Overpeck and Bradley Udall):

  • Jonathan Overpeck is a climate scientist and Dean of the School for Environment and Sustainability at the University of Michigan; prior to moving to Michigan, he lived and worked in Colorado and Arizona for over 25 years.
  • Bradley Udall is a Senior Water and Climate Research Scientist/Scholar, Colorado Water Center, Colorado State University.

Basin status update

Back in 2017, we published a peer-reviewed research paper (Udall and Overpeck, 2017) asserting that climate warming was a principal cause of the then eighteen-year Colorado River drought, a drought that had already seen a 17% reduction in natural flows of the river. We expressed confidence that warming would continue to eat away at these flows until the warming (due to greenhouse gas emissions, high confidence) ceased and suggested that increases in precipitation would likely not be able to compensate for the long-term impact of rising temperatures. We used the term โ€œHot Droughtโ€ to distinguish this period from the โ€œDry Droughts in the 20th century. This important concept continues to be researched and confirmed (King et al, 2024, Zhuang et al, 2024). Now, eight years later, as the warming has continued unabated and may be accelerating (Hansen et al, 2025, Ripple et al., 2025), it has become clearer than ever that precipitation declines have also played an important role in causing the worst drought in at least 1200 years (Williams et al., 2022). More troubling, however, is new evidence that human caused climate change is not only driving a steady increase in temperature but is also the main culprit behind the precipitation declines as well.

This is clearly bad news, but there is a silver-lining. But first, letโ€™s review where we are with respect to the unprecedented 21st century Colorado River drought, and the new evidence suggesting the situation is worse than we first thought.

Figure 1 Udall/Overpeck 4-panel Figure Colorado River temperature/precipitation/natural flows with trend. Lake Mead and Lake Powell storage. Updated through Water Year 2025. Note the tiny points on the annual data so that you can flyspeck the individual years. Credit: Brad Udall

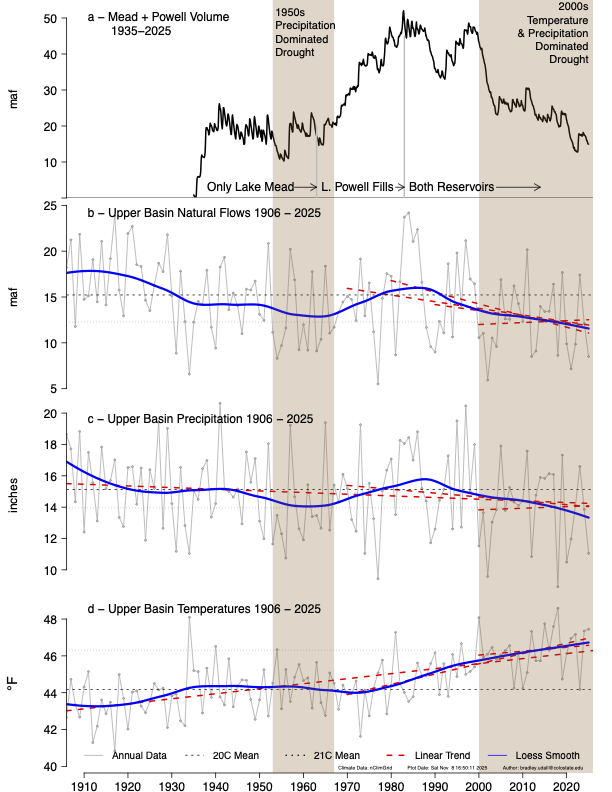
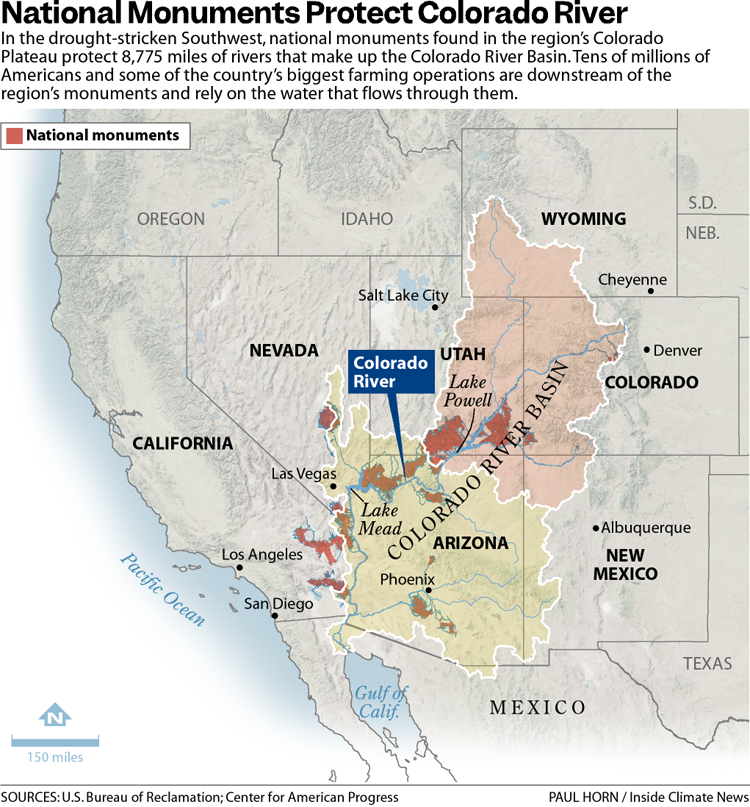
Each year one of us updates a figure3 that was first published in our 2017 paper showing the status of the Colorado River drought and its climate drivers. Weโ€™ve included this figure here, updated through the September 30th end of the 2024-25 water year (Figure 1). The combined volume of water stored in Lakes Mead and Powell has continued its decline to less than 15 maf (million acre-feet), the 26-year average naturalized flow of the Colorado River at Lees Ferry is now 12.2 maf, well below the 16.5 maf mainstem apportionments assigned to the seven Colorado River Basin states and Mexico. Critically, the 6 years since 2020 have averaged 10.8 maf/year, the same as the then-unprecedented low flows during 2000-05 at the start of this record-setting drought.

Matching the long slow decline in naturalized flows over the last century has been a similar long slow decline in precipitation in the Upper Basin of the Colorado (Figure 1, Panel C). Superimposed on this long trend are two notable drought periods with lower-than-average precipitation: one in the 1950โ€™s-60โ€™s and now the on-going current drought, at 26-years and counting, a multidecadal โ€œmegadroughtโ€ and the longest drought in the Colorado River Basin instrumental record. Mirroring the century-long declines in precipitation and naturalized flows is a long-term warming trend that started to accelerate in the 1970โ€™s and that is clearly linked to on-going global warming (Williams et al., 2020, Masson-Delmotte et al., 2021). Whereas the former drought of record, in the 1950โ€™s and 60โ€™s, was defined almost entirely by precipitation deficit (Figure 1, left gray shaded area), the current megadrought is being driven by a precipitation deficit compounded by relentless warming (Figure 1, right gray shaded area).

The impact of a warming climate

As we highlighted in earlier peer-reviewed papers (e.g., Vano et al., 2014, Udall and Overpeck, 2017), warming exacerbates drought in multiple ways. A warming atmosphere can hold progressively more water, and thus as the atmosphere warms it can evaporate more water. At the same time, a warmer atmosphere can cause soils and vegetation to lose more water to the atmosphere via evapotranspiration, especially as the warming atmosphere also causes the growing season in the Upper Basin of the Colorado to become longer (Das et al., 2011; Udall and Overpeck, 2017). Hot, dry springs in the basin bring on early melt and green-up (Hogan and Lundquist, 2024, Lin et al., 2022). Drier soils and vegetation thus mean less water that can eventually end up in the river, and incidentally also explains why the West I experiencing more wildfire (Abatzoglou and Williams, 2016). Atmospheric warming also leads to snow loss, a shorter snow-cover season, and an associated loss of solar radiation reflectivity โ€“ this drives further warming and yet more evapotranspiration (Milly and Dunne, 2020; Ban et al., 2023).

Large changes in groundwater supplies in both the Upper and Lower Colorado River Basins have been noted from soil moisture to deeper layers since 2002 (Abdelmohsen et al., 2025, Chandanpurkar et al., 2025). It is becoming increasingly clear that dry summer soils can persist into the fall and winter soaking up snowmelt the following spring thereby reducing runoff (Das et al., 2011, Lapides et al, 2022).

Precipitation declining

Estimates vary, but it appears that up to half of the observed roughly 20% reduction in Colorado flows are likely related to the steadily warming temperatures of the Colorado River headwaters region (Udall and Overpeck, 2017; Xiao et al., 2018; Milly and Dunne, 2020, Bass et al, 2023). Moreover, since 2017 it has become increasingly clear that the other major cause of the flow reductions is a sustained decrease in precipitation (Figure 1, Panel C). Until recently, the big question is whether the observed 7% post-1999 decrease in precipitation relative to the 20thย century average was due primarily to natural multidecadal climate variability or human-caused climate change. ย We now have good reasons to suspect the latter, and this translates to mostly bad news.

Megadrought country

It is now more clear than ever that the southwest United States, including the headwater regions of the Colorado River, is megadrought country. Tree-ring and other paleoclimatic sources reveal that multiple droughts lasting two or more decades took place over the last 2000 years (Meko et al, 2007; Gangopadhyay et al., 2022), and a good case has now been made for the current drought being among the most severe in at least 1200 years in large part because of the unprecedented amplifying effect of warming temperatures during the current sustained period of reduced precipitation (Williams et al., 2020; 2022).

However, there is another important lesson to be gleaned from the rich paleoclimatic record of pre-20thย Century droughts and megadroughts. Given that global temperatures were likely significantly cooler prior to the last 50 years then they are now (PAGES 2k Consortium, 2019), it follows that themany long Upper Colorado Basin droughts that took place over the last 2000 years preceding the current drought were likely due much more to precipitation deficits alone. This means that we have good evidence that precipitation deficits exceeding those of the current on-going drought in both magnitude and duration are not rare, and that the current drought could see not just warmer temperatures in the future (a sure bet), but also even larger and longer precipitation deficits. It is thus critical that we consider what is presently causing the precipitation decline in the headwaters region of the Colorado River, and from that get a better sense of whatโ€™s most likely ahead. And for motivation, since we wrote our 2017 paper, new evidence has emerged that drought-dominated periods โ€“ likely driven mostly by precipitation declines for the reason noted above โ€“ as long as 80 years have occurred in the last 2000 years in the Upper Basin of the Colorado River (Gangopadhyay et al., 2022).

The cause of precipitation decline

Could we be in for an even longer period of reduced precipitation than the last quarter. century in the years to decades ahead? The answer depends on knowing the cause of the on-going precipitation decline, and there are two primary possibilities. The first is natural climate variability in the climate system, which can cause periods of lower precipitation to oscillate irregularly with periods of higher precipitation. Thus, if the recent period of low precipitation is due to natural climate variability, there could be periods of greater precipitation returning to the Colorado headwaters, although these wet periods would be increasingly unlikely to offset the drying impact of the steadily increasing temperatures. The second potential cause of on-going precipitation deficit is an anthropogenically-forced trend in precipitation decline due to increasing human emissions of greenhouse gases and reductions in Asian, mostly Chinese, aerosols to the atmosphere.5ย Such an anthropogenic trend would likely portend continued low precipitation into the future, in synch with continued warming.

One well-known source of natural variability in precipitation in the Colorado River Basin is decadal and longer variation in the sea-surface temperature patterns of the North and tropical Pacific Ocean, giving rise to what is called the Pacific Decadal Oscillation (PDO). A peer-reviewed research paper just published (Klavans et al., 2025) reviews the scientific literature and notes that decadal and longer variability in the PDO has long been thought to have arisen from atmosphere-ocean interactions internal to the natural climate system and has in turn caused decadal and longer precipitation variability downstream over western North America. The PDO is strongly correlated with La Nina, and both are known to be associated with a dry Southwest US (Seager and Ting, 2017; Lehner et al., 2018; Hoerling et al., 2023, Seager et al., 2023). Klavans et al., 2025 also presents convincing new evidence that anthropogenic forcing in the form of human emissions of greenhouse gases and reductions in atmospheric aerosols is now the primary driver of the same elevated sea-surface temperatures and this forcing is thus the primary cause behind the precipitation decline that has been observed since the start of the on-going Colorado River megadrought. In other words, human-driven climate change has caused the PDO oscillation to lock into its negative dry phase and this situation is likely to persist into the future.

A second new paper (Todd et al., 2025) highlights that higher Northern Hemisphere temperatures from about 11,000 to 6,000 years ago, in this case due to well-understood changes in the Earthโ€™s orbit, caused a negative PDO-like Pacific warming that in turn forced western U.S. precipitation to lock into a multi-millennia-long dry phase. This new research thus provides yet more confidence that the odds will favor lowered precipitation in the Colorado River headwaters for as long as human-caused warming persists. Both new research papers (Todd et al., 2025; Klavans et al., 2025) also note that state-of-the-art climate models underestimate the role of human-caused climate change in driving persistent drought in the region containing the headwaters of the Colorado River. Natural decadal and longer climate variability clearly caused the many droughts and megadroughts of the last 2000 years, but looking ahead today, it appears that human-caused climate change is likely to exert a stronger influence, and this will mean a higher likelihood of continued lower precipitation in the headwaters of the Colorado River into the future.

Photo Credit: Kathryn Sorensen

Conclusion: bad news, good news

To sum it up, since 2017 we now know quite a bit more about how climate change is altering the flows of the Colorado River. Whereas eight years ago we were able to confidently anticipate that human-caused atmospheric warming alone would continue to reduce flows in the river, we now have a better, though still emerging, understanding of how human emissions of greenhouse gases are likely to also cause a continued reduction in precipitation in the headwaters of the Colorado River. Whereas we have known since 2017 that additional future climate warming will cause continued and even larger flow reductions, two new carefully crafted studies strongly suggest we are in for extended dry periods in the Colorado headwaters in the decades ahead.

As we hinted earlier, is important to recognize that the news is not all bad, and there is indeed a silver-lining to our improved understanding of why the natural flows of the Colorado are declining, and what this means for the future. We can say with confidence that human-caused emissions of greenhouse gases are having an increasingly negative impact on the flows of the Colorado River, a river that serves over forty million people and region that has an annual economy in excess of $1.4 trillion (James et al., 2014). This climate change impact will continue to worsen, but because humans cause it, humans can halt it. This is good to know as we work to reduce the greenhouse gas emissions to the atmosphere that are causing the climate change. The Colorado River will benefit.ย 

Photo Credit: Kathryn Sorensen

Literature Cited

Abatzoglou, J. T., & Williams, A. P. (2016). Impact of anthropogenic climate change on wildfire across western US forests. Proceedings of the

National Academy of Sciences, 113(42), 11770โ€“11775. https://doi.org/10.1073/pnas.1607171113

Abdelmohsen, K., Famiglietti, J. S., Ao, Y. Z., Mohajer, B., & Chandanpurkar, H. A. (2025). Declining Freshwater Availability in the Colorado River

Basin Threatens Sustainability of Its Critical Groundwater Supplies. Geophysical Research Letters, 52(10), e2025GL115593. https://doi.org/10.1029/2025GL115593

Ban, Z., Li, D., & Lettenmaier, D. P. (2023). The Increasing Role of Seasonal Rainfall in Western U.S. Summer Streamflow. Geophysical Research

Letters, 50(9), e2023GL102892. https://doi.org/10.1029/2023GL102892

Bass, B., Goldenson, N., Rahimi, S., & Hall, A. (2023). Aridification of Colorado River Basinโ€™s Snowpack Regions Has Driven Water Losses Despite

Ameliorating Effects of Vegetation. Water Resources Research, 59(7), e2022WR033454. https://doi.org/10.1029/2022WR033454

Chandanpurkar, H. A., Famiglietti, J. S., Gopalan, K., Wiese, D. N., Wada, Y., Kakinuma, K., Reager, J. T., & Zhang, F. (2025). Unprecedented

continental drying, shrinking freshwater availability, and increasing land contributions to sea level rise. Science Advances, 11, eadx0298

Das, T., Pierce, D. W., Cayan, D. R., Vano, J. A., & Lettenmaier, D. P. (2011). The importance of warm season warming to western U.S. streamflow

changes: WARM SEASON WARMING STREAMFLOW CHANGES. Geophysical Research Letters, 38(23), https://doi.org/10.1029/2011GL049660

Gangopadhyay, S., Woodhouse, C. A., McCabe, G. J., Routson, C. C., & Meko, D. M. (2022). Tree Rings Reveal Unmatched 2nd Century Drought in

the Colorado River Basin. Geophysical Research Letters, 49(11), e2022GL098781. https://doi.org/10.1029/2022GL098781

Hansen, J. E., Kharecha, P., Sato, M., Tselioudis, G., Kelly, J., Bauer, S. E., Ruedy, R., Jeong, E., Jin, Q., Rignot, E., Velicogna, I., Schoeberl, M. R., Von

Schuckmann, K., Amponsem, J., Cao, J., Keskinen, A., Li, J., & Pokela, A. (2025). Global Warming Has Accelerated: Are the United Nations and the

Public Well-Informed? Environment: Science and Policy for Sustainable Development, 67(1), 6โ€“44. https://doi.org/10.1080/00139157.2025.2434494

Hoerling, M., & Kumar, A. (2003). The Perfect Ocean for Drought. Science, 299(5607), 691โ€“694. https://doi.org/10.1126/science.1079053

Hogan, D., & Lundquist, J. D. (2024). Recent Upper Colorado River Streamflow Declines Driven by Loss of Spring Precipitation. Geophysical

Research Letters, 51(16), e2024GL109826. https://doi.org/10.1029/2024GL109826

IPCC, 2021: Climate Change 2021: The Physical Science Basis. Contribution of Working Group I to the Sixth Assessment Report of the

Intergovernmental Panel on Climate Change [Masson-Delmotte, V., P. Zhai, A. Pirani, S.L. Connors, C. Pรฉan, S. Berger, N. Caud, Y. Chen, L. Goldfarb,

M.I. Gomis, M. Huang, K. Leitzell, E. Lonnoy, J.B.R. Matthews, T.K. Maycock, T. Waterfield, O. Yelekรงi, R. Yu, and B. Zhou (eds.)]. Cambridge

University Press, Cambridge, United Kingdom and New York, NY, USA, 2391 pp. doi:10.1017/9781009157896.

James, P. T., Evans, D. A., Madly, E., & Kelly, C. (2014). THE ECONOMIC IMPORTANCE OF THE COLORADO RIVER TO THE BASIN REGION. L.

William Seidman Research Institute, W. P. Carey School of Business, Arizona State University.

King, K. E., Cook, E. R., Anchukaitis, K. J., Cook, B. I., Smerdon, J. E., Seager, R., Harley, G. L., & Spei, B. (2024). Increasing prevalence of hot drought

across western North America since the 16th century. Science Advances, 10(4), eadj4289. https://doi.org/10.1126/sciadv.adj4289

Klavans, J. M., DiNezio, P. N., Clement, A. C., Deser, C., Shanahan, T. M., & Cane, M. A. (2025). Human emissions drive recent trends in North

Pacific climate variations. Nature, 644(8077), 684โ€“692. https://doi.org/10.1038/s41586-025-09368-2

Lapides, D. A., Hahm, W. J., Rempe, D. M., Whiting, J., & Dralle, D. N. (2022). Causes of Missing Snowmelt Following Drought. Geophysical

Research Letters, 49(19), e2022GL100505. https://doi.org/10.1029/2022GL100505

Lehner, F., Deser, C., Simpson, I. R., & Terray, L. (2018). Attributing the U.S. Southwestโ€™s Recent Shift Into Drier Conditions. Geophysical Research

Letters, 45(12), 6251โ€“6261. https://doi.org/10.1029/2018GL078312

Lin, Y., Takano, Y., Gu, Y., Wang, J., Zhao, B., Liou, K., & Fu, R. (2022). Investigation of Springtime Cloud Influence on Regional Climate and Its

Implication in Runoff Decline in Upper Colorado River Basin. Earth and Space Science, 9(1), e2021EA002059. https://doi.org/10.1029/2021EA002059

Meko, D. M., Woodhouse, C. A., Baisan, C. A., Knight, T., Lukas, J. J., Hughes, M. K., & Salzer, M. W. (2007). Medieval drought in the upper Colorado

River Basin. Geophysical Research Letters, 34(10). https://doi.org/10.1029/2007GL029988

Milly, P. C. D., & Dunne, K. A. (2020). Colorado River flow dwindles as warming-driven loss of reflective snow energizes evaporation. Science,

367(6483), 1252โ€“1255. https://doi.org/10.1126/science.aay9187

PAGES 2k Consortium, Neukom, R., Barboza, L. A., Erb, M. P., Shi, F., Emile-Geay, J., Evans, M. N., Franke, J., Kaufman, D. S., Lรผcke, L., Rehfeld,

K., Schurer, A., Zhu, F., Brรถnnimann, S., Hakim, G. J., Henley, B. J., Ljungqvist, F. C., McKay, N., Valler, V., & Von Gunten, L. (2019). Consistent

multidecadal variability in global temperature reconstructions and simulations over the Common Era. Nature Geoscience, 12(8), 643โ€“649. https://doi.org/10.1038/s41561-019-0400-0

Ripple, W. J., Wolf, C., Gregg, J. W., Rockstrรถm, J., Mann, M. E., Oreskes, N., Lenton, T. M., Rahmstorf, S., Newsome, T. M., Xu, C., Svenning, J.-C.,

Pereira, C. C., Law, B. E., & Crowther, T. W. (2024). The 2024 state of the climate report: Perilous times on planet Earth. BioScience, 74(12),

812โ€“824. https://doi.org/10.1093/biosci/biae087

Seager, R., & Ting, M. (2017). Decadal Drought Variability Over North America: Mechanisms and Predictability. Current Climate Change Reports,

3(2), 141โ€“149. https://doi.org/10.1007/s40641-017-0062-1

Seager, R., Ting, M., Alexander, P., Liu, H., Nakamura, J., Li, C., & Newman, M. (2023). Ocean-forcing of cool season precipitation drives ongoing

and future decadal drought in southwestern North America. Npj Climate and Atmospheric Science, 6(1), 141. https://doi.org/10.1038/s41612-023-00461-9

Todd, V. L., Shanahan, T. M., DiNezio, P. N., Klavans, J. M., Fawcett, P. J., Anderson, R. S., Jimรฉnez-Moreno, G., LeGrande, A. N., Pausata, F. S. R.,

Thompson, A. J., & Zhu, J. (2025). North Pacific oceanโ€“atmosphere responses to Holocene and future warming drive Southwest US drought.

Nature Geoscience, 18(7), 646โ€“652. https://doi.org/10.1038/s41561-025-01726-z

Udall, B., & Overpeck, J. (2017). The twenty-first century Colorado River hot drought and implications for the future. Water Resources Research,

53(3), 2404โ€“2418. https://doi.org/10.1002/2016WR019638

Vano, J. A., Udall, B., Cayan, D. R., Overpeck, J. T., Brekke, L. D., Das, T., Hartmann, H. C., Hidalgo, H. G., Hoerling, M., McCabe, G. J., & others.

(2014). Understanding Uncertainties in Future Colorado River streamflow. Bulletin of the American Meteorological Society, 95(1), 59โ€“78.

Williams, A. P., Cook, B. I., & Smerdon, J. E. (2022). Rapid intensification of the emerging southwestern North American megadrought in 2020โ€“

2021. Nature Climate Change, 12(3), 232โ€“234. https://doi.org/10.1038/s41558-022-01290-z

Williams, A. P., Cook, E. R., Smerdon, J. E., Cook, B. I., Abatzoglou, J. T., Bolles, K., Baek, S. H., Badger, A. M., & Livneh, B. (2020). Large contribution

from anthropogenic warming to an emerging North American megadrought. Science, 368(6488), 314โ€“318. https://doi.org/10.1126/science.aaz9600

Xiao, M., Udall, B., & Lettenmaier, D. P. (2018). On the Causes of Declining Colorado River Streamflows. Water Resources Research, 54(9),

6739โ€“6756. https://doi.org/10.1029/2018WR023153

Zhuang, Y., Fu, R., Lisonbee, J., Sheffield, A. M., Parker, B. A., & Deheza, G. (2024). Anthropogenic warming has ushered in an era of temperature-

dominated droughts in the western United States. Science Advances, 10(45), eadn9389. https://doi.org/10.1126/sciadv.adn9389


Footnotes

3 https://coloradoriverscience.org/Current_conditions#The_Colorado_River_.274-panel_plot.27

4ย NOAAโ€™s nClimGrid dataset indicates that over the Upper Colorado River Basin there has been a 7% annual precipitation reduction during 2000-26 compared to 1897-1999. This reduction is not evenly spread over the seasons, however; reductions in the fall (SON), winter (DJF), spring (MAM) and summer (JJA) are 3%, 0%, 11% and 12%, respectively. Fall and winter precipitation for snowpack has thus been close to normal while spring and summer has been much reduced.

5ย Sulfate aerosols are emitted in large quantities when sulfur in fossil fuels is burned. These shiny particles can end up high in the atmosphere where they reduce anthropogenic warming by reflecting sunlight. But near the surface their sulfur-based precursors cause serious human health problems and thus many countries in the last few decades have tried and succeeded in reducing these emissions. China, notably, has made great strides in reducing these emissions but the unfortunate side effect is increased warming, especially in the Pacific Ocean downwind. It is believed that this aerosol cleanup (also underway in ocean shipping) is causing at least some of the accelerated global heating now underway including the additional heating in the northern Pacific contributing to precipitation reductions in the Southwest US.

Map credit: AGU

Report: Colorado River Insights, 2025: Dancing with Deadpool — #ColoradoRiver Reseach Group (Getches-Wilkinson Center) #COriver #aridification

Click the link to access the report on the Getches-Wilkinson Center website:

In a collection of essays and research summaries, eleven members of the Colorado River Research Group (with eight guest contributors) touch on issues as diverse as plummeting reservoir storage, climate change trends, risk management, agricultural water conservation, equity, and governance, all against the backdrop of the need to fashion post-2026 reservoir operating rules. 

Download the report here: 
Colorado River Insights, 2025:  Dancing with Deadpool

Contents

Chapter 1.  Colorado River Reservoir Storage โ€“ Where We Stand
Jack Schmidt, Anne Castle, John Fleck, Eric Kuhn, Kathryn Sorensen, and Katherine Tara

Chapter 2.  Think Natural Flows Will Rebound in the Colorado River Basin? Think Again. 
Jonathan Overpeck and Brad Udall

Chapter 3.  The Erosion of the Colorado River โ€œSafety Netsโ€ is Alarming
Doug Kenney

Chapter 4. Water Equity in the Colorado River Basin
Bonnie Colby and Zoey Reed-Spitzer

Chapter 5.  The Tale of Three Percentage-Based Apportionment Schemes
Eric Kuhn

Chapter 6. A Humbly Proffered Proposal to Aid the Colorado River System: Conservation Easements & Land Purchases
Kathryn Sorensen and Sarah Porter

Chapter 7.  Facing the Future: Can Agriculture Thrive in the Upper Basin with Less Water? 
Kristiana Hansen, Daniel Mooney, Mahdi Asgari, and Christopher Bastian

Chapter 8.  Towards a Basinwide Entity: Moving from Vision to Action
Matthew McKinney, Jason Robison, John Berggren, and Doug Kenney

Contributors

Colorado River Research Group (CRRG) Members

Bonnie Colby, Professor, University of Arizona.

John Fleck, Writer in Residence, Utton Transboundary Resources Center, University of New Mexico.

Kristiana Hansen, Professor, Department of Agricultural and Applied Economics, University of Wyoming.

Doug Kenney, Director, Western Water Policy Program, Getches-Wilkinson Center, University of Colorado Law School; and Chair, Colorado River Research Group.

Eric Kuhn, Retired General Manager, Colorado River Water Conservation District.

Matthew McKinney, Co-director, Water & Tribes Initiative; Senior Fellow, Center for Natural Resources & Environmental Policy, University of Montana; Fulbright Specialist 2025-2027.

Jonathan Overpeck, Dean, School for Environment and Sustainability, University of Michigan.

Jason Robison, Professor of Law and Co-Director, Gina Guy Center for Land & Water Law, University of Wyoming.

Jack Schmidt, Director, Center for Colorado River Studies, Utah State University, and former Chief, Grand Canyon Monitoring and Research Center.

Kathryn Sorensen, Kyl Center for Water Policy, Arizona State University; and former Director, Phoenix Water Services.

Brad Udall, Senior Water and Climate Research Scientist/Scholar, Colorado Water Center, Colorado State University.

Guest Contributors

Mahdi Asgari, Postdoctoral Scholar, Department of Agricultural and Applied Economics, University of Wyoming.

Christopher Bastian, Professor, Department of Agricultural and Applied Economics, University of Wyoming.

John Berggren, Regional Policy Manager, Western Resource Advocates.

Anne Castle, Senior Fellow, Getches-Wilkinson Center, University of Colorado Law School; former US Commissioner, Upper Colorado River Commission; and former Assistant Secretary for Water and Science, US Department of the Interior.

Daniel Mooney, Associate Professor of Agricultural and Resource Economics, Colorado State University.

Sarah Porter, Director, Kyl Center for Water Policy, Arizona State University.

Zoey Reed-Spitzer, Research Assistant, North Carolina State University (formerly University of Arizona).

Katherine Tara, Staff Attorney, Utton Transboundary Resources Center, University of New Mexico.


Here’s the preface:

Welcome to theย Colorado River Research Groupโ€™s (CRRG)ย inaugural Colorado River Insights report. This publication marks a new (and still evolving) direction for the CRRG, transitioning away from the group-authored policy briefs of the past to more personal โ€œIndividual Submissionsโ€ that allow members to be more focused, direct and sometimes prescriptive than in the past efforts authored jointly and requiring unanimous consent. While each of the Individual Submissions (i.e., Chapters) that follows is unique in structure and tone and detail, each member was given the same charge: to speak directly about issues on the river where they have been directing much of their current focus, and where feasible, to identify a path forward on those issues. Given this approach, each Individual Submission is truly individualโ€”or, in several cases, the product of small groupsโ€”and thus should not be attributed to the entire body, although in practice there is usually very little internal conflict on any of the major themes featured throughout these pages. One byproduct of this approach is that it shines a light on some of the CRRGโ€™s most glaring holes in terms of disciplines and substantive expertise, helping to steer us to new potential members (and guest contributors) and, perhaps, new approaches. Unless or until that happens, we readily acknowledge that our collective snapshot of current and emerging basin issues is far from comprehensive. But how could it be? Thatโ€™s an impossible standard for a river as vast in size, importance and complexity as the Colorado.

We are hopeful that this new approach can be helpful in better funneling the knowledge emerging from the research community into the hands of decision-makers, journalists, NGOs, water users, and other concerned parties in a more hands-on position to implement the changes needed to restore the economic and environmental sustainability of the River. Clearly, we are in an era screaming for new ideas and new approaches; the status quo isnโ€™t working. โ€” Doug Kenney, CRRG Chair

Map of the Colorado River drainage basin, created using USGS data. By Shannon1 Creative Commons Attribution-Share Alike 4.0

Water across the West at risk as President Trump targets national monuments: A new study found that about 83% of water passing through public lands uses monument designation for its only protection — Wyatt Myskow (High Country News)

RuggyBearLA Photographyย RuggyBearLA / via Flickr

Click the link to read the article on the High Country News website (Wyatt Myskow):

December 9, 2025

This story was originally published bInside Climate News and is republished here through a partnership with Climate Desk.

The 31 national monuments designated since the Clinton administration, which could be downsized as the Trump administration pushes to open more public lands to extractive industries, safeguard clean water for millions of Americans, according to a new analysis from the Center for American Progress.

Using geospatial data to quantify the miles of rivers and watersheds within the studied national monument boundaries, as well as the number of users who depend on that water, the report found that the water supplies for more than 13 million Americans are directly provided by watersheds within or downstream of these national monuments. About 83% of the water passing through these public lands has no other protection besides the monument designations, it found.

National monuments protect more than 21,000 miles of waterways across the U.S., nearly twice as much waterway mileage as the National Wild and Scenic Rivers System, the analysis also determined.

The report comes as the Trump administration weighs downsizing or revoking the designation of  some national monuments.

Corn Springs Chukwalla Mountains California. By Michael Dorausch from Venice, USA – Corn Springs CA, CC BY-SA 2.0, https://commons.wikimedia.org/w/index.php?curid=41004589

In March, the Trump administration announced it would eliminate Californiaโ€™s Chuckwalla and Sรกttรญtla Highlands national monuments before removing language from a White House fact sheet announcing that decision. The following month,ย The Washington Postย reportedย that the administration was considering downsizing or eliminating six national monuments, and in June, the U.S. Department of Justice issued an opinion that the president has the power to rescind national monument designations, backtracking on a decades-old determination on the matter.

Stone and evening light, Bears Ears National Monument, Utah. Jonathan P. Thompson photo.

During Trumpโ€™s last term, Bears Ears and Grand Staircase-Escalante national monuments, established by the Obama and Clinton administrations, respectively, were shrunk to fractions of their original sizes, but they were restored by President Joe Biden after he took office.

If national monuments are downsized or eliminated, the areas surrounding a waterway will lose protections from extractive industries, including oil and gas drilling, mining and grazing. Contamination from those industries could seep into streams and, in turn, rivers. Those industries also use water, sometimes vast amounts in arid regions, further reducing the supply that flows to nearby communities. (In certain cases, some mining and grazing are already permitted on national monument lands, but the activities are limited in scale and more regulated than they are outside the monuments.)

โ€œLandscapes and waterways go hand in hand,โ€ said Drew McConville, a senior fellow for conservation policy at the Center for American Progress and a co-author of the report. โ€œThe clean water depends on what comes into them from natural lands โ€ฆ Just protecting the wet stuff itself doesnโ€™t guarantee that youโ€™re keeping [water] clean and durable.โ€

The portion of historically marginalized communities living within the watersheds of the national monuments is greater than the average for watersheds nationally, it found. Twenty-three of the monuments studied are also found in regions expected to face water shortages due to climate change in the coming decades, making the arid regions downstream even drier.

Grand Staircase-Escalante National Monument, for example, protects 2,517 miles of waterways, according to the analysis, and nearly 90% of the watersheds within the monument are expected to see declines in their water levels. The monument straddles the Upper and Lower Colorado River Basins, with the Paria and Escalante rivers flowing within its boundaries and Lake Powell, the nationโ€™s second-largest reservoir, just to its south. 

The monument is often thought of as a sparse, arid region, which it is, said Jackie Grant, the executive director of Grand Staircase Escalante Partners, a nonprofit focused on protecting the monument that has spent $11 million to protect the Escalante River watershed and all its tributaries. It remains vital to the Colorado River System, which millions of people in the Southwest rely on. Grand Staircase-Escalante helps slow water from the Paunsaugunt Plateau in Bryce Canyon National Park, much of which starts as snowpack in the park before melting and flowing downstream. 

โ€œPeople donโ€™t think of water when they think of Grand Staircase-Escalante National Monument,โ€ Grant said. โ€œSo when we can bring this view of water and how important it is to the protection of the monument, it helps us put another building block in our case for supporting the monument, because not only is it important for the animals, the native plants, the geology and the paleontology, water plays a huge role in the monument, and the monument protects the water itself.โ€

The Antiquities Act of 1906 was signed into law by Theodore Roosevelt, for โ€œโ€ฆ the protection of objects of historic and scientific interestโ€ through the designation of national monuments by the President and Congress. National monuments are one of the types of specially-designated areas that make up the BLMโ€™s National Conservation Lands. Some of the earliest national monuments included Devils Tower, the Grand Canyon, and Death Valley. They were initially protected by the War Department, then later by the National Park Service. More recently, the BLM and other Federal agencies have retained stewardship responsibilities for national monuments on public lands. In fact, the BLM manages more acres of national monuments in the continental U. S. than any other agency. This includes the largest land-based national monument, the Grand Staircase-Escalante National Monument in Utah featured here. National monuments under the BLMโ€™s stewardship have yielded numerous scientific discoveries, ranging from fossils of previously unknown dinosaurs to new theories about prehistoric cultures. They provide places to view some of Americaโ€™s darkest night skies, most unique wildlife, and treasured archaeological resources. In total, twenty BLM-managed national monuments, covering over five million acres, are found throughout the western U. S. and offer endless opportunities for discovery. Photos and description by Bob Wick, BLM.

Stretching across 1.87 million acres of public land, Grand Staircase-Escalante National Monument is one of the countryโ€™s most expansive national monuments, protecting scores of wildlife as well as archeological resources in southern Utah. But a nine-billion-ton coal deposit is buried in the center of the monument along with deposits of minerals, including uranium and nickel. The Trump administration has long touted boosting the countryโ€™s coal production, and has established a pro-mining agenda this year.

โ€œItโ€™d be very easy to contaminate either one of those rivers if mining were to take place in the center section of the monument,โ€ Grant said.ย 

Margaret Walls, a senior fellow at Resources for the Future who has studied national monuments but was not part of this study, said national monuments are designated to protect cultural or historical landmarks, and it can be forgotten that they can also serve purposes like safeguarding water. Though she noted that even if monument protections are loosened, the areas remain federal lands, and their changes in status do not guarantee they will be developed. 

โ€œWe donโ€™t protect waterways the way we do land,โ€ Walls said, โ€œweโ€™re going to get those water benefits by protecting the land.โ€

Created by Imgur user Fejetlenfej , a geographer and GIS analyst with a โ€˜lifelong passion for beautiful maps.โ€™ It highlights the massive expanse of river basins across the country โ€“ in particular, those which feed the Mississippi River, in pink.

Federal Water Tap, December 8, 2025: Congressional Reps Ask for Water-Related Matters in North American Trade Talks — Brett Walton (circleofblue.org)

Click the link to read the article on the Circle of Blue website (Brett Walton):

December 8, 2025

The Rundown

  • Members of Congress want Tijuana River cleanup and Rio Grande water deliveries discussed as part of theย U.S.-Mexico-Canada trade agreement.
  • EPA publishes aย lead service line data dashboard.
  • Reclamation finalizes an operating plan to increase water deliveries to farms inย Californiaโ€™s Central Valley.
  • A water pipeline break disrupts theย Grand Canyonโ€™sย South Rim services.
  • DOE advisory group recommends limiting scope of stateย Clean Water Actย reviews.
  • NOAA assesses the 2025 harmful algal bloom inย Lake Erie.

And lastly, bipartisan bills in Congress would compensate farmers hurt by PFAS.

โ€œIn Maine, PFAS contamination affecting many different sectors, including agriculture, has been discovered over the past several years. The presence of PFAS in wastewater sludge once spread as fertilizer has prevented some Maine farms from selling their products, thus leading to significant financial hardship for these family farmers.โ€ โ€“ Sen. Susan Collins (R-ME) speaking on the Senate floor about the Relief for Farmers Hit with PFAS Act. The bill would provide financial aid to farmers affected by PFAS contamination.

The pot of money authorized in the bill could be used in several ways, the representatives say. Reimbursement for lost income. Soil and water testing. Remediation systems. Blood testing for farmers exposed to the chemicals.

By the Numbers

River Mile 58.4: Estimated location, as of December 2, of the saltwater โ€œwedgeโ€ in the Mississippi River in southern Louisiana. Due to dry weather, the wedge โ€“ saltwater that pushed upriver due to weak flows โ€“ has advanced 12 miles since mid-November.

2.4: Severity of the Lake Erie harmful algal bloom in 2025, according to a NOAA assessment. That corresponds to a โ€œmildโ€ bloom โ€“ the second mildest since 2008. The severity rating is a measure of the bloomโ€™s biomass, not its toxicity.

News Briefs

Tijuana River Sewage in Trade Talks
California Democrats in the House and Senate want chronic sewage problems in the Tijuana River to be part of trade talks between the U.S., Mexico, and Canada.

The representatives made their case in a letter to Jamieson Greer, the U.S. trade representative. The three countries are beginning to discuss revisions to the trade agreement that was signed in 2018.

The California contingent asked for:

  • a multi-year funding commitment from the Mexican government
  • expand the geographical scope of an infrastructure grant program to include projects in Mexico
  • more financing from the North American Development Bank
  • a permanent funding source
  • include a formal role for existing border river institutions in the trade agreement framework.

The Tijuana River Coalition, a public interest group, also asked the Office of the U.S. Trade Representative to consider sewage pollution in a revised trade agreement.

Tijuana River sewage is not the only cross-border water problem that U.S. representatives would like to see addressed in the trade talks.

Rep. Monica De La Cruz of Texas encouraged the USTR to include Rio Grande water sharing in the agreement and to use its dispute resolution process as a way to enforce accountability. The Lower Rio Grande Valley Water District Managersโ€™ Association also asked for Rio Grande water disputes to be handled through the trade agreement.

Studies and Reports

Lead Service Line Data
The EPA published an online dashboard with data about the number of lead service lines for each public water system.

Public water systems were required to submit lead service line inventories to the EPA by October 2024. The agency estimates about 4 million lead drinking water lines in the country.

Central Valley Project Operating Plan
The Bureau of Reclamation finalized a new operating plan for the Central Valley Project, the federal canal system that delivers water south of the Sacramento-San Joaquin Delta.

The new plan, which will maximize water deliveries to farms, stems from an executive order requiring the agency to do so.

Permitting and Energy Development
A Department of Energy advisory group that represents oil and gas interests submitted a report recommending limiting the scope of state water-quality reviews.

Like many Republican-leaning groups, the National Petroleum Council wants to prevent states from blocking fossil fuel infrastructure through use of Section 401 of the Clean Water Act, which allows states and some tribes to review projects that could pollute their waters. Notably, New York denied a water-quality permit to the Constitution natural gas pipeline in 2016.

The councilโ€™s report calls Section 401 a โ€œprocedural chokepointโ€ in project permitting.

The Trump EPA is promoting a โ€œspecific and limitedโ€ use of Section 401 for water-quality considerations only.

National Renewable Energy Laboratory

On the Radar

More Renaming
The Department of Energy has renamed the National Renewable Energy Laboratory.

The new name is the National Laboratory of the Rockies.

Economic Effects of Permitting Requirements
The Congressional Budget Office is seeking information that would help it better model the economic and budgetary effects of changes in federal permitting requirements for infrastructure.

Send comments to communications@cbo.gov.

Grand Canyon Water Troubles
The National Park Service is closing hotels on the Grand Canyonโ€™s South Rim to overnight guests due to breaks in the water pipeline that serves the area.

The 12-mile pipeline crosses the canyon. The park service is in the middle of a $208 million pipeline upgrade that it expects to complete in 2027.

Federal Water Tap is a weekly digest spotting trends in U.S. government water policy. To get more water news, follow Circle of Blue on Twitter and sign up for our newsletter.

Seven U.S. states and Mexico depend on the Colorado River, shown here in the Grand Canyon. But over the past century, the riverโ€™s flow has decreased by roughly 20 percent. (Bureau of Reclamation)

Assessing the U.S. Temperature and Precipitation Analysis in November 2025: November and fall rank among warmest on record and it was exceptionally dry across much of the East — NOAA

The aspens on the southern slope of the La Plata Mountains in southwestern Colorado were right in the middle of their autumn transformation during September 2025, with higher elevation clones already leafless and lower elevation ones still deep green. Jonathan P. Thompson photo.

Click the link to read the assessment on the NOAA website:

December 8, 2025

Key Points:

  • November was unusually warm nationwide, ranking as the fourth warmest on record, with five states setting November temperature records.
  • Meteorological fall ranked third warmest on record, with seven states setting fall temperature records.
  • Dry conditions dominated the eastern U.S., with the Southeast seeing its driest fall since 1978.
Map of the U.S. notable weather and climate events in November 2025.

Other Highlights:

Temperature

The average temperature of the contiguous U.S. (CONUS) in November was 46.8ยฐF, 5.1ยฐF above the 20th-century average, ranking as the fourth-warmest November in the 131-year record. Much-above-average warmth covered most of the western and central U.S., while much of the eastern third remained near average. Five statesโ€”Idaho, Nevada, Oregon, Texas and Utahโ€”set new statewide records for November temperature, with Utah (44.4ยฐF) surpassing its 2017 record by more than 1ยฐF. New Mexico had its second-warmest November and Colorado, Oklahoma and Wyoming each recorded their third warmest. At the county level, 100 Texas counties set new records for their warmest average November temperatures, with 30 counties recording average daily highs more than 10ยฐF above the 20th-century average.

November U.S. Mean Temperature Percentiles Map

For meteorological fall (Septemberโ€“November), the CONUS average temperature was 57.2ยฐF, 3.7ยฐF above average, ranking as the third-warmest fall in the 131-year record. Apart from the Carolinas, all CONUS states had fall temperatures more than 1ยฐF above the 20th-century average, and seven statesโ€”Idaho, Nevada, New Mexico, Oregon, Texas, Utah and Washingtonโ€”set new statewide fall temperature records. Nationwide, 275 countiesโ€”nearly 15 million peopleโ€”experienced their warmest fall temperatures on record.

Alaskaโ€™s statewide November temperature was 17.3ยฐF, 5.6ยฐF above the 1925โ€“2000 average, ranking in the warmest third of the 101-year period of record for the state. The state was especially warm across parts of the Interior and the North Slope, which had its fifth-warmest November on recordโ€”more than 11ยฐF above the long-term average. For the fall season, Alaskaโ€™s average temperature was 30.2ยฐF, 4.3ยฐF above average and the tenth warmest on record.

For November, Hawaiโ€™i had an average temperature of 66.9ยฐF, 0.4ยฐF above the 1991โ€“2020 average, ranking in the warmest third of the 35-year record. Fall temperatures also ranked in the warmest third of the historical record.

Precipitation 

November precipitation for the CONUS was 1.70 inches, 0.53 inch below average, ranking in the driest third of the 131-year record. Precipitation was below average across much of the U.S. east of the Mississippi River, with the Southeast region experiencing its sixth-driest November on record. The Southeast region averaged just 1 inch of rainfall for the monthโ€”less than 35% of the 20th-century average. South Carolina had its second-driest November, marking its lowest November rainfall since 1931, while Florida received less than 15% of its average rainfall for its third-driest November. In contrast, precipitation in the West was mixed; portions of California and the Southwest recorded above-average rainfall, while parts of the northern Great Basin, Northwest and Rockies received below-average precipitation.

November 2025 U.S. Total Precipitation Percentiles

The fall season (Septemberโ€“November) was also dry for the CONUS, with a total of 5.97 inches of precipitation, 0.91 inch below average, ranking in the driest third of the record. While much of the Northwest and Rockies received near-average precipitation, wetter-than-average conditions prevailed in the Southwest and Plains, with several counties in southern California and southeastern Arizona recording their wettest fall on record. Further east, below- to much-below-average precipitation was seen across the middle and upper Mississippi Valley and Great Lakes, as well as a region stretching from the southern Plains across much of the South, Southeast, Mid-Atlantic and Northeast. The Southeast region recorded its driest fall since 1978 (sixth driest on record), with Georgia receiving less than half of its seasonal average for its fourth-driest fall. However, in contrast to the widespread dry trend in the east, parts of the Ohio Valley received above-average rainfall.

Alaskaโ€™s average monthly precipitation in November was 2.99 inches, 0.40 inch below average, ranking in the middle third of the 101-year record. The Septemberโ€“November total was 12.91 inches, 0.59 inch above average and in the middle third of the record.

Precipitation across Hawaiโ€™i in November averaged 5.28 inches, 1.19 inches below average, ranking in the middle third of the 1991โ€“2025 record. Fall precipitation was 11.70 inches (4.30 inches below average), ranking in the driest third of the record.

Drought

According to the December 2 U.S. Drought Monitor report, about 41.4% of the contiguous U.S. was in drought, down about 2.3% from the beginning of November. Drought contracted or was reduced in intensity across much of the western U.S., particularly the Southwest, Great Basin and parts of the Rockies and Northwest, as well as in portions of the middle Mississippi and Ohio Valleys and the Northeast. In contrast, drought developed or intensified significantly across the Southeast and in parts of the southern Plains and upper Mississippi Valley.

Monthly Outlook

Above-average temperatures are likely across much of the southern tier, from the central Rockies through the southern Plains and Southeast, while below-average temperatures are favored in the northern Plains, upper Midwest, Great Lakes and Northeast. Above-average precipitation is expected in parts of the northern Rockies and northern Plains, and along the Gulf Coast through the Carolinas and into the Northeast, while below-average precipitation is favored across the central Plains and Florida Peninsula. Visit the Climate Prediction Centerโ€™s Official 30-Day Forecasts for more details.

Drought improvement or removal is expected in parts of the Northwest and northern Rockies, the western and central Gulf Coast, much of Alabama and Georgia, the Great Lakes, the Mid-Atlantic, the Northeast and Hawaiโ€™i. In contrast, drought is likely to persist or worsen across the central and southern Rockies, portions of the Plains, the middle and upper Mississippi Valley and the Florida Peninsula, with expansion likely in western Texas and eastern New Mexico. Visit the U.S. Monthly Drought Outlook website for more details.

Significant wildland fire potential in December is above normal across portions of western Texas and western Oklahoma, as well as southern Georgia and north-central Florida. For additional information on wildland fire potential, visit the National Interagency Fire Centerโ€™s One-Month Wildland Fire Outlook.


For more detailed climate information, check out our comprehensive November 2025 U.S. Climate Report scheduled for release on December 11, 2025. For additional information on the statistics provided here, visit the Climate at a Glance and National Maps webpages.

The latest Intermountain West briefing is hot off the presses from Western Water Assessment

Click the link to read the briefing on the Western Water Assessment website:

December 8, 2025 – CO, UT, WY

A hot and dry November left the Intermountain West with much below average snowpack conditions. November temperatures were four degrees above average region-wide and much of Utah and Wyoming baked under mean temperatures that were six to ten degrees above average. High temperatures coupled with mostly below normal precipitation caused low snow water equivalent (SWE) and worsening drought conditions.

November precipitation was much below average for much of the region, especially in Wyoming, northern Colorado and northern Utah, which received less than half of normal precipitation. Much above average November precipitation was observed in southern Utah and eastern Colorado. Record dry Novembers were observed at thirteen locations in Wyoming, ten locations in Colorado and five locations in Utah. Despite dry November conditions, regional water year precipitation is near to above average except for eastern Colorado and southeastern Wyoming.

November was an extremely warm month, especially in western Wyoming, where monthly temperatures were more than eight degrees above average. The entire region observed November temperatures that were at least four degrees above average, with all of Utah, nearly all of Wyoming and western Colorado experiencing temperatures that exceeded six degrees above average. Record warm October conditions were observed in western Colorado, southwestern Wyoming and throughout Utah.

Record low SWE conditions exist at many locations in Colorado, Utah and Wyoming. A hot and dry November left most regional river basins with SWE conditions at less than 50% of average, with the least snow in the Six Creeks near Salt Lake City, where December 1st SWE is 22% of median. Slightly better SWE conditions exist in southern Colorado and southern Utah.

Regional drought coverage expanded slightly during November, increasing from 51% five weeks ago to 54% on December 2. Eastern Colorado and eastern Wyoming remain drought-free, but drought emerged along the northern Front Range and adjacent plains. Coverage of drought in Utah dropped below 100% for the first time in five months. Utah and Colorado were last free from drought six years ago, while the current drought in Wyoming began five years ago.

West Drought Monitor map December 2, 2025.

A NOAA La Niรฑa Advisory is still in effect as eastern Pacific Ocean temperatures are below average. Weak La Niรฑa conditions are expected to transition (60% probability) to neutral conditions by early 2026. The NOAA December Precipitation Outlook suggests above average precipitation for most of Wyoming. For the winter months (Dec-Feb), there is an increased probability for above average temperatures in Utah and southwestern Colorado. In Wyoming, there is an increased probability for above average precipitation and below average temperatures.

Record high temperatures drive record low snowpack.ย On December 1, record low SWE conditions were present at 52 regional Snotel sites in northern Colorado, northern Utah, and across Wyoming. Despite very low snowpack conditions, water year precipitation is above average for the region, except in northern Colorado. During early October, daily precipitation records were set in Utah and Colorado, including widespread flooding in southwest Colorado. Due to the tropical origin of those storms, nearly all precipitation fell as rain. Contrasting precipitation, water year temperatures are much above average with record high temperatures observed in parts of western Colorado, eastern Utah, and southwestern Wyoming. Consequently, the current snow drought is primarily the result of high temperatures rather than low precipitation. While October precipitation generally fell as rain in regional mountains, above average precipitation has increased soil moisture, which could help to bolster the efficiency of runoff in 2026.

#Snowpack news December 8, 2025

Westwide SNOTEL basin-filled map December 7, 2025.
Colorado snowpack basin-filled map December 7, 2025.

Romancing the River: Why am I โ€˜Romancingโ€™ It? — George Sibley (SibleysRivers.com) #ColoradoRiver #COriver #aridification

The Demilitarized Zone between the two Koreas – it’s not quite this bad between the two Colorado River Basins.

Click the link to read the article on the Sibley’s Rivers website (George Sibley:

December 2, 2025

Negotiations among the Magnificent Seven representing the seven states of the Colorado River region begin to resemble the ongoing negotiations between the military and diplomatic representatives for North and South Korea, where negotiations for something beyond an armistice have been going on for more than sixty years. Here, as there, the negotiations have reached a stalemate, and both sides are now engaged in an information war. Between the two Koreas, this war takes the form of everything from huge arrays of speakers blasting pop music across the demilitarized zone to smuggled USB drives with movies and TV shows. Here, it is mostly just propaganda bombs tossed over our โ€˜DMZ,โ€™ the Grand Canyons, about each sideโ€™s virtue and the other sideโ€™s obstinacy, depending on their regional mediaโ€™s love of conflict and tendency to support the home team. The missed November deadline has been seamlessly replaced โ€“ as we all suspected it would be โ€“ by a February deadline. But otherwise โ€“ nothing new on that front. We can just hope it doesnโ€™t go on for another fortysome years.

So Iโ€™m going to take advantage of the stalemate to ask the reader to think about a bigger picture that may be more interesting. It stems from a comment from my partner Maryo, from whom I learn too much to dismiss anything she says. โ€˜Why are you โ€œromancing the riverโ€?โ€™ she asked the other day. โ€˜Romance is such a cheapened concept today โ€“ bodice-ripping stories of ridiculous antagonistic love. Youโ€™re undermining the value of your work, calling it a โ€œromance.โ€โ€™

โ€˜Well,โ€™ I said โ€“ figuring that if she feels that way, maybe my readers raise the same question โ€“ โ€˜maybe one of the things a writer ought to try to do is restore the value of words and the concepts they once represented that have become devalued through misuse.โ€™ Spoken like a true Don Quixote, another old man who took arms, sort of, against abuse of the concept of โ€˜romance.โ€™

I do think that one of the things that โ€˜civilizationโ€™ does in civilizing us is to simplify things for us, including words whose complexity and depth embrace concepts, ideas and feelings that can be inconvenient to an orderly civilized society. A  โ€˜romance,โ€™ from the medieval era on into the early 20th century, was a story of an adventure in pursuit of something mysterious, exciting, challenging, something beyond everyday life. That could be the pursuit of a love relationship that was life-changing (and maybe life-endangering) for its participants โ€“ Tristan and Isolde, Launcelot and Guinevere, Romeo and Juliet, Bonnie and Clyde.

But on a much larger scale, the romantic adventure can be establishing a relationship with anything outside of ourselves that intrigues or challenges us. The relationship can emerge with a place, a house, a horse, a car, a continent, a river, an idea, as well as another person, anything that intrigues us, wakes up our imagination โ€“ arational or prerational relationships that make the civilizing forces nervous. The relationship can run the quick dynamic spectrum from arational love to its flip side arational hate, through all the intermediary love-hate variations. It can also have a mythically selective or even creative attitude toward the gray-zone relationship between โ€˜truthโ€™ and fact. Which leads those trying to develop an orderly civilization to dismiss anything (ad)venturing into the mythic as a lie. It just seems simpler that way.

The Powell survey on its second trip down the Colorado River, 1871. Photo credit: USGS

The first comprehensive study of the Colorado River region was uncivilized enough to state upfront its romantic origins: Frederick Dellenbaughโ€™s Romance of the Colorado River. Dellenbaughโ€™s book (available online for a pittance) delved as deeply as was possible at that time into both the First People prehistory in the region and the early history of the Euro-American invasion, from the Spanish trying to work their way up the river from its contentious confluence with the Gulf of California (โ€˜Sea of Cortezโ€™ to them) to the trappers imposing the first major Euro-American change on the river, stripping its tributaries of their beavers which increased the size and violence of the riverโ€™s annual spring-summer runoff of snowmelt. But the heart of the book is John Wesley Powellโ€™s explorations to link the upper river and the lower river through its canyons.

Dellenbaugh, as a seventeen-year-old, accompanied Powell on his second Colorado River expedition, a โ€˜baptism under waterโ€™ (often literally) that shaped his โ€˜romanticโ€™ vision. In his โ€˜Introduction,โ€™ after observing that most of the great rivers that humans encountered in exploration and settlement gradually became like foster parents to those who settled along them, carrying goods for them and generally watering and growing their settlements, he says of the Colorado:

Dellenbaughโ€™s Romance was published in 1903. That same year, another great southwestern writer, Mary Hunter Austin came out with her Land of Little Rain, a fascinating collection of her explorations in the deserts of the lower Colorado River region. In that book she offered what might be a cautionary note about โ€˜romancing the river,โ€™ in an observation about a small Arizona tributary of the Colorado River, โ€˜the fabled Hassayampaโ€ฆ of whose waters, if any drink, they can no more see fact as naked fact, but all radiant with the color of romance.โ€™

I will now indulge my tendency to take a โ€˜tectonicโ€™ look at history โ€“ looking for large chunks colliding or grating together or subducting under each other. I see the history of our engagement with the Colorado River dividing into three โ€˜tectonic romancesโ€™:  first, the Romance of Exploration, which is chronicled in a couple different ways by those two explorers, Dellenbaugh and Austin; their 1903 publications summarize that age and put a semi-colon at the end of the period, as it were.

Second, the Romance of Reclamation: 1903 also marks the year the U.S. Reclamation Service came into being, an organization created almost specifically for settling the Colorado River deserts. Civilized people on both sides of the question would deny that there was any โ€˜romanceโ€™ to reclamation, but one early Bureau engineer would publicly disagree, writing in 1918 about โ€˜the romance of reclamationโ€™:

C.J. Blanchard of the U.S. Reclamation Service authored that steaming verdure. The Service at that time was under the U.S. Geological Survey, a scientific organization disciplined to the โ€˜look before you leapโ€™ methods of science, discerning the reality of a situation and adapting to that; but the Reclamation Service, frustrated by the seasonal flood-to-trickle flows of the Colorado, thought that changing that reality (through storage and redistribution) was a more promising route than adapting to it, and so was on its way to becoming independent of the USGS when Blanchard wrote his โ€˜romance of irrigationโ€™ for an educational journal called The Mentor(thanks, Dave Primus, for calling it to my attention).

Members of the Colorado River Commission, in Santa Fe in 1922, after signing the Colorado River Compact. From left, W. S. Norviel (Arizona), Delph E. Carpenter (Colorado), Herbert Hoover (Secretary of Commerce and Chairman of Commission), R. E. Caldwell (Utah), Clarence C. Stetson (Executive Secretary of Commission), Stephen B. Davis, Jr. (New Mexico), Frank C. Emerson (Wyoming), W. F. McClure (California), and James G. Scrugham (Nevada)
CREDIT: COLORADO STATE UNIVERSITY WATER RESOURCES ARCHIVE via Aspen Journalism

The best-known document of the Romance of Reclamation was of course the Colorado River Compact โ€“ a document in which the romance of reclamation overrode any relationship to โ€˜naked factโ€™ about the river and its flows, a situation that is now biting our collective ass. Yet an Arizona water maven said recently that any Bureau of Reclamation solution to the seven-state impasse would have to cleave closely to the Compactโ€ฆ. The history of the Romance of Reclamation has been written in the gaggle of Congressional acts, court decisions, treaties, regulations and directives that make up the โ€˜Law of the Riverโ€™ (recitations of which never seem to include the 1908 Winters Doctrine allocating assumed water to federal reservations, including to the First Peoples).

The end of the Romance of Reclamation would be in the 1960s, pick your date: publication of Rachel Carsonโ€™s Silent Spring in 1962, passage of the Wilderness Act in 1964, passage of the Environmental Policy Act in 1969 โ€“ a decade in which the general American perception of the West underwent a sea change, from seeing it as a workplace for producing the resources to feed the American people and industries, to seeing it as a great natural playground to which Americaโ€™s predominantly urban population could go to recharge, with a resulting desire to protect it from the very industrial consumption that supported the American โ€˜lifestyle.โ€™.

This was the dawn of the third romantic epoch in our relationship with the river (and the continent in general) โ€“ the Romance of Restoration and Revision, driven by a belief that we have sinned against capital-N Nature โ€“ with many naked facts as evidence โ€“ and can only expiate our sins by preserving what remains of the nonhuman environment, restoring what we can of the damage weโ€™ve done, and revising our own systems for consuming nature (e.g., renewable energy).

Aesthetics are at the root of our romance with capital-N Nature, aesthetics best served by the (increasingly rare) opportunity to be alone with and โ€˜silent on a peak in Darien,โ€™ as Keats put it. We have a large (and growing) number of excellent writer[s] who work to elaborate on that aesthetic โ€“ Ed Abbey first, Craig Childs, Heather Hansman, Kevin Fedarko, to name a few.

But the aesthetic yearning to ultimately โ€˜put it back the way it wasโ€™ does not extend to other equally naked facts, like the dependence of the outdoor recreation industries on the creation of big mountain-highway traffic jams pumping big quantities of carbon and nitrogen gases into the already overladen atmosphere, as we all load up our cars with expensive gear to go off to commune with Nature. Or the naked fact that maintaining civilization-as-we-know-it for 300 million people involves a lot of nonrewable extraction from Nature that it will be very difficult to move away from entirely โ€“ unless we figure out how to control our breeding.

Just as significant achievements were achieved under the Romance of Reclamation, so significant achievements have been achieved under the Romance of Restoration and Revision โ€“ the setting aside of millions of acres of still-sort-of-wild land, instream flow laws, increasingly responsible forest management, et cetera. But we are clearly still in the early transition โ€“ half a century later โ€“ to a more realistic romance with restoring and revising to a kinder gentler relationship with the nonhuman systems of nature. And right now, we  are experiencing a major counter-attack from the societal forces whose aesthetics still imagine a โ€˜working landscapeโ€™ of derricks, mines and other industrial-scale harvests, all suffused with the โ€˜smell of money,โ€™ societal forces that believe the best of times were before we woke up to the increasingly fragile finitude of our planet under the burden of us. Letโ€™s all go back and make America great again!

The back of Glen Canyon Dam circa 1964, not long after the reservoir had begun filling up. Here the water level is above dead pool, meaning water can be released via the river outlets, but it is below minimum power pool, so water cannot yet enter the penstocks to generate electricity. Bureau of Reclamation photo. Annotations: Jonathan P. Thompson

I cannot now imagine when and how this third epoch of our romance with the river will end. I think this aesthetic romance might peak with the โ€˜breachingโ€™ of Glen Canyon Dam, an action that has taken on a somewhat mythic quality for todayโ€™s river romantics. I donโ€™t think we will tear it down โ€“ let it stand as a monument toโ€ฆsomething. But I suspect that even the Bureau of Reclamation is exploring some way of tunneling around it at river level, as we continue to flirt with the disaster of dead pool behind the dam. It will not be easy, due to the silt already piled up at the dam โ€“ but really, nothing is going to be easy anymore; that blessed civilization is now in the rear-view mirror.

Iโ€™m going to take advantage of the lull in the short-term news about the riverโ€™s management for maybe the next decade, to take a look at each of these three epochs of โ€˜romancing the riverโ€™ and their relationship to the โ€˜naked factsโ€™ of the river โ€“ mostly see if there might be something there weโ€™ve overlooked that might help us move forward in our ever-emerging relationship of this โ€˜First River of the Anthropocene.โ€™ Onward and outward.

Map of the Colorado River drainage basin, created using USGS data. By Shannon1 Creative Commons Attribution-Share Alike 4.0

Federal money is still in President Trump’s limbo. Rural #Utah is antsy about its water projects — KUER

Price, Utah Main Street and historic theater. By Millman5429 – Own work, CC BY-SA 4.0, https://commons.wikimedia.org/w/index.php?curid=122348071

Click the link to read the article on the KUER website (David Condos). Here’s an excerpt:

December 3, 2025

Price Mayor Michael Kourianos drew an imaginary line in the air between two scrubby desert hills. His hand traced the path of a planned 100-foot dam for a new reservoir just north of the city in Carbon County. The project, which Kourianos described as vital to the areaโ€™s future, would provide irrigation to farmers and shore up the cityโ€™s water supply. Itโ€™s a big deal in a drought-prone area, and it could be built within five years, he said โ€” if the federal funding thatโ€™s supposed to pay for it doesnโ€™t disappear.

โ€œI’m very much worried about that,โ€ Kourianos said. โ€œThat could be at risk. Thatโ€™s the unknown.โ€

To finish the projectโ€™s environmental impact study by next spring, he said the city and county had to scrape together about $215,000. That was after they were told there were no more federal funds to help with it due to the Trump administrationโ€™s recent cuts. The next step will be designing the reservoir, which he said is supposed to be paid for by theย Natural Resources Conservation Service, part of the U.S. Department of Agriculture. The agency is set to pay 75% of construction costs, too. In all, the project will cost around $200 million. For a city of 8,216 people, thatโ€™s just not in the budget…

Priceโ€™s reservoir isnโ€™t the only one threatened. In January, for example, the Biden administrationย awardedย more than $70 million to 10 proposals in Utah and another $50 million to four on the Navajo Nation and Ute tribal land within the stateโ€™s watersheds. The projects range from improving wetland habitat forย endangered fishย to removing invasive plants, such asย Russian olive trees, from riverbanks. It was part of aย $388.3 million effortย to improve drought resilience across the Colorado River Basin with money from the Inflation Reduction Act. Just a few days after the money was awarded, however, President Donald Trump took office andย pausedย it. Several months later, recipients are still waiting…One of the impacted proposals is a collaboration between theย Utah Division of Wildlife Resourcesย and conservation organizationsย Trout Unlimitedย andย The Nature Conservancyย that would pay people to voluntarily leave water in the Price River rather than use it.

Utah Rivers map via Geology.com

New Report Warns of Critical #Climate Risks in Arab Region — Bob Berwyn (InsideClimateNews.org)

Rare desert wetlands at the southern tip of the Sinai Peninsula could be wiped by global warming before the end of the century, a new report on climate change in the Arab region warns. Credit: Bob Berwyn/Inside Climate News

Click the link to read the article on the Inside Climate News website (Bob Berwyn):

December 4, 2025

As global warming accelerates, about 480 million people in North Africa and the Arabian Peninsula face intensifying and in some places unsurvivable heat, as well as drought, famine and the risk of mass displacement, the World Meteorological Organization warned Thursday.

The 22 Arab region countries covered in the WMOโ€™s new State of the Climate report produce about a quarter of the worldโ€™s oil, yet directly account for only 5 to 7 percent of global greenhouse gas emissions from their own territories. The climate paradox positions the region as both a linchpin of the global fossil-fuel economy and one of the most vulnerable geographic areas.

WMO Secretary-General Celeste Saulo said extreme heat is pushing communities in the region to their physical limits. Droughts show no sign of letting up in one of the worldโ€™s most water-stressed regions, but at the same time, parts of it have been devastated by record rains and flooding, she added.

โ€œHuman health, ecosystems and economies canโ€™t cope with extended spells of more than 50 degrees Celsius. It is simply too hot to handle,โ€ she said. 

The region in the report stretches from the Atlantic coast of West Africa to the mountains of the Levant and the deserts of the Arabian Peninsula. It spans more than 5 million square miles, roughly the area of the continental United States west of the Mississippi River. Most people live near river valleys or in coastal cities dependent on fragile water supplies, making the entire region acutely sensitive to even small shifts in temperature and rainfall.

Egyptโ€™s Nile Delta, one of the worldโ€™s lowest-lying and most densely populated coastal plains, is particularly vulnerable. The delta is sinking and regional sea levels are rising rapidly, putting about 40 million residents and more than half of the countryโ€™s agricultural output at risk. 

The most recent Intergovernmental Panel on Climate Change report warns that large parts of the Nile Delta will face chronic flooding, salinized soils, and permanent inundation under nearly every future warming scenario. Some projections indicate that a third of the areaโ€™s farmland will be underwater by 2050. Because the delta is so low and flat, even modest sea-level rise will push saltwater far inland. 

The new WMO report shows that the foundations of daily life across the Arab region, including farms, reservoirs and aquifers that feed and sustain millions, are being pushed to the brink by human-caused warming.

Across northwestern Africaโ€™s sun-blasted rim, the Maghreb, six years of drought have slashed wheat yields, forcing countries such as Morocco, Algeria and Tunisia to import more grain, even as global prices rise. 

In parts of Morocco, reservoirs have fallen to record low levels. The government has enacted water restrictions in major cities, including limits on household use, and curtailed irrigation for farmers. Water systems in Lebanon have already crumbled under alternating floods and droughts, and in Iraq and Syria, small farmers are abandoning their land as rivers shrink and seasonal rains become unreliable.

The WMO report ranked 2024 as the hottest year ever measured in the Arab world. Summer heatwaves spread and persisted across Syria, Iraq, Jordan and Egypt. Parts of Iraq recorded six to 12 days with highs above 50 degrees Celsius (122 degrees Fahrenheit),ย conditions that are life-threatening even for healthy adults. Across the region, the report noted an increase in the number of heat-wave days in recent decades while humidity has declined. The dangerous combination speeds soil drying and crop damage.ย 

Northern African countries, including Egypt, are on the frontlines of the climate crisis, with temperatures soaring toward levels that arenโ€™t survivable without shelter or air conditioning. Credit: Bob Berwyn/Inside Climate News

By contrast, other parts of the regionโ€”the United Arab Emirates, Oman and southern Saudi Arabiaโ€”were swamped by destructive record rains and flooding during 2024. The extremes will test the limits of adaptation, said Rola Dashti, executive secretary of the Economic and Social Commission for Western Asia, who often works with the WMO to analyze climate impacts.

Climate extremes in 2024 killed at least 300 people in the region. The impacts are hitting countries already struggling with internal conflicts, and where the damage is under-insured and under-reported. In Sudan alone, flooding damaged more than 40 percent of the countryโ€™s farmland. 

But with 15 of the worldโ€™s most arid countries in the region, water scarcity is the top issue. Governments are investing in desalination, wastewater recycling and other measures to bolster water security, 

but the adaptation gap between risks and readiness is still widening.

The worst is ahead, Dashti said in a WMO statement, with climate models showing a โ€œpotential rise in average temperatures of up to 5 degrees Celsius (9 degrees Fahrenheit) by the end of the century under high-emission scenarios.โ€ The new report is important, she said, because it โ€œempowers the region to prepare for tomorrowโ€™s climate realities.โ€

State ramps up water measurement on Western Slope: Grant program will fund measuring devices as state anticipates compact administration, further scarcity — Heather Sackett (AspenJournalism.org)

This Parshall flume measures the water in the Alfalfa Ditch on Surface Creek near Cedaredge. The Colorado Division of Water Resources estimates there are 2,800 diversions of more than 1 cfs without measuring devices across the Western Slope. CREDIT: HEATHER SACKETT/ASPEN JOURNALISM

Click the link to read the article on the Aspen Journalism website (Heather Sackett):

December 5, 2025

The state of Colorado is ramping up an effort to measure water use on the Western Slope, developing rules and standards and rolling out a grant program to help water users pay for diversion measurement devices.

With input from water users, officials from the Colorado Division of Water Resources are creating technical guidance for each of the four major Western Slope river basins on how agricultural water users should measure the water they take from streams. The state is now doling out $7 million from the U.S. Bureau of Reclamation to eligible water users with faulty or missing devices to install structures such as flumes, weirs and pumps at their point of diversion. 

Map of the Gunnison River drainage basin in Colorado, USA. Made using public domain USGS data. By Shannon1 – Own work, CC BY-SA 4.0, https://commons.wikimedia.org/w/index.php?curid=69257550
Colorado River Basin in Colorado via the Colorado Geological Survey
Yampa River Basin via Wikimedia.
San Juan River Basin. Graphic credit Wikipedia.
Dolores River watershed
White River Basin. By Shannon1 – Own work, CC BY-SA 4.0, https://commons.wikimedia.org/w/index.php?curid=69281367
Green River Basin

Twenty-five percent of the funding is earmarked for each of the four river basins: Gunnison (Division 4); Colorado River mainstem (Division 5); Yampa-White-Green (Division 6); and San Juan-Dolores (Division 7). The first round of funding will go to Divisions 6 and 7, and applications close at the end of January. The goal is to have all the projects complete by 2029.

Measurement rules for Divisions 6 and 7 have been finalized and are in effect; rules for Division 4 are in the draft phase, and state officials are accepting comments until Dec. 19 on the draft rules in Division 5.

With thousands of diversions from small tributaries across rural, remote and mountainous areas, figuring out precisely how much water is used in Colorado has historically been challenging. According to state officials, there are about 2,800 diversions of more than 1 cubic foot per second from Western Slope rivers and streams that are not currently being measured. Historically, the state has required measuring devices on only diversions that have been involved in calls. When a downstream senior water rights holder is not getting the full amount of water they are entitled to, they can place a โ€œcall,โ€ which forces junior upstream water users to cut back.

This Parshall flume measuring device is being installed on a ditch on Morrisania Mesa near Parachute. The state of Colorado has $7 million in federal funds to distribute to water users to install measuring devices on their diversions from waterways. CREDIT: HEATHER SACKETT/ASPEN JOURNALISM

Compact compliance

The push for more-accurate measurement comes at a time when there is increasing competition for dwindling water supplies, as well as growing pressure on the Colorado Riverโ€™s Upper Basin states (Colorado, New Mexico, Utah and Wyoming) to conserve water. Whether through forced cuts under the terms of the 1922 Colorado River Compact or through a voluntary conservation program that pays water users to cut back, the state will almost certainly face future cuts to its water use.   

According to Jason Ullmann, who is the state engineer and director of the division of water resources, accurate and consistent water measurement is a prerequisite for making basinwide cuts related to the compact.

โ€œWhile weโ€™ve always been in compliance with the [1922 Colorado River] compact, we havenโ€™t had to do a West Slope-wide administration,โ€ Ullmann said. โ€œWe just donโ€™t want to be in the position of having to do that on an emergency basis. We want to be proactive and provide people consistent and reliable standards for what we expect and work with them to get to a point where we do have that more accurate measurement network before that happens.โ€

Although the Colorado River Compact splits the riverโ€™s water evenly between the Upper Basin and the Lower Basin (California, Arizona and Nevada) with 7.5 million acre-feet each annually, the agreement says nothing about what happens when thereโ€™s not enough water to meet these allocations. A โ€œcompact callโ€ is a theoretical legal concept, whose definition is hotly debated among water managers. 

One way it could play out is that the Upper Basin states would have to cut off some water users in order to send enough water downstream to meet their obligations to the Lower Basin. If that happens, Colorado would need a plan for who gets cut off first. Under the strict application water law known as prior appropriation, the oldest water rights get first use of rivers and junior water rights are the first to be cut. 

Michael Cohen, a senior fellow at the Pacific Institute, where he has written about the uncertainties of water use and measurement in the Upper Basin, said collecting better data will help water managers figure out where cuts should come from.

โ€œMoving forward, it looks more and more likely that thereโ€™s going to be some kind of compact call,โ€ Cohen said. โ€œThen the state of Colorado, as well as the other Upper Basin states, need to figure out how theyโ€™re going to enforce that kind of call.โ€

This Parshall flume was installed in the Yampa River basin in 2020 and replaced the old rusty flume seen in the background. The state of Colorado is working toward creating measurement rules and installing measurement devices across the Western Slope. CREDIT: HEATHER SACKETT/ASPEN JOURNALISM

Managing scarcity

But compact compliance is not the only reason that water measurement is needed. Scientists have shown that climate change has contributed to a 20% decline in flows from the 20th century average, and that every 1 degree Celsius of warming results in a 9% reduction in flows. The combination of climate change and a historic drought means that rivers that had never before experienced shortages or calls have started experiencing them in recent years. In the past few years, the Yampa and White rivers, in the northwest corner of the state, have had first-ever calls and have been designated โ€œover-appropriated,โ€ meaning thereโ€™s more water demand than supply at certain times. 

โ€œEven if you toss the compact situation out, itโ€™s just the practical reality that weโ€™re seeing less snowpack and we have more calls,โ€ Ullmann said. โ€œWeโ€™re just in need of improving that measurement accuracy because of the need for administration.โ€

John Cyran, an attorney who worked on developing the measurement rules for the South Platte River basin and is now a senior attorney with the Healthy Rivers department of Boulder-based environmental group Western Resource Advocates, uses the analogy of a pizza party with too-few pizzas where hungry partygoers are allowed only two slices each to illustrate how measurement is needed in times of scarcity. 

โ€œJust like sharing a shrinking pizza or Thanksgiving pie, our water supply is declining,โ€ Cyran said. โ€œThe pie is getting smaller. So it is increasingly important to make sure that people donโ€™t take more than their share. But we canโ€™t manage what we donโ€™t measure.โ€

Tightening up water measurement across the Western Slope could also help Upper Basin water managers as they grapple with a future conservation program that pays water users to cut back and then stores that water in a pool in Lake Powell. A criticism of past pilot programs was that the saved waterย was not tracked to Lake Powell. Water users downstream of a conservation project could pick up the extra water, with no guarantee that any of it reached the reservoir. Measurement rules and devices could help ensure that this conserved water is โ€œshepherdedโ€ to Lake Powell.

Measurement is the first step toward management of a scarce public resource, Cyran said.

โ€œThe first step is measuring how much water is being diverted,โ€ Cyran said. โ€œThe next step is management โ€“ making sure that folks only divert their share and that water we conserve stays in the stream and is not diverted by another user.โ€

Colorado River Basin map via the Babbit Center for Land and Water Policy/Lincoln Institute of Land Policy

Revisiting the Near Past — George Sibley (SibleysRivers.com) #ColoradoRiver #COriver #aridification

George visiting Glen Canyon Dam

Click the link to read the article on the Sibley’s Rivers website (George Sibley):

November 18, 2025

The Bureau of Reclamationโ€™s November 11 deadline for the seven states to present a plan for the management of the Colorado River has passed with no white smoke from the chimney โ€“ no smoke at all in fact, black or white; the meetings have been so secretive that one wonders if the Magnificent Seven have really been meeting at all.

So there being no news on that front, rather than adding to the copious media analysis of no news, Iโ€™m going to step back for the usual longer look โ€“ this time backward, to acknowledge an anniversary: this post marks the completion of the fourth year of this ongoing commentary on our lives with our rivers, mostly the Colorado River; the first post was November 22, 2021. About that, Iโ€™ll just say Iโ€™ve enjoyed this, and learned a lot on top of what I already knew about the river, hydrology, riparian sociology and economy, et cetera; and I do appreciate the handful of people who read it and comment, often teaching me something. I want to express my gratitude to a friend and mostly retired attorney who underwrites this website, and to Rob Strickland of Midnight Marketing, who created and manages the website.

Actually remembering this anniversary, for a guy who tends to forget birthdays, even his own (willfully), makes it a good time to check up on myself, and my work these past four years: am I doing what I started out wanting to do? An inquiry I might as well do transparently, with you still reading this ongoing bloviation. So here is my first post, from November 22, 2021, with some interlinear comments in italics:

Sibleyโ€™s Rivers? What, Why and โ€“ Why Not?

The first thing I want to say about โ€˜Sibleyโ€™s Riversโ€™ is to not be misled by the name; itโ€™s not going to be all about rivers โ€“ although because the West will be the locus of focus, the rivers that run through it (or donโ€™t) will be frequent topics. Especially the Colorado River, which is so ominously interesting these days.

What youโ€™ll find, should you decide to visit โ€˜Sibleyโ€™s Riversโ€™ from time to time, is mostly going to be โ€˜rivers of wordsโ€™ about learning to live in the Anthropocene. The Anthropocene: this new epoch in the eternal evolution of the planet, precipitated by changes that we humans, purposefully or inadvertently, have imposed on the planetโ€™s basic systems, changes which are now altering the conditions of existence for all life on the planet. [ed. emphasis mine]

Most of the scientific community accepts this as a fact of life we now have to learn to live with, and measure up to. We โ€“ all of us, just in the way we daily live โ€“ are a major change agent acting on the planet, on a global scale, which means that what we do now, or stop doing, carries a major responsibility for the continuity of much of the life on earth โ€“ certainly for the continuity of our own species. This is what the president means when he calls it an โ€˜existential challengeโ€™: our very existence is at stake.

I think Iโ€™ve been a little โ€˜liteโ€™ in this. I write primarily about the Colorado River because I see it as โ€˜the First River of the Anthropoceneโ€™ โ€“ the natural phenomenon most dramatically and obviously changed by human actions. But I need to make that more thematic.

Are we up for this? As the rational, problem-solving species we tell ourselves we are? We humans tell each other stories, mythologies, about ourselves and the world we live in โ€“ our origins, our development, our relationship with other living things and with the planet itself โ€“ and we want our stories to show us as a positive force in the world, in the systems we impose on the nature of things around us. These stories are part of who we are.

Most of us probably grew up, as I did, on the โ€˜Ascent of Humankindโ€™ story: We humans emerged as a poor little species with little going for us except a big active brain; for hundreds of thousands of years we crept around slipping into niches as foragers and hunters in all kinds of ecosystems, and somehow we managed to survive. Then around 10,000 years ago, we improved our lives with the invention of agriculture, bringing our food sources together under our control; we settled in towns rather than wandering around the landscape following the food. Success in that gradually led us to gather in larger and wealthier cities; we learned to write, developed the sciences and creative arts, created beautiful things and useful things that we traded with each other, and with other advanced city-states; we learned to make good wine and spirits. We became a civilization, the highest ascent of the species; we spread our light through the conquest and enlightenment of less well developed peoples. An originally insignificant little species became the dominant species on the planet. We are not yet perfect in all our systemic efforts to address the challenges to civilization, both internal and external, but we are, always, steadily improving. This is the mythos of Western Civilization, now the global civilization, in the Holocene, this lovely mellow 10 or 20 thousand year epoch that brackets the โ€˜Ascentโ€™ story.

So what does the dawning of the Anthropocene do to the Holoceneโ€™s โ€˜Ascentโ€™ mythos? If we go by the classical definition of โ€˜tragedyโ€™ โ€“ knowledge gained by the protagonists too late to save them โ€“ then our foundational myth turns from a tale of triumph to a tragedy if it were to end now with the end of the Holocene. So of course it canโ€™t end now. But how do we extend, amend or otherwise carry the story forward? Or do we need a new story to tell ourselves about ourselves and our evolving relationship with our planet? 

The fact is, we are not yet displaying any real capacity for executing a transition into the responsibilities weโ€™ve imposed on ourselves in creating the Anthropocene. In this nation we have a president who seems to get the urgency of it, but he is stymied in acting by a political cult that promotes nothing positive and seeks only his failure. Even worse, a solid 40 percent of the American electorate is in vigorous denial about the challenge โ€“ and many of them are threatening violent armed insurrection if pushed too far on this and other issues. Self-defense, you know.

The nations of the world (most of them) just assembled in Scotland for the United Nationsโ€™ โ€˜COP26โ€™ gathering, which was designed for a rational species confronting a problem to be solved, but everyone went home with no more than vague pledges offered and no specific missions to accomplish by a specific time, in addressing what everyone seemed to agree is a ticking time bomb. The fossil fuel producers had several hundred lobbyists there to make sure that nothing too productive happened on the carbon issue.

As I write this, the nations โ€“ the Council of Parties โ€“ are gathered in Belem, Brazil for COP 30. Carbon emissions have continued to go up every year since 2021; brave but vague promises are made very year, with rich nations making commitments to help poorer nations transition to affordable futures, commitments seldom more than partially fulfilled.

I followed COP26 on the internet through the adventures of a young Colorado woman, Sarah Johnson, at the COP26 conference. A freelance environmental educator from Carbondale, she wangled an โ€˜observerโ€™ badge to the Glasgow event, and made frequent posts from there, providing a different look at what was going on there than one got from the mainstream media. Based just on her accounts, I would say that one positive thing that might come from COP26 will be a lot of young people from everywhere who now know each other, and know of each other, and are the ones who will not shrink from inheriting the whirlwind the current crop of poohbahs is probably going to leave in their laps after a few more years of harrumphing.  (Sarahโ€™s COP26 postings are at https://www.wildroseeducation.com/uncop.html.)

โ€˜We are desperate for a new story,โ€™ Sarah said in one of her posts, โ€˜a promising narrative, words of encouragement grounded in our history of tenacity, strength, and determination.โ€™

Trying to find elements of that story for the Anthropocene is as close as I can come to a statement of purpose for this site, and I hope for exchange and input from people like Sarah, and anyone else who has read this far. 

I think cautionary elements of that story exist in the wrestling Iโ€™ve done with the Colorado River and its fantasy-ridden management, and Iโ€™ve gotten insightful comments from readers, for which Iโ€™m grateful. But the new story remains elusive.

My perspective here is what I think of as โ€˜Medial Westโ€™: the perspective of one caught between an Old West and a New West, and not really comfortably at home in either. The Old West has been a culture of resource appropriation and development โ€“ at its worst, the rip-and-run mining of minerals, timber, grass and water; at its best the evolution of multi-generational ranching and farming communities, in for the long haul. The New West is most visibly a culture of industrial recreation, auto tourismand real estate development dependent on an aesthetically inspiring natural environment. 

Iโ€™ve not pointed out enough that an โ€˜aesthetically inspiring natural environmentโ€™ is no more sustainable than an oil well, when we start filling it up with people, monstrous houses and the other artifacts of high civilization.

But the dominant culture of both the Old and New West has been and is the Industrial Revolution โ€“ a huge system for employing the population in the myriad acts of converting natureโ€™s resources into goods and services to be bought and sold in as many forms as possible. The basic difference between Old West and New West industries: Old West industries move the products to the people; New West industries move the people to the products. Just in the moving, both contribute significantly to the greenhouse gas challenge that tipped us into the Anthropocene.

Iโ€™ve personally been too involved with both the Old and New West to choose either over the other unconditionally. My motherโ€™s grandparents homesteaded a modest farm in the valley of the North Fork of the Gunnison River in the 1880s, driven by dreams that werenโ€™t very industrial at all, but also werenโ€™t very well articulated; Iโ€™ve come to know the fourth and fifth generations of farmer-ranchers here in the Upper Gunnison Basin who are a lot like what I know of my great-grandparents, and who seem to see their lives more as a heritage culture than an economic industry โ€“ even though they sell their cattle into the global industrial market.

Access to that market is thanks to people like my motherโ€™s father, who was a civil engineer in the Gunnison River Basin making sure the railroad got to every community โ€“ the Industrial Revolutionโ€™s first efficient vehicle for vacuuming the resources of the West for the nationโ€™s growing industrial cities โ€“ including eventually its human resources, its offspring.

I came to the Gunnison River Basin from the urban-industrial mainstream eighty years after my grandparents, thinking I was fleeing it, but instead went right to work in the incipient industries of the New West. When I realized that I was basically making straight in the wilderness the way for the fullblown advent of the remodeled Industrial Revolution, I tried to pull back, but still had to make enough of a living to keep the family functional, and what else was there?

Nevertheless, I did manage to work my way into two โ€˜counterrevolutionaryโ€™ situations. One was running a small sawmill on the edge of civilization, producing rough-sawn lumber entirely for a local market. The other was two decades of slightly subversive work for a regional college here, trying to develop niche programs to wake the children of the Industrial Revolution up the possibility that life could and should be more than an economy in which we must labor all our lives. My success was about par for the two and a half centuries of that counterrevolutionโ€™s steady retreat before the industrial revolutionaries โ€“ not much, but hope abides. More about that in future posts โ€“ rethinking our conventional sense of our history may help us succeed in the Anthropocene.

My โ€˜Medial Westโ€™ perspective values the work ethic and attachment to place of the Old West people who have stayed long enough to have a story of their own here, but also values โ€“ and shares โ€“ the aesthetic appreciations of the New West people and the growing effort to find re-creation beyond recreation โ€“ probably an essential transition in learning to live in the Anthropocene. My energy for earnestly tackling the challenges of the Anthropocene dissipates if not frequently infused with the sight of the blue sky out the window, and its invitation to spend some time later today out under that sky, in meditation with the axe and the woodpile.

Okay โ€“ thereโ€™s still work to do with the First River of the Anthropocene โ€“ but rather than beating on the dead horse of 20th-century mismanagement to try to make it get up and slog on, Iโ€™ll make a more disciplined effort to find Sarah Johnsonโ€™s story that would make us want to live constructively in the Anthropocene. Meanwhile, thereโ€™s again wood to be split for the winter. Allons, friends!

“First River of the Anthropocene” — George Sibley. Colorado River “Beginnings”. Photo: Brent Gardner-Smith/Aspen Journalism

A weird water year so far: Abundant rain, sparse snow: Plus: National park shenanigans in #Utah — Jonathan P. Thompson (LandDesk.org) #snowpack

The drought situation has improved markedly in the Southwest since the end of the last water year, especially in the Four Corners area. Source: National Drought Monitor.

Click the link to read the article on The Land Desk website (Jonathan P. Thompson):

December 2, 2025

โ›ˆ๏ธ Wacky Weather Watchโšก๏ธ

We are now two months into the water year โ€” and a couple of days into meteorological winter โ€” and so far both are pretty weird.ย On the one hand, much of the West is covered by one of the scantest snowpacks for early December in decades. On the other, itโ€™s also been one of the wettest beginnings to the water year in recent memory.

Graph of 2026 water year snowpack levels for the Animas River watershed (which this year reflects that for most of western Colorado and the Upper Colorado River Basin), along with every year since 2000 that has started as sparsely or more so than this year. Note that the 2008 snowpack in the Animas was just as meagre in early December as it is this year. Then the snows came with a vengeance, leading to one of the biggest winters on record as well as a very healthy spring runoff that lasted well into July.
While snow levels are paltry, the weather gods have delivered plenty of precipitation to the region. While that has helped ease drought conditions, it is no substitute for a healthy snowpack.

Adding to the uncanniness has been the wave of generous storms that have dumped up to a foot of snow on Colorado ski areas and snarled traffic, leading to at least two multi-car pileups on I-70 and shutting down other arteries โ€” yet still failing to bring snowpack levels to anywhere near โ€œnormal.โ€

Itโ€™s a big olโ€™ mixed bag, in other words. The big October deluges eased the drought in much of the region, but the warm temperatures and snow drought donโ€™t bode well for next springโ€™s runoff. Meagre early winter snowpacks can make and have made dramatic comebacks (e.g. water year 2008 in southwestern Colorado), and another storm is moving into the region as I write this, yet the National Weather Serviceโ€™s is predicting an abnormally warm and dry winter for much of the Southwest.


๐ŸŒต Public Lands ๐ŸŒฒ

The Grand County commissionersโ€™ โ€œAccess and Capacity Enhancement Alternativeโ€ plan aimed at increasing visitation at Arches National Park was just the tip of an iceberg, it seems. Yesterday (Dec. 1), Commissioner Brian Martinez presented the plan to a group of state and federal officials at a closed State of Utah and National Park Service Workshop in Salt Lake City.


Moab seeks bigger crowds? — Jonathan P. Thompson


The meetingโ€™s purpose, according to the official agenda, is:

This may sound fairly innocuous (and maybe it is). But given some of the players, it may also be the latest volley in Utahโ€™s long-running effort to seize control of public lands. The meeting was run by the Interior Departmentโ€™s associate deputy secretary, Karen Budd-Falen, and Redge Johnson, who leads Utahโ€™s Public Lands Policy Coordinating Office.

Budd-Falen built her legal career on fighting federal agencies, including the Interior Department, and was part of the Sagebrush Rebellion and the Wise Use movements that endeavored to turn federal land over to states and counties and to weaken regulations on the extractive industries. Johnson, meanwhile, was a driving force behind the stateโ€™s effort to take control of 18.5 million acres of Bureau of Land Management land in the state.


A Sagebrush Rebel returns to Interior — Jonathan P. Thompson

An anti-BLM sticker (referring, presumably, to the federal land agency, not the Black Lives Matter movement) at another Phil Lyman rally against โ€œfederal overreachโ€ and motorized travel closures in southeastern Utah back in 2014. Photo credit: Jonathan P. Thompson/The Land Desk

Itโ€™s not clear what is meant when they say the meeting is aimed at achieving Trumpโ€™s agenda. As far as national parks go, the administration has been rather chaotic: Freezing hiring, laying off thousands of staff (only to rehire some of them), slashing budgets, and allowing visitors to run roughshod over the parks during the government shutdown.

It sure looks like they are trying to cause the parks to fail, which would give them an excuse to further privatize their functions. Private for-profit corporations already run the lodges, campgrounds, and other services inside many parks. Thatโ€™s why, during the shutdown, concessionaire-run campgrounds within parks continued to operate, while all of the government-run functions, such as entrance-fee-collection, were shuttered. In this way a false contrast was created between the functional privately-run operations and the dysfunctional public ones; visitors during that time would be excused for preferring the former.

The timing of this meeting, purportedly to receive input from gateway communities, is kind of odd. I have to wonder whether the Interior Department consulted local elected officials before raising entry fees for foreign visitors to $100 at Zion and Bryce Canyon National Parks in Utah, along with Grand Canyon, Acadia, Everglades, Glacier, Grand Teton, Rocky Mountain, Sequoia & Kings Canyon, Yellowstone, and Yosemite National Parks.

The Southwestโ€™s tourism industry is highly reliant on international visitors. Visitation from abroad is already down, thanks mostly to the Trump administrationโ€™s โ€œAmerica Firstโ€ creed and its general hostility to the rest of the world. Singling out foreign travelers for these higher fees โ€” even if only at the most popular parks โ€” is likely to dampen visitation from abroad even more, which will ripple through Western economies.

Grand Countyโ€™s bid to cram even more visitors into Arches National Park wonโ€™t be too effective if would be visitors donโ€™t even make it to the United States โ€ฆ


๐Ÿ—บ๏ธ Messing with Maps ๐Ÿงญ

This is just another old map that caught my attention, in part because itโ€™s a reminder of how extensive the railroad network was, even in the rugged parts of Colorado, back in the late 1800s and early 1900s. This one shows the Denver & Rio Grande rail lines in 1893.

Water trial of the century delayed — AlamosaCitizen.com #SanLuisValley #RioGrande

San Luis Valley Groundwater

Click the link to read the article on the Alamosa Citizen website:

December 3, 2025

January date scrapped in favor of June 29, 2026, after โ€˜key witness unavailabilityโ€™ โ€” four years after Fourth Amended Plan of Water Management was first approved by Subdistrict 1 and with the unconfined aquifer still in a historic decline

The San Luis Valleyโ€™s highly-anticipated district water court case โ€” the water trial of this century if you will โ€” originally scheduled to last five weeks beginning in January has been pushed back six months to the summer of 2026 due to the departure of a key witness in the fallout from a series of contentious October emails.

The Fourth Amended Plan of Water Management by Subdistrict 1 in the Rio Grande Water Conservation District has lived a precarious life without ever being implemented, going back to 2022 when it was originally crafted by subdistrict managers and January 2023 when it was adopted by Rio Grande Water Conservation District board.

Later came approval by the state engineer, and then after objections were filed against the new amended plan, Colorado Water Court Division 3 Judge Michael Gonzales set a trial date to commence on Jan. 5, 2026, and to last five weeks.

That is, until the week before Thanksgiving when Gonzales scrapped the January date in favor of June 29, 2026, some four years after the plan was first approved at the subdistrict level and the unconfined aquifer still in a historic decline. The judge did so after a series of emails sent by a key expert witness for the main objectors to the plan surfaced.

The effect is that a new plan to recover the Rio Grandeโ€™s unconfined aquifer, which has been approved at the local and state levels but still requires sign-off from district water court, remains  in limbo.

Following filings by the Northeast Water Users Association and Sustainable Water Augmentation Group requesting a six-month continuance to the start of the trial, and the Rio Grande Water Conservation District and state Division of Water Resources objecting to the request, Gonzales ruled the two main objectors challenging the new aquifer recovery plan had good reason to ask for a six-month continuance after Taylor Adams, an environmental and water resources engineer for Hydros Consulting in Boulder, resigned from the case due to โ€œpersonal and family circumstances.โ€ 

Adams was set to challenge the Subdistrict 1 water plan on a variety of engineering fronts until a series of emails he sent in October to State Engineer Jason Ullman and Senior Assistant Attorney General Preston Hartmann came to light. In one email, he tells Ullman, โ€œAlso, GFY.โ€ In another, he emails that he is โ€œno longer interested in anything other than publicly exploding the rampant corruption at DWR and the AG Office.โ€ 

And in an email sent Sunday, Oct. 19, to Attorney General Phil Weiser, Adams writes, โ€œWe havenโ€™t met, but I understand that youโ€™re running for governor of Colorado. You should know that if you continue this pursuit without addressing the persistent and laughable perjury that has been carried out in your name by Preston Hatman (sic) and Jason Ullman, you will be the subject of my attention throughout your campaignโ€ฆโ€

The Rio Grande Water Conservation District asked Gonzales not to delay the water court proceedings due to the urgency to recover the unconfined aquifer and the lack of โ€œcredible evidence that demonstrates that Mr. Adams is unavailable. Rather, they now assert that he โ€˜should not be pressured into returning to the case at the risk of further harm to his mental health.โ€™โ€

โ€œIn any event,โ€ district water attorneys argued in their objection to a trial delay, โ€œnone of this changes the fact that the unconfined aquifer is still over 1.3 million acre-feet below the water levels measured in 1976, and more than 830,000 acre-feet below the water levels previously determined by this Court and the Colorado Supreme Court to be sustainable.โ€

State Engineer Jason Ullman, consultant Taylor Adams, Colorado Water Court Division 3 Judge Michael Gonzales

Subdistrict 1 is home to the San Luis Valleyโ€™s richest crops of potatoes, barley and alfalfa. Without recovery of the shallow aquifer, the state is threatening mass shut down of groundwater pumping wells and requires both a master plan and annual replacement plans to show recovery efforts.

The subdistrictโ€™s proposed Fourth Plan of Water Management is its most drastic effort yet to meet the stateโ€™s orders. The new plan, crafted in 2022 and adopted by the Rio Grande Water Conservation District in January 2023, is designed to โ€œmatch the amount of groundwater pumping to the amount of water coming into the subdistrict.โ€

It does this through a 1-to-1 augmentation, meaning for every acre-foot of water used, an acre-foot has to be returned to the unconfined aquifer through recharging ponds. The amended plan relies on covering any groundwater withdrawals with natural surface water or the purchase of surface water credits.

Farmers in the subdistrict have expressed support for the plan, which includes a $500 per acre-foot overpumping fee that farmers would pay if they exceed the amount of natural surface water tied to the property in their farming operations. 

Objections are coming from farmers who do not have natural surface water coming into their property and around the steep fee for purchasing surface water credits from a neighboring operation to offset groundwater pumping irrigation. Both proponents and opponents of the plan say the $500 per acre-foot overpumping fee could put farmers who rely on groundwater pumping out of business.

The five-week water trial will sort through these issues in much more granular detail. With the trial date pushed back six months, any new strategy to recover the Valleyโ€™s ailing aquifer will shift into 2027 at the soonest.

San Luis Valley farm. Photo credit: Allen Best/Big Pivots

Bureau of Land Management nominee draws criticism from #conservation groups over support for selling public land — Micah Drew (UtahNewsDispatch.com)

Signage welcomes visitors to Bureau of Land Management land near Cedar City on Sunday, Feb. 2, 2025. (Photo by Spenser Heaps for Utah News Dispatch)

Click the link to read the article on the Utah News Dispatch website (Micah Drew):

December 4, 2025

Republicans are rallying around former New Mexico Rep. Steve Pearce, Trumpโ€™s nominee to oversee the land management agency

Conservation groups in Montana and across the West are raising concerns about Steve Pearce, a former New Mexico representative who is President Donald Trumpโ€™s newest nominee to lead the Bureau of Land Management. 

The nomination has reignited a fight over the management of public lands which was highlighted during negotiations over Trumpโ€™s โ€œOne Big Beautiful Billโ€ due to proposed amendments to sell off federal land. The fight also spawned two new bipartisan caucuses in Congress, both co-chaired by Montanans, and predicated on public land access and management. 

In Montana and the two Dakotas, the BLM manages more than 8.3 million acres of federal land. Nationwide, the BLM oversees 245 million acres of federal land, along with 700 million acres of subsurface rights for extraction and energy development, putting the position directly in the crosshairs of energy developers and outdoor industry groups. 

According to the Center for Western Priorities, Pearce amassed a โ€œlengthy anti-public lands record,โ€ sponsoring bills to shrink national monuments and increase extraction on national forest land. 

Many conservation groups are specifically honing in on Pearceโ€™s long record of advocating to sell off federal lands, including sponsoring legislation in Congress to authorize land sales or exchanges with local governments. 

In a letter to then-House Speaker John Boehner in 2012, Pearce wrote that of the federal lands located in the West, โ€œmost of it we do not even need.โ€

He proposed using land sales to reduce the deficit, similar to rhetoric heard earlier when Interior Secretary Doug Burgum equated federal lands to the nationโ€™s โ€œbalance sheet.โ€

โ€œWe cannot afford to hand the keys to 245 million acres of our public lands over to someone who has spent his career trying to auction them off to the highest bidder,โ€ Aubrey Bertram, staff attorney and federal policy director at Wild Montana, said. โ€œSteve Pearceโ€™s record is crystal clear: he believes public lands should be privatized for billionairesโ€™ benefit, not protected for the peopleโ€™s.โ€

But Pearceโ€™s nomination has been greeted with enthusiasm by mining and energy companies that operate on federal land, as well as by many Republican officials, including Montana Sen. Steve Daines.

โ€œI knew Steve in the House days, and Steve is a great pick. And I particularly like the fact that itโ€™s a Westerner,โ€ Daines said in an interview. โ€œI think itโ€™s helpful when we have leaders in those important positions that come from the West, when they understand uniquely the challenges we face as it relates to federal land, state land, private land. And Steve Pearce has lived it and breathed it.โ€

Daines is a member of the newly formed Senate Stewardship Caucus, which is co-chaired by Montana Sen. Tim Sheehy. 

The two Montanans also bucked their party earlier this year by joining Senate Democrats in a resolution that would have prevented the use of public land sales to reduce the deficit. 

Representatives for Daines and Sheehy did not respond to questions about Pearceโ€™s nomination. 

Sheehy has not publicly stated whether he will support Pearce. 

But Montanaโ€™s federal delegation has been supportive of increasing coal and energy extraction in the state. 

In eastern Montana, Congress recently voted to overturn a Biden-era restriction on resource extraction on federal land, reopening nearly 1.7 million acres to future coal leasing.  

All members of the stateโ€™s delegation supported the move calling it vital to the stateโ€™s economy and the nationโ€™s energy security.

Pearce has roots in the oil and gas industry that stretch beyond his political work. 

In the 1980s, Pearce founded an oilfield services company in New Mexico, which he later sold when he won his first election. 

Starting in 2003, he represented New Mexico in Congress for seven terms.

He lost races for the U.S. Senate in 2008 and governor in 2018. 

While conservation and public land advocates have pushed back against Pearceโ€™s nomination, industry groups have applauded Trumpโ€™s pick. 

The National Cattlemanโ€™s Beef Association said Pearceโ€™s experience makes him โ€œthoroughly qualified to lead the BLM and tackle the issues federal lands ranchers are facing.โ€

The Western Energy Alliance, comprising oil and gas companies across nine western states, also put out a statement of support for Pearce. 

โ€œAs a westerner coming from a state thatโ€™s nearly 20 percent BLM land, he understands the bureauโ€™s mission. As a former congressman and chair of the Congressional Western Caucus, his record shows heโ€™s been a champion of multiple-uses of public lands. Steve has been a longtime friend who understands the value of energy development among other uses,โ€ the Alliance said. 

This story was originally produced by Daily Montanan, which is part of States Newsroom, a nonprofit news network which includes Utah News Dispatch, and is supported by grants and a coalition of donors as a 501c(3) public charity.

This map shows land owned by different federal government agencies. By National Atlas of the United States – http://nationalatlas.gov/printable/fedlands.html, “All Federal and Indian Lands”, Public Domain, https://commons.wikimedia.org/w/index.php?curid=32180954

Might good come from the NREL name change?: Maybe, but also plentiful skepticism about scrubbing of โ€˜renewable energyโ€™ from name of laboratory by President Trumpโ€™s teamย  — Allen Best (BigPivots.com)

National Renewable Energy Laboratory

Click the link to read the article on the Big Pivots website (Allen Best):

December 2, 2025

Changing a name is simple enough, if somewhat expensive and time-consuming, at least in the case of businesses.

But what to make of the National Renewable Energy Laboratoryโ€™s new name? Is the change all bad for the laboratory and for its mission of the last 34 years?

It became National Laboratory of the Rockies as of Monday. It had been known as NREL since 1991 and before that had been the Solar Energy Research Institute since its founding in 1977 during the presidency of Jimmy Carter.

The laboratory has become one of the nationโ€™s โ€” and perhaps the worldโ€™s โ€” seminal institutions devoted to engineering an energy transition. As of October, it had 3,717 employees after a reduction of 114 during May.

โ€œClearly an effort is underway (by President Donald Trump)โ€š to downplay renewable energy as a premier, viable energy source in the United States. So it is hard to separate the politics from this given the timing,โ€ said David Renee, who worked at the laboratory from 1991 until his recent retirement.

Renee said that in part he was very disappointed to see the words โ€œrenewable energyโ€ deleted from the name but does see the new name allowing the institution to broaden its mission to reflect needs of the ever-more-complex electrical grid.

โ€œI can see some good, long-term benefits from this. It gives the laboratory flexibility to have a broader scope,โ€ he said. โ€œA lot of the work is not exclusively related to renewable energy but more related to grid reliability and expansion, of which renewables play an important part. So one could argue that the name change was overdue anyway in order to be consistent with other national laboratories, which are mostly named for their locations and not the technology.โ€

The United States has 17 national laboratories engaged in energy and other research, and most are named for their local geographies. New Mexico, for example, has the Sandia and Los Alamos labs, the former named for a mountain range and the latter a town. Renee arrived in Golden from the Pacific Northwest National Laboratory and retired after running the solar resource assessment program.

Ron Larson, one of the earliest employees of the solar institute who arrived in 1977, a time when solar was 100 times more expensive than it is now, also tends toward a charitable view of the name change.

A possible reason, and a valid one, he said, could be that other national labs wanted more to do on renewable energy topics and are qualified to do so. โ€œToo, maybe some at NREL have wanted to expand into other sectors, including fossil fuels and nuclear.โ€


See: โ€œJimmy Carterโ€™s overlooked Colorado nexusโ€ Big Pivots, Jan. 2, 2025.


Peter Lilienthal, an NREL employee from 1990 to 2007, when he formed an energy-related business, was less charitable. He was incensed by a statement from Audrey Robertson, the assistant secretary of energy, in Mondayโ€™s announcement.

โ€œThe energy crisis we face today is unlike the crisis that gave rise to NREL,โ€ Robertson said. โ€œWe are no longer picking and choosing energy sources. Our highest priority is to invest in the scientific capabilities that will restore American manufacturing, drive down costs, and help this country meet its soaring energy demand. The National Lab of the Rockies will play a vital role in those efforts.โ€

Lilienthal called that statement gaslighting. โ€œThat is just not true,โ€ he said of Robertsonโ€™s assertion about no longer picking energy sources. He points to the promises of President Donald Trump on the campaign trail and elsewhere to restore fossil fuels and discourage renewable energy. This, he said, will slow the energy transition away from fossil fuels, he believes.

Jud Virden, the director of the renamed laboratory since October, said the new name โ€œembraces a broader applied energy mission entrusted to us by the Department of Energy to deliver a more affordable and secure energy future for all.โ€

That statement clearly fits in with the narrative of Chris Wright, the Colorado-born director of the Department of Energy. A graduate of Cherry Creek High School, in south Denver, Wright was a rock climber and skier before going to the Massachusetts Institute of Technology to study engineering, first mechanical and then electrical. He also later studied at the University of California at Berkeley.

In April, Wright returned to Colorado to tour NREL. Afterward, he met with reporters, where he said that he had worked on solar energy during graduate school and then geothermal. Only later, needing a paycheck, did he begin work in the oil and gas industry. In Denver, he founded Liberty, an oil and gas field services company, in 2011.

In his remarks, Wright did not dismiss renewable energy, but he did โ€” as he had done before โ€” dismiss โ€œclimate alarmism.โ€ He said the science does not support the perception of risk that has, in part, driven the work to make renewable energy affordable and integrated into the electrical grid.

Wright sees the need for more energy being paramount and climate change worries a hindrance to archiving that plentitude that will result in higher standards of living.

โ€œThe biggest barrier to energy development the last few decades is people, for political reasons, calling climate change a crisis,โ€ he claimed.

He went on to cite 3 million people dying every year because they donโ€™t have clean cooking fuels or the 4 or 5 million people dying because they donโ€™t have sufficient food as well as the disconnect notices to American consumers for non-payment.

โ€œIf you call climate change a crisis and you donโ€™t look at any data, you can pass laws to do anything.

Chris Wright has argued that energy scarcity poses a greater threat to quality of life than climate change. Here, he speaks to reporters in April 2025 while Martin Keller, then the director of NREL, looks on. Photo/Allen Best. Top image/National Laboratory of the Rockies.

In an essay published in The Economist in July, Wright said much the same thing.


See: โ€œClimate change is a product of progress, not an existential crisis.โ€


Wright also talked about the need to deliver plentiful energy and lowering energy prices. He talked about the drive to integrate artificial intelligence data centers into the U.S. economy.

โ€œArtificial Intelligence is critical. This is a phenomenal new technology. People are seeing the great consumer services it provides, the business efficiencies it provides, and we are very early on.โ€

And again, he talked about the need to expand electrical production as necessary to support artificial intelligence. Even without strong demand for data centers, he said, electricity prices have been rising.

โ€œWeโ€™ve seen 20 to 25% rise in the price of electricity over the last four years. Americans are mad and angry and upset about that, which is why theyโ€™re all worried about AI โ€” โ€˜No, we donโ€™t want new demand on our grid thatโ€™s just going to make our prices more expensive.โ€™ โ€” We need to show them we can walk and chew gum at the same time. Weโ€™ve got to grow our electricity production capacity without raising the prices to consumers, and weโ€™ve got to keep our grid stable, not just the complicated system stable, but the increasing cyber threats of people that want to do us harm on our grid.โ€

Chuck Kutscher took a broad view of the change. A mechanical engineer by training, he began working at NREL in the 1980s before retiring in 2018.

โ€œNREL is widely viewed as the leading renewable energy laboratory in the world. In the U.S. and throughout the world, solar and wind dominate the new electricity generation being deployed because they are now the lowest in cost and are also the fastest to deploy, in addition to avoiding air pollution and greenhouse gas emissions. China is clearly the world leader in renewable energy development and deployment, but NREL has played a critical role in keeping the U.S. competitive,โ€ he said in a statement.

โ€œAs a Department of Energy lab, NREL takes direction from DOE. The current administration made it clear in the last election that it would support fossil fuels. DOE does have a lab that focuses primarily on fossil fuels, the National Energy Technology Lab, so continuing to have a lab that performs R&D on renewables makes perfect sense, especially given the transition to renewable energy happening around the world. Iโ€™m sure the new lab director is working hard to preserve NRELโ€™s tremendous expertise and important work in renewable energy while at the same time being responsive to DOE directives to strengthen the labโ€™s portfolio in areas such as AI and data centers.โ€

The Crossing Trails Wind Farm between Kit Carson and Seibert, about 150 miles east of Denver, has an installed capacity of 104 megawatts, which goes to Tri-State Generation and Transmission. Photo/Allen Best

Autumn Rains Delay Basin-wide Reservoir Depletion — Jack Schmidt (Center for #ColoradoRiver Studies) #COriver #aridification

Click the link to read the article on the Center for Colorado River Studies website (Jack Schmidt):

In Brief
Unusually wet conditions in the Basin in October and November 2025, combined with reduced releases from some reservoirs, led to a basin-wide increase in storage for the two-month period. The combined contents of Lake Powell and Lake Mead increased during the two months for only the second time since 2010, and storage in the San Juan River basin increased by 19%, especially in Vallecito and Navajo Reservoirs. These changes were a welcome respite from the relentless depletion of storage that has dominated the last few years. Nevertheless, the upcoming winter snow season is predicted to be below average, and total active storage in the Basin is less than a 2 year supply when compared with recent Basin-wide consumptive uses and losses.

Total precipitation (inches) from 9-15 October 2025 with gridded data from the PRISM Climate Group and observations from the Community Collaborative Rain, Hail, and Snow (CoCoRaHS) network. Credit: Russ Schumacher/Colorado Climate Center
The Details

The rains of October and November 2025 slowed depletion of the Colorado Riverโ€™s reservoirs due to increases in stream flow and reduced reservoir releases in some places. Water levels rose in a few reservoirs, and autumnโ€™s rains provided a small bit of flexibility for water managers at the beginning of what is likely to be a below-average winter snow season.

As of November 30, the Basinโ€™s 46 reservoirs held 24.63 million af (acre feet) of active storage[1], of which 90% was in 12 federal reservoirs,[2] including 15.00 million af in Lake Powell and Lake Mead (hereafter, Powell+Mead) and 4.88 million af in 8 federal reservoirs upstream from Lake Powell (Fig.1). This amount of storage is similar to conditions in early 2022, a situation that was described at that time as a crisis. If we divide the total active storage in the Basinโ€™s 46 reservoirs by the basin-wide total annual rate of consumptive use and loss that was 12.7 million af in 2024, the basin-wide reservoir water supply would sustain Basin-wide use for less than 2 years. We continue to live at the doorstep of crisis.

Figure 1. Graph showing active storage in Colorado River basin reservoirs between January 1, 2021, and November 30, 2025. Credit: Jack Schmidt/Center for Colorado River Studies

Basin-wide reservoir storage stabilized in October and November, because Powell+Mead storage stabilized and storage in the San Juan River basin increased. Total Inflow to Lake Powell exceeded releases for more than one week between October 11 and October 18, when Lake Powell increased by 105,000 af[3]ย ย which is a 1.6% gain (Fig. 2). Approximately 40% of the total inflow came from the San Juan River, and the monthly October inflows were the largest since 2015. The gain in storage in Lake Powell during this weeklong period exceeded depletions during the rest of the month, and Lake Powell gained approximately 52,000 af during the month. Lake Powell lost 147,000 af in November.

Figure 2. Graph showing inflow and outflow from Lake Powell and active storage between October 1 and November 30, 2025. Total monthly flow at Lees Ferry, representing the total releases from Lake Powell, were 490,000 af in October and 501,000 af in November. Credit: Jack Schmidt/Center for Colorado River Studies

In contrast, the autumn rains did not significantly increase inflow to Lake Mead, because most of the inflows come from scheduled releases from Lake Powell. These reservoir releases were supplemented by 101,000 af of inflows downstream from Lees Ferry[4]ย and 8000 af from the Virgin River.[5]ย The most significant changes in Lake Mead occurred at the end of November when releases from Hoover Dam were significantly reduced (Fig. 3).

Figure 3. Graph showing inflow and outflow from Lake Mead and active storage between October 1 and November 30, 2025. Total monthly flow inflow of the Colorado River, representing the total releases from Lake Powell and inflows within Grand Canyon, were 574,000 af in October and 550,000 af in November. Reservoir releases from Hoover Dam were 485,000 af in October and 415,000 af in November. Withdrawals and return flows of the Southern Nevada Water Authority were not included in these data. Credit: Jack Schmidt/Center for Colorado River Studies

Together, total active storage in Powell+Mead increased by 63,000 af during October,[6]ย and decreased by only 38,000 af in November (Fig. 4).[7]ย  More significant than the gains, however, was that the the pace of reservoir depletion was significantly slowed. Storage in Powell+Mead increased by approximately 25,000 af in October and November, only the second time since 2010 that total storage in these two reservoirs increased during these two months.[8]

Figure 4. Graph showing active storage in Lake Powell, Lake Mead, and in Powell+Mead between January 1, 2023, and November 30, 2025. Credit: Jack Schmidt/Center for Colorado River Studies

Reservoir storage in the San Juan River basin increased more than in any other part of the Colorado River Basin. Five San Juan basin reservoirs increased by 197,000 af in October and November, mostly in Navajo and Vallecito Reservoirs.[9]ย Not much happened elsewhere, however. The 21 reservoirs of the upper Colorado River watershed lost 57,000 af during October and November, and 16 reservoirs in the Green River watershed lost 10,000 af during the same period.

  • [1]ย Active storage in 46 reservoirs are reported by Reclamation atย https://www.usbr.gov/uc/water/hydrodata/reservoir_data/site_map.html.
  • [2]ย Taylor Park, Blue Mesa, Morrow Point, Crystal, Fontenelle, Flaming Gorge, Vallecito, Navajo, Lake Powell, Lake Mead, Lake Mohave, and Lake Havasu.
  • [3]ย Inflow to Lake Powell was computed as the sum of mean daily discharge of the Colorado River at Gypsum Canyon near Hite (gage 09328960), Dirty Devil River above Poison Springs near Hanksville (09333500), Escalante River near Escalante (09337500), and San Juan River near Bluff (09379500), as reported by the U.S. Geological Survey. Outflow from Lake Powell was computed as the mean daily discharge of the Colorado River at Lees Ferry (09380000), because stream flow is measured 15 miles downstream from the dam and includes ground-water seepage around the dam.ย  Lake Powell storage increased between October 10 and October 20, as reported by Reclamation.
  • [4]ย Inflows within Grand Canyon were calculated as the difference between measurements of the Colorado River at Lees Ferry (09380000), Colorado River above Diamond Creek near Peach Springs (09420000), and Diamond Creek nr Peach Springs (09404208).
  • [5]ย Virgin River below confluence Muddy River near Overton (09419530)
  • [6]ย Between October 1 and November 1, 2025, active storage in Lake Powell increased 52,000 af and 11,000 af in Lake Mead.
  • [7]ย Between November 1 and November 30, active storage in Lake Powell decreased by 147,000 af and increased by 109,000 af in Lake Mead.
  • [8]ย During the previous 15 years between 2010 and 2024, total storage in Powell+Mead increased by 36,000 af in 2011. During the other 14 years of that period, the median depletion of Powell+Mead was 436,000 af.
  • [9]ย Storage in Navajo Reservoir increased 126,000 af between October 9 and November 8 and increased by 114,000 af in October and November. Active storage in Vallecito Reservoir gained 68,000 af in October and November. At the end of November, Navajo Reservoir was 60% of its 1.65 million af capacity. Vallecito Reservoir was 77% of its 125,400 af capacity.
Map of the San Juan River, a tributary of the Colorado River, in Arizona, Colorado, New Mexico and Utah, USA. Made using USGS National Map data. By Shannon1 – Own work, CC BY-SA 4.0, https://commons.wikimedia.org/w/index.php?curid=47456307

Albuquerqueโ€™s warmest fall in history — John Fleck (InkStain.net) #RioGrande

A warm fall in Albuquerque 2025. Credit: John Fleck/InkStain

Click the link to read the article on the InkStain website (John Fleck):

December 3, 2025

Inspired by this morningโ€™s Downtown Albuquerque News Climate and Transport Index (come for the bus boardings and river flow data, stay for the Shawarma restaurant news), I give you data, one of those โ€œScience confirms the obvious, but with graphs!โ€ things.

The overnight lows were 2.5F higher than the recent average. I wonder if that sensibly improves your quality of life if youโ€™re sleeping rough?

The Rio Grande (Rio del Norte) as mapped in 1718 by Guillaume de L’Isle. By Guillaume Delisle – Library of Congress Public Domain Site: http://hdl.loc.gov/loc.gmd/g3700.ct000666, Public Domain, https://commons.wikimedia.org/w/index.php?curid=7864745

Coyote Gulchโ€™s excellent EV adventure Thanksgiving 2025: White knuckle drive across #Missouri

Kia Niro charging at a Flying J facility in Missouri December 1, 2025.

Getting to my daughter’s house was smooth sailing but the drive home was long and unsettling. It snowed Saturday in eastern Missouri so we hunkered down and worked on a jigsaw puzzle she purchased from the Endangered Wolf Center in Eureka.

I kept an eye on the NWS Kansas City Twitter feed noting that a storm was expected to hit KCMO around 9:00 AM on Monday. My thinking was to hit the road very early in the morning and drive into the storm there. On Monday the storm had already hit and was moving east towards me along Interstate 70.

East of Columbia I drove into the storm. It was not white out conditions but the snow was nice and wet and the roads became icy and snow packed, but well-traveled, and MODOT had the plows out. My daughter texted me that I-70 was closed between Columbia and Kansas City but I hoped that the wreckage would be cleared and the highway reopened before I got there.

As luck would have it the highway was opened back up but that stretch was littered with tractor trailer rigs and passenger cars in the median and off the side of the highway. About 40 miles from Kansas City the NWS office said that another wave of snow was moving into the metro area. It was getting dark so I checked into a hotel in Higginsville hoping that conditions would improve knowing that it is easier to drive in the snow during daylight.

The drive through Kansas City Tuesday morning was okay but slow-going with ice on the roadway in places and rush hour traffic filled with folks hurrying to their destinations. As I hoped, the highway dried out west of there and I was back up to the speed limit from there to Limon.

I had decided to drive all the way to Denver to avoid the storm there that was forecast to move in after midnight. The storm moved into the area early and I drove into it just east of Bennet which was a bummer.

The Kia Niro handled well in the crappy conditions. It is a nice EV but the one Avis rented me did not have battery conditioning for charging so I was at the mercy of battery temperature which made it slow to charge much of the time.

I had driven the route in my Leaf before which required a CHAdeMOย connecter so I missed the proliferation of fast chargers along I-70. You can be assured that you will find sufficient places to fuel up your EV all along the route.

Next up, the CRWUA 2025 Conference in Las Vegas December 16-19, 2025.

#Drought news December 4, 2025: As of December 2, the NRCS SNOTEL network reported the following region-level (2-digit HUC) snow-water equivalent (SWE) levels: Missouri 47%, Upper Colorado 53%, Great Basin 39%, Lower Colorado 121%, Rio Grande 64%, and Arkansas-White-Red 53%

Click on a thumbnail graphic to view a gallery of drought data from the US Drought Monitor website.

Click the link to go to the US Drought Monitor website. Here’s an excerpt:

This Week’s Drought Summary

This U.S. Drought Monitor (USDM) week saw improvement in drought-related conditions across areas of the West, Plains, Midwest, South, Southeast, and the Northeast. Out West, improvements continued in areas of eastern California and southern Nevada, where conditions since the beginning of the Water Year (October 1) have improved significantly. As of early December, mountain snowpack conditions continue to be well below normal levels for the time of year across much of the western U.S., except for isolated areas of the Southwest and southern Rockies, where recent storms have boosted snowpack conditions well above normal levels. As of December 2, the Natural Resources Conservation Service (NRCS) SNOw TELemetry (SNOTEL) network reported the following region-level (2-digit HUC) snow-water equivalent (SWE) levels: Pacific Northwest 43%, Missouri 47%, Upper Colorado 53%, Great Basin 39%, Lower Colorado 121%, Rio Grande 64%, and Arkansas-White-Red 53%. In California, the statewide snowpack was 39% of normal (December 3), with the Southern Sierra at 78%, Central Sierra at 36%, and Northern Sierra at 17%. Elsewhere on the map, conditions continued to improve in drought-affected areas of central and northeastern Texas, where precipitation during the past month has been above normal. In the Southeast, drought conditions have intensified in recent months, both in spatial extent and intensity, including in southern Georgia and Florida Panhandle where soil moisture and streamflow levels have dropped significantly in recent weeks. In the Northern Plains, Midwest, and Northeast, moderate-to-heavy snowfall accumulations provided some minor relief to drought-affected areas…

High Plains

On this weekโ€™s map, only minor changes were made in the region. In eastern Kansas, two areas of lingering Moderate Drought (D1) were removed in response to improving conditions during the past 90-day period. For the week, some beneficial snowfall was observed across the northern Plains, with accumulations ranging from 1 to 14 inches. The highest accumulations were logged in areas of North Dakota. In terms of average temperatures, cooler-than-normal temperatures (5 to 20+ degrees F below normal) were observed across the region, with the greatest anomalies observed in the Dakotas. According to NWS NOHRSC, the Upper Midwest region is currently 94.4% covered by snow (area) with an average depth of 3.7 inches and a maximum depth of 22.2 inches…

West

Out West, recent storms and overall improving conditions on short-term indicators (precipitation, soil moisture, streamflows) led to improvements on the map in California (eastern Sierra, Mojave Desert), Nevada (west-central, southern), Utah (southwestern), Wyoming (central, southwestern), Montana (northwestern, central, northeastern), and Washington (southeastern). Conversely, degradations were made on the map in areas of Oregon (central, southern), Idaho (west-central), Wyoming (southeastern), Colorado (central, north-central), and New Mexico (southeastern). For the week, most of the region experienced dry conditions except for portions of the Pacific Northwest and isolated areas in the central and northern Rockies. In the Pacific Northwest, light-to-moderate precipitation accumulations were observed along the coastal areas of northwestern Oregon and western Washington. Despite this weekโ€™s storm activity, significant precipitation deficits (2 to 10 inches since October 1) remain, with the greatest anomalies observed in the Olympic Peninsula and Cascade Range. In terms of the snowpack out West, below-normal SWE levels are being observed at SNOTEL stations across most of the West, except for areas in the southern Sierra, Colorado Plateau, and southwestern Colorado. In California, the NWS Forecast Office in Los Angeles is reporting that November was one of the wettest Novembers in the last 50+ years across southwestern California. Moreover, the city of Santa Barbara has reported the wettest water-year start on record through November with over 9.5 inches observed. Other areas in Santa Barbara County, including areas of the Santa Ynez Mountains, have received over 15 inches for the contemporaneous period…

South

On this weekโ€™s map, widespread improvements were made in drought-affected areas of Texas, while isolated areas of Oklahoma, Mississippi, Louisiana, and Tennessee saw minor improvements in response to rainfall activity during the past week. The heaviest rainfall accumulations were observed in isolated areas along the Gulf Coast of southeastern Texas, while lesser accumulations (ranging from 1 to 2 inches) were observed in other areas of the region including eastern and southern Texas, Louisiana, southeastern Oklahoma, southern Arkansas, northern Mississippi, and eastern Tennessee. In western Texas, conditions on the map deteriorated in response to drier-than-normal conditions during the past 90-day period. Looking at climatological rankings for the past 30-day period (November 2 to December 2), Austin, TX was 10th driest (-2.31-inch departure), College Station, TX 9th driest (-2.54 inches), New Orleans, LA 8th driest (-3.32 inches), Slidell, LA 2nd driest (-3.49 inches), and Hattiesburg, MS driest on record (-3.71 inches). In Texas, Water for Texas (December 3) reported statewide reservoirs at 74% full, with numerous reservoirs in the eastern part of the state in very good condition, while numerous reservoirs in the southern and western portion of the state were experiencing continued below-normal levels, including at Falcon Reservoir along the Rio Grande River (15.9% full). In terms of drought-related impacts, the National Drought Mitigation Centerโ€™s Conditions Monitoring Observer Reports (CMOR) tool showed numerous impact reports during the past 30-day period with the highest concentration of reports yielding from southern Oklahoma, northern Arkansas, and northern Louisiana. For the week, average temperatures were below normal across most the region with anomalies ranging from 4 to 10 degrees F above normal…

Looking Ahead

The NWS 7-day quantitative precipitation forecast calls for the heaviest rainfall (2 to 5 inches) to be along the central Gulf Coast, including southern Louisiana, southern Mississippi, southern Alabama, and the western Florida Panhandle, while 1 to 4 inches is expected in southern Georgia and areas of coastal South Carolina. The southern extent of the Mid-Atlantic coast is forecast to receive 1 to 3 inches, while New England is expected to have totals less than 1 inch. In the Pacific Northwest, 2 to 7+ inches (liquid) of precipitation is expected across western portions of Washington and Oregon, while the Northern Rockiesโ€”including northern Idaho, western Montana, and western Wyomingโ€”are forecast to receive liquid totals ranging from 1 to 3 inches. These values represent liquid precipitation and may fall as rain or snow; actual snowfall amounts will vary depending on temperature and snow-to-liquid ratios. Meanwhile, much of the Intermountain West, Desert Southwest, and the central and southern Great Basin is expected to remain mostly dry, although northern portions of Utah and Colorado are forecasted to observe totals ranging from 0.25 to 2.0 inches. Across the Plains and Midwest, precipitation totals are expected to be less than 0.5 inch.

The 6โ€“10-day temperature outlook (valid December 9 โ€“13, 2025) calls for above-normal temperatures across the western U.S., much of the Plains, and Texas, with the highest probabilities centered over the Far West and Great Basin. Below-normal temperatures are favored across the eastern United States, with the highest probabilities in the Northeast and portions of the northern Mid-Atlantic and Great Lakes. Near-normal temperatures are expected across a narrow swath extending from the Lower Mississippi Valley through the eastern portions of the Dakotas. In terms of precipitation, the 6โ€“10-day outlook calls for below-normal precipitation across the southern half of the continental United States, including California, Great Basin, southern half of the Intermountain West, South, and much of the Southeast. Above-normal precipitation is forecasted for much of the northern tier of the continental U.S., including the Pacific Northwest, Northern Plains, Upper Midwest, and the Northeast. Near-normal precipitation is expected across the Lower Midwest and southern Florida.

US Drought Monitor one week change map ending December 2, 2025.

Just for grins here’s a slideshow of early December US Drought Monitor maps for the past few years.

Inside #Wyomingโ€™s fight against cheatgrass, the โ€˜most existential, sweeping threatโ€™ to western ecosystems — Mike Koshmrl (WyoFile.com)

A patch of cheatgrass, pictured here in January 2025, emerged from a mountainside along the east shore of Flaming Gorge Reservoir. Cheatgrass has steadily invaded the lower Green River Basin, about half of which “needs attention,” according to the Sweetwater County Weed and Pest District. (Mike Koshmrl/WyoFile)

Click the link to read the article on the WyoFile website (Mike Koshmrl):

December 1, 2025

An all-hands-on-deck effort, tens of millions in funding and a breakthrough herbicide are slowing but not halting a destructive force steadily enveloping the best sagebrush left on Earth.

POWDER RIVER BASINโ€”Brian Mealor scanned the prairie east of Buffalo, but his mind drifted west to a haunting scene in northern Nevada.ย 

In the burn scar of the Roosters Comb Fire, a single unwelcomed species had taken over, choking out all competitors. Mealor saw few native grasses or shrubs, scarcely a wildflower. 

Not even other weeds.

โ€œLiterally everything you see is cheatgrass,โ€ Mealor recalled of his June tour of the scar. โ€œI just stood there, depressed.โ€

A sea of cheatgrass photographed about 20 miles north of Battle Mountain, Nevada, off of Izzenhood Road. (Claire Visconti/University of Wyoming)

Mealor already knew plenty about the Eurasian speciesโ€™ capacity to decimate North American ecosystems since he leads the University of Wyomingโ€™s Institute for Managing Annual Grasses Invading Natural Ecosystems. But he was still shocked walking through the endless cheatgrass monoculture taking over the 220,000 once-charred acres northwest of Elko. 

The same noxious species, he knew, is steadily spreading in Wyoming.

The ecological scourge made Silver State officials so desperate that they were planting another nonnative, forage kochia, because it competes with less nutritious cheatgrass and offers some nourishment for native wildlife, like mule deer. 

โ€œTheyโ€™ll just die, because thereโ€™s nothing there,โ€ Mealor said. โ€œThatโ€™s why we have to do stuff. Because we could turn into that.โ€ 

Brian Mealor, center, looks off into the sagebrush along the outskirts of the House Draw Fire scar near Buffalo in November 2025. The 2024 blaze eliminated over 100,000 acres of core sage grouse habitat, including 18 active leks. (Mike Koshmrl/WyoFile)

Scientists, rangeland managers and state and county officials are doing everything in their power to prevent Wyoming from becoming another landscape lost to cheatgrass. Thereโ€™s a powerful new herbicide thatโ€™s helping. And funds enabling the spraying of hundreds of thousands of acres are being secured and raised. Yet, Wyoming is still losing its cheatgrass fight, and ultimately far more resources are needed to turn it around.

โ€œLetโ€™s not kid ourselves,โ€ said Bob Budd, executive director of the Wyoming Wildlife and Natural Resource Trust. โ€œThe magnitude of the need is utterly staggering. Weโ€™re talking hundreds of millions of dollars over the next decade. Thatโ€™s daunting.โ€

Budd voiced that warning Tuesday while addressing a statewide group that focuses on bighorn sheep, which depend on seasonal ranges being invaded by cheatgrass. A recent study co-authored by Mealor underscores the need to act soon to protect Wyomingโ€™s wildlife. UW researchers concluded that cheatgrass, which is only edible in spring, could cost northeast Wyomingโ€™s already struggling mule deer half their current habitat in the next couple of decades.

Eighteen months ago, green sagebrush plants would have dominated this vista all the way to the horizon in the Powder River Basin. Today, because of the House Draw Fire, itโ€™s a golden prairie โ€” the lighter-hued portions are dominated by invasive cheatgrass and Japanese brome. (Mike Koshmrl/WyoFile)

On Nov. 6, the Sheridan-based professor joined fellow academics, biologists and volunteers on a field trip to a mixed-grass prairie. Like the Nevada burn scar, this was a Wyoming landscape on the mend from wildfire. In fact, it wasnโ€™t a grassland until last year. 

Before Aug. 21, 2024, the ground where they stood had been considered the best of whatโ€™s left of northeast Wyomingโ€™s sagebrush biome. 

Transformation

A lightning storm that sparked a conflagration abruptly ended that era. Over the course of two days, the House Draw Fire tore a 10-mile-wide, almost 60-mile-long gash into the landscape, inflicting over $25 million in damage. In a fiery blink, the native plant community mostly disappeared. 

Once-prized sagebrush within roughly 100,000 acres of the burn area is basically gone, a worrisome loss of habitat for the regionโ€™s already struggling sage grouse. What grew back isnโ€™t a monoculture, like in Nevada. Native species are easily found. But portions of the Powder River Basinโ€™s rolling hills are now dominated by big densities of cheatgrass and Japanese brome, another invasive annual grass. Without mature sagebrush shrubs to compete with, thereโ€™s reason to believe the invaders, which flourish with fire, will expand their grip. 

โ€œItโ€™s not like you have a fire and all of a sudden youโ€™re just completely covered with cheatgrass,โ€ Mealor said. โ€œThereโ€™s a lag.โ€

Cheatgrass grows in thick amid sagebrush southeast of Buffalo, adjacent to the House Draw Fire scar. (Mike Koshmrl/WyoFile)

The Johnson County Natural Habitat Restoration Team is throwing everything it can at the fire scar to try to prevent invasive grasses from taking over. Armed with $12 million in state funds, crews will aerially spray some 120,000 acres with a cheatgrass-killing herbicide. Aerial sagebrush seeding is also underway on 3,000 acres of burned-up sage grouse nesting habitat. And there are even funded plans to build hundreds of simple erosion-controlling Zeedyk structures to protect the wet meadows within the fire scar. 

Yet, on a broader scale, Mealor is a realist about the immense challenge of keeping cheatgrass and its noxious counterparts at bay in Wyoming, let alone enabling sagebrush to stage a comeback โ€” a costly, complicated feat

โ€œIf we were talking about a 25,000-acre fire here and there,โ€ Mealor said, โ€œit would be a little different.โ€ 

About a half-million acres of northeastern Wyoming burned in 2024, the stateโ€™s second-largest fire year in modern history. Wyoming lawmakers agreed to carve out $49 million for wildfire recovery grants statewide, less than half of Gov. Mark Gordonโ€™s requested amount. Optimistically, Mealor said, the awarded sum might be enough to treat a million acres. That sounds significant โ€” itโ€™s half the acreage of Yellowstone. But cheatgrass is spreading just about everywhere in a state that spans 62 million acres.

Gov. Mark Gordon gives his State of the State address Feb. 12, 2024, at the Capitol in Cheyenne. (Ashton J. Hacke/WyoFile)`

โ€œIf you think about it from a statewide level, itโ€™s not a lot,โ€ Mealor said of the funding. โ€œThatโ€™s not an attack. Iโ€™m not downplaying the importance of the money that was set aside by the Legislature for this. Itโ€™s a lot of money. But itโ€™s also not enough.โ€ 

The governor, whoโ€™s a rancher by trade, has voiced the same concern. Pushing for $20 million in cheatgrass spraying funds during the Legislatureโ€™s 2024 budget-making process, Gordon acknowledged Wyoming is โ€œlosing the battleโ€ against invasive annual grasses. Lawmakers ultimately agreed to $9 million, less than half the requested amount, according to the budget

โ€˜Best of the bestโ€™

The incursions that cheatgrass, Japanese brome and fellow invasives medusahead and ventenata are making into Wyoming rangelands are significant because of whatโ€™s at stake. The Equality State is the cornerstone of what remains of the sagebrush-steppe biome, a 13-state ecosystem vanishing at a rate of 1 million-plus acres per year.  

โ€œHalf of the best of the best is in Wyoming,โ€ said Corinna Riginos, who directs the Wyoming science program for The Nature Conservancy. 

In 2020, the U.S. Geological Survey, U.S. Fish and Wildlife Service and Western Association of Fish and Wildlife Agencies completed a conservation plan to proactively restore the United Statesโ€™ declining sagebrush habitat. This map from the plan illustrates Wyomingโ€™s importance, being the stronghold of the biome. (USGS)

The Lander-based scientist is spearheading a Camp Monaco Prize-winning project that seeks to safeguard the Greater Yellowstone Ecosystem from cheatgrass. The flanks of the ecosystem, such as the Golden Triangle, southwest of the Wind River Range, contain some of the most expansive unbroken tracts of sagebrush remaining on Earth. Distribution maps show that almost all of those areas are in Wyoming. Itโ€™s no coincidence that the same places also host remarkable biological phenomena, like the worldโ€™s largest sage grouse lek and longest mule deer migration

Riginosโ€™ research is focused on defensive measures to catch and kill cheatgrass early on, when it exists at low levels. Keeping the invasion out of core tracts of sagebrush, she said, is a more efficient use of funds than trying to shift heavily contaminated landscapes back to what they used to be. 

โ€œMaybe we live with what they are, we cope with it, rather than trying to recover from it,โ€ Riginos said of cheatgrass-dominated areas. 

Cheatgrass grows where reddish stripes appear on the hillsides leading up to Washakie Reservoir in June 2024. The green stripes are where an herbicide, Indaziflam, was experimentally applied. Rangeland managers have since scaled up the effort, funding 16,000 acres of cheatgrass removal in the Washakie Park area. (Mike Koshmrl/WyoFile)

Within Wyoming, invasive grass experts donโ€™t have to go far from the worldโ€™s most unsullied sagebrush stands to find heavily infested landscapes. In June 2024, Riginos toured cheatgrass treatments in the Wind River Indian Reservationโ€™s Washakie Park area. Although they stood about 40 straight-line miles from the Golden Triangle, scientists, wildlife managers and weed experts on the tour were surrounded by hillsides purple-hued from cheatgrass. 

โ€œYou have to respect it, as an organism,โ€ Riginos said. โ€œThe adaptability and just kind of sheer ability to get a toehold and take over is pretty remarkable.โ€

Cheatgrass gets its name from its ability to โ€œcheatโ€ surrounding vegetation out of moisture and nutrients. Its mechanism for success is essentially a head start. It germinates in the fall and starts growing in cold temperatures. Then it overwinters, matures, throws off prolific amounts of seeds and dies by midsummer when native grasses and forbs are much earlier in their life cycle.

A patch of cheatgrass colors a 7,500-foot-high northern Wyoming Range ridgeline in November 2025. (Mike Koshmrl/WyoFile)

On top of the advantageous life cycle, the Westโ€™s ever-increasing, climate-driven wildfires help cheatgrass flourish. When a cheatgrass-infested area burns and becomes more cheatgrass dominant, itโ€™s more prone to burn again, creating a vicious feedback loop. 

Giving cheatgrass yet another advantage, research has shown the plant in North America adapts well to different locales. That trait enables it to flourish in a wide range of temperatures and moisture conditions across the West, Riginos said.

โ€œI donโ€™t want to see the West become a wasteland of cheatgrass, I really donโ€™t,โ€ she said. โ€œI feel that this is the most existential, sweeping threat to our western ecosystems. It really concerns me.โ€ 

Closing in

All those traits have enabled an impressive, though foreboding, expansion. Since its introduction from Europe in the 1800s, cheatgrass has spread to all 50 states and parts of Canada and Mexico. There are signs itโ€™s not slowing down. Rangeland ecologists have detected an eightfold increase in cheatgrass across the Great Basin since the 1990s, according to the National Wildlife Federation

Simultaneously, sagebrush-dominated landscapes have sustained a decline. A 2022 U.S. Geological Survey reportfound that an average of 1.3 million acres are being lost or degraded every year. Thatโ€™s an area larger than Rhode Island.

Although the spread of Wyoming cheatgrass hasnโ€™t been as overwhelming as in lower-elevation, drier western states, the invasion has, and continues to be, successful. A whitepaper distributed by the Wyoming Outdoor Council in the state Capitol during the 2024 funding fight reported that invasive annual grasses already affect 26% of the Equality Stateโ€™s landmass, which pencils out to over 16 million acres.

Cheatgrass is widespread along the east side of South Pass, just a couple dozen miles away from the most expansive and intact reaches of the sagebrush biome remaining on Earth. (Mike Koshmrl/WyoFile)

Historically, Wyoming land managers believed that much of the nationโ€™s least-populated state was too high and too cold for cheatgrassย to gain much ground. But the climate has tilted in its favor, according to Jeanne Chambers, an emeritus U.S. Forest Service research ecologist who has studied cheatgrass for decades.

โ€œCooler temperatures, especially those cold nighttime temperatures, used to keep cheatgrass at bay,โ€ Chambers said. โ€œBut now that things are warming up and people and livestock and animals are all over the place, the propagules โ€” the seeds โ€” are getting everywhere.โ€ 

As a result, slightly lower-elevation reaches of Wyoming, like the Bighorn Basin, are seeing more and more cheatgrass, she said. The same goes for where the salt desert transitions into sagebrush in the stateโ€™s southwestern corner.   

โ€œThose areas are pretty vulnerable,โ€ Chambers said. 

Cheatgrass sprouts off a badland-like formation near Burlington in November 2025. The noxious grass is widespread in the Bighorn Basin, and wildfires that have flared up in recent years are exacerbating its spread. (Mike Koshmrl/WyoFile)

Wyoming specialists in those communities corroborate the claims.

โ€œCheatgrass is moving into our county, primarily on the south end โ€” but itโ€™s not exclusive to the south end,โ€ Sweetwater County Weed and Pest Supervisor Dan Madson said. โ€œThere are hot spots throughout the county invading mule deer, antelope and elk habitats, as well as sage grouse core areas.โ€ 

Some of the encroachments are well north into the Green River Basin and Red Desert, noted sagebrush strongholds. North of Rock Springs, north of Superior and in the Seedskadee National Wildlife Refuge are all places being actively invaded, Madson said.  

Sweetwater County is scaling up its response, Madson said. The county is spending about $750,000 to spray nearly 12,000 acres of cheatgrass this year and plans to treat more like 15,000 acres in 2026. 

But money is a limiting factor. Wyoming landscapes have been the recipient of many millions of federal dollars, including from the Inflation Reduction Act and Bipartisan Infrastructure Law, which have complemented the stateโ€™s contributions. 

Wyoming contains half of the core sagebrush-steppe habitat, in dark blue, that remains in the United States. Light blue signifies areas habitat managers have identified as having potential for restoration and tan areas are classified as โ€œother rangeland.โ€ (U.S. Geological Survey)

Still, the pace of infestation statewide and in Sweetwater County far exceeds the total resources available. 

โ€œWe could easily, easily triple that [15,000 acres] in a year,โ€ Madson said, โ€œand still have enough to do for the rest of my career.โ€

Funding issues arenโ€™t only due to federal government turmoil. One potential pot of $11 million that would have been directed toward spraying evaporated when the Wyoming Senate opted to forgo a supplemental budget

โ€œThat money got lost,โ€ said Budd, at the Wyoming Wildlife and Natural Resource Trust. โ€œIt actually hurt some parts of the state that were doing a very good proactive job, managing to keep cheatgrass down.โ€

โ€˜Defending the coreโ€™

The upper Green River Basin is one example of a landscape where cheatgrass advances have been reversed. Its remoteness, harsh climate and high elevation helped, but those factors alone didnโ€™t prevent a slow incursion of the virulent vegetation early in the century. By 2014, for example, hues of red and purple โ€” hallmarks of cheatgrass โ€” were painting the ridges rising over Boulder Lake. 

The Sublette County Weed and Pest District fought the invasion with repeated treatments. In 2018 alone, some 30,000 acres of the western front of the Winds were aerially sprayed. It worked. 

By the summer 2020, no cheatgrass was being detected at Boulder Lake, once a hotspot, District Supervisor Julie Kraft said. Nowadays, she said, no major problem areas remain in Sublette County.

In August 2019, a recreational shooter hit an exploding target and sparked the Tannerite Fire, which ripped across the pictured ridge on the north end of Boulder Lake. Afterwards, cheatgrass that was already in the area grew in thick where the sagebrush once stood, but the mountainside was subsequently treated and today the invasive grass occurs only in trace levels. (Mike Koshmrl/WyoFile)

Kraft even felt โ€œgoodโ€ about the future of her cheatgrass fight, expressing uncommon optimism for those grappling with an organism overtaking so many places. 

โ€œA couple of years ago, I might not have said the same thing,โ€ Kraft said. โ€œBut with this new tool, and particularly because of the influx of money that came [during] the [Biden] administration, it allowed us to do so much more.โ€ 

That new tool is an herbicide, Indaziflam. Itโ€™s a product, also known by its trade name, Rejuvra, that provides far more enduring protection against cheatgrass than any previous chemical treatment. It works by attacking the seedbank and shallow root structure of cheatgrass, while not infiltrating the soil deep enough to kill perennial native grasses and plants like sagebrush. 

โ€œIt depletes it down until there wonโ€™t be a seedbank of cheatgrass anymore,โ€ Kraft said. โ€œWeโ€™ve seen that on our sites. Year one, you can go out and grab handfuls of cheatgrass seed off the top of the soil. Year two, you canโ€™t find those handfuls anymore. By year three, you canโ€™t dig [cheatgrass seeds] out of the bottoms of sagebrush.โ€

Sublette County, a stronghold of the sagebrush biome, has fared better than other parts of Wyoming at keeping cheatgrass at bay. Still, patches can be found here or there, like this pocket overlooking Half Moon Lake in March 2025. (Mike Koshmrl/WyoFile)

The June 2024 outing that drew Riginos, the Nature Conservancy scientist, to Washakie Park along the east slope of the Winds included a stop at an experimental Indaziflam treatment plot. 

Although a mix of the herbicide had been misted over strips of cheatgrass nearly four years earlier, its effect remained obvious and unmistakable. Curing, purple drooping brome blanketed untreated strips, and native green grasses filled the niches between. 

โ€œItโ€™s holding still,โ€ said Aaron Foster, Fremont Countyโ€™s weed and pest supervisor, who led the cheatgrass treatment tour on the reservation. โ€œItโ€™s been holding now for four growing seasons. Pretty impressive.โ€  

Barren fields find beneficial use: Innovative project will revegetate and restore the land, while producing revenue from carbon credits — Evan Arvizu (AlamosaCitizen.com) #SanLuisValley

The project will be on 480 acres of degenerated land, in between Stanley Road, the 105, and the 106. The property sits within Subdistrict 1, and its water rights, all groundwater access and wells, were sold to the Rio Grande Water Conservation District in December of 2024. Credit: The Citizen

Click the link to read the article on the Alamosa Citizen website (Evan Arvizu):

November 27, 2025

Down the Stanley Road looking north in central Alamosa County are the massive solar panels that offer an unusual but common skyline in the high mountain desert west of Mosca. In the foreground of the solar structures, on 480 acres of degenerated land, is a grand new experiment by the Colorado Land Board that promises to offer new insights into carbon, the Valleyโ€™s soil, and the growing but complicated โ€œcarbon market.โ€

In September the state land board inked a partnership with Land & Carbon Inc., a carbon project development company, to revegetate and restore the land under an initial 15-year partnership, and then a 40-year monitoring period to determine long-term success.

This is the first contract of its kind in the Valley, but it definitely wonโ€™t be the last. With more land and water being retired from irrigation every year, the question of how to revegetate only becomes more urgent. Revegation helps not just to improve carbon sequestration, but also to prevent dangerous dust-bowl conditions that threaten an increasingly dry Valley. The water on the Stanley Road property was retired to the Rio Grande Water Conservation District in 2024, and the partnership has committed to using only the allotted 18 inches of water over the first 3 years for revegetation. This project will illuminate the possibilities for revegetation in the Valley, and is likely to lead the way for more innovative partnerships and projects focused on both land restoration and carbon sequestration in the coming years.

The Colorado State Land Board manages lands that were granted to the state in a public trust from the federal government back in 1876. It operates as the second-largest land owner in the state, holding 2.8 million acres of surface land and 4 million acres of subsurface assets. Its land management practices aim to both steward the land and produce reasonable and consistent income, a majority of which gets distributed to the Colorado Department of Educationโ€™s Building Excellent Schools Today (BEST) program. 

The Land Board established an ecosystem services program, focused on generating revenue from nontraditional products, like wetland and carbon credits, as opposed to more traditional products like agriculture, grazing, mining, oil and gas, hunting, recreation and renewables. A few years ago, through this program, the Land Board started exploring the prospect of carbon sequestration and carbon credits.

โ€œWe hired a group of consultants to help us enter this market. Itโ€™s new and not well understood by most people. Itโ€™s kind of on the leading edge of being developed, what we sometimes call an emerging market,โ€ said Mindy Gottsegen, the State Land Boardโ€™s Stewardship and Ecosystem Services manager.  

The carbon market has emerged as a viable way to simultaneously restore damaged lands, while generating valuable revenue. While there are government regulations around carbon emissions and compliance with certain environmental standards, the carbon market is an entirely voluntary system that operates without large government oversight. Companies buying and selling carbon credits can join the market, and participate, as long as they meet certain standards, set by third-party organizations.

While it is a complicated system, this is generally how it works for soil carbon credits in the Valley: Every piece of land has some amount of carbon in the soil because plants take in CO2 from the atmosphere, photosynthesize, and store it. Through plant roots, and the decay of other organic matter, the soil ends up holding on to a certain amount of carbon. Different land management practices can increase or decrease the amount of carbon sequestered. 

To quantify carbon sequestration and sell credits, verified companies (or land owners) must first establish a baseline carbon measurement. Then, carbon gains are estimated over time using a combination of measurements and modeling. These numbers are reviewed, and based on the additional amount of carbon stored, carbon registries issue a proportionate amount of carbon credits. These credits can be sold on the market to entities looking to offset their carbon emissions. The revenue from carbon credits helps to fund and sustain carbon sequestration and land restoration projects.

โ€œThe Biological Carbon Program framework that our board approved in April of this year was kind of saying โ€˜This is how weโ€™re going to get involved in the carbon market,โ€™โ€ said Gottsegen. 

The program allows agricultural and land lessees to partner with board-approved Qualified Project Developers (QPDs) to create and implement restorative project plans. These companies work as the middle man between land owners and the carbon market, helping to make successful and sustainable changes, while also navigating the approval and acquisition of carbon credits.


Enter Land & Carbon Inc. Founded by Dave Lawrence in 2023, Land & Carbon is an innovative project development company, restoring highly degraded lands with low-cost, science-driven solutions. The company works to regenerate and revegetate land while offsetting and storing CO2 in the soil, using carbon credits to help pay for the projects.

โ€œI used to โ€” well I still do โ€” drive around the country quite a bit. Iโ€™ve observed just how much degraded and barren land there is, without healthy crops or native vegetation  โ€” brown trampled land all around the country,โ€ said Lawrence. 

Lawrence had previously served as both the chairman of the Yale Climate & Energy Institute and the executive director of the Salk Institute Harnessing Plants Initiative. In these roles, he was actively involved in carbon projects, and realized that reducing atmospheric carbon would require more than just emissions reduction.

โ€œI recognized that there were a number of different solutions available, and that they could be used in combination,โ€ said Lawrence. โ€œI started Land & Carbon with this idea that we would use a combination of practices, and collaborate with communities, ranchers, farmers, land holders, and experts โ€” local, regional, national, and global โ€” pulling all of this together to do the best job that we could restoring degraded land, and at the same time taking carbon out of the atmosphere.โ€

A significant amount of the degraded land across the West is largely agricultural and sits with different state land boards. Land & Carbon reached out to the Colorado State Land Board with hopes of collaborating to regenerate these lands in a way that was mutually successful, taking advantage of best practices to sequester carbon, restore ecosystem health, and help fund the stateโ€™s public education system. 

Land & Carbon got approved as the Land Boardโ€™s fourth QPD in August and the deal, officially titled Grassland Carbon Ecosystem Services Production Lease, ES 117611, came soon after.

Of the land in the State Land Boardโ€™s portfolio, the Stanley Road property was selected because of a combination of factors. The property consists of 480 acres, in between Stanley Road, the 105, and the 106. It sits within Subdistrict 1, and its water rights, all groundwater access and wells, were sold to the Rio Grande Water Conservation District in December of 2024. This means moving forward there are severe limitations to the amount of water that can be used to revegetate. The land is highly degraded from decades of agricultural use, and has been barren for years. In that time, a takeover of invasive weeds, along with harsh soil and climate conditions, have prevented any sort of natural recovery.

This property had been a challenge for the Land Board, because of the amount of damage. While this level of degradation can be seen as a deterrent for other QPDs, these types of highly degraded properties are exactly what Land & Carbon seek out. When the Land Board asked if it would be interested in taking on the challenge, the answer was a resounding โ€œYes.โ€ 

In any project for Land & Carbon, the first steps include a โ€œscope and discoveryโ€ research deep dive, to better understand what has already been done, and learn how its efforts will be situated in the broader context of work in the region. In the Valley, this means looking at CSU Extension information, published papers, USDA, State Land Board and Conservation District data, conducting their own boots-on-the-ground field visits, and also engaging with the community. All of it is pulled together to assess initial land characteristics. 

โ€œWeโ€™re a big believer in talking with people and learning from people who are actually doing the work. So we participated in workshops, convened by Colorado State, that allowed us to get to know different individuals and people and groups who were already doing things,โ€ said Lawrence. โ€œWe donโ€™t believe we have the corner on the market on all expertise. We really try to tap into as much local knowledge as we can, as to what has worked, what hasnโ€™t worked and why.โ€

After that, an exhaustive evaluation of all available data and information is done, pulling in literature, field data, and models to create an initial plan, taking into consideration resource availability and supplies. Then they take baseline measurements to determine the starting amount of carbon in the soil that is crucial to then quantify improvements and carbon credits. 

The Stanley Road project is still in these early stages, and they are working to collect data, determine land characteristics, and establish a carbon baseline, before considering different solutions and strategies. 

โ€œWe tailor our solutions to the land. Not everything grows everywhere and not all grazing practices work everywhere. So how can we tailor the best combination to this land?โ€ said Lawrence.

Theย next steps will come in the spring, at the start of the growing season, when Land & Carbon plans to establish what it has trademarked as Innovation Sites. These five- to 20-acre patches on the property are used to test out new ideas and different combinations, seed mixes, and technologies, in order to learn what works best on this specific land. These experimental sites will run for three to five years, after which the best, most successful techniques will be used on the larger property. Many of the tests will not work, but some will, and those are what get implemented broadly.

In the years to come, these plans will continue to develop. Final decisions around irrigation, and how to use the 18 inches of water allocated for the first 3 years of the project, have not yet been made. Nor have more definitive restoration plans, though in the press release by the Land Board, it was stated that the property is expected to support regenerative grazing within four to eight years. 

The project is estimated to sequester greater than 10,000 metric tonnes of CO2 in the first 15 years, which is when the initial contract ends. This will be followed by a 40-year monitoring period to ensure the permanence of the soil carbon storage.


With the state of water in the Valley, and efforts to retire agricultural land for water conservation purposes, the amount of land in need of revegetation and restoration will only continue to grow over the next few years. 

Both the State Land Board and Land & Carbon expressed interest in expanding the reach of this project and methodology, once it has been established. But that will take time. 

โ€œI always think itโ€™s good to try to do one thing very well, and to kind of get a proof point. We are very focused on this property, and of course we would love to work with others as we move along in this, and show what we have going,โ€ said Lawrence.

โ€œWeโ€™re just getting started. The first few take extra time, but weโ€™re hoping that once we get these few under our belt, weโ€™ll be able to expand,โ€ said Gottsegen. โ€œHopefully we can continue to build the carbon program with more leases in the coming years.โ€

Lawrence emphasized that Land & Carbon aims to make this project the template for affordable, quality land regeneration using carbon credits, that will work for people in the Valley.

โ€œThe idea is that what we learn, we share. We can serve as just advisors if thatโ€™s what somebody who has all the capabilities wants, and thereโ€™s a ton of people with capabilities, or we can actually do the work,โ€ said Lawrence. โ€œI think we all know the challenges that we face with water in the San Luis Valley. Itโ€™s important that we take whatever we learn, in collaboration with others, and work with them to try to implement this at scale.โ€

Evan Arvizu

Evan Arvizu is a recent graduate of Colorado College with a degree in Environmental Anthropology and minor in Journalism. She is a former intern with the Rural Journalism Institute of the San Luis Valley. More by Evan Arvizu

San Luis Valley Groundwater

A drying #GreatSaltLake is spewing toxic dust. It could cost #Utah billions — Leia Larsen (Grist.org)

Dust event from thunderstorm Great Salt Lake. Photo credit: Kevin Perry/University of Utah

Click the link to read the article on the Grist website (Leia Larsen):

December 1, 2025

Instead of waiting for more data, a new report lays out the case for action.

This coverage is made possible through a partnership between Grist and The Salt Lake Tribune, a nonprofit newsroom in Utah.

The dust blowing from the dry bed of the Great Salt Lake is creating a serious public health threat that policymakers and the scientific community are not taking seriously enough, two environmental nonprofits warn in a recent report.

The Great Salt Lake hit a record-low elevation in 2022 and teetered on the brink of ecological collapse. It put millions of migrating birds at risk, along with multimillion-dollar lake-based industries such as brine shrimp harvesting, mineral extraction, and tourism. The lake only recovered after a few winters with above-average snowfall, but it sits dangerously close to sinking to another record-breaking low.

Around 800 square miles of lake bed sit exposed, baking and eroding into a massive threat to public health. Dust storms large and small have become a regular occurrence on the Wasatch Front, the urban region where most Utahns live.

The report from the Utah Physicians for a Healthy Environment and the Utah Rivers Council argues that Utahโ€™s โ€œbaby stepsโ€ approach to address the dust fall short of whatโ€™s needed to avert a long-term public health crisis. Failing to address those concerns, they say, could saddle the state with billions of dollars in cleanup costs. โ€œWe should not wait until we have all the data before we act,โ€ said Brian Moench, president of Utah Physicians for a Healthy Environment, in an interview. โ€œThe overall message of this report is that the health hazard so far has been under-analyzed by the scientific community.โ€

Click the image to download the report.

After reviewing the report, however, two scientists who regularly study the Great Salt Lake argued the nonprofitsโ€™ findings rely on assumptions and not documented evidence.

The report warns that while much of the dust discussion and new state-funded dust monitoring network focus on coarse particulates, called PM10, Utahns should also be concerned about tiny particulates 0.1 microns or smaller called โ€œultrafines.โ€ The near-invisible pollutants can penetrate a personโ€™s lungs, bloodstream, placenta, and brain.

The lakeโ€™s dust could also carry toxins like heavy metals, pesticides and PFAS, or โ€œforever chemicals,โ€ Moench cautioned, because of the regionโ€™s history of mining, agriculture, and manufacturing.

โ€œGreat Salt Lake dust is more toxic than other sources of Great Basin dust,โ€ Moench said. โ€œItโ€™s almost certain that virtually everyone living on the Wasatch Front has contamination of all their critical organs with microscopic pollution particles.โ€

If the lake persists at its record-low elevation of 4,188 feet above sea level, the report found, dust mitigation could cost between $3.4 billion and $11 billion over 20 years depending on the methods used.

The nonprofits looked to Owens Lake in California to develop their estimates. Officials there used a variety of methods to control dust blowing from the dried-up lake, like planting vegetation, piping water for shallow flooding, and dumping loads of gravel.

Exposed shoreline of the Great Salt Lake in Utah (USA). The lakeโ€™s level has dropped over the past three decades, creating an enormous public health threat from windblown dust disrupting a continental migratory flyway. Photo by Brian Richter

The Great Salt Lake needs to rise to 4,198 feet to reach a minimum healthy elevation, according to state resource managers. It currently sits at 4,191.3 feet in the south arm and 4,190.8 feet in the north arm.

The lakeโ€™s decline is almost entirely human-caused, as cities, farmers, and industries siphon away water from its tributary rivers. Climate change is also fueling the problem by taking a toll on Utahโ€™s snowpack and streams. Warmer summers also accelerate the lakeโ€™s rate of evaporation.

The two nonprofits behind the report, Utah Physicians and the Utah Rivers Council, pushed back at recent solutions for cleaning up the toxic dust offered up by policymakers and researchers. Their report panned a proposal by the stateโ€™s Speaker of the House, Mike Schultz, a Republican, to build berms around dust hot spots so salty water can rebuild a protective crust. It also knocked a proposal to tap groundwater deep beneath the lake bedand use it to help keep the playa wet.

โ€œCostly engineered stopgaps like these appear to be the foundation of the stateโ€™s short-sighted leadership on the Great Salt Lake,โ€ the groups wrote in their report, โ€œwhich could trigger a serious exodus out of Utah among wealthier households and younger populations.โ€

Bill Johnson, a professor of geology and geophysics at the University of Utah whoย led research on the aquifer below the lake, said he agreed with the reportโ€™s primary message that refilling the Great Salt Lake should be the stateโ€™s priority, rather than managing it as a long-term and expensive source of pollution.

โ€œWe donโ€™t want this to become just about dust management, and we forget about the lake,โ€ Johnson said. โ€œI donโ€™t think anybodyโ€™s proposing that at this point.โ€

It took decades of unsustainable water consumption for the Great Salt Lake to shrink to its current state, Johnson noted, and it will likely take decades for it to refill.

Kevin Perry, an atmospheric scientist at the University of Utah and one of the top researchers studying the Great Salt Lakeโ€™s dust, said Utah Physicians and Utah Rivers Council asked him to provide feedback on their report in the spring.

โ€œItโ€™s a much more balanced version of the document than what I saw last March,โ€ he said of the report. โ€œItโ€™s still alarmist.โ€

Perry agreed with the reportโ€™s findings that many unknowns linger about what the lake bed dust contains, and what Utahns are potentially inhaling when it becomes airborne. He said he remains skeptical that ultrafine particulates are a concern with lake bed dust. Those pollutants are typically formed through high-heat combustion sources like diesel engines.

โ€œIn the report, they just threw it all at the wall and said it has to be there,โ€ Perry said. โ€œI kept trying to encourage them to limit their discussion to the things we have actually documented.โ€

The reportโ€™s chapter outlining cost estimates for dust mitigation, however, largely aligned with Perryโ€™s own research. Fighting back dust over the long term comes with an astronomical price tag, he said, along with the risk of leaving permanent scars from gravel beds or irrigation lines on the landscape.

โ€œYes, we can mitigate the dust using engineered solutions,โ€ Perry said, โ€œbut we really donโ€™t want to go down that path if we donโ€™t have to.โ€

Sunset from the western shore of Antelope Island State Park, Great Salt Lake, Utah, United States.. Sunset viewed from White Rock Bay, on the western shore of Antelope Island. Carrington Island is visible in the distance. By Ccmdav – Own work, Public Domain, https://commons.wikimedia.org/w/index.php?curid=2032320

#Snowpack news December 2, 2025

Westwide SNOTEL basin-filled map November 30, 2025.
Colorado snowpack basin-filled map November 30, 2025.

On President Trump’s arroyo-phobic Clean Water Act rule: Plus: Congress kills another RMP, sows chaos; President Trump endangers Endangered Species Act — Jonathan P. Thompson (LandDesk.org)

Ephemeral desert water. Jonathan P. Thompson photo

Click the link to read the article on The Land Desk website (Jonathan P. Thompson):

November 25, 2025

The News: The Trump administration last week weighed in on the 53-year battle over what waterways are covered by the 1972 Clean Water Act โ€” with a draft rule that would narrow the definition of โ€œWaters of the United States,โ€ or WOTUS. The rule would effectively remove federal CWA protections from hundreds of arroyos, rivers, and ephemeral streams in the Southwest, giving developers industries more latitude to alter or pollute those waterways. The public has until Jan. 5 to submit comments.

The Context: For years, the Environmental Protection Agency and Army Corps of Engineersโ€”the agencies charged with enforcing the CWAโ€”considered WOTUS to include everything from arroyos to prairie potholes to sloughs to mudflats, so long as the destruction or degradation thereof might ultimately affect traditionally navigable waters or interstate commerce (which could include recreation, sightseeing, or wildlife watching). It was a broad definition that gave the agencies latitude to โ€œrestore and maintain the chemical, physical, and biological integrity of the Nationโ€™s waters,โ€ as Congress mandated when creating the law in 1972.

Developers and property rights ideologues pushed back on this definition, saying it was too broad and therefore gave the feds too much power to curb pollution or restrict development. The issue ended up in the courts and, ultimately, to the U.S. Supreme Court.

The waters were muddied, so to speak, by the 2006 Supreme Court split decision on the Rapanos case. The late Justice Antonin Scalia wrote what would become the right-wingโ€™s preferred definition of waters of the U.S. He argued that they should include only โ€œrelatively permanent, standing or continuously flowing bodies of water โ€ฆ described in ordinary parlance as streams[,] โ€ฆ oceans, rivers, [and] lakes.โ€ Scaliaโ€™s definition emphatically excluded โ€œephemeral streamsโ€ and โ€œdry arroyos in the middle of the desert.โ€ Justice Anthony Kennedy disputed Scalia, saying instead the CWA should extend to any stream or body of water with a โ€œsignificant nexusโ€ to navigable waters, determined by a wetlandโ€™s or waterwayโ€™s status as an โ€œintegral part of the aquatic environment.โ€

Then, in 2023, in its ruling on the Sackett case, the SCOTUS majority deferred to Scaliaโ€™s Rapanos definition, writing: โ€œโ€ฆ we conclude that the Rapanos plurality was correct: the CWAโ€™s use of โ€˜watersโ€™ encompasses โ€˜only those relatively permanent, standing or continuously flowing bodies of water forming geographical features that are described in ordinary parlance as streams oceans, rivers and lakes.โ€™โ€

Itโ€™s up to the relevant agencies to translate these rulings into actual rules, often adding their own ideological twists. The W. Bush, Obama, and Trump I administrations issued their own post-Rapanos definitions of WOTUS, Biden weighed in post-Sackett, now Trump II is submitting its own set of industry-friendly, deregulatory definitions.

The EPAโ€™s proposed definition of โ€˜โ€˜waters of the United Statesโ€™โ€™ would include:

โ€œRelatively permanent,โ€ under the new rule, would mean

And then thereโ€™s this weird and vague, yet critical, term, โ€œwet season,โ€ which the rule defines as:

Sometimes you have to wonder whether the bureaucrats who come up with these things have ever even been to the Western U.S., particularly the arid Southwest.

The โ€œrelatively permanentโ€ requirement clearly excludes thousands of arroyos, ephemeral streams, washes, gullies, and even rios and rivers โ€” from the Santa Cruz to the Rillito to the Santa Fe to the Puerco and the Dirty Devil โ€” from CWA jurisdiction. Indeed, it leaves huge swaths of the Southwest without Clean Water Act protections, and at the mercy of respective states or counties. A 2008 EPA study estimates that ephemeral and intermittent streams make up 59% of all of the waterways in the U.S. (excluding Alaska) and over 81% in the arid and semi-arid Southwest (AZ, NM, UT, CO, CA).

Source: U.S. EPA.

The ecological benefits of ephemeral streams are obvious to any Western wanderer who happens to venture down a seemingly dry and barren arroyo bed, where they may find cool air, the smell of water even on the hottest day, tiny tracks of animals seeking sanctuary from the sun, the lascivous bloom of a datura, and cottonwoods and even willows miles and miles away from any โ€œrelatively permanentโ€ water source. And if thatโ€™s not enough, then consider that peer-reviewed research has found that these same ephemeral streams are major contributors to the water quantity and quality of the entire river drainage network of which they are a part.

Ephemeral streams are streams that do not always flow. They are above the groundwater reservoir and appear after precipitation in the area. Via Socratic.org

A 2024 study by Craig Brinkerhoff et al concludes: โ€œThis ephemeral influence directly implicates downstream water quality standards: Excluding ephemeral streams from coverage under the CWA would substantially narrow the extent of federal authority to regulate water quality in the United States.โ€

While the administration was looking to provide โ€œclarity,โ€ the โ€œwet seasonโ€ provision does exactly the opposite, especially when one tries to apply it to the desert Southwest. If southern Arizona has a wet season, wouldnโ€™t it be the days and weeks of the late summer monsoon? Many arroyos do run continuously during a good monsoon season, even if it is only for two or three weeks. So would that put them back under CWA jurisdiction?

How these proposed changes would play out on the ground is a bit of a puzzle โ€” especially given the โ€œwet seasonโ€ ambiguity. But what is clear is that developers of big housing projects in the desert outside Phoenix or Las Vegas or Tucson, for example, would be allowed to fill in or build roads through arroyos and washes without obtaining a federal CWA permit from the Army Corps of Engineers. That would leave it to the state and county to implement their own, similar, permitting systems if they chose to do so.

As one might expect, the energy industry, developers, ranchers, and farmers generally support the changes, since it will eliminate some of the red tape that tangles up and delays projects.

โ€œFor U.S. oil and natural gas operators, this is a game-changer,โ€ wrote the head of a Texas petroleum industry group in the Odessa American. โ€œPicture the Permian Basin or Bakken Formation: vast swaths dotted with intermittent draws and playas that previous rules treated like sacred rivers, triggering Section 404 permits under the U.S. Army Corps that could drag on for years and cost millions in mitigation. Now, with ephemeral features sidelined and groundwater off-limits, operators can overcome those hurdles for well pads, access roads, and seismic surveys.โ€

If you live in the West, you probably live near at least one of the ephemeral streams that would lose federal protections under these new definitions. You might want to go walk up it sometime soon before it goes away.

In the meantime, you have until Jan. 5 to send your comments, identified by Docket ID No. EPAโ€“HQโ€“ OWโ€“2025โ€“0322, by any of the following methods:

  • Federal eRulemaking Portal:ย https://www.regulations.gov/ย (our preferred method). Follow the online instructions for submitting comments.
  • Email: OW-Docket@epa.gov. Include Docket ID No. EPAโ€“HQโ€“OWโ€“ 2025โ€“0322 in the subject line of the message.
  • Mail: U.S. Environmental Protection Agency, EPA Docket Center, Water Docket, Mail Code 28221T, 1200 Pennsylvania Avenue NW, Washington, DC 20460.

Read more about the Clean Water Act, WOTUS, and the value of ephemeral waterways here (but remember, you gotta become a paid subscriber to bust through the paywall!)


News Roundup: Arroyos on trial; Superstition Vistas; Lake Powell bridge — Jonathan P. Thompson


Scene from a huge coal mine in the Powder River Basin. Jonathan P. Thompson photo.

๐ŸŒต Public Lands ๐ŸŒฒ

Congressional Republicans have apparently decided that the best way to turn over public lands to the extractive industries is to do away with the plans guiding management of those lands. Earlier this year, Congress revoked three Bureau of Land Management resource management plans in Montana, North Dakota, and Alaska. Now, theyโ€™ve done the same for the RMP for the BLMโ€™s Buffalo Field Office in Wyoming, which covers a good portion of the coal-rich Powder River Basin.

These mark the first times ever that the Congressional Review Act, which is intended to give Congress the power to review and possibly revoke recently implemented administrative rules, has been used in this manner. Thatโ€™s in part because RMPs have not been considered โ€œrulesโ€ in the past, meaning they are not subject to congressional review.

Resource Management Plans provide a framework for managing large swaths of land and authorize the BLM to permit mining, drilling, grazing, and other activities. They endeavor to balance the agencyโ€™s multiple-use mandate with environmental protections, guiding resource extraction and development away from sensitive areas and toward more appropriate ones, for example. They can take years to develop, and incorporate science, legal considerations, court orders, tribal consultation, and input from local officials and the general public.

And then, with just a few hours of debate and no opportunity for public input, Congress can toss the whole thing into the can. 

In this case, the main target was a provision of the Biden-era RMP that halted new coal leasing on that swath of public land. While the moratorium was celebrated by environmentalists and panned by fossil fuel lovers when it was implemented late last year, it was largely symbolic, since existing leases contain enough coal to meet demand at least until 2040. So revoking the ban similarly wonโ€™t lead to any new mining anytime soon, nor are resulting lease sales likely to fetch much industry interest or acceptable bids. 

But in their haste to scrap the ban, Congress also may have taken away the BLMโ€™s power to issue new leases altogether โ€” not just for coal, but for oil and gas drilling, grazing, or any other use. And not just for the Buffalo Field Office, either. This is a bit wonky, but basically it goes like this:

  • By applying the CRA to RMPs, Congress is saying that RMPs are โ€œrules.โ€
  • According to the CRA, rules must be submitted to Congress before they can take effect.
  • No RMP that has been implemented since 1996 has been submitted to Congress.
  • Therefore, no post-1996 RMP has legally taken effect, making it invalid.
  • The Federal Land Policy Management Act says the BLM can only issue permits, leases, rights of way, and other authorizations โ€œin accordance withโ€ a valid land use plan, or RMP.
  • Therefore all permits, leases, ROWs, and other authorizations issued under post-1996 RMPs โ€” including over 5,000 oil and gas leases, and hundreds more coming up for auction in the near future โ€” are invalid.

This summer, 31 law professors and public land experts called on Congress to refrain from using the CRA to revoke RMPs. โ€œThe resulting uncertainty could trigger an endless cycle of litigation,โ€ they wrote, โ€œeffectively freezing the ability of the BLM and other agencies to manage public lands for years, if not decades to come.โ€

Just last week, a group of conservation organization legal analysts expanded on the potential for chaos, and called on the BLM to pause new leasing and address the โ€œpotential legal deficienciesโ€ of oil and gas leases covering some 4 million acres that were issued under now potentially invalid RMPs. The agency should not issue drilling permits for those leases, the analysts wrote, and it should consider canceling the leases.

Somehow, I donโ€™t think the BLM under the current administration is going to follow that suggestion. Given its track record, it seems more likely that the agency will see the sudden lack of valid RMPs as an open gate through which it can ferry its pro-extractive agenda. This one is almost sure to end up in court.

๐Ÿฆซ Wildlife Watch ๐Ÿฆ…

The Trump administration is proposing new regulations that would dial back Endangered Species Act protections and weaken the landmark law to โ€œstrengthen American energy independence,โ€ according to an Interior Department news release.

The new rules would:

  • Make it more difficult for the U.S. Fish & Wildlife Service to designate critical habitat in areas that are not currently occupied by an endangered species โ€” likely because they were extirpated from the area โ€” but that are essential for the conservation of that species. This would make recovering an endangered species that much more difficult.
  • Remove a rule that extends ESA protections to species that are listed as โ€œthreatened,โ€ which is one step away from โ€œendangered.โ€ This would potentially remove protections for species such as the marbled murrelet, vernal pool fairy shrimp, western snowy plover, Gunnison sage grouse, northern sea otter, and many others.
  • Direct agencies to give economic impacts greater weight when deciding whether to extend ESA protections to a species. This could have potentially pushed the feds to, say, back off on listing the Tiehmโ€™s buckwheat under the ESA, because doing so would potentially restrict or nix a proposed lithium mine in its only known habitat.

โ€œThis plan hacks apart the Endangered Species Act and creates a blueprint for the extinction for some of Americaโ€™s most beloved wildlife,โ€ said Stephanie Kurose, deputy director of government affairs at the Center for Biological Diversity, in a written statement.

๐Ÿ“ธ Parting Shot ๐ŸŽž๏ธ
Raven and the red, white, and blue. Digital Painting by Jonathan P. Thompson.

And, finally, theย Land Deskย readers have spoken, and they have chosen El Burro Blanco as the name for the newย Land Desk dispatch-mobile, with Hank coming in a distant second.


Moab seeks bigger crowds? — Jonathan P. Thompson


Study: Something’s gotta give on the #RioGrande: #ClimateChange and overconsumption are drying up the Southwest’s “other” big river — Jonathan P. Thompson (LandDesk.org)

Sandhill cranes and some mallard ducks roost on a sandbar of the Rio Grande River at sunset on Jan. 22, 2025 in Albuquerque, New Mexico. Copyright Credit ยฉ WWF-US/Diana Cervantes.

Click the link to read the article on The Land Desk website (Jonathan P. Thompson):

November 21, 2025

๐Ÿฅต Aridification Watch ๐Ÿซ

The Colorado River and its woes tend to get all of the attention, but the Southwestโ€™s โ€œotherโ€ big river, the Rio Grande, is in even worse shape thanks to a combination of warming temperatures, drought, and overconsumption. Thatโ€™s become starkly evident in recent years, as the river bed has tended to dry up earlier in the summer and in places where it previously had continued to carry at least some water. Now Brian Richter and his team of researchers have quantified the Rio Grandeโ€™s slow demise, and the conclusions they reach are both grim and urgent: Without immediate and substantial cuts in consumption, the river will continue to dry up โ€” as will the farms and, ultimately, the cities that rely on it.

The Rio Grandeโ€™s problems are not new. Beginning in the late 1800s, diversions for irrigation in the San Luis Valley โ€” which the river runs through after cascading down from its headwaters in the San Juan Mountains โ€” sometimes left the riverbed โ€œwholly dry,โ€ wrote ichthyologist David Starr Jordan in 1889, โ€œall the water being turned into these ditches. โ€ฆ In some valleys, as in the San Luis, in the dry season there is scarcely a drop of water in the riverbed that has not from one to ten times flowed over some field, while the beds of many considerable streams (Rio la Jara, Rio Alamosa, etc.) are filled with dry clay and dust.โ€


Rio Grande Streamflow Mystery: Solved? — Jonathan P. Thompson


San Luis Valley farmers gradually began irrigating with pumped groundwater, allowing them to rely less on the ditches (but causing its own problems), and the 1938 Rio Grande Compact forced them to leave more water in the river. While that kept the water flowing through northern and central New Mexico, the Rio Grandeโ€™s lower reaches still occasionally dried up.

Then, in the early 2000s, the megadrought โ€” or perhaps permanent aridification โ€” that still plagues the region settled in over the Southwest. [ed. emphasis mine] Snowpack levels in the riverโ€™s headwaters shrank, both due to diminishing precipitation and climate change-driven warmer temperatures, which led to runoff and streamflows 17% lower than the 20th century average, according to the new study. And yet, overall consumption has not decreased.

โ€œIn recent decades,โ€ the authors write, โ€œriver drying has expanded to previously perennial stretches in New Mexico and the Big Bend region. Today, only 15% of the estimated natural flow of the river remains at Anzalduas, Mexico near the riverโ€™s delta at the Gulf of Mexico.โ€ Reservoirs, the riverโ€™s savings accounts, have been severely drained to the point that they wonโ€™t be able to withstand another one or two dry winters. As farmers and other users have increasingly turned to groundwater pumping, aquifers have also been depleted. The situation is clearly unsustainable.

Somethingโ€™s gotta give on the Rio Grande, and while we may be tempted to target Albuquerqueโ€™s sprawl, drying up all of the cities and power plants that rely on the river wouldnโ€™t achieve the necessary cuts.

Source: โ€œOverconsumption gravely threatens water security in the binational Rio Grande-Bravo basinโ€ by Brian Richter et al.

It will come as little surprise to Western water watchers that agriculture is by far the largest water user on the Rio Grande โ€” taking up 87% of direct human consumption โ€” and that alfalfa and other hay crops gulp up the lionโ€™s share, or 52%, of agricultureโ€™s slice of the river pie. This isnโ€™t necessarily because alfalfa and other hays are thirstier than other crops, but because they are so prevalent, covering about 433,000 acres over the entire basin, more than four times as much acreage as cotton.

Source: Overconsumption gravely threatens water security in the binational Rio Grande-Bravo basin

This kind of math means farmers are going to have to bear the brunt of the necessary consumption cuts โ€” either voluntarily or otherwise. In fact, they already have: Between 2000 and 2019, according to the report, Colorado lost 18% of its Rio Grande Basin farmland, New Mexico lost 28%, and the Pecos River sub-basin lost 49% (resulting in a downward trend in agricultural water consumption). Some of this loss was likely incentivized through conservation programs that pay farmers to fallow their fields. But it was also due to financial struggles.

Yet even when farmers are paid a fair price to fallow their fields there can be nasty side effects. Noxious weeds can colonize the soil and spread to neighborsโ€™ farms, it can dry out and mobilize dust that diminishes air quality and the mountain snowpack, and it leaves holes in the cultural fabric of an agriculture-dependent community. If a fieldโ€™s going to be dried up, it should at least be covered with solar panels.


Think like a watershed: Interdisciplinary thinkers look to tackle dust-on-snow — Jonathan P. Thompson


Another possibility is to switch to crops that use less water. This isnโ€™t easy: Farmers grow alfalfa in the desert because itโ€™s actually quite drought tolerant, doesnโ€™t need to be replanted every year, is less labor-intensive than other crops, is marketable and ships relatively easy, and can grow in all sorts of climates, from the chilly San Luis Valley to the scorching deserts of southern Arizona.


Alfalfaphobia? Jonathan P. Thompson


Still, it can be done, as a group of farmers in the San Luis Valley are demonstrating with theย Rye Resurgence Project. This effort is not only growing the grain โ€” which uses less water than alfalfa, is good for soil health, and makes good bread and whiskey โ€” but it is also working to create a larger market for it. While itโ€™s only a drop in the bucket, so to speak, this is the sort of effort that, replicated many times across the region, could help balance supply and demand on the river, without putting a bunch of farmers out of business.

Photo credit: The Rye Resurgence Project

***

Oh, and about that other river? You know, the Colorado? Representatives from the seven states failed to come up with a deal on how to manage the river by the Nov. 15 deadline. The feds had mercy on them, giving them until February to sort it all out. Iโ€™m not so optimistic, but weโ€™ll see. Personally, I think the only way this will ever work out is if the Colorado River Compact โ€” heck, the entire Law of the River โ€” is scrapped, and the states and the whole process is started from scratch, this time with a much better understanding of exactly how much water is in the river, and with the tribal nations having seats at the table.


โ›๏ธ Mining Monitor โ›๏ธ

There are a bunch of wannabe uranium mining companies out there right now, locating claims and acquiring and selling claims and touting their exploratory drilling results. But there are only a small handful of firms that are actually doing anything resembling mining. One of them is the Canada-based Anfield, which just broke ground on its Velvet-Wood uranium mine in the Lisbon Valley, even without all of the necessary state permits. 

Now Anfield says it has applied for a Colorado permit to restart its long-idle JD-8uranium mine. The mine is on one of a cluster of Department of Energy leases overlooking the Paradox Valley from its southern slopes, and was previously owned and operated by Cotter Corporation. The mine has not produced ore since at least 2006. Anfield says it will process the ore at its Shootaring Mill near Ticaboo, Utah, which has yet to get Utahโ€™s green light.


๐Ÿ  Random Real Estate Room ๐Ÿค‘

Look! Affordable housing near Moab! Sure, itโ€™s a cave, but itโ€™s only $99,000. Oh, whatโ€™s that? $998,000? Theyโ€™re selling a cave for a million buckaroos? But of course they are. To be fair, itโ€™s not just a cave. Itโ€™s several of them, plus a trailer. Crazy stuff.

๐Ÿ“ธย Parting Shotย ๐ŸŽž๏ธ

A work train in the Animas River gorge just below Silverton. Jonathan P. Thompson photo.
Rio Grande and Pecos River basins. Map credit: By Kmusser – Own work, Elevation data from SRTM, drainage basin from GTOPO [1], U.S. stream from the National Atlas [2], all other features from Vector Map., CC BY-SA 3.0, https://commons.wikimedia.org/w/index.php?curid=11218868

Your daily dose of wow (h/t Henry Brean)

#Drought news: Water Year 2025 Recap for the Intermountain West: Drought Persists in the Western Intermountain West; Dry Winter More Likely Amid La Niรฑaย  — NOAA #ENSO

Click the link to read the article on the NOAA website:

November 20, 2025

Key Points

  • Start of Water Year 2026:ย Leading up to the start of Water Year (WY) 2026, drought conditions improved across the eastern Intermountain West, but drought expanded and intensified across western areas of the region. Storage for Lake Powell and Lake Mead reached a 30-year low for the date as of October 25, 2025.
  • Water Year 2025:ย Precipitation was lower than average in western portions of the region, and greater than average in eastern parts of Colorado, New Mexico, and Wyoming. Much of the Intermountain West experienced warmer-than-average temperatures.
  • Water Year 2025 Impacts:ย Hot and dry conditions led to large fires in several states. Lack of precipitation, early snowmelt, and warm spring temperatures harmed crop production and forage in many areas.
  • La Niรฑa Winter Ahead:ย La Niรฑa conditions are present and favored to continue into early winter. La Niรฑa typically brings warmer and drier winter conditions to the southern region of the Intermountain West. A transition to El Niรฑo-Southern Oscillation (ENSO) neutral is favored for the January-March 2026 time frame. Neutral conditions mean neither El Niรฑo or La Niรฑa are influencing weather patterns.ย 

This update is based on data available as of Thursday, November 20, at 7 a.m. MT. We acknowledge that conditions are evolving.

Conditions at the Start of Water Year 2026 

  • The start of the new water year (beginning October 1, 2025) brought intense rainstorms and flooding in parts of Utah, Arizona, New Mexico, and Colorado. However, due to warmer-than-average temperatures, combined with lower-than-average precipitation across Water Year 2025, much of the region still remains in drought, according to theย U.S. Drought Monitor.
  • At the start of Water Year 2026, drought conditions were split across the Continental Divide, with no drought in much of the eastern extent of the Intermountain West region. Over Water Year 2025, drought conditions persisted or intensified across western portions of Colorado, Wyoming, and New Mexico, as well as statewide across Arizona and Utah.
  • Flaming Gorge Reservoir started Water Year 2026 at near-average storage levels, but many other reservoirs remained below average, including Lake Mead, Lake Powell, and Elephant Butte Reservoir. Greater-than-average runoff is needed to increase reservoir levels next spring.
  • Moving into winter, soil moisture levels are better than they were in November 2024, with root zone soil moisture in headwater basins for the Upper Colorado River and the Rio Grande River experiencing a mix of wetter-than-average conditions at some locations and drier than-average conditions at others, according to bothย SPoRT-LIS modeled dataย andย SNOTELย station data.
  • Storage is below averageย for most Bureau of Reclamationโ€“managed reservoirs in the headwaters of the Upper Colorado River Basin. As of November 18, 2025, Lake Powell is at 44% of typical storage, the lowest observed level for this date in the last 30 years.
  • Storage is also below averageย for Elephant Butte Reservoir in the Rio Grande Basin, at 11% of average as of November 18, 2025.
  • Withย La Niรฑa conditionsย anticipated to persist from December to February, snowpack is more likely to be lower than average during these months. However, all La Niรฑas differ, and there is uncertainty around how this season will play out. La Niรฑa conditions are expected to weaken into El Niรฑo-Southern Oscillation (ENSO) neutral conditions from January to March 2026.

Water Year 2025 Brings a Mix of Drought Degradation and Recovery 

52-week U.S. Drought Monitor Change Map, showing where drought improved (green and blue), remained the same (gray), and intensified (yellow and orange) from October 8, 2024 to October 7, 2025. Conditions were largely split across the western and eastern sides of the region, with 1- to 4-class degradations in the west and 1- to 2-class drought recovery in the east. Source: National Drought Mitigation Center.

November 2025 Reservoir Storage Levels

Lake Powellโ€™s storage declined over Water Year 2025. While Lake Meadโ€™s storage at the end of Water Year 2025 was similar to Water Year 2024, both years had low reservoir levels, with storage near only 50% of average. Source: U.S. Bureau of Reclamation, Interactive Reservoir Dashboard.

Intermountain West Water Year 2025 Summary

  • Water Year 2025 (October 1, 2024โ€“September 30, 2025) brought varied drought conditions to the Intermountain West. Drought largely worsened west of the Continental Divide and improved to the east of the Continental Divide.
  • Drought intensified and spread in Utah, Arizona, and western portions of Colorado, Wyoming, and New Mexico. Over the summer, portions of western Colorado and the southern border of Arizona and New Mexico reached Exceptional Drought (D4), according to the U.S. Drought Monitor.
  • Above-average temperatures (+ 1-3 ยบF) were widespread across the region in Water Year 2025, with some isolated areas being even hotter.
  • Water year precipitation for the region was variable, with a wet-dry split along the Continental Divide. The Southwest Monsoon season was slow to start this year, but precipitation ramped up at the end of August for Colorado, Arizona, and New Mexico. Utah had a weaker than usual summer rain season, and Salt Lake City experienced its fourth driest summer on record.
    • Utah:ย Total water year precipitation was below average across the entire state in 2025. The driest areas were in the south-central region of the state, and in Juab and Tooele Counties in Western Utah. Water Year 2025 was among the top five driest years on record for many portions of the state.
    • Arizona:ย Arizona received lower-than-average precipitation. Stations in some southeastern counties measured total water year precipitation among the lowest 10% on record, with some counties recording their 5th driest water year on record.ย August 2025 was the 16th driest August on record for the state. Yuma County was the only area with above-average precipitation, with the 9th wettest August on record for the county.
    • Colorado:ย Precipitation conditions were split between western and eastern Colorado. The western side of the state saw total water year precipitation between 50-90% of average. The eastern side of the state was unusually wet. Parts of Lincoln and Kit Carson Counties received over 130% of average precipitation.
    • New Mexico:ย Water year precipitation followed a diagonal split across the state. Temperatures were warmer than average for two-thirds of the state, and near average in counties to the northeast. The western and southern areas were drier than average (50-80% of average), and the eastern half of the state was wetter than average (100-150%). Hidalgo, Grant, and Catron Counties experienced the driest water year conditions in the state. Meanwhile, multiple counties on the eastern side of the state received 130-150% of average precipitation.
    • Wyoming:ย Total water year precipitation varied across Wyoming, ranging from 50-70% of average in parts of Sweetwater County to 120-130% of average in Converse County. Much of the state received 80-100% of average precipitation.
  • April 1, 2025 snow water equivalent (SWE) was 81-96% of average for many headwater basins in theย Upper Colorado, but runoff efficiency was low and yielded below-average streamflows in many reaches. Theย Colorado Climate Centerย attributed low runoff efficiency to early snowmelt and below-average spring snowfall. April 1, 2025 snowpack was much lower than average for the headwaters of the Rio Grande basin, located in southern Colorado, with SWE at ~56% of average for the basin.
  • Dry conditions and high evaporative demandย led to several large fires in the Intermountain West during the 2025 fire season, including the 145,000+-acre Dragon Bravo Fire in Arizona andย 137,758-acre Lee Fire in Colorado (5th largest fire in Colorado history).ย 

Near- to Below-Average Precipitation West of the Continental Divide

Percent of average precipitation for Water Year 2025 (October 1, 2024โ€“September 30, 2025), compared to historical conditions from 1991-2020. Tan and brown hues indicate below-average precipitation. Green hues indicate above-average precipitation. Gray and white hues indicate near-average precipitation. Parts of eastern Colorado and New Mexico received 110-150% of average precipitation during Water Year 2025, but the western two-thirds of the region and much of Wyoming received lower than average precipitation. Source: WestWide Drought Tracker, Western Regional Climate Center. Data from PRISM.

Departure from average water year average temperature (October 1, 2024โ€“September 30, 2025) in degrees Fahrenheit, compared to historical conditions from 1991-2020. The majority of the Intermountain West experienced higher than average temperatures (red hues), with parts of Utah hitting 3-4 ยบF above average. Source: WestWide Drought Tracker, Western Regional Climate Center. Data from PRISM.

Water Year 2025 Impacts

  • High evaporative demand, warmer-than-usual temperatures, lower-than-usual precipitation, and dry soils contributed toย dry fuel conditions and large firesย across many parts of the Intermountain West. Across the region, earlier snowmelt and warm temperatures led to longer-than-usual fire seasons.
  • Wildfire impacts across the Intermountain West varied by state during Water Year 2025.ย Arizonaย andย Coloradoย experienced record-breaking fires, including the 145,000+ acreย Dragon Bravo Fireย in Grand Canyon National Park and 137,000 acreย Lee Fireโ€“Coloradoโ€™s 5th largest wildfire on record.ย ย Meanwhile in Wyoming, the number of wildfire incidents increased, but acres burned decreased compared to Water Year 2024.
  • By April 2025, conditions were so dry in Utah that the governor declared aย drought emergency.
  • Dry conditions, early snowmelt, and warm spring temperaturesย negatively impacted crop productionย in portions of all states across the Intermountain West. Poor forage conditions likewise harmed grazing in many areas, leading to curtailed grazing seasons or herd reductions.ย 

La Niรฑa Outlook

  • As of November 17, 2025,ย La Niรฑaย conditions are present andย expected to continueย through December to February, with a transition to El Niรฑo Southern Oscillationโ€“neutral conditions likely from January to March.
  • Every La Niรฑa is different. For the Southwestern U.S., La Niรฑa is typically associated with a greater statistical likelihood of warmer, drier conditions during winter months.
  • Other variables also influence winter precipitation, and not all La Niรฑas are associated with below-average winter precipitation in the Intermountain West.

A Weak La Niรฑa Is Here, ENSO-Neutral Forecast Early Next Year

ย Official NOAAย El Niรฑo Southern Oscillation (ENSO) Outlook, showing the probabilityย ย (percent chance) of La Niรฑa (blue), El Niรฑo (red), or ENSO-neutral (gray) conditions for three-month periods over the next year. Taller bars indicate a greater likelihood of occurrence, shorter bars indicate a lower likelihood of occurrence. La Niรฑa conditions are present as of October 2025, and the official outlook favors ENSO-neutral conditions beginning in January and lasting through the remainder of the water year. Source:ย National Weather Service Climate Predication Center.

Additional Resources by State


Elise Osenga
University of Colorado Boulder/Cooperative Institute for Research in Environmental Sciences (CIRES), NOAA/National Integrated Drought Information System (NIDIS)

Meredith Muth
NOAA National Integrated Drought Information System (NIDIS)

Erinanne Saffell
Arizona State Climate Office, Arizona State University

Dave Simeral
Desert Research Institute, Western Regional Climate Center

Jon Meyer
Utah Climate Center, Utah State University

Paul Miller
Colorado River Basin Forecast Center, National Weather Service

Special Thanks

This Drought Status Update was issued in partnership between the National Oceanic and Atmospheric Administration (NOAA)/National Integrated Drought Information System (NIDIS) and partners across the Intermountain West. NIDIS is an interagency program within the Climate Program Office, which is part of NOAA’s Office of Oceanic and Atmospheric Research.

The big data center buildup: An AI server farm tsunami threatens to overwhelm the Westโ€™s power grid and water supplies — Jonathan P. Thompson (High Country News)

Welcome to the Landline, a monthly newsletter from High Country News about land, water, wildlife, climate and conservation in the Western United States. Sign up to get it in your inbox. Screenshot from the High Country News website.

Click the link to read the article on the High Country News website (Jonathan P. Thompson):

November 25, 2025

This is an installment of the Landline, a monthly newsletter from High Country News about land, water, wildlife, climate and conservation in the Western United States. Sign up to get it in your inbox.

In early November, Texas-based New Era Energy & Digital announced plans to build a โ€œhyperscale,โ€ meaning massive,ย AI-processing data center complexย in Lea County, New Mexico, the epicenter of the Permian Basin oil and gas drilling boom. The campus will be so big, and use so much power, that, if and when it is built, it will come with its own nuclear and gas power plants, with a mind-blowing combined generation capacity of about 7 gigawatts. Thatโ€™s like piling the Westโ€™s largest nuclear and natural gas plants โ€” Palo Verde and Gila River, both near Phoenix โ€” on top of one another, and then adding another 800 megawatts. That kind of power could electrify something like 5.3 million homes, though these power plantsโ€™ output presumably will all go toward more pressing requirements: processing movie streaming, doomscrolling, social media posting and, especially, AI-related activities. [ed. emphasis mine]

Despite the enormity of this proposal, it has received very little news coverage. This is not because anyone is trying to keep it secret, but rather because such announcements have become so common that itโ€™s hardly worth mentioning every new one. New Eraโ€™s hyperscale server farm and others like it are still a long way from generating and then devouring their own electricity. But even if only a fraction of the current proposals succeed, they will transform the Westโ€™s power grid, its landscapes and its economies as significantly as the post-World War II Big Buildup, when huge coal plants and hydroelectric dams sprouted across the region to deliver power to burgeoning cities via high-voltage transmission lines.

Data center construction at 49th & Race, Denver. Photo credit: Allen Best

In fact, this transformation is already underway. A new report from the nonprofit NEXT 10 and University of California Riverside found that, in 2023, data centers in California pulled 10.82 terawatt-hours of electricity โ€” 1 terawatt equals 1 trillion watts โ€” from the stateโ€™s grid, or about enough to power 1 million U.S. households. This resulted in about 2.4 million tons of carbon emissions, even with Californiaโ€™s relatively clean energy mix. (On more fossil fuel-reliant grids, the emissions would have been twice that, or even more.) These same centers directly and indirectly consumed about 13.2 billion gallons of water for cooling and electricity generation. In Silicon Valley, more than 50 data centers accounted for about 60% of one electricity providerโ€™s total load, prompting the utility to raise its customers rates to fund the transmission and substation upgrades and new battery energy storage the facilities required.

These facilities are also colonizing cities and towns far from Big Techโ€™s Silicon Valley epicenter. Over 100 data centers โ€” structures that resemble big-box stores overflowing with row after row of computer processors โ€” have already sprung up in Phoenix-area business parks, and the planned new ones could increase Arizonaโ€™s total power load by 300% over current levels, according to utilities. Recently, Arizona Public Service announced it would keep burning coal at the Four Corners Power Plant beyond its scheduled 2031 retirement to help meet this growing demand.

Data center developments around the West include:

  • NorthWestern Energy signed on toย provide up to 1,000 MWย of power โ€” or nearly all of the utilityโ€™s generating capacity โ€” to Quantica Infrastructureโ€™s AI data center under development in Montanaโ€™s Yellowstone County.
  • The 290-mile Boardman-to-Hemingway transmission project under development in Idaho and Oregon was initially designed to serve about 800,000 PacifiCorp utility customers. But in October it was revealed that the line now willย deliver all of its electricityย to a single industrial customer in Oregon, most likely a new data center.
  • In September, an NV Energy executive told a gathering in Las Vegas that tech firms are asking the utility to supply up to 22,000 megawatts of electricity for planned data centers. Since the utility has largely moved away from coal, this new load would likely be met by generation from existing and planned natural gas facilities, along with proposed utility-scale solar installations.
  • Xcel Energy expects toย spend about $22 billionย in the next 15 years to meet new data centersโ€™ projected power demand in Colorado, potentially doubling or even tripling legacy customersโ€™ rates. Xcel and the stateโ€™s public utilities commission are currently working to reverse the planned closure of a coal plant due to projected data center-associated electricity shortages.
  • Wyoming officials are doing their best to lure data centers and cryptocurrency firms to the state, and it seems to be working. This summer, Tallgrassย proposedย building an 1,800 MW data center, along with dedicated gas-fired and renewable power facilities, near Cheyenne. It would add to Metaโ€™sย facilityย in Cheyenne and the 1,200 MW natural gas-powered Prometheus Hyperscale data center under development in Evanston. Observers say electricity demand from these centers couldย transform the physical and regulatory utility landscapeย and potentially drive up costs for โ€œlegacyโ€ customers.
  • New Mexico utilities are struggling toย meet growing demandย from an increasing number of data centers while also complying with the stateโ€™s Energy Transition Actโ€™s requirements for cutting greenhouse gas emissions.
  • Doรฑa Ana County approved tax incentives for Project Jupiter, a proposed $165 billion data center campus in Santa Teresa in the southeastern corner of New Mexico. Developers have indicated they plan on building dedicated power generation, though they have not yet disclosed the energy sources.
  • Numerous companies areย eyeing Delta, Utah, as a site for new data centers, drawn by the areaโ€™s relatively cheap land, existing agricultural water rights and the fact that itโ€™s home to the Intermountain Power Project, a colossal coal plant built during the original Big Buildup in the years after World War II. The plant is scheduled to be converted to run on natural gas and, ultimately, hydrogen, but Utah lawmakers want at least one of its units to continue to burn coal. They just need a buyer for the dirty power it would produce, and data centers could fit the bill. Fibernet MercuryDelta is looking to construct the 20 million-square-foot Delta Gigasite there, and Creekstone Energy plans to manage 10 gigawatts of capacity there, with power coming from coal, solar and natural gas.
The Intermountain Power Project plant in Delta, Utah. The plant was scheduled to be converted away from coal, but Utah lawmakers want it to continue to burn coal. They need a buyer for the dirty power, and data centers could fit the bill. By Doc Searls from Santa Barbara, USA – 2014_11_21_lhr-lax_330, CC BY 2.0, https://commons.wikimedia.org/w/index.php?curid=38536818

The Western power grid is interconnected but also divided into 38 balancing authorities, or grid operators. Nearly every one of them is expected to see an increase in data center-driven demand over the next decade or so as the Big Digital Buildup gains steam, and few of them are currently equipped to meet that demand. In fact, the North American Electricity Reliability Corp.ย warned this monthย that growing data center-driven power demand is increasing the risk of outages this winter in parts of the West. Therefore, many of the largest data centers are going to need to generate their own power, while utilities also will have to scramble to add generating capacity and associated infrastructure as quickly as possible to serve the regionโ€™s on-grid facilities. The costs of that new infrastructure will be borne by each utilityโ€™s ratepayers.

How will the needed power be generated?

Thereโ€™s simply no way utilities and developers can meet the projected demand with solar and wind, alone. So, utilities are already making plans to keep existing coal plants running past previously scheduled retirement dates, and to build new natural gas plants and even nuclear reactors. Yes, nukes: Google, Switch, Amazon, Open AI and Meta are all looking to power proposed facilities with the new โ€” so new they have yet to be developed โ€” crop of small, modular and advanced reactors, if and when they are finally up and running.

Can data centers be โ€œsustainableโ€?

These developments will have environmental consequences, some more than others. Fossil fuel burning feeds climate change and pollutes the air, and oil and gas drilling and coal mining ravage landscapes; utility-scale solar and wind facilities can harm wildlife habitat and often require hundreds of miles of new transmission lines to move the power around; and nuclear power comes with unique safety hazards and a nagging radioactive waste problem, while the uranium mining and milling industry risks reenacting its deadly Cold War legacy. Even a facility that gets all of its power from solar and batteries is still using resources that, without the extra demand, would otherwise be replacing fossil fuels on the grid. And, unless it has a closed-loop air-cooled system, the data center will still consume water for cooling, usually from municipal drinking water systems.

Wyoming-based Prometheus Hyperscale has made waves with its ambitious and seemingly visionary talk of building โ€œsustainableโ€ data centers with dedicated clean energy generation, water recycling and efficient cooling systems that would capitalize on the cold in the Northern Rockies. Itโ€™s even talked about harnessing the heat from the servers to warm greenhouses and shrimp-farming operations. Maybe, one day, the power will be supplemented by nuclear micro-reactors. But so far, the companyโ€™s walk is not exactly matching its talk. In the beginning, at least, the facility will run on natural gas, and Prometheus says it will offset carbon emissions by paying another company to capture and sequester carbon dioxide from biofuel plants in Nebraska.

Is resistance futile?

Resistance to the imminent server farm tsunami and its outsized energy and water use is widespread, but because these are local projects considered on local levels, battling them can feel a bit like playing whack-a-mole. After Tucson-area residents defeated the cityโ€™s plan to annex the proposed Project Blue data center, which would have enabled it to use treated wastewater for cooling, the developers simply moved the project into the county and planned to use an air-cooling system, which requires less water but more energy. When opposition continued, the firm committed to investing in enough renewable energy on Tucson Electric Powerโ€™s grid to offset all of its electricity use.

Also working against the resistance is the fact that many local governments and utilities actually welcome the onslaught. Data centers can bring jobs and tax revenues โ€” assuming the state, county or municipality doesnโ€™t exempt them from taxes โ€” to economically distraught areas. Meanwhile, utilities are champing at the bit to sell more of their product and raise rates to pay for the needed additional infrastructure. When announcing all the data centers headed for Nevada, NV Energy executive Jeff Brigger noted that the utility is โ€œexcited to serve this load.โ€

While much of the opposition to data centers is based on their environmental impacts and the effects they might have on utility rates and on the communities where theyโ€™re built, the notion of AI itself is also a factor. Itโ€™s one thing to see a lot of water or power used to grow food, for instance, but quite another to see coal power plants continue to run simply so that a computer can write a high school essay or answer an inane question or draw a picture or even serve as a companion of sorts. To be fair, AI does have potentially significant and positive applications, such as diagnosing medical conditions and crunching large quantities of data to find, say, possible cures for cancer or solutions to geopolitical problems.

But before it goes about changing the world, maybe AI ought to start with itself and figure out how to do its thing without using so much energy and water.

No quick fix for #Aspen #drought conditions — The Aspen Daily News

West Drought Monitor map November 25, 2025.

Click the link to read the article on the Aspen Daily News website (Lucy Peterson). Here’s an excerpt:

November 18, 2025

The city of Aspenโ€™s drought response committee is recommending the city maintain a stage 2 water shortage that was declared in August. Monsoonal moisture and cooler temperatures that came since Aspen City Council activated the stage 2 restrictions have helped drought conditions, but not changed them,ย according to an information memoย sent to city council this week. As of Nov. 6, Aspen and Pitkin County remained in severe and extreme drought categories, according to the U.S. Drought Monitor.

โ€œPitkin County has experienced its second driest year to date (January โ€” September 2025) in 131 years of record with a precipitation deficit of 6.84 inches from normal,โ€ the memo states. 

Data collected from a National Weather Service station at the cityโ€™s water treatment facility recorded 1.52 inches of rain in August and 1.89 inches of rain in September. It brought the cityโ€™s precipitation deficit to 3.43 inches. Water demand typically decreases in Aspen during the winter when irrigation systems are turned off, but it is when streams are at their lowest point in the year, according to the memo. Councilman John Doyle, a staunch supporter of water conservation, said restrictions are especially important now as ski seasons get shorter and less snow falls…The stage 2 water shortage declaration came two months after the city declared a stage 1 water shortage with a goal to cut overall water consumption by 10% within city limits. Well below-average stream flows led the city to enact the second stage of water shortage, which represents severe drought conditions…The city relies primarily on streamflow from Castle and Maroon creeks for its water supply. It depends on consistent release of water from snowmelt. The cityโ€™s stage 2 water restrictions are mandatory. Watering of any lawn, garden, landscaped area, tree, shrub or other plant is prohibited from 9 a.m. to 6 p.m. Household watering schedules are also mandatory.

Map of the Roaring Fork River drainage basin in western Colorado, USA. Made using USGS data. By Shannon1 – Own work, CC BY-SA 4.0, https://commons.wikimedia.org/w/index.php?curid=69290878

A drying-up #RioGrande basin threatens water security on both sides of the border — The Associated Press

For the second time in the 21st century, this segment of the Rio Grande in Albuquerque went dry, leaving this image of cracked sediment on a blistering afternoon on Aug. 7, 2025. Photo (and copyright)/WWF-us, Diana Cervantes

Click the link to read the article on the Associated Press website (Susan Montoya Bryan). Here’s an excerpt:

November 20, 2025

Research published Thursday says the situation arguably is worse than challenges facing theย Colorado River, another vital lifeline for western U.S. states that have yet to chart a course for how best to manage that dwindling resource. Without rapid and large-scale action on both sides of the border, the researchers warn that unsustainable use threatens water security for millions of people who rely on the binational basin. They say more prevalent drying along the Rio Grande and persistent shortages could have catastrophic consequences for farmers, cities and ecosystems…Theย studyย done by World Wildlife Fund, Sustainable Waters and a team of university researchers provides a full accounting of the consumptive uses as well as evaporation and other losses within the Rio Grande-Bravo basin. It helps to paint the most complete โ€” and most alarming โ€” picture yet of why the river system is in trouble…The research shows only 48% of the water consumed directly or indirectly within the basin is replenished naturally. The other 52% is unsustainable, meaning reservoirs, aquifers and the river itself will be overdrawn…

Irrigating crops by far is the largest direct use of water in the basin at 87%, according to the study. Meanwhile, losses to evaporation and uptake by vegetation along the river account for more than half of overall consumption in the basin, a factor that canโ€™t be dismissed as reservoir storage shrinks…The irrigation season has become shorter, with canals drying up as early as June in some cases, despite a growing season in the U.S. and Mexico that typically lasts through October. In central New Mexico, farmers got a boost with summer rains. However, farmers along the Texas portion of the Pecos River and in the Rio Conchos basin of Mexico โ€” both tributaries within the basin โ€” did not receive any surface water supplies…The analysis found that between 2000-2019, water shortages contributed to the loss of 18% of farmland in the headwaters in Colorado, 36% along the Rio Grande in New Mexico and 49% in the Pecos River tributary in New Mexico and Texas.ย  With fewer farms, less water went to irrigation in the U.S. However, researchers said irrigation in the Mexican portion of the basin has increased greatly.

Rio Grande and Pecos River basins. Map credit: By Kmusser – Own work, Elevation data from SRTM, drainage basin from GTOPO [1], U.S. stream from the National Atlas [2], all other features from Vector Map., CC BY-SA 3.0, https://commons.wikimedia.org/w/index.php?curid=11218868

In headwaters of the Upper Arkansas, the river โ€œdrives everythingโ€ — Jason Blevins (Fresh Water News) #ArkansasRiver

Browns Canyon National Monument protects a stunning section of Coloradoโ€™s upper Arkansas River Valley. The area is a beacon to white water rafters and anglers looking to test their skills at catching brown and rainbow trout. Photo by Bob Wick / @BLMNational

Click the link to read the article on the Water Education Colorado website (Jason Blevins):

November 25, 2025

Andre Spino-Smith scoots his Waka kayak into the trickling Arkansas River. Itโ€™s barely flowing at 350 cubic-feet-per-second in the river above the Pine Creek stretch. The rapids below are meek, far from the raging rowdiness of a couple months earlier when the steep section of Class V rapids here peaked at nearly 1,700 cfs.

โ€œYou know, it doesnโ€™t matter what the flow is,โ€ says Spino-Smith, a former professional kayaker who has probably paddled this stretch more than anyone else in the last quarter century. โ€œI always have fun on this river.โ€

Today, the Upper Arkansas River between Leadville and Pueblo is the source of a lot of fun. While it primarily serves as a source of urban water, that tumbling snowmelt delivers a secondary but critical benefit of countless good times.

The river boasts one of the most vibrant trout populations in the land and floats more paying rafters than any stretch of river in the country. The Upper Arkansas Riverโ€™s modern-day role of floating rubber and sating cities has evolved over many centuries.

The Arkansas River from Leadville down to Pueblo sustained Indigenous people for most of that time. Then came the miners and railroad builders and high country settlers. The waterway was a thoroughfare for floating beaver pelts and fresh hewn lumber to market. Then it was a dumping ground for miners scouring deep holes for gold and silver. Its meandering path through craggy gorges marked an easy route for railroad builders who breathed new life into former mining towns at the dawn of the 20th century.

The Upper Arkansas River continues to feed its communities, but residents extract less from the endlessly rolling water. Before reaching taps in thirsty cities and sprinklers on the arid plains, the river is celebrated for being, well, a river. Recreation in the water has expanded to trails above the canyons, anchoring economies that are increasingly dependent on natural beauty.

That embrace of the lifeblood of the Upper Arkansas Valley continues to evolve as communities grapple with larger and larger crowds and new residents flocking to a place where water runs and stars sparkle.

โ€œNational models for what people wantโ€

Mike Harvey leans on his shovel, whistles and points.

Tommy Garcia, piloting a John Deere 345 excavator in the middle of the Arkansas River, turns his head and swings his boulder-pinching bucket toward Harvey. Garcia, with Lowry Construction, deftly drops a massive stone in the river, right where Harvey is pointing.

โ€œThat machine is pretty impressive to watch, isnโ€™t it?โ€ says Harvey, standing atop a gently sloping, freshly poured slab of concrete in September.

In a few days, Garcia will shift more boulders and the Arkansas River will flow over that slab, creating a glassy standing wave. Even with super-low fall flows, the surfers will flock, just as they do downstream at Harveyโ€™s slab-formed Scout Wave in his hometown of Salida.

This is the third time in more than a decade that Harvey has tinkered with the Pocket Wave in the Buena Vista Whitewater Park. Buena Vista locals โ€” led by the Friends of the Buena Vista River Park โ€” raised more than $150,000 to support this yearโ€™s $240,000 rebuild of the Pocket Wave.

Harvey and the park builders at the pioneeringย Recreational Engineering and Planning firm have deployed the heavy equipment operators from Lowry Construction to build both the Buena Vista and Salida parks. Piloting quarter-million-dollar excavators, they nimbly pluck giant boulders as if they were pepper shakers, twisting and turning them to fit so just in the river puzzle. Harvey directs the rocky Tetris like a maestro, pointing and whistling over the machineโ€™s rumbling diesel engine.

A standup surfer in the Arkansas River at Salida during Fibark, the river celebration held in late June 2017. Photo/Allen Best

Two decades ago, nascent whitewater parks on Colorado rivers were largely about economics and luring visitors. Now they are more about local amenities and community-based recreation. That resonates with communities in the Midwest, says Harvey, who has designed and built more than a dozen river parks in Colorado as well as parks in Arkansas, Iowa, Nebraska, Ohio, Michigan, Pennsylvania and Texas.

โ€œSalida and Buena Vista are national models for what people want,โ€ says Harvey, noting the cooperation of the local South Main developer, a nonprofit and the Buena Vista recreation department in designing and building the Buena Vista Whitewater Park and miles of hiking and biking trails spiderwebbing above the river.

Mike Harvey has worked with many communities to successfully guide whitewater park, dam modification and river corridor improvement projects through planning, permitting, public-process, funding, design and construction phases. Mike Harvey Badfish SUP and Whitewater Park Designer at REP from his LinkedIn feed.

Salida and Buena Vista are โ€œmaking their river the focal point of their community in a way that drives economics and works for locals.โ€ And other riverside communities are watching.

โ€œFor towns in the Midwest, we are seeing communities trying to figure out how to keep young people around and they want to make their town as attractive as possible,โ€ Harvey says. โ€œAnd younger generations donโ€™t necessarily want golf courses. They want bike trails and surfable waves.โ€

Harvey said river parks have โ€œdemocratized the riverโ€ for the recreation generation, the growing demographic of young and old championing outdoor play as a sort of life purpose. Being able to safely play in swift water once required years of practice with wise mentors. Now, river park lineups, like at the Scout Wave in Salida, include school kids carving potato-chip surfboards next to middle-aged moms and land-locked surfer bros.

โ€œI think thereโ€™s going to be a profound impact in the coming decades as these kids grow older and start businesses and families here,โ€ says Harvey, whose son, Miles, grew up surfing his dadโ€™s waves in Salida and now ranks as one of the worldโ€™s top river surfers. โ€œThese kids are going to be business leaders who clearly recognize the value of the river.โ€

Private investment, public reward

Like Harvey, Brice Karsh has spent long days improving his stretch of the Arkansas River. Karsh just dropped about $100,000 to improve riparian habitat along 300 yards of Arkansas River at his 262-acre Rolling J Ranch at the confluence of the river and the Lake Fork of the Arkansas and Halfmoon Creek. He hosts anglers and is planning another $200,000 to improve the fishing on the property downstream of Leadville he bought in 2016.

โ€œThere are 300 head of elk in the willows outside my window right now,โ€ he says on a warm Tuesday in late October.

Heโ€™s used mapping technology to plan his million-dollar restoration effort on nearly 2.5 miles of riverfront. His ranch is just downstream from the 30-year, $40 million Superfund project in the 18-square-mile California Gulch, where federal cleanup of more than 2,000 mine waste piles and miles of toxin-leaking underground mines dating back to the 1860s is nearing its end.

His property, Karsh says, has been transformed โ€œfrom outhouse to penthouse.โ€

โ€œThe people who do have access to the public areas below me and above me, just below Turquoise Lake, they catch my fish all the time,โ€ he says of prized golden palomino trout heโ€™s released into the river. โ€œPrivate land owners who put a lot of money into their watersheds should not be forgotten when we celebrate trophy waters in the Arkansas and elsewhere. When we invest, everyone wins.โ€

Photo credit: Rolling J Ranch

โ€œEvery pan is a scratch ticketโ€

Kevin Singel is a guardian of one definitively old-school use of the Arkansas River. The Silverthorne resident and guidebook author is highly respected among the thousands of recreational gold panners who poke through eddies in Colorado rivers every year, sifting through sediment in search of shiny flakes swirling in their ridged pans.

โ€œIt doesnโ€™t take a very big piece to be exciting,โ€ Singel says, poking a shovel into a pile of rocks just below a shack-sized boulder on the Arkansas River. โ€œIโ€™ve had some amazing experiences just downstream of big rocks.โ€

Singel has more than 28,000 members who follow his Facebook posts detailing how to find gold in Colorado. His 2018 โ€œFinding Gold in Colorado: Prospectorโ€™s Editionโ€ details 186 sites heโ€™s visited in his search for gold. His 2023 โ€œFinding Gold in Colorado: The Wandering Prospectorโ€ details 270 legal-to-pan locations where Singel suspects there could be gold.

Not much has changed for how placer mining prospectors pan for gold. But everything else around the rivers has changed.

The 1859 gold rush in Colorado followed economic distress back East that sent countless young people West in search of fortune waiting in rocky landscapes. Many mountain communities were established during that rush as miners stuck around after scouring the hills.

โ€œThe history is powerful. We all feel it,โ€ says Singel.

After many decades of poking and prodding through the rivers, the frequency of finding life-changing nuggets has faded. A full day of panning typically yields flecks that make up a fraction of a gram. Itโ€™s been many years since a Colorado panner scored big.

Most panners count a win with tiny hydrophobic grains that flicker in a swirl of sandy sediment.

Panning for gold in a creek bed. CC BY-SA 3.0, https://commons.wikimedia.org/w/index.php?curid=300765

โ€œWe call it flour gold or even fly-poop gold,โ€ Singel says. โ€œYou just never know. This is like scratch lottery tickets. Every pan is a scratch ticket.โ€

Suddenly, the sun glints in black sand swirling in his blue pan.

โ€œThere we go. Thatโ€™s what we are chasing,โ€ he says, scooping the speckles into a tiny vial.

After a couple decades of prospecting, Singel tips his vials of gold flakes into jeweler melting pots. He turns his bits of gold collected from a couple dozen rivers across Colorado into wedding rings and pendants for his wife, nieces and nephews.

โ€œI make them come digging with me too,โ€ Singel says. โ€œItโ€™s become a thing for our family.โ€

A 100-mile video map of the Ark

Brian Ellis and his team at Wilderness Aware recently floated the Arkansas River from Granite through Caรฑon City with a 360-degree camera. The uploaded photos provide a foot-by-foot Google Street View of more than 100 miles of the river and its rapids. Ellis hopes the video can expose more potential rafters to the thrills of whitewater.

โ€œWe are thinking this could open the river to a lot more people,โ€ says Ellis, who started guiding on the Arkansas River in 1999 and he bought the venerable Wilderness Aware rafting company in 2019.

In the late 1990s, whitewater rafting was on the edge; โ€œkind of an extreme sport,โ€ says Ellis, sitting on a rock down by the Wilderness Aware boat ramp.

Today, itโ€™s much more mainstream and there are a lot more folks paddling their own rafts. Wilderness Aware, on the banks of the Arkansas River at the put-in for the easy Milk Run downstream of Buena Vista, offers boaters private river access and a parking lot. Back in the 1990s, there were maybe 100 boaters using that put-in every season. Today, more than 100 boaters pass through the Wilderness Aware boat ramp every summer weekend.

And that growth in private traffic has accompanied a general flattening and even a decline in the number of commercial rafters. Still, the more than 200,000 paying customers rafting with 45 outfitters every year makes the Arkansas River the most commercially rafted stretch of water in the country.

The Arkansas River Headwaters Recreation Area, which spans 152 miles and 5,355 acres along the Arkansas River between Leadville and Florence, hosted 1.13 million visitors in 2024. Thatโ€™s up314,000 โ€” or 40% โ€” from 2014.

The management system for the AHRA is a national blueprint for regional and federal collaboration. The recreation area is managed by Colorado Parks and Wildlife and covers four counties as the river winds through Forest Service and BLM land and a national monument.

In the early 1990s, rafting outfitters proposed a one-of-a-kind arrangement with the federal Bureau of Reclamation, the Colorado Department of Natural Resources and the powerful Southeastern Colorado Water Conservancy District, which manages the complex Fryingpan-Arkansas Project that diverts water from the Western Slope into the Arkansas River drainage to water some 900,000 users along the growing Front Range.

Since the early 1990s, the Voluntary Flow Management Program has rafts floating on about 700 cfs every day between early July and the middle of August by timing the release of up to 10,000 acre-feet of water each year from Twin Lakes. The program gives the Arkansas River one of the most reliable boating seasons in the state. In 2022, nearly 200,000 commercial rafters on the Arkansas River spent about $39 million, supporting 498 jobs and creating a $50 million economic impact in the region. Almost all of that impact is delivered in June, July and August.

โ€œThe folks who have the biggest interests in this river โ€” the owners of all the water rights and the Front Range municipalitiesโ€” they have a much greater understanding of what this resource means to recreation now than they did 20 years ago,โ€ Ellis says.

Harvey, standing in the Arkansas a few miles upstream of Ellisโ€™ rafting company headquarters, agrees. He too is seeing a bit of a local pushback on development that draws tourists to the Arkansas River when tax funds could maybe be better spent on things like housing and infrastructure. Thatโ€™s certainly the case across most of Colorado, where a growing number of communities areย redirecting lodging tax dollars once dedicated to tourism marketingtoward things like early education, housing and trails.

โ€œItโ€™s funny how you can actually kick out the other side of the economic development argument into a place where people are saying โ€˜Hey pump the brakes,โ€™โ€ Harvey says.

But itโ€™s coming from a deepening local attachment to the Arkansas River, Harvey says.

โ€œWhatโ€™s changed here is the level of collaboration,โ€ he said. โ€œWhatโ€™s impressive here and probably is a model for other places is how these varied interests work together to meet their own needs while protecting the resource. Iโ€™m not sure other communities have such an impressive coalition around their river.โ€

Both Harvey and Ellis appreciate the renewed vigor in supporting the river but they fret the accompanying shift that is scrutinizing the visitors who flock to the valley.

The summer months are, obviously, exceptionally busy along the Arkansas River. And that is stirring a bit of a shift in communities hosting all that traffic. While lots of people visit the Arkansas River, today, a lot of people are moving closer to the river. The population in Chaffee and Fremont counties is up 20% in the last decade. That growth has shifted public sentiment around the river.

โ€œPeople have moved here to better appreciate the river and its resources. But back in the 1990s and early 2000s, that often meant a lot of support for rafting. But thatโ€™s changing now,โ€ says Ellis, who employs 40 workers at the height of summer. โ€œThatโ€™s a little bit of backlash against rafting and visitors. Some people want town to be quieter in the summer because the restaurants are too full and the streets are too crowded. Itโ€™s an interesting dynamic, with a growing number of folks who are maybe not in the working world around them. And maybe they donโ€™t recognize how badly we need that tourism flow to support the local economy.โ€

In the dark

Browns Canyon National Monument, nearly a decade after it was designated by President Barack Obama, secured International Dark Sky Park certification in December 2024. The campaign was organized by the nonprofit Friends of Browns Canyon, which regularly hosts night-sky gatherings and hired tech-equipped light measuring scientists to earn the recognition by DarkSky International.

The Friends of Browns Canyon group also was instrumental in forcing the Surface Transportation Board to scrutinize a plan to revive railroad traffic over Tennessee Pass and along the Arkansas River through Browns Canyon, the Royal Gorge and Caรฑon City. The board in 2021 nixed a request for expedited approval of trains on the Tennessee Pass Line, which has not seen trains since 1997.

While that 2021 decision was a victory for communities vehemently opposed to restoring train traffic along the Arkansas River, the threat is not dead. The Tennessee Pass plan was proposed by Colorado Midland & Pacific, which promised it would only transport people and perhaps construction materials, but not crude oil on the mountain route owned by Union Pacific.

The company that owns Colorado Midland & Pacific is the planned operator of the Uinta Basin Railway in Utah. That controversial 88-mile railroad was approved by the Surface Transportation Board in 2021 but a federal appeals court overturned that approval in 2023. The U.S. Supreme Court overturned that 2023 court decision earlier this year, resuscitating a plan that would route 2-mile-long trains loaded with Uinta Basin waxy crude along the Colorado River and through the Moffat Tunnel and metro Denver en route to Gulf Coast refineries. A secondary route for that eastbound crude could be over Tennessee Pass; a possibility that galvanizes communities who fear oil-train traffic along the Arkansas River would be a step back to that industrial use of their quiet, natural waterway.

โ€œWe have come such a long way from the mining and the railroads being economic drivers to the rafters and anglers, who pioneered recreation as the new economy in this valley,โ€ said Michael Kunkel, who cofounded Friends of Browns Canyon and has lived in Chaffee County for more than 25 years.

โ€œDepending on how the chips fall with the Uinta Basin Railway, I think trains on Tennessee Pass could come back. And weโ€™ve got to fight that. There is no more precious resource than water.โ€

That water โ€” for drinking, farms, fish and fun โ€” has shaped unique communities along the Arkansas River. And those communities are increasingly ready to step up and protect the lifeblood of their valley.

โ€œItโ€™s still the river that is driving everything here,โ€ Kunkel said.

More by Jason Blevins

Arkansas River Basin — Graphic via the Colorado Geological Survey

U.S. dams, levees, stormwater, and wastewater systems get D to D+ grades, need almost $1 trillion in upgrades — Jeff Masters (YaleClimateConnections.org)

Click the link to read the article on the Yale Climate Connections website (Jeff Masters):

November 24, 2025

โ€œAmericaโ€™s infrastructure is the foundation on which our national economy, global competitiveness, and quality of life depend,โ€ begins the 2025 Report Card for Americaโ€™s Infrastructure from the American Society of Civil Engineers, or ASCE, a trade group. 

The report, issued once every four years, gave Americaโ€™s infrastructure an overall grade of C, up from a C- grade in its 2021 report. ASCE credited the improvement to the Bipartisan Infrastructure Law of 2021, plus federal partnerships with state and local governments and the private sector.

But dams, levees, stormwater, and wastewater infrastructure components received D to D+ grades. Thatโ€™s concerning given that climate change is increasingly stressing dams, levees, wastewater, and stormwater systems through heavier precipitation events. Whatโ€™s more, the federal government has shown little interest in sustaining the funding needed to continue improving infrastructure.

A โ€œDโ€ grade, in ASCEโ€™s words, means โ€œthe infrastructure is in fair to poor condition and mostly below standard, with many elements approaching the end of their service life. A large portion of the system exhibits significant deterioration. Condition and capacity are of serious concern with strong risk of failure.โ€ Each of ASCEโ€™s assessments since the first was issued in 1998 has given U.S. dams a โ€œDโ€ or โ€œD+โ€ grade. 

ASCE called for investments of over $165 billion for dams, more than $70 billion for levees, and by 2044, $690 billion for wastewater and stormwater systems. That adds up to about $1 trillion.

The change in heavy downpours (defined as the top 1% of precipitation events) from 1958-2021, from the 2023 U.S. National Climate Assessment. (Image credit: Climate Central)

Climate change is increasing the risks to water-related infrastructure

Increased precipitation in the U.S. in recent decades, partially the result of climate change, has caused an additional $2.5 billion a year in U.S. flood damages, according to a January 2021 study in the Proceedings of the National Academy of Sciences. The researchers, climate scientists at Stanford University, found that between 1988 and 2017, heavier precipitation accounted for more than one-third of the damage. 

Read: Why is it raining so hard? Global warming is delivering heavier downpours

โ€œThere is real economic value in avoiding higher levels of global warming,โ€ study co-author Noah Diffenbaugh said in an interview with E&E News. โ€œThatโ€™s not a political statement. Thatโ€™s a factual statement about costs. And it also shows that thereโ€™s real economic value to adaptation and resilience because weโ€™re clearly not adapted to the climate change thatโ€™s already happened.โ€

Aging infrastructure and more frequent and intense rainstorms cause additional strain to the nationโ€™s dams. Since 2018, heavy rains have resulted in approximately 30 dam failures or near failures just in the Midwest, according to ASCE. Some examples:

Minnesota, June 2024: The 115-year-old Rapidan Dam, which had gone through several rounds of repairs since 2002 and was assessed to be in poor condition in 2023, failed. The failure resulted in the destruction of a power station and destroyed part of a riverbank.

Michigan, May 2020: Heavy rains from a 1-in-200-year rainstorm destroyed two 96-year-old dams, the Edenville Dam and Sanford Dam, and damaged four other dams, causing $250 million in damage.

Watch: Video: Michigan dam break shows how climate change strains infrastructure

U.S. dams need over $165 billion in upgrades

Drawing upon the latest data from the Association of State Dam Safety Officials, ASCE estimated the cost of rehabilitating all non-federal U.S. dams (which comprise 96% of the countryโ€™s more than 92,000 dams) at $165 billion. Of that amount, $37 billion is needed to address high-hazard dams, defined as those whose failure would result in loss of life and significant property damage. Additional money, which was not quantified in the report, would be needed to upgrade federal dams.

Over 2,500 dams are considered โ€œhigh-hazard.โ€ This class of dams has increased by 20% in number since 2012, driven mostly by increased development in downstream areas. 

The U.S. Army Corps of Engineers says the dams it maintains are designed to serve for 50 years. Yet the average age of Americaโ€™s dams is 64 years, and over 70% of U.S. dams are more than 50 years old. Old dams are a hazard: Approximately 75% of all U.S. dam failures occurred in dams over 50 years old.

Debris fills the Feather River from the damaged spillway of Californiaโ€™s Oroville Dam, the nationโ€™s tallest dam, after its near-collapse in February 2017. The Oroville incident forced the evacuation of nearly 190,000 people and cost $1.1 billion in repairs. (Image credit: California Department of Water Resources)

A key problem for old dams is that their reservoirs gradually fill up with sediment as they age, reducing their storage capacity and increasing the risk that the dams will overtop and fail. This problem is exacerbated by climate change, because increased drought and wildfire in the surrounding watershed increase the amount of debris flowing into reservoirs during heavy rains. In addition, dams built for flood-control purposes for the climate of the 20th century may no longer be up to the task for the warming climate of the 21st century, when heavier downpours can be expected to put pressure on infrastructure not designed for such extreme flows.

Worse than most: Vermontโ€™s dams

In Vermont, the average age of the stateโ€™s dams is 89 years, and many were not built using modern codes and standards. In other words, they are not designed to withstand increasingly heavy and frequent rainstorms. Following historic flooding in July 2023, state dam inspectors found that 57 dams were overtopped by flooding, 50 dams sustained โ€œnotable damage,โ€ and five dams failed.

Read: If a megaflood strikes California, these dams might be at risk

The L-550 levee on the Missouri River overtopping during the spring 2011 floods. (Image credit: USACE)

U.S. levees need significantly more than $70 billion in upgrades

โ€œTwenty-three million Americans nationwide live and work behind a levee,โ€ the report notes. โ€œThe National Levee Database contains over 24,000 miles of levees across the U.S., but nearly two-thirds have not been assessed for risks posed to the communities behind them.โ€ 

In that context, the Civil Engineersโ€™ 2025 report card grade of D+ for the nationโ€™s 40,000 miles of levees is concerning. The ASCE said that the cost of bringing the nationโ€™s levees into a state of good repair was significantly more than the $70 billion it estimated in 2021.

U.S. levees are, on average, 61 years old, many built using engineering standards less rigorous than current best practices. The good news is that fewer than 3% of U.S. levees are rated high or very high risk, down from 4% in 2021.

Wastewater and stormwater systems are 70% underfunded

โ€œThe nationโ€™s sewers are estimated to be worth over $1 trillion and include nearly 17,500
wastewater treatment plants that operate to protect public health and ensure the well-being of communities,โ€ the report said.

In 2024, the wastewater and stormwater annual capital needs were $99 billion, but funding was just 30% of that โ€“ $30 billion per year. The report said, โ€œAssuming the combined wastewater and stormwater sector continues along the same path, the gap will grow to more than $690 billion by 2044.โ€ 

The reportโ€™s D and D+ grades for stormwater and wastewater infrastructure, respectively, were unchanged from the 2021 report, despite the injection of $46 billion allocated by the Bipartisan Infrastructure Law and Inflation Reduction Act in 2021 and 2022 to assist the stormwater, wastewater, and drinking water sectors.

Smart infrastructure spending is essential

Although massive investments in our infrastructure are essential, the money must be spent wisely. Many infrastructure upgrades donโ€™t account for future climate extremes. As sea level rise expert Robert Young of Coastal Carolina University wrote in a 2022 New York Times op-ed, โ€œmost of the funded projects are designed to protect existing infrastructure, in most cases with no demands for the recipients to improve long-term planning for disasters or to change patterns of future flood plain development. At the very least, we need to demand that communities accepting public funds for rebuilding or resilience stop putting new infrastructure in harmโ€™s way.โ€

Some of the projects funded in the 2021 Bipartisan Infrastructure Law were of questionable wisdom. For example, it allocated funds to elevate 19 single-family homes in the Florida Keys. I love the Keys, but cruel math says that it is not cost-effective to defend the low-lying islands, which are all but certain to be swamped by rising seas in the coming decades. A state-commissioned 2020 report by the Urban Land Institute found that spending about $8 billion to combat sea level rise and storm surges in the Keys would only prevent about $3 billion in damages over the period 2020-2070 โ€” a return of just 41 cents on each dollar spent. In contrast, the study found that in Miami, a similar investment would yield a return of over $9 for each dollar spent. 

And civil engineer Chuck Marohn, founder of the nonprofit strongtowns.org, argues that infrastructure spending encouraging sprawl is to be avoided, since โ€œwhen you sprawl outward, every new house adds more to the public obligation to maintain. More pipes, more roads, more services. But thereโ€™s no corresponding bump in tax productivity. Instead, you create what we call a โ€œbad partyโ€ โ€” a place where every new resident consumes more than they contribute.โ€

Bob Henson contributed to this post.

Built to Fail: Rules at UN Climate Talks Favor the Status Quo, Not Progress: Experts say stifling bureaucratic procedures that are disconnected from the climate crisis have consistently stalled COP negotiations — Bob Berwyn (InsideClimateNews.org)

Indigenous climate activists marched on Friday through the conference hall at COP30 in Belem, Brazil, to protest continued fossil fuel exploitation on Indigenous lands. Credit: Bob Berwyn/Inside Climate News

Click the link to read the article on the Inside Climate News website (Bob Berwyn):

November 12, 2025

Frustration about slow progress at the United Nations climate talks boiled over this week. After hours under the equatorial sun at COP30 in Belรฉm, Brazil, scores of protesters pushed past security guards Tuesday evening and briefly occupied parts of the negotiating area, calling for an end to mining and logging in the Amazon, among other demands.

The clash symbolized a deeper tension at the heart of the U.N. climate summits. The people demanding change are often outside the gates while those with power inside are bound by rules that slow progress to a crawl.

UNFCCC officials said two people suffered minor injuries and that parts of the venue were temporarily closed for cleanup and security checks. The U.N. and local police are investigating the protests and the talks resumed on schedule Wednesday morning. 

On Instagram, a group calling itself Juventude Kokama OJIK posted a video of the Blue Zone occupation and called it an act against exclusion.

โ€œThey created an โ€˜exclusiveโ€™ space within a territory that has ALWAYS been Indigenous, and this violates our dignity,โ€ the group wrote. โ€œThe demonstration is to say that we will not accept being separated, limited, or prevented from circulating in our own land. The territory is ancestral, and the right to occupy this space is non-negotiable.โ€

The Tuesday tumult was a stark contrast to normal proceedings at the annual conference, where delegates with swinging lanyards and beeping phones usually file meekly through the metal detectors and past the espresso kiosks as if theyโ€™re heading to an office supply expo rather than negotiations to avert catastrophic climate collapse.

Somehow, that urgency rarely crept inside, partly because the United Nations Framework Convention on Climate Change runs the annual meetings like a corporate conference, said Danielle Falzon, a sociologist at Rutgers University whose research on the climate talks draws on dozens of interviews with negotiators and other participants from both developed and developing countries at most COPs since 2016. 

In the UNFCCC setting, she said, success is measured by how long you stay in the room, how polished your presentation is, how fluent you are in bureaucratic Englishโ€”and how well you can pretend that the world isnโ€™t burning outside.

โ€œIโ€™d like to go to the negotiations and see people taking seriously the urgency and the undeniability of the massive changes weโ€™re seeing,โ€ she said. โ€œIโ€™d like to see them break through the sterilized, shallow, diplomatic language and talk about climate change for what it actually is.โ€

For all its talk of unity, the climate summit has struggled to deliver because the talks mirror the global inequalities they are meant to fix, Falzon said. Based on her research, COP hasnโ€™t made much progress because it still fails to serve the countries that have contributed least to the problem but are suffering the most from it.

The negotiations, she said, are dominated by well-staffed teams from wealthy, developed nations that can afford to be everywhere at once. Smaller delegations from less-developed countries often canโ€™t even attend the dozens of overlapping meetings.

โ€œEveryone is exhausted but people from smaller delegations are just trying to keep up,โ€ she said. That exhaustion, she added, shapes the talks themselves: those with the most capacity set the pace and define the terms, while the rest simply try not to fall behind.

โ€œYou canโ€™t just pretend that all countries are equal in the negotiating space,โ€ she said.

The imbalance is built into the institution, she said. The U.N. climate process was designed to keep everyone at the table, not to shake it. That makes it resilient, but also resistant to change, and she said her multiyear study of the talks shows the system values consensus and procedure over outcomes and the appearance of progress over actual results. 

โ€œMuch of whatโ€™s called success at COP now is the creation of new texts, new work programs, rather than real climate action,โ€ she said. After 30 years of meetings, the pattern delivers new agendas, new acronyms and new promises that keep the gears grinding but rarely move the needle on emissions, she added.

Most people involved in the climate talks see the need for change, but Falzon said that institutions are built to preserve themselves.

How (not) talk about climate

Part of the paralysis Falzon describes stems from a reluctance to speak plainly about the emergency it exists to address, said, said Max Boykoff, a climate communications researcher at the University of Colorado Boulder.

The problems associated with climate change were first framed as scientific issues all the way back in the 1980s, and that has become the dominant way we understand a changing climate,โ€ Boykoff said. โ€œBut that has crowded out other ways of knowing; emotional, experiential, aesthetic, or even just visceral ways of understanding that somethingโ€™s not right.

#Coloradoโ€™s #snowpack hits record low, with snowstorms expected to hit mountains during Thanksgiving weekend — The Summit Daily

Westwide SNOTEL basin-filled map November 27, 2025.

Click the link to read the article on the Summit Daily website (Andrea Teres-Martinez). Here’s an excerpt:

November 26, 2025

A two-part storm stretching from Friday night into Monday afternoon could create snowy conditions for Thanksgiving weekend skiers and travelers, but it wonโ€™t do much for Coloradoโ€™s record-low snowpack

Itโ€™s been a lackluster start to the winter season as Coloradoโ€™s snowpack hit its lowest level in three decades, but a warmer-than-usual Thanksgiving and subsequent weekend storm could bring some much-awaited snow to Coloradoโ€™s northern and central mountains. Coloradoโ€™s snowpack is currently at theย 0th percentile, meaning the snow water equivalent is the lowest on record for Nov. 26 since 1987. Several basins in Northwest Colorado are at 23% of normal, while snowpack levels along the I-70 corridor are closer to 24% of normal, according to National Weather Service Forecaster David Byers. The stateโ€™s end-of-month forecast doesnโ€™t promise much in terms of notable changes to the snowpack…next is a two-part weekend storm expected to bring up to 8 inches of snow to Coloradoโ€™s northern and central mountains, according to a Wednesday report by OpenSnow. The first part is set to begin Friday night with 3-6 inches of snow to the northern mountains and 0-4 inches in the central mountains.

Happy Thanksgiving!

Turkeys in Waterton Canyon. Photo credit: Denver Water

Happy Thanksgiving Day to you! Thanks for coming by Coyote Gulch.

I am so grateful for all the readers. When I’m up early in the morning looking for water news it is great to know that the blog is reaching so many folks.

Also, a huge thank you to family and friends that have helped keep me focused on the future, while not forgetting those 50 years of marriage, after Mrs. Gulch passed in 2023. I love you all.

Coyote Gulch at the Alamosa National Wildlife Refuge March 10, 2018 during the Monte Vista Crane Festival. Photo credit: Mrs. Gulch

#Drought news November 27, 2025: In the Southwest, #LakePowell is currently 29% full and #LakeMead is 32% full, with the total #ColoradoRiver system contents at 37% of capacity on November 23 (compared to 42% of capacity at the same time last year)

Click on a thumbnail graphic to view a gallery of drought data from the US Drought Monitor website.

Click the link to go to the US Drought Monitor website. Here’s an excerpt:

This Week’s Drought Summary

This U.S. Drought Monitor (USDM) week saw improvement in drought-related conditions across areas of the West, Lower Midwest, Northeast, and the South. On the map, widespread improvements were made in drought-affected areas across Arizona as well as in other areas of the Desert Southwest including western New Mexico and southern Utah. In California, storms during the past few weeks, in addition to an overall wetter pattern in recent months, have continued to help improve conditions leading to removal of areas of drought in Southern California. Since October 1st, numerous locations in California, southern Nevada, and Arizona have received record to near-record precipitation accumulations including Santa Barbara, California (+8.2-inch departure from normal), Ontario, California (+4.11 inches), Las Vegas, Nevada (+2.08 inches), and Flagstaff, Arizona (+5.71 inches). In the Pacific Northwest, drier-than-normal conditions have prevailed (past 30-days) across areas of the region including central and eastern Oregon, southern Idaho, and southwestern Montana. Moreover, snowpack conditions across the Pacific Northwest continued to lag behind normal levels. In the Lower Midwest (Missouri) and areas of the South (Texas), widespread improvements were made in response to rainfall events during the past week. In areas of the Upper Midwest (Michigan, Wisconsin), exceptionally dry conditions have prevailed during the past 60-day period with numerous locations observing record to near-record dryness. In the Southeast, warm and dry conditions continued leading to expansion and intensification of drought conditions in the Florida Panhandle, southern Alabama, and southern Georgia. In the Northeast, recent rains led to reduction of areas of drought in West Virginia, while isolated areas of New England saw minor improvements.

In terms of reservoir storage in areas of the West, Californiaโ€™s reservoirs continue to be at or above historical averages for the date (November 24), with the stateโ€™s two largest reservoirs (Lake Shasta and Lake Oroville) at 110% and 100% of their averages, respectively. In the Southwest, Lake Powell is currently 29% full and Lake Mead is 32% full, with the total Colorado River system contents at 37% of capacity on November 23 (compared to 42% of capacity at the same time last year), according to the U.S. Bureau of Reclamation. In Arizona, the Salt River Project is reporting that the Salt River system reservoirs are 54% full, the Verde River system is 68% full, and the total reservoir system is 56% full (compared to 73% full a year ago). In New Mexico, the stateโ€™s largest reservoir, Elephant Butte, along the Rio Grande River is currently 5% full (12% of average). In the Pacific Northwest, Washingtonโ€™s Franklin D. Roosevelt Lake is 94% full (105% of average for the date), Idahoโ€™s American Falls Reservoir on the Snake River is 25% full (64% of average), and Hungry Horse Reservoir in northwestern Montana is 88% full (107% of average)…

High Plains

On this weekโ€™s map, only minor changes were made in the region, including changes in eastern Kansas, Nebraska, and southwestern South Dakota. For the week, precipitation across the region was generally light and primarily restricted to eastern and central portions of Kansas as well as in eastern and central South Dakota. In terms of average temperatures, warmer-than-normal temperatures (5 to 15+ degrees F above normal) were observed across the region with the greatest anomalies observed in the Dakotas. According to NWS NOHRSC, the current regional snowpack spatial extent is limited to areas of central and northern North Dakota…

Colorado Drought Monitor one week change map ending November 25, 2025.

West

Out West, recent storms have delivered much-needed precipitation to drought-affected areas of California, central and southern Nevada, southern Utah, Arizona, southern Colorado, and western New Mexico. On this weekโ€™s map, widespread improvements were made in Arizona, across the southern-third of California, and in isolated areas of Nevada, Utah, Colorado, and New Mexico. Moreover, the recent storm activity in the southern extent of the region has boosted snowpack conditions in the southern and central Sierra Nevada, Spring Mountains (southern Nevada), San Francisco Peaks (northern Arizona), Mogollon Rim (central Arizona), ranges of southwestern Utah, and Nacimiento Mountains (northern New Mexico). Elsewhere, snowpack conditions were poor across most of the Intermountain West and Pacific Northwest. In other parts of the region, some minor degradations were made on the map in northern Colorado and north-central Montana…

South

Across much of the region, generally dry conditions prevailed this week, especially in the far southern and western portions of the region, with little or no precipitation observed. In contrast, light to moderate rainfall (2 to 4+ inches) was observed along a swath extending from central Texas to southwestern Arkansas. The beneficial rainfall led to one-category improvements in areas of Moderate (D1) to Extreme Drought (D3) with most of the improvements focused on areas of central and northeastern Texas. Elsewhere, minor improvements were made on the map in southeastern Oklahoma, southwestern Arkansas, and northern Mississippi. In Louisiana, short-term precipitation deficits (past 90-day period) and declining soil moisture levels led to expansion of areas of Moderate Drought (D1) and Severe Drought (D2). For the week, average temperatures were well above normal across the region with anomalies ranging from 4 to 16 degrees F above normal. Looking at reservoir conditions in Texas, Water for Texas (November 25) was reporting statewide reservoirs at 74% full, with many reservoirs in the eastern part of the state in very good condition, while numerous reservoirs in the western portion of the state were experiencing continued below-normal levels…

Looking Ahead

The NWS Weather Prediction Center 7-Day Quantitative Precipitation Forecast (QPF) calls for moderate precipitation accumulations ranging from 2 to 4+ inches (liquid) across areas of the South and areas of the Southeast. Likewise, a significant winter storm is expected to impact the Upper Midwest and Great Lakes regions. In the West, dry conditions are expected to prevail across California and the Great Basin, while some lighter accumulations are expected across the Intermountain West. In the Pacific Northwest, moderate accumulations are expected across western Washington and some lesser accumulations across areas of the Northern Rockies of Idaho and northwestern Montana. The Climate Prediction Center 6-to-10-day Outlook calls for a moderate-to-high probability of below-normal temperatures across the eastern half of the West, Plains, South, Midwest, and Northeast. Above-normal temperatures are expected across the Southeast and along the Pacific Coast from Northern California to Washington. In terms of precipitation, there is a low-to-moderate probability of above-normal precipitation across most of the conterminous U.S. except for northern California and western Oregon where below-normal precipitation is favored.

US Drought Monitor one week change map ending November 25, 2025.

Western rivers may be pulling carbon from the atmosphere, surprising scientists — KUNC.org

Gunnison River. Photo credit: Colorado Parks & Wildlife

Click the link to read the article on the KUNC website (Kaleb Roedel). Here’s an excerpt:

November 20, 2025

A new study in the journal Science suggests rivers in the arid American West may be doing something unexpected: absorbing carbon dioxide from the atmosphere. The finding could reshape how scientists model climate change.

For decades, researchers believed most rivers were net carbon emitters. Thatโ€™s because leaves, wood, and other organic material wash into the water, decompose, and release carbon dioxide, a process especially common in shaded, forested landscapes. Most of the data scientists had come from those kinds of environments, particularly in the eastern United States. But the Westโ€™s desert and shrubland rivers have been far less studied. Taylor Maavara, an aquatic biogeochemist and one of the studyโ€™s lead authors, wanted to change that. Her team gathered data from thousands of river monitoring sites across the continental U.S. and used machine learning to estimate whether each reach of river tends to release carbon or take it up.

Theirย resultsย point to a stark geographic split: Western rivers โ€” from Nevada to Arizona to parts of New Mexico โ€” are much more likely to act as carbon sinks. Maavara says the regionโ€™s open landscapes play a key role. With less tree cover, more sunlight reaches the water, boosting photosynthesis. And with fewer leaves and organic material falling in, thereโ€™s less decomposition, a process that releases carbon dioxide back into the air. The findings, she says, โ€œshed some light on the value of these desert ecosystems, which we tend to think of having a bit less life. We show that thereโ€™s just as much life, theyโ€™re just doing different stuff.โ€ While the U.S. as a whole still emits more carbon from its rivers than it absorbs, this study suggests that the โ€œcarbon gapโ€ may be smaller than once believed.And because arid and semi-arid regions make up a large part of the worldโ€™s land surface, Maavara says these findings could have global implications

Created by Imgur user Fejetlenfej , a geographer and GIS analyst with a โ€˜lifelong passion for beautiful maps.โ€™ It highlights the massive expanse of river basins across the country.

Coyote Gulch’s excellent EV adventure Thanksgiving 2025

Kia Niro November 25, 2025 at Coyote Gulch Manor.

I’m heading out to celebrate Thanksgiving with Hellchild and her husband. The Kia Niro is a rental from Avis. I had a bit of time to drive it around yesterday and I approve. DC Fast Charging with a CCCS1 adapter.

The October 2025 briefing is hot off the presses from Western Water Assessment

Click the link to read the briefing on the Western Water Assessment website:

November 10, 2025 – CO, UT, WY

Much of the region received above average October precipitation, except for eastern Colorado and southeastern Wyoming where below average precipitation fell. October temperatures were near to above normal throughout the region. Regional snow-water equivalent (SWE) was variable, with statewide SWE levels at 0.3 inches in Colorado, 0.3 inches in Utah, and 0.9 inches in Wyoming as of November 1. By the end of October, regional drought coverage was 51%, a 10% improvement since the end of September. Streamflow conditions were generally near normal in Colorado and Wyoming, and below normal in Utah, with the highest streamflow conditions seen in southwestern Colorado. La Niรฑa conditions continued during October and will likely shift to ENSO-neutral conditions by late winter. The NOAA seasonal outlook for November-January suggests an increased probability of above average precipitation for northern Wyoming, and above average temperatures in Colorado, Utah, and southern Wyoming.

Utah, most of Wyoming, and western Colorado received above to much above average precipitation during October. Large areas of the region received 150-200% of normal precipitation, with some locations in northern Utah, southeastern Utah, northern Wyoming, and southwestern Colorado receiving 200-400% of normal precipitation. One pocket of 400-800% of normal precipitation was observed in Big Horn County in northern Wyoming. A rainfall event in Salt Lake City, UT on October 4 nearly broke the all-time daily rainfall record of 2.64โ€ when 2.47โ€ fell. In contrast, the majority of eastern Colorado experienced 25-50% of normal precipitation, with a swath of 5-25% of normal precipitation along the Front Range and eastern slope, from Weld County in the north to Las Animas County in the south. One pocket of 2% or less of normal precipitation occurred in Pueblo County in southern Colorado.

Regional temperatures were near to above normal in October. Temperatures were 2-4ยฐF above normal throughout most of Colorado, Wyoming, and eastern Utah, with scattered pockets of 4-6ยฐF above normal temperatures throughout. A swath of 4-6ยฐF above normal temperatures occurred in southeastern Colorado, with a pocket of 6-8ยฐF above normal temperatures in Cheyenne and Kiowa Counties. The majority of western Utah experienced near normal temperatures.

As of November 1, snow-water equivalent (SWE) was variable across the region. SWE was much below normal for Colorado, from 46% of normal SWE in the Upper Colorado-Dolores basin to as low as 24% of normal SWE in the Upper San Juan basin. SWE was much above normal in the Cheyenne (167%) and Belle Fourche (167%) basins in Wyoming. Basins with above normal SWE include the Powder (132%) in Wyoming, and the Lower Colorado-Lake Mead (127%) and Lower Bear (121%) in Utah. Basins with below normal SWE include the Tongue (63%) and North Platte (51%) in Wyoming, and the Escalante Desert-Sevier Lake (69%) and Upper Colorado-Dirty Devil (50%) in Utah. Statewide SWE levels are 0.3 inches in Colorado, 0.3 inches in Utah, and 0.9 inches in Wyoming.

Note: Current SWE as a percent of normal maps are often skewed at this time of year due to the very low average SWE this early in the season.

Westwide SNOTEL basin-filled map November 23, 2025.

Regional drought conditions significantly improved during October. By October 28, regional drought coverage was 51%, a 10% improvement since the end of September. Moderate (D1) drought coverage decreased by 16% in Colorado, 6% in Utah, and 6% in Wyoming. Severe (D2) drought coverage decreased by 22% in Colorado, 32% in Utah, and 5% in Wyoming. Extreme (D3) drought coverage decreased by 13% in Colorado, 10% in Utah, and 8% in Wyoming. The most significant improvement in drought conditions occurred in southwestern Colorado, with a 2 to 3 class improvement.

Regional streamflow conditions were generally near normal in Colorado and Wyoming, and below normal in Utah. Much below normal streamflow conditions occurred in the North Fork Gunnison River basin in western Colorado, the Hamlin-Snake Valleys River basin in western Utah, and the Madison River basin in northwestern Wyoming. However, some regional basins experienced above to much above normal streamflow conditions, particularly in southwestern Colorado and southeastern Utah. Much above normal streamflow conditions occurred in the San Miguel, Animas, and Upper San Juan River basins in southwestern Colorado, the Lower San Juan-Four Corners River basin in southeastern Utah and Raft River basin in northern Utah, and the Angostura Reservoir region of the Cheyenne River basin in eastern Wyoming. The Piedra River basin in southwestern Colorado experienced streamflow conditions in the highest percentile.

La Niรฑa conditions continued in October and are expected to persist through early winter, followed by a 55% probability of returning to ENSO-neutral conditions by late winter. The NOAA Monthly Precipitation Outlook suggests an increased probability of below average precipitation for Colorado, Utah, and southern Wyoming in November. The NOAA Monthly Temperature Outlook suggests an increased probability of above average temperatures for the entire region in November. The NOAA Seasonal Precipitation Outlook for November-January suggests an increased probability of above average precipitation in northern Wyoming and part of northern Utah, and below average precipitation in southwestern Colorado and southeastern Utah. The NOAA Seasonal Temperature Outlook for November-January suggests an increased probability of above average temperatures in Colorado, Utah, and southern Wyoming.

Significant weather event: Flooding in southwestern Colorado. WWA produced a rapid assessment of the flooding in southwestern Colorado from October 10th-14th to serve as a scientific resource for understanding the drivers and impacts of the flooding events. The report is designed to support local resilience-building efforts and hazard planning for communities in the region. It provides the long-term and recent historical context for the flooding, hydrologic characteristics of the flood event, and an assessment of the local probability of an event of this magnitude.

Key Findings:

  • The October 10th-14th, 2025 floods were the 3rd largest on record for Pagosa Springs, CO, with river levels reaching a maximum gauge height of 12.82 feet and peak flow rates of 8,570 cubic feet per second.
  • A total of 12.5 inches of precipitation fell at a high-elevation observation site in the watershed over 5 days, saturating the watershed and driving the river to reach Major Flood stage twice in that period.
  • Flood frequency analysis based on historical observations of runoff in Pagosa Springs suggests this flood has a return period of 25 to 40 years, meaning that there is a 2.5-4% likelihood of a flood of similar magnitude occurring in any given year.
  • Early reports following the flooding suggest that hundreds of residents and households were evacuated in Pagosa Springs and surrounding rural communities and many structures were damaged or destroyed by the floods including homes, bridges, and roadways.
  • Nearly two decades of exposure to drought conditions, increasing wildfire activity, and now the recent flooding collectively highlight the geographically unique and increasingly frequent natural hazard risks that rural mountain communities face in southwest Colorado.

Learn more: https://wwa.colorado.edu/resources/hazard-assessments

River stage for the San Juan River at Pagosa Springs from October 9-17, 2025. From https://water.noaa.gov/gauges/pspc2.

How about just closing Comanche 3 for good?: Environmental groups outline their views about what is best in wake of Colorado #coal plantโ€™s latest โ€” and extended โ€” outage — Allen Best (BigPivots.com)

Comanche 3 in 2010. Photo credit: Allen Best/Big Pivots

Click the link to read the article on the Big Pivots website (Allen Best):

November 21, 2025

Comanche 3, the trouble-plagued coal-fired power plant in Pueblo, went down on Aug. 12. Xcel Energy, the unitโ€™s operator and primary owner, says it canโ€™t be restored to service until June 2026.

This will be the third extended outage since 2020 for the coal plant, Coloradoโ€™s largest and newest unit.

Might the best thing for Xcelโ€™s customers be if the plant remained dormant? Donโ€™t try to repair it, whatever is wrong this time. Instead, save the money and just continue operating the much older and more reliable โ€” but soon to be retired โ€” Comanche 2?

Several environmental groups have advanced that idea in response to a proposal by Xcel and three state agencies to keep Comanche 2 operating for a full year beyond its current planned retirement at the end of December.

That plan on the table would leave both coal-burning units operating in the second half of 2026, point out the Sierra Club and Natural Resources Defense Council. They would provide more power than needed and will also generate pollution at levels greater than acceptable.

Western Resource Advocates, the City of Boulder and others have similar things to say. They also embrace an alternative plan. That plan would have the stateโ€™s Public Utilities Commission give Comanche 3 a hard look in coming months instead of waiting until next summer.

โ€œThe question must be asked whether any further reliance on Comanche at this juncture is prudent,โ€ says Boulder in its filing with the PUC yesterday. โ€œRatepayers continue to bear the consequences of (Xcel subsidiary) Public Serviceโ€™s failings when it comes to Comanche 3. At some point, the bleeding must stop.โ€

In asking to keep the plant open, Xcel insists that it is vulnerable to having too little generating capacity. It is at risk of having resource inadequacy. The basics of any utility are to keep the lights on, with only rare outages. The environmental groups do not disagree, but they do question whether Xcel โ€” in concert with a trio of state agencies โ€” have over-stated the case.

Western Resource Advocates also questions what is causing the โ€œresource adequacyโ€ about which Xcel has been fretting.

โ€œThe proposed extension to the retirement of Comanche 2 and the unplanned, extended outage of Comanche 3 represent extreme circumstances that may result in tens of millions of dollars in unexpected cost and increased emissions above levels previously expected,โ€ the Boulder-based WRA says in a filing with the PUC.

โ€œFurther, the proposed variance calls into question whether the company has strained its resource capacity position โ€” at the expense of all existing customers โ€” by soliciting and accepting new large-load interconnections.โ€

Large loads are commonly understood to consist mostly of data centers.

Pueblo County, along with the city and economic development group there, take a contrary point of view. They want to see the coal plants operating without question. They insist that the coal-fired power production from both units will be needed to power the steel mill in Pueblo. The plant is formally called Rocky Mountain Steel.

Thatโ€™s partly accurate. However, the steel plant in 2023 went on-line with the Bighorn Solar Project, which has a capacity of 300 megawatts and can, on a net-basis, deliver almost all the electricity needed at the steel plant. The steel plant also operates when the sun does not shine, of course.

As part of their long-standing complaint, the Pueblo interests say that they badly need the coal jobs at Comanche. โ€œApproximately one out of every four residents receive SNAP benefits compared to the state average of one in 10,โ€ says Pueblo.

In 2018, Xcel and other parties at the negotiating table agreed that Comanche 2 would be retired by the end of 2025. The PUC commissioners stamped their approval on the agreement. That agreement assumed more or less steady operations of Comanche 3. The assumption was misguided.

Comanche 3 was down for an average 91 days each year during its first decade. Then came 2020, an outage that extended about a year and into 2021. Another outage soon followed. A 2021 PUC staff report found that the actual cost of energy from Comanche 3 had been nearly 50% higher than expected when the unit was proposed almost 20 years before.

The proposal has the backing of the Polis administration, including the Colorado Energy Office, the Office of the Utility Consumer Advocate, and the PUC trial staff. The petition with the PUC was filed Nov. 10 by Attorney General Phil Weiser.

The petitioners said that keeping Comanche 2 operating for a year was the โ€œmost cost-effective approach to providing needed electricity for the systemโ€ as identified by Xcel.

Given the outage of Comanche 3, say the environmental groups, they do not object to Comanche 2 remaining open for a year longer. They do, however, see problems with the proposal by Xcel.

First, the solution is โ€œfar broader than the problem it tries to solve,โ€ says the Sierra Club and NRDC. If both Comanche 2 and 3 are operating, they will produce more power โ€” and pollution โ€” than had been planned.

They also point to a โ€œglaring contractionโ€ in the petition by Xcel and the state agencies. They see an imminent need to justify continued operation of Comanche 2 yet propose to delay starting a litigated proceeding at the PUC until next June to investigate all options for dealing with a near-term need.

This is getting the cart before the horse, they say. โ€œGiven the long history of forced outages at Comanche 3, its repeated cost overruns, and the fact that it is already slated to retire by 2031,โ€ the PUC commissioners should weigh in before Xcel decides whether to repair Comanche 3.

The alternative plan advocated by the environmental community would keep Comanche 2 operating for a full year โ€” but place limits on the operations of the unit coupled with that of Comanche 3, whenever it returns to service. โ€œThis allows the same total amount of generation from the two units as if Comanche 3 were available for all of 2026.โ€

Comanche Generating Station. Photo credit: Allen Best/Big Pivots

Scientists study variability in snowfall, wetter #snowpack: #Climate models show #Colorado ski season shortening by 10 days — #SteamboatSprings Pilot & Today

University of Utah graduate student Joey Bail works to remove snow from the mid-mountain instruments operated by Storm Peak Laboratory in February 2025 at Steamboat Resort. The station measures dust on snow, which can increase snow melt rates.
Storm Peak Laboratory/Courtesy photo

Click the link to read the article on the Steamboat Pilot & Today website (Suzie Romig). Here’s an excerpt:

November 22, 2025

Changing snowpack trends in the West are bringing more variability to snow conditions and more moisture to the snowpack, threatening the future number of light and fluffy powder days. Increasing variability was the predominant message from a panel of snow experts during the presentation โ€œStories of a Changing Snowpackโ€ hosted by nonprofit Yampatika on Nov. 13 in Steamboat. The panel, including representatives from the Storm Peak Laboratory and Airborne Snow Observatories, presented in-depth data and answered audience questions about how changing weather and climate conditions are affecting snowfall and snowpack impact to recreation and water supplies in northwest Colorado.

โ€œWe are seeing earlier snowmelts, heavier snow, more variability,โ€ said Atmospheric Science Professor Gannet Hallar, Ph.D., who directs the Storm Peak Lab which sits atop the Steamboat Resort.

Hallar said across the Western states, scientists are confirming decreases in snow-water equivalent, according to measurements taken April 1, increasing spring temperatures and dust โ€” factors that cause snow to melt. She explained the snowflake formation science behind how even small increases in winter temperatures can make a large difference in snow quality…Earlier spring runoff, hydrograph changes and increased variability of snowpack creates challenges for everything from sufficient river flows for endangered fish species to the timing of reservoir releases to agricultural irrigation, Burchenal said. Hallar said dust on snow measurements and understanding how dust on snow impacts melt timing is important because some scientists have documented that a large dust storm may lead to a 10- to 14-day earlier snow melt off…Allen and Hallar discussed the value of snowmaking additives such as Snomax, made from a protein derived from a naturally occurring microbe, used to provide nuclei for artificial snow making.

โ€œThis allows more significant volumes of snow to be produced at lower temperatures, with less water and energy.โ€ according to the website for Snomax International. โ€œThis substantially increases the efficiency of the snow-making system, while at the same time delivering a consistent snow quality even during the most extreme temperature fluctuations.โ€

Westwide SNOTEL basin-filled map November 23, 2025.

#COP30 Backpedals on #Climate Action: Offering no new plans to cut fossil fuels, the UNโ€™s climate conference failed to produce a roadmap to stop #GlobalWarming — Bob Berwyn (InsideClimateNews.org)

The convention center in Belem, Brazil, where COP30, the United Nations annual climate talks, took place over the past 12 days. Credit: Bob Berwyn/Inside Climate News

November 22, 2025

BELร‰M, Brazilโ€”After negotiators at COP30 retreated from meaningful climate action by failing to specifically mention the need to stop using fossil fuels in the final conference documents published Saturday, the disappointment inside the COP30 conference center was as pervasive as the diesel fumes from the generators outside the tent.

This yearโ€™s United Nations Framework Convention on Climate Change was billed as the โ€œCOP of Truthโ€ by host country Brazil, but it could go down in history โ€œas the deadliest talk show ever,โ€ said Harjeet Singh, founding director of the Satat Sampada Climate Foundation in India and strategic advisor to the Fossil Fuel Non-Proliferation Treaty Initiative.

COP30 was yet another โ€œtheater of delayโ€ with endless discussions, and the creation of yet more administrative duties, โ€œsolely to avoid the actions that matterโ€”committing to a just transition away from fossil fuels and putting money on the table,โ€ he said.

A draft text released Nov. 18 clearly spelled out the need to transition away from fossil fuels, but in the final version, the language was watered down, merely acknowledging that โ€œthe global transition towards low greenhouse gas emissions and climate-resilient development is irreversible and the trend of the future.โ€

After setting out ambitious targets ahead of the climate talks, COP30 President Andrรฉ Corrรชa do Lago, the secretary for climate, energy and environment in Brazilโ€™s Ministry of Foreign Affairs, acknowledged the disappointment. 

โ€œWe know some of you had greater ambitions for some of the issues at hand. I know the youth civil society will demand us to do more to fight climate change,โ€ he said during the opening of the final plenary.

Do Lago pledged to press for more action during his upcoming year as the COP president.

โ€œI, as president of COP30, will therefore create two roadmaps, one on halting and reversing deforestation and another on transitioning away from fossil fuels in a just, orderly, and equitable manner,โ€ he said.

That was not enough for some leading climate scientists. 

โ€œImplementation requires concrete roadmaps to accelerate the phase out of fossil fuels, and we got neither,โ€ said Johan Rockstrรถm, director of the Potsdam Institute for Climate Impact Research in Germany.

Indigenous climate activists marched on Friday through the conference hall at COP30 in Belem, Brazil, to protest continued fossil fuel exploitation on Indigenous lands. Credit: Bob Berwyn/Inside Climate News

During the closing plenary, a representative from Colombia said that her country refused to accept parts of the decision as written. โ€œDenying the best available science not only puts the climate regime at risk, but also our own existence. Which message are we sending the world, Mr. President?โ€

In a post on X, Colombian President Gustavo Petro elaborated, saying, โ€œI do not accept that in the COP 30 declaration. It is not clearly stated, as science says, that the cause of the climate crisis is the fossil fuels used by capital. If that is not said, everything else is hypocrisy.โ€

He noted that life on the planet is only possible โ€œif we separate from oil, coal, and natural gas as a source of energy โ€ฆ Colombia opposes a COP 30 declaration that does not tell the scientific truth to the world.โ€

After several similar objections, do Lago suspended the plenary to consult with the UNFCCC secretariat about how to proceed, since the entire process is built on consensus. And while consensus isnโ€™t the same as unanimity, the U.N.โ€™s climate body has faced repeated criticism in recent years for ignoring the pleas of smaller countries amid the rush to finalize COP agreements.

But apparently there was enough consensus to proceed.

Looking for bright spots, former Irish President Mary Robinson, now a member of The Elders, a group of global leaders that works to address issues, including climate change, said the deal is far from perfect, but it shows that countries can still work together โ€œat a time when multilateralism is being tested.โ€

Robinson said the COP30 outcome includes concrete steps toward establishing a mechanism to ensure no countries are left behind in the transition away from fossil fuels.

โ€œWe opened this COP noting the absence of the United States administration,โ€ she said. โ€œBut no one country, present or absent, could dampen the โ€˜mutiraoโ€™ spirit,โ€ or collective effort.

Given the recent rise of global political tensions, she said Belรฉm โ€œrevealed the limits of the possible, but also the power of the determined. We must follow where that determination leads.โ€

In another of the final documents, COP30 emphasized โ€œthe inherent connection between pursuing efforts to limit the global temperature increase to 1.5 ยฐC and pursuing just transition pathways,โ€ and that such a pathway leads to โ€œmore robust and equitable mitigation and adaptation outcomes.โ€

The conferenceโ€™s adoption of a just transition mechanism was hailed as a huge win by the Climate Action Network International, an umbrella group that represents hundreds of local, regional and national grassroots organizations working on climate justice. In a statement, the group called it โ€œone of the strongest rights-based outcomes in the history of the UN climate negotiations.โ€

The outcome could have been even better with stronger leadership from the European Union, which publicly advocated for more ambition, but opposed key provisions in closed-door negotiations, several observers said.

โ€œWith the U.S. absent, the European Union had a chance to lead; instead, they stepped into the vacuum as the primary obstructionist,โ€ said Singh, including opposition to language on fossil fuel phaseout timetables.

He said the European Union member countries were โ€œplaying a cynical blame game while the planet burns.โ€ Decisions made at this and previous COPs provided the tools needed to address the crisis, but the political will and the money to implement them are still lacking.

Many eyes on the #ColoradoRiver. The #RioGrande may be more urgent: New study of river from headwaters in #Colorado to the Gulf of Mexico demonstrates need for changes — Allen Best (BigPivots.com)

San Luis Valley farm. Photo credit: Allen Best/Big Pivots

Click the link to read the article on the Big Pivots website (Allen Best):

November 20, 2025

In November 2023, I stopped by the office of Cleave Simpson, then (and still now, at least for a brief time more), the general manager of the Rio Grande Water Conservancy District.

There, in Alamosa, he shared with me his observation that the Rio Grande during the 21st century has had water declines parallel to those of the Colorado River.

Both rivers originate in Colorado, and neither river has been able to deliver the water assumed by any number of diversion projects. Problems began in the 20th century but have intensified greatly in the 21st century because of drought but also rising temperatures.

The Rio Grande has had 17% reduced flows since 2000. The Colorado River flows have declined 20%.

Of the two rivers, the Rio Grande is longer, at 1,900 miles but carries less water, 9.1 million acre-feet/year. The Colorado flows 1,450 miles and has been carrying an average 15.4 million acre-feet. Neither river has delivered water into oceans with any reliability in decades.

Sandhill cranes and a few mallard ducks roost at sunset on a sandbar of the Rio Grande in Albuquerque during January. Photo(and copyright)/WWF-us, Diana Cervantes. Top: The San Luis Valley near Del Norte. Photo/Brian Richter

Despite these parallels, the Colorado has received far more attention, as is pointed out in a new report by Brian Richter of the World Wildlife Fund and nine others from academic institutions in Arizona, California, and other states.

Why is that? The Colorado provides drinking water for about 40 million people compared to 15 million for the Rio Grande. In irrigated agriculture, itโ€™s a similar story: 22,300 square kilometers in the Colorado River Basin vs. 7,800 square kilometers in the Rio Grande.

โ€œHowever, the water crisis facing the Rio Grande Basin is arguably more severe and urgent than the Colorado River Basin,โ€ Richter and his colleagues contend. They argue for some rethinking and institutional alignments to help ratchet water use down to sustainable levels.

The study is the first full accounting of how water is consumed across the entire Rio Grande Basin. Mexico calls it the Rio Bravo.

Doesnโ€™t Colorado also have a strong accounting system, as necessary to meet requirements of the 1938 compact among states that share the Rio Grande?

Yes, says Richter. However, he adds a โ€œbut.โ€ He reports difficulty in getting estimates of  how much water is being consumed by each sector and by each crop. He believes he has succeeded.

โ€œTo my knowledge, nobody has laid out the numbers at the level of clarity and accuracy that we were able to accomplish,โ€ he said.

Another major contribution of the paper is the estimation of the degree to which water consumption is unsustainable, he said.

โ€œWe estimate that 11% of water consumption in Colorado is unsustainable. Natural replenishment from snowmelt runoff, precipitation, and groundwater recharge supplies only 89% of the water being consumed; the remainder (deficit) is being met by depleting groundwater.โ€

โ€œThe Rio Grande basin is at a tipping point, and everyone needs to be part of the solution,โ€ said Enrique Prunes, a co-author and the World Wildlife Fund Rio Grande manager. โ€œThese findings will help us rethink how we manage water to secure a future for everyone.โ€

For the second time in the 21st century, this segment of the Rio Grande in Albuquerque went dry, leaving this image of cracked sediment on a blistering afternoon on Aug. 7, 2025. Photo(and copyright)/WWF-us, Diana Cervantes

Dry cracked sediment from the Rio Grande on a blistering afternoon on Aug. 7, 2025 in Albuquerque, N.M. For the second time in the 21st century the Rio Grande has gone dry in the Albuquerque stretch. (TC) (EDITORโ€™S NOTE:
T/C, to fact check).

Agriculture uses 99.9% of the water in Coloradoโ€™s San Luis Valley and 87% in the basin altogether.

Dramatic declines in reservoir storage illustrate the scope of problem. Altogether, 12% of reservoir storage has been lost in the 21st century. The decline is most severe in New Mexico, where 71% less water was stored at the end of 2024 compared to 2002.

Groundwater depletion has been even more drastic. Roughly 15 times more groundwater has declined compared to surface storage. The two are coupled. As surface water supplies decline, groundwater mining grows.

Draining of aquifers has been a particularly vexing problem, as was explained in a story published in Headwaters magazine in June (and published in installments at BigPivots.com during July). See in particular 20th century expansion and 21st century realities in the San Luis Valley

โ€œIn the San Luis Valley of Colorado, diminished river flows and aquifer recharge have led to continued over-pumping, causing aquifers levels to decline,โ€ Richter and his team write. โ€œThe Colorado state engineer has threatened to shut off hundreds of groundwater wells if the aquifer supporting irrigated farms cannot be stabilized.โ€

The San Luis Valley is famous for its potatoes as well as the barley to make Coors beer, but potatoes use just 7% of the water and barley 9%. The vast majority of water in the valley produces feedstocks for livestock: 47% for alfalfa, 27% for other hay, and 6% for pasture lands.

The study finds that groundwater in the San Luis Valley has been depleted at a rate of 89,179 acre-feet/year, equivalent to 11% of the annual average of direct water consumption in the valley.

What can be done? Large cities have done more with less. Albuquerqueโ€™s population grew 40% while its water use declined by 17%. However, municipal and commercial water consumption account for only 7% of all direct consumption in the three-state and two-country basin.

Strategies for reducing consumption in irrigated agriculture have been proven but must be rapidly deployed at sufficient scale and financially sustained by governments, companies, and credit institutions to rebalance the basinโ€™s water budgets, state, and binational levels.

At the same time, water shortages have contributed to the loss of 18% of farmland in the riverโ€™s headwaters in Colorado, 36% in New Mexico, and 49% in the Pecos River tributary in New Mexico and Texas.

Strategies being embraced to curb groundwater drafting in the closed basin of the San Luis Valley have been controversial. A key case is likely to go before the Colorado Supreme Court. In Mexico, cutbacks have led to violence. One protestor died.

The study points to several strategies that could reshape how water is used in the basins. These include restoring river habitats, adjusting dam operations to better support seasonal flows, improving water-sharing agreements, and helping farmers switch to crops that require less water.

That effort to encourage crop-switching has been underway in the San Luis Valley, but with successes only at the margins.

Rio Grande and Pecos River basins. Map credit: By Kmusser – Own work, Elevation data from SRTM, drainage basin from GTOPO [1], U.S. stream from the National Atlas [2], all other features from Vector Map., CC BY-SA 3.0, https://commons.wikimedia.org/w/index.php?curid=11218868

#Snowpack news November 24, 2025

Westwide SNOTEL basin-filled map November 23, 2025.
Colorado SNOTEL basin-filled map November 23, 2025.

In burned forests, the Westโ€™s #snowpack is melting earlier: As blazes expand to higher elevations, the impacts cascade downstream — Mitch Tobin (WaterDesk.org)

A high-severity burn in Coloradoโ€™s Rocky Mountains. Wildfires are altering the snowpack, a crucial source of water in the West. Photo by Arielle Koshkin.

Click the link to read the article on the Water Desk website (Mitch Tobin):

November 13, 2025

As the American West warms due to climate change, wildfires are increasingly burning in higher-elevation mountains, charring the watersheds where the regionโ€™s vital snowpack accumulates. 

new study has found that in the immediate aftermath of fires across the region, the snowpack disappears earlier in burned areas. This change can threaten forest health and affect the downstream farms, cities and species that rely on the snowpack for their water, according to other research.

Scientists who study the effects of wildfires on the snowpack and streamflows are finding that the story is complex and nuanced. The impacts can vary greatly across the Westโ€™s diverse ecosystems and topography. Plus, each wildfire burns differently, so the severity of the blaze is another critical factor. 

While streamflow volume typically increases after a wildfire, the peak flows come earlier in the season, and the water may be clogged with sediment that can harm wildlife and water infrastructure. 

The new study, published in the September 17 issue of Science Advances, used satellite data to track when the snowpack disappeared each season and examined how that timing changed after a fire burned through forests. The research also concluded that warming temperatures due to climate change will further accelerate post-fire melting. 

In the first year after a fire, the researchers found that under average winter conditions, snow melts earlier in 99% of the snow zone. โ€œPostfire snow cover loss is more extreme in relatively low-elevation, warm environments compared to that in high-elevation, cold regions,โ€ wrote the researchers from the Colorado School of Mines and the University of Colorado Boulderโ€™s Institute of Arctic and Alpine Research.

The loss of the forest canopy due to a fire can actually increase snow accumulation on the ground below because scorched trees that are missing branches and needles intercept fewer falling snowflakes. But opening up the canopy changes the flow of energy in the forest by exposing the underlying snowpack to more solar radiation that can melt the snow.

Wildfires also cause soot and darkened debris to fall on the snowpack, which reduces its reflectivity, allows more heat to be absorbed and leads to quicker melting. Burned forests are also more susceptible to wind, which can further erode the snowpack.

โ€œItโ€™s basically just a big energy balance puzzle, but it seems like that increase in sunlight and decrease in the reflectivity of the snow are both leading to (an) earlier snow disappearance date,โ€ said lead author Arielle Koshkin, a doctoral candidate in hydrologic science and engineering at the Colorado School of Mines. โ€œEven if we do see more snowfall in the forest, itโ€™s not overriding those energy balance changes.โ€

The study notes that previous research has found that the acreage of Western forests burned in the seasonal snow zone increased by up to 9% annually between 1984 and 2017, with the biggest rise in burned area occurring above an elevation of 2,500 meters (8,202 feet).

โ€œFire is burning higher and higher in elevation, which increases this overlap between where burned forests are and where it snows,โ€ Koshkin said.

Stephanie Kampf, a professor of watershed science at Colorado State University who wasnโ€™t involved in the study, said the findings are โ€œpretty consistent with prior researchโ€ showing that snow disappears earlier after a fire and that lower-elevation locations with more โ€œtransitionalโ€ snowpacks are more vulnerable. โ€œThis study shows it really nicely with a big dataset,โ€ Kampf said. 

Climate change speeds up melting

Looking ahead, the authors project that post-fire melting will accelerate further as the West gets hotter due to rising atmospheric levels of greenhouse gases. If warming increases by 2 degrees Celsiusโ€”something thatโ€™s possible by the middle of the 21st century under some emissions scenariosโ€”โ€œ73% of the snow zone would experience more extreme earlier postfire snowmelt compared to historically average conditions,โ€ according to the paper.

โ€œUnder two degrees (Celsius) warming, the areas that already showed large changes are going to show even larger changes,โ€ Koshkin said. โ€œThat warming is going to really have (an) impact on those warmer snow climates. So think maritime, Cascades, Sierras, comparative to the higher, colder, Rocky Mountain West.โ€

Previous research has also looked at what happens to the snowpack after a fire and found that the snow disappearance date moves up four to 23 days. Some of those studies have used ground-based observations, but the papers typically focused on one to three fires. Other research has examined snowpack readings from the automated SNOTEL network, but those snow sensors are usually placed in gaps in the forest canopy and may not capture the diversity of the Westโ€™s landscapes.

This new study relies on images captured by the MODIS instruments aboard two satellites to provide a Westwide look at wildfireโ€™s effects. Currently, satellites cannot measure the water content of the snowpack, known as the snow water equivalent. But repeated satellite imagery can detect whether snow is present on the ground, allowing researchers to measure when the snowpack disappears during the year.

โ€œI was really interested in seeing if we could leverage remote sensing to look at it on a pixel-by-pixel scale across the whole Western United States to really try to understand, are we seeing the same responses in the Pacific Northwest as in Colorado?โ€ Koshkin said. 

Each pixel in the MODIS satellite imagery represents a square on the ground with 500-meter (1,640-foot) edges. Thatโ€™s a somewhat coarse resolution for measuring the snowpack, which can vary dramatically over very short distances, but the satellites provide daily or near-daily coverage. 

While satellite data offers broad coverage of the region, it has significant limitations. 

โ€œThe satellites canโ€™t really peek underneath the forest canopy,โ€ said Anne Nolin, a professor in the geography department at the University of Nevada, Reno, who wasnโ€™t involved in the study. (Koshkin is a former student of Nolinโ€™s.) โ€œThe other issue is that the satellite data canโ€™t measure snow at times when thereโ€™s rain occurring or anytime thereโ€™s cloudiness. And so if you have a rain-on-snow event thatโ€™s changing your snowpack, which weโ€™re having more and more, and which we would anticipate to occur more frequently, then youโ€™re probably missing short-term changes in snowpack.โ€

Nolin said that the satellite-based estimates of the snowpack were โ€œlikely to be inaccurate in places where you have remaining forest, and especially in low-elevation snow zones and under warmer winter conditions.โ€ Thatโ€™s because previous studies have found that in warmer forests, the snow melts off under the canopy early, but itโ€™s retained in the gaps between the trees, so the algorithm used to process the satellite imagery can overestimate the amount of snow in the pixel. โ€œThereโ€™s less snow there than you think,โ€ Nolin said. 

Stark regional differences

Elevation, temperature, burn severity, vegetation type and the amount of incoming solar radiation are among the drivers explaining when the snow disappears. The variability of these factors across the West may help explain why previous studies have found such a wide range in the timing of the snow disappearance date. 

โ€œEverywhere we looked was disappearing earlier, but there were these kind of hotspots that disappeared way earlier,โ€ Koshkin said. โ€œI think the disruption in streamflow from these earlier melting-out pixels will be much more significant in Oregon, Washington and California.โ€

Wildfires had the biggest effect on the snowpack during the first five years after the blaze. In the first year after a fire, the snow disappearance date advanced by an average of 3.3 days. That might not sound like much, but the figure is just an average for the entire Westโ€”in some parts of Northern California and Oregon, the snow disappeared up to two weeks earlier. 

Over time, the effects of fire declined. Ten winters after a blaze, for example, the average snow disappearance date moved up by less than a day. 

While the advance of the snow disappearance date was most pronounced at lower elevations, the snowpack actually persisted slightly longer in some burned areas in Colorado and Utah, where the colder temperatures at higher elevations can insulate the snowpack from changes.

The finding that some higher elevation locations had a later snow disappearance date โ€œwould definitely be something to explore because everything that we know so far suggests that snow disappearance should be earlier after a fire,โ€ Kampf said. 

Higher elevations may be less vulnerable to an early disappearance of the snowpack due to late-season storms. โ€œHere in Colorado,โ€ Kampf said, โ€œwe get a fair amount of spring snow, and so thatโ€™s one of the reasons why weโ€™re not as sensitive because sometimes that snow just comes in May and it resets everything and you donโ€™t see the big change in snow disappearance date.โ€

Another factor in explaining the regional differences is the Westโ€™s diversity of vegetation.ย 
โ€œThe forests are different in places that are colder, so you have different tree species and different densities of forest and different ecosystems in general,โ€ Nolin said. โ€œThe northern tier of states and the high countryโ€”thatโ€™s where you would be probably seeing the least amount of change. It doesnโ€™t mean, though, that you have the least amount of fire because some of these places, especially in places like Idaho and Washington state, have significant amount of fire, and thereโ€™s some interesting studies that have shown earlier snowmelt in those locations as well.โ€

A large burn scar in the Northern Rocky Mountains. Post-fire changes to the snowpack vary significantly across the Westโ€™s diverse landscapes. Photo by Arielle Koshkin.

How wildfires change streamflow

Previous research has found that wildfires can significantly alter the timing and magnitude of runoff in burned watersheds, but scientists are still unraveling the details.

โ€œIf you burn down the forest, you donโ€™t have as many trees that are using that water,โ€ Nolin said. โ€œYou probably expect the streamflow to be earlier because the snowโ€™s melting off earlier.โ€

Fires can not only kill trees and ground cover that would absorb waterโ€”they can also eliminate organic material in the soil, which causes the ground to become more water repellent and makes the snowmelt more likely to run off into streams. 

2022 study that examined 72 forested basins that burned across the West found that average streamflow was significantly higher after a wildfire for an average of six years. The increase in streamflow was greater in areas where the extent of wildfire was larger. That study also found that the annual acreage burned by wildfires in the West skyrocketed by more than 1,100% from 1984 to 2020. 

Kampf said more research is needed to understand how streamflow changes after a fire. โ€œWe donโ€™t have all those interactions figured out yet, but there have been some studies that have shown that streamflow actually decreases after fire,โ€ Kampf said. โ€œWe certainly know it will affect streamflow timing, but the amount of streamflow weโ€™re less sure.โ€

Fire intensity is one key determinant of subsequent streamflow. 

โ€œIf the forest is totally torched, then the increased solar radiation thatโ€™s coming into the snowpack is going to have a much bigger effect than if the trees still have live branches on them,โ€ Kampf said. โ€œSimilarly, when you get down to the soil, if the soil is totally burned to a crisp, then its infiltration impacts will be much greater than if a lot of the litter and other stuff in the soil is still there.โ€

Nolin said she would have liked to see the authors distinguish between areas of high, moderate and low burn intensity. 

โ€œWhen you see photographs of burned areas, we tend to show the photos that are most dramatic with just charred trunks that have (been) left behind, but in fact, most fires are mainly low to moderate burn severity that maintain the forest canopy,โ€ Nolin said. โ€œTo not distinguish between different burn severities and to indicate that itโ€™s all about the canopy being burned off and all of this carbon shedding on the snowโ€”I think that stretches the results.โ€

The speed of vegetation recovery also shapes how the snowpack and streamflows respond to wildfire over time.

โ€œIf itโ€™s a forest type where the vegetation can respond quickly and come back, thatโ€™s going to be a really different response than if the vegetation is slow to grow,โ€ Kampf said. โ€œHere in Colorado, we have some fires where itโ€™s not coming back as forest at all, and where there are just no seedlings, and so we would expect the fire effect on snow to persist for a long time because we just donโ€™t have trees coming back.โ€

The post-fire effects on streamflow tend to be localized, so it can be difficult to detect their effects on major river basins. 

โ€œEven though the fires weโ€™ve been experiencing have been really large, theyโ€™re still not huge compared to the size of the watershed as a whole,โ€ Kampf said. โ€œIf you looked at something like the Colorado River Basin, it might be hard to detect the fire effect on the flow because thereโ€™s such a huge area thatโ€™s contributing to that flow. So in terms of how water is managed in forecasting and dam operations, I donโ€™t think weโ€™re there yet in terms of knowing how to account for fire.โ€

A major worry for water managers is the threat of high-intensity fires burning through dense stands of forest in the watersheds above their systems. 

โ€œThose are places that water managers are concerned about because if the forest burns, then they experience problems with post-fire erosion and sedimentation and harms to water infrastructure, so itโ€™s kind of a different side of the water management issue,โ€ Kampf said.

Impacts on ecosystems

Besides posing challenges for water managers, wildfires can have profound effects on wildlife and forest health.

For aquatic ecosystems, โ€œhaving a shift in the timing of when flow is coming in could also have an impact,โ€ Kampf said, but โ€œprobably the greater impact is when that flow is bringing in with it a lot of sediments that are changing the habitat more profoundly.โ€

More rapid melting of the snowpack after a fire can also lead to a longer dry season for forests.

โ€œIf the snow disappears earlier, plants will start greening up sooner,โ€ Kampf said. โ€œIf theyโ€™re not getting a lot of summer rain, they may find drier conditions later in the growing season that can stress plants.โ€

In addition to snow disappearing earlier due to fires, Nolin said the weather in November is getting drier. โ€œIf you have an earlier snow disappearance date and a later snowfall date, that dry seasonโ€™s really getting quite a bit longer, and so it means that you have a decline in forest health and you also have an increase in the potentialโ€ for a longer fire season, Nolin said.

How burned ecosystems will respond to fire remains an open question as the climate continues to warm. In many parts of the West, decades have passed since flames swept through a forest, but trees have yet to return.

The burned trees may be centuries old, โ€œand the climate was different than when those little seedlings sprouted and became the big trees that ultimately were involved in the fire,โ€ Nolin said. โ€œThey grew initially under a different climate, and we donโ€™t have that climate anymore, so we might see a lot more shrubs.โ€

Nolin said the paper โ€œused a very simplistic approach to looking at future impacts on snowโ€ by only examining what will happen under 2 degrees Celsius of warming. Climate change will also alter such factors as relative humidity and precipitation, so including these other effects โ€œwouldโ€™ve been more nuanced and perhaps a little more supportable,โ€ Nolin said. She would have liked to see the results for various temperature increases up to 4 degrees Celsius, noting that mountains are warming faster due to climate change, and a key question is whether rain or snow will fall under warmer conditions. 

โ€œJust having a single temperature change to look at helps us understand the impacts of temperature, and thatโ€™s great, but there is a lot more to be done in this area,โ€ Nolin said.

This story was produced and distributed by The Water Desk at the University of Colorado Boulderโ€™s Center for Environmental Journalism.

The latest seasonal outlooks through February 28, 2026 are hot off the presses from the #Climate Prediction Center