The health of our waters is the principal measure of how we live on the land — Luna Leopold

Click the link to read the article on the Summit Daily website (Shelby Reardon). Here’s an excerpt:
March 1, 2024
This is where Colorado’s resorts’ snow totals stand so far, according to resorts’ websites and unofficial tallies from OpenSnow.com:
- Steamboat Springs, 294 inches
- Winter Park, 257 inches
- Wolf Creek, 238 inches
- Powderhorn Mountain Resort, 220 inches
- Vail Mountain, 215 inches
- Copper Mountain, 215 inches
- Aspen Highlands, 214 inches*
- Crested Butte, 213 inches
- Snowmass, 211 inches*
- Breckenridge, 208 inches
- Beaver Creek, 203 inches
- Monarch Mountain, 202 inches
- Silverton Mountain, 190 inches
- Telluride, 185 inches
- Aspen Mountain, 179 inches*
- Arapahoe Basin, 177 inches*
- Loveland Ski Area, 177 inches
- Keystone Resort, 169 inches
- Purgatory, 167 inches
- Ski Cooper, 165 inches
- Eldora, 150 inches
- Buttermilk, 118 inches*
- Sunlight Mountain Resort, 98.5 inches
Unofficial number from OpenSnow.com are marked with an asterisk.

Click the link to read the article on The Denver Post website (Elise Schmelzer). Here’s an excerpt:
March 3, 2024
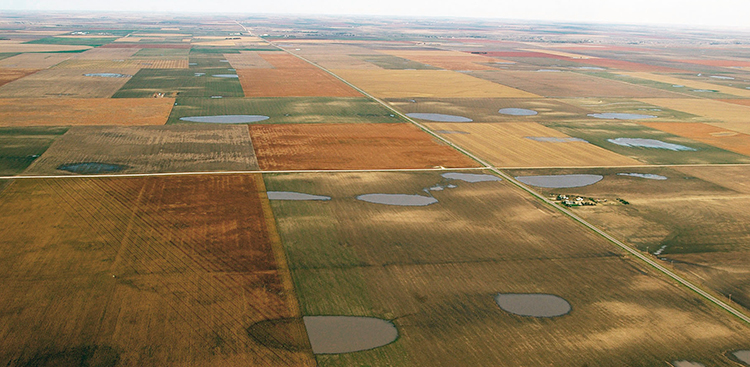
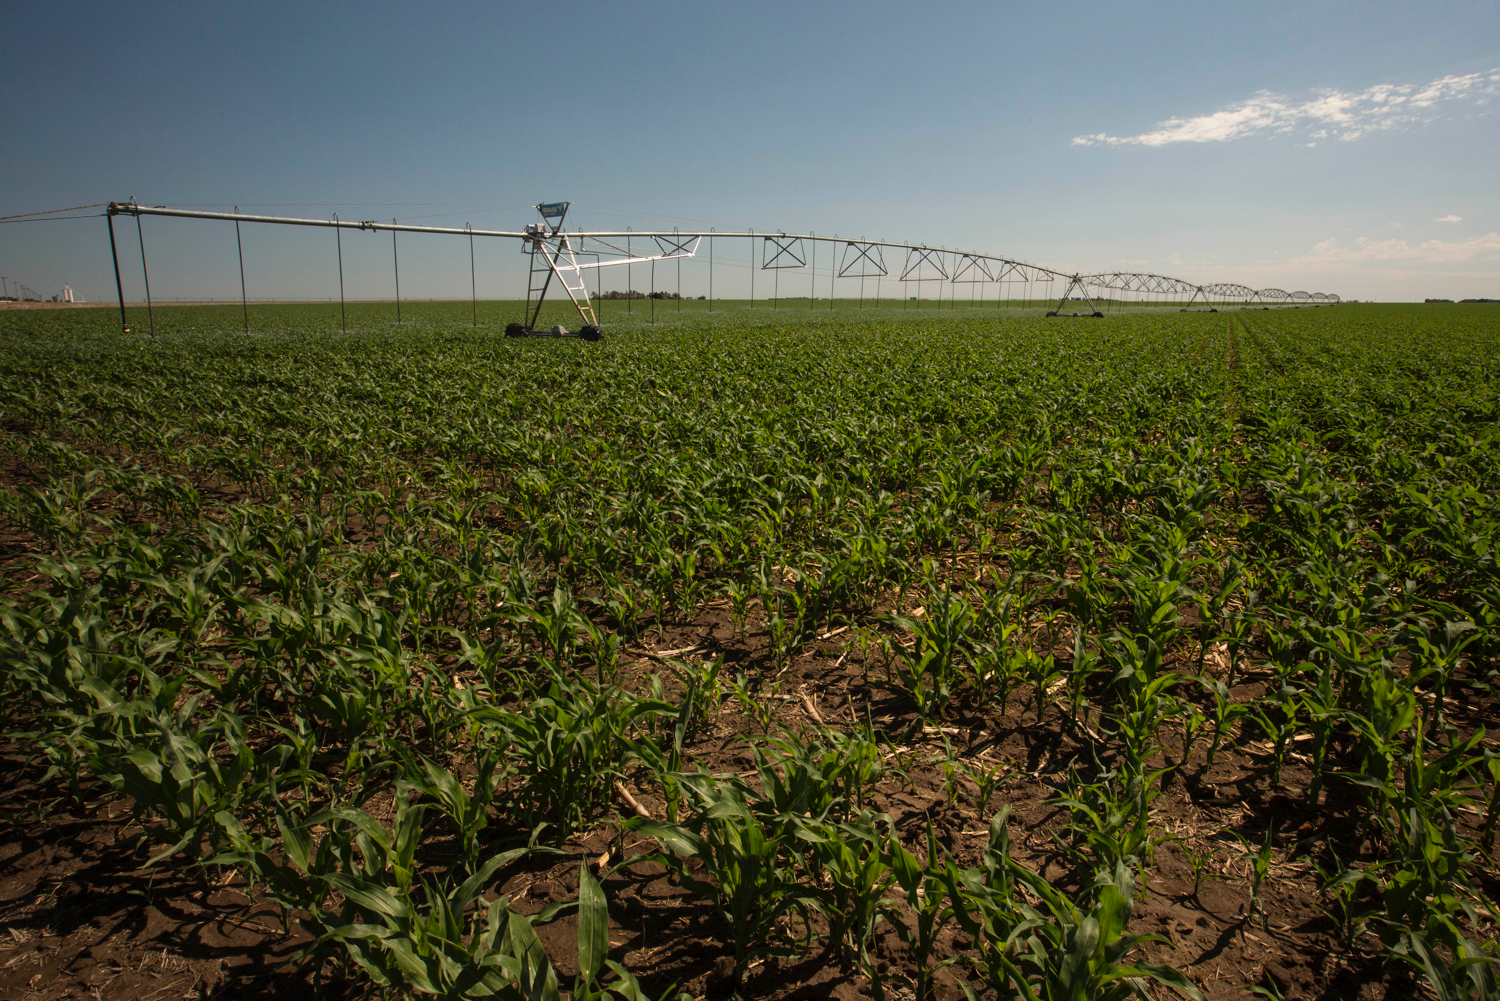
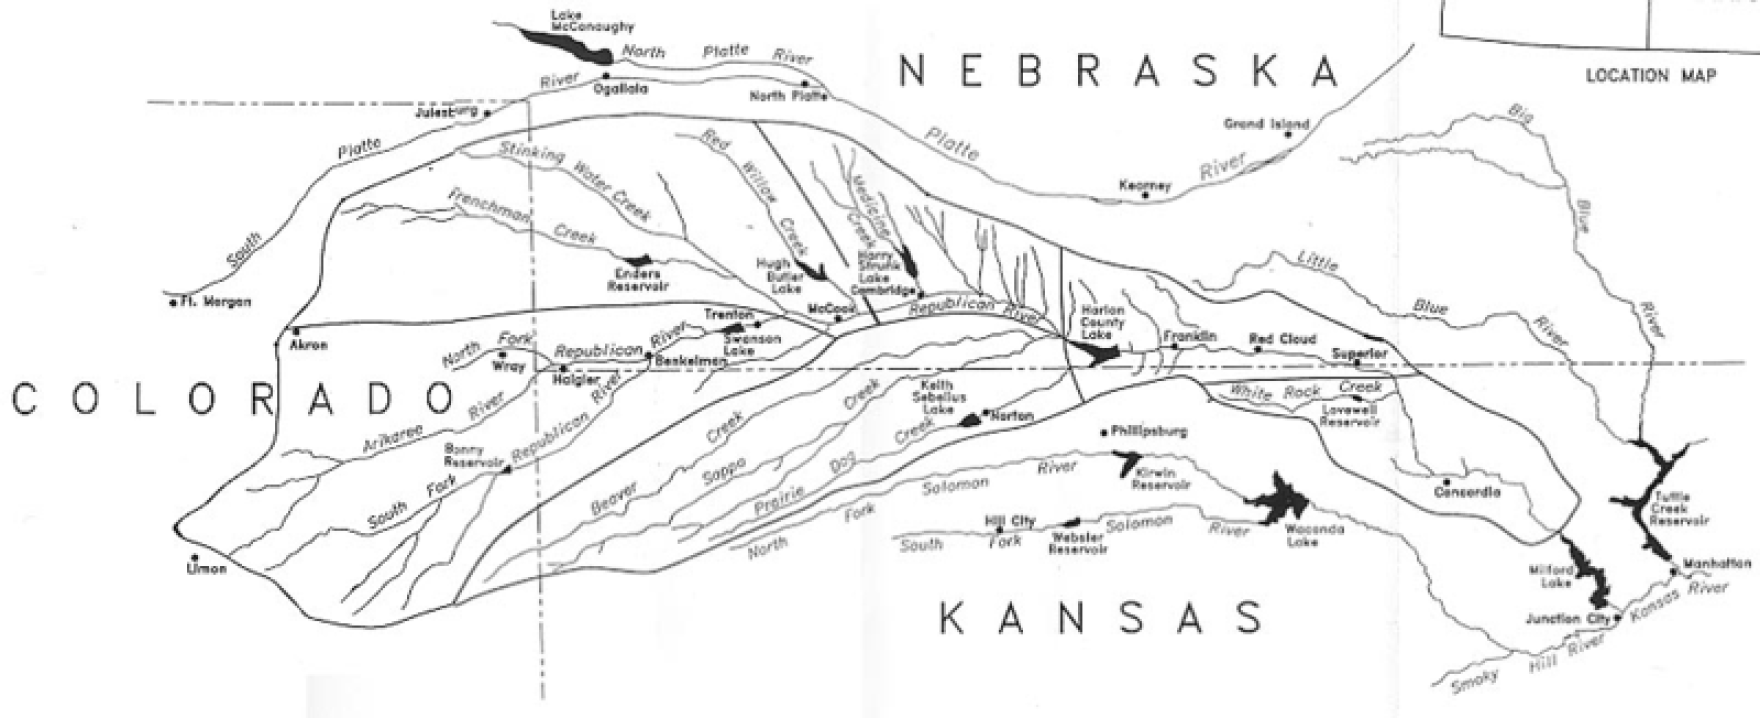
For decades, farmers in the Republican River basin have pumped water from the underground Ogallala Aquifer to grow wheat, beans, corn, potatoes, and feed for cattle and hogs. But the water is running out. Flows in the Republican River system are shrinking as the aquifer depletes, making it harder for Colorado to send enough water downstream to the east to fulfill its agreements with Kansas and Nebraska. To meet its obligations, Colorado is legally required to stop irrigating 25,000 acres in the southern part of the basin by the end of 2029 — more than a quarter of all irrigated acreage in that area. If the mandate is not met, state water officials say they will turn off wells for all 540,000 irrigated acres in the broader swath of the state that’s in the river basin, a move that would devastate the region’s economy and way of life…
With wells cut off, farms wouldn’t be able to grow crucial crops that feed Colorado and the wider region. The companies that sell farming supplies, such as seed, tractors and sprinklers, would lose massive amounts of business…Less local income would mean fewer meals at local restaurants in the plains towns and trips to the movie theater or bowling alley. Tax revenue would fall, potentially impacting schools and emergency and social services. Without irrigation, land values would drop — giving farmers less collateral for the loans they depend on to begin each season.
“What’s frightening about it is that it’s really an existential issue for those living in that region,” said Jordan Suter, a Colorado State University professor tasked with examining the economic fallout from that scenario. “With good reason. If irrigated production goes away, the area can’t really support a large population.”
Groundwater from the aquifer makes irrigated farming possible across a large part of Colorado’s Eastern Plains that spans about 7,000 square miles across eight counties — an area the size of New Jersey. In 2022, the counties produced more than $2.6 billion worth of agricultural products, according to the U.S. Department of Agriculture’s farm census. The state has made some progress, but even if it meets the 25,000-acre goal, the aquifer’s water level is still declining.


Click the link to read the article on the Water Education Foundation website (Nick Cahill):
February 29, 2024
When residents of the Yuba River watershed northeast of Sacramento saw a stretch of the emerald-green river suddenly turn an alarming reddish-brown on a recent winter day, they knew immediately who to call.
Though water quality concerns are the purview of federal, state and county environmental agencies, they alerted the local South Yuba River Citizens League, confident its volunteers could get to the scene quicker and investigate the discoloration faster than any regulator.
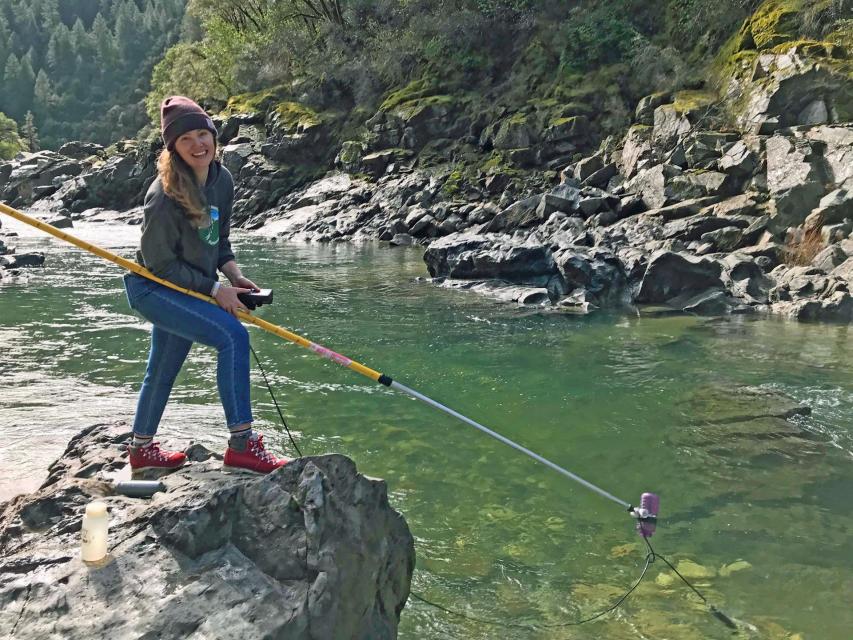
Sure enough, the group found the likely culprit within hours. One of its trained river monitors took samples at the site near the Gold Rush-era town of Nevada City, ran a series of tests, then compared the results with those from samples volunteers had routinely collected for more than 20 years – from the same section of river and the same time of year.
“Our baseline data allows us to look back on how the river has behaved at certain points in time, and lets us quickly identify anomalies,” said Aaron Zettler-Mann, the league’s executive director, who develops stream-sampling tools for volunteers as part of his post-doctorate research in geography. “We worked backward and determined it was probably just a small landslide.”
The league is among dozens of volunteer organizations that monitor the health of their local waterways and native fish populations across California and the West.
As new threats emerge, the community stream stewards bring their data and observations to the attention of environmental enforcement agencies. Colorado takes the relationship a step further by formally partnering with streamkeepers and using their data to inform decision-making.
Often referred to as “streamkeepers,” the grassroots groups are meticulous chroniclers of river conditions – the Yuba league alone records water temperature, pH, dissolved oxygen and turbidity at 37 sites across 40 river miles – and are often the first to detect problematic trends.
Information from streamkeeper groups has influenced California policymakers in setting minimum stream flow requirements for native fish, establishing water quality standards for treated wastewater disposed in streams and designating stretches of rivers “wild and scenic” to keep them free of dams and diversions.
“These groups get the data from the ground level and make it real,” said Felicia Marcus, former chair of California’s State Water Resources Control Board, which polices water quality. “Their stories can be really important and powerful in the public policy arena.”
Versatile Volunteers

Some larger groups like Los Angeles Waterkeeper have fundraising and public relations staff and are linked to larger networks while many of the smaller, more grassroots organizations like the Friends of the Shasta River monitor waterways in more remote areas.
Native American tribes are no less active in protecting their watersheds. Several tribes are the driving force behind the ongoing removal of four hydroelectric dams on the Klamath River. At Clear Lake, just north of Napa Valley’s wineries, the Big Valley Band of Pomo Indians and the Elem Indian Colony are taking the lead on spotting toxic algal blooms that harm fish and taint water supplies.
Streamkeeper groups share similar core goals: reduce pollution, monitor stream conditions and gather data that can help officials make informed water policy decisions.
Mostly comprised of trained volunteers, the groups lead river clean-ups, survey locations for habitat restoration, conduct routine water quality testing and educate the public on the importance of healthy watersheds. Retired biologists, ecologists, conservationists and former employees of natural resource agencies are common in the ranks of volunteers as are riverside property owners.
Andrew Rypel, director of the Center for Watershed Sciences at the University of California, Davis and former member of a streamkeeper group in Alabama, cast these volunteers as the “ultimate transdisciplinary water professional.”
“They tend to know something about science, ecology, agriculture, the people who live along the waterbody and the economics of the situation,” he said. “They’re in the middle of everything.”
Punching Above Their Weight
Some California streamkeepers wield their local knowledge to spur regulatory changes.
One of the preeminent streamkeeper success stories comes from Putah Creek, an 85-mile-long stream that winds through parts of Northern California’s wine country before draining into the Sacramento River.

In 1990, the volunteer-led Putah Creek Council sued the Solano Irrigation District and Solano County Water Agency to release more water from a dam to sustain chinook salmon and other native fish species downstream. The city of Davis and UC Davis later joined the council as plaintiffs.
After a protracted legal fight, a state judge ordered a new flow schedule for the creek that requires the water agency to provide more water when certain species are spawning or migrating out to the ocean. As part of a settlement over the lawsuit, the water agency agreed to create a permanent streamkeeper position on staff.
Having a dedicated, long-term funding source for the streamkeeper position has been key to the creek’s recovery, said Max Stevenson, who assumed the full-time job in December 2021. He added that some of his most important work is done off-stream, engaging with interest groups.
“Long-term relationship building is the key,” Stevenson said. “All the users – landowners, regulatory agencies, the public and cities – they have to get along.”
The lower Putah Creek, which commonly ran dry during drought and was a haven for illegal dumping, has seen a resurgence in its salmon and steelhead trout populations thanks to consistent flows and habitat restoration, according to UC Davis researchers.
A similar effort is underway in the San Joaquin Valley, where local streamkeeper groups are among those pressing the city of Bakersfield to keep more water in the lower Kern River for fish. A state judge has ordered the parties to come up with a plan that ensures “public trust flows” to benefit fish while the case is pending.
Los Angeles Waterkeeper has routinely filed lawsuits over the past 30 years, forcing the state and local governments to curb sewage spills and reduce the flow of toxic urban runoff into streams and along the Pacific coast.
“While no one likes to go to court, a lawsuit is often the only way to get polluters and regulators to do the right thing,” said Kelly Shannon McNeill, the Los Angeles group’s associate director.
Streamkeepers are also known for rallying against new dams.
The Yuba league was hatched in the 1980s primarily to fight proposals for more dams on the river. It swayed local politicians to fight against the projects and — after nearly 20 years of lobbying — state lawmakers gave the Yuba wild and scenic status, permanently banning new dams and diversions on nearly 40 river miles. The group now has about 3,500 members.
Since then, stretches of several other rivers have been added to the state’s wild and scenic list, most recently a portion of the Mokelumne River in 2018.
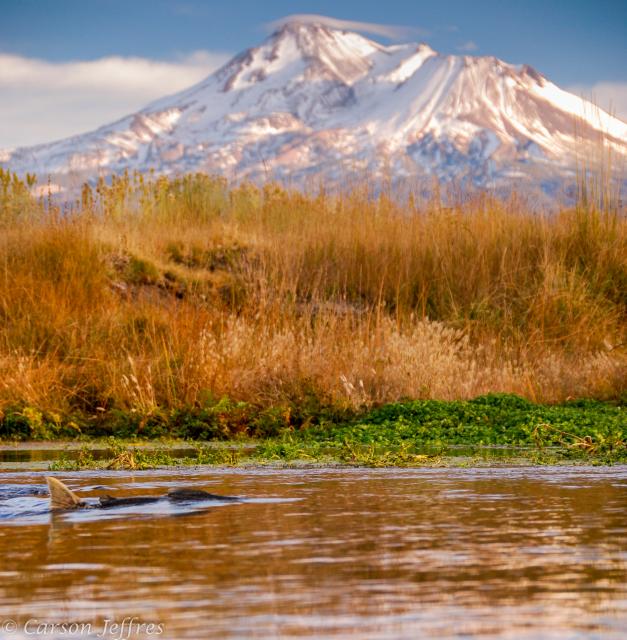
Near the California-Oregon border, Friends of the Shasta River has had recent success in protecting salmon and other native species on a key Klamath River tributary.
The group formed in 2019 out of frustration over the lack of streamflow protections for a river that historically produced about 50 percent of the chinook salmon in the Klamath River basin. The group, comprised of local scientists, retired natural resource professionals and riverside property owners, documents water conditions and promotes the river’s values in rural Siskiyou County.
“The Shasta River is tiny, more of a creek running through a desert, but arguably for its size it was probably the most productive salmon-bearing stream on the face of the earth,” said David Webb, a Friends of the Shasta River board member.
The Shasta streamkeepers, the Karuk Tribe and other salmon activists filed petitions that prompted the state water board to temporarily limit water diversions during the last three years on the Shasta and nearby Scott River. Regulators are currently gathering scientific data and considering whether to adopt permanent minimum flow requirements to ensure the rivers don’t run dry during critical periods for native fish.
“We’ve waited long enough; we need permanent instream flows so that public trust resources are protected,” Webb said.
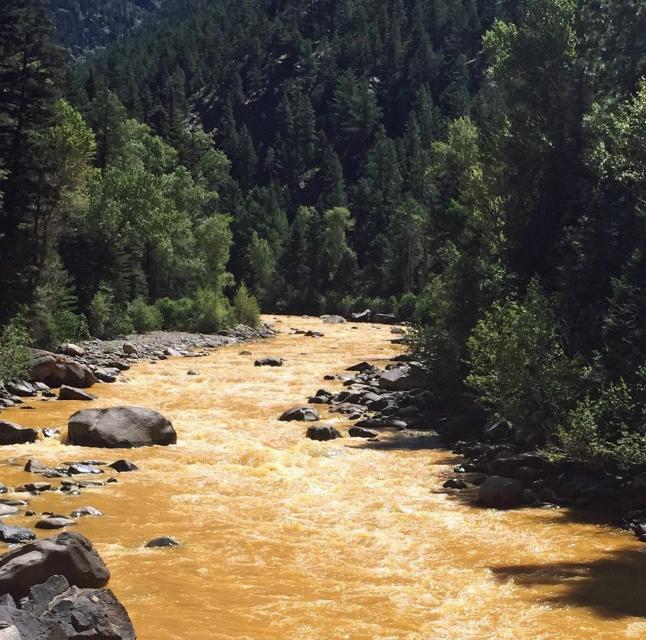
A River Turns Orange
For more than three decades, Colorado has relied on a virtual army of volunteers to track the health of the state’s more than 150 rivers.
Before 1989, conditions on most of the state’s 770,000 miles of river weren’t monitored. Important water decisions were made without reliable data. To better inform decision-makers, the state created a program that enlists streamkeepers, teachers and students to gather water quality data.
Today, the River Watch program managed by Colorado Parks and Wildlife and the nonprofit River Science has about 100 volunteer groups that monitor hundreds of streams. Revenue from the state lottery helps pay for the program.
Megan McConville, who manages the program for the state, says the thousands of volunteers serve as eyes and ears for Colorado’s streams, spotting trends unseen by environmental regulators.
“These students, these volunteers, they know their rivers better than I ever will,” McConville said. “What I love about this program is that I can call a volunteer and ask them ‘Hey, could you expand your monitoring to include two more locations? We want to figure out whether a culvert is introducing zinc into a waterway.’”
Streamkeepers came in particularly handy in 2015 when 3 million gallons of orange sludge spilled from an abandoned mine and tainted the Animas River, a Colorado River tributary. The state used the volunteers’ baseline data to track its progress on the river cleanup.
‘They Can Have Your Flank’
While streamkeepers have had legal fights with water suppliers and regulators, partnerships between them are becoming more common in California.
Both the South Yuba River Citizens League and the Yuba Water Agency are working with a broader coalition to restore 275,000 acres of forest in the river’s upper Sierra watershed. They are also cooperating on habitat restoration projects and a proposal to create a channel that will allow threatened green sturgeon to get around a dam on the Yuba.
Willie Whittlesey, Yuba Water Agency general manager, credited the 2008 Yuba Accord for fostering ongoing partnerships on the Yuba.
“This is a new way of doing things,” Whittlesey said of the series of agreements among the agency, environmental groups, farmers and hydroelectric producers.
Meanwhile, in California’s capital city, streamkeepers are becoming effective advocates. Marcus, the former head of the state water board, said grassroots groups have figured out creative ways to draw attention to problems in ways that regulators can’t.
She credited groups, such as those that brought jars of tainted drinking water to public hearings and press conferences, for winning legislative support for more water board staff and resources to regulate rural drinking water systems.
“They can have your flank,” said Marcus, who in 1985 co-founded the grassroots Heal the Bay group to fight pollution in Santa Monica Bay and elsewhere along Southern California’s coast. “Sometimes they highlight a problem and then the agency can get the resources needed to address it.”
Streamkeepers can also aid regulators by carefully reviewing pending orders and rules. During her stint as state water board chair, Marcus said the California Coastkeeper Alliance was particularly adept at articulating the pros and cons of draft documents and then working with the regulator on useful changes. “It makes it easier for you as a regulator,” she said.
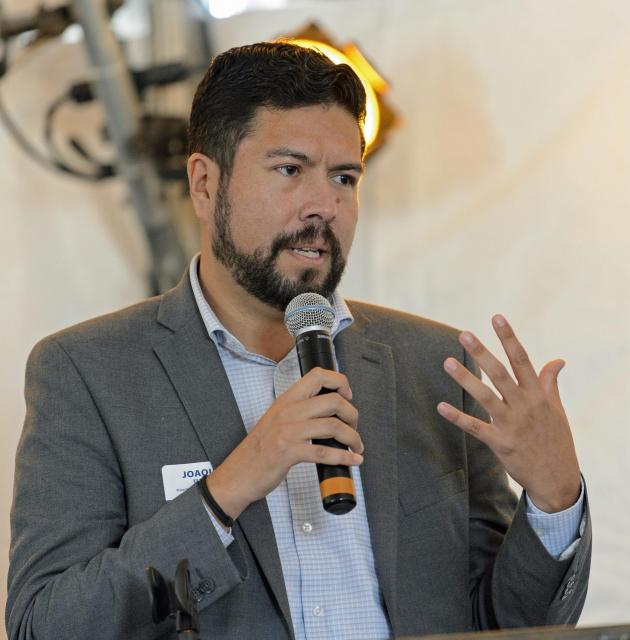
Joaquin Esquivel, the current board chair, said volunteer groups have been submitting critical water quality data to the board’s citizen monitoring program for years. The program helps streamkeepers choose monitoring techniques, perform quality control and find funding sources.
“Their concern is genuine,” Esquivel said. “Collecting and bringing in data helps us see that a watershed or stream is impaired.”
Back on the south Yuba, Zettler-Mann and his group have started monitoring the watershed for signs of emerging threats, including long-lived synthetic compounds known as PFAS and a rubber preservative in tires that federal regulators are examining for potential harm to salmon.
UC Davis’ Rypel, a professor of coldwater fish ecology who advocates “a streamkeeper for every stream,” said having passionate volunteers filling data gaps and looking out for emerging threats to streams like the Yuba and Putah can inspire neighboring watersheds to do the same.
“Of all the different management things I’ve seen tried,” he said, ”the streamkeeper thing might be the one that’s worked best.”
Reach writer Nick Cahill at ncahill@watereducation.org
Know someone who wants to stay connected to water in the West? Encourage them to sign up for Western Water and follow us on Twitter, LinkedIn, Facebook and Instagram.
Click the link to read the post on the Colorado Climate Center blog (Peter Goble):
March 1, 2024
Hello, and welcome to meteorological spring (March-May). The month of February just ended, and frankly, this winter felt different. The northern Front Range of Colorado has just been through a bizarre meteorological winter. For Fort Collins, this was the second warmest and second least snowy meteorological winter since the beginning of the 21st century, and certainly warmer and less snowy than the historical past. At the same time, precipitation (the combined accumulation of rain and melted liquid from snow/ice) has been well above average this winter. The official Fort Collins Weather Station winter precipitation total of 2.42” is the 8th wettest winter on record, and ranks only behind 2007 and 2016 in the last 30 years. Boulder also recorded its 8th wettest winter in over 100 years while remaining only 0.6” above the 1991-2020 average snowfall mark. Our neighbors at the University of Northern Colorado in Greeley recorded their 3rd warmest winter, but with 151% of normal precipitation. On top of this, winter 2024 has also been speckled with rain only events, freezing drizzle, and a very heavy, spring-like rain snow mix. Is this a sign of things to come? Will rainy, drizzly, sloppy winters replace the fine, snowy powder of our past? Let’s dig into the numbers and the literature to find out.
Winter Rain Only Events
Rainfall events during the winter months on the northern Front Range of Colorado are perhaps more common than some realize. Since 1951 there have been 80 rainfall events with no measurable snow for Fort Collins, and 95 for Boulder. That is an average of 1.0-1.5 rain only events/meteorological winter. Fort Collins and Greeley had three such events this year (Boulder only one). There is no statistically significant trend in winter rain events over this time. If somebody says “it never rains in northern Colorado during winter” be skeptical.
One reason we may be inclined to believe winter rain is rare in Colorado is these events generally aren’t memorable. Precipitation accumulations are almost always small. 80-90% of rain-only winter events tally less than one tenth of an inch of precipitation. Fort Collins, Greeley, and Boulder have never seen a rain event greater than half an inch during winter. The largest rain only value occurred in Boulder on January 18th, 1974 (0.43”).Freezing Rain/Drizzle
We also experienced a freezing drizzle event this winter on February 16th, 2024. This is not the only winter freezing drizzle events in recent years: Northern Colorado also saw freezing drizzle on January 24th, 2017, January 19th, 2022, and March 7th, 2014 (though this last date falls just outside the scope of “meteorological winter”). Anecdotally, it feels as though these events are becoming more frequent. A couple notes on freezing rain and freezing drizzle: 1. While freezing drizzle is obviously possible for northern Colorado, true freezing rain is nearly impossible. 2. Freezing drizzle is not well archived historically. One possible source of freezing drizzle records is the Automated Surface Observing System (ASOS), a network of weather stations designed to aid aviation endeavors. Some ASOS stations do mark the occurrence of freezing drizzle, but not all, and existing records are spotty. All this to say, it is unclear whether or not freezing drizzle is becoming more likely for northern Colorado.February 3rd, 2024 (A Spring Storm in the Middle of Winter)
February 3rd was a special day on the northern Front Range of Colorado. The official Fort Collins weather station received 1.66” of precipitation between 7:00 PM on the 2nd, and 7:00 PM on the 3rd (7:00 is the official weather station daily observation time). Boulder and Greeley received 1.74” and 0.74” of precipitation respectively. This was a top ten wettest storm for Greeley and a record setter for Boulder. In Fort Collins, 1.66” of precipitation is not only a record amount of moisture for any day in February (135 years of record), it single-handedly made February 2024 the wettest February Fort Collins has ever experienced. Furthermore, Greeley’s all-time wettest February storm also occurred in 2024 just one week later, but as heavy snowfall.Northern Colorado locals have seen these types of rain/snow events before, but they are more of a calling card of spring. Typically, in February, the air is too cold and dry to support such accumulations. The weather pattern on this day was unique in a couple key ways allowing this event to happen. For one, the storm tapped into a corridor of tropical moisture extending all the way from the central tropical Pacific Ocean to the western United States, greatly increasing the potential for high moisture totals. These events are often called “atmospheric river events,” and are more common in coastal settings like California, Oregon, and Washington. Secondly, we experienced a split polar jet stream pattern with Colorado lying in the middle of the two currents. The southern flank of the split polar jet brought the atmospheric river to our doorstep while a high pressure airmass in the middle of the two flanks deflected the moist air back against the eastern side of the Rocky Mountains, and blocked cold arctic air from sweeping this storm out over the plains (figure 1). Both factors were important for producing such spring-like storm conditions.

Winter Precipitation and Climate Change
Our office teamed up with Jeff Lukas of Lukas Consulting to synthesize what the academic literature says about how Colorado’s climate may change over the remainder of the 21st century. This resource can be accessed here. If you have not had a chance to scan this document, I highly recommend it. We can use this document to get a glimpse into the future of winter precipitation, snowfall, and winter storms for Colorado.
Colorado has warmed, and continues to warm, significantly in all seasons due to increasing greenhouse gas concentrations in the atmosphere. Atmospheric physics tell us that warmer air can hold more water vapor, meaning there is potential for higher precipitation measurements from each individual storm under a warmer climate. We do see evidence that meteorological winters are getting wetter. Since 1950 we have seen a 3% increase in statewide wintertime precipitation. This trend is actually higher for the northern Front Range +14%, but somewhat offset by marginal decreases in western Colorado. Most climate models do suggest further increases in wintertime precipitation are likely. One experiment from our report shows an average of 6% more winter precipitation across Colorado by mid-Century with nearly 90% of the 36 global climate models used agreeing on the sign of the trend. Further increases are possible by the end of this century, and under high carbon emissions scenarios.
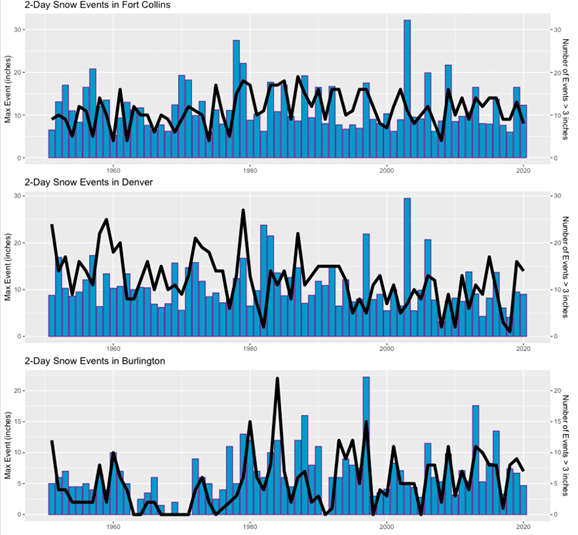
Accurately assessing trends in snowfall is more complicated. Snow measurement protocols have changed over time, muddying the waters of snowfall trend analysis. We do know average high elevation snowpack has decreased over time in Colorado, but 3”+ snowstorms on the Front Range have not. Annual maximum snowfall event totals have not fallen yet either (Figure 2). We also know that extreme cold outbreaks, which often follow winter snowstorms, are likely to continue decreasing in frequency and intensity, but will not disappear.
Winter storms are complex, and can be measured in a number of ways. For instance, just in recent years, we have seen the northern Front Range covered with 20-30” of snow (March 2021), a new lowest central pressure record from a winter storm (March 2019), and one of the most intense cold fronts in decades (December 2022). We have high confidence that winter will continue to get warmer on average across Colorado over the coming years and decades, but snow, extreme cold, and wildly varying conditions will not be out of the offing anytime soon.
Based on the evidence we have about climate change in Colorado, it is reasonable to hypothesize that our warming trend made this event more likely. Even so, climate models do not suggest that events like February 3rd, 2024 will become commonplace by the end of the century, even under high emissions scenarios.


Click the link to read the release on the USGS website (Alexandra (Allie) Weill and Olivia Miller):
February 8, 2024
A newly published study from the U.S. Geological Survey explains how salinity in the Upper Colorado River Basin has changed over the past few decades and shows how climate, irrigation and flow of groundwater contribute to salinity in the watershed. The study correlates overall salinity declines in the river basin since the 1980s with a transition from wet to dry conditions.
High salinity can limit water available for agriculture, drinking water, aquatic life and infrastructure, with significant impacts to the economy and human health. Salt occurs naturally in water, but salt loads are influenced by irrigated agriculture, geology, land cover, land-use practices and precipitation. Salinity can exacerbate corrosion of lead pipes and increase lead levels in drinking water and mobilize other metals or pollutants as well. High salinity levels in the Colorado River reduce agricultural yield, damage infrastructure and are estimated to cause $348 million per year in damage to infrastructure and crop production.

“This study shows us how irrigation and climate work together to influence salts going into streams,” said USGS hydrologist Olivia Miller, lead author on the study. “Future climate change in the Southwest, combined with changes in irrigation, may affect stream water quality, but we don’t yet understand how these interactions will play out, so our next step is developing a model to test scenarios of future climate change.”
Wet periods have higher salinity loads because increased runoff from rain and melting snow and increased groundwater movement bring more salts into rivers. In contrast, drier periods have lower salinity loads. Irrigation also plays an important role, contributing salts to the river more efficiently than any other source.
“Salt loading to the Upper Colorado River and tributaries is a significant economic and environmental concern which limits the utility of the Colorado River and creates economic damages to downstream water users,” said Don A. Barnett, Executive Director, Colorado River Basin Salinity Control Forum.
For the new study, USGS scientists created a dynamic model that simulates the flow of water and salts throughout the whole Upper Colorado Basin between 1986 and 2017, allowing them to estimate salinity in the river and identify its sources for every year over that time.
The study confirmed previous findings that salts come primarily from groundwater (66-82%), with smaller portions attributed to runoff and springs. The salts in groundwater may initially come from infiltration of irrigation water, but once dissolved in groundwater, tracing the source is difficult. Groundwater is stored for long periods underground, meaning that there can be a time lag between when the salts enter the groundwater and when they end up in the river. As a result, while salinity management efforts focused on surface runoff processes may produce small results in the short term, larger impacts may take longer to work through the groundwater system.
“The Upper Colorado River Basin States are taking actions to reduce salinity in the Colorado River for the benefit of the 40 million people who use the River’s water,” said Paul Kehmeier, Salinity Program Coordinator, Colorado Department of Agriculture. “This study helps clarify that the sources of salt vary over time and it will help inform managers on strategies to continue improving the quality of water in the Basin.”
The study was published in the journal Environmental Research Letters.
Click here for more science from the USGS Utah Water Science Center.


Click the link to read the article on The Land Desk website (Jonathan P. Thompson):
February 27, 2024
An effort is blossoming to protect a stretch of western Colorado’s Dolores River and its tributaries with a national monument designation. While the proposed boundaries haven’t been nailed down yet, the monument likely would include the river corridor in Montrose and Mesa Counties in Colorado, downstream of a proposed national conservation area that is still working its way through Congress. A designation would withdraw the canyons — many of which have remained relatively pristine despite being in the middle of the Uravan uranium belt — from future mining claims and oil and gas leases, while not affecting existing valid claims or private land.
Unfortunately, a mis-informed movement has emerged aimed at nipping the national monument concept in the bud.
Last week, someone named Sean Pond started an online petition (and an accompanying Facebook page) aimed at halting “the designation of the Dolores River National Monument.” He claims the petition is “born out of a deeply personal concern for the residents of Gateway, Paradox, Bedrock, Nucla and Naturita,” and claims a monument would “impose severe economic hardships” on those communities by leading “to an immediate cessation of mining activities that many local families depend on for their income.” He goes on to say that hunting and grazing would be outlawed and the freedom to enjoy outdoor activities curtailed.
If all that were true, then Pond’s petition might make sense. But it’s not true. Which is to say that the petition is using disinformation to incite fear and build opposition.
To clear things up, let’s do a little fact-check:
- A national monument designation would have zero effect on: existing, valid mining claims1; patented claims (i.e. private land); or active Department of Energy uranium leases. This means that a national monument would not affect existing mining activities, and would not in any way lead to a “cessation of mining activities.” If you don’t believe me, just take a look at the Baaj Nwaavjo I’tah Kukveni-Ancestral Footprints of the Grand Canyon National Monumentdesignated by President Biden last year. The controversial Pinyon Plains mine lies within the boundaries of the monument, and Energy Fuels is currently ramping it up for production.
- And even if it were to affect existing mining activities (again, it won’t), the notion that “many local families” depend on mining in that area is a bit of a stretch, since the uranium industry has been in a zombified state since the 1980s. The primary mining activity lately has been reclamation work — which is great! — but even that’s stalling out and, again, it won’t be affected by a national monument.
- Every national monument has its own set of rules, but most national monuments overseen by the Bureau of Land Management allow cattle grazing and have maintained the same number of permitted cattle as before designation, e.g.: Grand Staircase-Escalante, Canyon of the Ancients, and Bears Ears National Monuments. They also allow hunting. They also allow motorized travel on thousands of miles of designated routes. National monuments do not inherently curtail outdoor recreation any more than other federal land designations.
- If a monument has any economic impact on the area’s communities it likely will be a positive one, since a monument will draw tourists who will spend money in area businesses.
- A national monument only affects land that is already managed by the federal government. It is not a “land grab.” It is not an effort by the government to seize control of something it doesn’t already control.
I know, sometimes I sound like a damned broken record with these sorts of things. But I guess I hope that if I repeat myself enough times, folks might hear the facts. It’s not the opposition to the national monument that bothers me; there are legitimate reasons to be wary of such things. It’s the fact that the campaign to quash the proposal is based on lies.
Learn more about the effort to protect the Dolores River.

Click the link to read the article on the American Rivers website:
Yurok Tribe
On the coast, the Yurok Tribe’s ancestral territory stretches from the Little River in Humboldt County to Damnation Creek in Del Norte County. The tribe’s territory extends for 44 miles up the Klamath River to its confluence with the Trinity River. The Klamath and Trinity rivers are the lifeline of Yurok people, as the rivers provide the majority of the food supply including ney-puy (salmon), Kaa-ka (sturgeon), and kwor-ror (candlefish). Today, the tribe is the largest in California with more than 6,400 enrolled members. The Yurok Tribe was a signatory to the Amended Klamath Hydroelectric Settlement Agreement, which ultimately led to dam removal. The Yurok Tribe has played a pivotal role in every single aspect of Klamath River Dam Removal and restoration efforts.
The Yurok Fisheries Department and Yurok Tribe Construction Corporation are all at the forefront of these projects. The Yurok Fisheries Department collected a substantial volume of the approximately 20 billion native seeds that will be used to restore the 2,000-acre reservoir reach in between the four dams. Yurok Fisheries crews, RES and many project partners are now hand-sowing the seeds throughout the empty reservoirs. The Yurok Tribe is working on large-scale river restoration projects in other parts of California too. Informed by Traditional Ecological Knowledge and western science, the Yurok Fisheries Department and Yurok Tribe Construction Corporation transform severely degraded aquatic ecosystems into highly productive habitat for salmon as well as many other native fish and wildlife species. The Yurok Tribe has completed numerous projects on the Klamath and Sacramento Rivers and many smaller streams.
Karuk Tribe
The Karuk Tribe lives in its ancestral homelands along the middle part of the Klamath River, between Weitchpec and Seiad, California. The Karuk Tribe was a signatory to the Klamath Hydroelectric Settlement Agreement, which ultimately led to dam removal.
As Karuk Tribal Chairman Russell “Buster” Attebery stated in a video shared by KRRC, “Having the dams come out and having the almost 400 miles of salmon spawning grounds, and better water quality, is going to be imperative to life along the Klamath River. I was born and raised along the Klamath River and the fish, the river, and the clean water provides a perfect way of life. We are looking forward to the opportunity to have clean water again, and spawning grounds so our children can again experience the opportunities to fish and provide a food source for their families. It will be a great benefit to everyone who lives along the Klamath River.
Klamath Justice Coalition
The Klamath Justice Coalition was founded by grassroots Indigenous leaders more than two decades ago. They created what is now known as the “Un-dam the Klamath Campaign”. The refrain “Undam the Klamath, bring the salmon home” was heard from fishing boats on the river all the way to Berkshire Hathaway’s shareholder meeting in Omaha, Nebraska. As one of the co-founders Molli Myers (Karuk) states, “this was a movement of the people”.
Berkshire Hathaway
Berkshire Hathaway is the parent company of PacifiCorp, which owned and operated the four Klamath River dams. In 2020, Berkshire Hathaway played a pivotal role in securing the final dam removal accord: the company agreed to transfer operating licenses of the dams to the states of Oregon and California, and the Klamath River Renewal Corporation. Berkshire also agreed to share the burden of any cost overruns.
Ridges to Riffles Indigenous Conservation Group
Ridges to Riffles is advancing Indigenous-led restoration efforts on the Klamath and other rivers. R2R works in partnership with Indigenous Peoples to advance their cultural and natural resource interests through legal and policy advocacy. In partnership with the Yurok Tribe, R2R is working on Klamath dam removal, habitat restoration, instream flows, and personhood rights for the Klamath River.
Klamath River Renewal Corporation
The Klamath River Renewal Corporation (KRRC) is a nonprofit organization formed by signatories of the amended Klamath Hydroelectric Settlement Agreement, to take ownership and oversee removal of the four hydroelectric dams on the river. Managing the biggest dam removal and river restoration project in history is no small feat. KRRC’s team has prioritized safety, community engagement, and helping the people of the basin take steps toward a shared, sustainable future.

States of Oregon and California
Bipartisan support was key to success on the Klamath: elected leaders from both parties saw the value of a restored Klamath River, with California Governor Schwarzenegger and Oregon Governor Kulongoski signing the original agreement to remove the dams in 2010. A decade later, California Governor Newsom and Oregon Governor Brown took a vital step, joining the Klamath River Renewal Corporation as a co-licensee, allowing PacifiCorp to relinquish the operating license for the dams. California Proposition 1 water bond funds combined with PacifiCorp ratepayer funds to make the project possible. Never before has a state contributed this much funding to a dam removal project.

Click the link to read the article on the AZCentral.com website (Arlyssa D. BecentiDebra Utacia Krol). Here’s an excerpt:
March 1, 2024
For the past 60 years, Navajo leaders have worked to settle water claims in Arizona. The aim of the Northeastern Arizona Indian Water Rights Settlement Agreement is to affirm and quantify the nation’s rights to water in the state and to secure funding to build much needed water delivery infrastructure to homes on the Navajo Nation, according to a summary of the agreement.
“When we took office last year there was a huge push for us to start talking about our water rights, our water claims,” Navajo Nation Speaker Crystalyne Curley told The Arizona Republic. “It’s been far too long, going through COVID, climate change, drought that we are facing every year, we had to take into account of what we want to secure for the next 100 years.”
The U.S. Supreme Court held last summer that the United States did not have an affirmative treaty or trust obligation to identify and account for Navajo Nation water rights on the Colorado River. Curley said that ruling was a pivotal moment that led the Navajo Nation and its water rights negotiation team to focus on completing on the settlement…

The agreement will settle all of the Navajo Nation, Hopi Tribe and San Juan Southern Paiute water rights for the upper and lower basins of the Colorado River, the Little Colorado River basin, the Gila River Basin (including Big Boquillas Ranch) and claims to groundwater in the Navajo Aquifer, the Coconino Aquifer and other alluvial aquifers.
Click the link to access the report on the Science website (Hong Wang, Junguo Liu, Megan Klaar, Aifang Chen, Luka Gudmundsson, and Joseph Holden). Here’s the editor’s summary:
February 27, 2024
Editor’s summary
Patterns of river flow vary seasonally, which has important effects on the occurrence of floods and droughts, degrees of water security, and ecology. What is anthropogenic climate change doing to these seasonal cycles? Wang et al. used in situ observations of monthly average river flow from 1965 to 2014, combined with modeling, to show that human effects on climate have already caused a reduction of river flow seasonality at latitudes above 50° N. Understanding these changes is necessary for ensuring that freshwater ecosystems maintain their essential functions, for securing sustainable water resources, and for determining allocations for irrigation or hydropower generation. —H. Jesse Smith

Click the link to read the article on the Aspen Journalism website (Heather Sackett):
February 5, 2024
Presenters at a public meeting Thursday [February 1, 2024] about contamination on Lincoln Creek hosted by agencies that oversee water quality offered a lot of information, but few solutions yet to the problem.
The meeting, held at the Rocky Mountain Institute in Basalt, featured the results of water quality sampling and presentations from a panel of experts from agencies including Environmental Protection Agency, Colorado Parks and Wildlife, U.S. Fish and Wildlife Service, Colorado Department of Public Health and Environment, the U.S. Forest Service, Colorado Division of Reclamation, Mining and Safety, the U.S. Geological Survey, environmental group Trout Unlimited and Pitkin County Environmental Health.
“We have a lot of questions,” said Kurt Dahl, Pitkin County environmental health manager. “Is (the contamination) going to continue to increase? What does it mean for the Roaring Fork? For my office? For human health? … There’s also this question around mitigation. I think we want to get our arms around, is this a possibility? What does this look like? What are the costs? Can we afford it?”
A report released in November by the EPA based on water-quality samples from 2022 found that Lincoln Creek in the four miles between the Ruby Mine and Grizzly Reservoir exceeds state water quality standards for aquatic life for aluminum, cadmium, copper, iron, lead, manganese and zinc. Aluminum and copper concentrations were especially high.
Water quality issues on Lincoln Creek have been a concern for years, with the creek above the reservoir often running a yellowish color, and Grizzly Reservoir often a bright turquoise. In September 2022, Lincoln Creek below the reservoir turned a milky-green color, and white and yellow sediment settled on the streambed, prompting water quality testing in the fall of 2022 and the EPA report. These conditions in 2022 could be seen downstream at the confluence with the Roaring Fork River, sparking concern for local residents and organizations.
And the problem has gotten worse in recent years. The high concentrations of aluminum and copper are toxic to fish, and Lincoln Creek and Grizzly Reservoir experienced a fish die-off in 2021. In fall of 2023, there was a fish kill downstream in the Roaring Fork in the North Star Nature Preserve, which experts say was probably due to a combination of high metals concentrations and too-warm water.
The EPA report also found that the main source of contamination is not drainage from the Ruby Mine, but is naturally occurring from a “mineralized tributary” just downstream from the mine.
During the Q&A portion of the meeting, attendees asked whether the Ruby Mine, where turn-of-the-20th-century prospectors dug for gold and silver, could really be the source of contamination. Mindi May, water quality program director with CPW, said she initially shared the audience’s skepticism that the mine wasn’t the main source of contamination, but after visiting the site she agrees with geologists’ findings that it’s naturally occurring.
“You could just see the water from the mineralized trib just seeping out of the ground,” she said. “So at this point I am convinced … that the mineralized trib and the Ruby are separate and that the mineralized trib is natural and that it really is the problem.”
The fact that the contamination of the creek is naturally occurring creates a question about who’s responsible for cleaning it up. The EPA is authorized to address elevated metals concentrations only from human-caused sources, not contamination from natural sources.

Primarily an ecological problem
Panelists addressed the potential human health impacts from the contaminated water in the creek and at Grizzly Reservoir, a popular spot for summer camping, hiking and fishing. The U.S. Forest Service manages the seven-site Portal Campground near the reservoir.
Mike Carney, a toxicologist with U.S. Fish and Wildlife Service, said his agency is primarily concerned with arsenic and lead, which have health risks but aren’t the main contaminants in Lincoln Creek. He said there’s not much risk associated with someone’s skin coming into contact with the copper and aluminum-laden water. As for drinking the water, backpacking filters are unlikely to filter out all the contamination and gastrointestinal distress could result. But would-be guzzlers of the orange-tinted water would probably be turned off by the taste.
“At those concentrations, that water would likely not be palatable because it would taste very bad,” Carney said. “This is primarily an ecological problem here.”
Carney said they did not find worrisome concentrations of metals accumulating in the tissue of fish sampled from Grizzly Reservoir. CPW restocks the fish every summer so they may not spend enough time living in the reservoir to build up metals concentrations before they die or are caught and eaten by anglers.

Lincoln Creek feeds into the Twin Lakes Reservoir and Canal Company’s transmountain diversion system, in which Grizzly Reservoir is used as a collection pool before sending water through the Twin Lakes Tunnel to the Arkansas River basin, where it is used primarily in Front Range cities, including for drinking water. Colorado Springs Utilities owns the majority of the water in the Twin Lakes system.
The November EPA report said the substantial mixing, the distance that the water travels to the Front Range and the water-treatment process limit the impacts to Colorado Springs’ drinking water.
Twin Lakes is planning to drain Grizzly Reservoir this summer so it can do a rehabilitation project, including installing a membrane over the steel face of the dam, replacing the gates that control the flow of water into the Twin Lakes Tunnel and repairing the outlet works that release water down Lincoln Creek.
Repairs to fix damage after a log got caught in the outlet works in 2015 resulted in the release of a slug of contaminated water and sediment from the reservoir that quickly boosted flows in the Roaring Fork near Aspen and turned it yellow, alarming residents. Twin Lakes board president Alan Ward said that wouldn’t happen with this summer’s planned draw-down.
“The company was very embarrassed by that, we do not want that to happen again,” he said. “We talked with our contractor about a drawdown plan and we need to make sure that as we get to those sediments, that we’re moving slowly and have a lot of sediment control in place so that we’re not putting that in the creek.”
Leaching metals and climate change
When water and oxygen come into contact with pyrite-rich rock, it reacts to form sulfuric acid and causes the leaching of metals from the rock. One take-away from Thursday’s presentations is that this type of metals contamination of Colorado waterways is increasing with climate change.
Thomas Chapin, a research chemist with USGS, said drought and climate change have reduced the volume of streamflows, meaning metals concentrations will be higher even if the overall amount of metal leaching stays the same. But melting ice and ground that was once frozen also allow water and oxygen to come into contact with rock that used to be inaccessible to the leaching process.

“The combination of the decrease in flow coming down, so less dilution, and the lowering of the water table and exposing more material to acid rock drainage, it’s a double whammy,” Chapin said.
Pitkin County isn’t the only place in Colorado where increasing metals concentrations is negatively impacting water quality. Chapin said a recent study looking at the Snake River, a tributary of the Blue River in Summit County, found a 100% to 400% increase in the amount of zinc concentrations over 30 years.
“We saw similar data with Lincoln Creek,” he said. “Those September values have gone up quite a bit.”
The recently released Climate Change in Colorado report found that temperatures have warmed more in fall than other seasons.
Dahl wrapped up the meeting, which ran 30 minutes past its scheduled time of 6 to 7:30 p.m., by saying that local water quality experts are talking about next steps and plan to hold another public meeting this spring.
“We recognize that there was a lot of information here without a lot of opportunity to ask questions,” he said. “We’ve already agreed that we need to have another public meeting.”
This story ran in the Feb. 3 edition of The Aspen Times.

Click the link to read the article on the NOAA website (Amy Butler and Laura Ciasto):
February 29, 2024
We’ve talked about how the reversal of the west-to-east winds during a major sudden stratospheric warming sets up a feedback between large atmospheric waves and the winds, and how this results in the stratospheric wind changes being communicated down into the troposphere. But what does this mean for weather patterns down here after the polar vortex is disrupted?
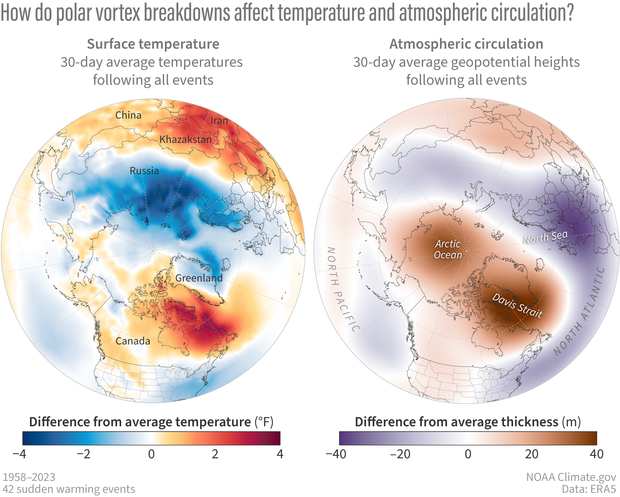
By taking the average of the surface temperature and atmospheric thickness for the 30 days after all the major sudden stratospheric warmings in the observational record, we can average out day-to-day variations in the weather and see more clearly what weather patterns related to major warmings look like.
From a stratospheric hot mess to a tropospheric cold brew
Sudden stratospheric warmings (and sometimes just the phrase “polar vortex”) are often associated with cold and snowy weather; and indeed, anomalous cold is evident over some regions like northern Europe and Asia and the eastern United States after these events. How does a warming of the stratosphere cause widespread cold at the surface?
During major warmings, the atmospheric thickness increases over the pole, which shows up on these maps as a positive anomaly in tropospheric geopotential height over the Arctic, particularly Greenland. This increase in atmospheric thickness in the troposphere is linked to the build-up of air over the pole during the sudden warming: it can act like a rock dropped in a bucket, pushing down on the troposphere such that the cold Arctic air “sloshes” out into lower latitudes. An alternative way to think about it is that the increased atmospheric thickness over the Arctic induces changes in tropospheric winds that push cold air from the Arctic farther south in some regions and pull warm air from the south into the Arctic in other regions.
But… it’s not cold everywhere
Not all regions need to bring out snow shovels and gloves when a polar vortex breakdown is on the menu. The map shows that there are also large areas with generally warmer than normal surface temperatures after major warmings. These regions include eastern Canada and much of subtropical Africa and Asia. This is one reason why, even though we might care most about what happens where we live, we shouldn’t equate polar vortex disruptions with cold air outbreaks.
Weather effects are strongly regional
Another reason to not automatically assume that a major stratospheric warming means colder weather is that the magnitude of cold varies widely from place to place, with the strongest cold appearing over northern Europe and Asia, and more moderate to weak cold appearing over central Europe and the eastern United States. These regional differences arise because the changes in atmospheric thickness, and thus the effects on the tropospheric jet stream, are centered over the North Atlantic [footnote 1], and so the strongest associated temperature changes occur just upstream or downstream of this region.
An atmospheric gamble
It’s important to remember that the maps of “typical” surface impacts are not a forecast and do not represent the expected day-by-day weather when one of these events occurs. These maps show an average over many major warmings, each occurring in different years and with different global climate conditions (such as different phases of ENSO). These maps don’t give a sense of where the weather may vary substantially from one event to another.
Furthermore, they’re also an average over the 30-day period after one of these events, which means that from day to day or week to week after a major warming event, the weather could look vastly different in any given location than from what is shown here. What this type of map does is provide a sense of where changes in temperatures and pressures are most likely to occur in the month after a major warming, allowing us to assess the probabilistic risk of certain extremes. In other words, a major warming “loads the dice” for certain conditions, but by no means guarantees them.
Another way we can get a hint about which areas are most likely to follow the average pattern is to look at how much variability there is at a given location from event to event. That’s what the maps below show.
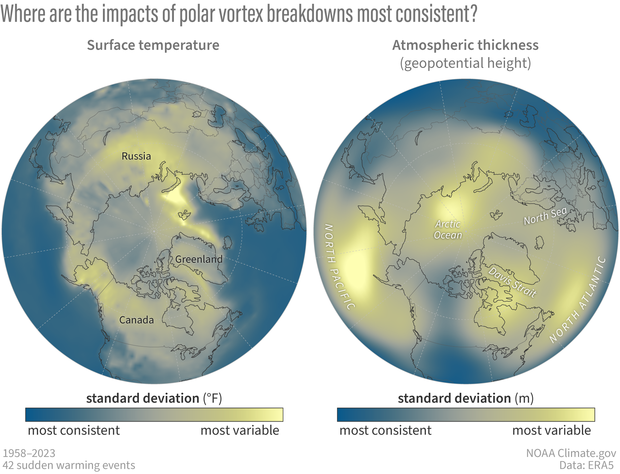
Current polar vortex conditions: did it or didn’t it?
So did we see the second sudden stratospheric warming of the year? Well… it’s complicated. The stratospheric polar vortex did indeed rapidly weaken and warm as predicted, so physically-speaking, a sudden warming occurred around February 19, 2024.
However, whether it will be classified as a major or minor event is still unclear. This is because the way a major sudden warming is commonly defined [footnote 2] requires the daily-mean west-to-east winds, averaged around the 60N latitude circle and at the altitude corresponding to an atmospheric pressure of 10 mb, to fall below 0 m/s. In this case, the winds came very very close to that threshold (within +/- 1 m/s), so that some reanalysis data products [footnote 3] likely will show the winds falling below 0 m/s and others will not. This disagreement between data products has happened in the past and is one of the caveats of using a threshold-based definition of these events; there is some sensitivity to which events get “counted” as major warmings, even though a rapid weakening and warming of the polar vortex was observed.
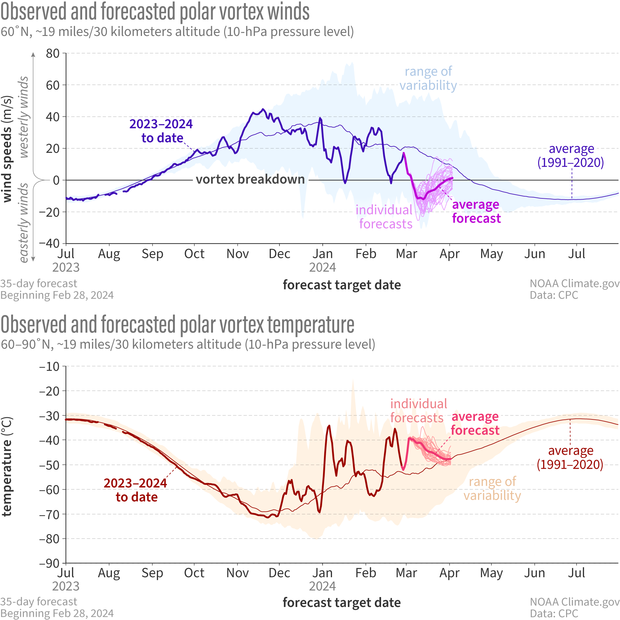
Nonetheless, perhaps because the weakening of the vortex wasn’t substantial enough to significantly reverse the stratospheric winds (if at all), the winds have re-strengthened quickly. The continued west-to-east winds will allow further onslaught of the polar vortex by atmospheric wave activity. [Remember from our earlier post that only when the polar vortex is whipping along from west-to-east can waves from below penetrate and disrupt it.] Current forecasts show potential for a more substantial reversal of the stratospheric polar vortex than we’ve seen so far this entire winter taking place early next week. However, we are also heading into spring, which is when the stratospheric polar winds typically transition to an east-to-west summertime state. So it remains to be seen whether this upcoming reversal will essentially kill the polar vortex for the remainder of the season (the “final warming”), or whether the vortex will return to west-to-east flow in April for a brief period [footnote 4].
Footnotes
- Why the North Atlantic jet stream appears more strongly affected than the Pacific region after major warmings is still not well understood.
- The most common definition is based on Charlton and Polvani (2007), but many other definitions exist. Which events are classified as “major” is sensitive to the definition used.
- Reanalysis products take multiple observational sources like satellite and balloon measurements and assimilate them into a model to create a product that is both temporally and spatially complete at each grid space of the model, and is constrained by observations. Because different data centers use different models and data assimilation techniques, and may assimilate different satellite and balloon records, reanalysis products can exhibit differences from one another. Note that because it can take some time for this data to be released, we often have to wait several weeks to determine if the major warming occurred in each dataset.
- There are more technicalities to the major stratospheric warming definition that have implications for the final count of events this winter. In particular, because events must be separated by 20 consecutive days of west-to-east stratospheric winds, this upcoming wind reversal will not be counted separately from the February 19th event, if it occurred. Additionally, if it is a final warming, it will not be counted as a major warming which only includes “mid-winter” events. Ultimately, these details are all somewhat arbitrary and only matter for statistical purposes!
Click the link to read the article on the Associated Press website (Felicia Fonseca and Suman Naishadham). Here’s an excerpt:
February 28, 2024
A Native American tribe with one of the largest outstanding claims to water in the Colorado River basin is closing in on a settlement with more than a dozen parties, putting it on a path to piping water to tens of thousands of tribal members in Arizona who still live without it. Negotiating terms outlined late Wednesday include water rights not only for the Navajo Nation but the neighboring Hopi and San Juan Southern Paiute tribes in the northeastern corner of the state. The water would come from a mix of sources: the Colorado River that serves seven western states, the Little Colorado River, and aquifers and washes on tribal lands. The agreement is decades in the making and would allow the tribes to avoid further litigation and court proceedings, which have been costly. Navajo officials said they expect to finalize the terms in the coming days. From there, it must be approved by the tribe’s governing bodies, the state of Arizona, the other parties and by Congress…
On Wednesday, the Navajo Nation cited climate change, cost, competition for water and the coronavirus pandemic as reasons to move toward a settlement. Arizona, in turn, would benefit by having certainty over the amount of water that is available to non-tribal users. The state has had to cut its use of Colorado River water in recent years because of drought and demand…
Arizona — situated in the Colorado River’s Lower Basin with California, Nevada and Mexico — is unique in that it also has an allocation in the Upper Basin. Under the settlement terms, Navajo and Hopi would get about 47,000 acre-feet in the Upper Basin — nearly the entire amount that was set aside for use at the Navajo Generating Station, a coal-fired power plant on the Navajo reservation that shut down in late 2019. The proposal also includes about 9,500 acre-feet per year of lower-priority water from the Lower Basin for both tribes. An acre-foot of water is roughly enough to serve two to three U.S. households annually. While the specific terms for the San Juan Southern Paiute Tribe remain under discussion, Congress could be asked to establish a small reservation for the tribe whose ancestral land lies in Utah and Arizona. The tribe’s president, Robbin Preston Jr., didn’t immediately respond to emailed questions from the AP.

Click the link to read the article on the Fort Collins Coloradoan website (Ignacio Calderon). Here’s an excerpt:
February 29, 2024
On Wednesday [February 28, 2024], 96 Colorado-Big Thompson water shares and 154 acres of farmland from the Carlson Family Trust were auctioned for $5,473,600 and $990,000, respectively. It was the second such water auction in February. Earlier this month, Carol Oswald Yoakum sold her 90 shares of Colorado-Big Thompson water for an average of $52,481 per share...In recent years, around 95% of Colorado-Big Thompson shares that were transferred went from farms to municipalities and water districts, a Coloradoan analysis found…
When Colorado-Big Thompson water changes hands, it is recorded in the Northern Water Board’s monthly meetings agenda. The Coloradoan manually compiled every document available online, with records going back to June 2019, to understand this trend. The analysis focused on the transfers where there was a change in contract class. This excludes transfers where water is kept in the same use, like when shares are passed down in a family farm. Different contract classes allow for different water uses…During the time period covered by the analysis, the Coloradoan found 237 transfers, which moved 4,396 shares. The 10 biggest receivers, which were all water districts or municipalities, accounted for nine out of every 10 shares. However, that doesn’t necessarily mean most water is being used by cities…
“When we look at the data of where water is delivered, we see that on average it’s a little more than 50% that goes to municipal use, but municipal ownership is about 75%,” said Jeff Stahla, spokesperson for Northern Water, referring to water use from the Colorado-Big Thompson Project…Christopher Goemans, an associate professor in the Department of Agricultural and Resource Economics at Colorado State University, said “we’ve seen this shift in the ownership of rights from agricultural to municipal uses. And yet the vast majority of the water is still diverted and used in agriculture.”
[…]
On the other hand, the cost of acquiring water is driven in large part by the market for water rights. Wednesday’s auction averaged around $57,000 per Colorado-Big Thompson water share — several orders of magnitude higher than it cost when the project began. In 1960, three years after the project first started delivering water to users, the cost per share was $1.50.

Click the link to read the article on the Audubon website (María Paula Rubiano A.):
Birds are everywhere at the school in Cañaveral, Colombia. Their songs fill the air. Their nests perch in flowerpots. And each Tuesday every classroom celebrates birds, from the short tales children write in Spanish class to science lessons about migratory journeys.
Since 2021 around 450 kids at 8 schools in Colombia’s coffee belt have been immersed in these lessons that seek to build support for conservation. “Kids now know about the worms that birds bring to their chicks and the birds’ scientific names,” says John Edison Martínez Delgado, academic coordinator at Cañaveral school. “They’re always drawing them in their notebooks.”
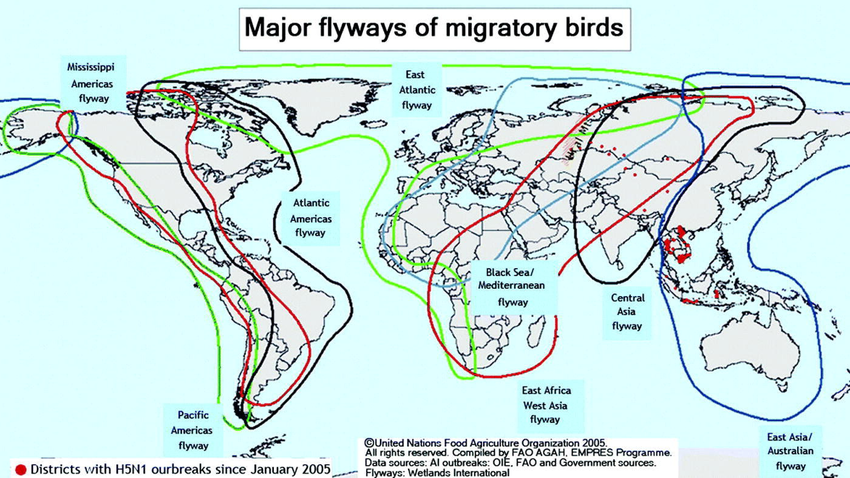
Audubon and a local university developed the curriculum for one of more than 700 projects funded through the U.S. Neotropical Migratory Bird Conservation Act (NMBCA), the only federal grant program dedicated to conserving birds across the Americas. Since 2002 it has pumped $89 million—$440 million, if you count matching funds—into habitat protection, research, and education in 43 countries. It has delivered three-quarters of that funding outside the United States to regions where some 390 long-distance migratory species spend much of their lives. And though the NMBCA is designed to benefit birdlife, advocates say it also supports people on the front lines of conservation, from Canada to Chile.
While the act’s geographic scale is vast, advocates say it needs more cash to help stem population declines driven by climate change, habitat destruction, and other threats. That’s why supporters are urging lawmakers to pass bipartisan legislation to increase funding and make it accessible to more communities. “It’s a perfect time to look back at this program, to work with Congress, and provide some options about how to address some of these steep declines,” says Erik Schneider, policy manager at Audubon.
Before Congress passed the NMBCA in 2000, wildlife managers across the Americas were alarmed by mounting evidence that development in migratory birds’ winter habitats was eroding populations. They saw the need for coordinated action—and for funding to make it happen.
To help foster that collaboration, the act required recipients to come up with $3 to match every $1 in U.S. government grants. As a result, organizations have banded together across borders to work with locals at key sites, says Ingrid Arias, development director at the nonprofit FUNDAECO. Using NMBCA funds, the group has partnered with the American Bird Conservancy (ABC) to purchase and protect more than 16,000 acres of forest habitat for Wood Thrush, Baltimore Oriole, and other species on Guatemala’s Caribbean Coast.
Setting aside protected areas, however, is not enough. Since many neotropical migrants winter on farms and other working lands that people rely on for their livelihoods, NMBCA projects also nurture connections with often remote communities, supporters say. Along with their work at schools in Colombia’s coffee belt, Audubon Americas and local partners have inked conservation agreements with growers there who commit to respect the biodiversity corridors running through their coffee farms. And in Guatemala, FUNDAECO and ABC have established native tree nurseries and bird-friendly cardamom farms run by community members.
The program also protects habitat in more urban areas. In Chile, Audubon Americas and nearly 80 partners used NMBCA funds to create the first conservation plan for a wetland, now being engulfed by the growing city of Concepción, where shorebirds like Baird’s Sandpiper and Hudsonian Godwit overwinter. Now another grant is helping to build support for the plan and to train locals as coastal stewards.
As effective as the act’s cost-share requirement has been at spurring teamwork, proponents argue that it could be lower and still serve that function—while opening the door to more partners. The proposed Migratory Birds of the Americas Conservation Enhancements Act would set the match at two-to-one, a change Arias says is especially needed today: “Since the pandemic, many environmental organizations’ fundraising ability has suffered a lot.”
What’s more, the bill would double the program’s annual budget to $10 million by 2028. That would be a big step, supporters say, toward the goal of making it a habitat-protecting force comparable to the North American Wetlands Conservation Act. That program has funded projects on more than 32 million acres, or nearly 10 times the scale of the NMBCA, and is widely credited with reversing declines in waterfowl populations. Other migratory birds desperately need—and could soon have a better shot at—a similar rebound.
This story originally ran in the Winter 2023 issue as “Ready for a Rebound.”

2000 days ago WordPress decided to keep track of the number of days in a row that I (and maybe all WordPress users) posted. I think they were hoping to motivate bloggers to post often. Coyote Gulch’s 21st blog birthday is coming up on March 29th and so far I’ve published 28,784 posts, according to the WordPress stats, with no plans to let up. Thank you to all the Coyote Gulch readers — you are my motivation! When I’m up early in the morning looking for stuff to inform Coyote Gulch fans it is good to know that someone reads the blog.

Click on a thumbnail graphic to view a gallery of drought data from the US Drought Monitor website.


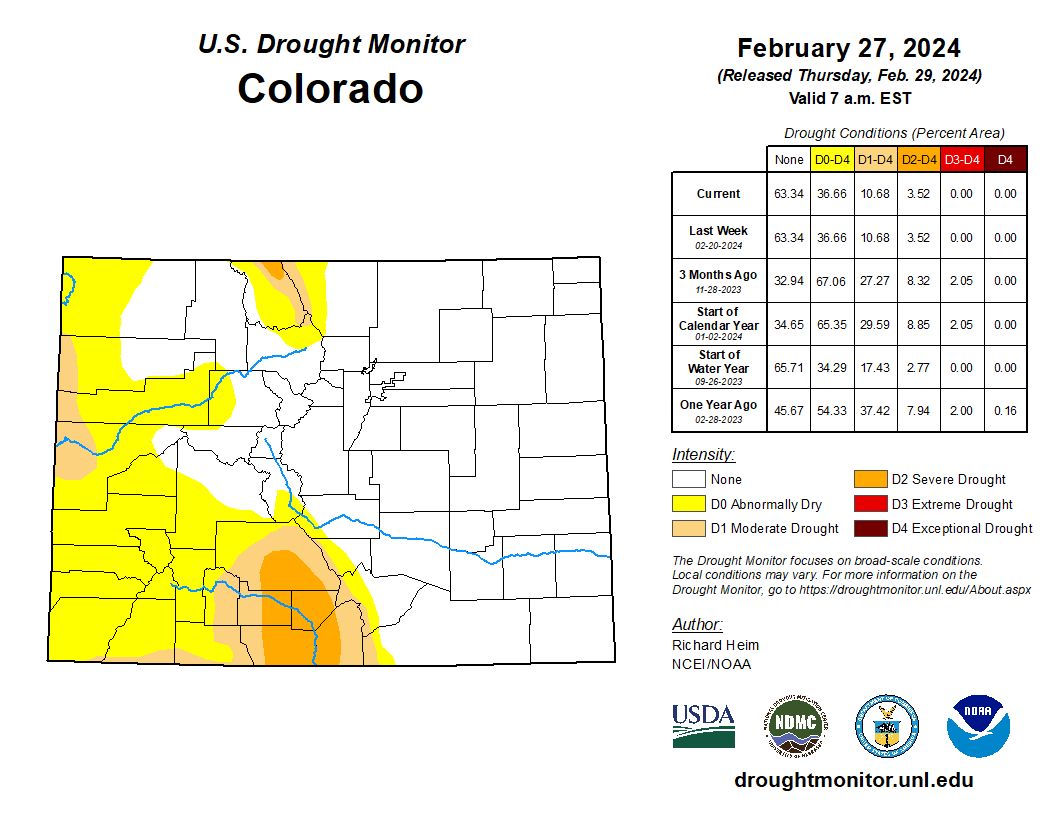
Click the link to go to the US Drought Monitor website. Here’s an excerpt:
This Week’s Drought Summary
Several weather systems moved across the contiguous U.S. (CONUS) during this U.S. Drought Monitor (USDM) week (February 21-27). Their fronts and surface lows spread rain and snow across parts of the West at the beginning and end of the week, and over the Tennessee to Ohio Valleys and Appalachians at mid-week. These systems were associated with an upper-level circulation pattern that consisted of low-pressure troughs just off the west coast and east coast, with a high-pressure ridge over the central part of the country. The ridge brought above-normal temperatures to much of the CONUS, from the Rocky Mountains to Appalachian Mountains, with weekly temperatures averaging 15-20 degrees F above normal from Texas to the northern Plains and Upper Mississippi Valley. Temperatures averaged near to cooler than normal in parts of the interior West to Pacific Coast and along the Eastern Seaboard. The ridge also inhibited precipitation from the Rockies to Mississippi Valley. The precipitation in the West was mainly over mountain ranges but was not enough to improve drought conditions. The precipitation in the Midwest was enough to prevent further drought expansion or intensification where it was wetter than normal for the week. In other areas, drought or abnormal dryness expanded or intensified in parts of the Plains and Midwest, and a few parts of the Pacific Northwest, Gulf of Mexico coast, and Mid-Atlantic coast…
High Plains
There were a few areas of half an inch to locally 2 inches of precipitation in the High Plains region this week – in North Dakota and parts of Colorado and Wyoming. But the rest of the region had little to no precipitation. Daily high temperatures reached into the 80s F some days in Kansas and up to the 50s and 60s in the Dakotas. Weekly temperatures averaged 10 to 20 degrees above normal across most of the region, increasing evapotranspiration (ET). Since this is February and vegetation is still dormant, the above-normal ET had little effect on vegetation, but soil temperatures were well above freezing in southern parts of the region and the high ET helped to dry soils. D0 expanded in the Dakotas, and D1 crept into northwest North Dakota, to reflect the 1- to 2-month dryness and unusually warm temperatures, and D0 expanded in eastern Kansas where recent precipitation has been low and soils were drying. In Wyoming, very low mountain SWE (snow water content) and dry 1- to 4-month SPI values prompted the expansion of D0-D2…

West
Two to locally 5 inches of precipitation fell in the Oregon and Washington Cascade and Coastal mountains this week, with half an inch to locally 2 inches in the northern and central Rockies and southern California, and 0.5 to 1.5 inches in the Sierra Nevada and parts of coastal California. Outside of these areas, precipitation was generally less than a fourth of an inch, with rainshadow areas and the Southwest (Four Corners States) mostly dry. The precipitation was above normal for the week in some areas, particularly parts of the Cascades, Rockies, and southern California. But amounts were not enough to bring month-to-date totals to near normal values, with these areas still well below normal for the month. And snowpack improved little, with just a few inches of new snow added to most Cascade and Coastal mountain SNOTEL sites. Mountain snowpack and SWE values were still well below normal to near-record low in Washington, Oregon, Idaho, and Montana. In California, as of February 27, mountain SWE was 94% of normal in the northern Sierra Nevada Mountains, 78% of normal in the Central Sierra, and 76% of normal in the southern Sierra. In Washington, D0-D1 was expanded in the northern Cascades and D1 added to the Olympic Mountains to reflect the low snowpack and subnormal precipitation. Low SWE and 1- to 4-month SPEI values resulted in expansion of D0-D3 in parts of Montana…
South
Northern parts of Tennessee received 0.5-1.5 inches of precipitation this week, but most of the South region was dry with no precipitation occurring. Much warmer-than-normal temperatures accompanied the dryness, with daytime maximum temperatures in excess of 90 degrees F recorded in Texas. Dallas/Fort Worth reached 94 on February 26, which was a daily record and 31 degrees above normal. The hot temperatures increased evapotranspiration which drew moisture out of the soils. The recent dry weather, accompanied by low relative humidity and windy conditions, contributed to an outbreak of wildfires across parts of the region. D0 expanded in southwest Texas where air temperatures were hot, soils were hot and dry, and the last 3 months were drier than normal. Dry 1- to 3-month SPI values prompted expansion of D0 in eastern Oklahoma and adjacent parts of northeast Texas and western Arkansas. Dead fields in Sebastian County, Arkansas, were reported via the CMOR (Condition Monitoring Observer Reports) reporting system. D0 expanded in southern Mississippi, adjacent parts of Louisiana, and southeast Texas where SPI was dry, streamflow was low, and some soil moisture indicators showed dryness, and D0 expanded in southeast Tennessee where 1- to 2-month SPEI (Standardized Precipitation Evapotranspiration Index) showed dry conditions. A reassessment of data resulted in the deletion of the relic D0 along the southeast Louisiana coast…
Looking Ahead
In the two days since the Tuesday valid time of this USDM, Pacific moisture continued to move across the Coastal and Cascade ranges in the Pacific Northwest, with precipitation falling in areas east of the Mississippi River and in parts of the southern Plains. For February 29-March 5, a ridge over the eastern CONUS will bring warmer-than-normal temperatures to much of the country east of the Rockies while a trough contributes to cooler-than-normal temperatures in the West. Forecast models predict a wet period for much of the West, in the Upper Rio Grande Valley, and from the Lower Mississippi Valley to the East Coast, as low-pressure systems and fronts bring locally heavy precipitation. The Coastal, Cascade, and Sierra Nevada mountain ranges could see 5 to 10 inches of precipitation, or locally more, while the central to northern Rockies could receive 2 to 4 inches of precipitation. Parts of southern New Mexico and western Texas could receive up to an inch of rain. An inch or more of precipitation is predicted from southern Louisiana to southern New England. Outside of these wet areas, up to half an inch of moisture could fall in the lower elevations of the West, across the northern and southern Plains, and Midwest to Northeast. Areas that could miss out on the precipitation stretch from southern California to the central Plains, where little to no precipitation is expected, and the southern Plains and Mid-Mississippi Valley to eastern Great Lakes, where less than a fourth of an inch may fall.
For much of the next 2 weeks, the atmospheric circulation is expected to continue an upper-level trough over the western CONUS and a ridge over the eastern two-thirds of the country, with Pacific weather systems migrating through the trough/ridge pattern. The Climate Prediction Center’s (CPC) 6-10 Day Outlook (valid March 4-8) and 8-14 Day Outlook (valid March 6-12) favor a fairly stable pattern of warmer-than-normal temperatures from the Plains to East Coast and cooler-than-normal temperatures over the West and Alaska. The outlook is for above-normal precipitation over eastern and southern Alaska and much of the CONUS, especially east of the Mississippi River, with odds favoring near to below-normal precipitation over the northern Rockies to northern Plains and over the west coast of Alaska.


From email from the Colorado Water Trust (Barrett Donavan):
Here are the details:
We have four great judges who will choose the top five stories. First, second, and third place winners will receive an awesome prize, and all top five submissions will be shared on our website, in our newsletter, and on our social media accounts.

The Judges:

Judging Criteria:

Click the link to read the article on the Water Education Colorado website (Jerd Smith):
Colorado lawmakers OK’d a measure this week backing efforts to restore Grand Lake, the state’s deepest natural lake once known for its clear waters.
Advocates hope the resolution will help fuel statewide support for the complicated work involved in restoring the lake and give them leverage with the federal government to secure funding for a new fix.
The resolution is largely symbolic and doesn’t come with any money, but it adds to the growing coalition of water interests on the Western Slope and Front Range backing the effort.
After more than a year of work, Mike Cassio, president of the Three Lakes Watershed Association, said he is hopeful the resolution will create a new path forward after years of bureaucratic stalemate. The association advocates on behalf of Grand Lake, Shadow Mountain and Lake Granby.
“It’s been a long process, but this resolution puts the state legislators in support of what we are trying to do and we will be able to take that to our congressional representatives,” Cassio said.
The measure was carried by Sen. Dylan Roberts, a Democrat from Frisco, and House Speaker Julie McCluskie, a Democrat from Dillon.
“I’m really encouraged with all the work that has been done in the past few months and I think it will hopefully lead to more progress,” Roberts said.
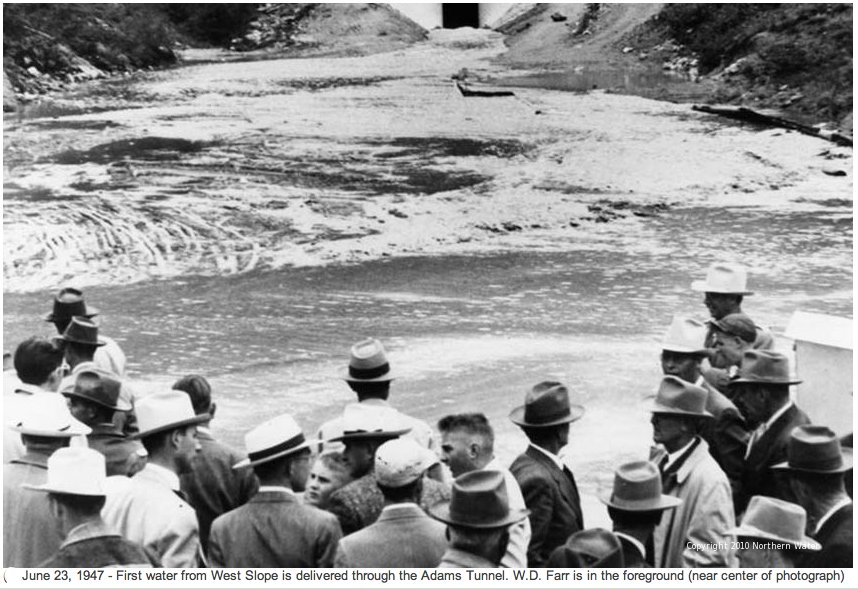
Owned by the U.S. Bureau of Reclamation and operated by Northern Water, what’s known as the Colorado-Big Thompson Project gathers water from streams and rivers in Rocky Mountain National Park and Grand County, and stores it in Lake Granby and Shadow Mountain Reservoir. From there it is eventually moved into Grand Lake and delivered via the Adams Tunnel under the Continental Divide to Carter Lake and Horsetooth Reservoir, just west of Berthoud and Fort Collins, respectively.
On the Front Range, the water serves more than 1 million people and thousands of acres of irrigated farmlands. But during the pumping process on the Western Slope, algae and sediment are carried into Grand Lake, clouding its formerly clear waters and causing algae blooms and weed growth, and harming recreation.
Advocates have long been frustrated at the failure to find a permanent fix to the lake’s clarity issues, whether it’s through a major redesign of the giant federal system or operational changes.
The Bureau of Reclamation, Northern Water, Grand County and other agencies and local groups have been working since 2008 to find a way to keep the lake clearer, and Northern Water and others have experimented with different pumping patterns and other techniques to reduce disturbances to the lake’s waters.
Now an even broader coalition has come together, Cassio said, led by Grand County commissioners and Northern Water’s board of directors.
“Northern Water is fully committed to the continued and collaborative exploration of options to improve clarity in Grand Lake and water quality in the three lakes,” said Esther Vincent, Northern Water’s director of environmental services.
Last year, a technical working group reconvened, and is now studying new fixes that may be possible, including taking steps to reduce algae growth and introduce aeration in Shadow Mountain, a shallow artificial reservoir whose warm temperatures, weeds and sediment loads do the most damage to Grand Lake, Cassio said.
Though much more work lies ahead, the work at the legislature is critical, he said.
“This resolution is one piece of the puzzle,” Cassio said. “We’re at the finish line and everybody is coming together. It’s a wonderful thing.”
More by Jerd SmithJerd Smith is editor of Fresh Water News. She can be reached at 720-398-6474, via email at jerd@wateredco.org or @jerd_smith.
Click the link to read the article on the Big Pivots website (Allen Best):
February 25, 2024
Colorado Water Center’s John Tracy said we’re in a new phase of understanding water. It’s not building dams or canals. It’s not new technology. It’s something else.
In January, when John Tracy began his lecture at the Colorado Farm Show in Greeley, he had a modest-sized audience.
Outside of the meeting room, in the central exhibition hall at Island Grove Regional Park, concessionaires hawked everything from paintings of wheat harvest and other flag-draped farm scenes to the latest in technology products.

John Deere had implements. I crawled inside the cabin of a chemical applicator. It was full of computer screens and, I surmised, air conditioned. I inquired as to the cost: $900,000. This wasn’t the John Deere my grandfather drove.
Thinking about water and agriculture has also changed dramatically since I tagged along in the early 1960s after my grandfather amid his fields of corn, sugar beets, and alfalfa in northeastern Colorado.
Tracy, who directs the Colorado Water Center, a small research enterprise affiliated with Colorado State University, characterized that shift as analogous to what happened in energy.
“Back in the ‘80s, there was this rhetoric that we need to produce more energy,” he said. “We’re going to need to mine more coal, get more hydropower online, you name it.”
In the Columbia River Basin, where he was, the push for new energy generation resulted in heavy investment in nuclear plants. They, he said, were an economic disaster.
Finally, Bonneville Power Administration said just put in some simple conservation and energy efficiency programs.
That idea wasn’t even novel then, of course. Amory Lovins in his 1976 Foreign Affairs essay, had described conservation as the soft path. It took utilities decades to embrace the idea. They kept wanting to build bigger and bigger coal but also natural gas plants.
Tracy described something similar happening in water. “The rhetoric out there right now — that we need to find more water — just doesn’t match reality,” he said. “It’s not only that we’re using less water. Our gross domestic product keeps going up.”
Since 2000, agricultural productivity – both irrigated and dryland – has grown 20%. “Even with a decline in irrigated agriculture, our agricultural productivity across the nation has been increasing.”
That’s water used for agriculture. How about urban use? Colorado’s Front Range, metropolitan Phoenix, Southern California, the metroplexes in Texas – surely they’re using more water.
“Well, their water use kind of increased until about 2005, and it’s been on a decline since then,” he said. “Municipal water use is actually declining.”
Tracy described inertia as a problem in thinking about water. “It takes us a while to get out of the way we are thinking (that gets in the way of how we need to think) in order to address the coming challenges.”
Colorado, he suggested, still remains mired in old ways of thinking about water. He cited Thornton’s long-standing bid to export water from the Poudre River Valley. The city’s water planning assumed a per-capita need of 170 gallons a day, when 120 to 130 gallons is possible.
”When you think of how efficient ag has become, it’s decades ahead of where municipalities are,” he said. `
Tracy also faulted the Colorado Water Plan, which defines a water gap between supply and demand.
Dams and then technology
How did we get here? Tracy described several phases.
Physical interventions came first. Water was diverted from creeks and rivers, dams were built and, beginning in the 1930s, tunnels were bored to bring water across the Continental Divide. Massive amounts of infrastructure resulted, continuing through the 1960s.
“For the most part, the era of big dam building was done by the ‘60s.”
Some want to link the end of that era to the 1976 collapse of the Teton Dam in Idaho. Had that dam not failed, that era had largely reached its limitations, he said. “We hit marginal returns on this approach.”
Although Tracy did not mention it, the formal end to Colorado’s era of big physical infrastructure is best described by the veto for Two Forks, Denver’s plans for a massive import. There have been expansions of existing transmountain diversion projects since then, but not new ones.

Technology interventions came next, in Tracy’s telling. The centrifugal pump was a major one. Developed in the 1940s, it came on strong in the ‘60s, ‘70s, ‘80s and even the ‘90s. These new pumps allowed drafting of groundwater in the Ogallala and elsewhere. “A lot of this water was used to support irrigated agriculture.”
A twist on this was to improve efficiency of the technical interventions. Instead of using the groundwater for flood irrigation, it was spread with center-pivot sprinklers. Then the center-pivot sprinklers were modified to reduce evaporative losses.
That approach has now arrived at the stage of marginal returns.
Agronomic intervensions
Now comes what Tracy called agronomic interventions. It’s a form of ag water management. “When you said you were working in ag water management, people assumed you work on irrigation systems, on canals or ditches and so forth.”
Now when he talks about water management, he’s talking about crop selection and evaporative and transpiration needs.
“Your decisions on managing under water stress are not related to the highest efficiency irrigation system,” he explained. They’re related to what crop are you selecting? What type of agrochemicals are you applying? What type of soil management are you doing?
This has led to predictive crop water-demand tools, development of drought and salt-tolerant crops and other pursuits of the Colorado Water Center. “We’re not talking about pumps.”
What else falls under the heading of total water management?
Try cowpeas. The legume tolerates sandy soils and low water and can provide forage for cattle. Research is underway to answer whether this crop from Africa might be useful in Colorado in some areas reliant on declining groundwater supplies.
Crucial will be whether the crop can find a viable market. That includes, he added, whether cowpeas could be a replacement for beef in the so-called fake meat products.
As for the Ogallala, the efficiency of irrigation in some areas is “mind-blowingly ridiculous. I mean, they’re north of 90%. Whereas if you think of somebody watering their lawn, if they get anywhere near 50% it would be a miracle.”
Guided by water decisions should be a clear understanding of value derived. Agriculture, for the most part, has been doing so for the last two decades, if not longer.
“Do we have enough water? Yes, we have enough water. Do we have enough water to grow corn in areas where the productivity of the Ogallala Aquifer isn’t what it used to be? No, we do not.”
That, he said, requires agronomic decisions.
The Colorado Water Center has research underway at several locations in Colorado, including at Akron, on the edge of the Ogallala Aquifer, and at Fruita, along the Colorado River. The research attempts to get a better understanding of how much water crops are using. “There are a lot of areas on the West Slope that still use flood irrigation,” he said. The efficiency of that water use can be improved, but given the demand for the water, “sometimes the infrastructure investment isn’t worth it.”
Water Center staff has also been working with ranchers to better manage forage on pasture land in ways that may reduce water use. The Fruita station also did a winter crop of legumes that required no irrigation. “And they brought in a crop, which just kind of amazed me,” said Tracy.
The mixed bag of climate change
Tracy also talked about climate change, calling it a mixed bag. The warming climate allows growing of corn into Canada now. But this has been accompanied by greater variability. “It has expanded the growing season on average – great. But it means you have higher probability of a freeze in June – not good. As for weather, he sees improved forecasting that will help farmers. “I expect that in the next couple of years there will be some products that give a much better idea of when we expect deep freezes, high-precipitation events, droughts and what have you in the three-to six month timeframe. Those pieces of information will be incredibly useful in helping make beginning-of-season decisions.”
As for water policy, he argued that Western states in general, but Colorado in particular, has an over-reliance on technical interventions.
Building infrastructure will not solve the problems. These physical and technological interventions are reaching the point of marginal returns,” he said. “So how do you go about dealing with water challenges and growing populations? He cited emerging information technology that will aid in understanding exactly how much water is needed to bring a crop to market.
Click the link to read the release on the Ute Water website:
February 24, 2024
With a unanimous decision during a regular board meeting on February 14th, Ute Water’s Board of Directors pledged a financial contribution of two million dollars to the Colorado River District in securing the Shoshone water rights. The largest domestic water provider between Denver, Colorado, and Salt Lake City, Utah, is committing funding for the historic and monumental acquisition of the state’s largest and most senior non-consumptive water right on the Colorado River. This landmark purchase aims to finalize the Shoshone permanence efforts that Ute Water has been committed to for over 20 years.
What are the Shoshone water rights?
The senior Shoshone water right was established in 1902, before the Shoshone Hydroelectric Facility was constructed in the Glenwood Canyon east of Glenwood Springs, Colorado. The rights have commanded supreme control over the Colorado River for over a century to ensure the hydroelectric plant’s “first in time, first in right” allocation to run water through the power-generating turbines and back into the river below. The Colorado River water that exits the Xcel Energy-owned facility after power generation flows downstream has contributed to the life force of the Grand Valley for generations.
On December 19th, 2023, Xcel Energy signed a momentous Purchase Sale Agreement (PSA) with the Colorado River District, which will transfer the senior water rights to the multi-county conservation organization for 98.5 million dollars. The sale will provide a permanent solution to an agreement made in 2016–the Shoshone Outage Protocol (SHOP), a standing acknowledgment between major water users across the state to operate the Shoshone Call, thereby sending historic flows westerly even when the hydroelectric facility is not in operation. The facility does not have any plans to close to date, but isolated outages related to the age of infrastructure and a host of natural disasters that the Glenwood Canyon has inflicted, from rockslides to wildfires, have tested the SHOP agreement.
According to the Colorado Division of Water Resources, water rights can be abandoned or dissolved when not put to beneficial use. When called, rights as influential as Shoshone can command as much as 86,000 acre-feet of westerly flow in a dry year.
With the Shoshone water rights purchase, the Colorado River District, in collaboration with the Colorado Water Conservation Board, aim to arrange an instream flow agreement to secure the historic flows to the Western Slope.

Why are the Shoshone Water Rights important to Ute Water and its 90,000 customers?
With strategically redundant infrastructure and source waters, Ute Water can overcome the difficulties of dry years by activating secondary water sources from Ruedi Reservoir and the Colorado River to supplement primary Plateau Creek water sources. Additional flows in the Colorado River from the Shoshone call improve water quality characteristics, such as the dilution of salinity levels. Irrigation entities also rely on Colorado River flows that fill canals and allow for robust and bountiful agriculture. Continued flows from Shoshone aid in maintaining the natural heritage of four endangered and threatened fish species that utilize the 15-mile reach (Bonytail, Colorado Pikeminnow, Humpback Chub, and Razorback Sucker), and persist alongside continued water security and sustainability for the Grand Valley community.
On a statewide level, maintaining higher recreational flows fuels the river recreation economy in Colorado, where the Colorado River basin on the Western Slope contributes around four billion dollars annually to the state’s GDP, according to the Colorado River District. The flows from Shoshone that reach Lake Powell also contribute to Colorado River interstate compact compliance.
How will the purchase be funded?
The Colorado River District presented the plan and progress for funding the Shoshone permanency effort during Ute Water’s regular board meeting on February 14th. Colorado River District General Manager Andy Mueller outlined two major milestones that have gotten the project’s funding off the ground.
On December 19th, 2023, in conjunction with signing the PSA with Xcel Energy, the Colorado River District’s 15-county board unanimously approved a 20-million-dollar contribution.
Then on January 29th, during the regular Colorado Water Conservation Board meeting, a hearing took place regarding Shoshone water rights funding. Ute Water staff testified in support of the Shoshone permanency effort at the hearing, and the Colorado Water Conservation Board unanimously backed the effort with an additional 20 million dollars in state funds through the Non-Reimbursable Investment Grant.
Moving forward, the Colorado River District hopes to leverage at least ten million dollars committed by various water users and providers of the Western Slope who will continue to benefit from the flows of Shoshone. Once local funds are secured alongside Ute Water’s two-million-dollar contribution, the Colorado River District plans to request the remaining balance of 49 million dollars from the Bureau of Reclamation’s Inflation Reduction Act funding sources, which is slated to support drought mitigation funding projects like these efforts on Shoshone permanency.
What’s next?
More information about the effort can be found through the Shoshone Water Right Preservation Coalition and Campaign, of which Ute Water is a member, at keepshoshoneflowing.org. The Colorado River District plans to meet the four closing conditions of the PSA by December 31st, 2027. These closing conditions are as follows:
- Negotiation of an instream flow agreement with the Colorado Water Conservation Board
- A change of water rights decree through the water court process
- Secure Funding
- Approval by the Colorado Public Utilities Commission
Once these conditions are met and the acquisition is completed, Ute Water, the Grand Valley, and the Western Slope at large will realize the water security and sustainability benefits of Shoshone permanency.
Ute Water is proud to stand with our Western Slope community in preserving the lifeblood of our region – the Colorado River. Shoshone permanency has been generations in the making, and it will provide Western Slope water resources and prosperity for generations to come.
The latest on Keep Shoshone Flowing can be found online, on Facebook, and via newsletter.
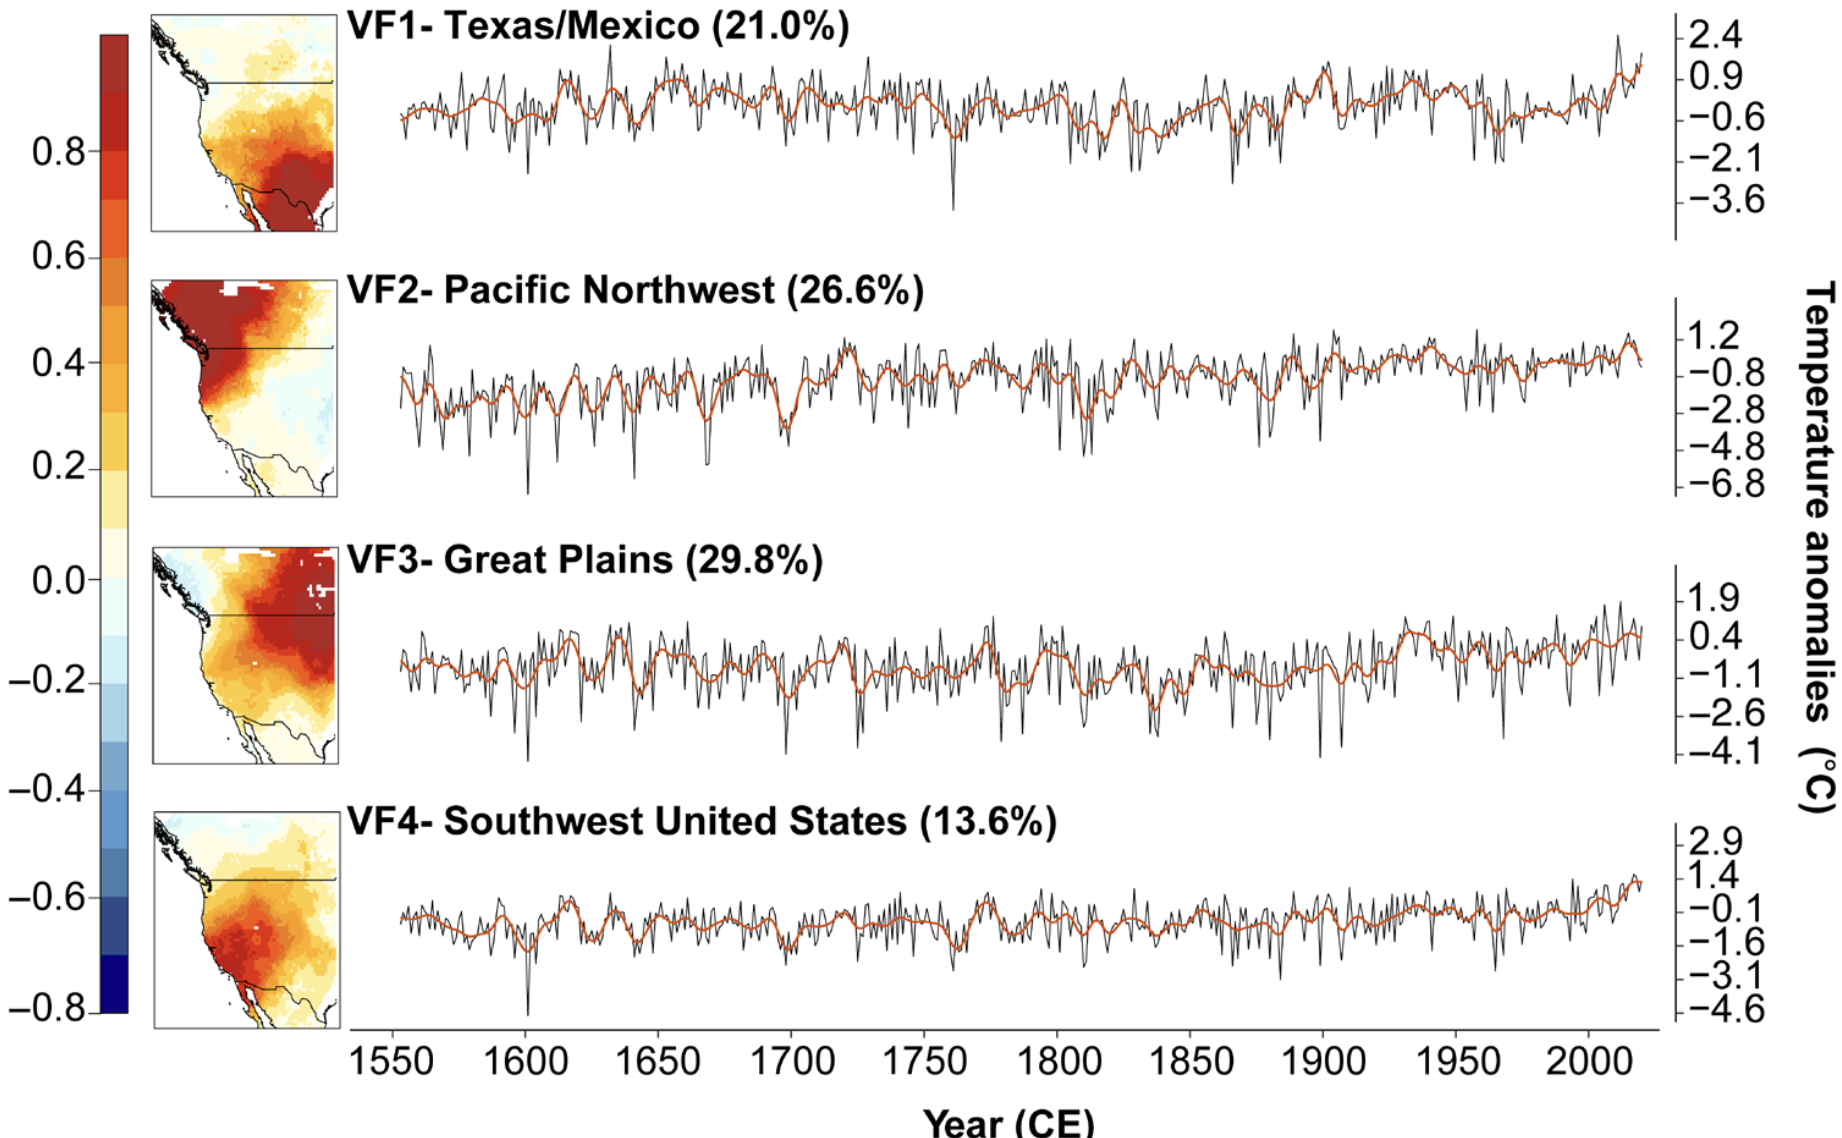
Click the link to access the article on the Science Advances website (Karen E. King, Edward R. Cook, Kevin J. Anchukaitis, Benjamin I. Cook, Jason E. Smerdon, Richard Seager, Grant L. Harley, and Benjamin Spei). Here’s the abstract:
Across western North America (WNA), 20th-21st century anthropogenic warming has increased the prevalence and severity of concurrent drought and heat events, also termed hot droughts. However, the lack of independent spatial reconstructions of both soil moisture and temperature limits the potential to identify these events in the past and to place them in a long-term context. We develop the Western North American Temperature Atlas (WNATA), a data-independent 0.5° gridded reconstruction of summer maximum temperatures back to the 16th century. Our evaluation of the WNATA with existing hydroclimate reconstructions reveals an increasing association between maximum temperature and drought severity in recent decades, relative to the past five centuries. The synthesis of these paleo-reconstructions indicates that the amplification of the modern WNA megadrought by increased temperatures and the frequency and spatial extent of compound hot and dry conditions in the 21st century are likely unprecedented since at least the 16th century.
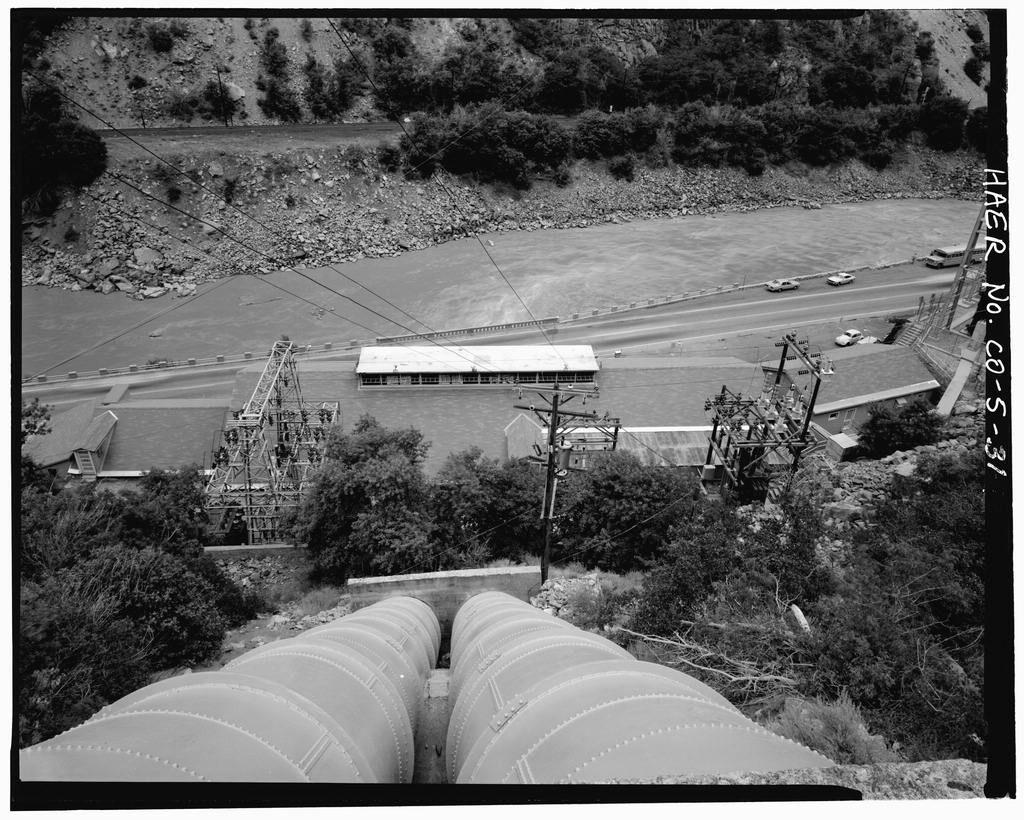
Click the link to read the article on The Denver Post website (Elise Schmelzer). Here’s an excerpt:
February 26, 2024
A small hydroelectric power plant on the banks of the Colorado River has inspired a unique coalition in a state where water scarcity and politics often pit environmentalists, growers and recreationists against each other. Yet those groups recently set aside their competing interests in western Colorado, banding together to safeguard the water rights tied to the squat brown building tucked just off Interstate 70 in Glenwood Canyon. It still generates power, but its true value has been in the water that flows through it — which just might be the key to the river’s future…
Peter Fleming, the general counsel for the district, said of the interests along the river, from agricultural producers to the recreation industry: “Uniformly, across the board, they are in support of protecting the Shoshone flows. It’s pretty unique. People don’t always see eye to eye on water issues.”
[…]
Environmental protection plans exist based on the assumption that the water will be in the river. If the plant’s right were to disappear, those plans likely would need to be rewritten. The flows also keep water temperatures down for endangered fish and keep salinity low in drinking water for towns on the river…For agricultural producers in the Grand Valley, the water is crucial for growing Palisade peaches, wine grapes, wheat, corn, hay and alfalfa, said Tina Bergonzini, the general manager of the Grand Valley Water Users Association…The consistent flows provided by the Shoshone right also are critical for the $4 billion recreation industry centered on the Colorado River on the Western Slope, according to the river district.
More Coyote Gulch coverage of the Shoshone right.
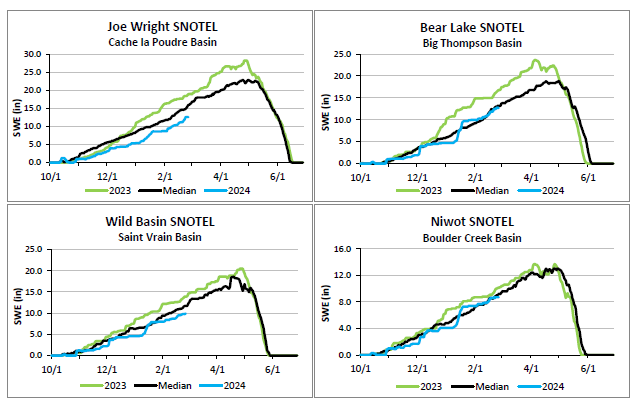
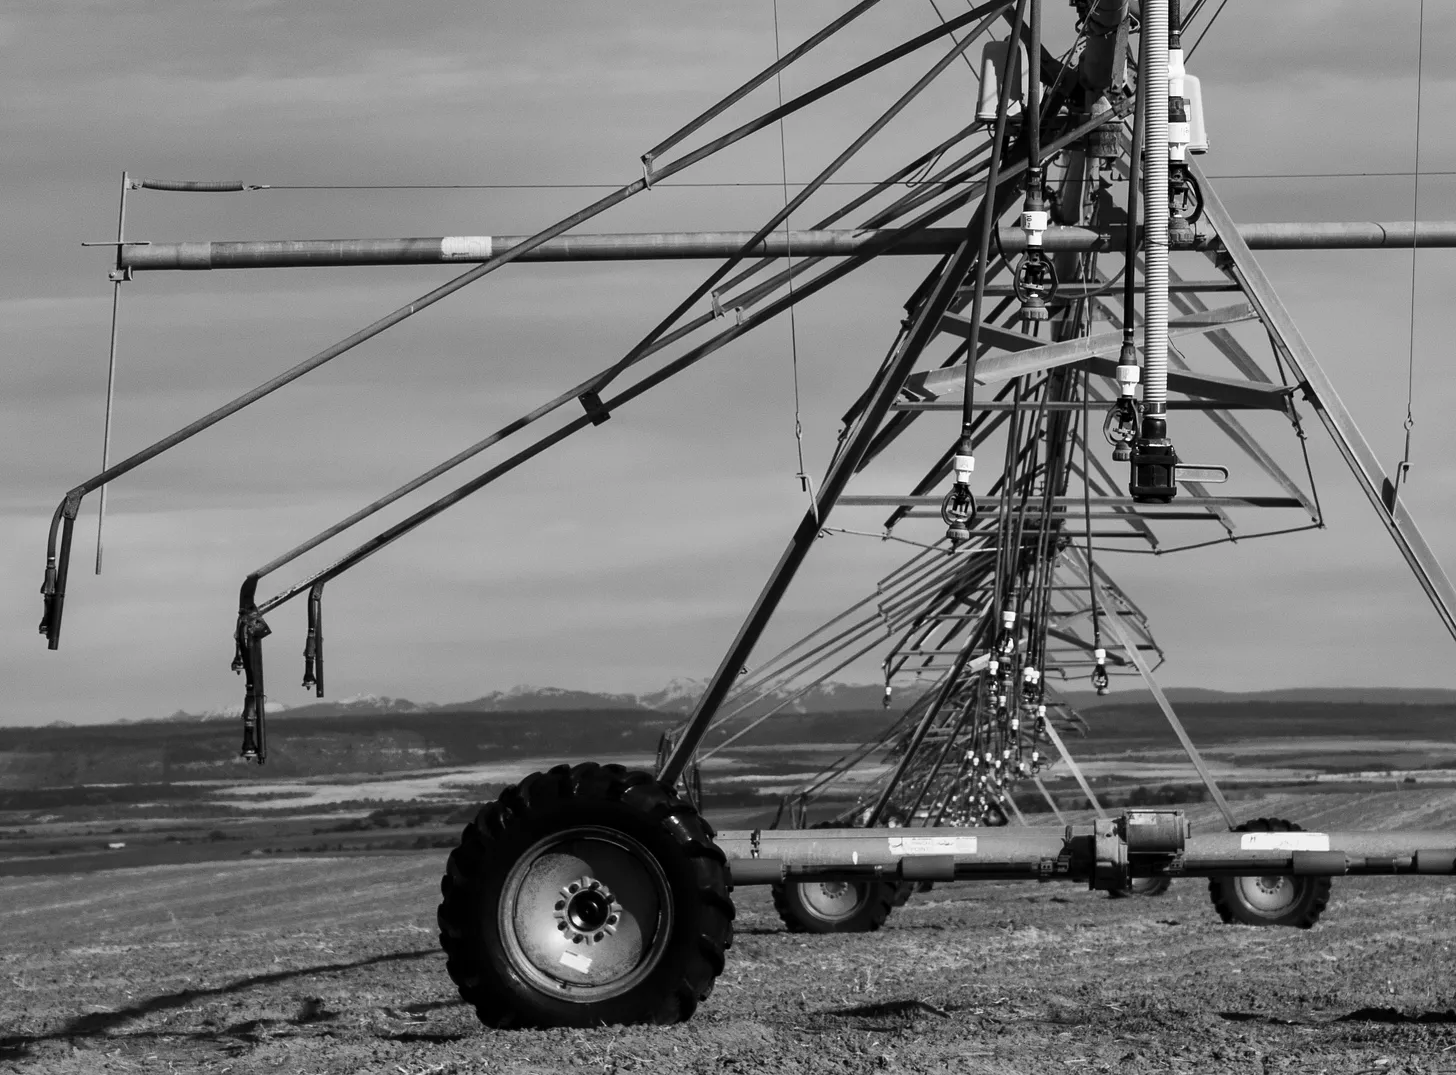
Click the link to read the article on The Land Desk website (Jonathan P. Thompson):
February 23, 2024
Happy Agricultural Census time! Last week, the USDA released the 2022 Census of Agriculture — a once-every-five-year event — and, as always, it’s chock full of data on the state of the nation’s farming. I like to peruse the numbers and compare them to those from previous censuses to try to get a sense of how the West’s agricultural landscape is changing, and to get answers to questions like: How are farmers responding to aridification? Is residential development really gobbling up all the farmland?
The report only offers numbers, without a lot of context. So drawing firm conclusions isn’t possible. But the data are interesting, and sometimes enlightening, nonetheless. Let’s start with an overview:
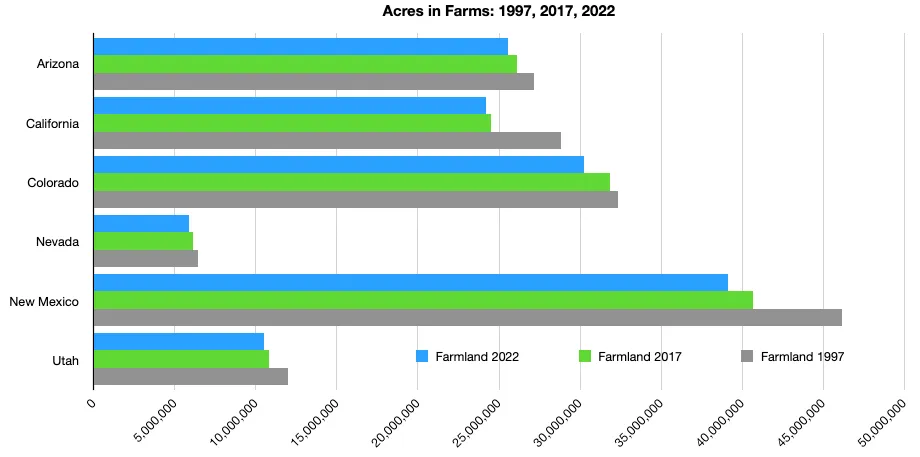
I gotta say, I had to double- then triple-check the numbers on this one. New Mexico has way more farmed acres than California — Say what!? But yeah, they do. Keep in mind that this is not cropland, but farm land, which can include sprawling ranches and just land that someone is calling agricultural for tax reasons. So take it with a grain of salt. Farm acreage is decreasing in all the states, which is hardly surprising.
But before you freak out about the death of American farming, consider this: The total number of farms has increased everywhere since 1997 except in California.
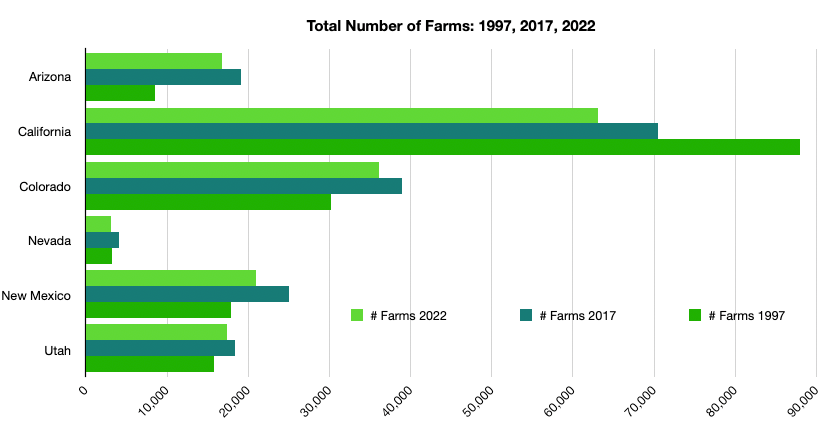
Other data suggest that small farms are making a big comeback, especially in Colorado (though there was a slight dip in farm numbers between 2017 and 2022).
Now let’s look at alfalfa, since hay is not only fodder for horses but also for fighting over these days, especially in the Colorado River Basin. We hear a lot about how much water alfalfa uses and about how the federal government is paying farmers in the Lower Colorado River Basin not to grow the stuff. And so, one might expect to see a big drop in alfalfa production in those places.
That didn’t happen. In fact, several places produced significantly more alfalfa in 2022 than in 2017. It seems weird, but there are a few things to consider. First, even though the Colorado River Crisis was well under way by 2022, most of the programs paying farmers to stop farming hadn’t yet kicked in in 2022. Also, farmers aren’t really being paid to stop farming or plow up their crops. They’re being paid to use less water. Or, another way to look at it: The feds are leasing the farmers’ water from them in order to keep it in the reservoirs. Which means farmers can keep growing if they want; they just can’t irrigate as much. And alfalfa, it turns out, is fairly drought tolerant, unlike, say, almonds or lettuce or broccoli. So it makes some sense to see alfalfa production hold steady or even climb during a drought.
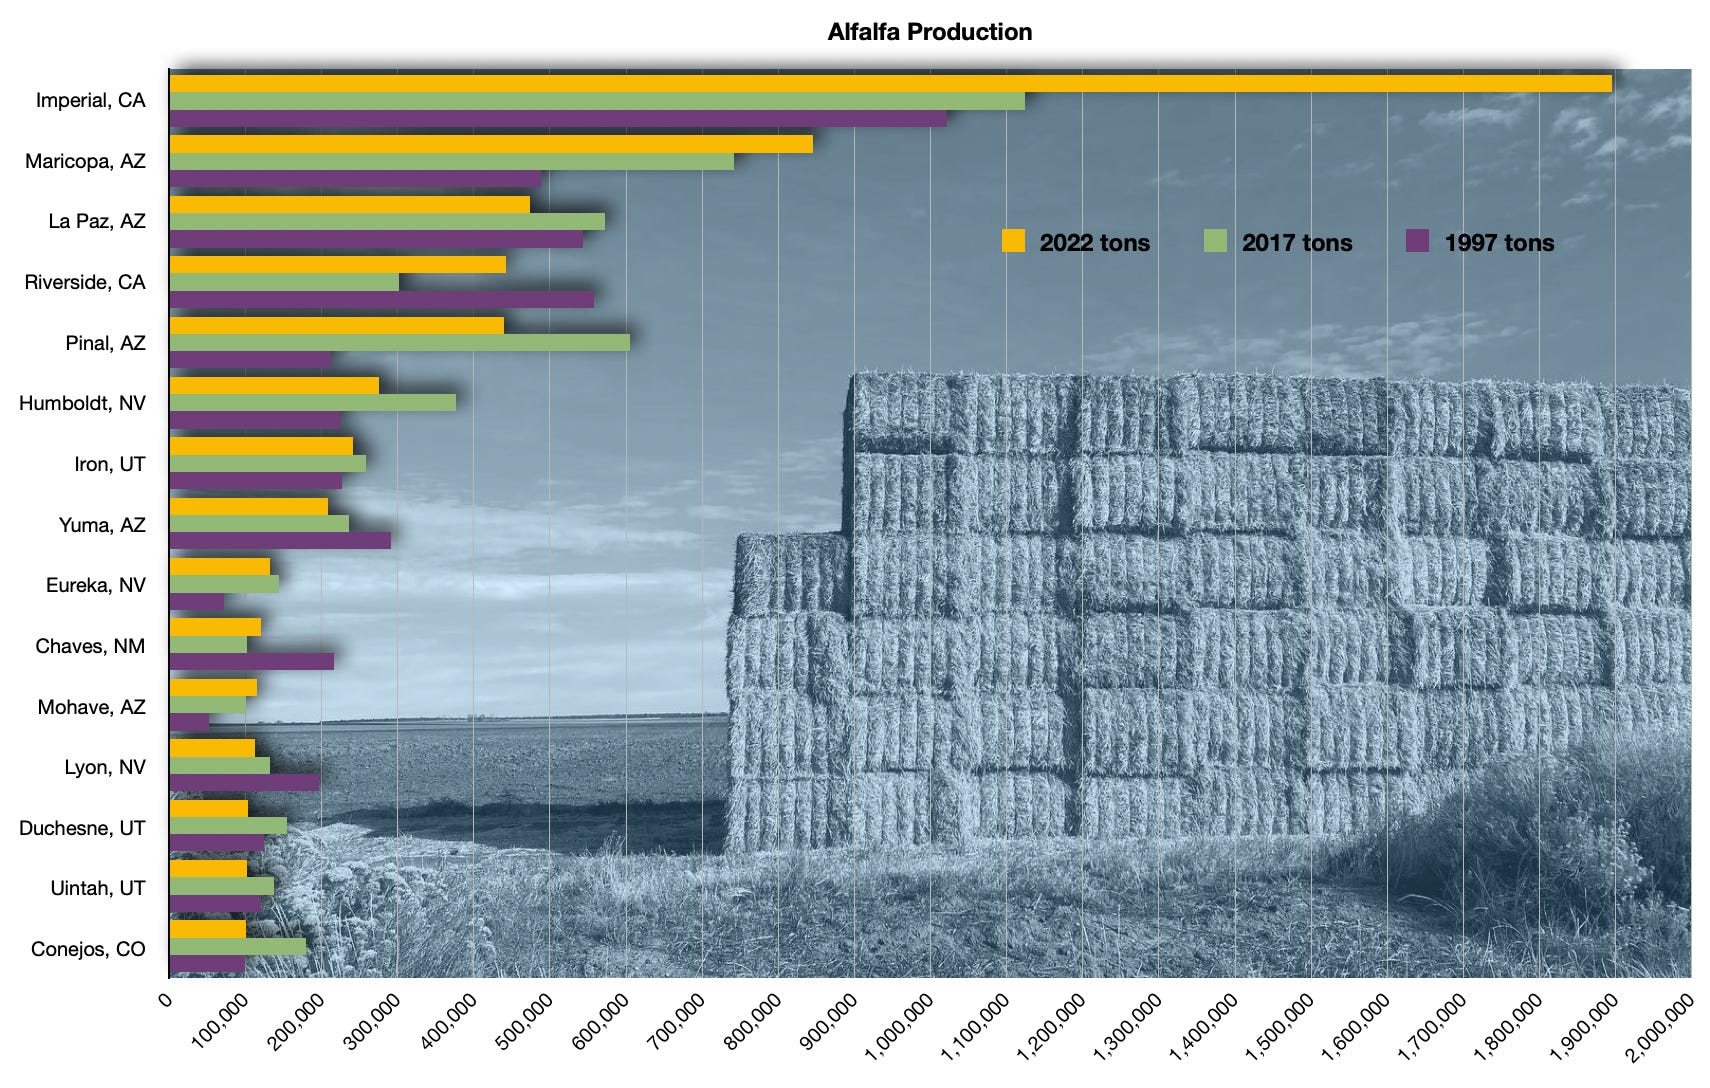
Once again, Imperial County, California, is the West’s biggest alfalfa producer. And the Imperial Irrigation District remains the largest single water user on the Colorado River. Maricopa County, Arizona, is in second place for alfalfa tonnage, which just goes to show that Phoenix sprawl may be gobbling up farm- and desert-land, but the hayfields endure (and Maricopa County is ginormous). And alfalfa production increased substantially between 2017 and 2022 in those places, though it fell in most of the other counties surveyed.
And here’s something else that doesn’t show up on the graph: Eddy County, New Mexico’s alfalfa acreage and production fell by more than 50% between 1997 and 2022. I don’t know the reason, but I wouldn’t be surprised if it had to do with the Permian Basin oil and gas drilling boom, some of which surely is taking place on farmland. Just a guess. It also might have to do with ongoing drought, I suppose.
Of course, most of that alfalfa is going to feed livestock, either in the U.S. or elsewhere. And a surprisingly (for me, at least) large percentage of that livestock in the West are dairy cattle. So eschewing beef, alone, in order to save water ain’t gonna be enough. You gotta ditch the whole enchilada, cheese and all! (Ain’t happening).

California, especially Tulare and Merced Counties, is dairy country. The state is home to nearly 1.7 million dairy cattle. Idaho runs a distant second for the West, with a mere 664,000. Nearly a half-million dairy cattle call New Mexico home, while Maricopa County has about 103,000 dairy cows. Montana is the West’s beef-cow leader, with California, Wyoming, Colorado, and New Mexico rounding out the top five, in that order. Weld County, Colorado, (home of the Greeley stench) is the beefiest county in the West, with Fresno, Kern, and Tulare in California up there, too.
$36 million; $14 million; $45 million: Amount spent in 2018 on energy for on-farm irrigation-pumping in the Rio Grande; Upper Colorado; and Lower Colorado watersheds, respectively.
626,000; 1.4 million Acres of almond orchards in California in 2002 and 2022, respectively. (Aridification ain’t keeping these water hogs at bay, apparently!)
546; 1176 Number of farms in Colorado harvesting vegetables for sale in 1997; 2022, respectively. (A small-farm/farmers market revolution?)
$671,000; $2 million Average value of a Colorado farm’s land and buildings in 1997; 2022, respectively (That amounts to $618/acre then vs. $2,401/acre now, meaning it’s a lot more expensive to get into farming these days if you don’t already have any land).
37; 105 Number of farms in Nevada harvesting vegetables for sale in 1997; 2022, respectively.
85,446; 58,831 Acres of potatoes harvested in Colorado in 1997; 2022, respectively. (That’s a big drop. I plan to look into this one a bit more in a future dispatch).
2,038,456; 606,105 cwt (approx. 100 lbs) of dry beans harvested in Colorado in 1997; 2022, respectively (Ack! What’s going on?!)
6.8 million; 9.4 million Bushels of corn produced in Arizona in 1997; 2022, respectively. (Another counterintuitive one. Warrants further investigation!)
860,000; 313,000 Bales of cotton harvested in Arizona in 1997; 2022, respectively.
73,603; 58,492 Acres of land in orchards in Arizona in 1997; 2022, respectively. (Those citrus groves have been displaced by subdivisions, I’m afraid).
2.7 million; 4.1 million Acres of land in orchards in California in 1997; 2022, respectively. (Wow! A lot of these acres are planted with almonds, surely.)
2.6 million; 1.8 million Number of hogs and pigs sold by Utah operations in 2012; 2022, respectively. (Yes, Utah is hog-farm central. Smithfield Foods contracts with a bunch of factory hog farming operations in Beaver County. They are cutting back operations, however.)
And the most heartbreaking data point? Dove Creek isn’t even close to being the Pinto Bean Capital of the World anymore. Hell, it’s not even the bean capital of Colorado. Dolores and Montezuma Counties together produced about 25,000 cwt of dried beans in 2022. Yuma County, Colorado, harvested 270,000 cwt. Okay, granted, that’s for alldry beans, not just pintos (the census doesn’t break them out by variety). Still … How the mighty have fallen!
Are you curious about specific ag stats for your county or state? Drop the Land Desk a line or put your question in the comments below and we’ll try to track down an answer.
Alfalfaphobia?
SEPTEMBER 23, 2022

In recent weeks I’ve written a piece or Two about Alfalfa. My thesis: As the biggest single water user in the Colorado River Basin, the crop must plan an equally large role in contributing two the cuts necessary to keep the river from drying out. I know, it doesn’t seem like a hot-button topic. I mean, it’s just hay, after all.
A follow up
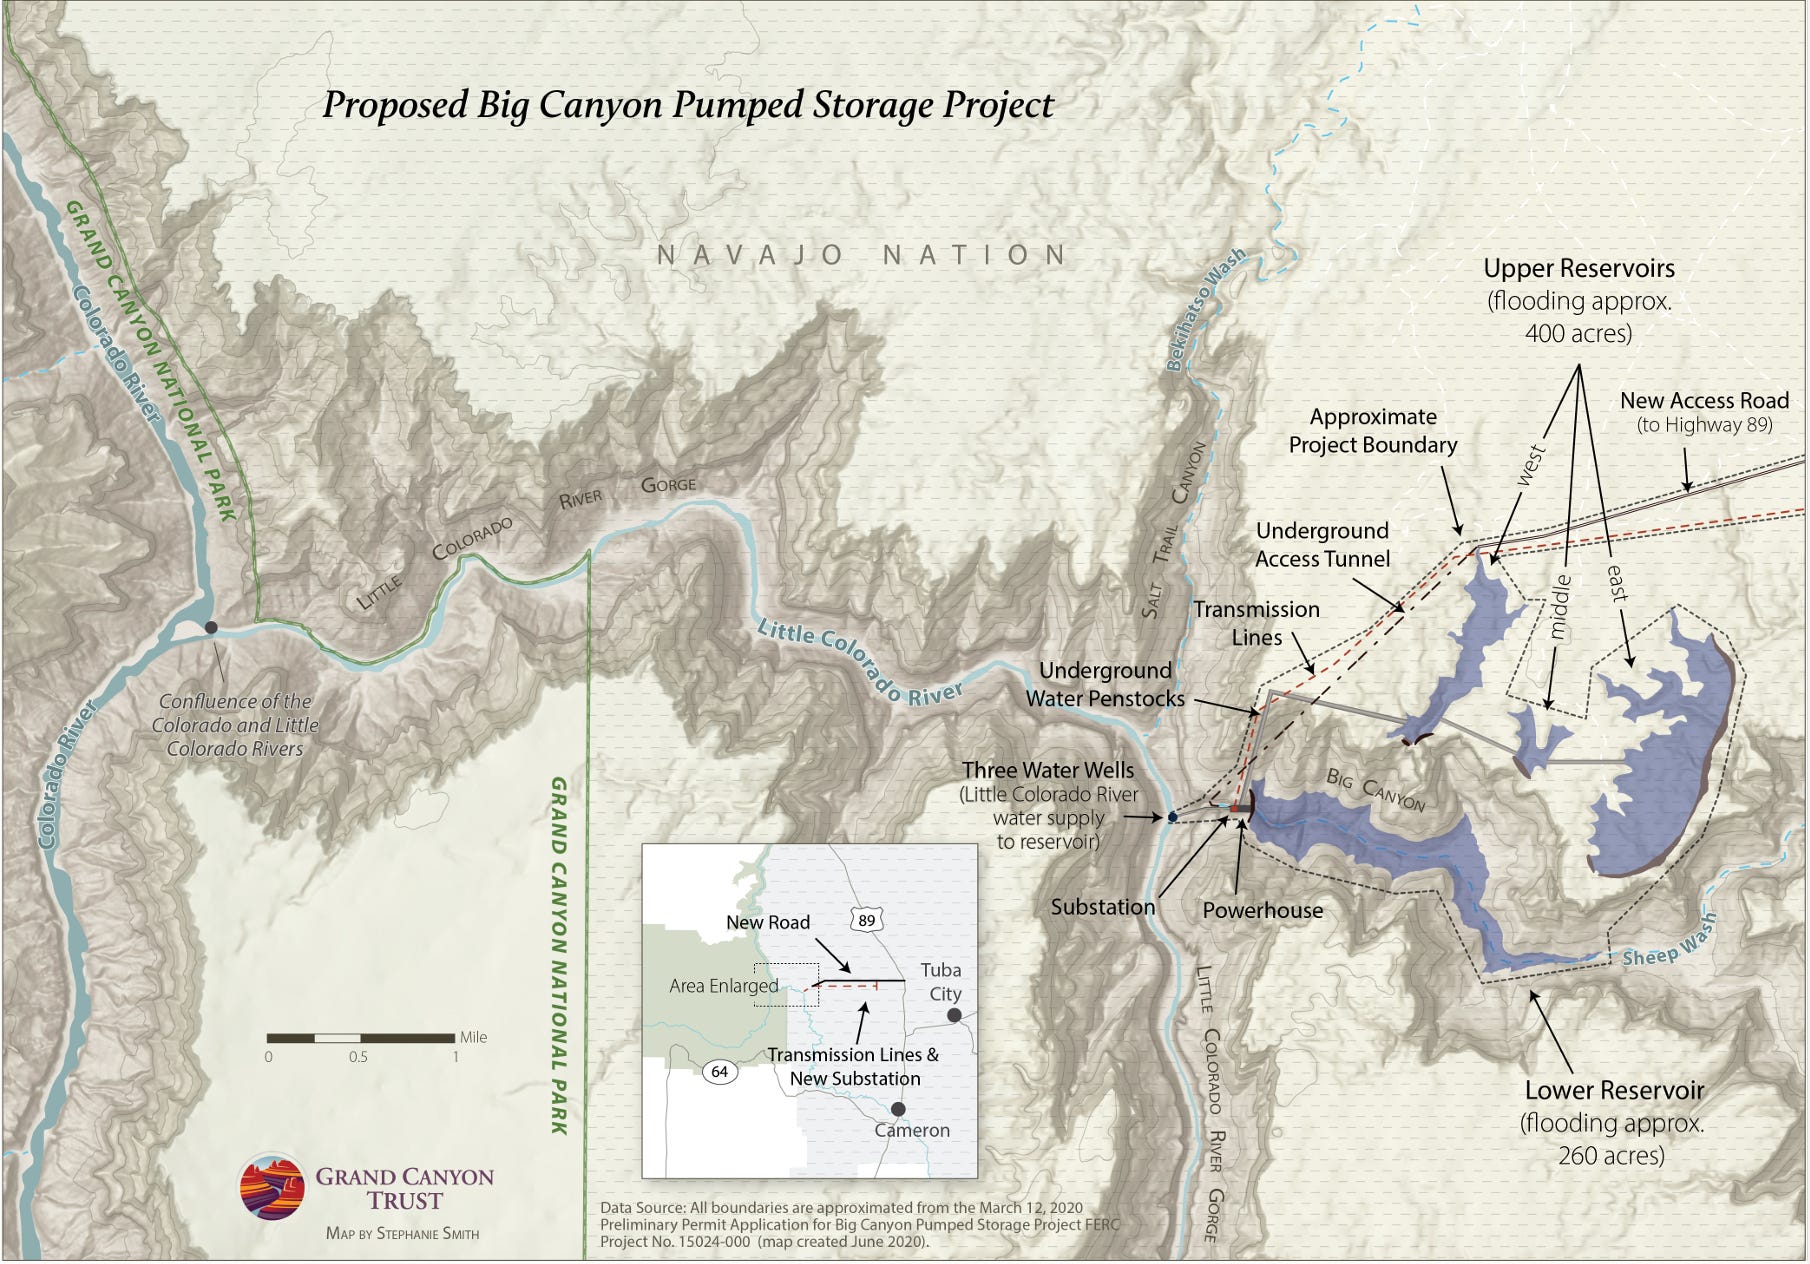
When I wrote earlier this week that federal regulators had nixed all of the still active proposals for pumped hydropower energy storage facilities on the Navajo Nation, I overlooked one: the proposed Big Canyon Pumped Storage Project on a tributary of the Little Colorado River. Seems that when the Phoenix-based company surrendered permits for two other Little Colorado projects back in 2021, it kept a third proposal alive. Since I hadn’t heard anything about it, I had assumed it had simply faded away. Not quite.
This week FERC issued a notice seeking public input on the Pumped Hydro Storage’s application for a preliminary permit for the project, which would be located on Navajo Nation lands.
So why didn’t FERC reject this project like it did the other proposals? Because back in 2020, when the application was initially submitted, the tribe intervened in the case, but didn’t express outright opposition. Now they have the chance to do so, which presumably would result in the permit’s rejection per FERC’s new policy. The Hopi Tribe has also weighed in on FERC policy and these projects.
Parting Shot
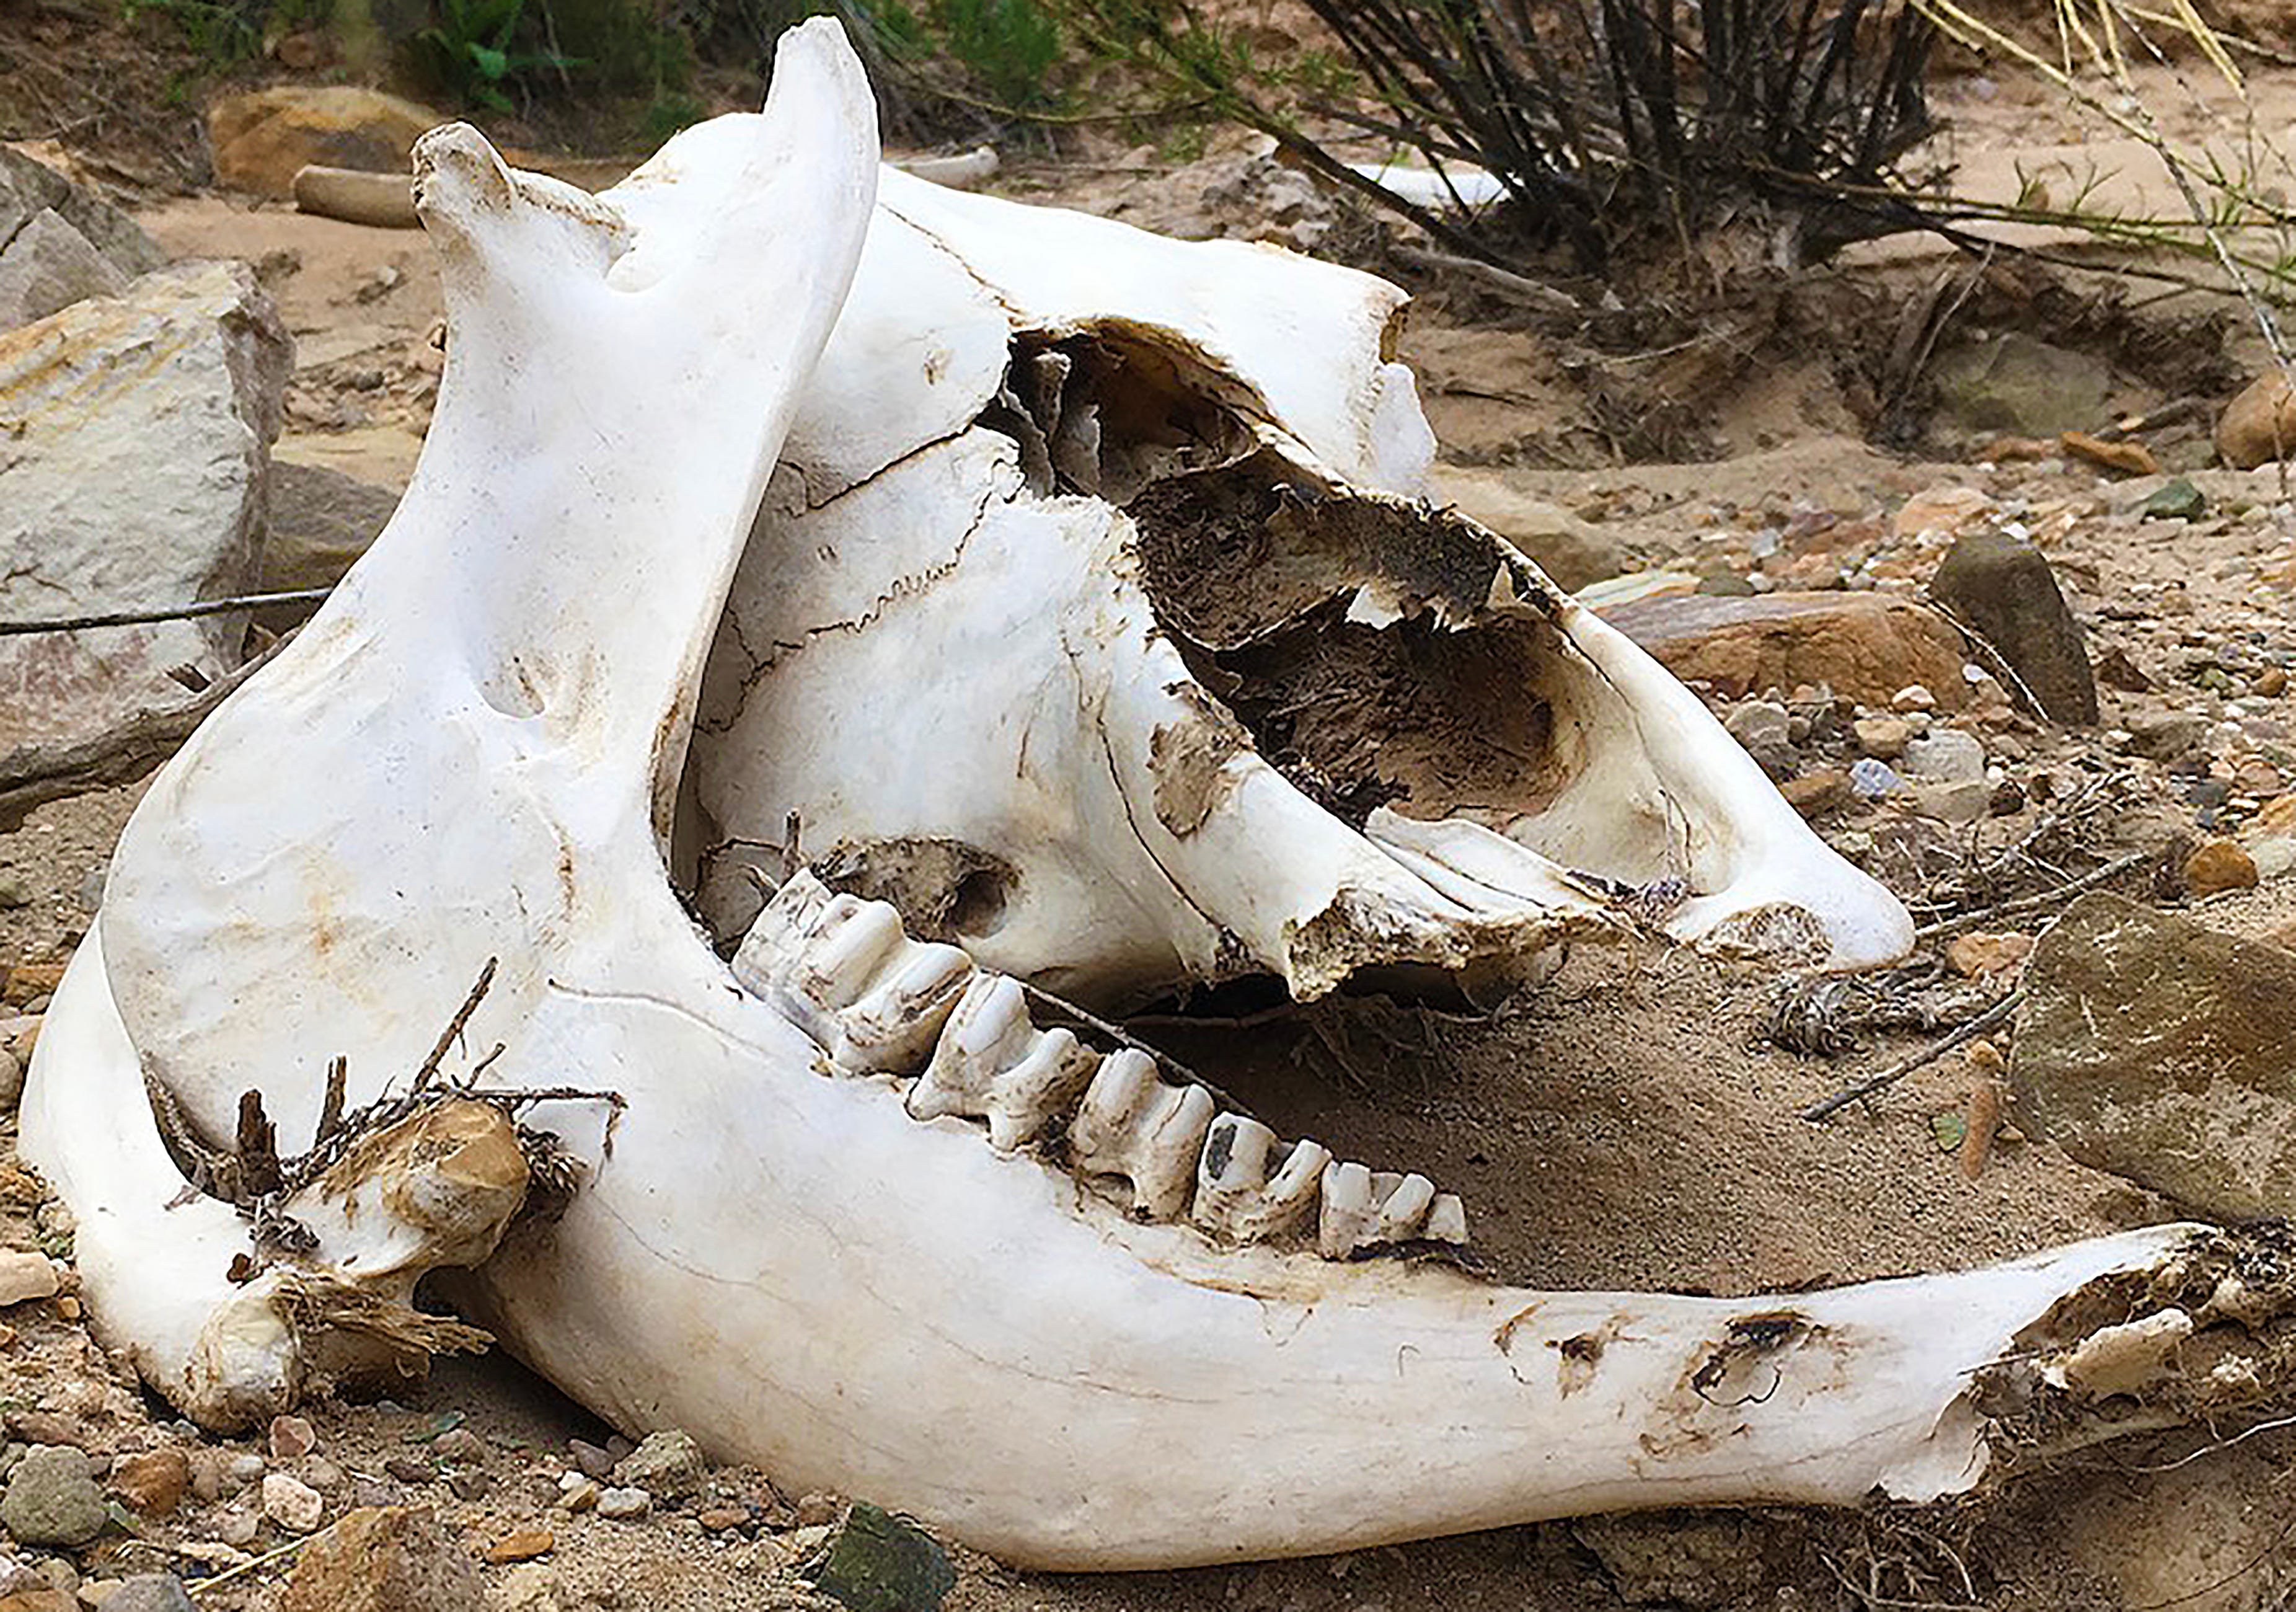
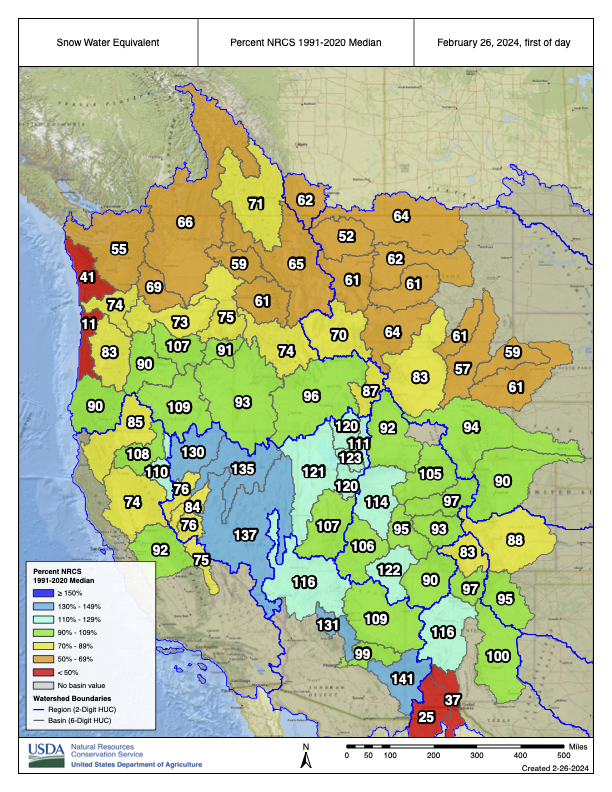
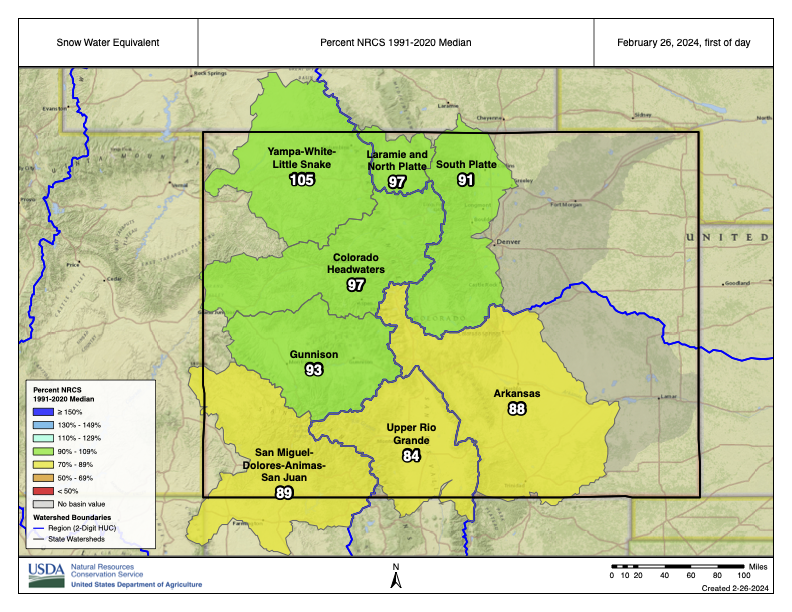

Click the link to read the article on the Getches-Wilikinson Center website (Chris Winter):
January 24, 2024
The Getches-Wilkinson Center and the Getches-Green Clinic recently teamed up with 29 law professors from around the country to submit an important amicus curiae brief in a case that could undermine the integrity of the Antiquities Act.
In 2021, President Biden issued two proclamations restoring Bears Ears and Grand-Staircase Escalante National Monuments in southern Utah. Both landscapes are rich in cultural, ecological, and paleontological objects that reflect millennia of human occupation and provide a living laboratory for scientific study. Professor Charles Wilkinson played a key role in the work that led to the original designation of both monuments, and scholars from the University of Colorado Law School have advanced the study of the Antiquities Act for many years.
The State of Utah and other parties challenged President Biden’s proclamations in the District of Utah, alleging that the President designated ineligible objects and protected too much federal public land in creating the monuments. The district court dismissed the lawsuit holding that there was no right to judicial review of a monument proclamation. The plaintiffs appealed the case to the 10th Circuit Court of Appeals.
Chris Winter, Executive Director of GWC, and Sarah Matsumoto, Director of the Getches-Green Clinic, worked on the amicus brief, which was signed by 29 environmental law professors from across the country. The law professors encouraged the 10th Circuit to refine the district court’s approach to judicial review of monument proclamations to align with how the D.C. Circuit court has addressed the issue. The D.C. Circuit Court allows for a limited form of facial review to ensure that the President acted within the authority delegated to the office by Congress. Here, it is clear that President Biden’s proclamations should be upheld under this limited form of review as a valid exercise of Presidential discretion.
Prof. Mark Squillace, Raphael J. Moses Professor of Law at Colorado Law School, and John Leshy, Distinguished Professor Emeritus, University of California College of the Law San Francisco, contributed extensive time and energy to the effort. We are also grateful for the key assistance of the clinical students – Lizzie Bird, Mariah Bowman, and Mike McCarthy.
You can also read a Bloomberg article discussing the amicus brief here.

Click the link to read the article on the Pagosa Springs Sun website (Josh Pike). Here’s an excerpt:
At its Feb. 15 meeting, the Pagosa Area Water and Sanitation District (PAWSD) Board of Directors voted to raise fees and rates for 2024 in accordance with the rate study by Stantec that the board approved at its Dec. 14, 2023, meeting. The board voted to increase the monthly service charge per equivalent unit (EU) by 3 percent, going from $31.44 in 2023 to $32.38 in 2024. The monthly service charge per EU for wastewater was voted to increase by 30 percent from $32.80 in 2023 to $42.64 in 2024. Short-term rentals (STRs) will be charged 140 percent of the wastewater rate, according to the fee schedule approved by the board.
The capital investment fee (CIF) for water increased from $5,352.37 in 2023 to $8,958, and the wastewater CIF increased from $1,178.98 in 2023 to $15,697 in 2024, according to the fee schedule.
Other fees, such as availability fees, dumping fees for septic haulers and water fill station fees also increased, with the increases matching the percentage increase in water rates for water-related fees and the percentage increase in wastewater rates for wastewater-related fees.
The new rates and fees will take effect March 1.
Click the link to read the article on the Big Pivots website (Allen Best):
February 23, 2024
A bill being readied for introduction in March would create a state standard for review of renewable energy projects by Colorado jurisdictions. Is this really needed?
A bill creating statewide standards for local governments in Colorado evaluating renewable energy projects is likely to be introduced in coming days or weeks. Is this a solution in search of a problem?
Very few local governments in Colorado have adopted regulations seen as onerous by energy developers. Pueblo County several years ago rejected a solar farm based on neighborhood opposition. They feared loss of views. Mesa County in January adopted a six-month moratorium on new utility-scale solar projects with the active support of at least one local solar company. Delta County commissioners at first rejected a solar farm on Garnett Mesa but the proponents made changes more acceptable to neighbors.
Colorado’s counties have not been hard-nosed about renewable energy. That point was made by State Sen. Byron Pelton, a former Logan County commissioner who represents much of northeastern Colorado and has a small cow-calf operation near Sterling.
In an op-ed published in the print edition of The Denver Post on Feb. 4 (not available online), he took a swing at the “Democrat majority and radical environmentalists” who would usurp local control in regulating renewable energy siting.
“Most proposed renewable energy projects are approved, and when proposals are denied, it’s for good reason,” wrote Pelton. “Those reasons range from environmental impact concerns and impact on agriculture and wildlife to inadequate benefits for the host community.”
Boulder County, he pointed out, led the way in using moratoriums to address local concerns.
“They imposed a five-year moratorium on oil and gas, giving them time to contemplate the best path forward for their community. None of the moratoriums imposed on renewable energy development have come anywhere close to approaching five years.”
On the same day Pelton’s op/ed was in the Denver Post, USA Today published a story: “US counties are blocking the future of renewable.”
“At least 15% of counties in the US have effectively halted new utility-scale wind, solar or both,” the newspaper reported. The limits come in the form of outright bans, moratoriums, construction impediments and other conditions that make green energy difficult to build.”
The newspaper reported that 375 counties blocked new wind developments in the past decade compared to 183 counties who got them. Many were in Tennessee, North Carolina, and Kentucky, but also in Vermont. Maps published with the story show a couple of counties with wind restrictions on Colorado’s eastern plains, and several on the Western Slope, which have far less wind value. The chart also shows solar restrictions in several Colorado counties but provides no detail.
One common requirement in zoning rules intended to block new wind farms specifies the height of a turbine relative to adjacent property lines. Most new wind turbines in the U.S. are 500 feet or taller. Some counties require setbacks of 1,320 feet, 1,500 feet, a mile or, in some cases, 3 miles.
Colorado Public Radio in a Feb. 8 story reported that State Sen. Chris Hansen, D-Denver, said he intended to introduce a bill that would create a standardized process for local governments considering renewable energy projects. CPR’s Sam Brasch reported that an early draft of the bill also identified rules to restrict development of wind and solar farms and also transmission lines.
Hansen yesterday confirmed that he intends to introduce the bill in March.
A flashpoint for this lies in Washington County, which is in Pelton’s district. While county commissioners in Akron have welcomed the Colorado Power Pathway that crosses the county’s southern section, the county in 2021 also approved some of the state’s toughest regulations on renewable energy projects. CPR says those regulations require one-mile spacing between structures and new wind turbines.
The CPR story also cites a study from the Sabin Center for Climate Change Law that found local governments across 34 states have approved at least 228 restrictions on renewable energy development.
New York, California, and Illinois adopted legislation similar to that being drafted by Hansen to limit local control over renewable energy projects.
Click the link to read the article on the InkStain website (John Fleck):
It is agonizing to watch this, but here we are.
With efforts by the Colorado River Basin states to craft an agreement to share the river’s water skidding, brakes screeching, toward a cliff, we appear on the brink of repeating the disastrous mistake the authors of the Colorado River Compact made a century ago: ignoring inconvenient truths about the risks we face, washing away genuine uncertainties with convenient talking points.
As Eric Kuhn carefully documented in a post here [February 22, 2024], there is once again a genuine risk that we will ignore inconvenient truths about a huge uncertainty in our understanding of how much water the river can offer us, and for whom. We are pretending that an uncertainty literally at the scale of millions of acre feet in how we measure and manage water does not exist.
Resource: A freight train of thoughts about the Colorado River — Allen Best (Big Pivots)
A masterful Upper Colorado River Basin public relations blitz, led by the Colorado Water Conservation Board, would have us believe one set of numbers about the river’s future, a set of numbers that has given Upper Basin water users comfort that they can sit tight and blame others for the river’s woes.
But as Eric’s analysis showed, there are hidden assumptions behind the Upper Basin’s numbers – assumptions that hide a genuine and irreducible uncertainty. The uncertainty is irreducible because more than a century after the adoption of the Colorado River Compact, there is still no agreed upon definition of how to measure the use of water. As Eric wrote, these are questions “with enormous potential impacts on the allocation and distribution of the shrinking Colorado River – questions we have avoided dealing with by draining the Basin’s reservoirs. We no longer have that option.”
ARITHMETIC AND LAW
Eric is a master of the arcane and wonky details of the interface between Colorado River law and hydrology, and I commend you to his analysis – it rewards a careful read. But Eric once described my role in our collaboration as “dewonkifying”, so let me try to put this in simpler terms.
The 1922 Colorado River Compact based its allocations on “beneficial consumptive use”. But the phrase was never defined, and the definitions ended up bitterly contested in the decades that followed. It remains undefined to this day. Or rather, there are two competing definitions that yield very different results.
Each definition makes intuitive sense, and at first glance they look puzzlingly similar. But at the scale of the Colorado River Basin they yield very different results that have become a critical piece of the current basin management debate.
Method A is based on the collective amount of water communities take from the river, minus the amount they return – “diversions less return flows.”
Method B is based on the ultimate impact of that use on the Colorado River downstream of the use – for the Upper Basin, for example, at Lee Ferry, or for Arizona at the confluence of the Gila and the Colorado near Yuma. This is the “stream depletion theory”.
Those might sound so similar that the differences are trivial. And at localized scales they are. But, as Eric explained in yesterday’s post, with a classically Eric Kuhn working out of the mathematical details (I love collaborating with this guy – he shows his work!) at the scale of the Lower Colorado River Basin the differences amount to nearly 2 million acre feet of water.
Under Method A, Lower Basin use is more than 10.1 million acre feet per year, well above its Colorado River Compact allocation of 8.5 million acre feet. This is the methodology the Colorado Water Conservation Board staff used in its now-famous PowerPoint slide purporting to demonstrate that the Lower Basin is using more than its legally allotted share of the Colorado.
But under Method B, Lower Basin use is some 8.3 million acre feet – less than its Compact allocation. Importantly, Method B is the method adopted by the Upper Basin Compact, and therefore the method used in the Upper Basin’s management of its share of the river.
LET’S BE HONEST ABOUT THE UNCERTAINTIES
To be clear, Eric and I are not arguing in favor of A or B. We are arguing, as we did in our book Science be Dammed(we spent chunks of three chapters on this question), that the lack of an agreement over the definition of “beneficial consumptive use” remains a genuine and important unresolved uncertainty in the Law of the River, and our discussions of the future management of the Colorado River need to acknowledge that uncertainty, not pretend that it does not exist.
This is what I, as a stakeholder whose community depends on the Colorado River, expect of those leading the interstate effort – public honesty about the genuine risks and uncertainties we face.


Click the link to access the article on the Nature Communications website (David Ketchum, Zachary H. Hoylman, Justin Huntington, Douglas Brinkerhoff & Kelsey G. Jencso). Here’s the abstract:
Abstract
Quantifying the interconnected impacts of climate change and irrigation on surface water flows is critical for the proactive management of our water resources and the ecosystem services they provide. Changes in streamflow across the Western U.S. have generally been attributed to an aridifying climate, but in many basins flows can also be highly impacted by irrigation. We developed a 35-year dataset consisting of streamflow, climate, irrigated area, and crop water use to quantify the effects of both climate change and irrigation water use on streamflow across 221 basins in the Colorado, Columbia, and Missouri River systems. We demonstrate that flows have been altered beyond observed climate-related changes and that many of these changes are attributable to irrigation. Further, our results indicate that increases in irrigation water use have occurred over much of the study area, a finding that contradicts government-reported irrigation statistics. Increases in crop consumption have enhanced fall and winter flows in some portions of the Upper Missouri and northern Columbia River basins, and have exacerbated climate change-induced flow declines in parts of the Colorado basin. We classify each basin’s water resources sustainability in terms of flow and irrigation trends and link irrigation-induced flow changes to irrigation infrastructure modernization and differences in basin physiographic setting. These results provide a basis for determining where modern irrigation systems benefit basin water supply, and where less efficient systems contribute to return flows and relieve ecological stress.

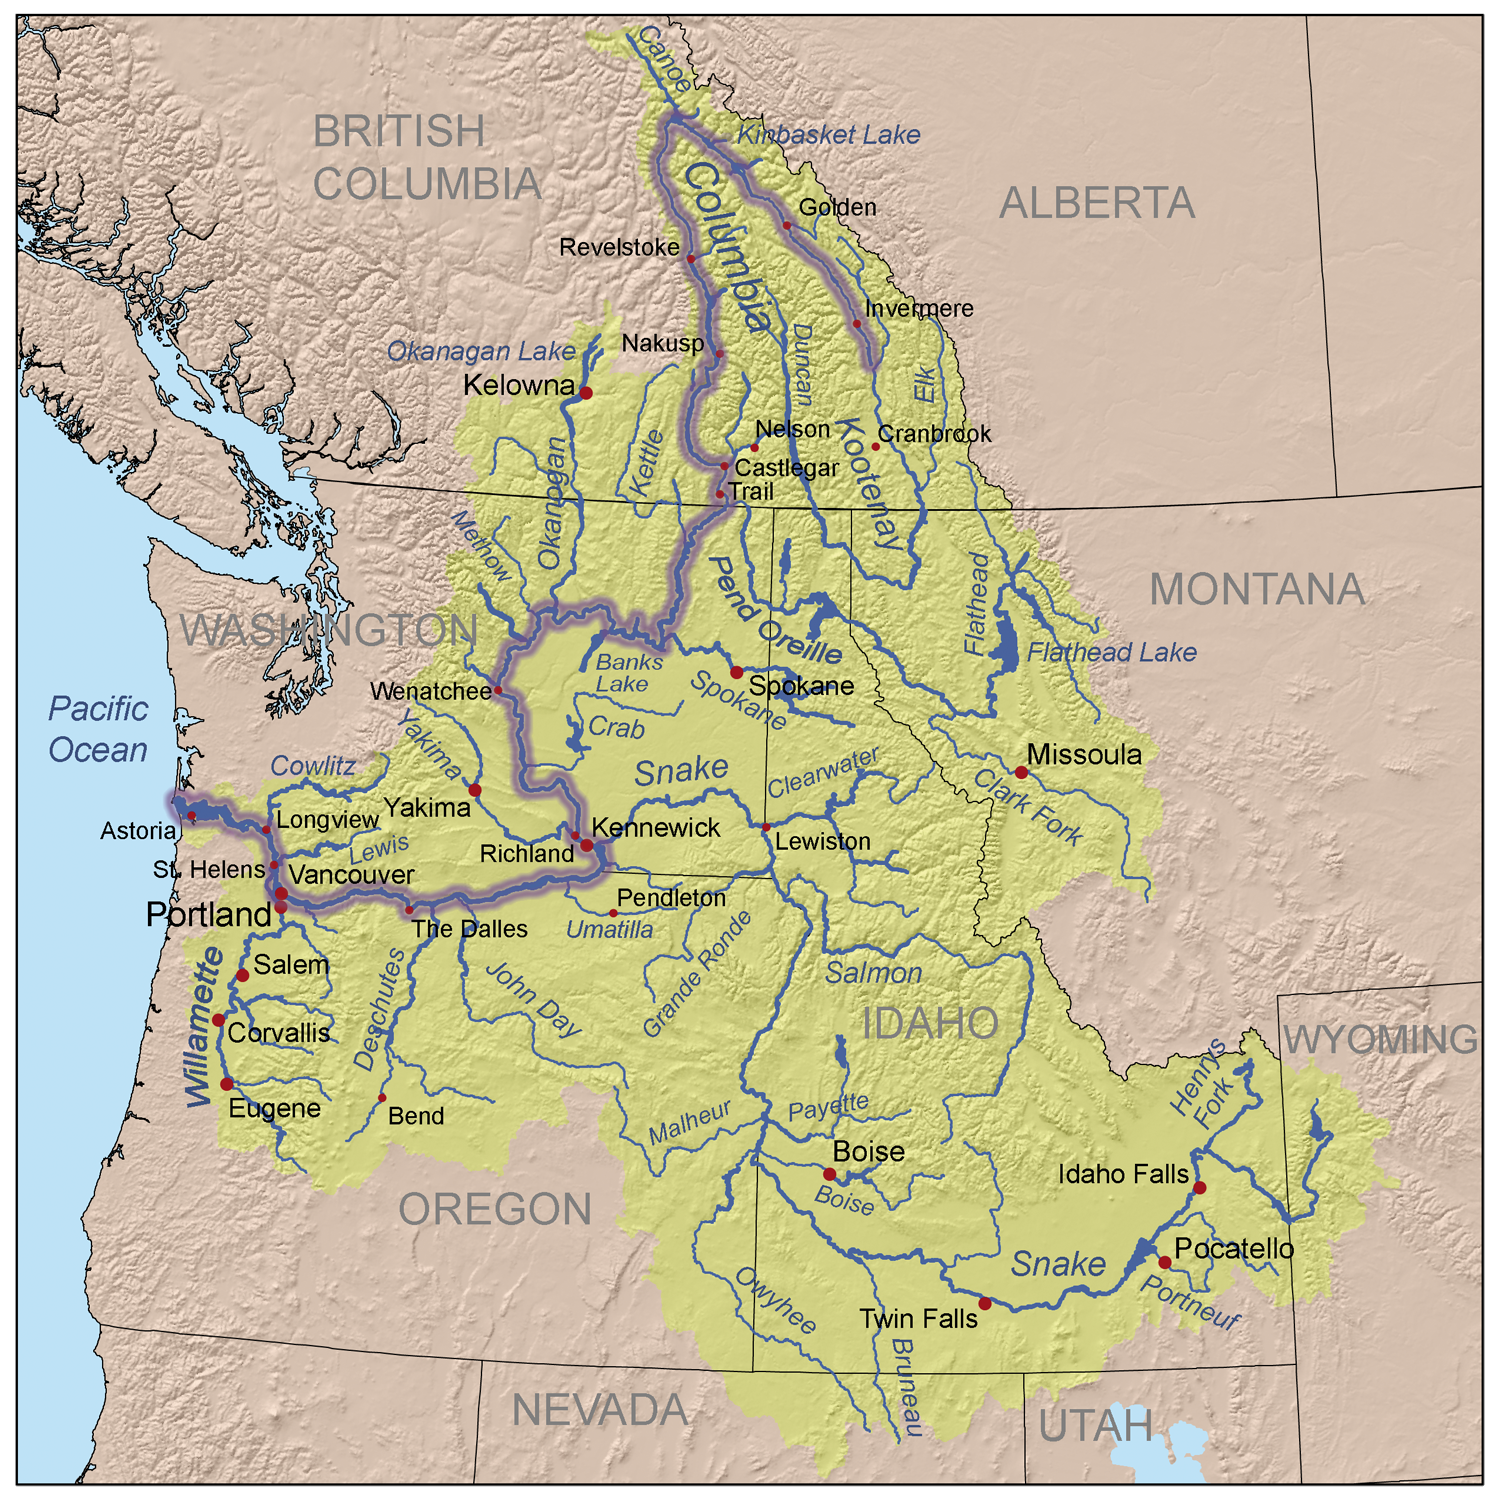


Click the link to read the article on the Water Education Colorado website (Jerd Smith):
February 21, 2024
LONGMONT: It is 10:16 a.m. on Valentine’s Day. More than 100 people are gathered in a sprawling room at the Boulder County Fairgrounds. Pencils, notebooks, calculators, auction catalogs and heart-shaped chocolates lie on tables as buyers begin bidding for some of the most sought-after and pricey water in Colorado.
In less than an hour, they will have spent some $4.7 million to buy shares of water in the Colorado-Big Thompson (C-BT) Project, a federal water system whose construction began after the Dust Bowl, which now serves more than 1 million people on the northern Front Range and which helps irrigate thousands of acres of farmland in the South Platte River Basin. It is operated by Northern Water.
This liquid, in some ways, is the Saks Fifth Avenue of water — high quality, clean, neatly packaged and easily delivered within the boundaries of Northern Water’s eight-county district. Another major attraction is that transactions involving C-BT shares don’t have to be approved by Colorado’s water courts, as most water sales do.
Under the contract between Northern Water and the U.S. Bureau of Reclamation, transfers of C-BT Project shares are instead approved by the Northern Water Board of Directors.
Some 90 shares were for sale on that morning, a tiny fraction of the 310,000 shares that comprise the entire project, according to Jeff Stahla, a spokesman for Northern Water, which operates the system for the U.S. Bureau of Reclamation.
And the sales prices were low, averaging just over $52,000 per share, well below the $70,000-plus the water has fetched in recent years, Stahla said.
Jim Docheff is a retired dairyman from Weld County. He sits in the front row, in a Western red felt jacket and tan cowboy hat, one of his sons by his side.
Ultimately he will buy six shares of the water. “It’s all I could afford,” he said, smiling.
How much water is conveyed in a share of the Colorado-Big Thompson system varies from year to year and is tied to how much water the system gathers from the headwaters of the Colorado River and how much irrigators need, Stahla said. Each spring, Northern’s board decides how much water will be allotted to its shares, which are designed to supplement native supplies in the South Platte River Basin.
Some years, the board sets a quota as high as 100% per share, which is one-acre foot. The lowest it has set is 50%. In a dry year, the board might set the quota higher to help growers, and in a wet year, it may be lower because less water is needed.
An acre-foot of water equals about 326,000 gallons.
This purchase will add water security to Docheff’s dairy operations for years to come, he said, as his sons continue the work the family has been doing for 89 years.
But the deal must be approved by Northern Water, which will certify that the water will stay in its district, that it will be put to beneficial use, and that it will serve as a supplemental rather than a sole source of water, a requirement under its federal operating rules.
Docheff and others were surprised by the numbers. “Honestly, I thought the prices were low,” Docheff said.
In recent years, Colorado-Big Thompson shares have topped $70,000. And in fact, one share did sell for $79,200 on Valentine’s Day, but most sold for less, trading in the $50,000 to $72,600 range, according to Scott Shuman of Hall and Hall Auctions, which ran the morning’s proceedings.
And that was good news for farmers, who dominated the bidding. They were able to afford to buy shares in a system in which fast-growing cities from Broomfield north to the Wyoming state line once dominated the sales, often pricing farmers out.
“I think it actually speaks to the fact that there is a robust market for agriculture and you have producers who are looking to firm up their [water] portfolios,” Stahla said.
The lower prices may also be tied to a softening in the housing market in northern Colorado, Shuman said.
“We had an auction in 2019 and we had tons of cities participating,” Shuman said. But not this time around.
“In 2019 there were new subdivisions being built everywhere and we’re not seeing that kind of building now,” he said.
Throughout the proceedings, Carol Yoakum and her family, the sellers of the C-BT shares, sat at the back of the room, watching bid prices post on a huge screen behind the auctioneer.
“I think it went just fine,” she said, after the bidding closed. “I hope it makes everybody happy.”
More by Jerd SmithJerd Smith is editor of Fresh Water News. She can be reached at 720-398-6474, via email at jerd@wateredco.org or @jerd_smith.

Click the link to read the article on The Los Angeles Times website (Ian James). Here’s an excerpt:
February 22, 2024
Concerns that California might remain in a “snow drought” this winter have eased after a series of storms this month blanketed the Sierra Nevada with a near-average amount of snow for this time of year. The snowpack across the mountain range now measures 86% of normal for the date, according to state data, up from 28% of normal at the start of the year. The latest storms have also brought enough rain to push the state’s total precipitation to slightly above average for this time of year. And California’s major reservoirs, which were filled spectacularly by last year’s historic wet winter, are still at 118% of their average levels…
“We have a fairly good snowpack right now — not great, but it’s not unusually dry,” [Jay] Lund said. “And even if it were to get dry, we’re coming into it with a full set of reservoirs.”
[…]
Shasta Lake, the state’s largest reservoir, is now 87% full, while Lake Oroville stands at 82% of capacity.
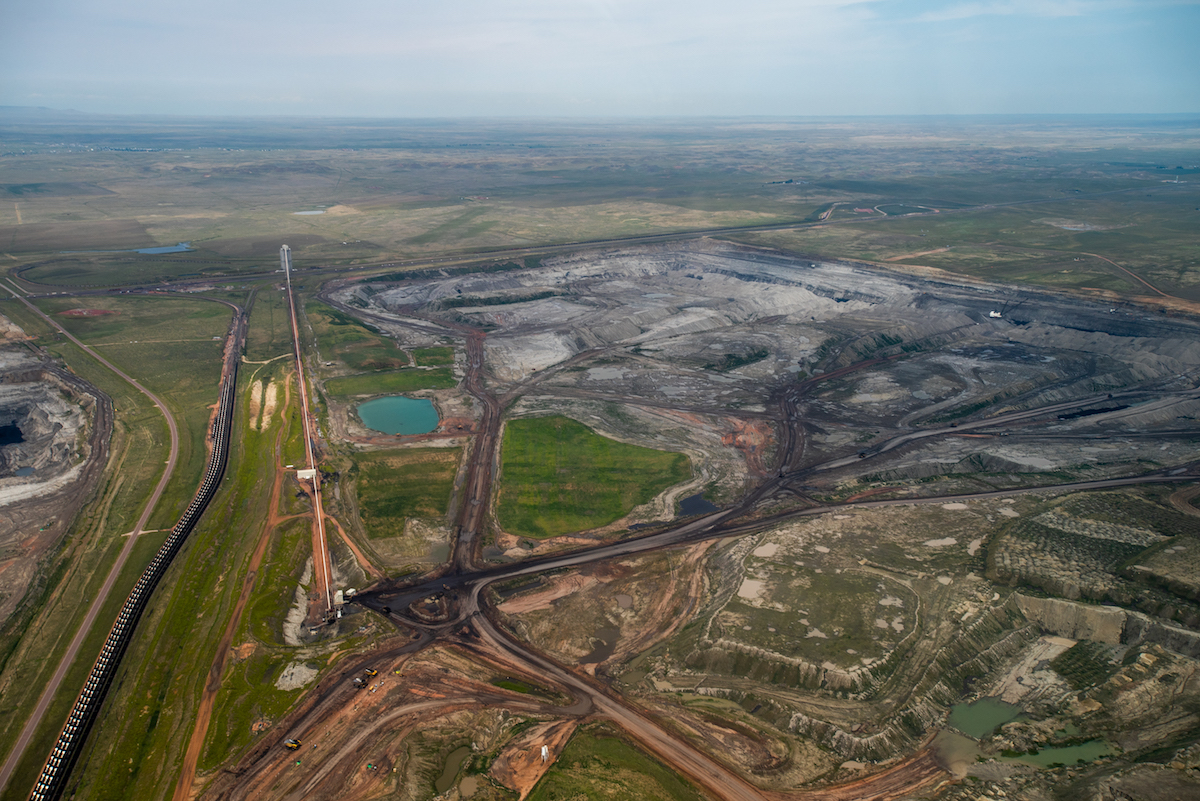
Click the link to read the article on the WyoFile website (Dustin Bleizeffer):
February 22, 2024
A federal appeals court has overturned an Obama-era moratorium for new coal mine leasing on public lands — an “unequivocal win” for Wyoming’s coal industry, according to Gov. Mark Gordon. Yet the decision, which the 9th Circuit Court of Appeals handed down on Wednesday, likely will not result in a rush on new federal coal leases in Wyoming.
The three-judge panel even noted an apparent “de facto moratorium” dictated by markets that has all but erased demand for major new federal coal tracts — a trend that particularly applies to Wyoming coal, which has lost nearly half its market among coal-burning electric power producers in the U.S over the past 15 years.
Nonetheless, the court’s ruling does away with “duplicative” environmental analysis introduced by the Obama moratorium and is a clear charge to the Department of Interior that it must be responsive to federal coal lease requests, according to Gordon.
“The Department of Interior now has one less excuse to thwart its federal coal leasing responsibilities,” he said in a prepared statement Wednesday.
Volley among administrations
In 2016, then-President Barack Obama directed the Interior and Bureau of Land Management to issue a moratorium on federal coal leasing and conduct a review of the program to better account for a fair rate of return to taxpayers, as well as coal’s impact on human health and the environment.
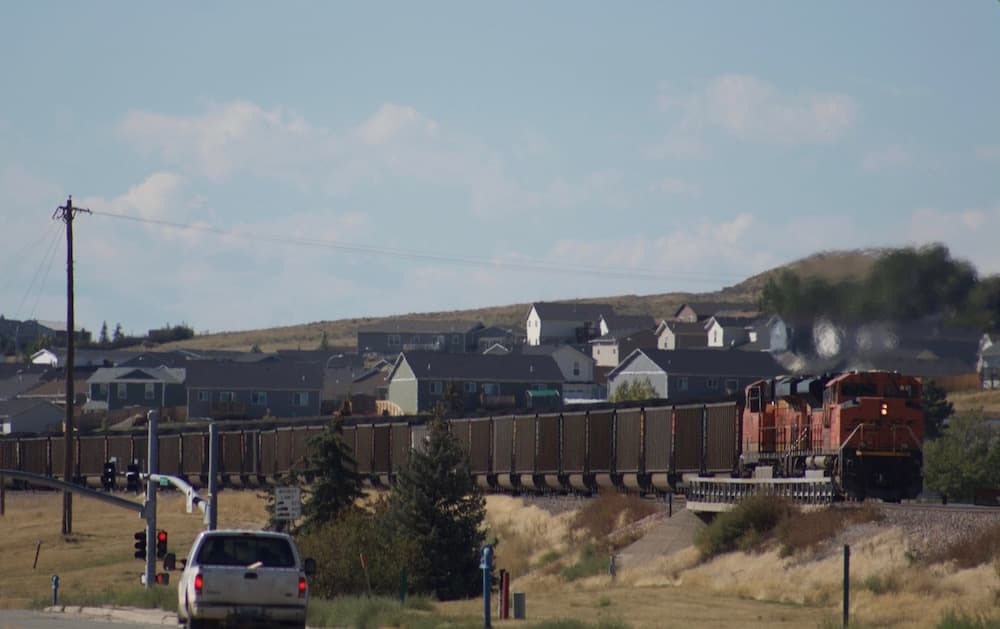
But then the Trump administration rescinded the order before the federal agencies completed the work. The conflicting administrative policies set off a series of legal volleys and prompted Wyoming to join the battle in support of the Trump administration’s actions on the matter.
The appellate court ruling this week nullifies a 2022 federal district court ruling that temporarily reinstated the original moratorium.
“With this ruling, important projects can once again advance and support the production of affordable, reliable power to the grid, while creating jobs and economic development across the country, helping federal, state and localities with necessary funding by contributing hundreds of millions each year in revenues to state and local governments,” National Mining Association President and CEO Rich Nolan said in a prepared statement.
However, the Northern Cheyenne Tribe and several conservation groups that brought the lawsuit say the Biden administration can still take meaningful action regarding federal coal reserves.
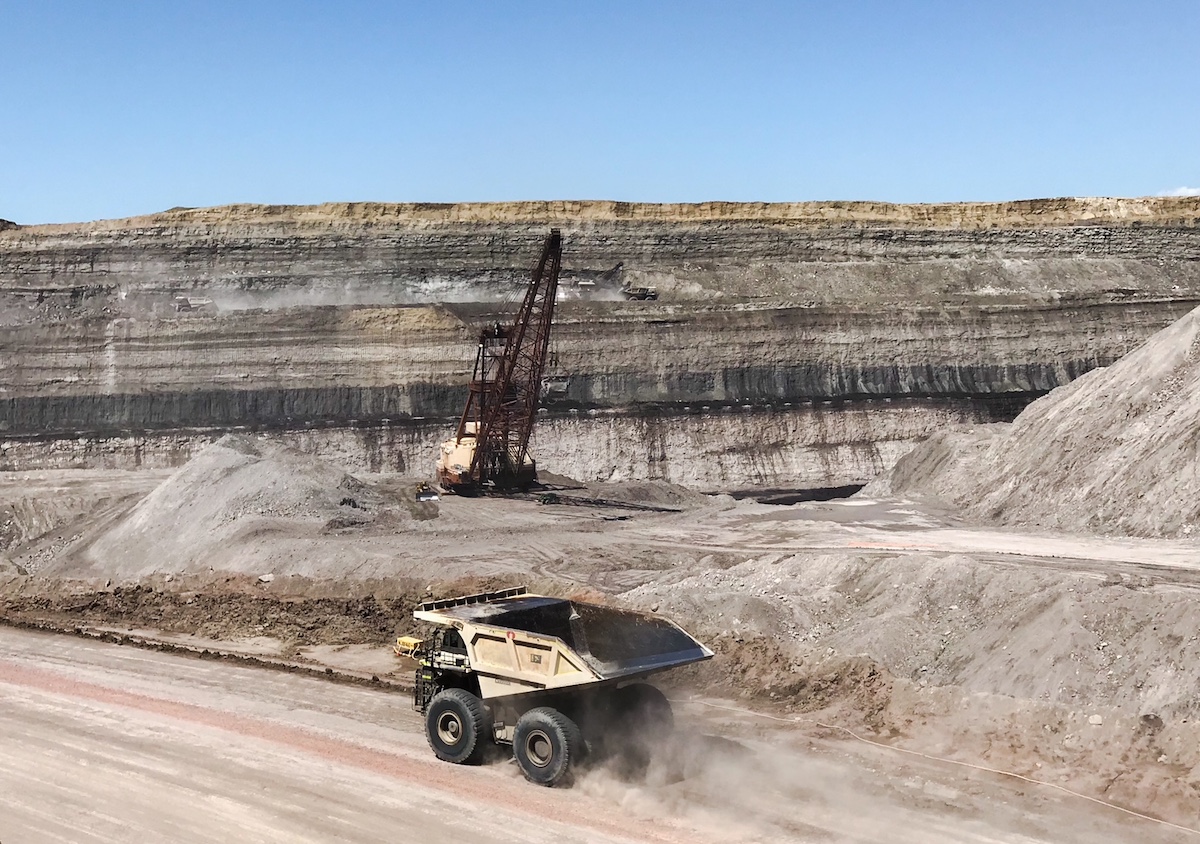
“Almost 10 years ago under President Obama, we were promised there would be an honest conversation with the American people about the real costs of the federal coal program on our public lands and public health. We’re still waiting for that conversation,” Wyoming Sierra Club Acting Director Rob Joyce said. “Now we have less than a decade to make significant cuts to climate pollution to avoid the worst impacts of climate change. Instead of leasing coal to the highest corporate bidder, BLM needs to focus on helping coal communities transition to clean energy jobs and setting a conservation-minded course that preserves public lands for future generations.”
Dwindling demand
Wyoming became the nation’s largest coal producer in the 1980s, and at its peak, in 2008, produced 466 million tons. The annual volume of coal that’s shipped out of state has fallen by nearly half since then.
Powder River Basin mines, which account for the bulk of Wyoming’s coal production, shipped about 230.4 million tons in 2023 — a decline of 7 million tons compared to 2022, according to the Gillette News-Record.
Demand for new federal coal tracts has followed suit.
The most recent large federal coal leases sold in the Powder River Basin went to Peabody Energy and Arch Coal (now Arch Resources) in 2012. Peabody paid $1.24 billion for the rights to mine 1.12 billion tons of coal to extend operations at its North Antelope Rochelle mine, according to the BLM. Arch paid more than $300 million for 222.67 million tons of federal coal for its flagship Black Thunder mine.
All told, some 2.5 billion tons of federal coal reserves were leased in the Powder River Basin during the first seven years of the Obama administration prior to the coal leasing moratorium in 2016.
Since then, coal producers in Wyoming — responding to softening market demand — have pulled back on earlier plans to acquire large tracts of federal coal to last them decades into the future. Aside from leasing small “maintenance” coal tracts at existing mining operations — which was allowed to continue under the Obama moratorium — there are just two pending lease applications for major new federal coal tracts in Wyoming, according to the BLM.
Cloud Peak Energy applied for a 441 million-ton federal coal lease in 2015, but the company filed for bankruptcy in 2019. Its Powder River Basin mines were acquired by Navajo Transitional Energy Company LLC, which still maintains the lease application. NTEC, however, has scaled back production at the mines.
A subsidiary of Arch applied for a 468 million-ton federal coal tract in 2005, a request that was not subject to the moratorium. However, Arch has also scaled back its mining operations in Wyoming and plans to sell or close its mines in the state.
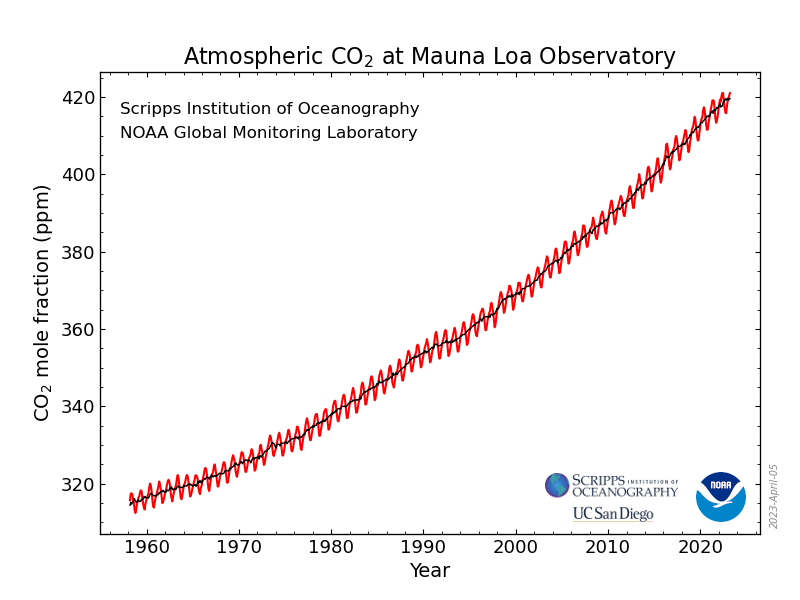
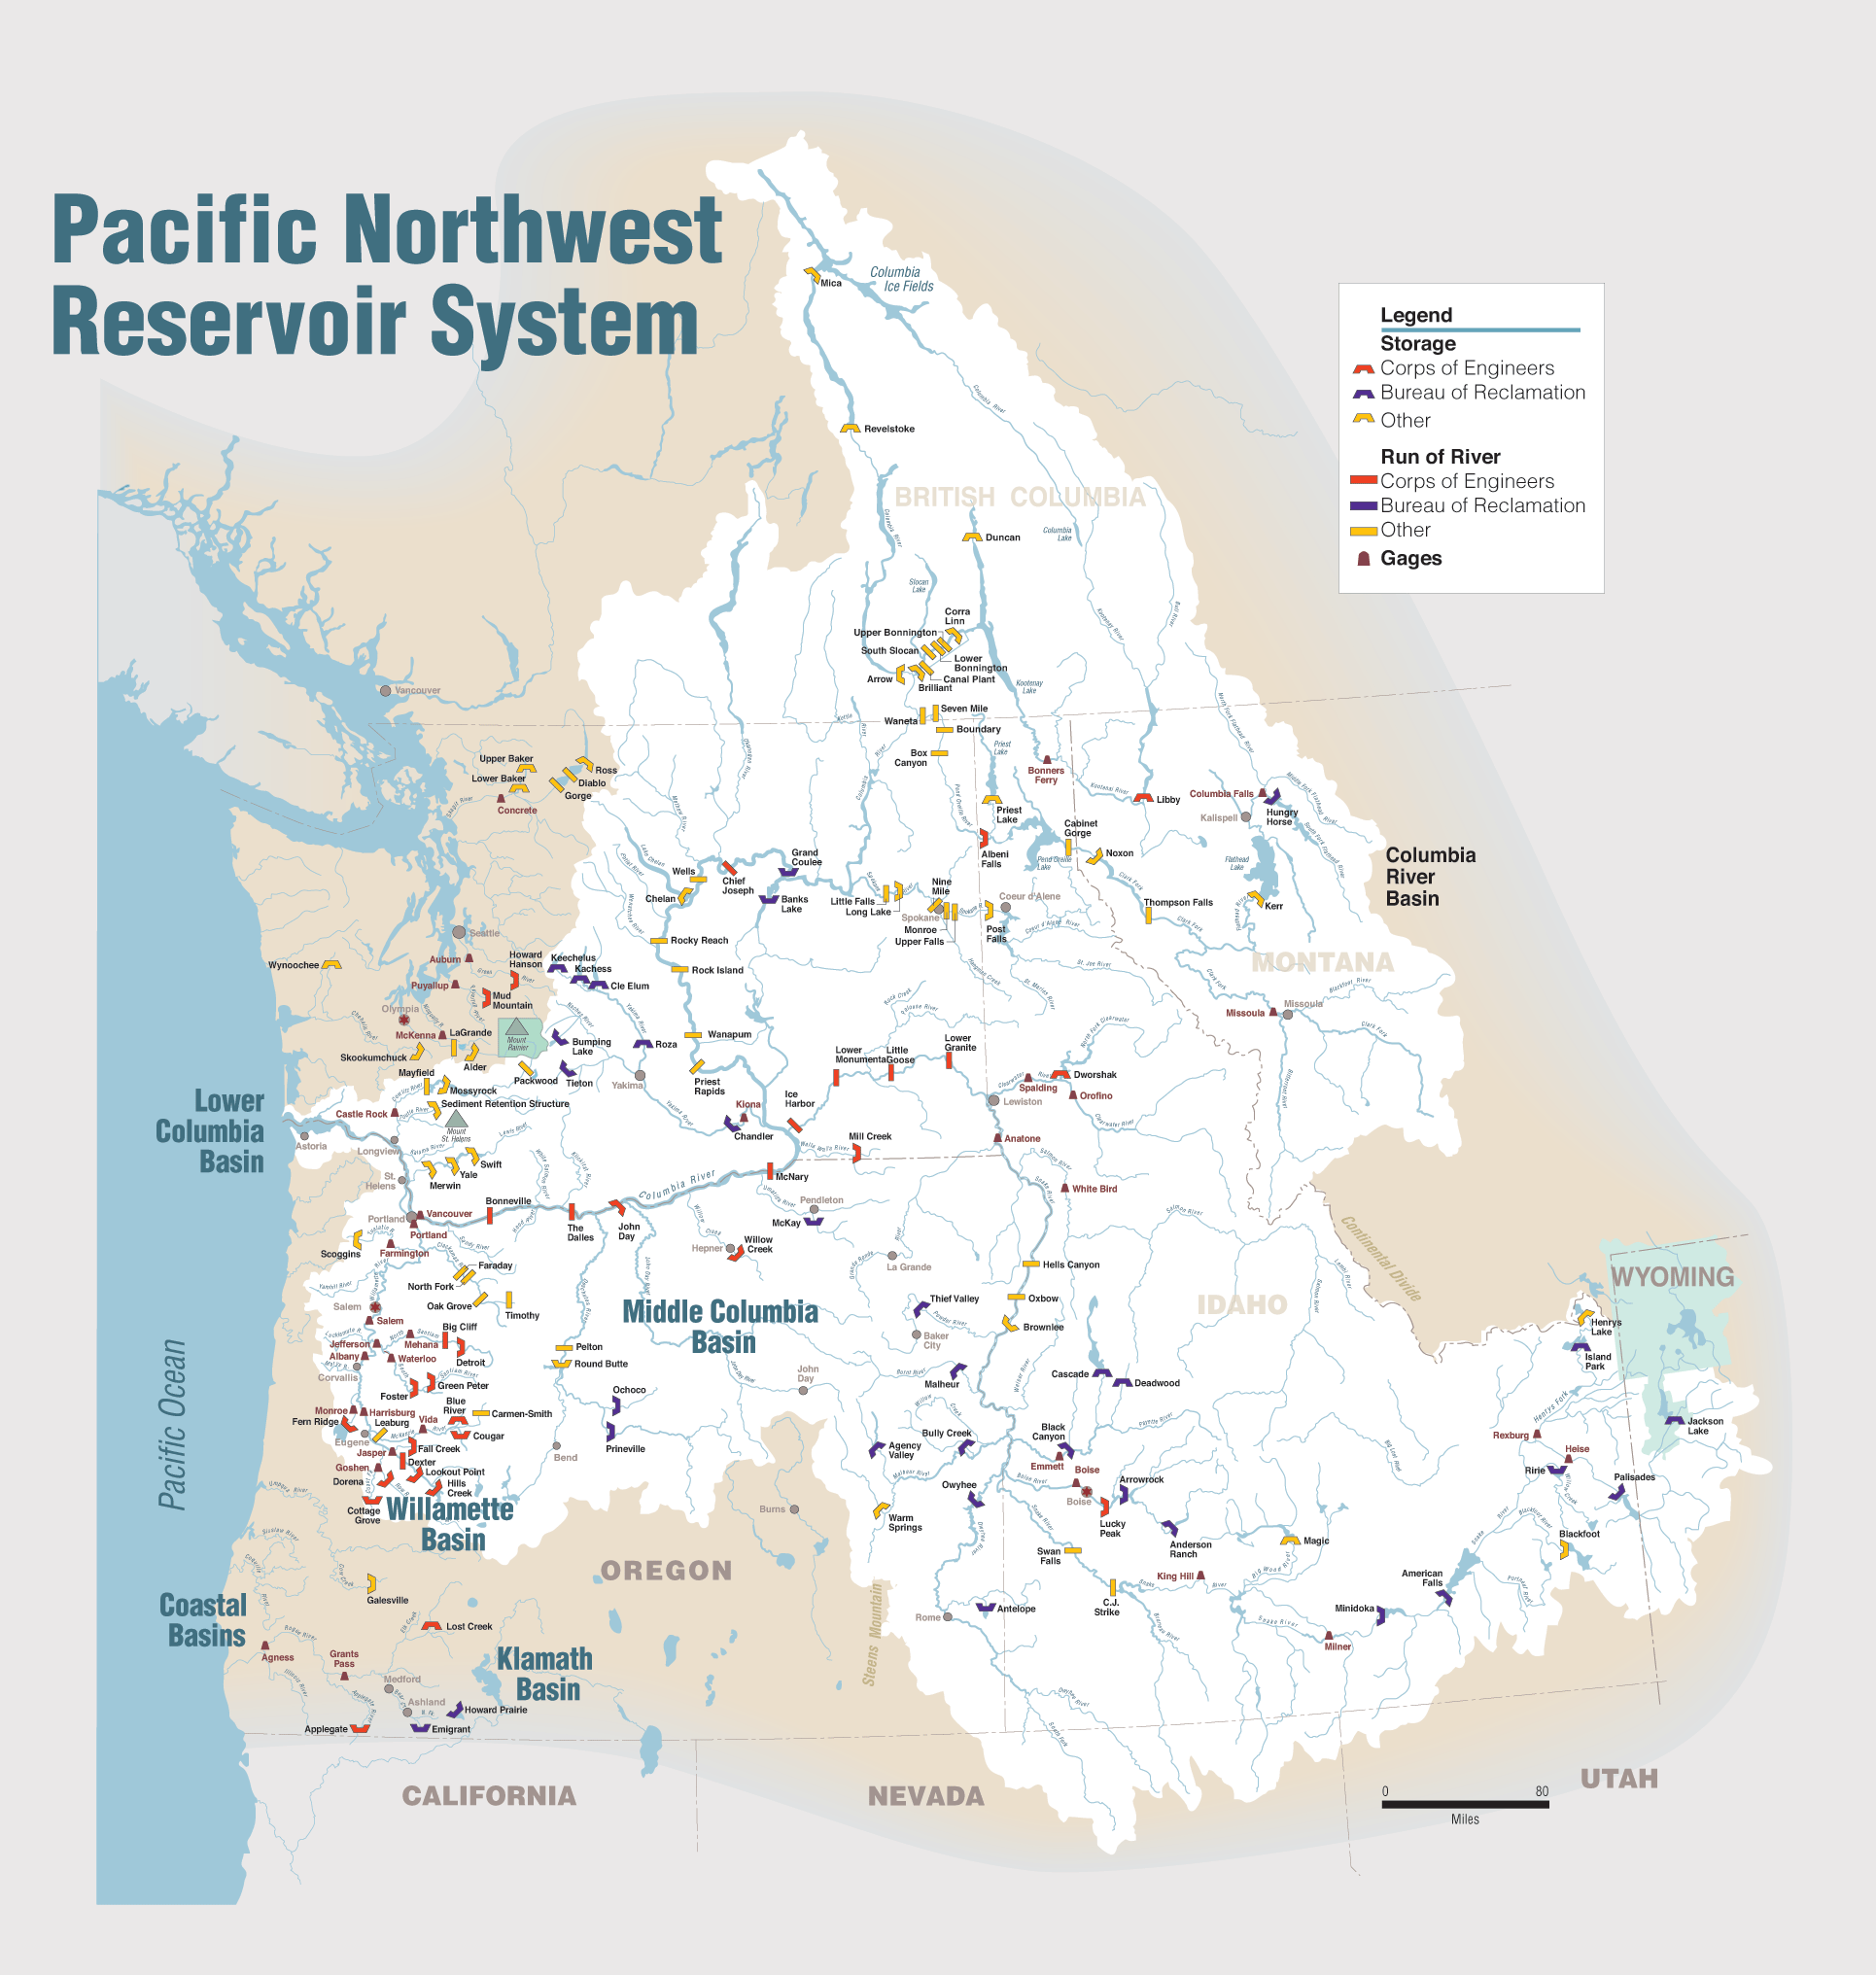
Click the link to read the article on The Seattle Times website
Leaders of four Pacific Northwest tribal nations indigenous to the region on Friday inked a historic agreement with the U.S. that lays out the future of the operations of hydropower dams in the Columbia River Basin, including the dams on the Lower Snake River. At the White House on Friday, the Nez Perce, Umatilla, Warm Springs and Yakama tribes, and the states of Washington and Oregon, signed a memorandum of understanding, outlining a series of commitments from the federal government. It’s not an agreement for dam removal; in fact, removal of the Lower Snake dams, a long-running and controversial goal of tribes and other groups, is put off for years. But it’s the end of an era.
“We need a lot more clean energy, but we need to develop it in a way that’s socially just,” Yakama Nation Chair Gerald Lewis said at the White House. “The last time energy was developed in the Columbia Basin it was done on the backs of tribal communities and tribal resources.”
[…]
Tribal nations helped draw up a road map for the future of the region’s energy and salmon. Under the $1 billion-plus agreement announced in December and approved by a federal judge this month,tribes will help restore wild fish and lead in the construction of at least 1 to 3 gigawatts of clean-energy production. The agreement stems from years of mediated negotiations in a decadeslong court battle over dam operations. A stay of litigation is in place for up to five years and could continue for as long as 10. In a key compromise, the agreement also reduces water spilled over the dams for summer and fall run fish, including fall Chinook, one of the more robust salmon runs on the river, and a mainstay of tribal and sport fisheries. That allows the Bonneville Power Administration to sell more power from the dams into the lucrative California power market. However, spring spill would be boosted, to help spring Chinook by providing something more like a spring freshet for young fish migrating to the sea.
It comes as climate change turns more mountain snow to rain, throwing imperiled salmon and steelhead into hot water, and straining access to a steady stream of hydropower.
Click the link to read the article on the NOAA website:
Highlights
- Temperatures were above average over much of the globe, but the eastern United States, most of Europe and a few other areas were cooler than average.
- There is a 22% chance that 2024 will be the warmest year in NOAA’s 175-year record and a 79% chance that El Niño will transition to neutral conditions by mid-year.
- Northern Hemisphere snow cover was near average, but Antarctic sea ice extent was fifth lowest on record for January.
- Global precipitation was nearly record-high in January, following on the heels of a record-wet December.
Temperature
The January global surface temperature was 2.29°F (1.27°C) above the 20th-century average of 54.0°F (12.2°C), making it the warmest January on record. This was 0.07°F (0.04°C) above the previous record from January 2016. According to NCEI’s Global Annual Temperature Outlook, there is a 22% chance that 2024 will rank as the warmest year on record and a 99% chance that it will rank in the top five.
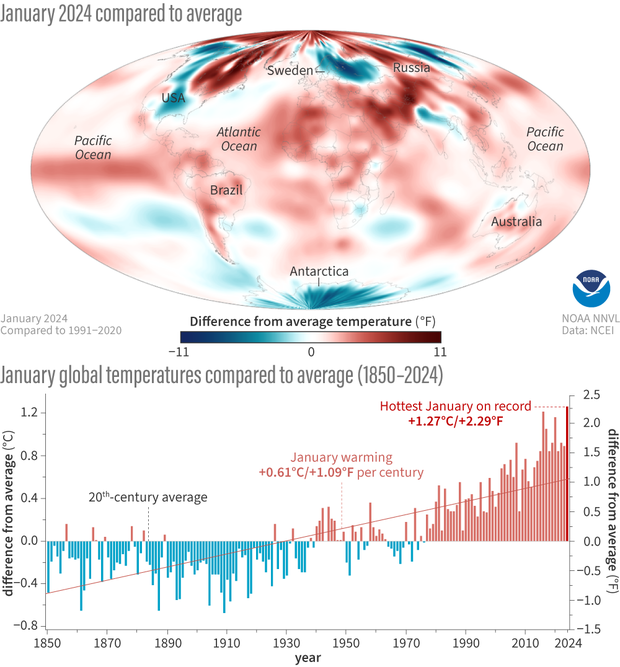
January saw a record-high monthly global ocean surface temperature for the 10th consecutive month. El Niño conditions that emerged in June 2023 continued into January, but according to NOAA’s Climate Prediction Center it is likely that El Niño will transition to ENSO-neutral by April–June 2024 (79% chance), with increasing odds of La Niña developing in June–August 2024 (55% chance).
Temperatures were above average throughout the Arctic, most of northeastern North America, central Russia, southern and western Asia, Africa, South America, eastern and southeastern Asia and Australia. Much of northwestern North America, the central and southern United States, northern and eastern Europe, northeastern Asia and Antarctica experienced near-to- cooler-than-average temperatures during January. Sea surface temperatures were above average across much of the northern, western and equatorial Pacific Ocean, as well as parts of the western Indian Oceans.
Precipitation
- The El Niño rainfall anomaly pattern over the central and western Pacific Ocean and Maritime Continent has weakened.
- Further afield the patterns over the Indian Ocean, Africa and the southern U.S. are more clearly El Niño-like.
- Overall the pattern correlation between this January’s rainfall anomaly pattern and the El Niño composite plummeted from a high of +0.59 last month to only +0.19.
- Global total precipitation for this January is nearly a record high following December’s record high for that month of the year.
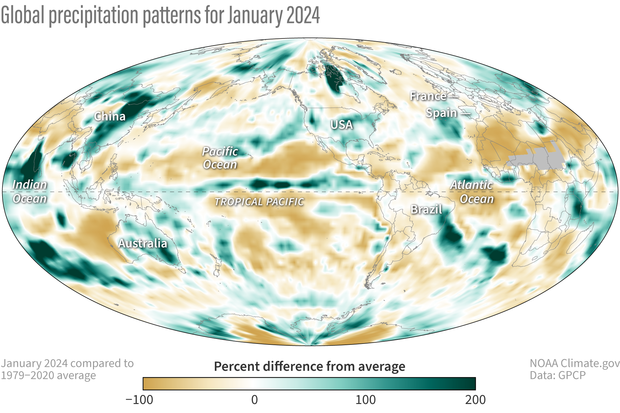
The current El Niño continues through January, but the departures from average on the global map show a mixed pattern, with some rainfall excess/deficit features typical of El Niño situations and others differing from the expected pattern. In the central and eastern Pacific along the Intertropical Convergence Zone, there is still a narrow, strong positive anomaly as typical of El Niño, with a rainfall deficit just to the north and south. But just to the west the wide positive feature expected at ~180° longitude at the Equator is weak this month, despite the Niño 3.4 Index being +1.9, easily within strong El Niño range. [The “Niño 3.4 Index” tracks sea surface temperatures in the central-eastern tropical Pacific Ocean: the key ENSO monitoring region].
The match between this January and the El Niño composite becomes even more fraught over the Maritime Continent to the west where generally very dry conditions are typical of El Niño, but rainfall is in excess over Borneo and Malaysia, although deficit features exist over some surrounding areas, especially between Sumatra and Australia. Australia itself is typically very dry during El Niños, but for this January it is mostly wetter than normal across the continent, and there was even flooding first in Victoria and then heavy rains in northern and northeastern parts of the country later in the month.
Northern South America is mostly dry, as is typical of El Niño, but the rest of the pattern does not match well. The spatial correlation of January’s anomaly pattern with the El Niño composite has plummeted to +0.19 from a high of +0.59 in December, seemingly indicating a weakening of El Niño at core tropical locations. It will be interesting to see if that type of change continues next month, or if this is a temporary change. Models are predicting an end to the El Niño over the next few months. [Read more about what we can expect from the El Niño-Southern Oscillation this spring in Climate.gov’s latest ENSO Blog post.]
For a deeper dive on January 2024 climate, including circulation patterns, major events, and separate statistics and rankings for Earth’s land and ocean areas, see the full January 2024 monthly report from NOAA NCEI.
Click the link to read the article on the InkStain website (Eric Kuhn):
February 22, 2024
One of the commentors to our January 19th, 2024, blog post titled “Are We headed for the First Colorado River Compact Tripwire?” – John C. (who, by-the-way runs a very talented water resources engineering firm) raised several finer points to explore further:
The first point deals with obligations of each Basin to contribute water needed to meet U.S. obligations to Mexico under the 1944 Treaty. The second deals with the question of how to measure, and therefore manage, in the context of overall Colorado River Basin management, the use of tributary water in the Lower Basin. Both represent unresolved legal questions with enormous potential impacts on the allocation and distribution of the shrinking Colorado River – questions we have avoided dealing with by draining the Basin’s reservoirs. We no longer have that option.
The two issues have been disputed for decades. They are, of course, totally inter-related, and when one peels back the layers of each, the problems get so complicated that the only real solution may be for the Basin’s states and other stakeholders to ignore their past positions and grievances and negotiate a river management approach that works on the river we have today, even if that means changes to the foundation of the Law of the River, the 1922 Compact.
MEXICO OBLIGATION
The different interpretations of the Upper Basin’s delivery obligations to Mexico under Article III(c) are well understood throughout the Basin. III(c) says that water for Mexico should be provided from “surplus”. If there is no surplus, the Upper and Lower Basins much each provide half the necessary water. But there has never been agreement on what that language means in practice. This unresolved uncertainty has enormous implications for how much water is available to each basin in the future.
The Lower Division States take the position that there’s no current “surplus,” as defined by Article III (c), thus the Upper Division States must deliver at Lee Ferry 50% of however much water is required to be delivered under the Treaty. The annual delivery is normally 1.5 maf/year, but under either the “extraordinary drought” provision of the Treaty, or Minutes, it could be less. In 2023, it was 1.4 maf.
The Lower Division States’ position would dictate an average annual delivery of 8.25 maf/year at Lee Ferry, 7.5 maf under Article III(d) + 750,000 af under Article III(c). The 8.25 maf includes an average contribution of 20,000 af/year from the Paria River and would be adjusted for the occasional annual delivery of less than 1.5 maf. Veterans of the negotiations that led to the 2007 Interim Guidelines will recall that Arizona’s Herb Guenther always brought with him to the meetings a posterboard sign with “8.25” written on it.
Going back to the 1970 decision by the Secretary of the Interior to set the “minimum objective release” from Glen Canyon Dam at 8.23 maf/year, the Upper Division States have consistently taken the position that their annual obligation Mexico has never been formally defined and, whatever it is, it is not 750,000 af/year, every year. While they vigorously complained, they never chose to formally challenge the issue in court or in Congress, perhaps because they concluded that they couldn’t show that any of their interests were injured. Today, based on post-2000 hydrology, that dynamic may have fundamentally changed.
The basic position of each basin has not changed. If anything, because the stakes are much higher, the positions have hardened. In a December 20, 2022, scoping letter to Reclamation, Arizona’s Tom Buschatzke, and Ted Cooke, wrote: “Article III(d) and (c) prohibits the Upper Division States from depleting the flow of the river at Lee Ferry below a rolling 10-year aggregate of 75 maf plus one-half of the Mexico delivery obligation. With reduced releases from Glen Canyon Dam potentially analyzed under the SEIS, if the 10-year rolling aggregate falls below the required aggregate volume, the Upper Division States could be subject to a “Compact call” that would require a reduction in consumptive use in the Upper Basin. In footnote 1, they add “A “surplus” currently does not exist because natural flows in the Colorado River have not exceeded 16 maf in the past 10 years.” In their August 15, 2023, scoping letter, the three Lower Division States write: “The Post-2026 EIS must analyze whether alternatives are consistent with the 1922 Colorado River Compact non-depletion obligations and delivery obligations to Mexico. Alternatives should include actions necessary to ensure compliance with such obligations.”
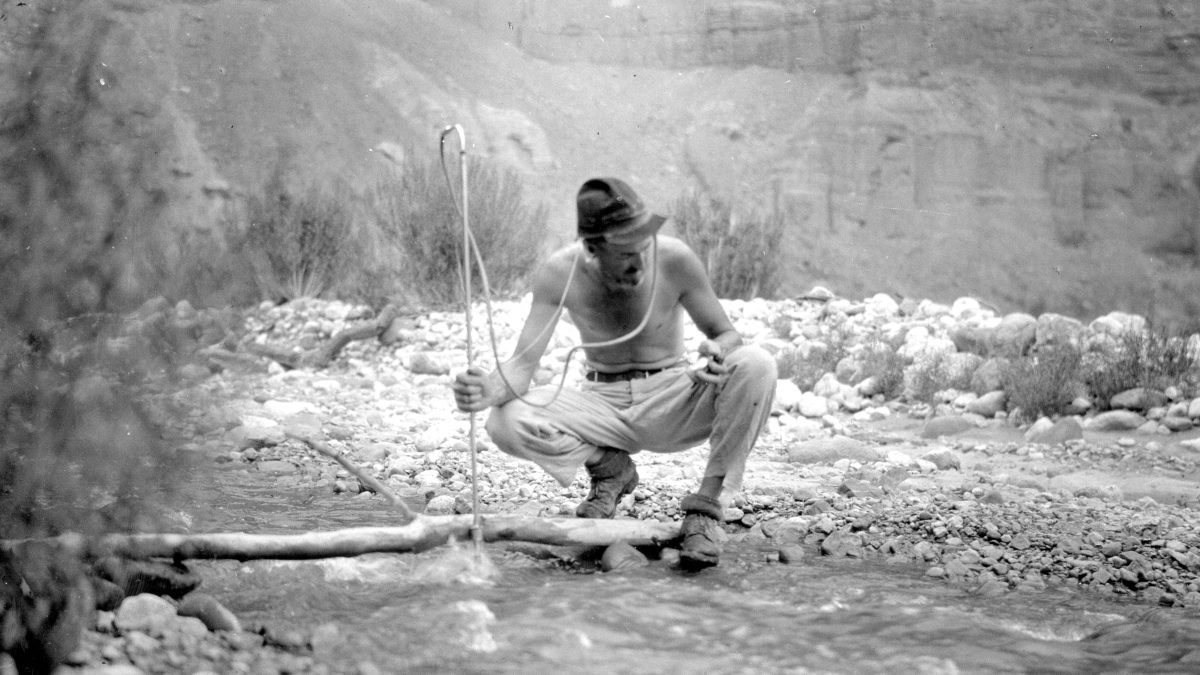
The Upper Division States are equally adamant that because of overuse in the Lower Basin, they currently have no annual obligation to Mexico under Article III(c). Note that I used the term “Lower Basin” because under the 1922 Compact, the Lower Basin includes the upper Gila River in New Mexico, where uses are small, Kanab Creek in Utah and Arizona, again uses are small, and the Virgin River, shared by Nevada, Arizona, and Utah, where uses are not small. The Virgin River is the water supply for the rapidly growing St. George area. As a state, Utah consumes the second largest amount of Lower Basin tributary water, about 150,000 af/year, albeit much less than Arizona.
In recent public presentations, Colorado Commissioner Becky Mitchell has stated that the Lower Basin’s total annual use, including tributaries and reservoir evaporation, were 10.5 maf in 2020, 10.8 maf in 2021, and 10.4 maf in 2022, far more than the Lower Basin’s compact apportionment (7.5 maf under Article III(a) plus 1.0 maf under Article III(b)). Their position is that the Lower Basin’s overuse is “surplus” water that must first be used to meet the 1944 Treaty obligations to Mexico before the Upper Division States have any obligation to Mexico, a position the Lower Division States do not agree with.
The situation is messy. As I explain below, Mitchell’s 10-plus million acre foot calculation is based on analysis that contains a hidden assumption about the correct way to measure water use, an assumption at odds with the method the Upper Basin has traditionally used to measure its own water use. But when one peels back the layers, it’s even messier. First, there is no agreement on whether the obligation of the Upper Division States to Mexico is calculated on an annual basis, a ten-year rolling aggregate basis, or something else (I’m in the something else camp). The predominant position the Upper Division States is, as mentioned in John’s comments, that the since the 1944 treaty provides for an annual delivery to Mexico (which can change), therefore, the obligation of the Upper Division States is determined annually. As can be seen by the language in the Arizona and Lower Division States letter, the Lower Basin states’ position is based on a ten-year rolling aggregate. The logic of this position is that the last sentence of Article III(c) states: “whenever necessary the States of the Upper Division shall deliver at Lee Ferry water to supply one-half of the deficiency so recognized in addition to that provided in paragraph (d).” Paragraph (d) is a ten-year requirement; does it make sense to add an annual requirement to a ten-year requirement? Further, the data necessary to determine whether a deficiency exists (and thus the obligation of each basin) would not be available until well after the water year is over.
My reading of the reports of the compact commissioners, their Congressional testimony, and the minutes of both the 1922 and 1948 suggests a third possible alternative. The negotiators of the 1922 Compact, the 1944 Treaty, and the 1948 Compact considered the surplus to be the difference between the average long-term natural flow of the river at the international boundary and 16 million acre-feet, the aggregate of the apportionments made by Articles III(a) and III(b). During the negotiations of the 1948 Compact, Colorado’s Royce Tipton and Arizona’s Charles Carson laid out the logic. Based on the comprehensive hydrologic analysis conducted by Reclamation (Appendix I of the 1947 Comprehensive Report), the estimated long-term natural flow below the confluence of the Colorado and Gila Rivers was 17.7 maf/year. Subtracting 16 maf left an average surplus of 1.7 maf, 1.5 maf for Mexico and about 200 kaf for surplus uses within the United States. Upper Division State officials argued that with this hydrology there was no deficiency. Colorado’s Tipton and Clifford Stone (its 1948 Compact Commissioner), however, did acknowledge that the location of the surplus was an important factor.
With their 1940s understanding of the river hydrology, the Upper Division States did not want the deficiency calculated either on an annual basis or a ten-year running average. They understood that in both cases, they would be required to deliver more water to Mexico than using the long-term average. Under an annual determination, there would be many years (~50%) when there was a deficiency. Under the ten-year rolling average, there would be long periods when it would be below 16 maf/year and there would be a deficiency (the 1930s drought period for example) but provided the long-term average was more than 17.5 maf/year, there would be no deficiency. Tipton also made the point that in the future, the construction of additional storage reservoirs (like Lake Powell) would effectively “equate” the river. Today’s problem with this approach is that in the 1940s, the basin’s water managers assumed a level of “stationarity” (future river flows can be predicted by what happened in the past) that because of climate change does not exist today.
Resource: Stationarity is dead: Whither water management?
An additional problem we have today is the calculation of the deficiency is based on the natural flow at the international border with Mexico, not Lee Ferry. Note that the Arizona letter states, “natural flows in the Colorado River have not exceeded 16 maf/year.” That statement is very likely true, but there are no data to back it up. Unlike Lee Ferry, there are no recent calculations of annual natural flows at the international border. There is no Colorado River system natural flow database. The existing database includes natural flows to Lee’s Ferry, but downstream to the Imperial Diversion Dam, Reclamation acknowledges that they have little confidence in these data and much of it is not based on reconstructed natural flows. Importantly, the existing natural flow database does not include the Gila River system.
The last widely published estimate of natural flows at the international border was completed by the Bureau of Reclamation nearly eighty years ago (Appendix I). These data were used during the 1944 Treaty ratification hearings and, to a lesser extent, by the 1948 Compact negotiators. Appendix I shows an average natural flow at the border of 17.72 maf/year. At Lee Ferry, it was 16.41 maf/year (based on1898-1943). Assuming a similar relationship between the flows today, from 2000-2023 the estimated natural flow at the border, including the Gila, would be approximately 13.5 maf/year (12.44/16.41 x 17.72). Note, because of climate change, which appears to have a greater impact on the southern tributaries of the Colorado River system, the relationship may no longer be reasonable.

Updating the natural flow database to include the Gila River has been suggested by Upper Division State officials, but Arizona has historically objected. Clearly this would not be an easy task and there would be large uncertainties, especially estimating with any certainty natural losses on the Colorado River below Hoover Dam and on the Gila River from the Phoenix area to Yuma under today’s climatic conditions.
LOWER BASIN TRIBUTARY USE
The Gila River is also the central subject of John C.’s second comment that Arizona, California, and Nevada should be concerned that including mainstem consumptive uses, tributary consumptive uses (including those in Utah and New Mexico), reservoir evaporation, and maybe system losses, the Lower Basin total consumptive uses exceed its compact apportionment of 8.5 maf/year. Alternatively, Lower Basin tributary consumptive uses far exceed 1.0 million acre-feet – if one believes Article III(b) was intended to only cover Lower Basin tributaries. The problem with this argument is that there is no 1922 Compact definition of “beneficial consumptive use” (the “commodity” the Compact apportions). This is especially important for the Lower Basin tributaries.
There are different interpretations among the states and between the basins of how “beneficial consumptive use” should be defined and therefore measured. Each has a strong legal argument in its favor. But their approaches result in vastly different numbers, and as my co-author John Fleck has written, “There’s not enough water for all the lawyers to be right.”
Article VI of 1948 Compact defines and provides a method measuring compact apportionments for the Upper Basin. The 1964 decree in Arizona v. California defines how to measure the mainstem apportionments made to the Lower Division States under the 1928 Boulder Canyon Project Act. Since the 1963 decision did not interpret the 1922 Compact and there is no Lower Basin Sub-Compact, there is no accepted or defined method for measuring 1922 Compact apportionments on the Lower Basin tributaries (and arguably the entire Lower Basin). The methods used by the 1948 Compact and the 1964 Decree are very different. The 1964 Decree uses the concept of “diversions minus return flows.” It comes from the language of the Boulder Canyon Project Act. Stream losses and reservoir evaporation from Hoover Dam to the points of diversion are not considered a use, but rather a limitation on the available supply.

The 1948 Compact approach for defining and measuring consumptive use under Article VI is based on what was referred to as the “stream depletion” theory. Consumptive uses for the Upper Basin and for the individual states are measured as the net impact of man-made depletions on the natural (AKA virgin) flow of the Colorado River at Lee Ferry using the “input-output” method. The 1948 Compact gives the UCRC the authority to change the method by unanimous approval. The UCRC has instructed its staff to identify an alternative to the input-output method, so this may happen soon. Article VI was one of the most debated and carefully written articles in the 1948 Compact. The negotiators had a clear objective in mind. They wanted to carefully define how to measure compact apportionments so that water made available for consumption through “salvage by use” would not count as compact apportioned use.
The issue of salvaged water was a major dispute among the basin states in the 1940s and 1950s. Simply put, salvaged water is water made available for use by the reduction of natural losses caused by the development of the river. The best example of salvage by use is Arizona’s Gila River. As the Gila River and its two major tributaries, the Salt and Verde Rivers, leave the rim country upstream of Phoenix, they have a combined average natural flow of over 2.0 maf/year (2.3 according to the 1947 report). As the river flows to its confluence at Yuma, in its natural state it loses about 1.0 maf/per year. By diverting and using the entirety of Gila River’s waters upstream, these losses are eliminated. Thus, Arizona can consume a million af/year more water than what the Gila River contributes to the natural flow of the Colorado River system. Under the “stream depletion” theory, which was favored by Arizona and the Upper Division States, Arizona is only charged for a million acre-feet of 1922 Compact apportionment. Under California’s “diversions minus return flows” theory, also favored by Nevada, all 2+ maf/year of Arizona’s Gila River consumptive use would be charged as 1922 Compact apportionment.
The Upper Basin adopted the stream depletion theory during an era when the states were competing for every acre-foot possible. They thought could benefit by 400,000 -600,000 af per year. Simply put, in years when the water was physically available, the Upper Basin could consume 7.9 – 8.1 maf/year while only depleting the natural flow of the river at Lee Ferry by 7.5 maf/year (their compact apportionment). The negotiators never contemplated that 75 years later, the water available to the Upper Basin would be far less than 7.5 maf.
During the negotiations of the 1948 Upper Basin Compact, the decision to use the stream depletion theory was thoroughly debated. Wyoming’s legal advisor, W. J. Wehrli, warned the other states that using this definition would benefit the Lower Basin far more than the Upper Basin. Additionally, he noted that it could reduce the amount of surplus water under Article III(c), potentially increasing the obligation of the Upper Division States to Mexico. Wyoming ultimately fell in line and agreed to the Article VI definition. During the Congressional debate over the authorization of the Central Arizona Project, Upper Division State officials (primarily Tipton and Stone) testified in favor of the stream depletion theory, arguing that the negotiators of the 1922 Compact intended this method to measure apportionments. Note, the compact does not include a definition of “beneficial consumptive use,” they made their case based on an analysis of the minutes and the use of the term “depleted” in Article III(d).

The Upper Division States make a rhetorically powerful public argument that in the face of climate change, overuse in the Lower Basin is the central problem in the Colorado River Basin that must be solved to reach a sustainable future where water use, and the available supply are in balance. The argument is that when mainstem uses, reservoir evaporation, system conveyance losses, and tributary consumptive uses (in Arizona, Nevada, New Mexico, and Utah) are added together, the Lower Basin’s total use exceeds ten maf/year, perhaps as high as eleven maf/year. The Lower Basin’s compact apportionment, however, is only 8.5 maf/year (perhaps 7.5 maf/year depending on how Article III(b) is interpreted), resulting in an overuse of at least 1.5 maf/year. Such an overuse has major policy implications:
- If the Lower Basin is overusing its compact entitlement, why should the Upper Basin, which is using far less than its apportionment, reduce its uses to help bring the system into balance?
- Should the Lower Basin’s overuse be considered “surplus” water under Article III(c)? If so, should this surplus water be delivered to Mexico before the Upper Division States have any obligation to deliver half of the deficiency to Mexico?
- These two questions have implications for Mexico, if the Lower Basin is overusing its compact apportionment, why should Mexico reduce its annual use?
The problem with the Upper Basin’s argument is that it’s based on the diversions less return flow theory. If the Lower Basin’s uses are calculated based on the stream depletion theory – the methodology the Upper Basin adopted in its own 1948 Upper Basin Compact, uses may not be greater than 8.5 maf/year.
Stream Depletion Diversions less Return Flows Mainstem uses (a) 6.6 maf/year 6.6 maf/year Reservoir Evaporation (b) 0.5 maf/year 0.86 maf/year System Losses (c) 0 0.45 maf/year Tributary Uses (d) 1.2 maf/year 2.2 maf/year Total 8.3 maf/year 10.1 maf/year
Explanation:
a) Mainstem uses (deliveries from Hoover Dam) are very similar under both theories. Almost all mainstem uses are either fully consumptive or located low in the system. The average mainstem use by the Lower Division States over the last five years (2019-2023) is approximately 6.6 maf/year.
b) Under diversions less return flows the 0.86 maf/year is the average evaporation (2017-2021) from the December 2023 Reclamation study. Under the stream depletion theory, reservoir evaporation is calculated as surface evaporation less the natural losses in the inundation area that would have occurred had the reservoir not been built. This is how evaporation on Lake Powell is calculated. I estimated natural losses as .36 maf/year.
c) The 0.45 maf/year is from the December 2023 Reclamation study. Under the stream depletion theory, system losses are offset by salvaged water. As a practical matter, we have no idea how much salvaged water is currently generated on the mainstem below Hoover Dam, but we do know that the channel is much smaller today than it was before development. In 1945 during the Mexican Treaty ratification hearings, Colorado’s Royce Tipton estimated the number to be 400,000 af/year. I’ll assume they offset.
d)Under diversion less return flows, tributary uses are 2.2 maf/year, the latest data from the 2001-2005 Consumptive Uses and Losses and Report. Under the stream depletion theory, it’s reduced by 1.0 maf/year, the estimated salvage on the Gila River from the 1947 study. Because of climate change, losses today may be greater, but no data are available.
Thus, using the diversions less return flows theory, the Lower Basin is clearly using more than 8.5 maf/year, but under Upper Basin’s own stream depletion theory, it is not. Since the 1922 Compact neither defines nor prescribes a way to measure “beneficial consumptive use,” the basic question – “is the Lower Basin overusing its compact apportionment?” simply cannot be answered. [ed. emphasis mine]
These disputes also point to the fundamental flaw with the states’ talking point that the 1922 Compact, the 1948 Upper Basin Compact, and the Mexican Treaty will serve as the foundation of the post-2026 operating rules. There is no agreement on what they say or mean. As the states continue their discussions with the goal of agreeing on a state proposal, they need to consider addressing the disputed compact issues in a straight-forward manner. Leaving these critical uncertainties for future generations to handle (like we have in the past) is no longer possible and asking the Supreme Court for a resolution will likely make matters worse, not better.

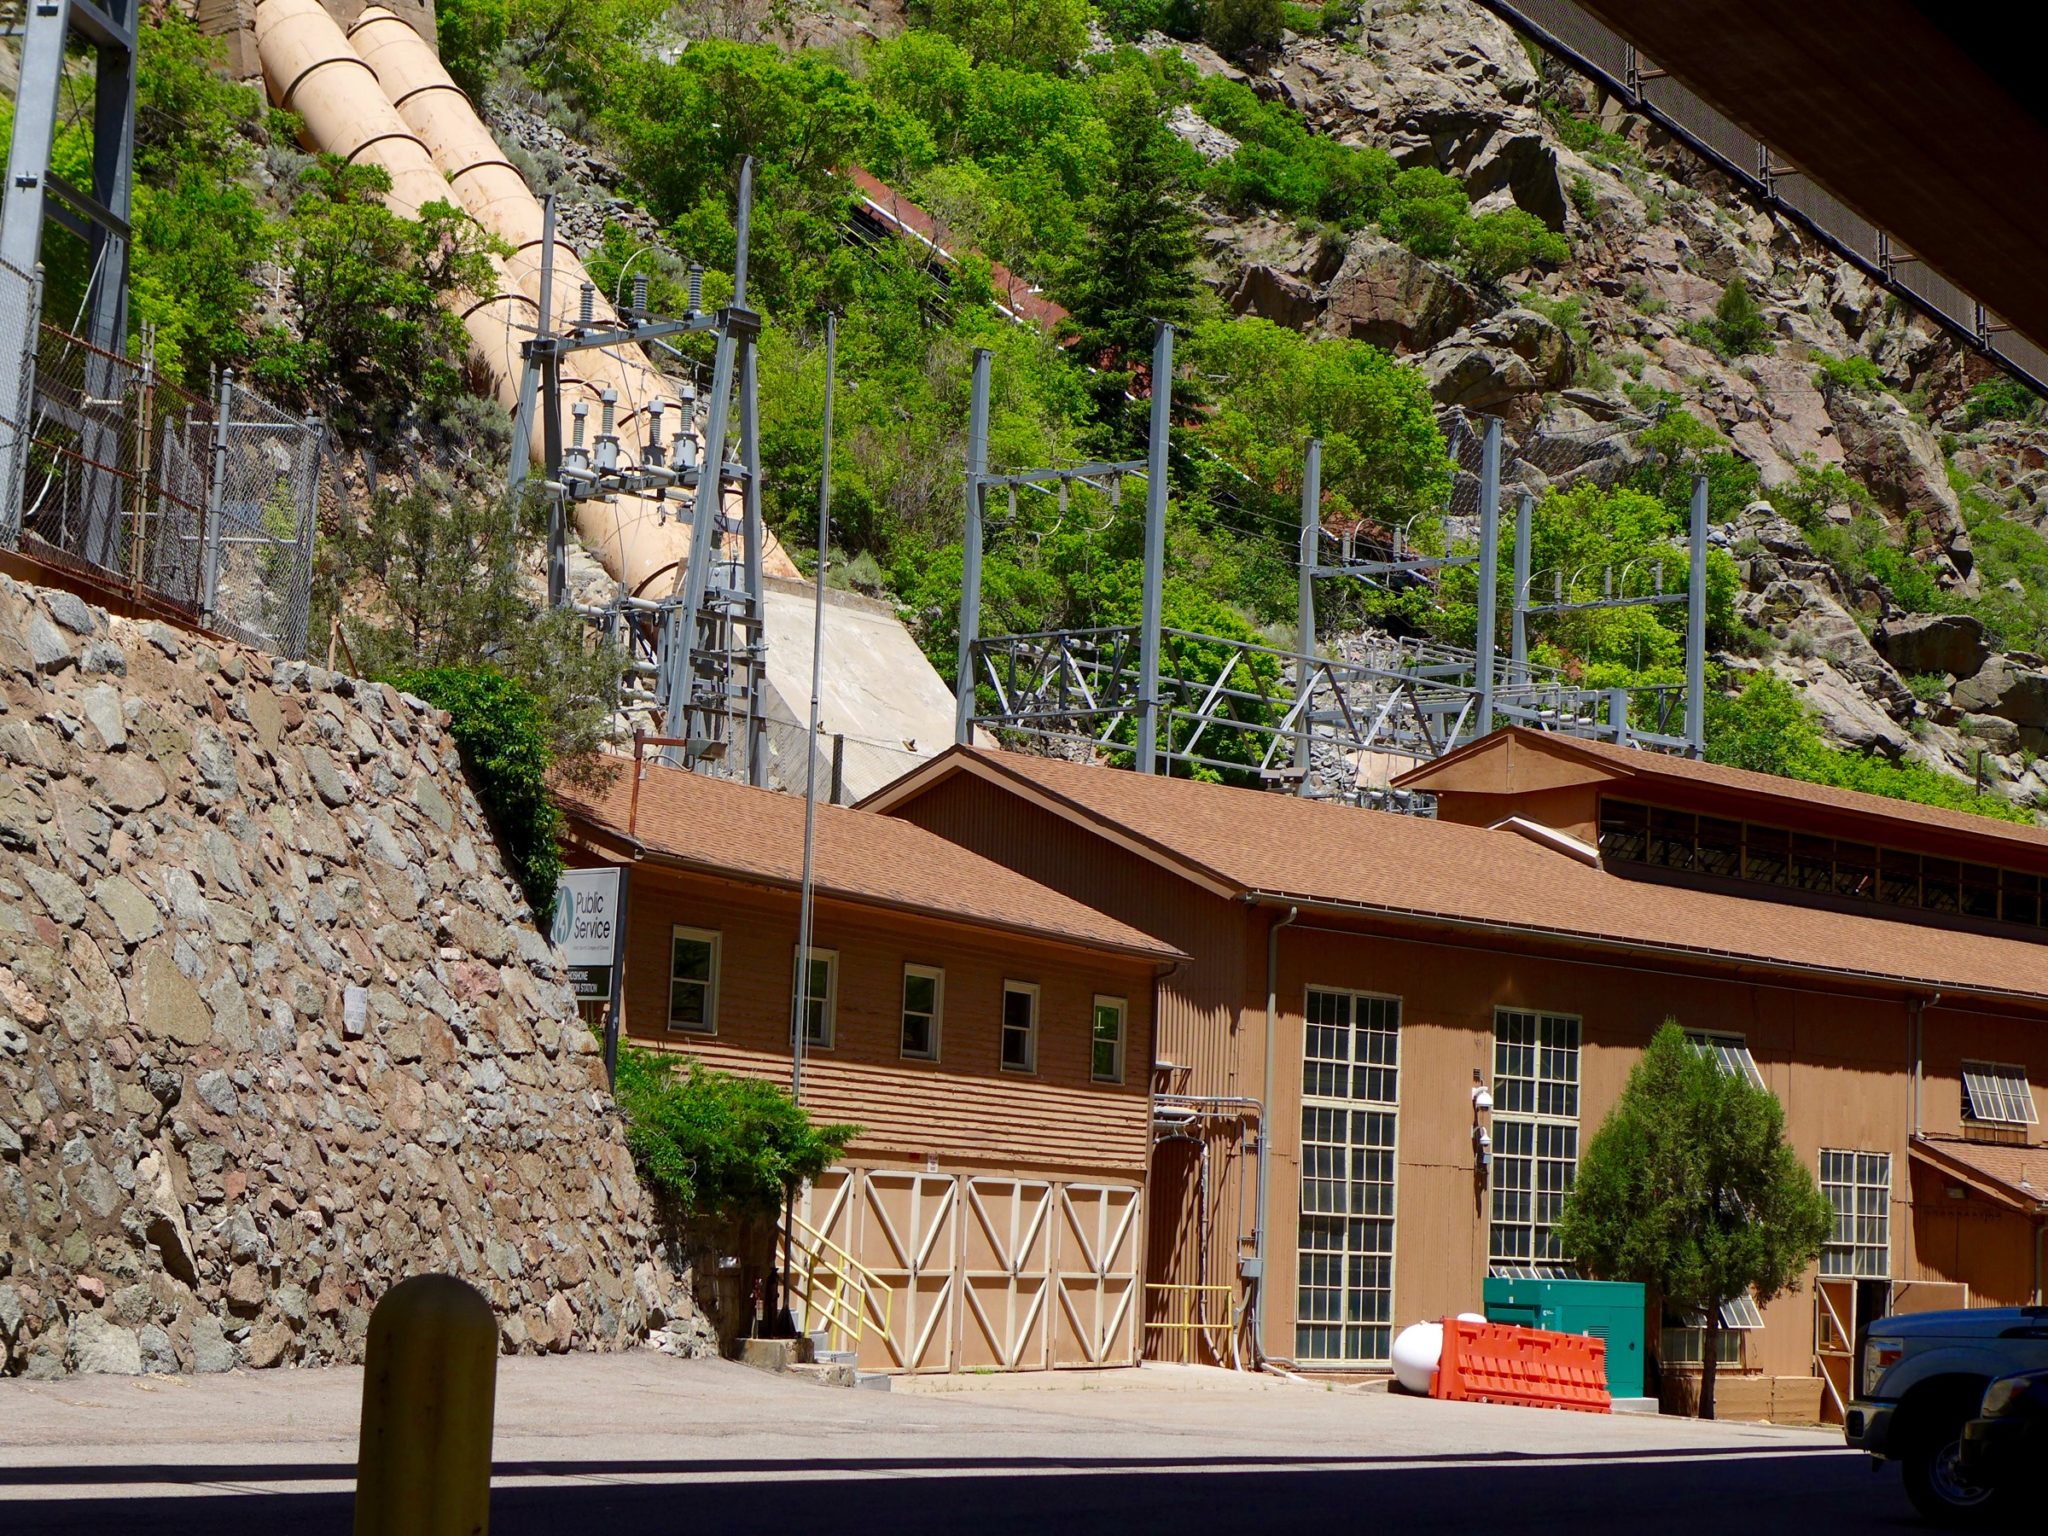
Click the link to read the article on the Aspen Journalism website (Heather Sackett):
February 21, 2024
An historic deal to put a senior water right in the hands of the Colorado River Water Conservation District has been celebrated as a victory for the Western Slope. But Pitkin County officials say there’s a chance it could harm the upper Roaring Fork River.
In December, the Glenwood Springs-based River District signed a deal with Xcel Energy to buy water rights associated with the Shoshone hydropower plant in Glenwood Canyon for $98.5 million. As some of the biggest and oldest non-consumptive water rights on the mainstem of the Colorado River, they ensure water keeps flowing west to the benefit of downstream users because the water runs through Shoshone’s power-generating turbines and then returns to the river.
Pitkin County’s concerns have to do with the complex interaction of the Shoshone water rights with another set of big downstream water rights known as Cameo, which are made up of Grand Valley irrigation water rights. These two senior water rights have the ability to command the flow of the Colorado River and force Front Range cities that send water from the Colorado’s headwaters across the Continental Divide to shut their diversions off.
Under Colorado’s cornerstone of water law, known as prior appropriation, oldest rights get first use of the water. When a senior water right isn’t receiving its full amount, it can place a “call.” When Shoshone, which dates to 1902, places a call, transmountain diverters like Denver Water and Northern Water have to shut off. When Cameo places a call, the Twin Lakes Reservoir and Canal Co., which takes water from the top of the Roaring Fork basin to Colorado Springs, Pueblo and Aurora, has to shut off because its 1930s water rights are junior to Cameo’s 1912 water rights.

Pitkin County’s concern is that with Shoshone under new ownership — and the proposed addition of an instream flow use for the water along with hydropower — the call for the water through Glenwood Canyon could be on more often, which might delay or reduce the need for the Cameo call. Aspenites like to see the Cameo call come on because it forces the Twin Lakes diversion to shut off, which means more water flowing down the Roaring Fork, typically during a time of year in late summer and early fall when streamflows are running low and river health is suffering.
“The upper Roaring Fork lives and dies on the Cameo call because that’s what curtails Twin Lakes,” Pitkin County Attorney John Ely, who sits on the River District’s board, said in an interview with Aspen Journalism. “If the Cameo call is changed through administration of the river because there is a change in the flow going to satisfy Shoshone, then that could delay Cameo, which would prolong the operation at Twin Lakes and deplete the upper Fork.”
Pitkin County in November hired Golden-based engineering firm Martin and Wood Water Consultants to do a technical analysis and modeling of the Colorado and Roaring Fork rivers. They bill in monthly installments and have charged Pitkin County $6,600 so far, according to Ely; the firm is expected to produce a report after they finish studying the issue, although Ely did not say when that would be.

Health of Roaring Fork dependent on Cameo
The River District has said the goal of owning the Shoshone right is to preserve the status quo and keep water flowing west the same way it always has. Xcel representatives have said they intend to keep operating the plant for hydropower, but the facility is old, frequently offline for repairs and located in a treacherous area of Glenwood Canyon.
Ely isn’t so sure that nothing would change. If the Colorado Water Conservation Board (CWCB) was to place a Shoshone instream flow call, it could alter the way the system has historically operated, he said. The CWCB is the only entity allowed to hold an instream flow water right, which is intended to preserve the natural environment to a reasonable degree.
“If it wasn’t going to change the administration of the river, why would anyone pay $98 million for it? … The potential for injury (to the Roaring Fork) is most definitely there,” he said.
River District General Counsel Peter Fleming said the organization is working with Pitkin County to look into the issue.
“The question has arisen and we’re working in good faith with the county to identify and resolve any concerns,” he said. “We’re going to determine whether there is an actual issue that we can accommodate.”
The Cameo call comes on most years in late summer. But it occurs for more days in dry years than wet ones. According to a database maintained by the Colorado Division of Water Resources, in 2019 and 2023 — both years with above-average snowpack and runoff — the Cameo call was on for 22 and 24 days, respectively. In 2020 and 2021 — two back-to-back below-average years — Cameo called for 88 and 75 days, respectively.
The health of the upper Roaring Fork may be more dependent on the Cameo call in drought years.
Wendy Huber is board chair of Pitkin County Healthy Rivers, a taxpayer-funded organization focused on maintaining and improving water quality and quantity in the Roaring Fork watershed that doles out grants and advises the board of county commissioners. She said Healthy Rivers needs more information from engineers about the impacts from any changes to Shoshone on the Cameo call.
“The Cameo call may allow more water to remain in the Roaring Fork to satisfy the call,” Huber said. “We need to understand the potential impact on quantity of water in our Roaring Fork Valley rivers, especially the Roaring Fork and Crystal rivers.”
Ely said he is optimistic Pitkin County will reach a resolution with the River District, at which point the county would be in a position to support the Shoshone permanency campaign. The River District has committed $20 million from its own pocket, and so far has secured $20 million in funding from the CWCB and $2 million from Grand Valley domestic water provider Ute Water Conservancy District toward purchasing the Shoshone rights. It is in the process of seeking funding from other entities in its 15-county district.
“Water is just simply too scarce a resource to not be mindful that you must protect your interests,” Ely said. “We’re not looking to get in the way of Eagle and Garfield and Mesa counties protecting themselves, but we don’t want to sacrifice our river for them to be able to do so.”
This story ran in the Feb. 22 edition of the Glenwood Springs Post-Independent.
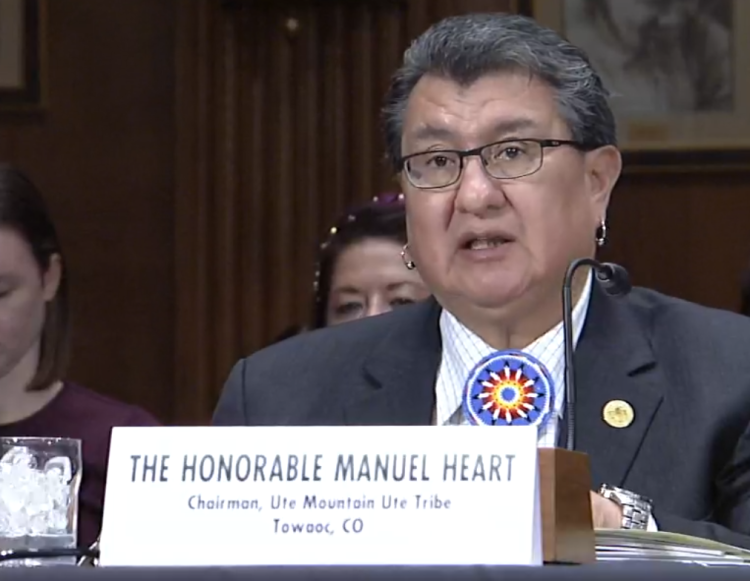
Click the link to read the article on the Getches-Wilkinson Center website (Frannie Monasterio):
February 21, 2024
On Thursday, February 8, 2024, the Senate Committee on Indian Affairs held a Legislative Hearing to gather more information about several tribal bills,1including S. 2385, the Tribal Access to Clean Water Act of 2023, which we have covered in a previous blog. It was the Committee’s first hearing in 2024.
Witnesses commenting on the Act included Melanie Anne Egorin, Assistant Secretary for Legislation the Department of Health and Human Services; Kathryn Isom-Clause, the Deputy Assistant Secretary of Indian Affairs within the Department of the Interior; and Manuel Heart, Chairman of the Ute Mountain Ute of Colorado.
Though several bills were raised during the Hearing, comments from Senators Bennet (D-Colorado) and Murkowski (R-Alaska) focused almost exclusively on the lack of access to water and water infrastructure experienced by Tribes.

Senator Bennet, who introduced the Tribal Access to Clean Water Act last year in July, highlighted that “only half of households on Native American reservations have clean water or adequate sanitation.”2 Senator Bennet stated the lack of water access “is completely unacceptable to me, and it should be unacceptable to every member of the United States Senate. No family in this country should have to raise their children without clean water. No member of a Tribe should have to accept circumstances none of us would accept for our own family.”3
Senator Murkowski raised concerns for water access for Alaska Native communities. Lack of access to indoor plumbing, she noted, impacts one in ten Native Americans in 2024, and is “one of our great public health challenges in rural Alaska and so many parts of the country.”4
Ms. Egorin of the Department of Health and Human Services, within which the Indian Health Service (IHS) is housed, acknowledged that “too many tribal families still do not have access to clean water and reliable wastewater infrastructure.” The Department is still reviewing the implications of the Act and has not expressed support but stated it “would like to continue to work with the bill sponsors and Committee to ensure compatibility with existing sanitation facility authorities, and determine the best way to serve non-eligible homes and commercial properties located within tribal communities.”5
Ms. Egorin also commented on S. 3022, the IHS Workforce Parity Act of 2023, as a means to help address staffing issues chronically experienced by the IHS. Although healthcare services and sanitation services are different programs within the agency, the two are related. Health and Human Services reported that “[t]he absence of clean water to sanitation facilities for tribal households exacerbate concern for the Indian Health Service Clinical Health Care Program” and that “[e]fforts by other public health specialists such as nutritionists and public health nurses are much more effective when safe water and adequate wastewater disposal systems are available in the home.”6 Furthermore, “[e]very $1 spent on water and sewer infrastructure will save $1.23 in avoided direct healthcare cost.”7
Ms. Isom-Clause, the Deputy Assistant Secretary of Indian Affairs within the Department of the Interior, also commented on the S. 2385 and some of the services offered by Interior programs that help address water security issues. The “Bureau of Reclamation’s Native American Affairs Technical Assistance Program or TAP,” for example, “provides technical assistance to Tribes to develop, manage, and protect their water and related resources” and supports “a broad range of activities, including water needs assessments, improved water management studies, water quality data collection assessments, and water measurement studies.”8
Though Interior has not expressly supported S. 2385,9 it “is committed to further developing this program in the coming years, including with the FY 2024 President’s Budget Request of” $23.5 million.10
Ms. Egorin and Ms. Isom-Clause did not comment on water-related treaty obligations or trust responsibilities the United States has to Tribes.
Manuel Heart, Chairman of the Ute Mountain Ute of Colorado, poignantly stated, “[o]ne of the most significant issues facing the Tribe today is access to reliable, clean drinking water.” He detailed Ute Mountain Ute’s ongoing challenges in addressing water insecurity in both his oral testimony and prepared statement, highlighting the looming difficulties many western Tribes face when trying to access water. Chairman Heart supported S. 2385 as “a necessary first step to meeting . . . the United States’ treaty obligation and trust responsibility to Ute Mountain Ute people.”11
One of these hurdles is that the Ute Mountain Ute’s tribal lands span three states: Colorado, New Mexico, and Utah. The result is that Ute Mountain Ute must coordinate with each state individually as water issues surface

In Colorado, the Ute Mountain Ute experience the dichotomy of paper water, the amount of water to which they are legally entitled, and “wet water,” the water that they actually receive.12 Under “the Colorado Ute Settlement Act of 2000,” the Ute Mountain Ute were guaranteed “16,525 acre-feet of water from the Animas-La Plata Project (ALP) at Lake Nighthorse. However, year after year, the Tribe has been unable to access its water due to the lack of water infrastructure connecting the ALP project to the Tribe’s reservation lands.”13 Ute Mountain Ute receive no compensation for leaving the water available from the Animas-La Plata.14
Meanwhile, in Utah, the Ute Mountain Ute White Mesa community is afraid to drink the water available to them because of a uranium mill located 2.5 miles north.15 “Presently the Tribe is in discussion with the state engineer of Utah in settling the Tribe’s water rights in White Mesa.”16
Beyond the aforementioned issues, tribal water infrastructure projects are plagued by capacity limits. Many projects, for example, require planning and design to become shovel-ready.17 Operations and maintenance after construction also remain a problem. Relatedly, Senator Murkowski noted a study by the Government Accountability Office “to examine the operation and maintenance issue in greater detail.”18
Although not mentioned directly in this Hearing, parity to access Bipartisan Infrastructure Law (BIL) funding is another issue for other North American Indigenous communities. Senator Bennet hinted at it when he “welcomed the Committee’s feedback on how to approve this legislation so we can ensure Native Hawaiians and Alaska Natives and Tribes across the country can access Bipartisan Infrastructure Law funds to guarantee reliable access to clean water.”19 The issue was also raised during the Committee’s Oversight Hearing on Water as a Trust Resource, held in September 2023, when Mr. Kali Watson, Director the Department of Hawaiian Home Lands, stated that Native Hawaiians were not eligible for BIL funds for water and other infrastructure needs.20
The relationship between Tribes and the federal government creates additional, unique hurdles for accessing clean water. Senator Murkowski recalled the September Hearing “on the trust responsibility of providing for water and sanitations needs for those in our Native communities” and noted “the significance, the importance, [and] the responsibility to deliver clean, affordable water to our Native communities.”21 Senator Bennet stated that the lack of water infrastructure “is particularly egregious because it is a direct consequence of the federal government’s failure to honor promises and treaties made to Tribes across this land.”22 Although raised at the September hearing, no federal legislative responses appear to be in sight for the time being.
The Committee is leaving the record open for two weeks after the Hearing for additional questions and comments about the bills. Ideally, the Committee’s next step would be to markup S. 2385, at which point Committee members would consider possible changes, before moving the bill to the Senate floor.23
Check out our previous blog post on the Tribal Access to Clean Water Act of 2023, where we outlined how its passage would facilitate Tribal access to clean water. For additional information about the Act, including its partners and supporters, check out the Universal Access to Clean Water’s page.
List of Resources
- Tribal Clean Water Act of 2023 bill text: Tribal Access to Clean Water Act of 2023, S.2385, 118th. Cong. (2023), https://www.bennet.senate.gov/public/_cache/files/a/6/a6fb5c6f-eac9-4d4e-9541-d1ba7c1f8ab8/64B158C296583B7B80A3A39962959A78.tribal-acccess-to-clean-water-act-bill-text.pdf.
- Congress.gov webpage for the Senate bill: See also S.2385 – A Bill to Provide Access to Reliable, Clean, and Drinkable Water on Tribal Lands, and for Other Purposes, Congress.gov, https://www.congress.gov/bill/118th-congress/senate-bill/2385
- Congress.gov webpage for the companion House bill: H.R.4746 – To Provide Access to Reliable, Clean, and Drinkable Water on Tribal Lands, and for Other Purposes, Congress.gov, https://www.congress.gov/bill/118th-congress/house-bill/4746.
- Bill fact sheet: Universal Access to Clean Water for Tribal Communities, Fact Sheet, Tribal Access to Clean Water Act of 2023, https://tribalcleanwater.org/wp-content/uploads/2023/07/Fact-Sheet-2023-legislation.pdf.
- Letters in support of the Act: Universal Access to Clean Water for Tribal Communities, Legislation, https://tribalcleanwater.org/legislation-partners/ (last visited Feb. 12, 2024).
- A report detailing tribal water access issues: Heather Tanana et al., Universal Access to Clean Water for Tribes in the Colorado River Basin (2021), https://tribalcleanwater.org/wp-content/uploads/2021/09/WTI-Full-Report-4.20.pdf.
- A report detailing the economic cost of water access issues across the United States: DigDeep & the U.S. Water Alliance, Draining: The Economic Impact of America’s Hidden Water Crisis (2022), https://www.digdeep.org/s/Draining_-The-Economic-Impact-of-Americas-Hidden-Water-Crisis-FULL-REPORT.pdf.

Click the link to read the article on The Summit Daily News website (Kit Geary). Here’s an excerpt:
February 23, 2024
Colorado’s statewide snowpack is currently at 96% of the 30-year average, and storms in the forecast could push it closer to 100%. While a majority of the snow is slated to arrive early next week, experts are predicting snowfall varying from 1 to 3 inches for many of Colorado’s ski resorts over the course of the next couple days…[Jim] Kalina said a storm system moving in early next week is expected to bring favorable conditions to those looking to hit the ski slopes.
The Colorado Headwaters Basin — including the northern and central mountain regions as well as parts of the Western Slope — is currently at 97% of the 30-year median. In terms of whether or not it will push the Colorado Headwaters Basin up to 100% snowpack, Kalina said “It looks like a pretty good storm, so it could bump it up a little bit to be in that kind in of range.”
…the Yampa-White-Little Snake River Basin, which is currently at 105% of the 30-year median for snowpack…The USDA National Resources Conservation Service reported that The Colorado Headwaters Basin generally reaches its snowpack peak around April 12, and the Yampa-White-Little Snake River Basin generally reaches its snowpack peak around April 7.
Click on a thumbnail graphic to view a gallery of drought data from the US Drought Monitor website.
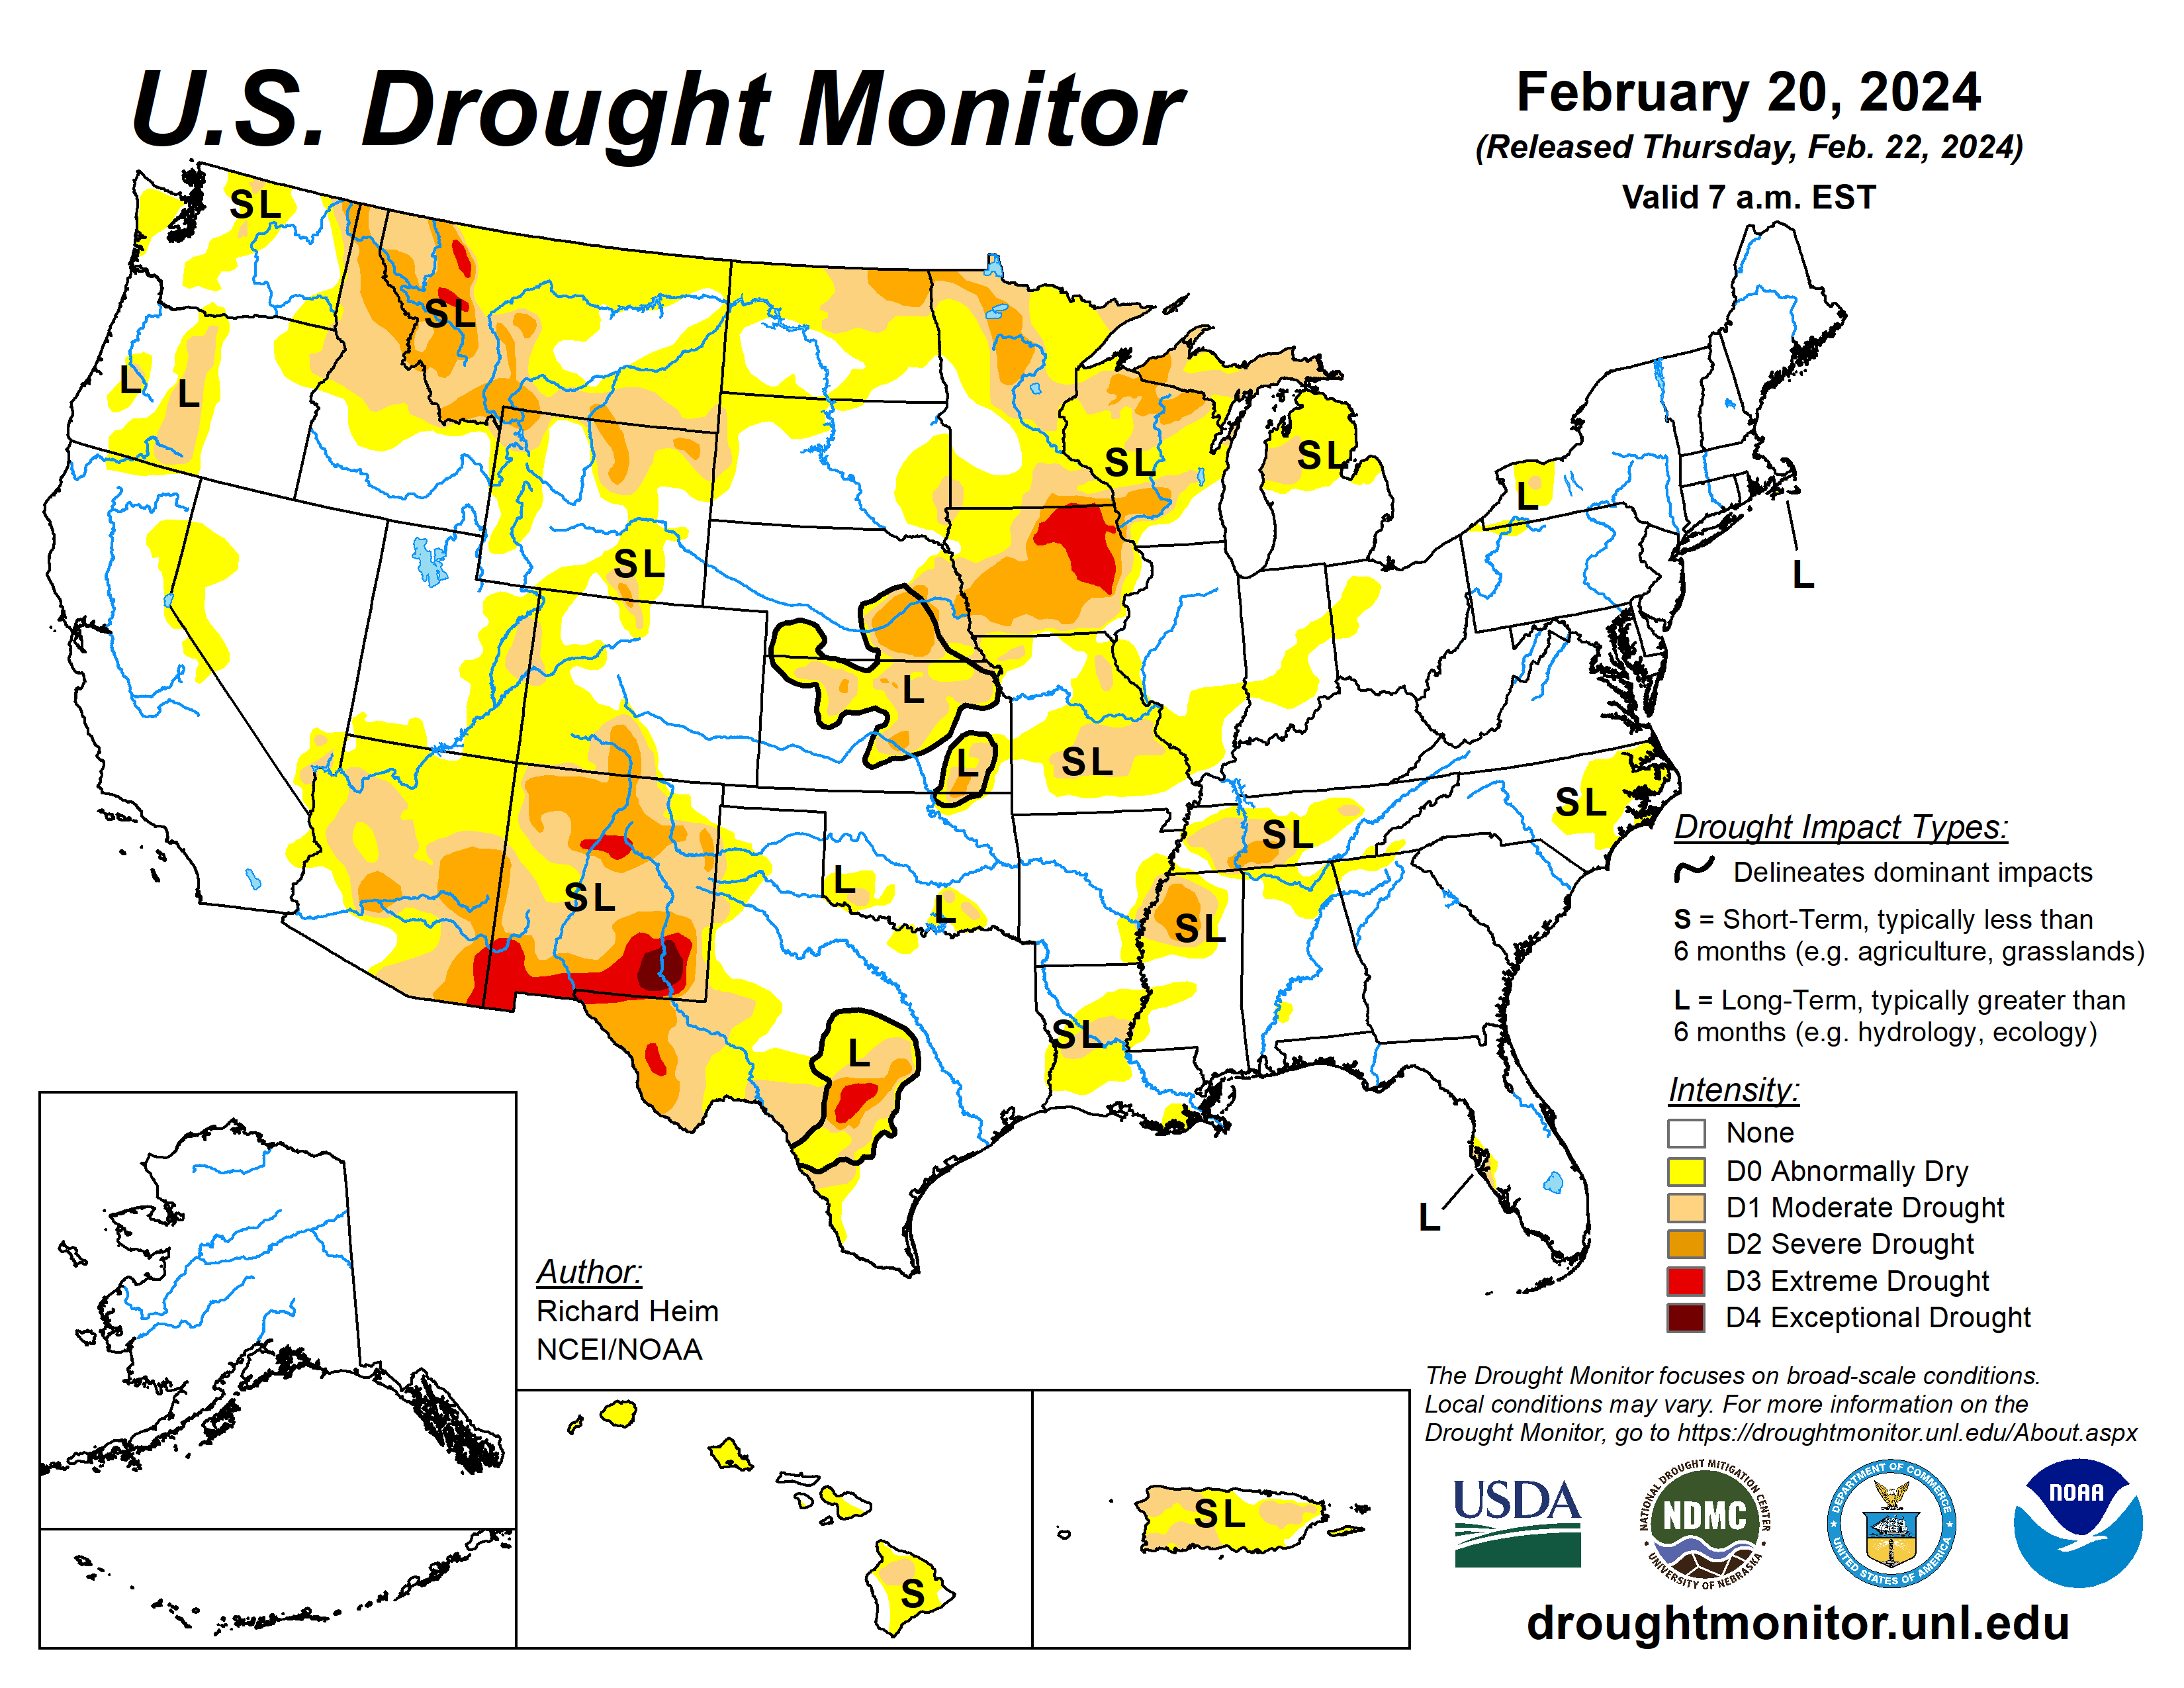
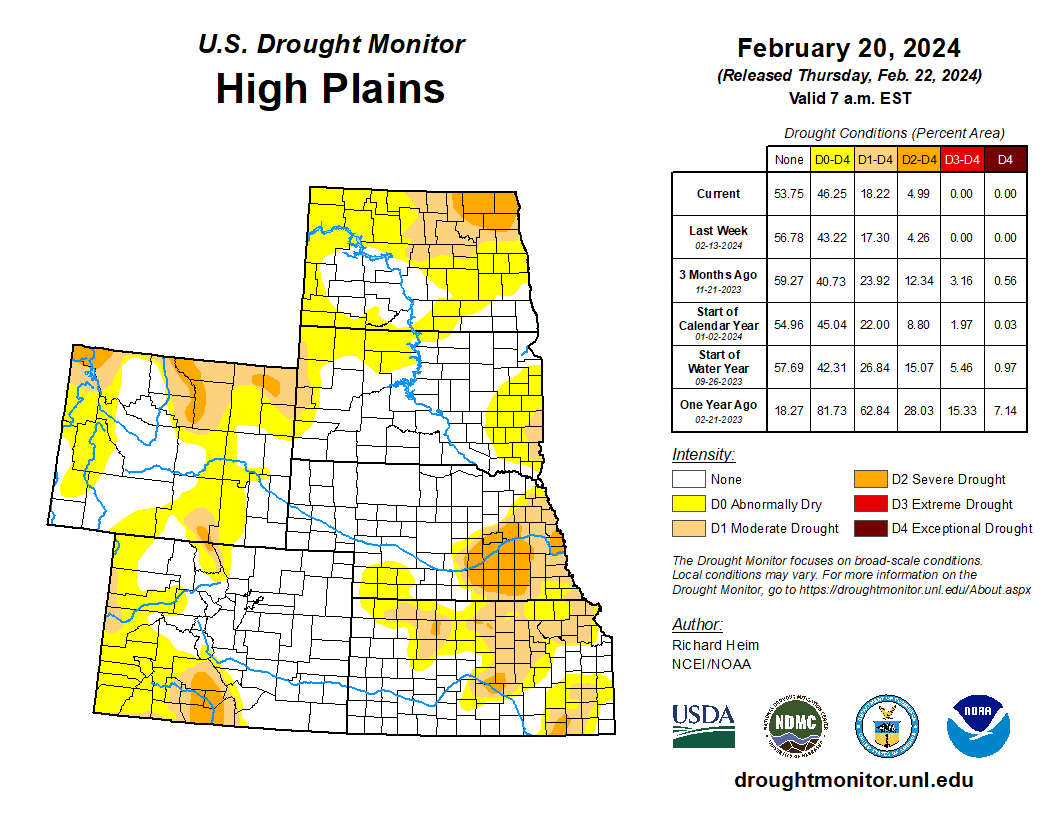


Click the link to go to the US Drought Monitor website. Here’s an excerpt:
This Week’s Drought Summary
An atmospheric river of Pacific storm systems slammed parts of the West Coast with heavy precipitation during this U.S. Drought Monitor (USDM) week (February 14-20). The weather systems dried out as they crossed the western mountains, then produced anemic precipitation amounts east of the Rockies. Parts of the Midwest and Northeast received limited precipitation amounts from passing cold fronts, and heavier rain fell along the Texas coast and across Florida from another frontal system, but much of the country east of the Rockies, as well as the southwestern U.S., received little to no precipitation. The weather systems distorted the upper-level circulation over the contiguous U.S. (CONUS), which otherwise consisted of a high-pressure ridge over western North America and a low-pressure trough over the east. The end result of this distortion was a temperature anomaly pattern that consisted of warmer-than-normal weekly temperatures in the Upper Midwest and parts of the interior West, and below-normal temperatures in the Pacific Northwest, Rockies, and southern tier states, with near-normal temperatures elsewhere. An upper-level ridge over the Caribbean brought generally dry and warmer-than-normal weather to Puerto Rico and the U.S. Virgin Islands, while ridges also kept Alaska mostly drier and warmer than normal and Hawaii drier than normal this week. Drought or abnormal dryness expanded or intensified this week in parts of the Pacific Northwest, northern Rockies, northern Plains, Upper Midwest, Middle Mississippi Valley, Rio Grande Valley, eastern North Carolina, and much of Hawaii. Drought or abnormal dryness contracted or reduced in intensity in parts of the Four Corners states and Lower Mississippi Valley…
High Plains
Half an inch to locally 2 inches of precipitation fell this week over the Colorado mountains into adjacent Wyoming, and over western Wyoming. A band of precipitation extended across South Dakota, with locally up to half an inch falling. Otherwise, the High Plains region received little to no precipitation. D0 was expanded in the Dakotas, and D1 expanded in North Dakota, where the last 3 months have been dry and the lack of snow cover has exposed bare ground. D0 and D1 were adjusted in north central and southwest Colorado where recent precipitation resulted in local improvements and continued dryness caused local expansion. D2 was introduced in north central and northeastern Wyoming…
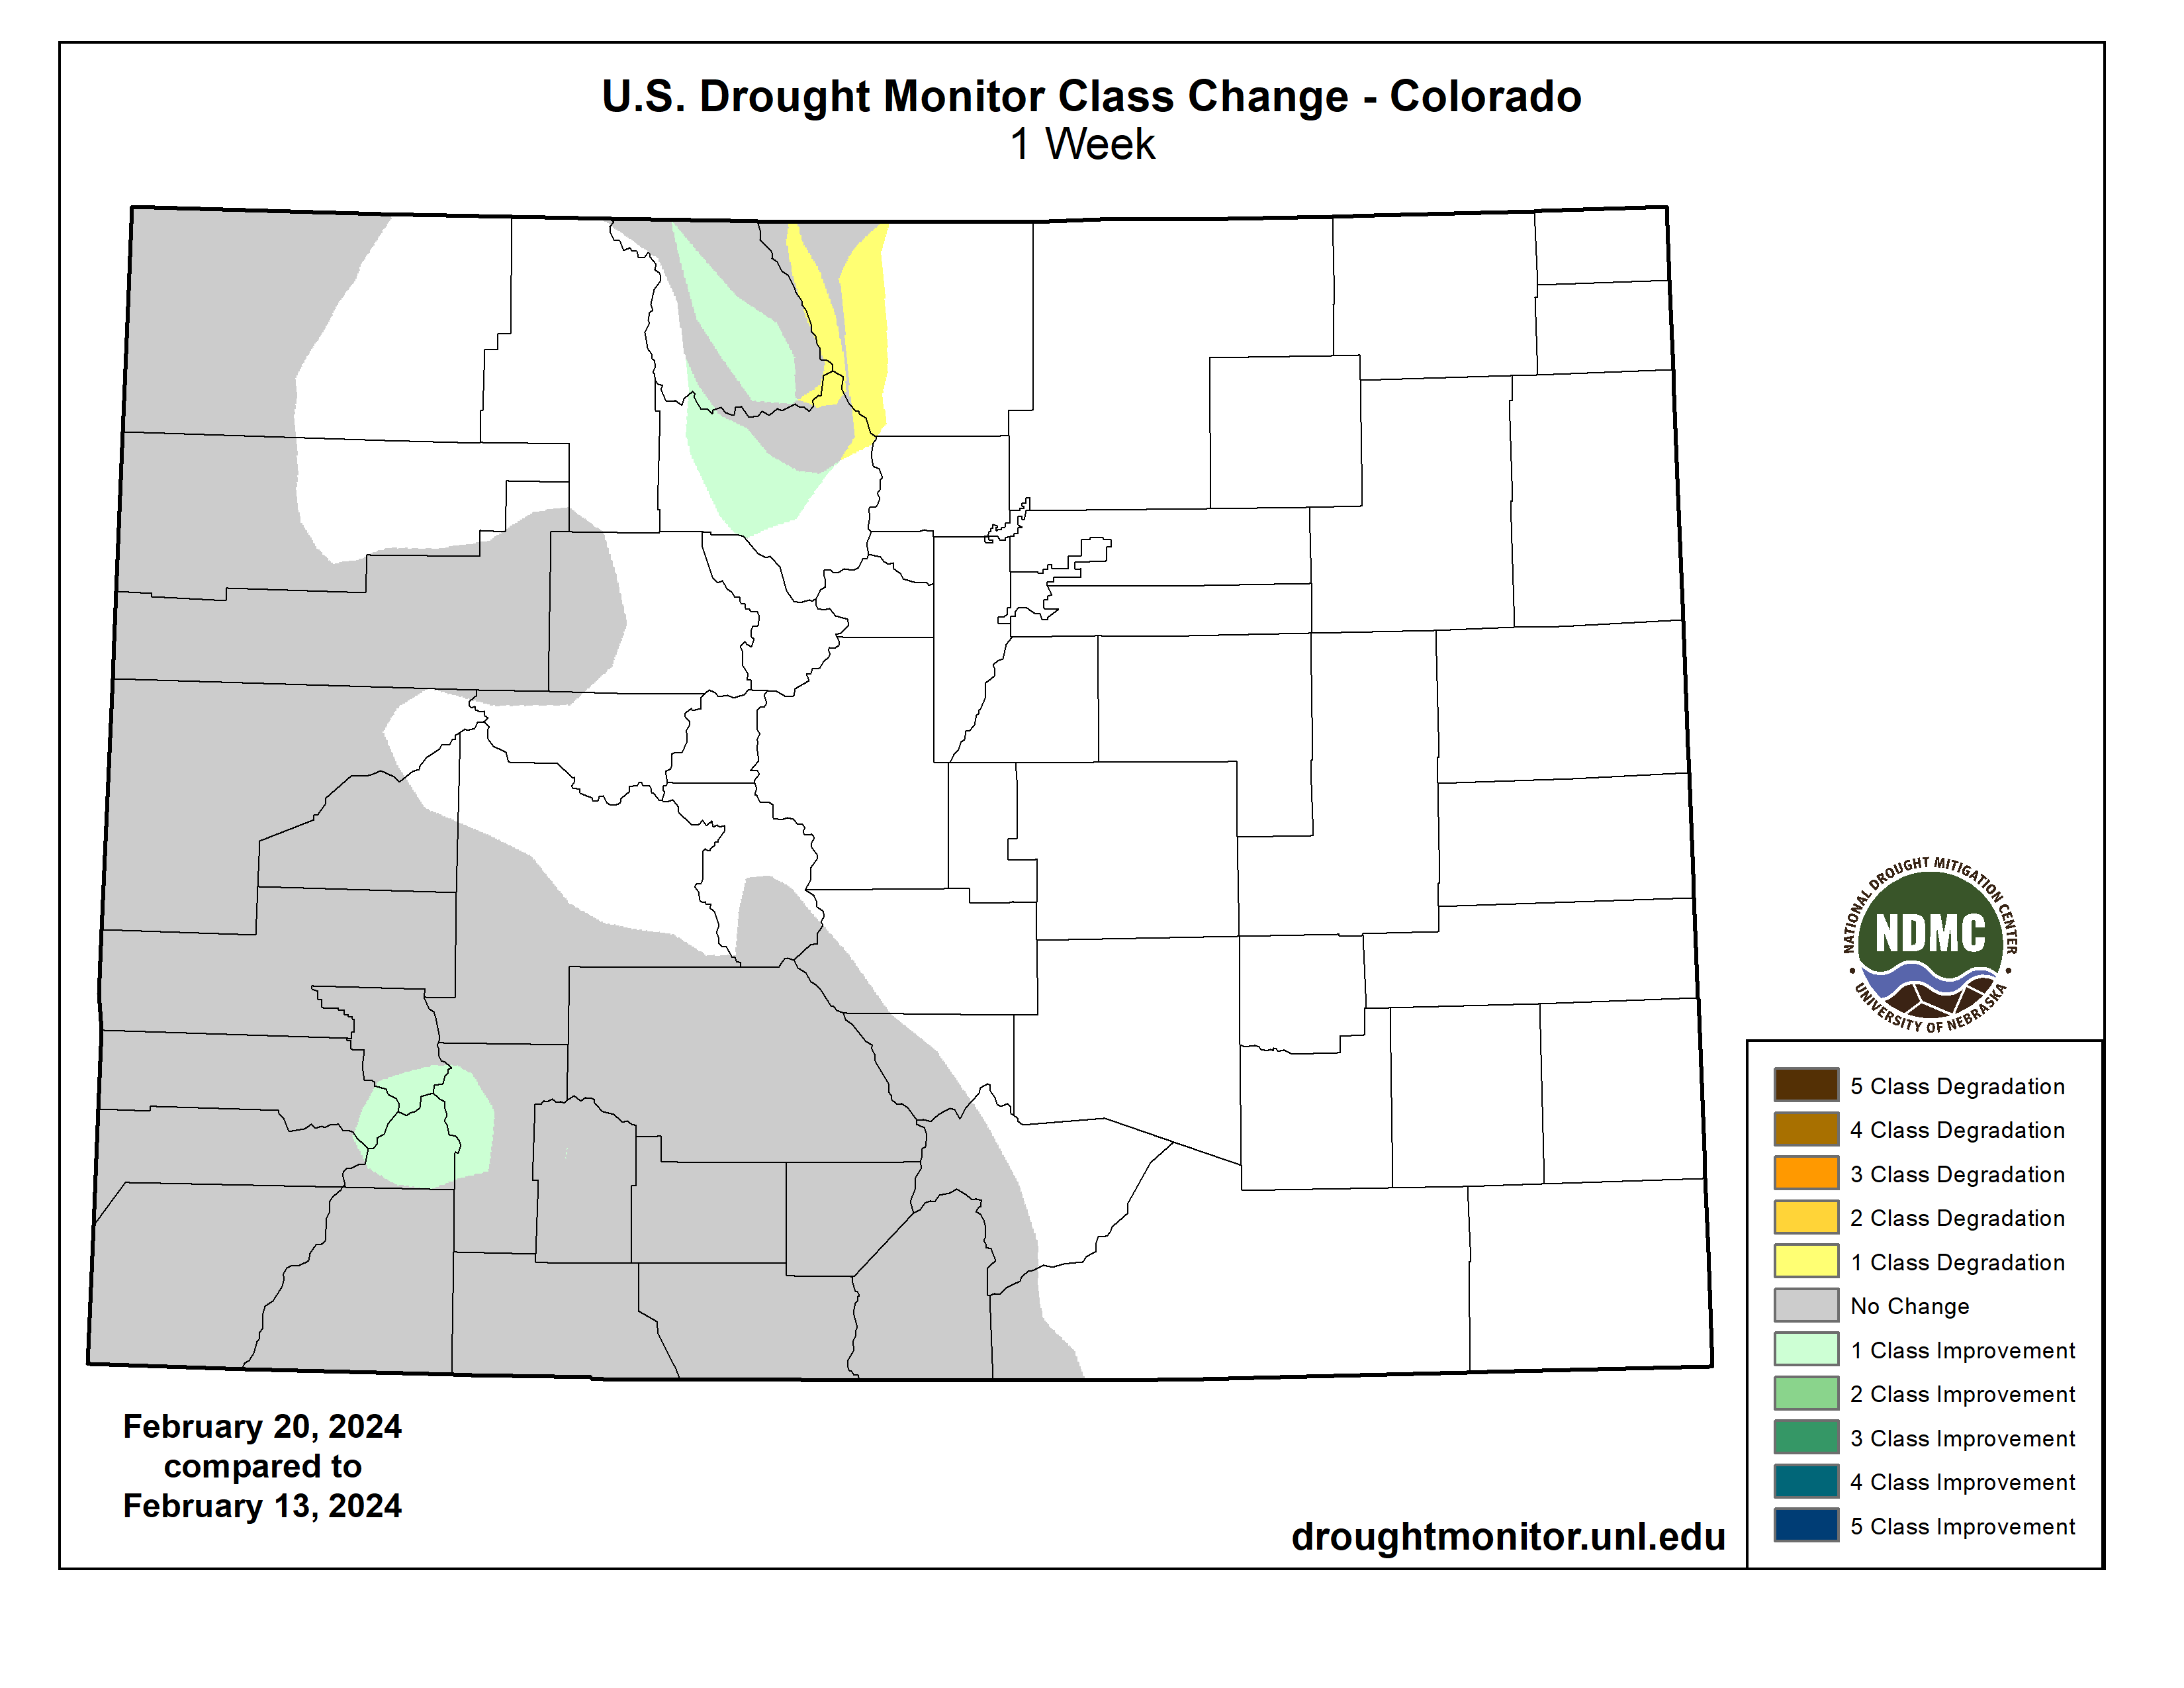
West
Five inches or more of precipitation fell along the California coast, across much of northern California, and in southwestern coastal Oregon, with 2 inches or more inland to the Sierra Nevada, Oregon Cascade mountain range, and over southwestern coastal Washington. Half an inch to an inch of precipitation fell across southern parts of the Pacific Northwest inland to the Rockies and a few areas to the north, with up to 2 inches falling from the Great Salt Lake area to Yellowstone National Park. Another area of 1 to 2 inches of precipitation occurred over the Colorado Rockies into adjacent Wyoming. Parts of California have received over 10 inches of precipitation during February and the Sierra Nevada range has received 1 to 3 feet of new snow since the end of January. But even with a wet February, much of the Sierra Nevada still has a below-normal snowpack. As of February 16, the northern Sierra snow water content (SWE) was 83% of normal, the central Sierra SWE was 74% of normal, and the southern Sierra SWE was 72% of normal. So, the D0 along the California-Nevada border was left unchanged.
While this week was dry across New Mexico, precipitation from the last 2 weeks to 3 months prompted the elimination of the D4 in southwestern New Mexico and the northwest D2, and contraction of the D3 in north central and D2 in southwestern parts of the state.
In northern parts of the West, precipitation for the water year to date (October 1, 2023-February 18, 2024) has been largely below normal and the winter snowpack is significantly below normal. Parts of the northern Rockies have record low SWE values, according to SNOTEL data. D0 expanded in parts of Idaho, Oregon, and Washington; spots of severe drought (D2) were added in north central and northeast Wyoming; and D2 was expanded and new D3 added in parts of Montana, especially the western and southern mountains, where the last 3 to 4 months have been dry and SWE values are record low…
South
Half an inch or more of precipitation fell across parts of the Texas coast, and there were a few areas of up to half an inch of precipitation in Arkansas and Tennessee, but otherwise the South region received no precipitation this week. D0 and D1 were expanded in west Texas along the Rio Grande Valley to reflect dry conditions over the last 7 days to 3 months, low streams, drying soils, and stressed vegetation indicated by satellite. D0 was contracted in South Texas and D1 contracted slightly in central Texas (Bell County). No change was made in Oklahoma, where reservoir levels remain historically low. A reassessment of conditions resulted in the removal of the D3 (extreme drought) and trimming of D2 in northwest Mississippi, trimming of D0-D1 in Arkansas, Louisiana, and Mississippi, and trimming of D0 in Tennessee. Precipitation is near to above normal in these areas for the last 1 to 4 months, streamflow is near to above normal, and surface soil moisture has been recharged. In Louisiana, stock ponds mostly refilled. The remaining D0-D2 is sufficient to reflect the longer-term dryness which shows up most severely at the 6- to 12-month time scales…
Looking Ahead
In the two days since the Tuesday valid time of this USDM, Pacific moisture continued to move across parts of the West, with little precipitation falling east of the Rockies. For February 22-27, one weather system will move across the eastern CONUS, while another moves into the West by the end of the period. The first is forecast to drop 0.5 to 1.5 inches of precipitation across the Tennessee Valley and southern Appalachians northward to the southern Great Lakes and central Appalachians, with half of an inch or less over the Northeast and even less over the Southeast. The second is expected to bring an inch or more of precipitation to the central and northern Rockies, coastal ranges of the Pacific Northwest, and Sierra Nevada, with up to 3 or 4 inches in the Washington Cascades. Other areas of the West are forecast to receive less than half an inch of precipitation, with little to no precipitation over the Southwest and to the lee of the Cascades in Washington. For the Great Plains to Mississippi Valley, little to no precipitation is predicted. Temperatures are expected to be warmer than normal, with the warmest anomalies across the Plains and Mississippi Valley due to upper-level ridging.
For much of the next 2 weeks, the atmospheric circulation is expected to consist of an upper-level trough over the western CONUS and a ridge over the eastern two-thirds of the country, with Pacific weather systems migrating through the trough/ridge pattern. The Climate Prediction Center’s (CPC) 6-10 Day Outlook (valid February 27-March 2) and 8-14 Day Outlook (valid February 29-March 6) favor a fairly stable pattern of warmer-than-normal temperatures from the Plains to East Coast and cooler-than-normal temperatures over the West and Alaska. The outlook is for above-normal precipitation over much of the CONUS, especially along the West Coast and Great Lakes, with odds favoring near to below-normal precipitation across the Plains and over most of Alaska.

Click the link to read the article on the Colorado Climate Center blog (Russ Schumacher):
February 18, 2024
We spend a lot of time thinking about snow in our mountains, because Colorado is a headwaters state, and the water stored in that snowpack ends up serving ecosystems, farms, and millions of people not just in Colorado but in all directions. As we progress toward the end of February, the overall picture of Colorado’s mountain snowpack comes into much clearer focus. As of February 20th, the snow water equivalent (SWE) in Colorado’s mountains, as measured at SNOTEL stations, was 97% of the median value for this day, compared to the 1991-2020 period. The northern mountains were a little bit above average (for example, the Yampa-White basin was at 104% of average), and the southern mountains a bit below (88% of median for the mountain areas feeding the Rio Grande river).
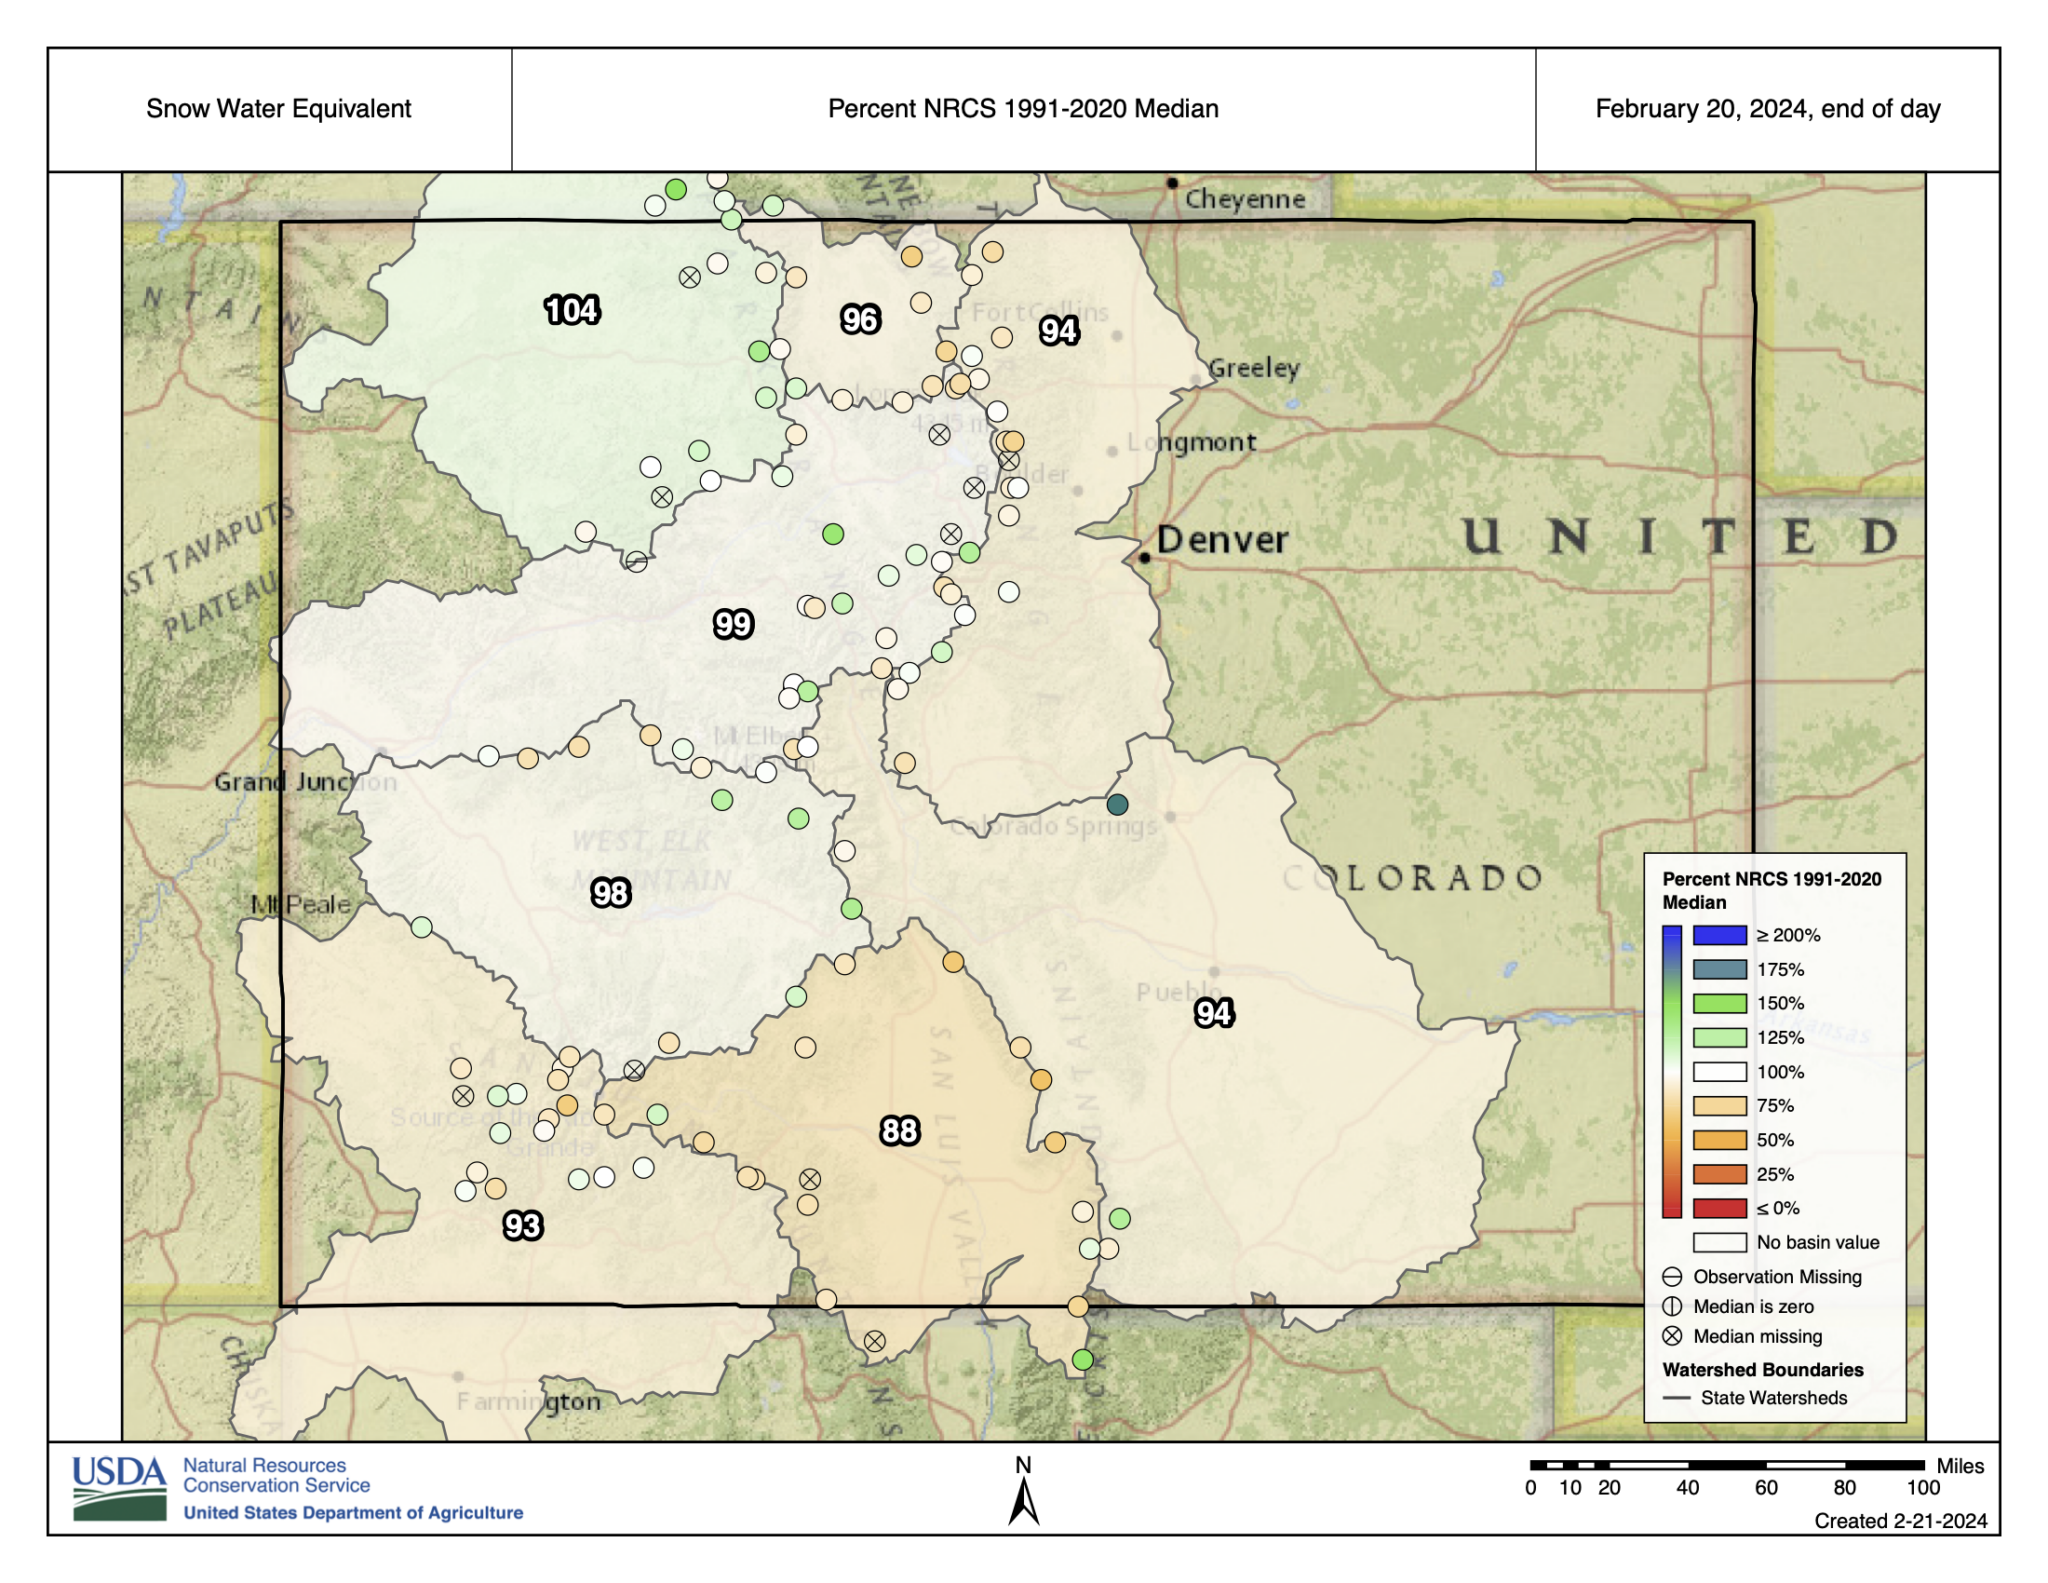
The state of the snowpack at this point in the winter can be characterized as pretty ok. Certainly much better than some of the drought years over recent decades, but also nowhere near the huge snows that fell last year across Colorado. (At this time last year, we were sitting at about 120% of average statewide.)
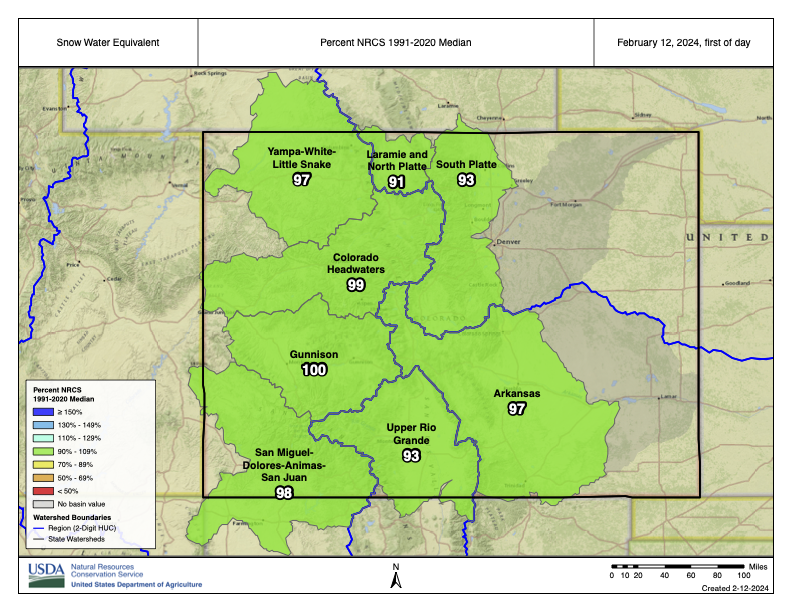
The snow accumulation season started quite slow: most locations were lagging well behind the average snowpack, with a few sites near record lows, in early January. But then a major storm cycle in mid-January gave a huge boost to the snowpack, bringing it back within shouting distance of the average. February has been a more typical month in the mountains, with a steady string of storms, some hitting the northern ranges and others benefiting the south. That brings us to the decent position we’re in now: not amazing, but not too bad either.
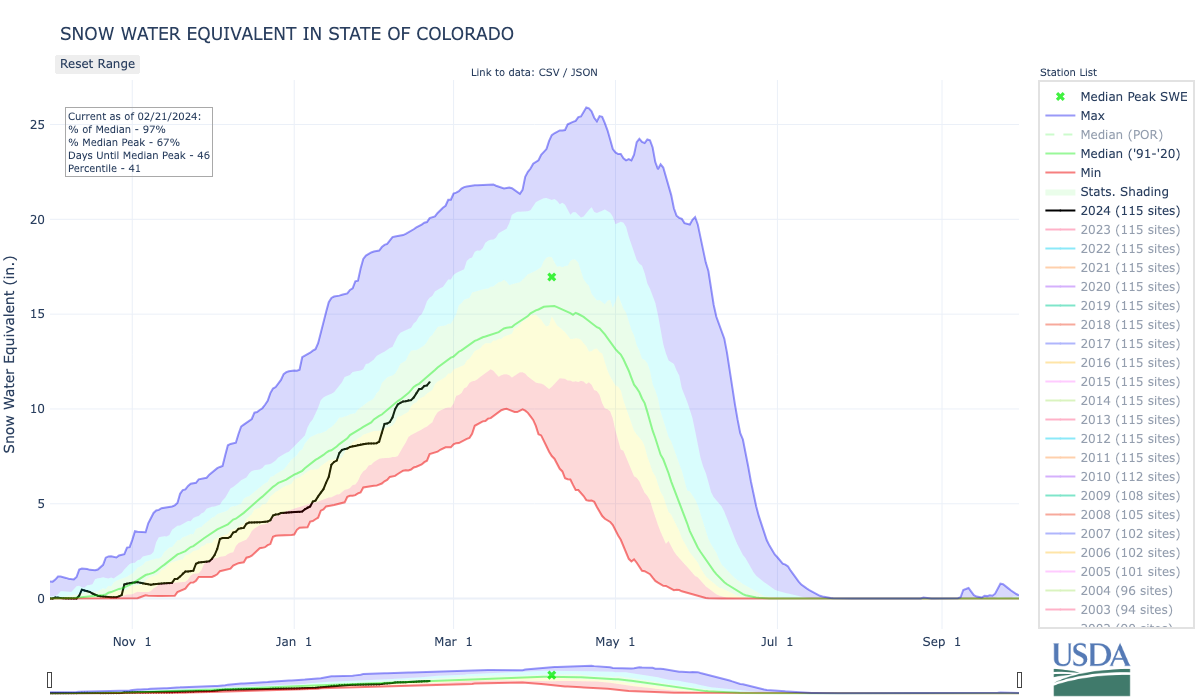
How much do the current conditions tell us about where we’ll end up?
It turns out that for the statewide average, the snowpack value on February 20th correlates very strongly with the eventual peak, as shown in the graph below. (The correlation coefficient is 0.85, for those familiar with that metric.) In past years when the snowpack was similar in late February to where it is this year, the eventual peak tended to be a little below average. Only one year when the February snowpack was similar to this year did the seasonal peak end up well above average (1998…more on that in a second.) There’s still about a month and a half until the typical peak (a little less in the south, more in the north), meaning there’s still time for things to change. In a typical year, a whole lot of snow falls between late February and mid-April! But it’s also uncommon for a huge change in the overall seasonal picture after this time in the winter.

So, what should we expect for the rest of the winter and spring? Although snowpack is just a bit below average, the water supply forecasts for the Upper Colorado River Basin look even lower. The Colorado Basin River Forecast Center’s mid-February update projected that April-July streamflow into Blue Mesa Reservoir along the Gunnison River will be 88% of average. For this reservoir—Colorado’s largest—that would be a decent outcome. However, the projected flow into Lake Powell is only 77% of average. Lake Powell rose above its historic lows after the big snows last year, but is still far below average levels (let alone being filled.)
There are a couple of wild cards to consider. One is that we remain in El Niño conditions, which tends to increase the odds of a wet and snowy spring (see Figure 2.12 here). Recall the reference above to 1998, when snowpack that was just ok in February ended up well above average by late April. That was a strong El Niño similar to this year. The CPC monthly outlook for March does tilt toward wetter-than-average conditions, so that is a possible reason for hope.
On the flip side, the long-term trend toward warm springs and earlier melts in the mountains continues as the climate warms, which could alter the eventual water supply as well. As pointed out in this post, the biggest reason for errors in streamflow forecasts is the fact that we don’t know what’s going to happen with the weather over the next couple months! So, while history and these outlooks give some useful hints, as usual we will just need to wait and see what happens.
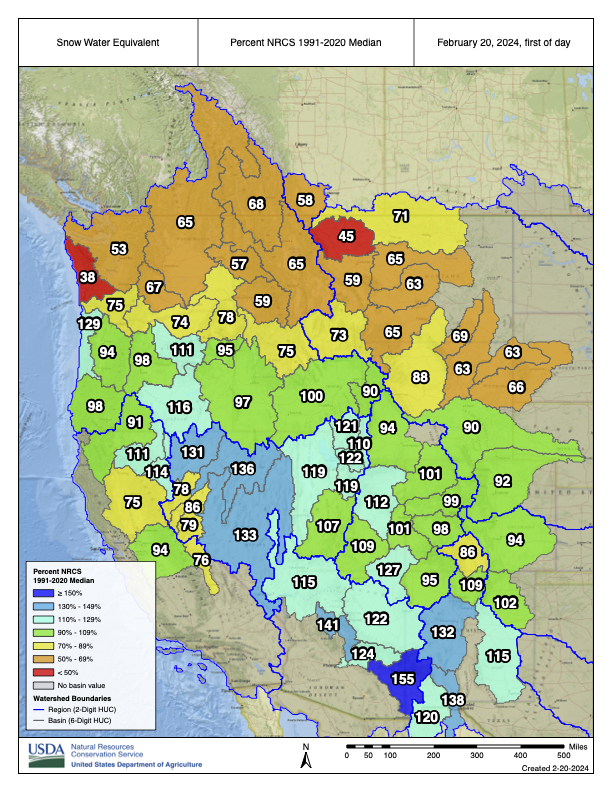

Click the link to read the article on the Big Pivots website (Shannon Mullane):
February 18, 2024
Coloradans gunning to join this year’s effort to save water in the Colorado River Basin could help conserve up to 17,000 acre-feet of water — much more than the 2,500 acre-feet saved in 2023 — and receive about $8.7 million in return.
The voluntary, multistate program pays water users to temporarily use less water. State and federal officials relaunched the effort, called the System Conservation Pilot Program, in 2023 in response to federal calls to cut back on water use in the drought-stressed river basin. After a stumbling relaunch in 2023, this year’s program is moving forward with more applications, more potential water savings and more money for participants.
“The changes this year — it was just much more transparent,” said Greg Vlaming, a consultant who helped nine growers apply to the program. “The application process was simple and easy. It took me less than 15 minutes per application.”
The conservation program was initially piloted from 2015 to 2018. In 2023, officials relaunched it with $125 million in federal funding as a way to cut back on water use in response to a looming water supply crisis in the Colorado River Basin. The basin supplies water for 40 million people across the western U.S., 30 Native American tribes and northern Mexico.
Interest in the program has grown steadily. During the four-year pilot, about 15 to 45 people applied each year. In 2023, the program received more than 80 applicants.
But program costs have grown as well, in part because the program’s managers have boosted reimbursement rates to keep up with rising crop prices, according to the Upper Colorado River Commission, which oversees the program.
Last year, the four Upper Basin states — Colorado, New Mexico, Utah and Wyoming — spent nearly $16.1 million in federal funding to conserve about 37,810 acre-feet of water. During the four-year pilot, the program spent half that amount, about $8.5 million, to conserve more water, about 47,000 acre-feet.
One acre-foot supports about two families of four to five people for one year.
This year’s application period closed in December with 124 applications, according to the Upper Colorado River Commission. Of those, Colorado water users submitted 56; Utah, 32; New Mexico, one; and Wyoming, 35.
The river commission, which includes representatives from the federal government and each of the Upper Basin states, is scheduled to consider the applications March 4.
Then, once a federal review is complete and all project details are finalized, applicants have the final say about whether they will participate. The commission aims to launch the conservation projects in April, said Executive Director Chuck Cullom.
In Colorado, most of the applications come from farmers and ranchers who proposed cutting their water use by temporarily fallowing fields, or by switching to crops that use less water or can better withstand drought. About 20 proposals aim to save enough water to warrant $100,000 or more in compensation per project.

The Ute Mountain Ute Farm and Ranch in southwestern Colorado proposed the state’s biggest project this year. If approved, the enterprise will use crops that require less water and will fallow nearly 900 acres of land for an estimated 2,172 acre-feet of water savings. It would receive $1.1 million in return.
David Harold, owner of the Tuxedo Corn Company in Olathe, proposed saving 600 acre-feet of water. In return, he’d get about $305,000, roughly equivalent to the cost of a nice tractor, he said.
The program asks farmers to cut down their water use — buy-and-dry under a different name — but it’s also a way to experiment, he said. How can he respond to an uncertain water supply with as little impact to the local economy as possible and still survive as a farmer?


Harold chose not to fallow — not growing crops means fewer hands to help with production and that impacts the local economy. Instead, he decided to turn off irrigation when it was hottest and least efficient, and to grow more drought resistant crops, like Kernza and sainfoin.
The payment was enticing, but in the long term not enough to offset all of the uncertainties that farmers face, he said. The conservation program’s reimbursement rate could change, or the program could end. There was a disaster with corn earworm in the sweet corn industry last season. State regulations, water supplies and labor costs change.
“The list goes on and on and on of why I should be doing everything I can to diversify or maneuver. Be agile. Be thoughtful,” Harold said. “The past will not be the future; what my dad did is not likely what’s going to work for me. It’s kind of daunting out there.”
Pueblo Water was the only municipal water provider to apply. The Front Range utility normally takes about 943 acre-feet of water from the Ewing Placer Ditch in the Colorado River Basin and diverts it into the Arkansas River Basin for homes and gardens around Pueblo. If accepted, it will leave all of that water in the Colorado River Basin in return for up to $479,987.
“The primary purpose we’re doing it is just because we think, for this particular year, the water’s going to be more valuable in the System Conservation Pilot Project than it’s going to be on the Arkansas River,” said Alan Ward, division manager of water resources for Pueblo Water. “I don’t think we have plans to dedicate it (the funding) to any specific purpose. Essentially what it does is it subsidizes the cost of water for our customers.”
In 2023, when participants negotiated their own reimbursement rates, compensation for the top five applicants ranged from about $70,000 to $195,000 per project, according to the Colorado Water Conservation Board.
In response to participant feedback, officials this year switched to a fixed-rate structure based on a market analysis by the federal and state governments.
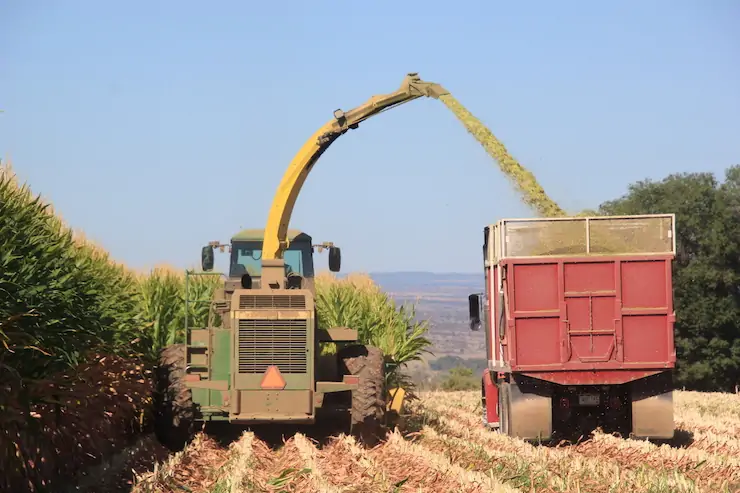
Colorado participants will receive $509 per acre-foot of saved water, the highest compensation rate of the four Upper Basin states. New Mexico producers will receive $300, while those in Utah and Wyoming will receive $506 and $492, respectively. Reimbursement rates will vary for other projects, like leaving water storage in reservoirs, or municipal and industrial water savings.
“I’m not complaining about it,” Vlaming said. “But when I say $509 per acre-foot to guys, they’re like, ‘Where do I sign?’ Some of these guys are going to get paid quite well.”
For water users, negotiating their own rates was one of several problems with last year’s program, alongside a short application period and unclear communication about how to apply and how water savings were calculated.
The application process was much more streamlined this year because officials learned from the process in 2023, said Cullom, the Upper Colorado River Commission executive director.
“The process — which included pre-application interviews and discussions between the applicant and the states and the consultants — helped strengthen all the applications,” he said. “I think we improved the process. That’s some feedback we’ve heard.”
[…]
This story was published by Fresh Water News, a service of Water Education Colorado.


Click the link to read the article on the Aspen Journalism website (Heather Sackett):
February 16, 2024
Longmont dairy farmer Jim Docheff has been in the dairy business for all of his 88 years, and his son Joe grows the corn and alfalfa for the dairy cows on the farm east of the city. On Wednesday, Docheff acquired six units of Colorado River water to use on his family farm by outbidding other would-be buyers in a water auction.
“I came with the idea of buying up to 10 units, but I only got so many dollars to spend,” Docheff said.
Docheff was one of 42 registered bidders who gathered at Barn A of the Boulder County Fairgrounds for a chance to buy some of the 90 units for sale of Colorado-Big Thompson Project water. The transmountain diversion project, built by the U.S. Bureau of Reclamation in the 1940s, takes water from the headwaters of the Colorado River in Grand County and transports it via a system of tunnels, pipes and canals to farms and cities in northeastern Colorado.
The first bid for one unit of C-BT water hit a high mark of $72,000, but prices soon stabilized at around $46,000 per unit. After a bidder won the round, they said how many units they wanted to buy, with some people scooping up two, five or 10 units. A buyer’s premium of 10% was added to the high bid to get the total purchase price, which averaged $52,488 per unit.
After all 90 units had a high bid, auctioneer Scott Shuman with auction company Hall and Hall offered the crowd a last chance to outbid their neighbors and reopen bidding on any of the units, or to buy the entire 90 shares.
“If you didn’t get as much water as you thought you would, here’s your opportunity to add something to it,” he said. “I do not want to say ‘sold’ and then have anybody meet me in the parking lot saying ‘I really wanted to get a couple of those units; I would have given you more for it.’”
But no bidders raised their hands.
“All right, happy Valentine’s Day, ladies and gentlemen, we sold all the water units,” Shuman told the crowd. “Give yourselves a hand, give the Yoakum family a hand.”
When all was said and done, the auction netted a total sale price of about $4.7 million for about 63 acre-feet of water. The seller was longtime Longmont farmer Carol Oswald Yoakum.

C-BT water regulated
It’s common for shares of C-BT water to change hands, but a large-scale sale by auction like the one held on Wednesday is rare. The last one was in 2019.
But not just anyone can own C-BT water. It is highly regulated and there are rules about its use. To participate in the auction, would-be buyers had to meet criteria set by the Northern Colorado Water Conservancy District, which manages and delivers the water to users. Northern does not allow more than three acre-feet of C-BT water per irrigated acre, and it’s best if a bidder is an existing water user like an irrigator or municipality within Northern’s delivery area who already has water from a different source since C-BT water is only meant to be used as a supplemental supply. And out-of-state investors looking to speculate get turned down immediately.
“If they don’t have a farm, if they don’t have a beneficial need for the water, then there’s a very high probability that (Northern) would not approve a contract for them,” said Sherri Rasmussen, contracts manager with Northern Water. “I’ve had calls from New York people wanting to buy C-BT and my first question is: What do you want C-BT for? And they’re like, ‘Well, for investment, what do you think?’ And it’s like no, you don’t qualify.”
The C-BT project provides supplemental water to farms and cities along the northern Front Range and eastward along the South Platte River. Northern delivers this water to 33 municipalities and 120 ditch, reservoir and irrigation companies, according to its website. The project diverts about 200,000 acre-feet a year from the Colorado River basin.
Each year in April, Northern Water’s board determines the amount of water that users will get for each unit depending on whether it’s a drought year and how much water is available. The board most commonly settles on 7/10 of an acre-foot. That means Wednesday’s buyers paid an average of $74,600 per acre foot to own the water in perpetuity. That’s up from an average of $36,300 per acre-foot buyers were paying for C-BT water in 2015, according to WestWater Research, a water market research firm.
According to Adam Jokerst, a regional director with WestWater, C-BT unit prices are simply a function of supply and demand.
“Population growth largely drives water prices on the Front Range and in areas with the fastest population growth in the northern Front Range, that’s where we see the highest water prices,” he said.
But not all the buyers Wednesday were cities looking to transfer water from agriculture to support their continued growth. According to Shuman, of the 15 buyers, six were farmers; four were dairies; two were developers; two were municipalities and one was a farm foundation.
According to Jeff Stahla, public information officer for Northern Water, dairy farming in the district has been growing in recent years.
“That’s one of the takeaways from today: A lot of this water is staying in agriculture,” he said.
Another water auction is set to take place on Feb. 28 in Ault, east of Fort Collins. The Carlson Family Trust will sell 96 units of C-BT water and 154 acres of land.
This story ran in the Feb. 18 edition of The Aspen Times, the Vail Daily, Summit Daily, SkyHi News.
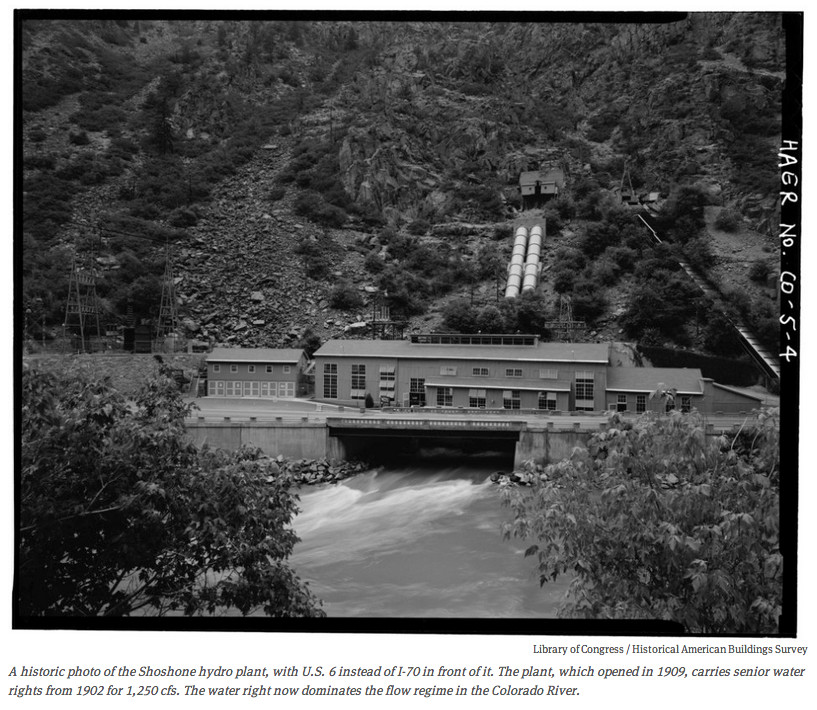
Click the link to read the article on The Grand Junction Daily Sentinel website (Dennis Webb). Here’s an excerpt:
February 16, 2024
A regional effort to purchase major Colorado River water rights in Glenwood Canyon gained major Western Slope support this week when the Ute Water Conservancy District pitched in $2 million toward the cause. The Mesa County entity’s board unanimously approved the contribution on Wednesday. An effort being led by the Colorado River District is seeking to buy water rights associated with the Shoshone hydroelectric power plant in Glenwood Canyon from Xcel Energy for $98.5 million, plus $500,000 to cover Xcel’s transaction costs. The rights include a right to flows of 1,250 cubic feet per second that dates back to 1902, along with a second, 158-cfs right that was appropriated in 1929…
The purchase is intended to ensure the flows continue even if the plant ever closes, through reaching an agreement with the state and pursuing a water court decree that would change the rights so they are not just for hydropower production but are instream flow rights would also ensure the flows continue.
The river district has committed $20 million itself for the purchase, and the Colorado Water Conservation Board recently supported pitching in $20 million in state funds, contingent on approval by the state legislature. The river district also has said it hopes to secure $49 million in federal funding and $10 million from West Slope governments and water entities.

Click the link to read the article on the Water Education Colorado website (Jerd Smith):
February 14, 2024
What’s the best way to protect hundreds of acres of wetlands and streams in Colorado, in the absence of federal rules that once did that work? It’s one of the biggest water issues facing state lawmakers this year.
But as the legislative session kicks into high gear, there is no consensus yet on how to proceed.
Last week, Republican Sen. Barbara Kirkmeyer, introduced Senate Bill 24-127 as a first stab at figuring it out.
At issue is how the U.S. Environmental Protection Agency now defines so-called Waters of the United States, or WOTUS, which determines which waterways and wetlands are protected under the federal Clean Water Act. The definition has been heavily litigated in the nation’s lower courts since the 1980s and has changed dramatically under different presidential administrations.
In May, in Sackett v. EPA the U.S. Supreme Court decided, among other things, that the WOTUS definition that included wetlands adjacent to streams, was too broad.
In its ruling, the court said only those wetlands with a direct surface connection to a stream or permanent body of water, for instance, should be protected.
The court’s decision in the WOTUS case means it will now be up to the state to handle that regulation — including permitting — and enforcement.
Last year limited temporary emergency protections were put in place to give the state time to create a new program.
Water experts said the Sackett decision and the new Colorado permitting program will have far-ranging implications for the environment, as well as agriculture, construction and mining, all major parts of Colorado’s economy.
The Sackett decision may have more impact in semi-arid Western states, where streams don’t run year-round and wetlands often don’t have a direct surface connection to a stream.
The U.S. Geological Survey, for instance, estimates 44% of Colorado’s streams are intermittent, meaning they are sometimes dry, and 24% are ephemeral, meaning they can be dry for months or years and appear only after extraordinary rain or snow. Just 32% of Colorado streams are classified as being perennial, meaning they flow year-round.
Kirkmeyer’s bill would create a new, nine-member commission appointed by the governor that would be housed in the Colorado Department of Natural Resources. The commission would oversee a staff responsible for issuing permits regulating how any activity impacting nearby streams and wetlands, such as road building, home construction and mining, would be conducted to minimize and repair any disturbances the activity caused. It would also sharply limit the kinds of streams and wetlands that could be protected, in keeping with the narrow scope enshrined in law by the U.S. Supreme Court in its Sackett v. EPA decision, Kirkmeyer said.
“These waters are important to all of us,” the Brighton lawmaker said.

The bill is supported by the Colorado Livestock Association, Weld County and the mining giant Freeport-McMoRan. Conservation Colorado and the Sierra Club, and liberal environmental nonprofits, oppose the measure.
Kirkmeyer said she proposed placing the program in the Department of Natural Resources, in part, because the Colorado Department of Public Health Environment’s Water Quality Control Division has been plagued with huge backlogs in processing permits in other programs it oversees.
Her proposal, however, may face an uphill battle in the Democratically controlled legislature. There are also questions about what the state’s new regulatory burden will mean in terms of cost.
A broad-based working group convened last year by the Colorado Department of Public Health and Environment is still analyzing options on how best to address the regulatory gap, and has been briefing lawmakers on possible options. Those options, however, would likely give the regulating job to the Colorado Department of Public Health and Environment and would likely seek to cover a broader class of streams and wetlands than Senate Bill 127 envisions, according to Alex Funk, a member of the working group who is also director of water resources and senior counsel at the Teddy Roosevelt Conservation Partnership.

Funk said he wants to see a bill that is housed within the health department and which offers broader protection for uniquely Colorado waters, such as fens, a kind of high-altitude bog, as well as playa lakes, small shallow pools found on the high plains.
“There is a real opportunity (this session) for Colorado to provide some clarity once and for all with a program that is inclusive of all stakeholders,” Funk said.
“The federal program has been a tennis ball,” he said, referring to the program’s long history of lawsuits over shifting definitions of what constitutes protected wetlands and streams.
“Everyone has agreed that hasn’t worked well. But I think Colorado can get this right.”

Click the link to read the release on the USFS website:
In January 2022, the Forest Service launched a robust, 10-year strategy to address the wildfire crisis in the places where it poses the most immediate threats to communities. The strategy, called “Confronting the Wildfire Crisis: A Strategy for Protecting Communities and Improving Resilience in America’s Forests,” (leer en español) combines a historic investment of congressional funding with years of scientific research and planning into a national effort that will dramatically increase the scale and pace of forest health treatments over the next decade. Through the strategy, the agency will work with states, Tribes and other partners to addresses wildfire risks to critical infrastructure, protect communities, and make forests more resilient.
In early 2023, the USDA Forest Service added 11 additional landscapes. This announcement followed a year of progress in collaborating with partners across 10 initial landscapes to address wildfire risk to infrastructure and communities.
Year 3 – 2024 – nearly $500 million investment expands critical work to reduce wildfire risk.
Agriculture Secretary Tom Vilsack announced on February 20, 2024 that the United States Department of Agriculture is investing nearly $500 million to expand work on the USDA Forest Service’s Wildfire Crisis Strategy to reduce wildfire risk to communities, critical infrastructure and natural resources from the nation’s wildfire crisis.
Approximately $400 million of the Inflation Reduction Act and Bipartisan Infrastructure Law funds will be allocated to ongoing efforts on the 21 priority landscapes across the West. This work is beginning to reduce wildfire risk for some 550 communities, 2,500 miles of power lines and 1,800 watersheds.
An additional $100 million will be allocated through a collaborative process with tribes, communities, and partners as part of new agency-established program – the Collaborative Wildfire Risk Reduction Program. Inspired by past examples and the success of programs such as the Collaborative Forest Landscape Restoration Program, the new Collaborative Wildfire Risk Reduction Program expands work in high-risk wildfire areas outside the 21 priority landscapes.
These landscapes and efforts to expand the work under the Wildfire Crisis Strategy are determined using scientific research and analysis that considers the likelihood that an ignition could expose homes, communities, infrastructure, and natural resources to wildfire.
In 2023, the Forest Service and a wide-range of partners, communities, and tribes treated more than 4.3 million acres of hazardous fuels, including nearly two million acres of prescribed burning, on National Forest System lands across the nation – both are record highs in the agency’s 119-year history and over a million acres more accomplished than the previous year.


Click the link to go to the Blue River Watershed Group website to access the plan:
BRWG has partnered with Trout Unlimited to create an Integrated Water Management Plan (IWMP) for the Blue River Watershed, that will provide a comprehensive roadmap for future water use, restoration projects, and other solutions to the issues that currently threaten the health of the watershed. The IWMP will guide the strategic direction of BRWG for the next several years through ongoing scientific research and resource evaluation, planning of restoration projects and acquiring funds to sustain those projects, implementation of projects that have secured funding as well as evaluating and maintaining completed projects.
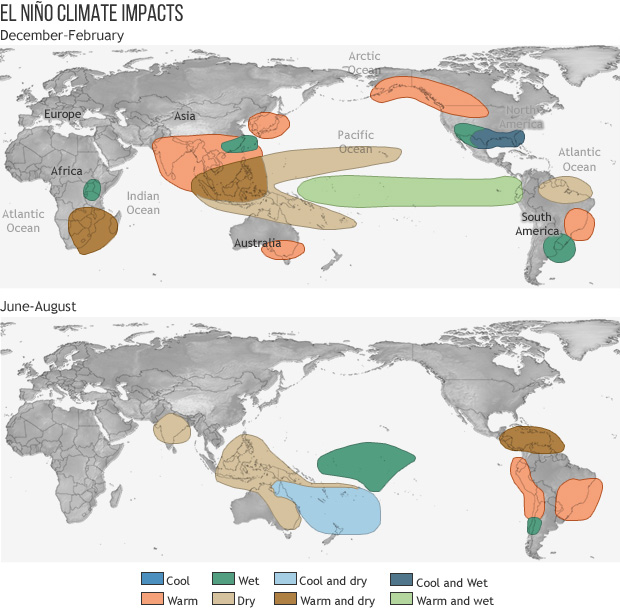