Through the years, [Carol Oswald] Yoakum acquired 900 acres of farmland north of Longmont…A couple hundred acres went for a 20-home subdivision, 575 acres were put into a conservation easement with Boulder County so the views [of Long’s Peak] she lived with for 57 years would always be protected. She retained 175 acres…Now 91, Yoakum sold Meadow Green Farm in March 2023. On Wednesday, the last links to the property — 90 shares of Colorado-Big Thompson water — were auctioned at Boulder County Fairgrounds in Longmont. Fifteen buyers paid an average of $52,481 per share, or $4.72 million, making the water that once nourished the farm as valuable as the land itself.
The relatively rare water auction within Northern Water boundaries was the first of two this month that will ultimately see 186 shares of Colorado-Big Thompson water transition to new hands and new uses. On Wednesday, Yoakum’s 90 shares went to ditch companies, developers, farmers, ranchers and one municipality that will use it to add to their water holdings, supply water to new subdivisions and irrigate some farmland…Michael Markel of Markel Homes bought five shares at $49,500 each (including a 10% seller’s fee that goes to the auction house) to help provide water to homes in a 420-unit subdivision in Lafayette. “This will just cover a fraction” of the project, Markel said. Although the price per share opened at a high of $72,000, most shares sold for $46,000, plus seller’s fee. Water was sold in one to five units but could be combined for more shares. The largest share of water, 12 units, sold for $46,000 per share plus fees…Sterling Zehnder, who farms about 110 acres near Kersey, bought four shares at $53,000 each for irrigation.
On Feb. 28, the Carlson Family Trust will auction its 154-acre family farm in Eaton and 96 shares of Colorado-Big Thompson water. Markel said he may be among the bidders at that sale, too.
To buy Colorado-Big Thompson water, which is owned by the U.S. Bureau of Reclamation and jointly operated and managed by Northern Water, a buyer has to represent a municipality or already own some shares; the water has to be used within district boundaries; and it can’t be the sole source of water. “C-BT is intended to supplement” an existing water supply, said Jeff Stahla, spokesperson for Northern Water.
The Federal Energy Regulatory Commission announced a new policy requiring that any energy project seeking to build on tribal land must get the tribe’s approval before it will permit the project.
Federal officials Thursday denied preliminary permits for multiple pumped storage hydroelectric projects proposed on the Navajo Nation that would have required vast sums of water from limited groundwater aquifers and the declining Colorado River, citing a lack of support from tribal communities.
In the order, the Federal Energy Regulatory Commission announced it was implementing a new policy requiring that any project proposed on all tribal land must gain the respective tribe’s consent to be approved, a move that local tribes, opposed to the proposed hydroelectric projects, had been calling for. The decisions pave the way for increased tribal sovereignty in energy-related projects seeking federal approval across the country.
“This is a federal commission acknowledging tribal sovereignty,” George Hardeen, a spokesman for the Navajo Nation president’s office, said. “If a company wants to do business on the Navajo Nation, it, of course, needs to talk to and get the approval of the Navajo Nation. And in the eyes of FERC, that has not yet happened.”
The Navajo Nation opposed the preliminary permits for the projects through motions to intervene that were submitted by its Department of Justice in 2022 and 2023.
Future projects “should work closely with Tribal stakeholders prior to filing,” to FERC, agency officials wrote in their decision. Before this new policy, the agency had “applied the general policy of granting permits even where issues were raised about potential project impacts without a distinction for projects on Tribal lands opposed by Tribes.”
The decision is the latest setback for the development of hydropower in the U.S. While many see electricity generated by turbines in dams as a key source of renewable energy, a growing body of scientific evidence has found that the reservoirs behind dams are a significant source of carbon emissions—particularly methane, a potent greenhouse gas that’s roughly 80 times more effective at warming the atmosphere than carbon dioxide over 20 years. Hydroelectric dams also block fish from traveling upstream to their spawning grounds, which studies have long shown interfere with their ability to reproduce.
Hydropower dams have had major effects on rivers across the country, including the Colorado River and its tributaries, where four native fish species are now endangered. Such issues have led to the removal of dams along some other river systems.
Pumped hydroelectric generation illustrated. Graphic via The Mountain Town News
Pumped storage has been seen by some in the industry as a way to keep hydropower a relevant part of the renewable energy transition, as they don’t always require a river or dam to function. However, environmental problems, and opposition, remain. The projects FERC denied had garnered widespread opposition from the Navajo Nation and Indigenous and environmental groups over the lack of consultation developers offered and the impacts they would have on cultural sites, endangered species and water resources in the area.
In its motion to FERC for a project on the western part of the Navajo Nation near Page, Arizona, the tribe’s Department of Justice wrote that “meaningful consultation” between the company and the tribal government, including chapter administrations and local communities, was “unclear.”
The department also stated that the project might impact the tribe’s water rights or its use of water from the Colorado River system.
“The Navajo Nation’s interests would be directly affected by the outcome of this proceeding,” the department wrote.
Graphic credit: Jonathan P. Thompson/The Land Desk
Daryn Melvin, a Hopi Tribal member who works as the Grand Canyon manager with the Grand Canyon Trust, which opposed the projects, said the hydro projects are “just the latest in a number of developments that were threatening the area in places that are of particular importance to Native communities.” The impacts of coal and uranium mining persist to this day, he said, and local tribes and environmental groups pushed to find new ways to protect the area, including reform in the FERC permitting process.
In particular, a proposal from Nature and People First to build three pumped storage hydropower projects across 40 linear miles on Black Mesa drew intense scrutiny. Project opponents say the developer never reached out to locals about the project and attempted to pit communities in the area against one another. Representatives of Nature and People First did not respond to a request for comment in time for publication.
Nature and People First states on its website that Chilchinbeto Chapter, where one of the projects on Black Mesa would be located, supported the proposal because it would create jobs and economic opportunities. The company filed resolutions to FERC from the Western Navajo Agency Council and the chapters of Ts’ah Bii Kin and Oljato that supported the project.
How Pumped Storage Hydropower Works
Over a dozen hydro projects have been proposed in recent years on or near the Navajo Nation for pumped storage—a nearly century-old technology experiencing a surge of interest as the U.S. looks for ways to store energy from renewable sources as it pivots away from fossil fuel-generated electricity.
Pumped storage can help store electricity from wind and solar energy projects for when it is needed and serves as an alternative to utility-scale lithium-ion batteries to bank renewable energy.
Graphic credit: Inside Climate News
The projects use two water reservoirs, one above the other. Water is pumped uphill to the higher reservoir at night when energy costs are low, then sent back down through electricity-generating turbines when energy demand peaks or renewable resources can’t generate electricity, helping to ensure grid stability during system-stressing events like record-hot summers.
But to work, they need certain geographic characteristics, namely a rapid change in elevation over a short distance, leading many of the projects to be proposed in the Mountain West. But they also need water, and a lot of it, which is something lacking in many arid Western communities.
That’s led to pushback across the region as rural residentslook to protect their limited ground- and surface water supplies from diversion to pumped storage projects and, potentially, further depletion.
Impacts to Local Water Supplies
If all of the proposed pumped storage projects near the Navajo Nation were built, it would require over 2 million acre feet of water. That’s enough water for over 5 million homes in Arizona and about the same amount of water that federal officials are currently allowing the state to take from the Colorado River in recent drought conditions.
If developed, the projects would further impact flows on the Colorado River and its tributaries, as well as the levels of local aquifers that serve tribal communities. The Hopi Tribe, for example, is completely reliant on the same groundwater sources some of these hydro projects would likely pull from.
“Water scarcity is a simple fact of our region,” said Taylor McKinnon, the Southwest director for the Center for Biological Diversity, which opposed the projects. “Their failure to see that caused them to run headlong into the problem of aridity.”
The Coconino Aquifer. The fundamental law of the Navajo (Dine) people believes water to be one of the four sacred elements that was put forth by Diyin dine’e’ (Deities) as a source of life. Water is part of prayer in the Hozho ceremonies for healing. All human and all life on Nahasdzaan (Mother Earth) have a degree of water in their system. Water is precious to native people – it is life. Credit: Dine’e’ C.A.R.E.
The Black Mesa projects proposed pulling groundwater from the Coconino aquifer—colloquially known as the C aquifer—which provides the base flows for the Little Colorado River, McKinnon said. “That water comes out of the earth in Blue Springs, and it creates a river,” he said, noting that the flow was critical to an endangered fish. “That river is where the last source population of humpback chub in the world live.”
Thursday’s ruling, for now, puts an end to seven of the proposed projects in the region that would have collectively required around 1.6 million acre feet of water. “This is an agency actually stepping forward and saying, ‘we have the authority to do the right thing and we’re going to do the right thing,’” McKinnon said. “We applaud that.”
The projects have also received pushback from the Hopi Tribe, whose land is adjacent to the Navajo Nation. The projects on Black Mesa not only threatened water sources for the Hopi, but also endangered species and cultural resources, like ancestral trails and shrines, said Stewart B. Koyiyumptewa, tribal historic preservation officer for the tribe.
“We still have a vested interest in our cultural resources left by our ancestors throughout the landscape,” Koyiyumptewa said.
FERC has a policy statement for consulting with federally recognized tribes that preexisted Thursday’s order. While the commission recognizes the government-to-government relationships the U.S. holds with sovereign tribes, how it notifies tribes about proposed projects is dependent on laws, like the National Historic Preservation Act.
For Koyiyumptewa, this leaves tribes cut off from key information about proposals—especially when projects are not on the tribe’s land, but could impact it.
“We weren’t given the opportunity to provide opposition,” he said of the early process for the Black Mesa projects.
“Today the honey-colored hills that flank the northwestern mountains derive their hue not from the rich and useful bunchgrass and wheatgrass which once covered them, but from the inferior cheat which has replaced these native grasses. … The cause of the substitution is overgrazing. When the too-great herds and flocks chewed and trampled the hide off the foothills, something had to cover the raw eroding earth. Cheat did.”—Aldo Leopold, Sand County Almanac
For a couple years when I was a teenager, my dad lived in a house near Lebanon, a tiny settlement about ten miles north of Cortez, Colorado. The front porch afforded an expansive view of much of the Montezuma Valley, a quilt of pastures and hayfields and residential development amid patches of sagebrush and piñon-juniper set against the backdrop of Ute Mountain and Mesa Verde.
La Plata Mountains from the Great Sage Plain with historical Montezuma County apple orchard in the foreground.
On hot, dry summer afternoons I liked to sit on the porch and gaze upon the valley, waiting for the inevitable plume of smoke. It always started as a white-gray wisp wafting into the cloudless blue sky, and sometimes would quickly die down. More often than not, however, the wisp grew into a thick, billowing, dark cloud with glowing orange flames at its base. And then, maybe ten minutes later, the faint sound of sirens would ring out as the volunteer fire fighters raced to the scene hoping to save houses and barns from the expanding inferno.
Almost every one of these fires was sparked intentionally — a landowner burning their fields against better judgment. And the target of the blaze was almost always the same, an innocent-looking species that is so nasty and pernicious that it can drive folks to risk burning down their own property to get rid of it: cheatgrass, aka Bromus tectorum, a Eurasian annual that invaded North America in the 1800s and has since become one of the continent’s most detested, ubiquitous, and stubborn invasive species.
The news hook, unfortunately, is not the discovery of a foolproof method to eradicate cheatgrass (burning it doesn’t work, by the way). Rather it’s a new paper on cheatgrass that compiles a collection of scientific studies into a comprehensive, extensive yet digestible, volume: “Cheatgrass invasions: History, causes, consequences, and solutions,” by Erik M. Molvar et al. and put out by the Western Watersheds Project.
Cheatgrass’s invasion of North America echoed Euro-American settler-colonization. The first continent’s earliest record of the grass was made in Pennsylvania in 1790. It popped up in Nevada, Utah, Colorado, and Wyoming in the 1800s, in the wake of mining rushes and subsequent influxes of cattle and sheep to feed the burgeoning settler population. Cheatgrass was carried westward by wagons and railroads where it quickly took over land disturbed by farming and, especially, livestock grazing. Sometimes livestock operators would burn sagebrush and then encourage cheatgrass to replace it since in early spring the green grass makes for nutritious forage. By early summer, though, it’s unpalatable, and the dry seeds drive folks to arson.
By the 1930s cheatgrass, aided by a massive ground invasion of livestock grazing, had invaded much of the West. And further land disturbance in later decades facilitated the spread of the invasive species, which competes with and often displaces native bunch-grasses. In what’s known as the livestock-cheatgrass-fire cycle, grazing facilitates an initial cheatgrass invasion. The flammable grass then burns, taking out native shrubs such as sagebrush, leaving a cheatgrass mono-crop in their place. This destroys the sagebrush ecosystem and harms all the species that depend upon it, making cheatgrass “one of the most significant ecological crises facing land managers in the arid West,” according to the paper. Climate change is expected to make it worse.
It’s all rather depressing, to be honest. And even worse is that there’s no easy way to rid the West of this malignant grass. Various methods have been tried, from burning the stuff to chemical herbicides to amending the soil to even hand-pulling it. None have been successful in the long-term. Some researchers have suggested inoculating cheatgrass with fungi and bacterium, such as black-fingers-of-death. But they could have dire unintended effects.
Yet it’s not all hopeless. Reducing livestock grazing in areas that have yet to be overrun by cheatgrass has kept a full-invasion at bay, and ceasing grazing altogether in cheatgrass-dominant places has allowed native grasses to recover. Avoiding soil disturbance of any form and preserving the cryptobiotic crusts can help fend off new cheatgrass invasions. The authors of the paper sum it up nicely:
“The key to combating weed invasions is to prevent the types of conditions and land uses that confer advantages to weed species over native plants, and to restore native plant associations that are resilient and resistant to future weed invasion.”
Year-end real estate market reports are rolling in and, generally, it looks like more of the same: Homes are getting more expensive and further out of reach of the average income earner. And relatively high interest rates don’t seem to be dimming the trend, at least in most places.
Take La Plata County in southwestern Colorado, home of Durango and of an alarming increase in home prices across the entirety of its 1,700 square miles over the last several years. In 2023, median sales prices shot up once again — by as much as 26.7% in one area — relative to 2022. The typical in-town Durango home will now cost you about $780,000, with the median priced condo/townhome selling for $529,000. The high high-end is even scarier: Homes in Purgatory resort area were selling for about $1.1 million in 2021; now they’re fetching $2.1 million.
Perhaps most alarming is the way once-affordable areas have also become overpriced. As recently as 2018 the lowest priced house in the county sold for $48,000; last year it was three times that much. While the $150k or so sale would be within the price range of, say, a Durango school teacher, it is an outlier: I look at the listings constantly and rarely see anything under $200,000. The exception might be a trailer in a park, which is great, except that you need to add a $600-$1,200/month lot fee to the mortgage payment, which can easily push affordable housing into the unaffordable zone.
The once lofty institution known as National Geographic recently weighed in on the growing visitation to national parks issue by dispensing some advice to its 9.5 million readers: “National parks overcrowded?” asks the headline. “Visit a national forest.”
Ugh.
Some national parks clearly are overflowing with visitors. And these crowds may diminish the experience for some of these visitors (others may be just fine with it). And the more people you have, presumably the more impacts they will bring.
But shuffling them onto nearby public lands isn’t the answer. All that’s doing is moving the people from places that have infrastructure, roads, and rangers designed to handle the crowds and limit their impacts, to places that lack this sort of infrastructure. Instead of being confined to paved roads, paths, viewpoints, visitors centers, and bathrooms, the masses will scatter themselves across fragile terrain with no rangers to guide them back to the trails.
I’m not saying folks shouldn’t go to the national forests or that they should be kept secret — as if that were even possible. It’s just that National Geographic should think about the potential impacts of these sorts of articles and who is benefiting from them. The parks won’t be better off, nor will the crowds be noticeably smaller. The forests won’t be better off. And probably the would-be national park visitor that headed to the forest to escape the crowds won’t benefit either. There is, after all, a reason so many people go to national parks (they have iconic landforms and infrastructure and interpretive signs and clean toilets and gift shops). They’d only be disappointed by the forests. So let them go to the parks — crowded or not — and leave the forests alone.
📖 Reading Room … 🧐
… or Listening Room in this case. If you liked Tuesday’s Messing with Maps dispatch, you’ll probably also like The Magic City’s podcast delving into the mysteries of Durango’s founding. Even those most versed in Colorado history will learn something and it’s a captivating listen, besides. Check it out on Spotify or at The Magic City.
Parting Shot
Henry Mountains. Photo credit: Jonathan P. Thompson
Plastic pollution is one of the most serious environmental crises facing the world today. Between 1950 and 2015, over 90% of plastics were landfilled, incinerated, or leaked into the environment. Plastic waste is ubiquitous—from our rivers, lakes, and oceans to roadways and coastlines. It is in “the air we breathe, the food we eat, and the water we drink.” One study estimates that humans ingest up to five grams or the equivalent of one credit card worth of plastic per week. Some of the largest oil and gas companies are among the 20 petrochemical companies responsible for more than half of all single-use plastics generated globally. ExxonMobil, for example, is the world’s top producer of single-use plastic polymers.
Underpinning this plastic waste crisis is a decades-long campaign of fraud and deception about the recyclability of plastics. Despite their long-standing knowledge that recycling plastic is neither technically nor economically viable, petrochemical companies—independently and through their industry trade associations and front groups—have engaged in fraudulent marketing and public education campaigns designed to mislead the public about the viability of plastic recycling as a solution to plastic waste. These efforts have effectively protected and expanded plastic markets, while stalling legislative or regulatory action that would meaningfully address plastic waste and pollution. Fossil fuel and other petrochemical companies have used the false promise of plastic recycling to exponentially increase virgin plastic production over the last six decades, creating and perpetuating the global plastic waste crisis and imposing significant costs on communities that are left to pay for the consequences.
Big Oil and the plastics industry—which includes petrochemical companies, their trade associations, and the front groups that represent their interests—should be held accountable for their campaign of deception much like the producers of tobacco, opioids, and toxic chemicals that engaged in similar schemes. This report lays the foundation for such a claim.
• Part II provides an overview of the well-established technical and economic limitations of plastic recycling.
• Part III describes how—in response to repeated waves of public backlash against plastic waste and subsequent threats of regulation—the plastics industry has “sold” plastic recycling to the American public to sell plastic.
• Part IV outlines the evidence of the plastics industry’s fraudulent and deceptive campaigns, which are more fully detailed in Appendix C.
Petrochemical companies and the plastics industry should be held liable for their coordinated campaign of deception and the resulting harms that communities are now facing. True accountability will put an end to the industry’s fraud of plastic recycling and open the door to real solutions to the plastic waste crisis that are currently out of reach.
Biological soil crusts, sometimes called cryptobiotic soil crusts, are an important part of arid and semi-arid ecosystems throughout the world, including those in Glen Canyon National Recreation Area. Crypto means hidden, while biota means life. These crusts are composed primarily of very small organisms that cannot be seen with the naked eye. Well-developed cryptobiotic soil crust is often much darker than the soil it is on top of, and has a sponge-like look, with bumps and small “pinnacles.”. The extent of crust development depends on soil structure, texture, and chemistry as well as elevation and microclimate. Photo credit: Glen Canyon National Recreation Area
Click the link to read “Dust, snow, and diminishing albedo: Spring dust storms further shrink the snow ‘reservoir’ that feeds the Colorado River” on The Land Desk website (Jonathan P. Thompson):
May 7, 2021
“Most of us are poor now, like I am. Many of them blame John Collier, who made us reduce our flocks and herds because there was not enough grass for all. But I think the true reason is a change in the climate. When I was a young man this whole country was covered with tall grass. We had rains enough in summer to keep it alive and growing. Now the rains do not come and the grass dies. There are fewer sheep and horses now than when our family claimed this valley, yet all you can see is sand. The grass is gone. All we need to be rich again is rain.” — Navajo elder Hoskannini-Begay, who lived on Naatsis’áán, or Navajo Mountain, near the confluence of the San Juan and Colorado Rivers, to Charles Kelly in 1945
The McElmo Dome, Mesa Verde, and Ute Mountain, obscured by dust. Heavily grazed lands are in the foreground. The view was blotted out altogether later that day. Jonathan P. Thompson photo.
It’s springtime in the Southwest, which means that on four days out of five a dry wind blows incessantly, tossing hats and untethered tents high into the air. The Mistral of southern France is said to drive people—and even horses—insane. The Four Corners Country’s April and May gusts are every bit as maddening, sending humans into paroxysms of mental distress.
And if the wind doesn’t drive you to the brink, then the dust carried by that wind will—dust that blots out desert views, coats your dinner with teeth-grinding grit, and somehow manages to get into every nook and cranny imaginable. Worse, that stuff will eventually fall on what remains of the snow in the mountains, coating the surface with a reddish-brown tinge that kills the snow’s albedo (not libido, silly, albedo). That speeds up snowmelt, which has ripple effects across the ecosystem and water supplies in the lowlands, which, in turn, dries out and frees up more dust for the wind’s taking.
During some years the “dust events” manifest as just that, distinct events during which the wind kicks up, followed by a growing volume of dust in the air, followed by a thick layer of dust on the surface of the snow. Dust storm feels too dramatic a phrase to describe the phenomenon. The incidents in the Four Corners country usually don’t involve a wall of airborne sand, thousands of feet tall, rushing across the desert and gobbling up everything in its path, as sometimes happens further south in the Phoenix area. Dust event, on the other hand, feels too clinical. I prefer aeolian—or windborne—dust cloud, since its root is the Ancient Greek god of wind, Aeolus.
These episodes are not uncommon in these parts, happening several times a year, most often in late winter and early spring. “Our party experienced a violent windstorm when we were several miles above the mouth of Piute Creek,” wrote Hugh D. Miser in a 1924 report on a trip down the San Juan River in Utah on 16-foot boats. “It blew in gusts and picked up sand and fine yellow dust, which were carried up into the air for hundreds if not thousands of feet.” Eight years later, during the severe drought of the early 1930s, newspapers reported that a good two inches of red, dust-infused snow fell on Durango. In that case, the dust even may have “seeded” the clouds, giving something around which the snowflakes could form.
Story from the Feb. 5, 1932, Steamboat Pilot.
All that dust on (or in) the snow brings about subtle but significant changes by throwing the snowpack’s albedo out of whack. “Albedo is a non-dimensional, unitless quantity that indicates how well a surface reflects solar energy,” notes the National Snow and Ice Data Center. “Albedo varies between 0 and 1. Albedo commonly refers to the ‘whiteness’ of a surface, with 0 meaning black and 1 meaning white.” If a surface’s albedo is zero, or black, then it absorbs all of the solar energy. If it is one, or totally white, it absorbs none of the solar energy, or reflects all of it. When dark-colored dust (or ash, or carbon, or what have you) coats the snow, it reduces the albedo, causing the snow surface to absorb more solar energy, thereby melting the snow more quickly.
Dust on snow in the San Juans. Photo credit Chris Landry.
In 2003 a group of snow-focused scientists founded the Center for Snow and Avalanche Studies to study the dust-on-snow phenomenon in the San Juan Mountains and to better understand its long-term effects. The San Juan Mountain snowpack is considered to be a giant, natural reservoir that stores up vast amounts of water in the form of snow during the winter months, slowly releasing it to flow down to the arid, surrounding lands in the spring. Most of the snowmelt ends up in the Colorado River watershed, but the San Juan Mountains also contain headwaters for the Rio Grande.
Those who use the water, whether they are irrigators or river rafters or fish, want an abundant but slow-melting snowpack. Dust on snow speeds up the snowmelt, disrupting alpine flora phenology,1 or the natural calendar that tells plants when to bloom and so forth, and pushing the spring runoff earlier into the year. Reduced albedo enhances evapotranspiration and snow sublimation2, thereby reducing the amount of water that goes into the streams and rivers. Aeolian dust on the snow, alone, has pushed the peak of spring runoff of the Colorado River watershed up by three weeks, when compared to the period prior to the 1850s, and it has also reduced the total runoff volume.
These aeolian dust events are natural and have probably been taking place every spring since the end of the Pleistocene era and the retreat, some 12,000 years ago, of the glaciers that carved many of the region’s valleys. Maybe the dust events occurred during the last ice age and contributed to the melting of the glaciers, which was mainly caused by global warming resulting from a buildup of carbon dioxide in the atmosphere. That, too, was natural. But just as human activity is again causing an increase in carbon and a warming climate, so, too, has human activity exacerbated the aeolian dust cloud phenomenon.
Map of the greater Colorado River Basin which encompasses the Colorado Plateau. Credit: GotBooks.MiraCosta.edu
By examining the sediment that had built up over nearly six millennia at the bottom of alpine lakes in the San Juan Mountains, researchers in 20083 concluded that most, if not all, of the dust deposited on the San Juan Mountain snows is from the Colorado Plateau, not Asia or other distant lands, as has been hypothesized in the past. And they found that dust events have been occurring for thousands of years but picked up significantly beginning about a century and a half ago, coinciding with the white settler-colonist influx of the mid-1800s and peaking in the first few decades of the twentieth century, when volumes of dust were five times higher than they were prior to colonization. The timing leaves little doubt regarding the cause of the uptick in dust: a combination of the newcomers’ land-disturbing ways, which include mining, development, tilling for farming, logging, and, perhaps most dust-raising of all, cattle grazing, which has drastically altered the landscape of the Colorado Plateau.
Cattle have their evening meal in the San Luis Valley. Credit: Jerd Smith
The cattle and sheep ate the native grasses and trampled the fragile soil, making way for non-native grasses to invade and preclude the return of the native vegetation, while also encouraging gulley-forming erosion. Where once ran braided, intermittent streams along wide, flat, sandy beds, now there are deep channels. Streambeds are choked with cheatgrass and other invasive species. These gullied arroyos are so common in the West—the Rio Puerco in northern New Mexico offers one of the most striking examples—that many observers assume that it is the “natural” state, and that they’ve always looked that way. Call it normalized degradation.
The Rio Puerco, an ephemeral tributary of the Rio Grande, west of Albuquerque, crossing the eastern edge of the Tohajiilee Indian Reservation; December 2016. By Dicklyon – Own work, CC BY-SA 4.0, https://commons.wikimedia.org/w/index.php?curid=54602926
Cattle hooves will also wreck the fragile cryptobiotic crust that is critical to the desert ecosystem, and which, as renowned cryptobiotic crust researcher Jayne Belnap put it, holds “the place in place.” Cryptobiotic crust, sometimes known as cryptogamic soil, is ubiquitous, or once was, in most of southeastern Utah. At first glance it looks just like, well, dirt, only with a dark-brown-to-black hue that resembles desert varnish. Bend down and look more closely, however, and you’ll see a miniature, living world—a symbiotic mingling of cyanobacteria, lichen, and mosses—which is particularly noticeable when the crust is wet. The cyanobacteria are made up of filaments wrapped in sheaths. Writes Belnap: “This sheath material sticks to surfaces such as rock or soil particles, forming an intricate webbing of fibers in the soil. In this way, loose soil particles are joined together, and otherwise unstable and highly erosion-prone surfaces become resistant to both wind and water erosion.” And when the crust is destroyed, it leaves those same soils vulnerable to erosion and to the types of winds that scrape across the region every spring.
And the damage is, indeed, irreparable. Once wrecked, cryptobiotic crust may take decades, even centuries, to fully recover. In 2005 Belnap published a paper4 on the impacts of decades of grazing on soils in southeastern Utah. She and her co-researcher ventured into the Needles District of Canyonlands National Park and compared an area that had been grazed from the 1880s until 1974 with Virginia Park, an area where an impassible cliff kept cattle at bay, and which is now a “relict area” shut off to people entirely, save for researchers with a light touch. Belnap’s findings are disturbing. Even 30 years after the cattle had been removed from the historically grazed site, the land had not recovered. The cyanobacteria were distributed spottily, the lichen and moss were only beginning to come back, nutrients and organic material were more sparse than in the ungrazed area, and the soil remains far less stable, which means it more easily can get picked up by the wind and carried to the snow in the San Juan Mountains. Also troubling is the difficulty the researchers had in finding plots of land that had never seen grazing at all, even in a national park. Somehow the cowboys of yore were able to squeeze the cows and their attendant effects into just about every corner of the region.
Sonoran Desert. Credit: George Gentry/USFWS
Back in 1965, James Rodney Hastings and Raymond M. Turner compared historic photographs of a section of Sonoran Desert with modern ones and determined that cattle grazing in the late nineteenth century had caused a “shift in the regional vegetation of an order so striking that it might be better associated with the oscillations of Pleistocene time than with the ‘stable’ present.”5 If we are currently living in the Anthropocene, then an appropriate subset might be the Bovineiferous period or, more appropriate still, the Beefocene.
Clearly cattle are not the only culprit. ATVs, mountain bikes, cars, and bulldozers can wreck cryptobiotic crust and mobilize dust. Chaining huge swaths of juniper forest to make way for forage or even sagebrush is hugely destructive and dusty. Before each of the tens of thousands of oil and gas wells were drilled across the San Juan Basin, more than an acre of land was scraped clean of all vegetation, top soil, cacti, sagebrush, and even centuries-old juniper trees. Every new house or hotel built on Moab’s, Durango’s, or Farmington’s fringe stirs up dust. Springtime tilling of corn, bean, sunflower, and alfalfa fields kick up huge amounts of dust. Even a single human backpacker trodding through the P-J forest in hiking boots can crush and break up the living soil, liberating the dust underneath for the wind’s taking.
And just as dust on snow can exacerbate aridity, so too can aridity exacerbate the dust problem. The winter of 2013 was one of the skimpiest snow years on record in the Four Corners Country, parching the Colorado Plateau and turning what should have been moist soils and muddy lands into dust patches. The March winds lifted the earth up into the air and carried it across the mesas and canyons, leading to a number of severe dust events. In Durango the dust was so thick that it fell with rain as a gritty red slime, coating cars and buildings and just about everything else; the Durango Herald ran a woe-filled article about a window washer whose work was destroyed by the storm, forcing him to start all over again. Another dust event a week later would whip up a nasty wildfire near Farmington and contribute to a fatal car crash. The dust ended up on top of what snow was left in the San Juans, reducing rivers and streams to a trickle that summer.
Westwide SNOTEL basin-filled map April 29, 2021 via the NRCS.
This water year [2021]—taken in isolation—hasn’t been quite as meagre, moisture-wise, as 2013 was, meaning a little more of the place seems to be staying in place, despite the maddening winds. But the effects of 20-plus years of aridification and warm temperatures has left the region unusually dry, and the relentless wind has filled the air with a constant, mid-level dust-haze, which thickens during especially gusty times.
A few weeks ago I unwittingly followed the aeolian dust cloud from northern Arizona into southeastern Utah, where I watched Ute Mountain and the Abajos slowly vanish behind a sepia-toned gauze that seemed to hang from the otherwise clear sky. A few days later I drove over Red Mountain Pass and pulled over to inspect the snowpack. A dusting of new snow had fallen atop the dust layer, partially covering it up for a brief moment. But it was springtime in the San Juans, another dry year in the unrelenting string of dry years, which meant that another dust cloud would arrive before long.
It felt strange but also revelatory to be in the thick of this big cycle of soil disturbance, aeolian dust events, reduced albedo, faster-melting snow, diminished river flows; to be experiencing the interconnectedness of the region, the intimate link between desert and mountains, in real time.
Like so many hikes close to Boulder, the hike over Arapahoe Pass is slightly jarring for the first couple hours. It takes 45 minutes to go from the Tesla-bespeckled, yoga pants-wielding city to a view that looks completely untouched by people. To the right of this extraordinary view is the Arapahoe Glacier, which previously covered much of the area but is melting so fast it was claimed by the city of Boulder as an official municipal water source. Though it will be hard to restore the glacier, its looming absence serves as a reminder to do our absolute best to preserve the rest of the area, as we have already changed so much of the landscape.
Senator Cheri Steinmetz (R-Lingle) chairs an official Senate Agriculture, State and Public Lands and Water Resources Committee hearing at the Wyoming Capitol in February 2024. (Mike Koshmrl/WyoFile)
Sen. Cheri Steinmetz was clear: The committee chairwoman did not want to hear prevailing viewpoints about carbon dioxide and climate change.
Those who accept what climate scientists have known for decades — that the planet is warming because of human-caused CO2emissions — need not speak up, the Lingle Republican said.
“If proponents of a different viewpoint wish to express that,” Steinmetz said, “they are free to have a hearing of their own.”
That left room for only alternative theories, those that deny or discount the world-changing effect carbon dioxide and other greenhouse gasses are having on human beings, other species and the climatic conditions of the planet.
Purported experts invited to testify, and other speakers, including each lawmaker who spoke, expressed either disbelief that climate change was happening, or a belief that it is inconsequential, even beneficial.
Speakers with the CO2 Coalition testify at a Senate Agriculture, State and Public Lands and Water Resources Committee hearing. The advocacy group is known for spreading disproven claims about climate change. (Ashton J. Hacke/WyoFile)
Flanking Steinmetz in the Wyoming Capitol extension building auditorium were four members of the Senate Agriculture, State and Public Lands and Water Resources Committee: Sens. Dan Laursen (R-Powell), John Kolb (R-Rock Springs), Tim French (R-Powell) and Bob Ide (R-Casper).
They nodded and smiled as they listened to presentations from speakers brought in from the CO2Coalition. The group touted its theory — discredited by the Intergovernmental Panel on Climate Change and other climate scientists — that loading more carbon dioxide into the atmosphere will not tip the planet’s climate into unlivable conditions.
William Happer, a physicist and co-founder of the CO2 Coalition, told lawmakers and attendees that those who believe climate science have been brainwashed.
“I don’t know how you deprogram people from a cult,” Happer said, “it’s really sort of a cult.”
Pamphlets distributed by an advocacy group, the CO2 Coalition, were distributed at a Wyoming Legislature hearing this week. On the front, the pamphlet declares: “CO2 should be celebrated, not captured.” (Ashton J. Hacke/WyoFile)
But the science is clear. In fact, human-caused climate change has pushed Wyoming’s annual mean temperature upward by 2.2 degrees Fahrenheit from 1920 to 2020, according to National Oceanic and Atmospheric Administration data. Wyoming’s highest elevations are warming even faster, already changing the seasonal pulse of water flows that the state’s economy is built around.
Climate change, which is already changing people’s lives in Wyoming, will have a dramatic effect on temperature regimes all across the state, according to University of Wyoming climate scientist Bryan Shuman. A place like Jackson, he said, will go from virtually never touching 90 degrees to getting that warm with regularity.
“On the track we’re on by 2050, [Jackson] will pretty easily start to have about two weeks of 90 degree weather,” said Shuman, one of the lead authors of the Greater Yellowstone Climate Assessment. “By 2100, depending on whether we mitigate carbon emissions or not, [Jackson] either ends up staying around that two-week level or it gets up to about two months of 90 degree weather.”
Deniers’ road trip
The CO2Coalition’s participation at the legislative hearing was part of a three-stop engagement in Wyoming. The Wyoming Republican Party teamed up with conservative group Turning Point USA to host speakers from the coalition for a series of events this week in Gillette, Cheyenne and at the University of Wyoming in Laramie.
Laramie resident Laurie Richmond attended the UW event and said she’s very concerned about Gov. Mark Gordon’s policy goal to capture and store more carbon than is emitted.
The governor, Richmond told WyoFile, won’t even give the CO2Coalition speakers “the time of day” — and she wasn’t happy about it.
Richmond worried about the economic burden of current state policies that attempt to force carbon capture retrofits at Wyoming coal-fired power plants. So far, Wyoming ratepayers are being forced to cover more than $3 million in costs for utilities to study the feasibility of adding carbon capture at five coal-burning units in the state — studies that were mandated by the Wyoming Legislature. If the utilities actually implement carbon capture at the coal plants, Black Hills Energy customers in Wyoming could be tapped for up to $1 billion, and Rocky Mountain Power’s Wyoming customers could pay more than $2 billion, according to preliminary filings with the state.
William Happer, co-founder and Chairman of the CO2 Coalition, in the red tie, arrives at the University of Wyoming in Laramie Feb. 14, 2024. (Dustin Bleizeffer)
“This is all about government grifting,” Richmond said. “Can we really afford $1,000 electrical bills every month? So Gov. Gordon’s got a problem coming.”
In the Capitol, Steinmetz said at the onset that the Senate Agriculture hearing wasn’t intended to be a personal attack on the governor. That didn’t stop speakers from taking shots at his policies.
“CO2 capture is unnecessarily costly and dangerous and therefore, it is not worth pursuing for the state of Wyoming — or anyone, for that matter,” Frits Byron Soepyan, a chemical engineer, told lawmakers.
“There are people that are going to say, ‘Climate is not changing.’ Or they’ll say, ‘It’s better to have more CO2.’ We can talk about all of that, but that doesn’t really matter,” Gordon said while speaking to business leaders in Casper on Tuesday.
More than 20 years of climate policy dictated from outside the state has moved markets toward lower-carbon energy sources, Gordon said. If Wyoming’s coal, oil and natural gas are going to remain viable, those industries must have technical solutions to reduce their carbon emissions, the governor has maintained.
Gov. Mark Gordon visits with City of Casper leaders during an Advance Casper event on Feb. 13, 2024. (Dustin Bleizeffer/WyoFile)
“The reason I say that it doesn’t really matter [where Wyomingites stand on climate change] is that what we are seeing is a regulatory environment that says, ‘We need to move away from fossil fuels because that’s the only way that we can save the planet, and we need to move to renewables because that’s the only way that we can save the climate,’” Gordon said.
“The most important thing is that Wyoming not stick its head in the sand,” he continued. “If [carbon capture] isn’t going to happen here, it’s going to happen — it is already happening in places like Texas and places like Louisiana. We really need to make sure that Wyoming is competitive, that it is a leader and that it is a place that people come to find the solutions.”
Gordon and his chief energy advisor, Randall Luthi, are working with Sen. Cale Case (R-Lander) and others on an idea that more equitably distributes both the cost of adding renewables and the cost of integrating fossil fuel carbon capture into the western electricity grid. All those capital costs — as well as long-term benefits — should be spread “system wide,” Luthi told WyoFile.
Wind turbines north of Medicine Bow, pictured Feb. 9, 2024. (Dustin Bleizeffer/WyoFile)
It will be a tough sell among Wyoming’s counterparts on the western grid, Gordon admitted. But it’s part of his signature “Decarbonizing the West” initiative as chairman of the Western Governors Association. Ultimately, Wyoming cannot impose such a system-wide “fee” on its own, Gordon told WyoFile. But the current electrical power regulatory regime doesn’t fairly distribute the cost of pursuing a net-zero electrical grid.
“We’re all in this together,” Gordon said. “Instead of being a victim, Wyoming can say, ‘If you’re really interested in doing something about CO2, we got the answer. We got the answer from the bottom to the top.’”
A state of climate denial
Steinmetz and other far-right lawmakers in the Legislature have tried to capitalize politically on Gordon’s carbon-capture advocacy. It’s fair to say their criticisms land with some residents of Wyoming, a state long financially dependent on revenue from carbon-producing industries and where fewer than half of residents believe humankind is driving climate change.
Approximately 38% of Wyoming residents believe “climate change is an extremely or very serious problem,” and 46% “have noticed significant effects from climate change over the past 10 years,” according to Colorado College’s annual Conservation in the West Poll, released earlier this month. Fifty-four percent “think that the low level of water in rivers is a serious problem,” according to the poll.
Still, Steinmetz’s and others’ efforts to make a spectacle of Gordon’s carbon policies haven’t gone over seamlessly. There was a fight, for example, over whether the Senate Agriculture Committee’s climate denier-led hearing should have been considered an official legislative event.
In late January Steinmetz spread word of the hearing on official Wyoming Legislature letterhead. She challenged the governor’s authority to pursue a carbon-negative policy: “The Legislature must have a true cost-benefit analysis in order to make an informed policy decision regarding the governor’s decarbonization plans for the state of Wyoming,” the Goshen County senator said in a press release.
CO2 Coalition Executive Director Gregory Whitestone spoke at the University of Wyoming on Feb. 14, 2024. (Dustin Bleizeffer/WyoFile)
The Legislature’s leadership didn’t appreciate it. Two days later the speaker of the House, Rep. Albert Sommers (R-Pinedale) and the Senate president, Sen. Ogden Driskill (R-Devils Tower) sent out another press release purportedly uncoupling the event from the Ag Committee.
The Legislative Service Office explained the decision in an email: “Under the Senate Rules a chairman can convene a meeting of their committee at any point during a legislative session to discuss items they deem to be relevant.”
House Majority Floor Leader, Rep. Chip Neiman (R-Hulett), thought that leaving the hearing sanctioned was “appropriate,” given how “deeply involved agriculture is in the whole issue of climate change.”
Parroting disproven claims
Shuman, the UW climate scientist, missed Turning Point USA’s event with the CO2 Coalition speakers due to a conflict, but afterward he looked into their resumes and a short report they produced about Wyoming and climate change.
“They are not climate scientists,” Shuman said.
The University of Wyoming professor took issue with some of the graphics the CO2 Coalition speakers presented. He was “shocked,” he said, by one graph purporting that annual average max temperatures have declined over the last 90 years in Wyoming, a “truly misleading” assertion.
“Basically, every single weather station across the state refutes that this is the trend,” Shuman said.
Sen. Cheri Steinmetz (R-Lingle) gives remarks at a press conference that followed a legislative hearing that promoted disproven claims about climate change. (Mike Koshmrl/WyoFile)
Nevertheless, the CO2 Coalition speakers had a receptive audience with the Senate Ag Committee. The next day, Steinmetz and other hardline Republican members of the Legislature gathered for a follow-up press conference.
“Our voters — the citizens of Wyoming — are rightly skeptical of this so-called crisis and permanent carbon capture and sequestration,” Steinmetz said.
Ten members of the Legislature, plus Secretary of State Chuck Gray, spoke after Steinmetz. Some doubted climate change was happening, while others challenged the need to act and take steps like sequestering carbon. Yet other legislators repeated the CO2 Coalition’s primary disproven message: that the primary gas accelerating the climate crisis is actually beneficial.
“We all know CO2is good,” said Sen. Dan Laursen (R-Powell), a hydrographer with the State Engineer’s Office. “Plants have to have it. The more there is there, the plants do better.”
Sen. Tim French (R-Powell) agreed.
Sen. Tim French (R-Powell) gives remarks at a press conference that followed a legislative hearing that promoted disproven claims about climate change. (Mike Koshmrl/WyoFile)
“As a farmer, I need a lot of CO2to grow my crops,” French said. “There’s a lot of hype out there from different individuals, but in my world, my business, I really need it.”
Climate scientists, however, came to consensus decades ago that the atmosphere needs less CO2 — at least if the goal is to inhabit a planet resembling the one we know today. In the middle of the 20th century the average annual temperature in Wyoming was about 40 degrees, Shuman said. Today, it’s approaching 43 degrees.
“While that doesn’t sound like a huge amount, it’s worth keeping in mind that the difference between the last ice age and today is only about 5 to 7 degrees,” Shuman said. “Even a few degrees makes a big difference.”
The Global Monitoring Division of NOAA/Earth System Research Laboratory has measured carbon dioxide and other greenhouse gases for several decades at a globally distributed network of air sampling sites. Credit: NOAA Global Monitoring Laboratory
You might call it the great economic riddle of our time: It sustains human life, lubricates the entire economy and has no known substitute, yet a month’s supply can be delivered to your home for less than the cost of cable TV or cell phone service. It belongs to the public but the right to use it is bought and sold, and changing that use requires a pricey court approval process. It supports kayakers and anglers, trout and sparrows, and all the ecosystems in between, yet those benefits are rarely reflected in its cost. It is cheap, and yet it is priceless. What is it?
If you’re reading [Headwaters] magazine, you already know that the answer is water, and you already know that water is invaluable. What you may not know is that water’s price, according to many economists, comes nowhere near to reflecting its true value, and that blunt economic fact has consequences for the long-term sustainability of both our water resources and our water systems.
Aligning water’s price with its value is much harder than it seems. That’s because water is traded and regulated in ways that reflect its unique and irreplaceable role in our economy. Depending on who you ask, water is a private commodity or a public good, an economic input or a human right.
These varying roles affect the accuracy of water prices, and the freedom—or lack thereof—of water markets. Some examples: In Colorado, many water utilities are prevented by their charters from charging more than they need to cover their costs. This keeps water rates affordable but also prevents providers from charging customers for the current market value of their water, also called the “scarcity value,” to encourage conservation. Legal restrictions on water transfers—in place to protect other water users—make those transfers complicated and expensive, slowing the flow of water from farms to cities and helping to preserve the gap between agricultural and municipal water prices. At the same time, many non-market costs of water transfers or appropriations—“externalities” like the open space, wildlife habitat and fishing grounds lost when farmers sell their water rights to a city or a new water right is appropriated, further depleting a stream—are not typically paid for by the buyer or the seller.
Ignoring the full cost of water—and the non-market values that water provides—saves money in the short term by keeping water rates low. In the long run, however, it could prove both financially and culturally expensive. Over time, wasteful use may hasten the need for costly new water projects, and public benefits like wildlife habitat and open space are less likely to be preserved if they aren’t factored into the price of water transfers. Given the stakes, how can we value water more accurately, while preserving the legal framework that protects water users and the environment?
Supply and demand, within limits
When utilities, ditch companies and irrigation districts buy water rights to serve their populations, the price of those rights is determined in part by the basic interplay of supply—what the water costs to deliver—and demand—what it’s worth to buyers. Brett Bovee, intermountain regional director for the consulting firm WestWater Research of Fort Collins, helps clients value water rights for purchase or sale. He considers factors like a water right’s source, location, current use, historical buyers and sellers, ease of storage, and seniority, since older rights are more dependably fulfilled than those appropriated more recently.
Bovee might compare a water right to a handful of others with similar characteristics to arrive at a reasonable price, or, if the water is agricultural, he might use a technique called the income approach, calculating the yields that a farmer could get irrigating with the water compared to dryland farming yields. (A slight variation is comparing the sale price of dry farm ground to that of irrigated land nearby, then using the difference to infer a water right’s value). A final technique, the replacement cost approach, involves calculating the cost of the next-most expensive water supply option and then advising clients to pay just less than that.
“Usually the replacement cost sets the ceiling, the income approach sets the floor, and the market price is somewhere between those two,” Bovee says. “The willing seller must make more off a water transaction than he would in farming, and the willing buyer is only going to buy water if it is cheaper than alternative sources.”
Brett Bovee. Photo credit: Westwater Research
Yet the economic playing field is not completely level where water is concerned, as evidenced by the vast and enduring price differences between agricultural and municipal water. As University of Arizona law professor Robert Glennon and his co-authors point out in the 2014 paper “Shopping for Water: How the Market Can Mitigate Water Shortages in the American West,” agricultural users in many parts of the West may pay just a few cents for a thousand gallons of water, while urban users pay $1 to $3 for the same amount. That’s partly because, in a strictly financial sense, urban users can earn more money with the water they consume: If you ignore the vital non-market values of agriculture like open space, wildlife habitat and food security, urban activities like manufacturing frequently generate more money per acre-foot of water than farming does. Used to grow lettuce in Yuma, Arizona, Glennon writes, an acre-foot of water might generate $6,000. Used to make microchips in California’s Silicon Valley, it would generate $13 million.
The price disparity between agricultural and municipal water is further explained by higher treatment and conveyance costs for urban water, from the chemicals that disinfect drinking water to the pumps that keep it pressurized and ready to flow from the tap. “If farmers needed really clean, pressurized water at their farm headgate on demand, the price between agricultural and municipal water may not be all that different,” Bovee says.
Grand River Ditch July 2016. Photo credit Greg Hobbs.
Agricultural water users who inherit their land also benefit from the investments their ancestors made in ditch and reservoir systems originally constructed to put the water to beneficial use. Today, they pay only the water assessments necessary to maintain or improve these systems or to make the occasional legal filings. When they sell their shares in their infrastructure or water rights, they earn the appreciated value of both, which can be substantial in areas like Colorado’s Front Range where a booming residential real estate market has kept water demand high.
First water through the Adams Tunnel. Photo credit Northern Water.
Finally, federally funded irrigation projects provided a subsidy to early agricultural water users: Many of the West’s large water diversions were paid for with federal dollars between the 1930s and the 1970s. Although those federal outlays were partly recouped through a combination of cost sharing from local governments and revenues from projects’ hydroelectric features, the federal government never required full reimbursement from water users. Examples include the Colorado-Big Thompson Project, authorized by Congress during the Great Depression to provide a supplementary source of water to farmers and cities in northern Colorado, as well as earlier Western Slope projects like the Uncompahgre Project and the Grand Valley Project. “Recipients of irrigation water from federal projects will have repaid, on average, about U.S. $0.10 on each dollar of construction cost,” writes University of California, Berkeley economist W.M. Hanemann In his 2005 paper “The Economic Conception of Water.” Today, federal funds are largely unavailable to help finance water supply infrastructure.
Although they remain much higher than agricultural water prices, municipal water rates are hardly exempt from market manipulation, and for good reasons. Because water is widely considered a basic necessity for human life and economic activity, many Colorado utilities are public entities whose rates are regulated by local governments or appointed boards, and even the rates of private, investor-owned utilities are limited by the Colorado Public Utility Commission. Many municipal utilities set their rates through “cost-of-service” pricing, which doesn’t account for the value of water itself but factors in only what it costs to run the utility—energy, water treatment chemicals, office staff—plus maintain financial reserves, make debt service payments, and repair aging pipes, tanks, reservoirs and other infrastructure. A growing number of utilities also employ “increasing block rate” pricing to keep everyday water use affordable while penalizing higher water users to encourage conservation. Yet their rates include little or no charge for water’s replacement cost or “scarcity value:” what it would cost to obtain their water on the open market today, or what they could earn by selling their water and using the proceeds to pay off debt or meet other obligations.
“For a farmer to keep a tractor, they have to be earning more by keeping it than they could make by selling it,” says Chris Goemans, an associate professor of economics at Colorado State University (CSU) who specializes in water issues. “For water rights portfolios, there is no charge to households to reflect the fact that the water could go somewhere else and earn more money for the utility.”
Failing to account for this opportunity cost encourages customers to use their water for purposes worth less to them than the cost of bringing that water to the tap, whether that’s watering the lawn or filling the swimming pool. That’s highly inefficient from an economist’s point of view. “You don’t want people using water that costs $10 per gallon to produce on applications for which they place a value of a dollar or two,” says Chuck Howe, a professor emeritus of economics at the University of Colorado, Boulder. “If the price to the consumer doesn’t cover all the costs of production, then individual customers will apply water to uses that are, at the margin, worth less than the costs imposed on society.”
Boulder’s Avery Brewing Company is one among 230-plus Colorado craft and micro breweries that have combined water with barley, hops and other specialty ingredients to establish a nationally recognized market for beer enthusiasts. Photo courtesy of Avery Brewing Company
Artificially cheap water saves customers money today, but in the long run will prove expensive as utilities are forced to meet growing demands by acquiring expensive new water rights or building new infrastructure. In a 2013 analysis, city staff in Westminster, Colorado, calculated that water rates would be 135 percent higher and water tap fees 99 percent higher if per-capita water demand in the city had not fallen by 21 percent since 1980. That declining consumption—driven by a combination of utility-sponsored conservation programs, conservation-oriented increasing block rate water pricing and stricter national plumbing codes—saved the city over $5.9 million on water and wastewater treatment, new water rights, and loan interest payments, which would have been passed along to residents in the form of higher rates and tap fees. Even though water rates have risen in Westminster since 1980, in part to compensate for declines in per-capita consumption, they have risen much less than they would have if per-capita consumption had stayed flat as the population grew.
Howe believes that charging customers for the scarcity value of their water could have a similarly virtuous effect on consumption—and thus on water rates—over the long haul. In an unpublished paper co-written with water attorney Peter Nichols of the Boulder firm Berg Hill Greenleaf Ruscitti LLP, Howe argues that utilities could encourage conservation by charging customers more for each 1,000 gallons of water they use, then refunding any resulting profits by reducing the fixed monthly service charges that appear on monthly water bills. By increasing the price of each 1,000 gallons of water by just $1.50, Howe and Nichols surmise, the City of Boulder could earn $20 million per year, a sum equivalent to 5 percent of its $400 million water rights portfolio. This would encourage conservation without harming ratepayers’ overall bottom lines, since higher volumetric usage fees would be offset by reductions in fixed service charges.
Love thy neighbor: Legal restrictions on water transfers
Despite the limits on what municipal utilities can charge, the gap between urban and agricultural water prices persists. That’s partly because significant legal barriers discourage those who get their water cheaply—farmers—from selling it to the cities who will pay dearly for it. Those barriers serve noble goals: Because water, unlike other commodities like land or electricity, is often used several times in succession within the same river basin, many users depend on the reliable timing and amount of return flows from their neighbors upstream. To protect those flows, legal restrictions, such as the “no harm to juniors” rule, prevent anyone who moves their water or changes its use from impacting other water users. Colorado water courts employ several other principles in regulating water trades: The beneficial use requirement is intended to discourage waste and requires water to be put to beneficial uses approved by the legislature or the courts or else abandoned, and the anti-speculation doctrine mandates that anyone changing their water use show precisely its new use, location and amount, to prevent speculators from buying water and simply holding it, unused, until prices rise.
Water courts also limit the salable portion of a water right to its “historical consumptive use,” the average amount actually absorbed by crops, retained by people and lawns, or used up by industrial processes over the water right’s history. This prevents farmers from harming other water users by selling water they no longer have to divert as a result of improving their irrigation efficiency, provided they leave irrigated acreage and consumptive use unchanged. Before the efficiency improvements, the unused portion of the water diverted and applied had served other users in the form of return flows, so Colorado law protects those historical return flows for appropriation by other users after efficiency improvements are made.
On July 7, 2020, we closed our headgate that takes water from the Little Cimarron for irrigation. The water in the above photo will now bypass our headgate and return to the river. Photo via the Colorado Water Trust.
Taken together, these restrictions discourage water from simply flowing to the highest bidder. They make the process of transferring water rights time consuming and expensive, since detailed engineering studies and costly legal filings are necessary to prevent other water users from being injured without compensation. And yet, examples abound of Colorado water law flexing to accommodate changing state priorities. The nonprofit Colorado Water Trust and the Colorado Water Conservation Board (CWCB)—the only entity in the state that can hold an instream flow water right—are now seeking water court approval for the state’s first permanent “split-season” water right on the Little Cimarron River in Gunnison County. The right, acquired by the Colorado Water Trust, will permit the same water to be used for agricultural irrigation in the early summer and then for instream flows that benefit fish in the fall. Another example: Under a state law passed in 2013, farmers and municipal water providers can now enter into so-called “interruptible supply agreements” three out of every 10 years without the approval of a water court. In this arrangement, farmers fallow some of their land or reduce irrigation and then, with the blessing of the State Engineer, convey the freed-up water to cities in exchange for short-term lease payments. One such arrangement, the Arkansas Valley Super Ditch, is partway through a three-year pilot project that began in spring 2015 when irrigators on the Catlin Canal east of Pueblo leased 500 acre-feet of water to the cities of Fowler, Fountain and Security.
“It went so smoothly the first year that I don’t think we want to mess it up by changing anything,” says John Schweizer, president of the Lower Arkansas Valley Super Ditch Company and the Catlin Canal Company. Because agricultural commodity prices were low in 2015, Schweizer says, the farmers who participated earned at least twice as much fallowing land and leasing water as they would have growing corn, wheat or alfalfa on the same acreage. And they still kept at least 70 percent of their water rights in agricultural production, as required by law. Even though there are two years left in the pilot project, Schweizer says, “The City of Fountain is already talking about coming back and negotiating a longer term lease, which could mean bringing more farmers into the program.”
Ideally, these alternative transfer methods (ATMs) could give cities reliable sources of water in dry years without requiring the “buy and dry” of agricultural lands. Yet short-term leases are a relatively new concept, and because urban water providers must plan for a reliable, long-term supply they often prefer to purchase agricultural water outright. Some urban utilities then lease the water back to farmers until they need it, giving them flexibility in deciding when to begin the sometimes long and arduous process of filing for a change of use in water court.
“If you are a water [utility] manager, when you provide a water tap to a developer you are promising them water. Short-term leases are just not reliable enough right now to fulfill that promise,” says Goemans, at least not for a city’s entire water supply.
Still, reducing regulatory barriers to water leasing is likely to make it more common over time. In the South Platte River Basin, where the Colorado-Big Thompson (C-BT) Project diverts water from the upper Colorado River, owners of contracts for C-BT water are only required to obtain the blessing of the Northern Colorado Water Conservancy District board, rather than a water court, before selling or leasing their water interests, and a robust leasing market has materialized there.
According to a 2016 WestWater Research report, leases have accounted for about 80 percent of all water trades in the South Platte Basin in recent years, and most transactions have involved farmers leasing their water to cities. The value of this streamlined process is also reflected in the sale price of C-BT units—unlike a lease, a sale gives a buyer rights to the unit in perpetuity. In 2015, C-BT units changed hands 67 times and fetched an average sale price of $36,300 per acre-foot—by the second quarter of 2016 the price was above $40,000. Meanwhile area ditch shares, whose transfer requires water court approval, were traded just 23 times for an average price of $13,800 per acre-foot.
Pricing the priceless: The non-market value of water
The market for C-BT units is a compelling example of what freer water trading might look like, yet several factors make it unlikely that such a market could be replicated across Colorado. Under a 1938 contract between Northern Water and the U.S. Bureau of Reclamation, all contracts for C-BT water must be exercised within the boundaries of Northern Water’s service area. Units of C-BT water can only be used once before being allowed to flow down the lower South Platte River between Greeley and the Nebraska border, for the benefit of irrigators there. And yet, irrigators on the lower river have no legal right to claim injury if the lease or sale of C-BT units affects the return flows they rely on, since the prior appropriation doctrine—including the no-harm-to-juniors rule—applies only to native flows within a river basin, not to transbasin diversion water. This minimizes objections when C-BT units are leased or sold.
Colorado-Big Thompson Project Map via Northern Water
Leaving aside these complicated machinations, there is a simpler reason why most of Colorado’s water sales and leases are still regulated by water courts: Legal safeguards like the no-harm-to-juniors rule play an important role in limiting harm to third parties or the environment when water is moved. They also highlight water’s role as both a private good and a public resource with important environmental and cultural values.
Economists have devised a suite of techniques to translate those “non-market” values into financial terms so that they can be factored into cost-benefit analyses of water projects. Perhaps the most prominent technique is “contingent valuation,” where economists survey water users to gauge their financial willingness to pay for environmental benefits or willingness to accept environmental harms.
Big Wood Falls photo via American Whitewater (2011)
People value water’s role in the environment for a wide variety of reasons: “Use value” reflects the benefit of using a waterway for kayaking, rafting or swimming; “existence value” measures the well-being gained from simply knowing that a river exists; and “bequest value” shows the worth of knowing that an environmental good will be preserved and passed down to future generations. There is also “intrinsic value”—the notion that other water-dependent species should be allowed to exist regardless of their value to humans.
Because some of these values have an emotional component, it can be tough to give them the same weight as purely financial considerations, and many cost-benefit analyses reflect this problem. In 2011, for instance, the Colorado Department of Public Health and the Environment was considering additional limits on releases of phosphorous and nitrogen from wastewater treatment plants to comply with enforcement of the federal Clean Water Act by the Environmental Protection Agency. A state-commissioned study by the consulting firm CDM Smith weighed the costs of those new regulations—new equipment and more intensive wastewater treatment and monitoring—against benefits like reduced spending on drinking water treatment, better-tasting and better-looking drinking water, improved ecological function in rivers and streams, and increased recreation. The study found that the regulations would yield just $0.79 worth of benefits for every $1.00 spent to implement them. Yet it relied on rough estimates—derived from previous economic studies—of the financial value that people place on environmental benefits. And it did not weigh qualitative benefits like existence and bequest value, despite the fact that these values often account for half of people’s willingness to pay for environmental benefits, according to CSU environmental economics professor John Loomis.
Colorado transmountain diversions via the State Engineer’s office
Those same omissions have characterized, and potentially marred, other studies. A 2009 study by the Front Range Water Council, a group of Front Range water providers that has advocated for new transbasin diversions from Colorado’s Western Slope, found that the Front Range withdraws 19.4 percent of the state’s water but generates 80 to 86 percent of the state’s economic activity, while western Colorado withdraws 41 percent of the state’s water but comprises just 10 percent of the state’s economy. By that logic, the Front Range produces about $132,268 in economic output per acre-foot of water used, compared to just $7,200 per acre-foot on the Western Slope. Yet those figures fail to account for the economic costs that diverting water to the Front Range imposes on the Western Slope, along with the financial benefits of things like tourism and recreation, which rely on keeping western Colorado water in the stream. The Northwest Colorado Council of Governments (NWCCOG), a coalition of Western Slope municipal governments whose members generally oppose new transbasin diversions, attempted to address these omissions with its own 2012 study: “Water and its Relationship to the Economies of the Headwaters Counties.”
“We have struggled to convey how important having water in the river is to the economy in the headwaters region, especially in the summer,” says Torie Jarvis, co-director of the Water Quality and Quantity Committee at NWCCOG. “That study was meant to point out that there were values that studies like the Front Range Water Council’s were not accounting for.”
Fraser River at gage below Winter Park ski area. Photo credit: Colorado Water Trust
Some of these values, and the economic implications of protecting them, are relatively easy to quantify: The town of Winter Park, for instance, is forced to treat its wastewater to a higher standard because 65 percent of the Fraser River that once flowed through town is diverted to the Front Range, making wastewater more difficult to dilute. “We have seen an impact on the cost of wastewater treatment year-round due to the lack of dilution flows,” says Bruce Hutchins, manager of the Grand County Water and Sanitation District 1. Faced with ongoing transbasin diversions, Winter Park town leaders have also opted to curtail the town’s development to keep at least 10 cubic feet per second of water in the Fraser River at all times. That has clear economic consequences: At buildout, the town could accommodate about 9,300 single-family housing units if officials were willing to dry up the river to provide them with water. Instead, the town has capped the number of water taps it will dispense to allow for just 8,300 single-family units in order to maintain river flows.
Colorado fly fishing, whitewater and other water-related recreational pursuits contribute significantly to Colorado’s $34.5 billion recreational economy. Photo courtesy of the Winter Park Convention and Visitors Bureau
“It’s a bit backwards from the way that other communities have done it,” says Winter Park community development director James Shockey. “We’ve put the river first, and then looked at how much we can develop from there.”
Other values compromised by transbasin diversions, like the potential effect of changes in water use on tourism, require non-market valuation in order to be expressed financially. In a March 2003 study, CSU economists Adam Orens and Andrew Seidl surveyed winter tourists in the towns of Gunnison and Crested Butte to see how changes in the area’s open space ranch landscape would affect their decision to vacation there. More than half of those surveyed said they would reconsider vacationing in the area if just 25 percent of the existing ranchland were converted to second homes or other uses. If all of the ranchland were converted, the researchers concluded that tourism in the area could drop by as much as 40 percent.
Contingent valuation surveys have also shed light on the value of water left in rivers for recreation, wildlife habitat and scenic views, which sometimes exceeds the economic benefit of diverting that same water to farms or cities. In a 2008 study, CSU Economist John Loomis surveyed a random sampling of Fort Collins residents and found that they were willing to pay an average of $352 per year to keep peak spring and summer flows in the Cache La Poudre River rather than letting agricultural and municipal users deplete them. “It appears the value of these instream flows to Fort Collins residents is of the same magnitude as the market value of the water in alternative uses,” like irrigation and municipal use, Loomis concluded. In Colorado today, there are two legal mechanisms that Fort Collins residents could use to keep that water in the stream, and both involve the prior appropriation system. In theory, they could convince local or state government to acquire a water right on the Poudre from a willing farmer or utility, then convert it to an instream flow right (held by the CWCB) or a recreational in-channel diversion right (held by a local government) to keep its recreational and wildlife benefits intact. Such benefits are protected in some states by the public trust doctrine, a legal concept which holds that certain resources should be held in trust by the government for public benefit. Yet that concept holds no legal sway in Colorado.
“We are not a public trust doctrine state,” says retired Colorado Supreme Court Justice Greg Hobbs. “We are a prior appropriation state with a market. The Constitution provides that the water is owned by the public and is dedicated to the use of the people of the state subject to appropriation. Therefore, the public values protected by the constitution consist of the beneficial uses made by water rights owners.”
The graphic shows the existing dam and water level and how high the new dam will rise above the current water level. Image credit: Denver Water.
Wading through no man’s land: Accounting for social costs
There are some good examples of water users paying for the public and private costs of their diversions. Under a 2012 pact called the Colorado River Cooperative Agreement between Denver Water and 17 Western Slope entities, the Front Range utility won support for its efforts to enlarge Gross Reservoir north of Boulder in exchange for helping to fund dozens of river improvements on the Western Slope. Among them: channel maintenance and habitat improvements on the Fraser River, a catchment basin that reduces sediment in the Fraser and cuts water treatment costs for Winter Park, and a whitewater park in the Colorado River at the mouth of Gore Canyon near Kremmling.
Yet some observers argue that there should be a more formalized way to charge for the public costs of diverting water. Aside from mitigation requirements imposed on water projects by state and federal environmental laws, the existing legal mechanisms for protecting public values—instream flow rights and recreational in-channel diversion (RICD) rights—were introduced into Colorado water law relatively recently. (The legislature authorized the first instream flows in 1973 and RICDs in 2001.) That means that many instream flow rights have junior priorities and cannot be exercised when more senior rights are diverting, which can render them ineffective during dry parts of the year. As an added way to safeguard water-related public goods, the CSU economist Chris Goemans floats the idea of a public fund—perhaps financed by a tax on the buy and dry of agricultural lands—dedicated to preserving water-related public goods like open space and wildlife habitat.
“There are social values of water use that are not factored into the transaction when a farmer sells their water to a city,” says Bovee. “A farmer cannot charge a developer twice as much simply because his water is irrigating nice open land that will dry up once the water is gone. The developer will not pay extra to compensate for the loss of that public good.”
In extreme cases, in the absence of state intervention, the social costs of water diversions can undercut the economy of an entire region. A well-known example of this is southeastern Colorado’s Crowley County, where droves of farmers sold their water rights to the growing cities of Aurora, Colorado Springs and Pueblo between the 1960s and the 1980s, then took the profits, packed up and moved away. Because few of the proceeds from those water sales were reinvested in the community and the region lacked an alternative economy to fall back on, widespread unemployment ensued that persists to this day.
Photo of Crowley County by Jennifer Goodland
“If you looked at this transaction from a statewide perspective, it was a net benefit,” Bovee points out. “The revenue from moving that water to the Denver Metro area was greater than the lost income from farming in the county. But there was a spatial problem—Crowley County did not have a second and third economy to rely upon, so it was economically devastating, and there was huge poverty and social fallout. Open markets see nothing wrong with that transaction. But the state has to look out for the health of its rural populations and mitigate the downside in some way.”
Click the link to go to the USGS website for the article:
By 1867, the developing industries were making radical demands on the Nation’s natural resources. Joseph S. Wilson, the Commissioner of the General Land Office, in his annual report written in the fall of 1866, assessed at some length the mineral resources of the public domain, and afterward stated that the proper development of the geological characteristics and mineral wealth of the country was a matter of the highest concern to the American people. On March 2, 1867, Congress for the first time authorized western explorations in which geology would be the principal objective: a study of the geology and natural resources along the fortieth parallel route of the transcontinental railroad, under the Corps of Engineers, and a geological survey of the natural resources of the new State of Nebraska, under the direction of the General Land Office. Looking back at that day’s work in 1880, Clarence King, Director of the U.S. Geological Survey, remarked that “Eighteen sixty-seven marks, in the history of national geological work, a turning point, when the science ceased to be dragged in the dust of rapid exploration and took a commanding position in the professional work of the country.”8
Clarence King exploring an active glacier on Mount Shasta, 1870. Photo credit: USGS
King was only 25 and 5 years out of Yale, where he had been a member of the first class to graduate from the Sheffield Scientific School, when he was appointed Geologist in charge of the Geological Exploration of the Fortieth Parallel. He had been a member of the Geological Survey of California when he conceived the idea of a geological survey along the route of the railroad then being built, had then interested the Engineers in the plan and secured their endorsement and that of the War Department, exhibiting political as well as scientific acumen. The Chief of Engineers told King he could expect to receive $100,000 to finance the work for 3 years and was authorized to engage two assistant geologists, three topographic aides, two collectors, a photographer, and necessary camp men. King chose as assistants well-trained young men, the geologists with graduate education in Europe, and planned the work in detail before taking the field.
Ferdinand V. Hayden, M.D., who had already established a reputation as a master of reconnaissance in the Upper Missouri country, was placed in charge of the survey of Nebraska, for which only $5,000 was available. Hayden, 38, was a graduate of Oberlin College in Ohio and Albany Medical College. Except during the Civil War years, Hayden had been enthusiastically exploring the northern Great Plains region since 1853 when James Hall, the New York State Geologist, had sent him and Fielding B. Meek west to study the geology and collect fossils. In 1856 and 1857, Hayden had accompanied expeditions led by Lieutenant G.K. Warren and in 1859, the expedition led by Captain W.F. Raynolds, both of the Topographical Engineers.
The Hayden survey in the Yellowstone area, 1871. Photo credit: USGS
Both the King and the Hayden surveys were successful. In 1870, the King survey, without solicitation, received additional funds for another 3 years in the field. The Hayden survey received additional appropriations in 1868 and 1869 for exploration in Wyoming and Colorado, and in 1869 was placed directly under the Secretary of the Interior. In 1870, Hayden presented to Congress a plan for the geological and geographical exploration of the Territories of the United States that looked forward to the gradual preparation of a series of geographical and geological maps of each of the territories on a uniform scale. With Congressional blessing the Hayden survey then became the Geological and Geographical Survey of the Territories under the Department of the Interior.
By that time two additional surveys had taken the field. On May 24, 1869, John Wesley Powell, Professor of Geology at Illinois State Normal University, and a party of nine men left Green River, Wyoming, in three small boats to explore the unknown canyonlands to the south and west. Powell’s expedition was privately sponsored–its only public support an authorization to draw Army rations–and the members of the expedition were a mixed crew of nonprofessionals.
Powell, 35, was the son of an itinerant Methodist preacher. His formal schooling had ceased when he was 12, and his life thereafter had been spent in farming, studying, teaching, and exploring the Midwest until the outbreak of the Civil War. He enlisted in the Union Army in May 1861 and remained in the service until the war was over. After the war, Powell became professor of geology at Illinois Wesleyan University and then at Illinois State Normal University. In 1867 and 1868, he explored the Rocky Mountains in Colorado and eastern Utah and became convinced that the unknown canyonlands to the southwest could best be explored in boats. In a trip fraught with hardships, Powell and five of the nine original members of the crew completed a journey down the Green River to the Colorado and through the Grand Canyon on August 13, 1869. In 1870, Professor Powell received an appropriation of $10,000 from Congress to make a second trip down the Colorado, being required only to report his results to the Smithsonian Institution. On June 10, 1872, Congress appropriated another $20,000 for completion of the survey.
The Powell survey on its second trip down the Colorado River, 1871. Photo credit: USGS
The second new exploration in 1869 was led by Lieutenant George Wheeler, Engineer Officer on the staff of the Commanding General of the Army’s Department of California (which covered California, Nevada, and Arizona). Wheeler, not quite 27, was a graduate of West Point in 1866 where he had ranked sixth in his class and won a commission in the elite Corps of Engineers. By 1869, exploration of the Colorado River and location of north-south routes across the Great Basin had become the most important projects of the Division of the Pacific, but when the Army learned of Powell’s planned expedition, exploration of the Colorado was postponed.
Wheeler Party Survey Members. Standing in the top row, sixth from the left, is George Montague Wheeler, the West Point graduate who in 1871 developed a comprehensive plan for surveying the territory west of the 100th meridian.
National Portrait Gallery. Photo credit: Timothy O’Sullivan
In early June 1869, Lieutenant Wheeler received orders to organize and equip a party to make a thorough and careful reconnaissance of the country south and east of White Pine, Nevada, as far as the head of navigation on the Colorado, to obtain data for a military map and to survey the possibility of a wagon road and select sites for military posts. In 1871, the Engineers sent Lt. Wheeler to explore and map the area south of the Central Pacific Railroad in eastern Nevada and Arizona.
On his return from the 1871 expedition, Wheeler, convinced that the day of the pathfinder had ended, proposed a plan for mapping the United States west of the 100th meridian on a scale of 8 miles to the inch, expected to cost $2.5 million and take 15 years. Congress authorized the program on June 10, 1872, the day on which funds were appropriated for completion of the Powell survey. Hayden that year was given $75,000 for his Geological and Geographical Survey of the Territories.
Inevitably, conflicts developed between the Hayden survey, mapping the Territories of the United States, and the Wheeler survey, mapping the areas west of the 100th meridian. In 1874, Congress was provoked to a thorough discussion of civilian versus military control of mapping. In the testimony heard by the Congressional committee, much of it on the purposes and efficiency of the mapping, Powell credited King’s Fortieth Parallel survey with the most advanced techniques, which Hayden and he had later adopted. In the end Congress concluded that each survey had been doing excellent work for the benefit of the people and that there was sufficient work for both the Interior Department and the War Department for years to come. The Secretary of the Smithsonian Institution had requested an additional appropriation for the Powell survey, which Congress granted but transferred the survey to the Department of the Interior, where it was at first called the second division of the Geological and Geographical Survey of the Territories. Later, because of tension between Powell and Hayden, the Powell survey became known as the Geographical and Geological Survey of the Rocky Mountain Region.
Wagon Wheel Gap on the Rio Grande, by Wheeler, D. N. (Dansford Noble), 1841-1909.jpg. Photo credit: WikipediaThe camp and cooking setup for the second expedition (pictured) was likely very similar to the first expedition and consisted of a few pots and pans to cook over a fire. May 4, 1871. (Credit: E.O. Beaman. Public domain.)THE GRAND CANON,
LOOKING EAST FROM TO-RO-WEAP
From “Exploration of the Colorado River of the West and Its Tributaries” By J. W . Powell, 1875No photos were taken during John Wesley Powell’s pioneering 1869 expedition of the Colorado River. This photo, taken along the Green River in northern Colorado, dates from Powell’s 1871 expedition, which retraced the 1869 journey. Credit: National Park ServiceA stopover during Powell’s second expedition down the Colorado River. Note Powell’s chair at top center boat. Image: USGSExplorer John Wesley Powell and Paiute Chief Tau-Gu looking over the Virgin River in 1873. Photo credit: NPSThe Powell-Ingalls Special Commission meeting with Southern Paiutes. Photo credit: USGSJohn Wesley Powell at his desk—same desk used by the USGS Director today via the USGSJohn Wesley PowellJohn Wesley Powell’s recommendation for political boundaries in the west by watershedJohn Wesley Powell Too close for comfort! Members of Ferdinand Hayden’s Survey stand precariously close to @YellowstoneNPS Old Faithful Geyser erupting, circa 1878. Photo credit: William Henry JacksonClarence King; Camp near Salt Lake City, Utah. The exploration of the Survey of the Fortieth Parallel. Photo by Timothy H. O’Sullivan, October 1868. By Timothy H. O’Sullivan – Davis, Keith F., Timothy H. O'Sullivan, Jane Lee Aspinwall, François Brunet, John P. Herron, Mark Klett, and Julián Zugazagoitia. Timothy H. O'Sullivan: The King Survey Photographs. Yale University Press Mass. Published:2011., Public Domain, https://commons.wikimedia.org/w/index.php?curid=56679730
Last week, another round of Pacific storms swept across the West, bringing rain and mountain snow. Storms left over 3 feet of snow in the northern Arizona mountains before dropping more than a foot of snow in the mountains of Colorado and New Mexico. After a slow start to the year, basin snowpack in the Southwest has returned to near-normal conditions. Southwestern states saw improvements to short- and long-term drought conditions. In the Northwest, basin snowpack remains below normal with some of the worst conditions in the northern Rocky Mountains. The lack of snow led to the expansion of drought conditions. The wet pattern continued in the South and Southeast. In the last 30 days, rainfall totals of more than 10 inches (200 to 400 percent of normal) fell in parts of the South and Southeast.
The excess rain brought additional one- and two-category improvements to drought. The Northern Plains and Upper Midwest stayed relatively dry, with temperatures well above normal for the second week in a row. States in the Southern Plains saw pockets of improvements as long-term moisture deficits are finally showing signs of improvement. The winter storm that brought heavy snow to the Northeast on Wednesday occurred at the data cutoff for this week’s map…
High temperatures averaged about 8 to more than 20 degrees above normal. Precipitation of less than 0. 5 inches fell across much of the Dakotas, Nebraska, and Kansas. Southwest Nebraska, Kansas, and eastern Colorado saw 1-category improvements to long-term drought areas. Short-term moisture deficits have largely been eliminated. A dry signal remains in Nebraska and Kansas at timescales longer than about 6 months and moisture deficits linger in deeper soil levels and ground water. Moderate drought (D1) expanded in western South Dakota, near the Black Hills, and northeast Wyoming due to a lack of snow and below-normal soil moisture levels…
Colorado Drought Monitor one week change map ending February 13, 2024.
Pacific storms swept across the West again this week, bringing rain and mountain snow. Over 3 feet of snow fell in the northern Arizona mountains. The mountains of Colorado and New Mexico saw over a foot in some locations. The recent storms brought some of the best snowfall totals to date for this year’s snow season. Basin snowpack in the Southwest has returned to near-normal conditions, prompting improvements to areas of moderate (D1), severe (D2), extreme (D3), and exceptional (D4) drought. The largest improvements occurred in New Mexico and southwest Colorado. In the Northwest, basin snowpack remains below normal with some of the worst conditions in the northern Rocky Mountains. This lack of snow led to the expansion of D1 across southern Montana, northern Wyoming, central Idaho, and south-central Oregon. D2 expanded in eastern Idaho and western Montana. D1 improved in southern Washington and northern Oregon where above-normal precipitation over the last six months has helped reduce long-term moisture deficits…
Another round of wet weather brought 2 to 4 inches of rain to parts of Louisiana, Mississippi, and Tennessee. The continued wet weather left a band, stretching from east Texas to northeast Alabama, with rainfall totals of 6 to 12 inches — 200 to 400 percent of normal —over the last 30 days. Much of the region saw 1- and even 2-category improvements to drought conditions. All exceptional drought (D4) has been eliminated. Moderate (D1), severe (D2), and extreme (D3) drought remain in the region where drought signals can still be found in long-term indicators. Despite the record-breaking rainfall over the last several weeks, deficits of 4 to 10 inches over the last six months remain over parts of many parts of the region. Groundwater levels and deeper soil moisture also remain historically low for this time of year in some places. West Texas was the only area where drought expanded. Moderate drought (D1) was added in response to growing long-term moisture deficits and impacts to soil moisture, groundwater, and vegetation…
Looking Ahead
The National Weather Service Weather Prediction Center forecast (valid February 15 – 17, 2024) calls for another round of rainfall to push into the West Coast, bringing heavy rain and high elevation snow to the Cascades, Sierra Nevada, and the Northern Rockies. Polar air from Canada is expected to bring cold, dry air into the Northern Plains. Snow is expected across the Central Plains and Ohio Valley. Heading into the weekend, the extended forecast (valid February 17 – 21, 2024) calls for increased chances of multiple atmospheric river events for parts of central and southern California. Areas of lighter precipitation may spread across other parts of the west. The Upper Midwest and Northeast may see some snowfall. Storms tracking across the Gulf of Mexico may bring rain to Florida. The Climate Prediction Center’s 6-to-10-day outlook (valid February 20 – 24, 2024) calls for an increased probability of above-normal temperatures across most of the continental U.S. (CONUS) and Alaska. Temperatures across southern California, the East Coast, and northern Alaska are expected to be near to below normal. Increased precipitation is expected across California, the interior West, southern Alaska, and the Northeast. Much of the remaining CONUS, northern Alaska, and the Big Island of Hawaii are expected to have below- or near-normal precipitation.
US Drought Monitor one week change map ending February 13, 2024.
Last post, I laid out some reasons why the water mavens now engaged in mapping out Colorado River management strategies beyond 2026 – the year ‘interim’ management strategies expire – should consider laying the Colorado River Compact to rest, archiving it along with most of the chain of subsequent compacts, rules and guidelines, legislated acts, minuted treaties and interim patches and props known as the ‘Law of the River,’ and start over with a new compact that actually reflects contemporary river realities.
One of those reasons was the fact that the Compact had failed from the start in its primary goal: to provide for an ‘equitable division and apportionment of the use of the waters’ that was not driven by the prior appropriation doctrine, which was leading the seven states into an appropriation ‘horse race’ in which California was already lapping the other six states.
Over the past years we have heard again and again, in speech and in print, that the Colorado River Compact is the ‘foundation of the Law of the River.’ That is just not true. The foundational law of all the law governing use of the river is the doctrine of prior appropriation, which all seven of the compact states had adopted from the time they were territories, as a vehicle for the reasonably orderly distribution of essential water among water users in the arid and semi-arid lands. [ed emphasis mine]
That is what we’re going to look into today – the doctrine of prior appropriation that is the foundation on which the formal and informal management of the river is built. (Fools tiptoe in where mavens fear to tread.)
The appropriation doctrine for the use of water in arid regions evolved literally everywhere at once in the arid West, a grassroots ‘common law’ that was only formalized, not created, when states wrote it into their laws and constitutions. ‘Common law’ refers to the ‘justice’ that people agree upon in resolving problems among themselves before there are local governments with sheriffs and judges to apply justice for them.
An appropriator of water could be anyone from an individual to a whole ditch company organized in a number of ways. An appropriation of water was created by just digging a ditch from a stream to put some water to use, and if you were smart posting a dated notice near it and starting a ditch journal at home. But no one needed to be asked for permission, and evidence of actual use amounted to proof of appropriation. ‘The right to divert the unappropriated waters of any natural stream to beneficial uses shall never be denied,’ the Colorado Constitution says.
But as more people came to use the streams, priority of appropriation became an issue that had to be resolved between parties wanting to use the same water in the pre-law period. That was probably resolved reasonably amicably in many cases; but for the rugged American individualist yeomen invented by Thomas Jefferson and John Locke, it could get tense, even violent; and the common rule arrived at among the unruled, when neither side would yield, was that the first user had the better claim, and got his water first, with the subsequent users in ranked priority for what was left. Once county and state offices were set up, land and water appropriation claims could be officially filed, with law enforcement to back them, which made it all easier, but still it occasionally resulted in open competitive conflict, in a nation of rugged individualists.
Appropriation law has developed a reputation today of being terribly complex, but it is all founded on that simple default premise, easily understood even by children on the playground: first come, first served. Although it should be acknowledged that the appropriation and privatization of water from the commons is not a universally accepted ‘God-given’ practice.
It should also be noted that a sociopolitical philosophy underlay appropriation law as it first evolved in the arid lands. The ‘agrarians’ – farmers and would-be farmers in counterrevolutionary retreat from the dominant Industrial Revolution back in the states – wanted to protect themselves from the speculators scouring the continent for investment opportunities for private capital. So their law insisted that no one could appropriate more water than he or she could put directly to use (or show ‘due diligence’ in installing the works to put the water to use). This prevented speculators from appropriating whole streams, to profit from selling or leasing to would-be farmers.
The emerging law also said that no riparian users could keep subsequent appropriators from access to the stream, even if it meant letting a junior user run a ditch through their fields. While appropriation was oriented toward the individual, this condition encouraged collaboration among users on a stream: the first user’s ‘mother ditch’ could be enlarged to carry water to other farms rather than cutting through the first users’ fields. My great grandfather James Short and his brother Frank started a floodplain ditch in the valley of the North Fork of the Gunnison River that, by the time they filed for a water right in 1889, had 21 farmers using the enlarged ‘Short Ditch,’ all named in the decree.
The Short brothers did not create a formal ‘ditch company’ for their often-enlarged ditch, but when it came to settling the mesas and benches above the floodplains, requiring long expensive upstream conveyance ditches, ditch companies were almost necessary, formally registered companies with a large appropriation shared out among the funding members once the system was completed. Entrepreneurs also somehow skirted the speculation issue, purchasing dry uplands at a low price and running a long conveyance ditch to it in order to resell it as irrigated land. Incorporated and unincorporated communities appropriated water for domestic and industrial purposes – the City of Gunnison went from a sagebrush flat to a ‘Tree City’ designation, thanks to a municipal ditch system along its streets.
For those interested in the agrarian roots of the prior appropriations doctrine, an excellent book on the subject is The Colorado Doctrine: Water Rights, Corporations, and Distributive Justice on the American Frontier by legal scholar David Schorr. It is all very straightforward, if not all as simple as the basic premise.
Complexity began to enter the system as users on the streams increased, and all local streams conflued with other streams, all with water users with rights in priority too; seniority in one watershed was not necessarily seniority in the downstream confluence with several watersheds.
State Engineer’s Office Division boundaries. Division 1 in Greeley: South Platte, Laramie & Republican River Basins. Division 2 in Pueblo: Arkansas River Basin. Division 3 in Alamosa: Rio Grande River Basin. Division 4 in Montrose: Gunnison & San Miguel River Basins, & portions of the Dolores River. Division 5 in Glenwood Springs: Colorado River Basin (excluding the Gunnison River Basin). Division 6 in Steamboat Springs: Yampa, White and North Platte River Basins. Division 7 in Durango: San Juan River Basin and portions of the Dolores River.
Hierarchies of state engineer and water commissioners had to compile all of that inter-watershed information and organize it by priority for entire river basins – eight major basins in Colorado alone. This was a formidable task in the pre-computer era; now we can look up water rights in minutes.Other complexities emerged, however, that began to change prior appropriation law – essentially a grafting of the urban-industrial mainstream game plans onto its agrarian roots. This complexity would have been precluded, or at least deferred, by a second simple rule proposed by the explorer-scientist Major John Wesley Powell. In his famously ignored 1877 ‘Report on the Lands of the Arid Regions’ – actually a detailed plan for an agrarian West – Powell proposed that, since the land was essentially worthless without the water, the right to use the water should ‘inher’ in the title for the land – land and water bound together as a single property.
John Wesley Powell’s recommendation for political boundaries in the west by watershed
His recommendation was ignored everywhere. Instead, land titles and water rights evolved as separate ‘properties.’ The right to just use a quantity of water became a property that could be bought and sold, like a piece of land or an automobile, separate from the land it nourished. And the sold water right kept its place in priority with the new owner; seniority went along with the purchase of the right to use the water.This freeing of water rights from their original purpose, alone, made the appropriations laws a powerful engine for the growth of great cities. Growing cities, with their concentrated wealth, could grow well beyond the limits of their own local water supply by buying water rights from users many miles distant and bringing the water to the city.
Laramie and Poudre Tunnel inlet October 3, 2010.
But an incident in two small tributaries of the South Platte River in Colorado’s Front Range led to further complexity – or opportunity, as the western city builders would have seen it. A little water was taken across a ridge from one watershed into another on Colorado’s Front Range. This was contested in water court by users from the basin of origin because they said it limited the future development of their watershed. The court, however, found that insufficient reason to deny this small ‘transbasin diversion.’
But given that foot in the door, the door was pushed open for much larger transbasin diversions – transmountain diversions, even through the Continental Divide, with no legal responsibility on the diverter to compensate the basin of origin for water appropriated or purchased, and the resulting loss of a piece of its future (sine agua nada).
These ‘complexities’ showed up in one form or another in the appropriation laws throughout the arid West. California, as usual, was first to really exploit it, bringing questionably acquired water a hundred miles from the Sierras to the Los Angeles Basin in the first decade of the 20th century. Transmountain diversions have been the cause of most of Colorado’s so-called ‘water wars,’ with the urban-industrial metropolis east of the Continental Divide now taking half a million acre-feet annually from the West Slope’s Colorado River headwaters.
Colorado transmountain diversions via the State Engineer’s office
The ‘great and growing cities’ of the eastern plains also managed to undermine, or at least muddy, the appropriation doctrine’s fundamental anti-speculation mandate, to only appropriate as much water as you could put directly to use. In the 1930s Denver leased and lined the pilot bore for the Moffat Tunnel, to move water through the Divide from the Fraser River on the West Slope. In 1937 the city filed for a Fraser water right that was almost twice as much water as they could put to use, planning to lease the rest to East Slope agricultural users until the growing city needed it.
The leaders of the newly created Colorado River Water Conservation District, protecting the West Slope’s water, challenged that additional water as speculation. The district water court judge agreed with them, and reduced the city’s claim accordingly. But Denver appealed the decision to the Colorado Supreme Court – which reversed the district judge’s finding, determining that ‘it is not speculation but the highest prudence on the part of the city to obtain appropriations of water that will satisfy the needs resulting from a normal increase in population within a reasonable period of time.’
Map credit: AGU
The courts have gone back and forth for decades now, trying to pin down what constitutes ‘prudent’ acquisition of water to meet ‘a normal increase in population within a reasonable period of time.’ But the sprawling urban growth throughout the Southwest since World War II has essentially made distinctions between ’normal growth’ and ‘speculation’ meaningless. And most of that growth has depended on water brought in from distant places – some acquired from farmers, for whom water rights constitute a good retirement package.
The mythographers of money like to say that ‘in the West water flows uphill toward money,’ implying an effortless magnetism for money. The truth is that large quantities of money come out from the concentrated wealth of the cities to suck up – at a considerable but affordable cost – the water (as well as other raw resources) to feed the cities’ growth.
One can argue – I might even – that the anti-capitalist appropriations law as conceived by the agrarian ‘counterrevolutionaries’ was at best a holding action that could not forever hold off the juggernaut of the Industrial Revolution rolling across the continent. One can also point out that, despite all this, the farmers still own the rights to 70-80 percent of Colorado River water. But that is mostly just because the urban-industrial juggernaut hasn’t needed more of it, yet; and in any case most of the agriculture in the Colorado River region is pretty thoroughly industrialized agribusiness. (Only in the headwaters tributaries does one still find a hereditary agrarian ‘agri culture’ – and it is feeling besieged.)
Those major ‘complexifications’ of the original simple idea of prior appropriation law probably barely scratch the surface of the ever more complex evolution of the prior appropriation doctrine, an evolution that goes on despite – or maybe because of – the fact that there is really no more water to appropriate from the exhausted commons.
There is, however, one more complexification that needs to be considered, to really understand where things are today in the Colorado River region, and that is the Colorado River Compact itself, and the rationale behind it that failed in trying to go around the appropriation doctrine rather than going through it.
But I’ve gone on long enough on this post; that will be for next time – with some thoughts on how we could maybe sketch out a compact that might work to address some of the challenges we face, now and beyond 2026, that the current Compact can’t resolve. Stay tuned.
Colorado River “Beginnings”. Photo: Brent Gardner-Smith/Aspen Journalism
Gov. Mark Gordon spoke with Advance Casper members Feb. 13 2024 in Casper. (Dustin Bleizeffer/WyoFile)
Click the link to read the article on the WyoFile website (Dustin Bleizeffer):
February 14, 2024
Governor Mark Gordon’s push for carbon capture at coal-fired power plants and for pumping planet-warming carbon dioxide underground to produce more oil isn’t a climate crusade, he told business leaders Tuesday in Casper. It’s an acknowledgment of where policies outside Wyoming have driven markets.
Wyoming, the nation’s top coal producer and among its top oil and natural gas producers, can help meet the goal — and the market reality — of reducing carbon emissions into the atmosphere, he said. But the state doesn’t have to abandon its fossil fuels to do it.
Instead, Gordon is on a mission to prove that integrating carbon capture with fossil fuel production and use is not only economically and technically viable, it’s necessary to fill in the energy-availability gaps that renewable energy introduces into the western electricity grid when the sun doesn’t shine and the wind doesn’t blow.
And if people are honest about the full cost and complete carbon life cycles of both renewables and fossil fuel energy, more states will get on board, he said.
Gov. Mark Gordon visits with Casper business leaders Feb. 13 2024 in Casper. (Dustin Bleizeffer/WyoFile)
“If we can extend the life of these coal plants [by retrofitting them to capture carbon] for a period of time, we can meet that gap,” Gordon told members of Advance Casper, the city’s business and economic development group.
Gordon has been aggressively sharing his energy vision of late. He spoke last fall at Harvard University, which drew a strong rebuke from Wyoming’s far right. He also appeared on “60 Minutes,” where the governor discussed making the state carbon-negative.
One challenge, Gordon explained to members of Advance Casper, is that states that are demanding low-carbon or carbon-free electricity are not fairly distributing those costs, which include the loss of viewsheds and wildlife habitat from wind and solar farms in Wyoming. At the same time, those states don’t want to help pay to capture carbon at Wyoming coal plants, despite their own carbon policies that push costs onto Wyoming ratepayers.
“We need to be able to have the grid pay for the desire to reduce carbon emissions — that’s consumers across” the West, Gordon said.
To that end, Gordon has been lobbying his counterparts in the Western Governors Association. Gordon was elected WGA president last summer, and he established “Decarbonizing the West” as his signature initiative during his one-year tenure.
A sticker at Nerd Gas Co. in Casper. (Dustin Bleizeffer/WyoFile)
The initiative spans an all-of-the-above energy strategy, from nuclear and geothermal power to smarter siting of wind and solar development. Bringing some of those western state leaders onboard with his ideas for adding carbon capture to fossil fuels is still a challenge, Gordon said.
Meantime, the Biden administration — although it’s onboard with Wyoming’s carbon capture research efforts — continues to present existential threats to the state’s struggling fossil fuel industries through restrictive rulemakings to cut carbon emissions, the governor maintains.
State of the state’s energy
In his State of the State address on Monday at the Capitol, Gordon said the Legislature’s task of crafting a state budget for the next two years is particularly challenging under the weight of federal policies that the Biden administration continues to pile on fossil fuels — an industry that has “anchored our economy for over a century,” Gordon said.
The weight of Wyoming’s fossil fuel economic anchor has varied greatly in recent years, and it’s the largest factor in setting the state’s budget — in boom times and in bust. Although revenue from Wyoming’s carbon-based energy industries rebounded after the economic shock of the pandemic, markets have begun to settle back into broader trends that point to a continued decline in Wyoming coal consumption and the potential for even more volatility for oil and natural gas.
Gov. Mark Gordon gives his State of the State address Feb. 12, 2024, at the Capitol in Cheyenne. (Ashton J. Hacke/WyoFile)
They also represent a federal policy agenda that is “misguided,” “warped” and “unwise” — and, borrowing from a phrase by Gulf War military leader Gen. Norman Schwarzkopf, they amount to “pure, unadulterated ‘bovine scatology,’” Gordon declared.
“Wyoming people know how these policies have left our nation more vulnerable to put our economy — our very way of life — at risk,” Gordon said.
Mauna Loa is WMO Global Atmosphere Watch benchmark station and monitors rising CO2 levels Week of 23 April 2023: 424.40 parts per million Weekly value one year ago: 420.19 ppm Weekly value 10 years ago: 399.32 ppm 📷 http://CO2.Earthhttps://co2.earth/daily-co2. Credit: World Meteorological Organization
Future leaders panel with Gregor MacGregor. Photo credit: Andrew Teegarden
Phil Weiser and Dan Gibbs. Photo credit: Andrew TeegardenPanel discussion Colorado Water Congress 2024 Annual Convention. Photo credit: Andrew Teegarden
The Colorado Water Congress (CWC) winter convention in Aurora, CO has been buzzing with excitement. The conference kicked off with a series of water related workshops. Gregor MacGregor, Director of the Acequia Assistance Project at the Getches-Wilkinson Center (GWC), moderated a panel on the future generations of water leaders. One of the panelists, Mary Slosson, a 3L at the Colorado Law school, talked about the uncertainties of a legal profession in the water space. All of the students on the panel echoed the idea that we need young leaders to help drive change and that doing so requires organizations to work with the next generation of leaders to remove the barriers to access a career in the water sector. While this was happening, Jackie Corday with Corday Natural Resources Consulting, gave a training on SB23-270, describing how members within the state can restore natural streams without needing to obtain a water right. Other notable highlights included Author Erica Gies presentation on her recent book Water Always Wins which describes how to work with water rather than against it. The conference also jumped into the practical side of water by examining drought, resilience, and risk.
The first day of the conference ended with the POND casino night. The casino night has been a reoccurring event of the winter CWC convention because many of the conference topics center around risk tolerance. During the event, members of the Colorado Water Congress Board and I served as blackjack dealers for the night and helped people press their luck!
Day two of the conference focused on federal funding updates, legislative priorities, and how Colorado leaders plan to address our current issues. KC Becker, EPA Administrator for Region 8, talked about the funding available under the Bipartisan Infrastructure Law and Inflation Reduction Act. KC estimated that Colorado will see approximately $140 million dollars each year over the next three years to use for implementing water projects with an emphasis on disadvantaged communities. In addition, various mayors from across the state discussed how the legislature needs to begin integrating water planning and land use. Specifically, how replacing lawns and other non-usable grass with turf will help cut down on unnecessary water usage. Day two ended with a conversation between Dan Gibbs, the Executive Director of DNR and Phil Weiser, the Colorado Attorney General. They discussed the passion they share for the water community and the need for all water users to come together collectively and compromise to assure a water secure future for Colorado. Phil even gave a shoutout the the late Charles Wilkinson, Colorado Law Professor and namesake of the GWC, for the impact he had on both Phil and the larger water community.
The final day of the conference focused on cooperative action, what priorities states are looking to advance, and recognizing Kevin Rein with the Honorary Life Membership Award for his work as the Colorado State Engineer and Director of the Division of Water Resources. Members of the lower basin pointed to the 2007 guidelines, including the Drought Contingency Plan, and agreements with Mexico as major milestones in the cooperative effort to bridge the gap between the lower and upper basin. States also replied that we must begin looking for unique ways to save water whether that be infrastructure projects, cooperative agreements, or water conservation measures. Ultimately, it will take all of us to align our water usage and supply.
Clearly, a lot of ground was covered during CWC’s winter convention. If there was one take away, it would be that we need to begin analyzing the risk of inaction. [ed. emphasis mine] If we keep waiting to take a stance or begin water infrastructure projects, we will only hurt Colorado and the Colorado River Basin in the long run. One way we can reduce the risks is by working with one another and allowing water to shape the future of our actions.
Click the link to read the article on the InkStain website (John Fleck):
February 10, 2024
Folks in Colorado’s San Luis Valley are engaged in a bold experiment in western water management – charging farmers for the water they use. Jerd Smith [Fresh Water News] explains:
The challenge in the valley is that, with climate change inexorably chomping at the Rio Grande, and the groundwater used to replace the river’s dwindling irrigation supplies, there simply isn’t enough water to keep farming all the acreage they’ve got up there.
The valley is operating under the same two constraints that we see up and down the river – less water flowing in, and requirements established in the Rio Grande Compact to pass some of what does come in to folks downstream – Colorado can’t use it all, but must pass some water along to water users in central New Mexico. Those of us in central New Mexico’s “Middle Rio Grande” (the stretch from Cochiti through Albuquerque to Socorro) get to use some, but must pass some of on to farmers in Southern New Mexico. Under the deal now pending before the U.S. Supreme Court, the southern New Mexican’s (the Elephant Butte Irrigation District and Las Cruces area) must then pass some water across the border to people in Texas and Mexico.
PAYING TO REDUCE USE: PRIVATE V. PUBLIC GOODS
In each of those stretches – Colorado, central New Mexico, and southern New Mexico – we face the challenge of reducing use in order to meet downstream obligations.
In New Mexico, our approach to problems like this has been to treat the water as a private good, and pay its users to not use the water. This year, for example, a pipeline of money from the federal government, through the state, to our local water agency, the Middle Rio Grande Conservancy District, is paying irrigators $700 an acre to not irrigate.
The approach in the San Luis Valley is different. There, farmers who want to pump groundwater (recognizing that groundwater and surface water are an interconnected part of a single system, and that as river flow declines farmers have been pumping groundwater to replace it) have to pay for it. If you want to pump more, you have to pay more. And as it gets scarcer, the price needs to go up.
The legal terminology involving the notion of property rights here is tricky, but as a practical matter this suggests two very different approaches. In New Mexico, we are treating the water as the irrigators property, and paying them to forego its use. In Colorado, they’re treating it as public property, and requiring them to pay if they want to use it.
THE COASIAN SOLUTION
Students of the Berrens-Fleck Lab will recognize this as a version of the classic problem of assigning the property right, as laid out by Ronald Coase in his classic 1960 paper The Problem of Social Cost. Overuse of water in a climate change-constrained system is a classic “externality” – a burden pushed off onto others, rather than the people who get to benefit from the use of water. [ed. emphasis mine]
Coase’s answer – “assign the property right!” – has made his paper one of the most-cited papers in the history of papers, and won him a Nobel prize. Coase’s argument is that by assigning the property right, and starting from that point to figure out who pays and how much to solve the problem, we can converge on solutions. You can either make the people being harmed pay to stop the harm, or the people causing the harm pay to stop the harm.
We can, for example, require the factory polluting our river pay the cost of installing pollution control equipment. Or we can make the folks downstream, or the community as a whole, pay. Either way will work. The question of which approach we take is an ethical and political question.
Colorado has chosen (or at least is trying to chose – this’ll end up in court) one approach. New Mexico has chosen another.
CARTOON COASE
This is a cartoon of Coase’s argument. In the paper (which is a terrific read) he’s making a more nuanced argument involving transaction costs. In both the New Mexico and Colorado cases, the cost of setting up the payment system makes actually carrying out the policies we need super hard. But the cartoon helps frame our approach to western water management challenges more broadly.
This image is fake. There also is no Large Container Ships Full of Money Act. I made that up too. It’s really the “Build Inflation Better Act” or something, I can never get that right. Graphic credit: John Fleck/InkStain
The Colorado example – charge more to use water! – is rare. In the Lower Colorado River right now, we’re paying farmers, through their agricultural districts, giant container ships full of money to reduce their use – the New Mexico approach. We’re treating the water as their property, and paying them not to use it. This is an ethical and political (and possible legal?) choice.
But the key difference between the New Mexico/Lower Colorado approach and the classic Coasian cartoon is who’s doing the paying. In both cases, at least for now, we’re using Other People’s Money (OPM), via the recently passed Large Container Ships Full of Money Act (LCSFMA). Those of us in the West have somehow worked a racket where folks in Maine and Georgia and elsewhere are paying to bail us out of our mess. (To be fair, I’m sure we’re bailing them out in some way too.)
The processes by which we have to figure out how to move all this money and water around – to pay people to not use water, or to charge them for the water they use – are a great example of the power of the deeper insights in Coase’s 1960 paper. Working out the ways things don’t match up to Cartoon Coase is where the real value of the intellectual framework is found.
SOURCES AND METHODS
Two huge thanks. First, to Daniel Rothberg, whose Western Water Notes alerted me to the issue. And to Jerd Smith, for supporting and publishing the great water journalism we all need to understand these issues. If you can, I’d encourage you to contribute to one or the other or both, to support the fundamental underlying knowledge base we all need to move forward on climate change and western water issues.
The Rio Grande flows near Albuquerque as the sun rises over the Sandia Mountains. (Photo by Diana Cervantes for Source NM)
Click the link to read the release on the NRCS website:
February 7, 2024
A series of storms in early January help boost snowpack and precipitation totals across the state. In addition, an early February storm added to totals across all major basins bringing much of the state’s snowpack closer to normal for this time of year. Above normal precipitation was observed across the state in January ranging from 115 percent of normal in the combined San Miguel-Dolores-Animas-San Juan River basin to 149 percent of normal in the Arkansas River basin. Despite these gains, there is still room for improvement especially in the state’s southern river basins. NRCS Hydrologist Joel Atwood comments that “Colorado river basins received substantial precipitation in the first half of January, then recently in the first week of February, which has helped boost the snowpack. Despite these improvements, volumetric streamflow forecasts for most locations remain below normal.”
February forecasts for streamflow volumes were generally below normal. Rivers draining the western side of the Continental Divide north of the combined San Miguel-Dolores-Animas-San Juan River basin have the most optimistic runoff forecasts. Nevertheless, rivers draining further west are less optimistic. The Sangre De Cristo Mountains have some of the worst streamflow outlooks in the state due to the low snowpack and precipitation in that area. The forecast point on Sangre De Cristo Creek has a particularly dismal forecasted streamflow volume, at 25 percent of normal. The Arkansas and the Upper Rio Grande River basins are forecasted to have 90 and 74 percent of normal, respectively. Atwood continued further “The water supply in the high country is still recovering from a dry fall, therefore more storms are needed to improve spring runoff volumes across the state. With El Nino conditions in the Pacific, there is some optimism that more moisture will be directed at Colorado in the next couple of months.”
Current reservoir storage across the state reflects streamflow runoff trends over the last several years. In some cases, streamflow runoff trends were also impacted by reservoir management needs in the broader region. The Colorado Headwaters, Upper Rio Grande and the Arkansas River basins ended January with above normal reservoir storage, at 112, 119 and 113 percent of normal, respectively. The Eastern Arkansas and the combined San Miguel-Dolores-Animas-San Juan River basins have the lowest reservoir storage numbers in the state with 83 and 87 percent of normal, respectively.
The Climate Dictionary is an initiative aimed at providing an everyday guide to understanding climate change. It seeks to bridge the gap between complex scientific jargon and the general public, making climate concepts accessible and relatable to individuals from various backgrounds and levels of expertise.
The concept is driven by the belief that empowering people with knowledge is crucial in fostering action and collective responsibility towards addressing climate change.
By utilizing a creative combination of compelling visuals, concise explanations, and engaging storytelling, “The Climate Dictionary” effectively communicates complex climate concepts in a user-friendly and visually captivating manner. The publication features a series of climate-related term or phenomenon. The content is meticulously crafted to cater to diverse audiences, catering to both the scientifically inclined and those with limited prior knowledge of the subject.
Today the U.S. Fish and Wildlife Service (FWS) announced revisions to their incidental take permitting program under the Bald and Golden Eagle Protection Act. The final rule includes a general permit for wind energy projects that exhibit a demonstrably low risk to eagles. Audubon and partners submitted recommendations to make permitting more efficient in ways that support the buildout of wind energy while benefitting Bald and Golden Eagle conservation.
“Bald Eagles and Golden Eagles are deeply important to our nation, and this rule sets a new precedent for how the U.S. Fish and Wildlife Service will work with clean energy developers to avoid and minimize impacts to these iconic birds at wind energy sites as well as transmission,” said Marshall Johnson, chief conservation officer of the National Audubon Society. “We congratulate the Service and the Migratory Bird Program for their hard work in creating a pathway to a more efficient permit program where wind energy companies commit to conservation measures, monitor and share data on eagles at their project sites, and help manage Bald and Golden Eagle populations across the country.”
This funding will prevent approximately 11,661 tons of salt each year from entering the Colorado River. Quantified economic damages due to salinity in Colorado River water is currently about $332 million per year in the United States. It is estimated that damages would increase to $631 million per year without the Colorado River Basin Salinity Control Program.
“These awards will make improvements to off-farm irrigation systems like ditches and laterals in the Upper Basin States and prevent economic damages to downstream users by improving Colorado River water quality,” said Clarence Fullard, program manager for Reclamation’s Colorado River Basin Salinity Control Program. “When the projects are complete, they will benefit crop production and decrease water treatment costs and damage to water supply infrastructure in Lower Basin States.”
These projects were selected through a competitive process, open to the public. Reclamation solicits, selects and awards grants through Notice of Funding Opportunity announcements to projects sponsored by non-federal entities that control salt loading in the Upper Colorado River Basin. One of the primary selection criteria is the lowest cost per ton of salt controlled. Reclamation will distribute the $17.5 million over the next 4 years to the state of Colorado and $3.4 million to the state of Utah.
You watched the news this morning, and the meteorologist told you snow is coming this weekend. Conversations at the coffee shop and the break room at work center around the amount of snow we might get. But now you actually want to know, “how much am I going to get at my house?” What if you’re driving somewhere else? Might be helpful to know how much other places are going to get too. Look no further. You’re going to want to bookmark one of these links below!
72-hour snowfall accumulation forecast for February 8-11 over the Intermountain West. NOT CURRENT Credit: NOAA Weather Prediction Center
Pull up your weather app, and it’s likely to tell you “chance of snow, high of 29°F, 2-3″ of new accumulations,” or something similar. But that accumulation is just for the morning. Or afternoon. Or one brief time-period that is only one part of a total storm that has passed through. It’s hard to figure out the forecast total for the entire event from your weather app! Bookmark the links below for easy access to forecast snow accumulations.
Intermountain West Ski Dashboard – not only does our ski dashboard provide a 7-day precipitation outlook, you can find 72-hour forecast snow accumulations like the one above (not current, from last week!). The 10th percentile map gives you an idea of a “low end” amount, the 50th percentile represents the most likely amount, and the 90th percentile map gives you the “high end” amount.
National Weather Service Probabilistic Snow Forecast – The Boulder Weather Forecast Office has a wonderful winter page that shows snow forecasts for the entire state of Colorado. Included are the official snow total forecasts, with low end and high end amounts included. There are also probabilistic maps, so you can see the likelihood that your location will receive 2 inches, 6 inches, 10 inches (and other totals) for the next storm passing through.
Snowfall Forecast Maps for Many Locations – the following link takes you to the snowfall forecast for the Contiguous United States (CONUS). Change “CONUS” in the URL to any Weather Forecast Office 3-letter identifier and you’ll zoom into that area. Or change “CONUS” to a state, such as “WY_state_Snow.png” to see any state’s snowfall forecast map. Thanks to Mark Ellinwood, and his informational post on X for this great resource!
It snowed! Woohoo! You’ve taken pictures of your patio furniture and lawns. You’ve captured slo-mo videos of pretty snowflakes falling from the sky. You can go out into your own yard and measure the depth with a ruler. But… it is kinda cold. Also, you want to see the snowfall totals from other locations than just your backyard. Where do we find that information??
Snowfall Accumulation Maps AFTER the Event
The storm ended and you’re watching the news for totals. They tell you the official amount in Denver (which actually comes from Denver International Airport… or practically Kansas!). They share a short-list of other locations around the state – Boulder, Vail, Greeley. But they missed your town! Okay, make sure you have one of these bookmarked to get at that extra info you’re craving!
Intermountain West Ski Dashboard – Back to the top of our ski dashboard page and you’ll find 24-hour, 48-hour, and 72-hour snowfall maps for the Intermountain West. These maps are generated by NOHRSC (pronounced know-risk), using observation data combined with models to estimate total snowfall at every point.
NOHRSC Interactive Snow Information – Going directly to the NOHRSC page, you can set up your own preferences. Zoom into the area you want, pick the product that you want, add county lines or highways. Once done, scroll to the bottom, and on the left, you’ll see options to link to the image directly (“Link to latest image”) or to the page with the latest updates (“Link to latest page”).
CoCoRaHS New Snow Maps – gridded maps are cool, but station maps are cooler. Find the snowfall totals from thousands of CoCoRaHS volunteer observers. On this page, you can zoom into an area, pick the time period you want, make sure to select snowfall, and see the totals. Click on a station for more details!
Month-to-date snowfall accumulations from CoCoRaHS volunteers. Check out that 48.9″ accumulation in southwest Colorado. That’s a lot of snow in 11 days! Credit: CoCoRaHS
Hopefully you’ve found one of these links helpful. Or maybe you’ve used links to other resources. Share where you get your information to further add to this database of helpful snowfall forecasts and totals!
My kids and their friends built a small terrain park in front of their house near Sloans Lake after the March 2003 St. Patrick’s Day blizzard.
Humpback chub occupied range and critical habitat.
Credit: Julie Stahli/USFWS
Click the link to read the article on the KUNC website (Alex Hager). Here’s an excerpt:
February 10, 2024
Federal water managers proposed a new plan to protect native fish species in the Grand Canyon, but conservation groups say it doesn’t go far enough. Water levels in Lake Powell, the nation’s second-largest reservoir, have been dropping to historic lows as the region struggles to rein in demand in response to dry conditions fueled by climate change. Those low water levels have allowed non-native fish to pass through the Glen Canyon Dam, which holds back Lake Powell, and eat native fish that live on the other side, in the portion of the Colorado River that runs through the Grand Canyon. The native species at issue is the humpback chub, which is found nowhere on earth besides the Colorado River and its tributaries. It was previously considered “endangered,” but was downlisted to “threatened” in 2021. The fish still receives protections under the Endangered Species Act.
Lake Powell’s decline is seen in these photos of Glen Canyon Dam taken a decade apart. On the left, the water level in 2010; on the right, the water level in 2021. (Source: Bureau of Reclamation)
Lake Powell, which began filling in the 1960s, was stocked with non-native fish such as smallmouth bass for recreational fishing in 1982. Smallmouth bass prefer warm water near the reservoir’s surface. Now that the surface of the reservoir is dropping, the fish are able to move low enough to enter the tubes inside Glen Canyon Dam that allow water to pass from one side to the other. The Bureau of Reclamation, the federal agency which manages the West’s dams and reservoirs, released a draft plan for water releases from the dam in northern Arizona. It proposed five new ways to manage releases from the dam in an effort to keep native fish thriving in the Colorado River below Lake Powell — four of which involve attempts to make the water cooler and disrupt the spawning patterns of non-native fish…
This 2023 diagram shows the tubes through which Lake Powell’s fish can pass through to the section of the Colorado River that flows through the Grand Canyon. Credit: USGS and Reclamation 2023
Taylor McKinnon, Southwest director for the Center for Biological Diversity, takes issue with two components of the draft plan. The first, he said, is a tangible change. McKinnon encouraged federal water managers to consider making physical changes to the dam intakes themselves — like adding screens — to prevent fish from passing through…The second issue McKinnon described is more of an ideological one. He said federal water managers are not doing enough to look at the long-term viability of the reservoir in the face of a drying climate.
“Federal agencies need to become proactive,” he said. “They need to look at the science. They need to look at the forecasts for future Colorado River flows in one decade, two decades. All that information indicates that Glen Canyon Dam is facing climate-inevitable deadpool and climate-inevitable obsolescence.”
The back of Glen Canyon Dam circa 1964, not long after the reservoir had begun filling up. Here the water level is above dead pool, meaning water can be released via the river outlets, but it is below minimum power pool, so water cannot yet enter the penstocks to generate electricity. Bureau of Reclamation photo.
Shoshone Falls hydroelectric generation station via USGenWeb
Click the link to read the article on the KUNC website (Alex Hager). here’s an excerpt:
February 9, 2024
The purchase [of the Shoshone Power Plant non-consumptive use hydropower rights] represents the culmination of a decades-long effort to keep Shoshone’s water on the west side of Colorado’s mountains, settling the region’s long-held anxieties over competition with the water needs of the Front Range, where fast-growing cities and suburbs around Denver need more water to keep pace with development. Even though the Shoshone water rights carry an eight-figure price tag, the new owners will leave the river virtually unchanged. The river district will buy access to Shoshone’s water from the plant operator, Xcel Energy, and lease it back as long as Xcel wants to keep producing hydropower. The water right is considered “non-consumptive,” meaning every drop that enters the power plant is returned to the river. The river district wants to keep it that way as long as they can and ensure the water that flows into the hydroelectric plant also flows downstream to farmers, fish and homes.
The river district is rallying the $98.5 million sum from local, state and federal agencies. The district has secured $40 million already, with deals in the works for the remainder. It’s rare for a big-money water deal to find this kind of broad approval from a diverse group of water users. But the acquisition is seen as pivotal for a wide swath of Colorado, and has been co-signed by farmers, environmental groups and local governments…Shoshone’s water right is one of the oldest and biggest in the state, giving it preemptive power over many other rights in Colorado. Even in dry times, when cities and farms in other parts of the state feel the sting of water shortages, the Shoshone Hydroelectric Plant can send water through its turbines. And when that water exits the turbines and re-enters the Colorado River, it keeps flowing for myriad users downstream…
The hydro plant itself produces relatively little energy. Its 15 megawatt capacity is only a small fraction of Xcel Energy’s total Colorado output of 13,100 megawatts. Shoshone’s capacity is enough to serve about 15,000 customers, which is less than a quarter of the population of Garfield County, where the plant is located. But the power plant has held legal access to water from the Colorado River since 1902, and can claim seniority over the vast majority of other water owners in the state. That kind of seniority means power and certainty for whoever owns it. And that has raised the hackles of Western Colorado water users, who worry that water users in other parts of Colorado might be interested in buying Shoshone’s water right…The Colorado River District’s plans to buy Shoshone’s water have rallied widespread support, largely because of the transfer’s widespread benefits. Perhaps no constituency will benefit from the move as much as the one that lives in the river itself…Standing on the banks of the Colorado River in Grand Junction, [Dale] Ryden looked out over a murky, meandering stretch of water. It’s part of the “15 mile reach,” a critical section of the river about 80 miles west of the Shoshone plant. The reach is filled partly by water exiting Shoshone’s turbines. Ryden explained that this section of river is home to a variety of species, some of which are endangered, and some which are found nowhere else on earth besides the upper portions of the Colorado River. Those species – with funky names like the flannelmouth sucker and the humpback chub – rely on this stretch of river for virtually every aspect of life.
This map shows the 15-mile reach of the Colorado River near Grand Junction, home to four species of endangered fish. Map credit: CWCB
“New plot using the nClimGrid data, which is a better source than PRISM for long-term trends. Of course, the combined reservoir contents increase from last year, but the increase is less than 2011 and looks puny compared to the ‘hole’ in the reservoirs. The blue Loess lines subtly change. Last year those lines ended pointing downwards. This year they end flat-ish. 2023 temps were still above the 20th century average, although close. Another interesting aspect is that the 20C Mean and 21C Mean lines on the individual plots really don’t change much. Finally, the 2023 Natural Flows are almost exactly equal to 2019. (17.678 maf vs 17.672 maf). For all the hoopla about how this was record-setting year, the fact is that this year was significantly less than 2011 (20.159 maf) and no different than 2019” — Brad Udall
Will seven Western states be able to rapidly craft a voluntary plan to keep the Colorado River afloat for decades to come? It’s increasingly unclear, as negotiations have foundered between two sides, according to key players. There are sharp differences between northern and southern states’ proposals, with representatives of the mountainous Upper Basin states of Colorado and New Mexico unwilling, to date, to shoulder large future cuts, both because of historic underuse of their share of the river and because of heavily populated California and Arizona’s historic overuse. The southwestern states have for years taken twice as much as their northern neighbors.
Total losses (evaporation and riparian ET) from Reach 1 through Reach 5. Credit: USBR
Upper Basin officials, including Colorado’s plainspoken river commissioner, Becky Mitchell, said they have been informed of a proposal under discussion by California, Arizona and Nevada, collectively known as the Lower Basin, where the Lower Basin and Mexico would agree to take 1.5 million acre-feet of water less from the shrinking river each year. Mitchell said far more details are needed. That amount would be enough to both to make up for evaporation and leakage from delivery canals snaking across the hot desert, and to help stabilize the nation’s largest reservoirs, based on a report released Thursday by the U.S. Bureau of Reclamation that showed average annual losses to evaporation and river banks of 1.3 million acre-feet in the Lower Basin.
Lower Basin officials, including California’s Colorado River commissioner JB Hamby, who is leading the state’s negotiating team, declined to confirm numbers while they hash out specifics, but pointedly said major reductions need to be contributed by every state. One California official did confirm the numbers. Tom Buschatzke, Arizona’s top representative on the river talks, also wouldn’t confirm the 1.5 million acre-feet number, but emphasized the structural magnitude of what the Lower Basin is offering to do, noting his state and California, with help from Nevada and Mexico, would address evaporation and leakage for decades to come, and contribute more atop that to help stabilize the system. But, he said, more needs to be done, by everyone.
“It’s hugely important for folks to know that the Lower Basin is going to step up, and that we see a desire and a need for the rest of the problem to be solved collectively,” he said. “We can’t do it all. It is not physically possible.”
[…]
“There’s been a couple times when I’ve tried to be quieter or politer to make myself heard, and it hasn’t worked,” Mitchell said. “What we’re fighting for is too important to make myself small to make myself feel comfortable.” via @ShannonMullanehttps://t.co/tNWw8yOgsX
For now, negotiations between the two sides have ground to a halt, even as a deadline looms to produce a draft agreement by next month. The last time representatives from all seven states met face to face was in early January, when they convened at the Woolley’s Classic Suites, at Denver Airport. Since then, at the urging of U.S. Reclamation Commissioner Camille Calimlim Touton, there have been two Zoom calls with all the states that highlighted the fundamental differences, one participant said. The northern states recently invited their southern counterparts to Salt Lake City to resume full talks, but none chose to attend.
“We’ll keep inviting them,” Mitchell said. “I do not think we are at an impasse, and I do not believe we need to be at an impasse.”
Click the link to read the article on the NOAA website (Tom Di Liberto):
February 8, 2024
On a brisk early February morning, all of us El Niño-Southern Oscillation (ENSO) forecasters emerged from our burrows and saw our shadows. That can mean only one thing: conditions are favorable for the development of La Niña within the next six months. Yes, the February ENSO Outlook officially announces that we are in a La Niña Watch, even while, at the current moment, the Pacific Ocean remains in an El Niño (this is simultaneous to the ongoing El Niño Advisory—here is an explainer to help sort it out). The outlook gives a 79% chance that El Niño will transition to ENSO-Neutral by the April–June period, and then a 55% chance the Pacific transitions into La Niña in June–August. Confused? I’ll explain it all without the help of any prognosticating rodents (take THAT, Punxsutawney Phil).
January 2024 sea surface temperature difference from the 1985-1993 average (details from Coral Reef Watch). Much of the global oceans are warmer than average. NOAA Climate.gov image from Data Snapshots.
El Niño’s current status
Let’s start with the here and now. At the current moment, El Niño remains across the equatorial Pacific Ocean. In January, sea surface temperatures remained above average across most of the Pacific, though temperatures fell a bit across the eastern and central Pacific. Monthly values in the Niño-3.4 region (the key tropical Pacific monitoring region for ENSO and the basis for the Oceanic Niño Index (see below) dropped from just over 2°C above average in December 2023 to 1.87°C above average in January 2024. Overall, the most recent Oceanic Niño Index (ONI) value—how NOAA classifies the strength of events—for November–January places this event’s peak strength at ~2°C, or the fifth highest on records back to 1950 (**).
Generalized Walker Circulation (December-February) anomaly during El Niño events, overlaid on map of average sea surface temperature anomalies. Anomalous ocean warming in the central and eastern Pacific (orange) help to shift a rising branch of the Walker Circulation to east of 180°, while sinking branches shift to over the Maritime continent and northern South America. NOAA Climate.gov drawing by Fiona Martin.
Atmospherically, El Niño weakened a bit as well over the last month. Remember, El Niño is an ocean-atmospheric phenomenon. During El Niño, the atmosphere over the tropics—the Walker Circulation—gets all jumbled up. The result in the Pacific is weakened trade winds, an increase in thunderstorm activity near the Dateline, and a reduction in thunderstorms across the Western Pacific (also, usually, across the Amazon). However, in January, the trade winds were closer to average across the equatorial Pacific, and while thunderstorm activity remained a bit elevated near the Dateline, it was instead closer to average across Indonesia in the western Pacific.
Put together, it looks clear that this El Niño event is past its peak. However, it’s important to remember that El Niño’s impacts on global temperature and precipitation can linger through April.
Water temperatures in the top 300 meters (1,000 feet) of the tropical Pacific Ocean compared to the 1991–2020 average in December 2023–January 2024. NOAA Climate.gov animation, based on data from NOAA’s Climate Prediction Center.
Is that all?
While everything I said above is all fine for the surface, the BIG story is happening underneath the sea surface in the Pacific. Averaged across the entire equatorial Pacific Ocean, ocean temperatures in the upper 300 meters returned to near-average for the first time in almost a year. And it’s clear that cooler-than-average ocean waters are widespread at depth and expanding eastward, even while above-average temperatures persist closer to the surface in the central/eastern Pacific.
Where is this all going?
That’s the million-dollar question. The seasonal prediction models that forecasters look to for guidance are pretty confident in a transition from El Niño to ENSO-neutral sometime during the northern hemisphere spring 2024. Following that, there is a general consensus among the models that La Niña will follow during the summer. Now when it comes to transitions, there is always a bit of uncertainty on the exact timing, as an El Niño can end in a hurry. After all, the current outlook has only a two-season difference between the end of El Niño (79% chance in April-June), and the start of La Niña (55% chance in June-August). And some of the influencers of that transition can be atmospheric patterns that are not forecastable this early on, like the Madden-Julian Oscillation or random weather events.
Animation of the NOAA Climate Prediction Center February 2024 ENSO forecast for each of the three possible ENSO categories for the next 8 overlapping 3-month seasons. Blue bars show the chances of La Niña, gray bars the chances for neutral, and red bars the chances for El Niño. Climate.gov animation based on graph by Michelle L’Heureux.
How common are transitions from El Niño to La Niña?
Going back to 1950, over half of the El Niño events were followed shortly thereafter by a transition to La Niña (after a brief period of time in ENSO-Neutral). So, it would not be at all uncommon to see this sort of potential outcome this year.
Breaking that down even more by looking at similar strong El Niños, five of the eight events since 1950 were followed by a La Niña. And that transition happened rapidly. Two years (1973 and 1998) had only one 3-month period of ENSO-Neutral conditions before switching to La Niña. Two years (1983, 2010) had two 3-month periods of ENSO-Neutral in between. And 2015 had three 3-month periods.
Suffice to say, the historical record suggests that if the equatorial Pacific moves from a strong El Niño into a La Niña, it doesn’t seem to waste its time.
We’ll keep our eyes on the Pacific for you to help narrow down when and how this El Niño will end. So check back with us next month!
Signed,
The most accurate mammalian weather/climate forecasters
** A pesky annoyance is the fact the 1965-66 El Niño also peaked at 2.0°C, but it did so only during the September-November and October-December seasons. By November 1965-January 1966, it was 1.7°C. So, if we rank just by November-January seasons, then the current 2023-24 event is ranked fifth. But if we rank by all near-winter seasons, then this event is basically tied for fifth.
A first of its kind U.N. study by conservation scientists finds nearly half of internationally protected migratory species are on their way to extinction.
Humans are driving migratory animals—sea turtles, chimpanzees, lions and penguins, among dozens of other species—towards extinction, according to the most comprehensive assessment of migratory species ever carried out.
The State of the World’s Migratory Species, a first of its kind report compiled by conservation scientists under the auspices of the U.N. Environment Programme’s World Conservation Monitoring Centre, found population decline, a precursor to extinction, in nearly half of the roughly 1,200 species listed under the Convention on Migratory Species (CMS), a 1979 treaty aimed at conserving species that move across international borders.
The report’s findings dovetail with those of another authoritative U.N. assessment, the 2019 Global Assessment Report on Biodiversity and Ecosystem Services, that found around 1 million of Earth’s 8 million species are at risk of extinction due to human activity. Since the 1970s, global biodiversity, the variation of life on Earth, has declined by a whopping 70 percent.
Scientists and economists use complicated models to try to predict how fast the world can transition away from fossil fuels. The Washington Post analyzed 1,200 modeled pathways for the world to shift to clean energy and found that only four of them showed the world hitting the 1.5C target without substantially overshooting or using speculative technology (like large-scale carbon capture) that doesn’t yet exist. At this point, many experts believe that the economy is too stuck on fossil fuels to transition fast enough for 1.5 degrees.
Does that mean we’ll pass catastrophic tipping points?
Arctic Ocean. Photo credit: The European Commission
That’s a more difficult question. Scientists don’t know exactly when certain tipping points — like the collapse of the Greenland ice sheet or the release of greenhouse gases from thawing permafrost — will occur. It’s very hard to predict and model these types of catastrophic changes.
And 1.5C isn’t a magic threshold; it’s not as though as soon as we pass that number, Antarctic ice sheets will collapse and ocean circulations will grind to a halt. But one thing is certain: For every tenth of a degree of warming, tipping points are more likely. Two degrees is worse than 1.9 degrees, which is worse than 1.8 degrees, and so on.
And at each tenth of a degree, the infrastructure and systems that the world has built — electric grids, homes, livelihoods — will become more strained. Our modern world simply was not designed for temperatures this high. At some level, the final temperature of the planet isn’t what matters most. It’s where countries can actually get carbon emissions to zero — and stop contributing to future warming altogether.
Click the link to read the article on The Washington Post website (Shannon Osaka). Here’s an excerpt:
It’s official: For the past 12 months, the Earth was 1.5 degrees Celsius higher than in preindustrial times, scientists said Thursday [February 8, 2024], crossing a critical barrier into temperatures never experienced by human civilizations. According to the European Union’s Copernicus Climate Change Service, the past 12 months clocked in at a scorching 1.52 degrees Celsius (2.74 degrees Fahrenheit) higher on average compared with between 1850 and 1900. At some level, that’s not surprising — the past 12 months have been scorching, as a warm El Niño cycle combined with the signal of human-caused warming generated heat waves and extreme weather events around the globe.
“This El Nino maximum is riding on top of a base climate that is continuously warming due to climate change,” Andrew Dessler, a climate scientist at Texas A&M University, said in an email. “The combination of them is what’s giving us such hot global temperatures.”
But does this mean that the world’s most famous climate goal is out of reach? Not … exactly. Here’s what you need to know:
In the 2016 Paris climate agreement, almost 200 nations agreed to keep the global average temperature from exceeding 2 degrees Celsius (3.6 degrees Fahrenheit) above preindustrial levels — and to “pursue efforts” to keep it below 1.5 degrees Celsius. The latter addition largely came from pressure from small-island states, who are at risk of disappearing under rising seas if temperatures get much higher. Scientists have shown that holding the temperature riseto 1.5C could mean the survival of coral reefs, the preservation of Arctic sea ice and less deadly heat waves…
Does this mean we have missed the 1.5C climate goal? No. There’s actually some disagreement about what exactly counts as breaching that threshold — but scientists and policymakers agree that it has to be a multiyear average, not a single 12-month period. Scientists estimate that without dramatic emissions reductions, that will happen sometime in the 2030s. But there could be other single years or 12-month periods that cross the line before then.
Can we still avoid passing 1.5C? Most scientists say passing 1.5C is inevitable. “The 1.5-degree limit is deader than a doornail,” Columbia University climate scientist James Hansen said in a call with reporters late last year.
ChatGPT 4’s image of a fox crossing the Yampa River February 11, 2024
Click the link to read the assessment on the NOAA website:
FEBRUARY 8, 2024
An arctic air mass brought bitter cold and snow to much of the nation in mid-January; powerful storms brought heavy rainfall and flooding to parts of the southern Plains
Key Points:
The arctic air mass from January 14–18 broke nearly 2,500 daily minimum temperatures county records from the Northwest to the Lower Mississippi Valley.
On January 22–25, heavy rainfall brought more than a month’s worth of rain and life-threatening flooding to parts of Texas and Louisiana.
January 2024 was the 10th-wettest January on record for the nation, and temperature ranked in the middle third of the historical record for the month.
Other Highlights:
Temperature
The average temperature of the contiguous U.S. in January was 31.8°F, 1.6°F above average, ranking in the middle third of the 130-year record. Generally, January temperatures were above average from the Carolina Coast to the Northeast and across parts of the West Coast, central Rockies, Upper Midwest and Great Lakes, with below-normal temperatures extending from parts of the Northwest to the Gulf of Mexico. Wisconsin had its 10th-warmest January on record.
The Alaska statewide January temperature was 2.9°F, 0.7°F above the long-term average, ranking in the middle third of the 100-year period of record for the state. Near-normal temperatures were observed across much of the state with above-normal temperatures observed in parts of the North, West and the Aleutians. Below-normal temperatures were observed in parts of the Interior and East.
Precipitation
January precipitation for the contiguous U.S. was 3.18 inches, 0.87 inch above average, ranking as the 10th-wettest January in the historical record. Precipitation was above average across much of the eastern U.S. and in parts of the West. Massachusetts and Connecticut ranked third wettest. Conversely, precipitation was below average from parts of the northern Rockies to portions of the Upper Midwest and in parts of the Southwest and coastal Carolinas. North Dakota had its 10th-driest January on record for this period.
Alaska’s average monthly precipitation ranked in the middle third of the historical record. Precipitation was below average across much of the state, while above-normal precipitation was observed in parts of the southeast Interior, Panhandle and the Aleutians during the month.
Other Notable Events
An arctic air mass brought record-breaking cold temperatures and snow to much of the contiguous U.S. during mid-January:
The mid-January arctic air mass dropped temperatures to 20 to 35°F below normal over parts of the northern and central Plains, while heavy snow fell over portions of the Great Lakes and the Northeast. The lowest temperature in the country occurred in Briggsdale, Colorado, with a low temperature of −35°F the morning of January 16.
Heavy snow fell over much of the Northeast, while New York City reported over an inch of snow for the first time in nearly two years on January 16.
Nashville received over six inches of snow on January 15—more than an entire winter’s worth of snow for the city.
A powerful bomb cyclone brought cold temperatures, strong winds and heavy snow to portions of the Northwest on January 8–10, resulting in the Seattle NWS issuing the first blizzard warning in over 11 years for the region.
Historic snowfall continued across portions of Alaska. Anchorage has received over 100 inches of snow since October—the snowiest water year (October 2023–September 2024) to date. In Juneau, the airport received more than 76 inches of snow in January, the highest January total on record and second highest monthly total.
US Drought Monitor map February 6, 2024.
Drought
According to the January 30 U.S. Drought Monitor report, about 23.5% of the contiguous U.S. was in drought, down about 9.5% from the beginning of January. Drought conditions expanded or intensified across northern parts of the Rockies and Plains and in parts of the Northwest, Southwest and Puerto Rico this month. Drought contracted or was reduced in intensity across much of the Great Plains to the East Coast, parts of the Northwest, Southwest and Hawaii.
Monthly Outlook
Above-average temperatures are favored to impact northern portions of the U.S. in February while precipitation is likely to be above average across portions of the southwestern U.S. and Southeast Coast. Drought is likely to persist across portions of the Northwest, Southwest, Midwest, Hawaii and Puerto Rico. Visit the Climate Prediction Center’s Official 30-Day Forecasts and U.S. Monthly Drought Outlook website for more details.
Significant wildland fire potential for February is above normal across Puerto Rico. For additional information on wildland fire potential, visit the National Interagency Fire Center’s One-Month Wildland Fire Outlook.
This monthly summary from NOAA’s National Centers for Environmental Information is part of the suite of climate services NOAA provides to government, business, academia and the public to support informed decision-making. For more detailed climate information, check out our comprehensive January 2024 U.S. Climate Report scheduled for release on February 13, 2024. For additional information on the statistics provided here, visit the Climate at a Glance and National Maps webpages.
As the Stewardship Manager for Colorado Water Trust, I am lucky to have several interesting jobs outside of developing new projects. I write a monthly forecasting memo that helps our staff plan for the upcoming season’s operations. I travel around the state and visit our projects to ensure they are still operating as designed. I collect streamflow and water temperature data to inform project design. It’s all great work but there is one job that is arguably the most important; I maintain and update (read the next words in an important sounding voice) The Master Dashboard Accounting Spreadsheet.
This spreadsheet tallies the streamflow volumes and the number of river miles with improved flows. Volume and miles restored are the primary metrics that describe our impact. We must report accurate records to the Division of Water Resources, and our funders like to see our volume and mileage metrics, as well. Heck, the first thing you see on our website is a cool animation tallying up our volumes and stream miles. Just looking at the site now, I see that we have restored 73,242 acre-feet of water to 612 miles of Colorado’s rivers, which is very impressive… or is it? Honestly what do those numbers mean? Is our work important? Impactful? Let’s dig a little deeper to find a better way to highlight the benefits our work.
Let’s start with terms. Acre-feet is a weird one—it’s a very important term in the water world but doesn’t translate well to a general audience. Us water nerds often try to better explain the term. “An acre-foot of water is enough water to supply two average households for one year” we will say in a very serious tone. Great, so now we can visualize how many showers and toilet flushes the Water Trust has restored. Hmm… perhaps if we convert it to gallons it will make more sense. I see that we have restored 22.6 billion gallons—that sounds impressive! Let’s convert it to metric tablespoons to get a truly enormous number. Unfortunately, the human brain is epically bad at comprehending large numbers so perhaps we should look at this another way.
Rivers and streams are not simple units easily counted and categorized. Rivers are homes for fish, drinking water for towns, irrigation water for farmers, places of recreation, and focal points for communities in the arid west. Rivers are local and personal. Our Yampa River Project is a great example for examining the alternative metrics we can use to measure our impact on the river and the community that depends on it. Low summertime flows on the Yampa lead to high water temperatures that are unhealthy or even deadly to the trout who call the river home. To help protect the trout, Colorado Parks and Wildlife (CPW) is often forced to close the river to extremely popular recreational activities like angling and tubing. While the closures help keep fish alive, they severely impact summer tourism and the local economy. Since 2012, the Water Trust has partnered with the Upper Yampa Water Conservancy District, Colorado Water Conservation Board, City of Steamboat Springs, and the Yampa River Fund to release additional water from Stagecoach Reservoir 18 miles upstream of Steamboat. These releases help cool temperatures for the fish and keep the river open for recreation. Now, let’s take a closer look at some of the metrics that tell the story of our impacts to the Yampa and the Steamboat community.
Take a look at the plot below, which shows the flows in the Yampa River in Steamboat during the late summer of 2023. The blue shading shows the flows that the Water Trust released. Last summer, Water Resources Specialist, Blake Mamich, saw that dropping flows and high river temperatures were exceeding regulatory thresholds (which lead to river closures) so he acted quickly, coordinating releases to boost stream flows and keep the river cool.
Graphic credit: Colorado Water Trust
Let’s look at some of the metrics that help tell the story of this successful project. In 2023, the Yampa River Project:
Released water for 60 days, keeping the river cool to keep the city compliant with regulations.
Boosted flows for fish for nearly two months.
Averted 38 days of river closures, keeping the river open when it would have otherwise been closed for over a month during the busy tourism season.
Water Trust releases often accounted for over 30% of the entire flow in the Yampa River, and has accounted for over half of the flow in years past.
Now there are some metrics that show the impact of our work a little better than 3,288 acre-feet or one billion gallons. Let’s look beyond the flow numbers to see how the project is providing benefits to the upper Yampa community. A 2019 study by the Steamboat Chamber of Commerce found that summer tourism has a $166 million-dollar impact on the city which supports over 2,000 jobs. While I am not an economist, it’s not unrealistic to imagine that a 38-day closure of the river flowing through the heart of town would reduce those numbers. It’s also interesting to note that less than 2% of the economic benefits would easily pay for this project to run in perpetuity. Looking beyond the tourism impacts, the water continues to flow downstream of Steamboat where it is available to agricultural users along the length of the river. This project is also a long-term investment in sustainable river health as the Water Trust has operated this project in 10 of the last 12 years, providing a decade of benefits.
Digging more deeply into the impact of our projects really shows why our work is so important. They go beyond just putting flows into the river—they make tangible and long-term impacts on the habitats and communities that rely on healthy rivers across the state.
I will keep updating the Master Dashboard Accounting Spreadsheet and reporting our volume numbers since they are still very important to our work, but I promise to chime in here on occasion to highlight all of the benefits that our projects generate. So next year when you are reading the annual report and you see we have restored enough water to cover Manhattan Island to a depth of 5 feet*, know that there is a story behind the numbers.
*That is true by the way.
The Yampa River emerging from Cross Mountain Canyon in northwest Colorado had water in October 2020, but only the second “call” ever was issued on the river that year. Photo/Allen Best
Agrivoltaics are the pairing of solar energy—also known as photovoltaics—and agriculture. Some experts think it offers solutions that can help renewables better integrate with rural livelihoods and might also provide some enhancements for farming as we head into a hotter, drier, less predictable weather future.
As an example, Jack’s Solar Garden, on Colorado’s Front Range, has been a real leader modeling how agrivoltaics, farming and community can support each other. And now, such systems are beginning to sprout on the Western Slope as well.
As the need for fast deployment of renewables impacts rural communities, issues such as siting and who benefits become central concerns.
Smart co-location, including agrivoltaics where it makes sense, is one way to smooth the way for more clean energy to power farms and rural places. Community-solar is another way to ensure that communities are centered in the expansion of renewable energy.
Community-Solar can help put rural people at the center of the clean energy build-out.
Community-solar—think “solar garden”—is a shared solar system that provides a direct benefit from the power production at that facility to a group of community-based members or subscribers. Community-solar can increase energy equity by sharing the benefits of clean energy production and savings among a number of users, and can support the expansion of renewables by putting more members from impacted communities in the driver’s seat. It often is used to assist households that otherwise would be unable to afford or obtain individual solar systems in benefiting from the growth of clean energy.
In Delta County, the Colorado Farm & Food Alliance is part of a team of local leaders bringing agrivoltaics together with community-solar in a project at Thistle Whistle Farm on Hanson Mesa, outside the town of Hotchkiss. The Thistle Whistle project got a kick-start last spring when the Colorado Farm & Food Alliance and the team were awarded a stage 1 Community Solar Power Accelerator Prize, sponsored by the National Renewable Energy Laboratory. That competition is still on-going even as the Thistle Whistle project proceeds.
Photo credit: Colorado Farm & Food Alliance
National Community Solar Prize spurs project along.
Project proponents hope the latest submission will unlock the stage 2 funding award this spring, keeping things on track to put a community-owned, farm-integrated energy system into operation before next year. In any case, the National Community Solar Partnership, which helps administer the competition through the Hero X platform, also provides in-depth training, technical assistance, and a supportive cohort that has already moved this project forward.
You can learn more about this project and the inspiration behind it on this episode of Crisis to Comeback, a podcast by Kori Stanton and Citizens for a Healthy Community. She interviews Mark Waltermire, owner of Thistle Whistle Farm and a western Colorado agricultural leader.
To read more about how renewables can integrate with rural communities, check out this guest column by our director that recently ran in the Grand Junction Daily Sentinel: “Renewable energy: Get it right, but get it going”. And watch our blog, our social media, and in other outlets for updates as this and other projects progress.
+ UT nixes Bears Ears swap; Mining Law reform … NOT!
Though it sits just 10 miles from the Grand Canyon’s south rim, the controversial Pinyon Plain (née Canyon) uranium mine goes unnoticed by the millions of people who drive past it on their way to the national park. It’s tucked in among the trees about two miles off the highway, and its total above-ground footprint is a mere 17 acres — smaller than an upscale shopping center in Flagstaff.
Officials at Energy Fuels, Pinyon Plains’ operator, highlight the facility’s inconspicuousness when responding to opposition to plans to rev up the mine. Curtis Moore, Energy Fuels’ VP of marketing, told the Navajo-Hopi Observer in 2022 that the mine “is about as small and low-impact as commercial mining gets.” There’s no gaping open pit like those at the copper mines further south in Arizona nor hulking piles of waste rock and toxic tailings and, Moore insisted, the Pinyon Plain is the most heavily regulated conventional mine in the nation, which should prevent it from contaminating groundwater or the air.
Moore’s assurances don’t ease the concerns of many Havasupai people, however, who are affected by the mine in ways that transcend regulations and the scope of conventional Western science. “We have a belief system that they don’t understand,” Havasupai elder Carletta Tilousi told The Guardian in 2022. “In our stories, that area where the mine is located is Mother Earth’s lungs. So when they dug the mine shaft, they punctured her lungs.”
This is the sort of potential harm that almost never makes it into environmental impact statements or regulators’ considerations of proposed projects. That may be changing. The United States Geological Survey has published a new report on uranium mining near the Grand Canyon, one that incorporates Indigenous knowledge to identify exposure pathways that standard risk analyses might miss. The report, by Carletta Tilousi (Havasupai Tribe) and Jo Ellen Hinck (USGS), is an eye-opening read.
In the Grand Canyon-area, high-grade uranium ore often occurs in geologic features known as breccia pipes, prompting prospectors to stake hundreds of claims there from the 1940s to the 1980s, when the domestic uranium mining industry collapsed. Interest was revived in 2007, when prices shot up again, and more claims were staked. The Pinyon Plain Mine — which was developed years ago but never produced ore — sits a few miles from Red Butte, a landform held sacred by several tribal nations, and in Mat Taav Juudva, or “sacred meeting corridor” for the Havasupai. It is now within the boundaries of Baaj Nwaavjo I’tah Kukveni – Ancestral Footprints of the Grand Canyon National Monument. New mining claims can’t be staked here, but since Pinyon Plain was an existing, valid claim when President Biden established the monument last year, it is grandfathered in.
The Havasupai Tribe has pushed back against uranium mining for decades, saying it endangers their health, land, and culture. The Pinyon Plain Mine sits above the Redwall-Muav aquifer, and mining could contaminate this precious store of groundwater. Indeed, when the mine shaft was sunk in 2016, it encountered a perched aquifer, which drained into the shaft. This not only threatens the tribe’s drinking water, but also its very existence. The report quotes Havasupai Vice-Chairman Edmond Tilousi thusly: “If the R-Aquifer becomes contaminated, and we must abandon our ancestral home of Supai Village, we will leave the blue-green waters of Havasu Creek behind and consequently will cease to be the Havasuw Baja. While we may still breathe air, we, the People of the Blue Green Water, will have become extinct.”
The aquifers are just one exposure pathway. Others will appear in standard risk assessments of mines, like this one:
Typical conceptual site framework for a mining site that highlights human health and ecological risk assessment considerations. From Park and others (2020). Source: Conceptual Risk Framework for Uranium Mining—An Update to Include Havasupai Resources at Risk. Credit: The Land Desk
And yet others are typically overlooked. This updated contaminant exposure framework shows both the pathways revealed by standard analyses, and those identified through Indigenous knowledge and the Havasupai perspective:
Contaminant exposure framework for uranium mining in the Grand Canyon region from the Havasupai perspective. Photographs by Blake McCord and Dawn Beauty. Source: Conceptual Risk Framework for Uranium Mining—An Update to Include Havasupai Resources at Risk. Credit: The Land Desk
This new report, “Expanded Conceptual Risk Framework for Uranium Mining in Grand Canyon Watershed—Inclusion of the Havasupai Tribe Perspective,” gives a far more holistic view of mining and its impacts than standard analyses. As such, it gives a much more complete vision of what is actually at stake. Hopefully other researchers and federal agencies will take note and follow the authors’ lead.
I will admit that I was pretty psyched to hear that Congress was finally taking up mining law reform. After all, the General Mining Law of 1872 hasn’t been significantly altered since then President Ulysses S. Grant signed it into law. Isn’t it about time to tighten things up a bit and end the 152 years of public land giveaways? Apparently not.
Yes, Congress is considering the Mining Regulatory Clarity Act. But no, it is not reforming the law in a good way.
See, the law currently says that for a mining claim to be valid, the claimant has to prove it contains a valuable mineral deposit. And if it’s not valid, then a mining company can’t use or occupy the claim. For decades, this requirement was more or less ignored when it came to mining companies using invalid claims on public lands to store waste rock or mill tailings. But in recent years, judges have handed down some significant rulings — most notably the Rosemont decision — blocking mines from storing waste on invalid, unproven claims.
The “Clarity Act” pushed by Rep. Mark Amodei, a Nevada Republican, would essentially validate invalid claims by removing the “valuable mineral” requirement. The language from the bill reads: “A claimant shall have the right to use, occupy, and conduct operations on public land, with or without the discovery of a valuable mineral deposit,” if the claimant pays their location fee and annual maintenance fees.
In other words, it further loosens an already lax and antiquated law.
🤯 Annals of Inanity 🤡
It really seems as if the Republican-led Utah legislature is looking to one up Congress in the dysfunction department. Nearly every day we hear some news of boneheadedness coming out of Capitol Hill, and nearly every time it’s follow up by something even more head-scratching out of Salt Lake City.
This week’s moronic moment comes to you courtesy of Gov. Spencer Cox and his comrades in the legislature, who put the kibosh on a land exchangethat would have swapped out state parcels in Bears Ears National Monument for federal land outside the monument. You might be thinking that Utah felt like they were getting the short end of the stick here, and merely wanted to renegotiate. But in fact, as Utah’s School and Institutional Trust Lands Administration officials and Utah’s congressional delegation will tell you, the swap is a really good deal for the state and for the schools and institutions revenues from the lands support.
The exchange would allow SITLA (Utah’s School and Institutional Trust Lands Administration) to dispose of discrete parcels within the monument with minimal revenue-generating potential. In return, they’d receive consolidated blocks of Bureau of Land Management land in areas targeted for lithium, potash, uranium, helium, oil and gas, and/or residential development. Meanwhile the BLM would rid itself of the headache of dealing with all of these little inholdings within the monument. SITLA officials estimated the swap would net the state hundreds of millions of dollars in additional revenue over the long term, which was good enough for Utah’s entire congressional delegation to sign onto federal legislation that would have ratified the deal (it stalled out, however, which opened the door to this week’s withdrawal).
So what’s changed that would spur the withdrawal? Nothing. Cox and his Republican colleagues claim they made this imbecilic move because: the BLM “has signaled that it will adopt an exceptionally restrictive and unreasonable land management plan {for Bears Ears NM} that would negatively impact the communities surrounding the Monument and the state’s public school children…”
Yes, Utah’s elected leaders are throwing away hundreds of millions of dollars for public schools because they perceived “signals” about something they didn’t like. The draft management plan for Bears Ears NM hasn’t even been released, and even if it is restrictive as all get out, canceling the exchange will do nothing to change it. Nothing! All this little political circus act will do is, yes: Take money away from public school children.
In other words, this whole thing is merely an exercise in ideology-driven stupidity. Echoing their GOP brethren in Washington, D.C., Utah’s Republicans are acting against their constituents’ best interest in order to make a political point. Only not even they know what that point might be.
After a relatively wet January, snowpack conditions improved and are near-average in Utah (96%), slightly-below average in Colorado (87%) and below average in Wyoming (74%). Seasonal streamflow volume forecasts are below average for most locations except for northern Utah where forecasts predict average to slightly-above average seasonal streamflow. Regional coverage of drought remained steady at 15% and alleviation of some drought conditions in southwestern Colorado was offset by the development of drought in northern Wyoming. El Niño conditions are expected to continue through spring with above average precipitation and temperatures predicted for February.
Across the region, a patchwork of above and below average precipitation fell during January. Slightly-above average January precipitation was observed in northern Colorado, southern Wyoming and along the Wasatch Front and southwestern Utah. Much-above average January precipitation was observed in southeastern Colorado. Below average January precipitation, including large areas of less than 50% of average, fell in northeastern, south-central and northwestern Colorado and Utah and across all of northern Wyoming.
January temperatures were generally above average in the southwestern portion of the region and below average in the northeast. In Colorado and Wyoming, January temperatures were above average on the west side of the Continental Divide and below average east of the Divide with temperatures as cold as 10 degrees below average. Utah temperatures were generally 2 to 4 degrees above average but the eastern Uinta Basin saw temperatures up to 10 degrees warmer than average.
Regional snowpack at the end of January was a mix of near-normal and below normal conditions. Near-average snow water equivalent (SWE) was observed in northern Utah and northern Colorado. In southern Colorado, southern Utah and much of Wyoming, SWE was 70-90% of average. Snowpack in northeastern Wyoming and in the Yellowstone River Basin was much-below normal (50-70% average). Statewide SWE improved relative to average in Colorado (87%), Utah (96%) and Wyoming (74%).
Regional April-July streamflow volume forecasts are generally below to much-below average, except northern Utah where streamflow forecasts are near to above average. In most locations, forecasted streamflow volume increased compared to the January 1st forecast. Streamflow forecasts are lowest for the Dolores, Duchesne and San Juan River Basins. The forecast for the inflow to Lake Powell is 74% of average.
Total regional coverage of drought remains at 15% and unchanged since December. Drought development in northern Wyoming was balanced by drought improvement in southeastern Utah and southwestern Colorado.
El Niño conditions continue as ocean temperatures in the eastern Pacific were 1.5–2 degrees Celsius above average. All ocean temperature models are projecting a steady cooling of ocean temperatures and there is a 70% chance of El Niño conditions continuing through spring (March-May). This summer, there is a 65% probability of neutral ENSO conditions but by fall, there is a 60% chance of La Niña conditions developing. The NOAA monthly outlook for February suggests an increased probability of above average precipitation for Colorado, Utah and eastern Wyoming and above average temperatures for the entire region. During February–April, the NOAA seasonal forecast suggests an increased probability of above average temperatures for northern Utah and Wyoming.
January significant weather event: Early January storm cycles and avalanches. After a stormy early December in the West, very dry conditions prevailed across Colorado, Utah and Wyoming from December 10–January 4. Beginning on January 4 and lasting for 11 days, near-continuous storms impacted the Intermountain West and brought below and much-below average snowpacks to near-normal by January 15. River basins reached near-normal SWE conditions by January 15 including the Bear, Jordan, Yampa-White and Weber which received 3.5–5.5” of SWE. A few snotel sites in northern Utah received very high amounts of SWE from January 4–January 15 including 10.4” at Ben Lomond Peak near Ogden, 8.5” at Alta near Salt Lake City and 8.3” at Tony Grove Lake near Logan. With the combination of a month-long snow drought and the rapid addition of SWE to mountain snowpacks in Utah, extreme avalanche danger was forecasted for the entire Wasatch Mountain Range from Logan to Provo including the Wasatch Plateau in central Utah. It was extremely rare to see extreme avalanche danger over the entire Wasatch Mountain Range on a single day and not something that I have personally observed over the last 17 years. Extreme avalanche danger closed Little Cottonwood Canyon Road for 36 hours and avalanche mitigation efforts triggered numerous full-path avalanches that buried the road.
The Bonneville Salt Flats west of the Great Salt Lake are so flat that racers can drive at mind-boggling speeds that break the sound barrier. But the expanse of salty crust began rapidly receding in the 1980s and hasn’t stopped. In just 30 years, the salt flats shrunk from 50 square miles to 35 square miles. They lost a third of their volume. The racing community pointed at nearby groundwater pumping for potash mining as the culprit, so in the late 1990s, land managers approved a process called “laydown” — mixing all the leftover mining salts with groundwater and flooding it across the flats in an effort to help the crust regrow…
Turns out, groundwater extraction — including the pumping done for brine laydown — has dramatically changed the aquifer beneath the salt flats. The subterranean water that built up the salt pan over thousands of years is now flowing away from the flats, carrying the salt away with it. Researchers published their findings in the Utah Geological Association Journal on Jan. 14. The site the potash company used to pump water for the laydown process was on the edge of the flats, next to the Silver Island Mountains. Supporters of the project may not have realized the water it extracted was linked to the aquifer beneath the shrinking salt crust.
In response to falling flows in the critical habitat reach, the Bureau of Reclamation has scheduled an increase in the release from Navajo Dam from 350 cubic feet per second (cfs) to 400 cfs for tomorrow, February 10th, at 4:00 AM.
Releases are made for the authorized purposes of the Navajo Unit, and to attempt to maintain a target base flow through the endangered fish critical habitat reach of the San Juan River (Farmington to Lake Powell). The San Juan River Basin Recovery Implementation Program recommends a target base flow of between 500 cfs and 1,000 cfs through the critical habitat area. The target base flow is calculated as the weekly average of gaged flows throughout the critical habitat area from Farmington to Lake Powell.
State climatologist Russ Schumacher appeared on the latest episode of the Outdoor Citizen podcast to talk to us about Colorado’s snow and climate. Schumacher, who took over as Colorado’s state climatologist in 2017, is also professor of atmospheric science at Colorado State University. In a time of climate change and increasingly unpredictable events, Schumacher and people like him are here to help us all make sense of it.
“There’s always something new happening,” and that’s what fascinates him most about his work and the weather. In Colorado, especially, he said. “We have such fascinating weather. The weather and the climate can vary hugely over short distances.”
It’s both fascinating and challenging, he said.
The San Luis Valley is a great example of the variability of weather, he noted. “For one thing, I think it’s not as well understood as other parts of the state.”
Everybody loves to study the weather in the northern part of the state, he said, but “I think some of what happens there in the Valley is so fascinating, and a lot of times it flies under the radar either literally or figuratively.”
New radar installed near the Alamosa airport helps track local weather, he said.
Schumacher and his colleagues at the climate center just released the third edition of the Climate Change in Colorado report. The last time that report was updated was in 2014. A lot has happened since then, he said, and they realized a new update was needed.
You can read the report here. Schumacher broke down some of the key takeaways from that report.
LIke most of the planet, Colorado has been warming. Colorado has warmed by 3 degrees fahrenheit on average since the late 1880s. Precipitation is much harder to pin down, but the past two decades have been very dry.
As the planet continues to warm, Colorado will see the effects.
Climate models are all over the place, he said, when it comes to precipitation. There is a lot of variation. When it comes to snow and water, he said, even if the precipitation doesn’t change and the amount of liquid coming out of the sky doesn’t change “the fact that it’s warmer is going to put more stress on those water resources.”
In the summer, when the air is hotter it means quicker evaporation. In the winter, there is a shift in timing when runoff occurs in the spring and that changes when there are peak flows in the river.
“Warming is going to have impacts on our snow in the winter and our water supply in the summer,” he said.
We’re haven’t yet seen much of the effects for this El Niño year. Schumacher says there is still more time for that. Yet, we’re still below average in many of the nations’ southern river basins.
The current atmospheric river conditions on the west coast and in California are likely to head our way in the coming days and weeks. “It’ll be on the warm side when it hits Southern Colorado, as well.”
Westwide SNOTEL basin-filled map February 9, 2024 via the NRCS.
“Nowhere in the state is looking great at this point,” but we are much better than we were at the end of 2023. This last bout of snowstorms this month is helping. But it’s not a “boom year” that is typical with El Niño years.
There’s still hope to be had, he said.
The storms coming from the southwest are typically warmer than winter weather. He said that Saturday, Feb. 4, was the wettest day Fort Collins has seen. The city received 1.66 inches of precipitation in just that one day, which he said is not typical for early February.
The current snow drought will have long-term effects. It’s been “most acute” in Southern Colorado. There have been more years with low snowpack rather than a higher snowpack.
Since Colorado is a headwaters state, that doesn’t just impact us but the states surrounding us. Their water levels are reliant on Colorado’s snowpack.
The larger reservoirs in the Colorado River system require more consistently good years. One good year won’t necessarily create good levels. That system is in better shape than it was a year ago, but overall is in a bad state.
In the Rio Grande basin, he said, as the river flows down to New Mexico, there are increasing water supply issues further south. “Even if you have a good snowpack year, if the summer monsoon doesn’t come through and it’s really hot, that air is really thirsty for that water. It’s gonna try and pull that water out of the soils and out of the crops back into the air which means if you’re growing crops you’ve got to irrigate more, which means you’re using more water. That all is really a vicious cycle that puts stress on the system all around.”
Listen to the podcast here, or wherever you get your podcasts to hear more about what Schumacher is seeing.
ENSO Alert System Status: El Niño Advisory / La Niña Watch
Synopsis: A transition from El Niño to ENSO-neutral is likely by April-June 2024 (79%chance), with increasing odds of La Niña developing in June-August 2024 (55% chance).
During January 2024, above-average sea surface temperatures (SST) continued across most of the equatorial Pacific Ocean. SST anomalies weakened slightly in the eastern and east-central Pacific, as indicated by the weekly Niño index values. However, changes were more pronounced below the surface of the equatorial Pacific Ocean, with area-averaged subsurface temperature anomalies returning to near zero. Although above- average temperatures persisted in the upper 100 meters of the equatorial Pacific, below-average temperatures were widespread at greater depths. Atmospheric anomalies across the tropical Pacific also weakened during January. Low-level winds were near average over the equatorial Pacific, while upper-level wind anomalies were easterly over the east-central Pacific. Convection remained slightly enhanced near the Date Line and was close to average around Indonesia. Collectively, the coupled ocean-atmosphere system reflected a weakening El Niño.
The most recent IRI plume indicates a transition to ENSO-neutral during spring 2024, with La Niña potentially developing during summer 2024. Even though forecasts made through the spring season tend to be less reliable, there is a historical tendency for La Niña to follow strong El Niño events. The forecast team is in agreement with the latest model guidance, with some uncertainty around the timing of transitions to ENSO-neutral and, following that, La Niña. Even as the current El Niño weakens, impacts on the United States could persist through April 2024 (see CPC seasonal outlooks for probabilities of temperature and precipitation). In summary, a transition from El Niño to ENSO-neutral is likely by April-June 2024 (79% chance), with increasing odds of La Niña developing in June-August 2024 (55% chance).
John Echohawk and David Getches discuss strategy in NARF’s early years. Photo credit: Native American Rights Fund
Click the link to read the article on The Denver Post website (Elise Schmelzer). Here’s an excerpt:
February 7, 2024
When David Gover became an attorney with the Native American Rights Fund, he inherited a water rights legal case about as old as he was.
The case revolving around water rights in Oregon held by the Klamath Tribes started in 1975 and it’s emblematic of many tribal water cases — they’re long, complex and require specific legal knowledge. There are not enough Native water attorneys to handle the difficult cases, which are critical for tribes to access the water they are entitled to. That’s one of the challenges Gover hopes the new, Colorado-based Tribal Water Institute will help solve. The institute will help train new attorneys in tribal water law and provide other resources to help tribes access and develop their water rights. Tribes hold some of the oldest and most senior water rights in the West, but many do not have the money or infrastructure to use their water or sufficient legal staff to protect it.
“There’s still so much need out there and capacity is an ongoing issue for us all,” Gover said…
The institute will train young water attorneys to advocate for tribes in state and federal policy and serve as a central resource for tribes on water issues. It will be part of the Boulder-based Native American Rights Fund, a nonprofit that has worked on myriad legal issues for tribal nations since 1970. Too often, tribes are stuck in a reactive position on water policy and litigation because they don’t have enough resources to work proactively, Gover said. The Native American Rights Fund has represented tribes in nine of the 35 tribal water rights settlements approved by Congress since 1978, but there is more work than attorneys available…
The Walton Family Foundation — which has spent millions on water issues in the West — donated $1.4 million to launch the institute. Native American Rights Fund staff continues to fundraise for the $4.2 million they estimate will be needed to fund the institute for three years. Tribal nations are under-represented in federal and state policy discussions, said Moira Mcdonald, environment program director of the Walton Family Foundation.
“That is unjust and unwise,” she said. “We need to listen to their voices. More inclusive decision-making will lead to greater benefits for the environment and society as a whole.”
Native America in the Colorado River Basin. Credit: USBR
Fair representation for tribes is especially important in the Colorado River basin. Combined, the 30 tribes in the basin hold rights to approximately 25% of the water. But many have not been able to use their full allotment and the tribes have been repeatedly left out of negotiations over how the river should be used and divided.
John Echohawk. Photo credit: Allen Best/Big Pivots
The Bureau of Reclamation today published an overview of historical natural losses along the lower Colorado River. The Mainstream Evaporation and Riparian Evapotranspiration report looks at water surface evaporation, soil moisture evaporation, and plant transpiration. It will be used by Reclamation as a source of data as it manages regional water operations and to improve the agency’s modeling efforts.
“Reclamation’s approach to water management in the Colorado River Basin and across all Reclamation states is based on best available science, transparency, and inclusivity.” said Reclamation Commissioner Camille Calimlim Touton. “The release of the Mainstream Evaporation and Riparian Evapotranspiration study today evidences this commitment by informing our partners and the public about river and reservoir evaporation and transpiration in the Colorado River Basin.”
The report provides an overview of average mainstream losses from both river and reservoir evaporation, as well as the evaporation and transpiration associated with vegetation and habitats along the river. The report states that approximately 1.3-million-acre feet of losses occur annually along the lower Colorado River mainstream. Based on data from 2017 to 2021, approximately 860,000 acre-feet of Colorado River water is lost to evaporation occurring annually from Lake Mead to the border with Mexico. A further 445,000 acre-feet is lost to evaporation and transpiration from natural vegetation and habitats.
A second atmospheric river of moisture in a matter of days is further bolstering Colorado snowpack levels that have continued to lag a bit behind normal…An initial atmospheric river storm system that wound down over the weekend dumped as much as three feet of snow in parts of the mountains, with the Colorado Avalanche Information Center saying the Ruby and Ragged ranges west of Crested Butte and south of Marble were particularly hard-hit. The Mesa Lakes area on Grand Mesa got about 15 inches of snow in that storm and Park Reservoir saw about a foot of snow fall, while another measuring site on Grand Mesa got only about 4 inches, said Dennis Phillips, a meteorologist for the National Weather Service in Grand Junction. The second atmospheric river that arrived this week is expected to be a stronger system, he said…
The federal Natural Resources Conservation Service on Tuesday said that statewide snowpack in Colorado stood at 93% of normal for Feb. 6. It has seen little growth since the middle of last month or so, after increasingly sharply from below 70% of normal at the start of January.
Snowpack in the Colorado headwaters basin on Tuesday stood at 96% of normal for Feb. 6. The Yampa-White-Little Snake basins were at 95% of normal, as was the Gunnison River Basin, and the Arkansas River Basin was at 91%.
Southwest Colorado is drier, with the combined San Miguel-Dolores-Animas-San Juan basins at 84% of normal and Upper Rio Grande River Basin at 80%. On Grand Mesa, snowpack levels at NRCS sites Tuesday ranged from 93% at Mesa Lakes to 74% at Overland Reservoir. Mountain snowpack is relied upon to bolster streamflows, reservoirs and agricultural and municipal supplies when that snow melts and runs off.
Colorado Drought Monitor map February 6, 2024.
Most of Southwest Colorado is in varying levels of drought, with moderate drought stretching into western and southern Mesa County, according to the U.S. Drought Monitor.
Last week, a strong Pacific storm system brought flooding rains to California and heavy snow to the mountain ranges of Northern California and the Sierra Nevada. Parts of the state saw nearly a foot of rain from this storm, breaking long-standing records. Moisture from this system also brought rain and snow to the Pacific Northwest and inland regions of the West. Most states in the region saw pockets of improvement despite the heaviest precipitation missing many of the West’s persistent drought areas. Another round of showers and thunderstorms passed through the South and Southeast. In the last two weeks, rainfall totals of more than 10 inches fell in parts of East Texas, Louisiana, and Mississippi. The excess rain brought one and two category improvements to drought. The Northern Plains, Upper Midwest, and Northeast stayed relatively dry, with well above normal temperatures last week. Concerns continue to grow over the lack of snow this season…
Colorado Drought Monitor one week change map ending February 6, 2024.
High temperatures averaged about 8 to more than 20 degrees above normal. Precipitation of less than 0.25 inches fell across much of the Dakotas, eastern Nebraska, and southwest Kansas. The rest of the region recorded totals ranging from about 0.25 inches to just over 1 inch. Moderate drought (D1) improved in eastern South Dakota in response to above normal precipitation during the month of January. South-central Nebraska and northern and central Kansas also saw 1-category improvements to long-term drought areas. While short-term moisture deficits have largely been eliminated, a dry signal remains at timescales longer than about 6 months. Precipitation deficits of nearly 10 inches over the last year remain in drought areas in these states and impacts to deeper soil moisture levels and groundwater continue to linger…
A strong storm system brought flooding rains to California and heavy snow to the mountain ranges of Northern California. Parts of the state recorded totals of 10 to 15 inches during the week, more than 600% of normal (for the same 7-day period). Moisture from this system also brought rain and snow to the Pacific Northwest and inland regions of the West. Outside of California, precipitation mostly totaled less than 3 inches. Pockets of improvements occurred in Idaho and western Montana, where recent precipitation has helped reduce drought signals in the short and longer terms. Central Arizona, the Four Corners region, and Colorado also saw improvements. A lack of snow in eastern Montana and western North Dakota led to the expansion of abnormal dryness (D0)…
Another round of wet weather brought more than 3 inches of rain to parts of Texas, Louisiana, and Mississippi. Totals less than 0.25 inches fell in parts of Tennessee and Texas. The continued wet weather left parts of Alabama with 200 to more than 400% of normal rainfall for the last two weeks. Much of the state saw 1- and 2-category improvements to drought conditions. While the drought developed rapidly over the summer, improvements are slower to happen. Rainfall deficits of more than 10 inches over the last six months remain over parts of Louisiana and Mississippi. Streamflow, groundwater levels, and deeper soil moisture also remain historically low for this time of year. The fact that drought signals are still present shows how dry it was during earlier months…
Looking Ahead
The National Weather Service Weather Prediction Center forecast (valid February 7 – 10, 2024) calls for another round of rainfall to sweep across California and into the Desert Southwest. High elevation snow is expected over mountains in the West with a wintry mix (freezing rain, sleet, and snow) over the northern Plains and upper Midwest. Heading into the weekend, the extended forecast (valid February 10 – 14, 2024) calls for a band of heavy rain across the South and Southeast. High temperatures are expected remain above average across central and eastern parts of the country. The Climate Prediction Center’s 6-to-10-day outlook (valid February 13 – 17, 2024) calls for an increased probability that observed temperatures, averaged over this 7-day period, will be above normal across the Upper Midwest, the west Coast, and Alaska. Temperatures across the remaining parts of the country are expected to be near to below normal. The pattern of increased precipitation across California and the southern tier of the continental U.S. (CONUS) is expected to continue, while much of the remaining CONUS, eastern Alaska, and the Big Island of Hawaii are expected to have below or near-normal precipitation.
US Drought Monitor one week change map ending February 6, 2024.
Just for grins here’s a gallery of US Drought Monitor maps for the last few years.
US Drought Monitor map February 28, 2023.
US Drought Monitor map February 7, 2023.US Drought Monitor map February 22, 2022.US Drought Monitor map February 8, 2022.US Drought Monitor February 9, 2021.US Drought Monitor February 4, 2020.US Drought Monitor February 5, 2019.US Drought Monitor February 6, 2018.US Drought Monitor February 7, 2017.US Drought Monitor February 2, 2016US Drought Monitor February 3, 2015US Drought Monitor February 4, 2014US Drought Monitor February 5, 2013US Drought Monitor February 7, 2012US Drought Monitor February 1, 2011US Drought Monitor February 1, 2010
The Dolores River flows more than 241 miles from south to north through Colorado and then into Utah where it joins the Colorado River, carving one of the country’s most stunning canyons.
In 1765, a Spanish explorer came across what he named “El Río De Nuestra Señora de Dolores,” or “The River of Our Lady of Sorrows.” Today, the Dolores River brings pleasure rather than sorrow, as a vibrant habitat for wildlife and a popular recreation destination.
Dolores River watershed
Why is the Dolores River important?
The water in the Colorado River is used for multiple purposes across many western states; including agriculture and drinking water. The river provides water to the cities of Cortez and Dove Creek as well as the Ute Mountain Ute Tribe and the Montezuma Valley through large, man-made canals. Importantly, the Dolores River flows into the Colorado River, which provides critical downstream benefits to some 40 million Americans.
Mcphee Reservoir
The Dolores River was dammed just southwest of the city of Dolores, Colorado, creating the McPhee Reservoir, which allocates all of its stored water for agriculture. Even though it is the second largest reservoir in Colorado, the McPhee does not have the capacity to support agriculture and to release enough water into the river to help recreation and wildlife thrive.
This watershed is an ideal habitat for large mammals, such as desert bighorn sheep, mule deer, and beavers as well as many migratory birds. The river is also home to three native fish; flannelmouth sucker, bluehead sucker, and roundtail chub.
The jaw-dropping scenic views make it a popular tourist destination year after year. Rafting, camping, hiking, fishing, hunting, bird watching and other activities are abundant. Visitors also come for the rich cultural history. The Dolores Canyon was home to ancient Ute peoples, Ancestral Puebloans, and Fremont peoples for thousands of years.
Dolores River Canyon. David Joswick | Used by permission
Because of the more intense drought conditions caused by climate change, there is often not enough water in the McPhee Dam left to release into the river after water has been allocated to agriculture. The river’s flow has decreased by 50% over the last 10 years. Not having enough water flowing can lead to dramatic increases in both water temperature and sediment and silt, leading to reduced water quality.
Nathan Fey, seen here paddling the Lower Dolores River. The lower Dolores River depends on a deep snowpack for boating releases from McPhee Reservoir. (Photo courtesy Nathan Fey)
The importance of snowpack to the river was demonstrated in 2016. Thanks to a healthy snowpack which released more water than past years, the river flowed at a “floatable” level for the first time in half a decade. The fully flowing river led to increased water recreation, such as rafting the technical rapids, exploring back hidden canyons, fly fishing for rainbow trout and spotting wildlife such as beavers. Camping even resumed, despite many campsites being overgrown and untended for years.
In addition to low water levels, the river is exposed to pollution from uranium tailings and runoff from historic mines at its headwaters. With the possibility of mining resuming, the Dolores could be exposed to even more pollution, threatening native fish species, potentially leading to population declines. Additionally, it decreases the quality and the safetyof drinking water across the country, potentially leading to public health risks.
Prickly Pear Dolores River Canyon. David Joswick | Used by permission
We must protect the Dolores River
We must ensure the water in the Dolores River is safe for drinking, wildlife, recreation, and agriculture. Designating the land surrounding the Dolores River in Mesa and Montrose counties as a national monument would help to protect endangered species, encourage sustainable and responsible recreation and protect the water that does flow in the river from future toxic pollution. A national monument will not address all of the challenges with water shortages in this area but it will give wildlife a better chance. This will allow people to continue to enjoy the unique beauty of this area without running the risk of overuse, and preserve it for future generations.
Dolores River skeleton plant (Lygodesmia doloresensis). Photo by Peggy Lyon via Colorado Natural Heritage ProgramThe Dolores River, below Slickrock, and above Bedrock. The Dolores River Canyon is included in a proposed National Conservation Area. Photo: Brent Gardner-Smith/Aspen Journalism.A view of the Dolores River below Slickrock.Ponderosa Gorge, Dolores River. Boating is popular on the Lower Dolores River, which is being considered as a National Conservation Area. Photo credit RiverSearch.com.Dolores River Campground September 2016.St Louis Tunnel Ponds June 29, 2010 – view south towards Rico. Photo via the EPA.The Dolores River shows us what’s at stake in the fight to protect the American West — Conservation ColoradoPhoto via the Sheep Mountain AllianceDolores River south of Lizard Head PassFriends of the Dolores River Fall Fest 2011 siteDolores River above DoloresDolores RiverDolores River Canyon near Paradox
Hundreds of growers in Colorado’s San Luis Valley could see their water costs nearly quadruple under a new plan designed to slash agricultural water use in the drought-strapped region and deflect a potential legal crisis on the Rio Grande.
A new rule approved by the area’s largest irrigation district, known as Subdistrict 1, and the Alamosa-based Rio Grande Water Conservation District, sets fees charged to pump water from a severely depleted underground aquifer at $500 an acre-foot, up from $150 an acre-foot. The new program could begin as early as 2026 if the fees survive a court challenge.
“It’s draconian and it hurts,” said Sen. Cleave Simpson, a Republican from Alamosa who is also general manager of the Rio Grande water district.
The region, home to one of the nation’s largest potato economies, has relied for more than 70 years on water from an aquifer that is intimately tied to the Rio Grande. The river begins high in the San Juan mountains above the valley floor.
Both the river and the aquifer are supplied by melting mountain snows, but a relentless multi-year drought has shrunk annual snowpacks so much that neither the river nor the aquifer have been able to recover their once bountiful supplies.
And that’s a problem. Under the Rio Grande Compact of 1938, Colorado is required to deliver enough water downstream to satisfy New Mexico and Texas. If the aquifer falls too low, it will endanger the river’s supplies and push Colorado out of compliance. Such a situation could trigger lawsuits and cost the state tens of millions of dollars in legal fees.
Subdistrict 1 has set state-approved goals to comply with the compact. Within seven years, it must find a way to restore hundreds of thousands of acre-feet of water to the aquifer, a difficult task.
Rio Grande River, CO | Photo By Sinjin Eberle
An acre-foot equals nearly 326,000 gallons of water, or enough to cover an acre of land with water a foot deep.
The specter of an interstate water fight is creating enormous pressure to reorganize the valley’s farming communities in a way that will allow them to use less water, grow fewer potatoes, and still have a healthy economy.
For more than a decade, valley water users have been working to reduce water use and stabilize the aquifer. Many have already started experimenting with ways to grow potatoes with less water by improving soil health, and to find new crops, such as quinoa, that may also prove to be profitable.
But the pumping plans, considered innovative by water experts, haven’t been enough to stop the decline in aquifer levels. The Rio Grande Basin is consistently one of the driest in the state, generating too little water to make up for drought conditions and restore the aquifer after decades of over pumping.
With the new fees, the region will likely have some of the highest agricultural water costs in the state, said Craig Cotten, who oversees the Rio Grande River Basin for Colorado’s Division of Water Resources.
Perhaps not as high as water in the Colorado-Big Thompson Project on the northern Front Range, where cities and developers and some growers pay thousands of dollars to buy an acre-foot of water.
Still it is much higher than San Luis Valley growers and others have paid historically. Fees at one time were just $75 an acre-foot, eventually reaching $150 an acre-foot. The prospect of the fee skyrocketing to $500 is shocking.
“That is high,” said Brett Bovee, president of WestWater Research, a consulting firm specializing in water economics and valuations. Typically such fees across the state have been in the $50 to $100 range, he said.
But Bovee said the water district is taking constructive action while giving growers opportunities to find their own solutions to the water shortage. “It’s putting the decision-making power into the hands of growers and landowners, rather than saying ‘everybody take one-third of your land out of production.’”
Third hay cutting 2021 in Subdistrict 1 area of San Luis Valley. Photo credit: Chris Lopez
Subdistrict 1 is the oldest and largest of a group of irrigation districts in the valley, according to Cotten. Its $500 fee has triggered a lawsuit by some growers, who believe the district is applying the new fees unfairly.
“The responsibility for achieving a sustainable water supply is to be borne proportionately based on (growers’) past, present and future usage,” Brad Grasmick, a water attorney representing San Luis Valley growers in the Sustainable Water Augmentation Group and the Northeast Water Users Association, said, referring to state water laws. “But we believe the responsibility is being disproportionately applied to our wells.”
Those growers are now trying to create their own irrigation district and they are suing to stop the new fee.
“I think that more land retirement and more reduction in well pumping is needed and that is what my group is trying to do,” Grasmick said. “No one wants to see the aquifer diminish and continue to shrink. If everybody can do their part to cut back and make that happen, that is the way forward. My guys just want to see the proportionality adhered to.”
To date, tens of millions of dollars have been raised and spent to retire wells in the San Luis Valley, with Subdistrict 1 raising $70 million in the last decade, according to Simpson. And in 2022 state lawmakers approved another $30 million to retire more wells.
Lawmakers are closely monitoring these efforts to reduce water use while protecting growers.
Sen. Byron Pelton, a Republican from Sterling, said the combined money that is going to the Rio Grande and Republican basins is critical. But the potential for legal battles, he said, is concerning.
“Agriculture is key in our communities,” Pelton said. “But the biggest thing is that we have to stay within our compacts. Sometimes you’re backed into a corner and that is just the way it has to be. I hate it, but we have to stay in compliance.”
How much irrigated land will be lost as wells are retired isn’t clear yet. Simpson said growers who have access to surface supplies in the Rio Grande will still be able to irrigate even without as many wells or as much water, but the land will likely produce less and farms may become less profitable.
And it will take more than sky-high pumping fees to solve the problem, officials said. The Division of Water Resources has also created another water-saving rule in Subdistrict 1 that will force growers to replace one-for-one the water they take out of the aquifer, instead of allowing them to simply pay more to pump more.
Cotten said the hope is that the higher fees combined with the new one-for-one rule will reduce pumping enough to save the aquifer and the ag economy.
Valley growers are already shifting production and changing crops, said James Ehrlich, executive director of the Colorado Potato Administrative Committee in Monte Vista, an agency involved in overseeing and marketing the region’s potato crops.
“There are a lot of creative things going on down here,” Ehrlich said. “But we have to farm less and learn to survive as a community together. And Mother Nature has not helped us out. We’ve stabilized but we can’t gain back what (state and local water officials) want us to gain back. It is just not going to happen.”
More by Jerd SmithJerd Smith is editor of Fresh Water News. She can be reached at 720-398-6474, via email at jerd@wateredco.org or @jerd_smith.
Montgomery Reservoir, a source of water for Colorado Springs Utilities, can hold about 5,700 acre-feet of water. As the result of an agreement with West Slope opposers, Colorado Springs will be allowed to enlarge the reservoir to hold an additional 8,100 acre-feet without West Slope opposition. CREDIT: COLORADO SPRINGS UTILITIES
Colorado Springs has agreed to give up water rights tied to reservoirs in the Blue River basin in exchange for the ability to expand Montgomery Reservoir on the east side of the Continental Divide without opposition from Western Slope entities.
Colorado Springs Utilities had been fighting in water court since 2015 to hang on to conditional water rights originally decreed in 1952 and tied to three proposed reservoirs: Lower Blue Reservoir, on Monte Cristo Creek; Spruce Lake Reservoir, on Spruce Creek; and Mayflower Reservoir, which would also have been built on Spruce Creek. Lower Blue Reservoir was decreed for a 50-foot-tall dam and 1,006 acre-feet of water; Spruce Lake Reservoir was decreed for an 80- to 90-foot-tall dam and 1,542 acre-feet; and Mayflower Reservoir, was decreed for a 75- to 85-foot-tall dam and 618 acre-feet.
After negotiations with eight opposers, including the Colorado River Water Conservation District, Summit County and the town of Breckenridge, the parties are set to approve an agreement that would cancel the conditional water rights for Spruce Lake and Mayflower reservoirs. A third potential reservoir, Lower Blue, would keep its 70-year-old rights, but Colorado Springs would transfer the majority of the water stored to Breckenridge and Summit County, and would share the costs of building that reservoir, which would be owned and operated by Breckenridge and Summit County.
In exchange, the Western Slope parties will not oppose Colorado Springs’ plan to enlarge Montgomery Reservoir to hold an additional 8,100 acre-feet of water for a total capacity of about 13,800 acre-feet. That project is expected to enter the permitting phase in 2025. After the permitting and construction of the Montgomery Reservoir expansion, the conditional water rights for Spruce Lake and Mayflower reservoirs would be officially abandoned and the water rights for Lower Blue Reservoir transferred to Summit County and Breckenridge.
“These conditional rights we’re relinquishing in the agreement are for future reservoirs that would be difficult to permit and build for us,” Jennifer Jordan, senior public affairs specialist at Colorado Springs Utilities (CSU), said in an interview with Aspen Journalism. “And we can gain in average years that same yield and perhaps a little bit more by getting the Montgomery Dam enlargement completed.”
A 2015 evaluation of the conditional water rights and proposed reservoirs by Wilson Water Group found several potential environmental and permitting stumbling blocks, including the presence of endangered species and challenging high-Alpine road construction.
CSU also agreed to a volumetric limit of the amount it will be allowed to take through the Hoosier Tunnel after the Montgomery Reservoir expansion: 13,000 acre-feet per year over a 15-year rolling average. CSU currently takes about 8,500 acre-feet per year through the tunnel.
Montgomery Reservoir is part of CSU’s Continental Hoosier System, which takes water from the headwaters of the Blue River between Breckenridge and Alma to Colorado Springs via the Hoosier Tunnel, Montgomery Reservoir and Blue River Pipeline. It is the city’s oldest transmountain diversion project.
Each year, transmountain diversions take about 500,000 acre-feet from the Colorado River basin to the Front Range. Colorado Springs is a large water user that draws from this vast network of tunnels and conveyance systems that move water from the mountainous headwaters on the west side of the Continental Divide to the east side, where the state’s biggest cities are located. Colorado Springs’ largest source of Western Slope water is its Twin Lakes system, which draws from the headwaters of the Roaring Fork River above Aspen.
Proposed reservoirs on the Blue River
Map: Laurine Lassalle – Aspen Journalism Source: Colorado Springs Utilities Created with Datawrapper
CSU to support Shoshone
The Glenwood Springs-based River District was created in 1937 to combat these types of diversions and keep water on the Western Slope. It was one of the entities that opposed CSU’s conditional water rights in its nearly nine-year water court battle, which kicked off when the water provider filed a diligence application. That is the process in which a conditional water-right holder must demonstrate to the water court that it can and will eventually develop the water right, and that in the previous six years, it has done its diligence in seeing a project through.
On Jan. 16, the River District board approved the settlement agreement, which includes a commitment from Colorado Springs that the utility will support the River District’s efforts at securing the Shoshone water right.
The River District is working to purchase water rights from Xcel Energy associated with the Shoshone hydropower plant in Glenwood Canyon. The water rights date to 1902 and are nonconsumptive, meaning the water would stay in the river and flow downstream to the benefit of the environment, endangered fish and other water users on the Western Slope. The Colorado Water Conservation Board approved $20 million toward the $98.5 million purchase last week.
“The settlement provides additional local water supplies to the Blue River Valley and a commitment of support from Colorado Springs Utilities for the Shoshone Water Right Preservation effort, which provides substantial benefits to the health of the entire Colorado River, including important water security, economic and environmental benefits to the West Slope,” River District General Manager Andy Mueller said in a prepared statement. “In addition, the West Slope will benefit from clearly specified limits on the total amount of water Colorado Springs can divert through its Continental-Hoosier transmountain diversion tunnel.”
The agreement was also good news for Breckenridge, which will split the 600 acre-feet of water from Colorado Springs in a future Lower Blue Reservoir equally with Summit County. The reservoir was originally decreed for 1,006 acre-feet, but the agreement now limits the reservoir capacity to 600 acre-feet. Colorado Springs will retain the remaining amount, about 400 acre-feet, which can be stored in Montgomery Reservoir.
Breckenridge Mayor Pro Tem Kelly Owens said Breckenridge will be able to use the stored water in late summer, when flows in the Blue River are at their lowest.
“The way we see it is that we’ve now protected those waters, the snowmelt, and keeping it in the Blue River basin,” Owens said.
According to the agreement, Colorado Springs would pay 50% of the construction costs of a future Lower Blue Reservoir, and Breckenridge and Summit County would each pay 25%.
Colorado Springs City Council is expected to approve the agreement at its Feb. 13 meeting.
This story ran in the Feb. 5 edition of the Summit Daily.
Click the link to read the article on the 8NewsNow.com website (Greg Haas). Here’s an excerpt:
February 5, 2024
The attention is on Southern California right now, but an atmospheric river’s path will extend inland with potential flooding — and possible drought relief. If you’re watching the weather, it’s still a little early to tell whether these storms will go where they can hope Las Vegas the most. That’s anywhere in the Upper Colorado River Basin, where there’s a chance they could produce snow to help the river that supplies 90% of the water used in Southern Nevada…The paths of this year’s atmospheric rivers are unlike the ones that slammed the Sierras last year. Those storms carried snow straight east through Northern Nevada and Utah, feeding the Rocky Mountains with snowpack levels that reached 160% of normal by the end of winter. That snow provided relief from drought years that had everyone watching nervously as Lake Mead dropped in 2022. This time, the moisture is following a path that is causing concern in Death Valley, where roads were destroyed less than six months ago by the remnants of Hurricane Hilary…
But where will the atmospheric river go from there? The path is currently extending to Salt Lake City, where it fizzles out as it runs up against the Wasatch Mountains…And after rains let up, the biggest question remains: Will the moisture reach the Upper Colorado River Basin? That’s the drainage area that feeds the Colorado River, extending from central Utah to the Continental Divide in Colorado. The moisture is currently tracking toward the upper Green River basin, the northern tip in the map shown below:
Westwide SNOTEL basin-filled map February 5, 2024 via the NRCS.
…Currently, total SWE levels for the Upper Colorado River Basin are at 92% of normal — an improvement over recent weeks. The level was 93% on Jan. 18, and dipped as low as 85% since then, according to information from the U.S. Bureau of Reclamation.
Denver Water crews measure snow at 11 locations throughout the winter in Grand, Park and Summit Counties. Learn why these surveys are so important to Denver Water customers.
Storms that dumped several feet of snow in Park, Summit and Grand counties in January and February left behind great skiing conditions and a sorely needed boost to the mountain snowpack.
Entering 2024, the snowpack in the areas of the South Platte and Colorado river basins where Denver Water captures snow for its water supply were well below normal due to relatively dry weather in November and December 2023.
But storms in mid-January and early February boosted mountain snowpack in the two river basins to nearly normal for this point in the season.
A snowboarder enjoys the fresh snow at Copper Mountain on Jan. 19. Copper Mountain received 60” of snow in January. The resort is in Denver Water’s collection area, so snow that falls on the slopes flows into Dillon Reservoir. Photo credit: Denver Water.
As of Monday, Feb. 5, the snowpack in Denver Water’s collection areas stood at 106% of normal in the South Platte Basin and 98% of normal in the Colorado River Basin.
“January was great in terms of our water supply. In fact, the snowpack accumulation was nearly double the average for the month,” said Nathan Elder, water supply manager at Denver Water.
“We are right at normal for the season, and we’re hopeful the stormy weather pattern continues as we head into the snowier months of the year.”
The blue line on the charts below shows how a few big storms can quickly boost a very low snowpack (close to the bottom of the grey area) up to the black or “normal” line:
Image credit: Denver Water.
Image credit: Denver Water.
Monitoring the snow
Denver Water pays close attention to the snowfall in the mountains because snowmelt provides 90% of the water supply for 1.5 million people in its service area across metro Denver.
The utility monitors the snowpack in multiple ways through the season.
Once a month, January through April, Denver Water crews snowmobile and snowshoe through the snow to collect about a dozen samples of the snowpack along preestablished paths through the wilderness called “snow courses.”
Denver Water employees John King (left) and Conor Peters get ready to head out on a snow course to check the status of the snowpack in late January 2024. Photo credit: Denver Water.
Denver Water has snow courses at 11 locations in Grand, Park and Summit counties.
Capturing snow samples looks like spear-fishing. Crews jab a specially designed hollow pole into the snow until it hits the ground. The pole measures the snow depth and weight which is then used to determine the snow’s density.
This information is then used to calculate the snow water equivalent, or SWE. In simple terms, it’s the depth of water that would cover the ground if all the snow melted.
Denver Water crews measure mountain snowpack at 11 locations in Grand, Park and Summit counties from January through April. Photo credit: Denver Water.
“Ski areas love that champagne powder, but we like to see snow with lots of water inside,” said Rick Geise, a facility operator at Dillon Reservoir in Summit County. “The more water packed into the snow, the more water that flows into our reservoirs in the spring when all the snow melts.”
Denver Water shares the data collected from its snow courses with the National Resources Conservation Service, which puts out statewide snowpack and water supply information.
Donald McCreer, facility operator at Denver Water, checks the weight of the snow inside a special, hollow tube used to calculate snow density at a snow course on Vail Pass. Photo credit: Denver Water.
Changing Rio Grande flow at Otowi over time. Credit: John Fleck/InkStain
Click the link to read the article on the InkStain website (John Fleck):
February 2, 2024
I’ve been updating the crufty old code I use to generate graphs to help me (and colleagues) think about river flows.
This one’s a little busy, so maybe for specific nerd colleagues’ use, and not general consumption?
It’s based on a request from a friend who uses these, and asked for a visualization of the wet 1981-2000 period compared to the drier 21st century. This is an important comparison given that a whole bunch of New Mexicans (including me!) moved here in the wet 1980s and ’90s, which created a sense of what’s “normal.”
It’s important to note that this is not a measure of climate, at least not directly. This is a measure of how much actual water flows past the Otowi gage, which is a product of:
climate-driven hydrology adding water
trans-basin diversions adding water (“trans basin diversion” singular, I guess, the San-Juan Chama Project)
upstream water use subtracting water
reservoir management decisions moving water around in time (sometimes reducing the flow by storing, sometimes increasing it by releasing)
I get so much out of staring at these graphs. A few bits from this one, which I did a few evenings ago curled up with my laptop in my comfy chair:
Look at the curves around Nov. 1 – a drop as irrigation season ends, following by a rise as managers move compact compliance water down the river to Elephant Butte. Makes me curious about what they were doing back in the ’80s and ’90s in November.
This year’s winter base flow is low.
At some point soon I’ll get the updated code onto Github, but it’s not quite ready for sharing. (I’m rewriting it in Python, because learning is fun!)

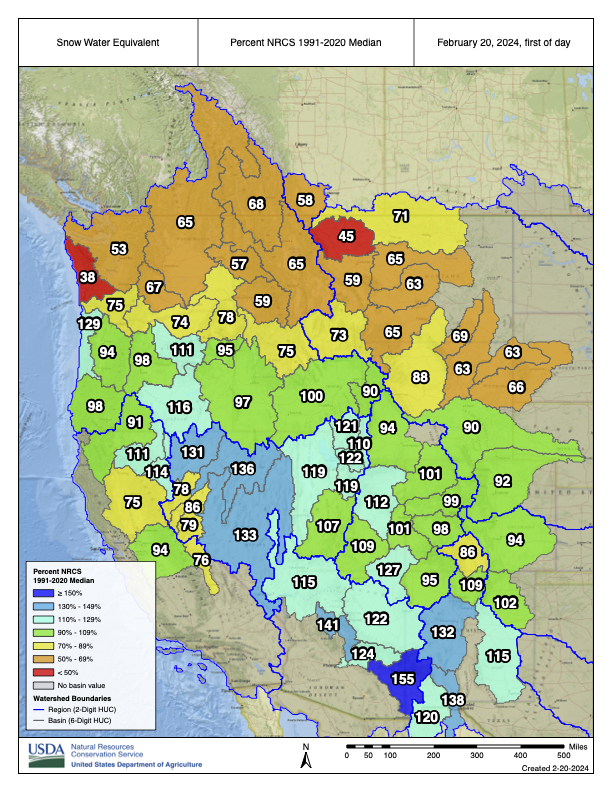
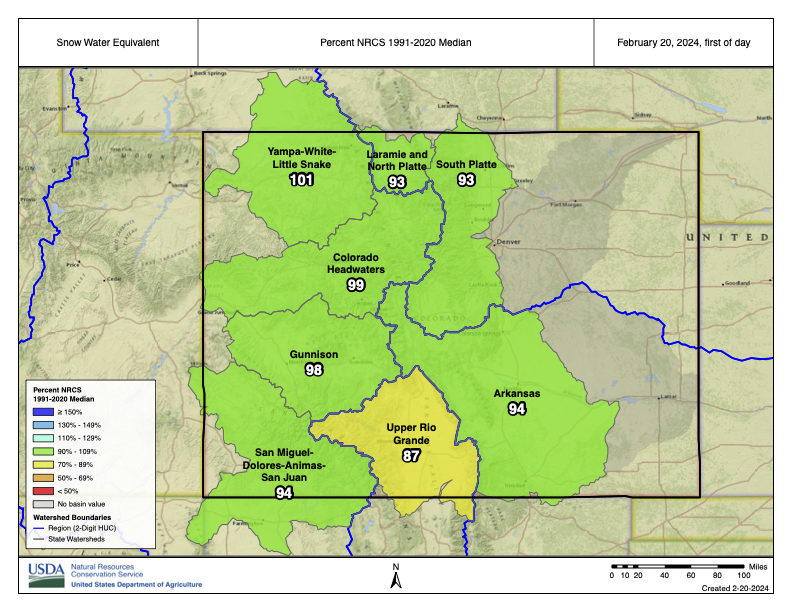


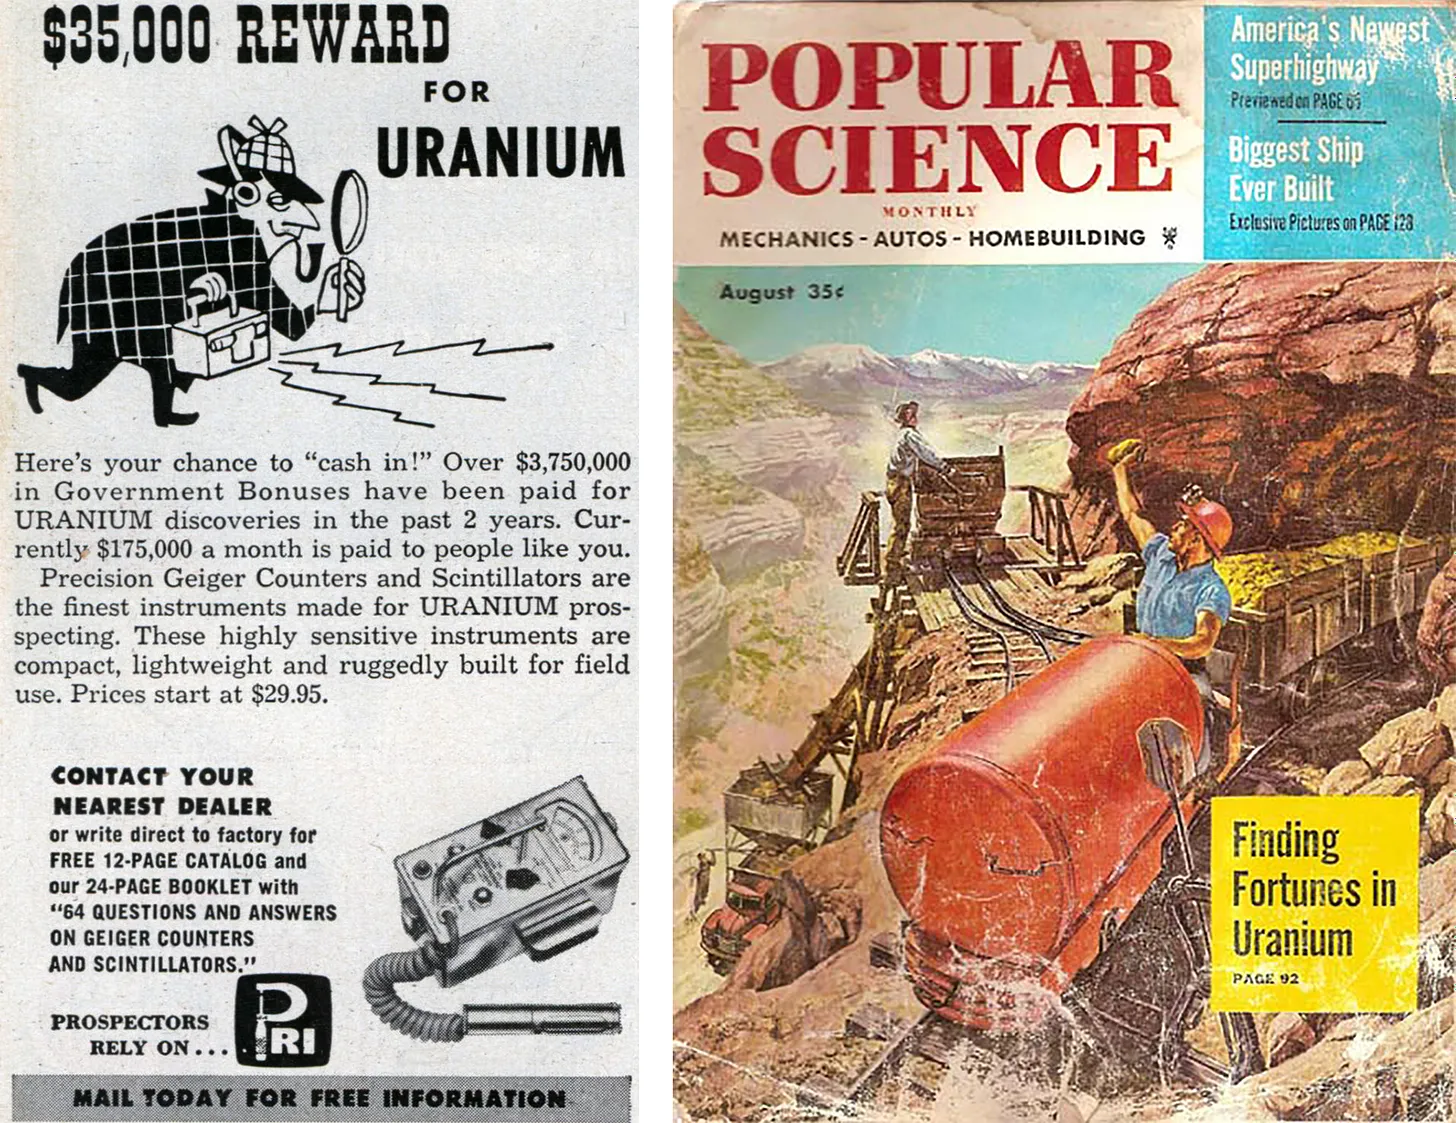
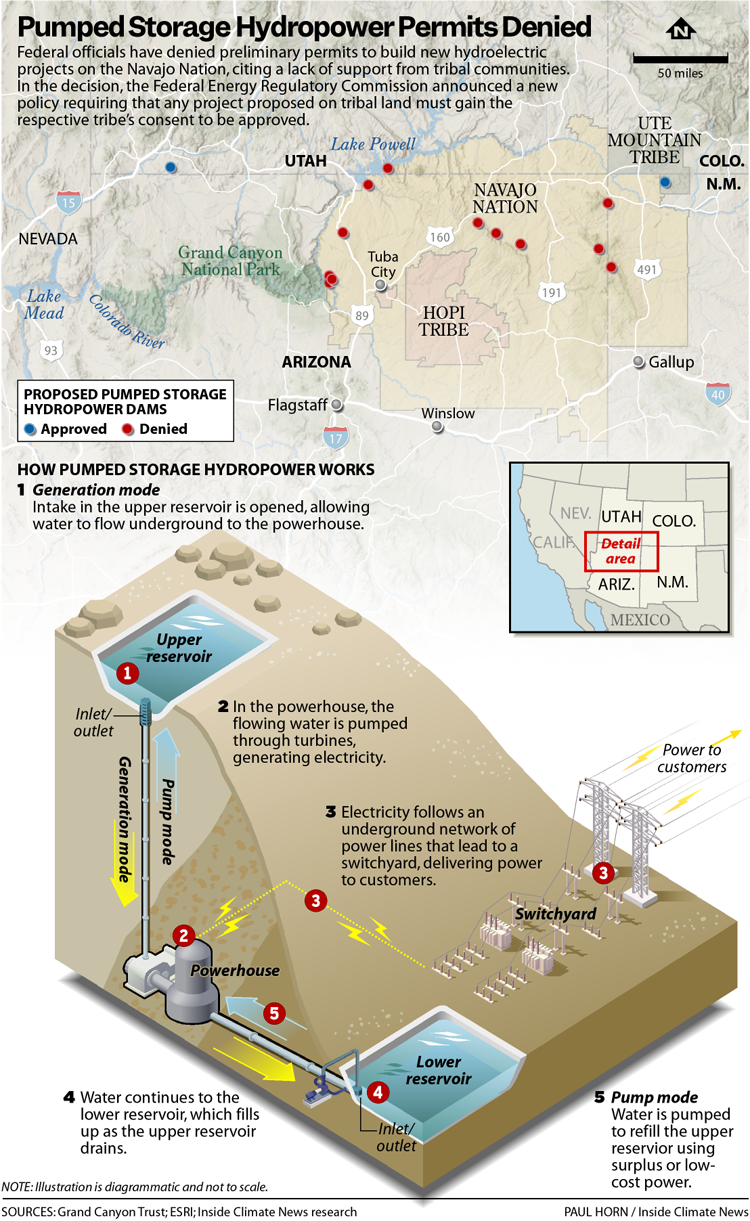


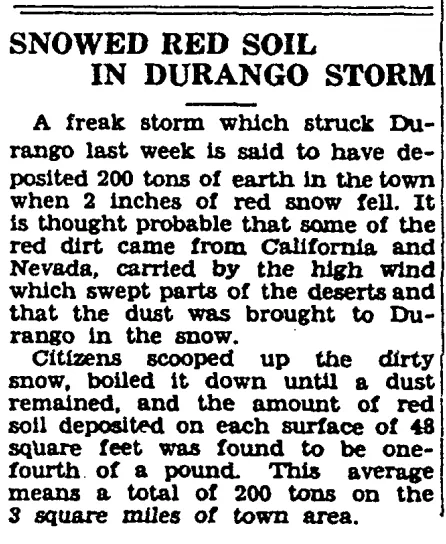


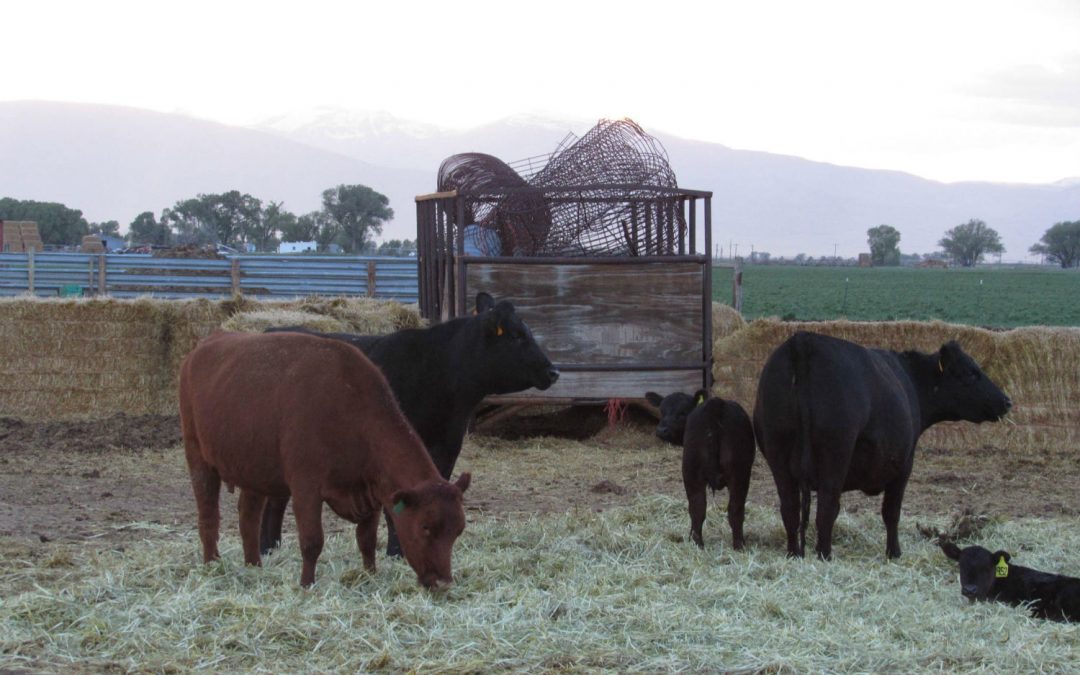
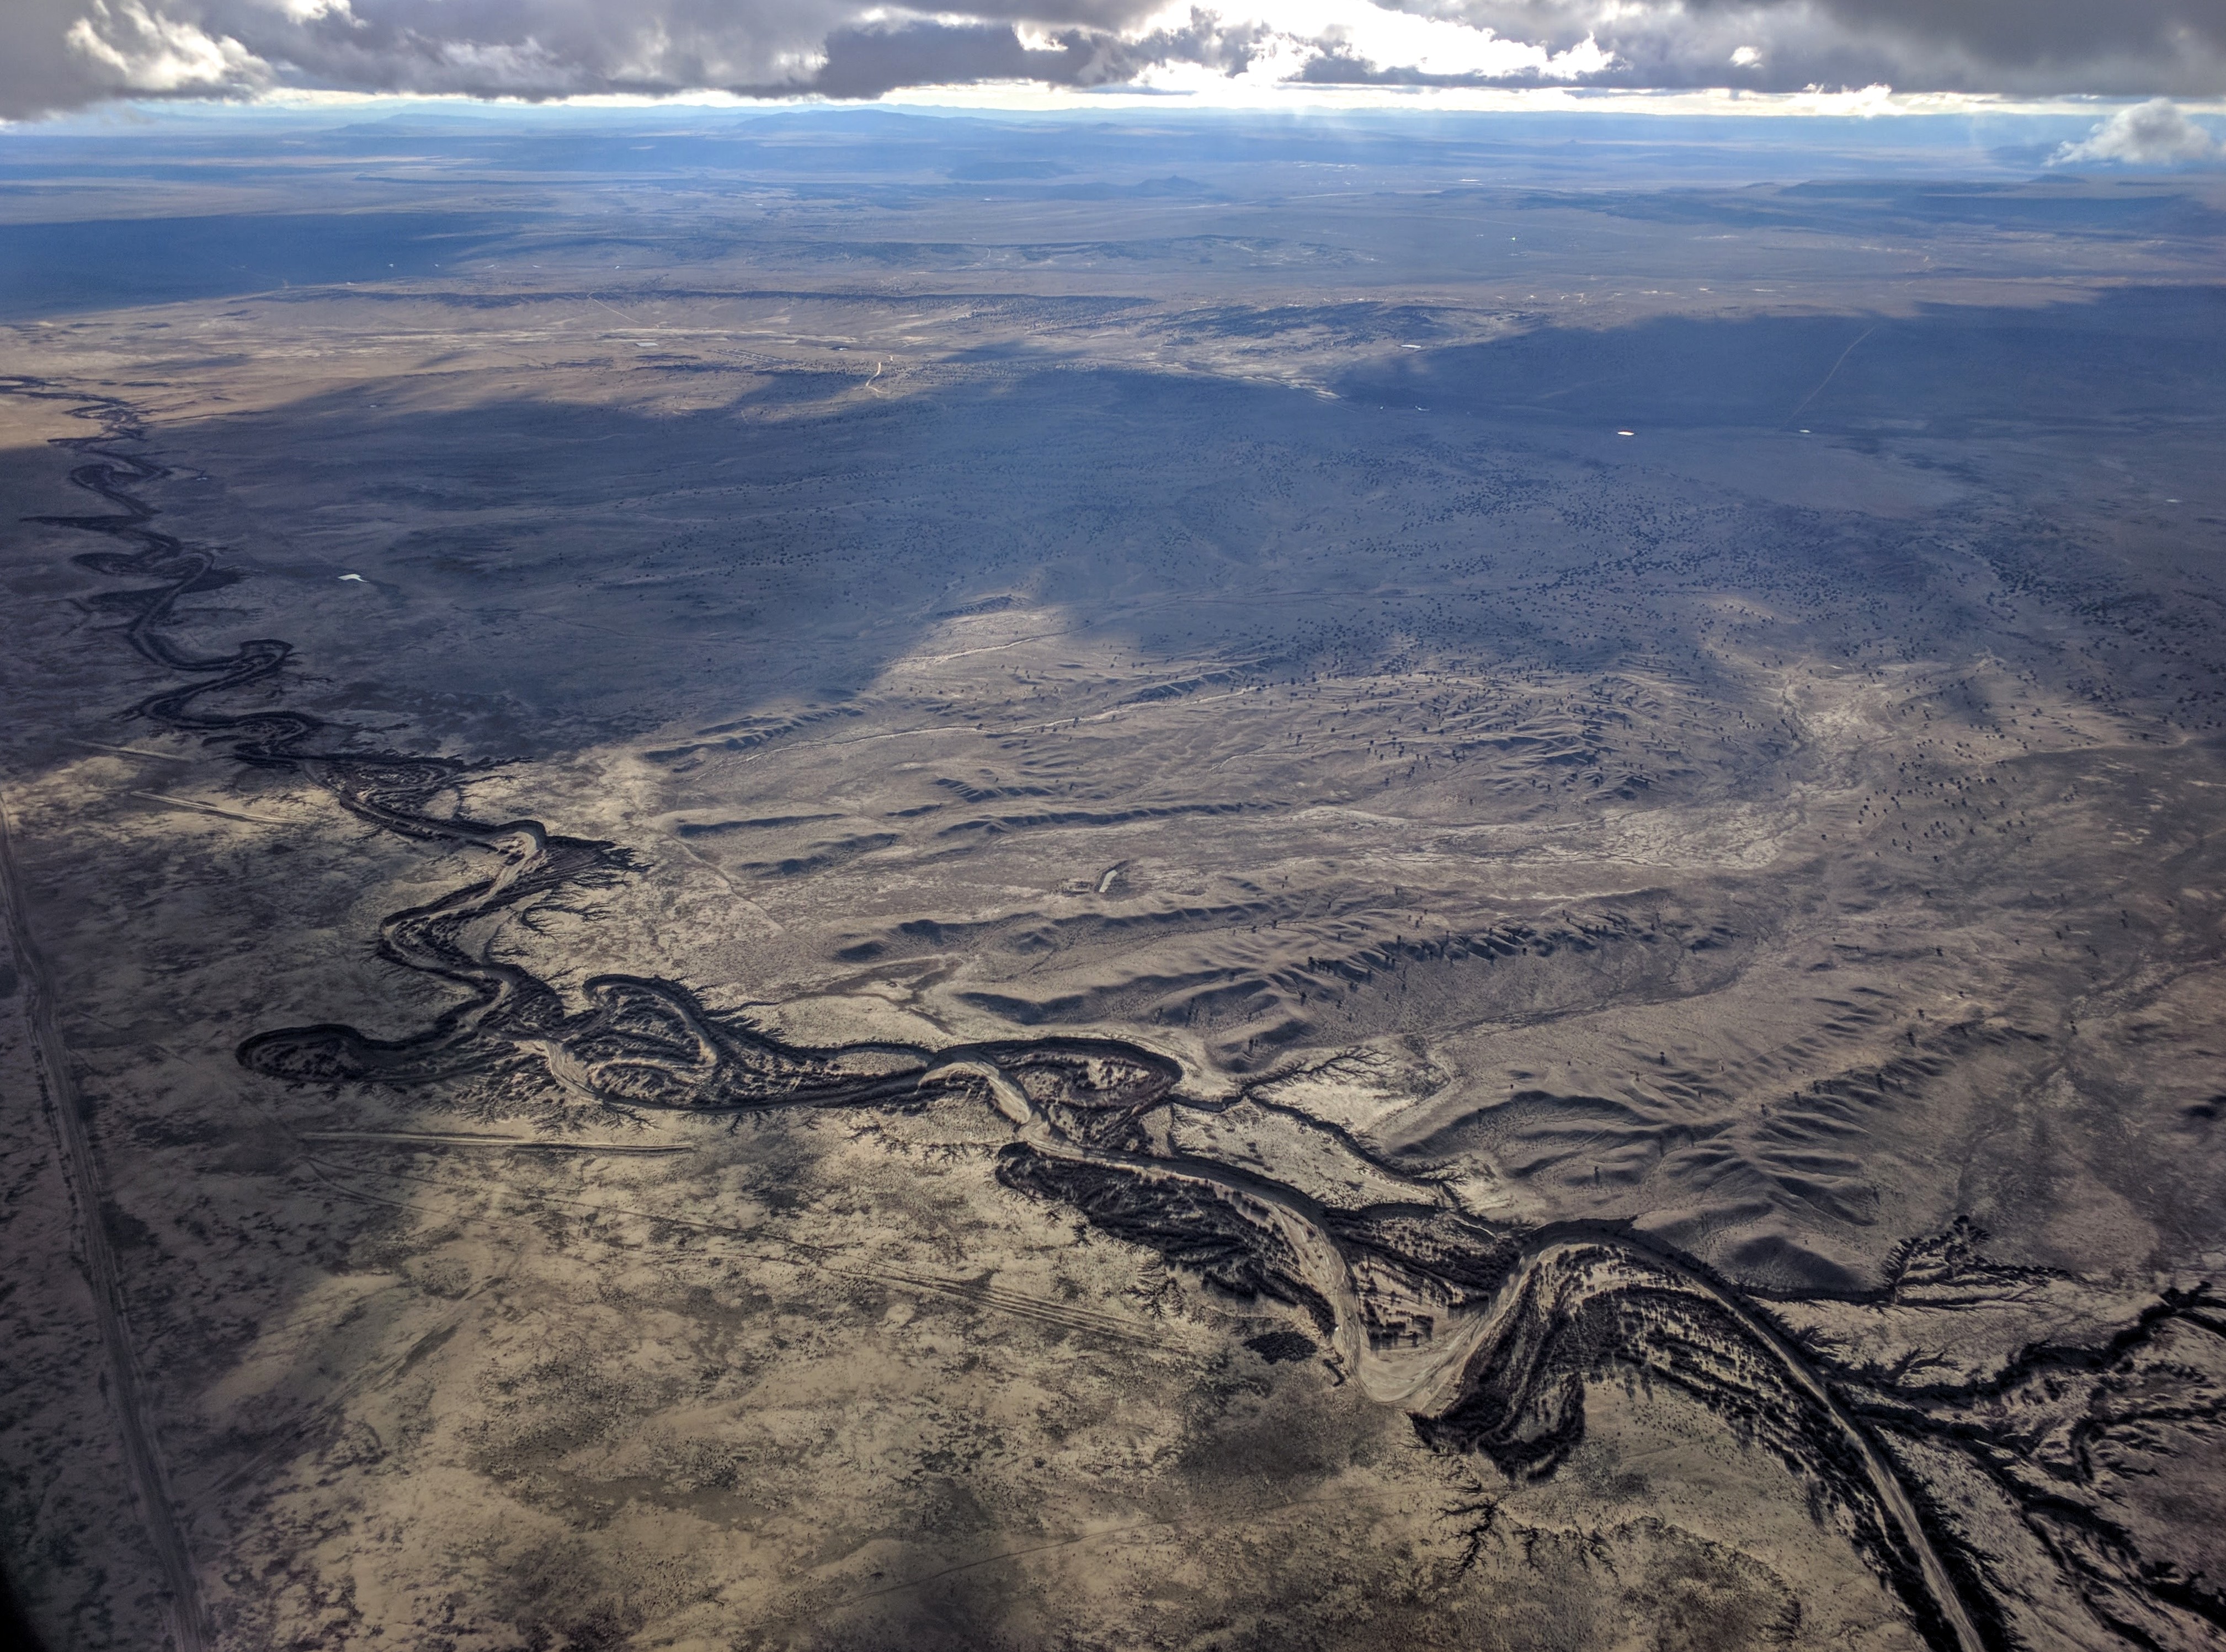

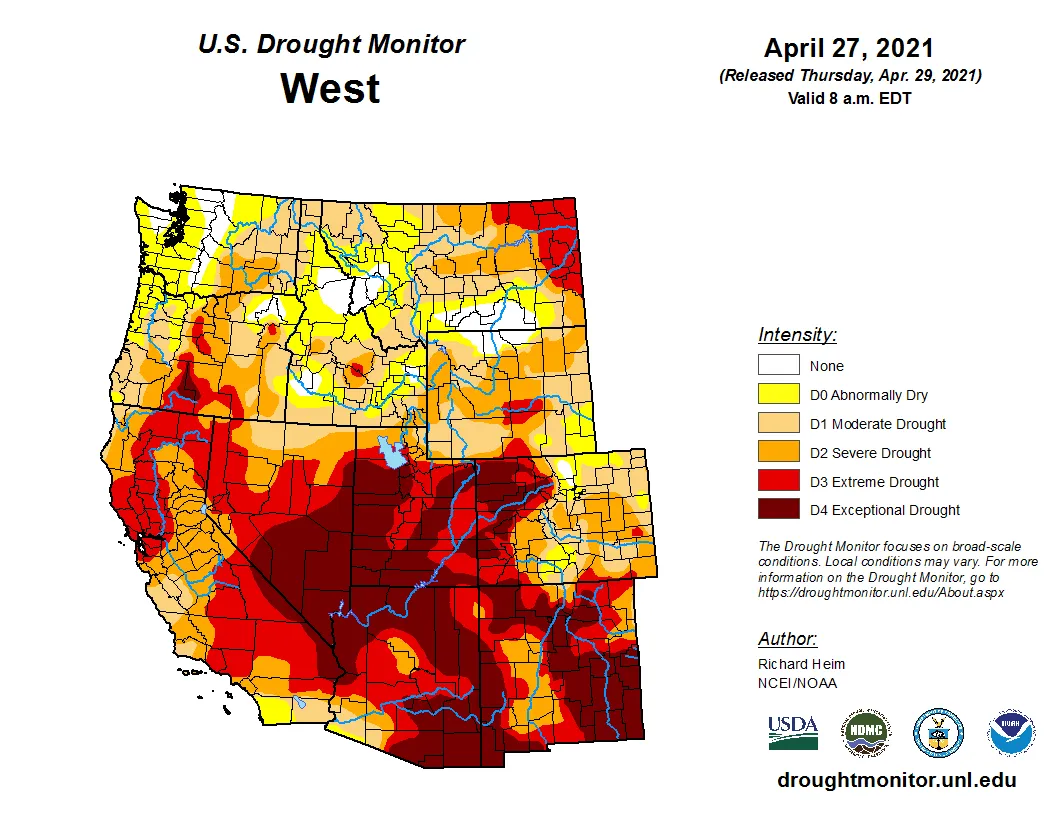
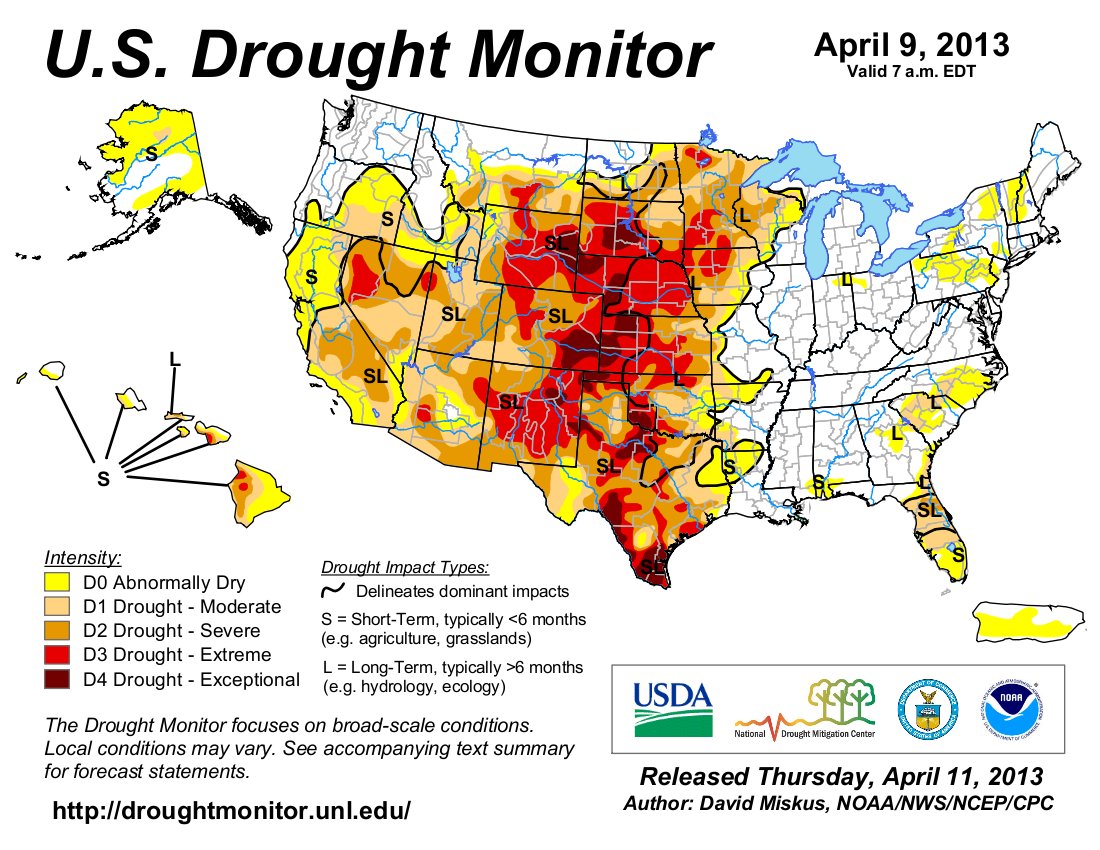


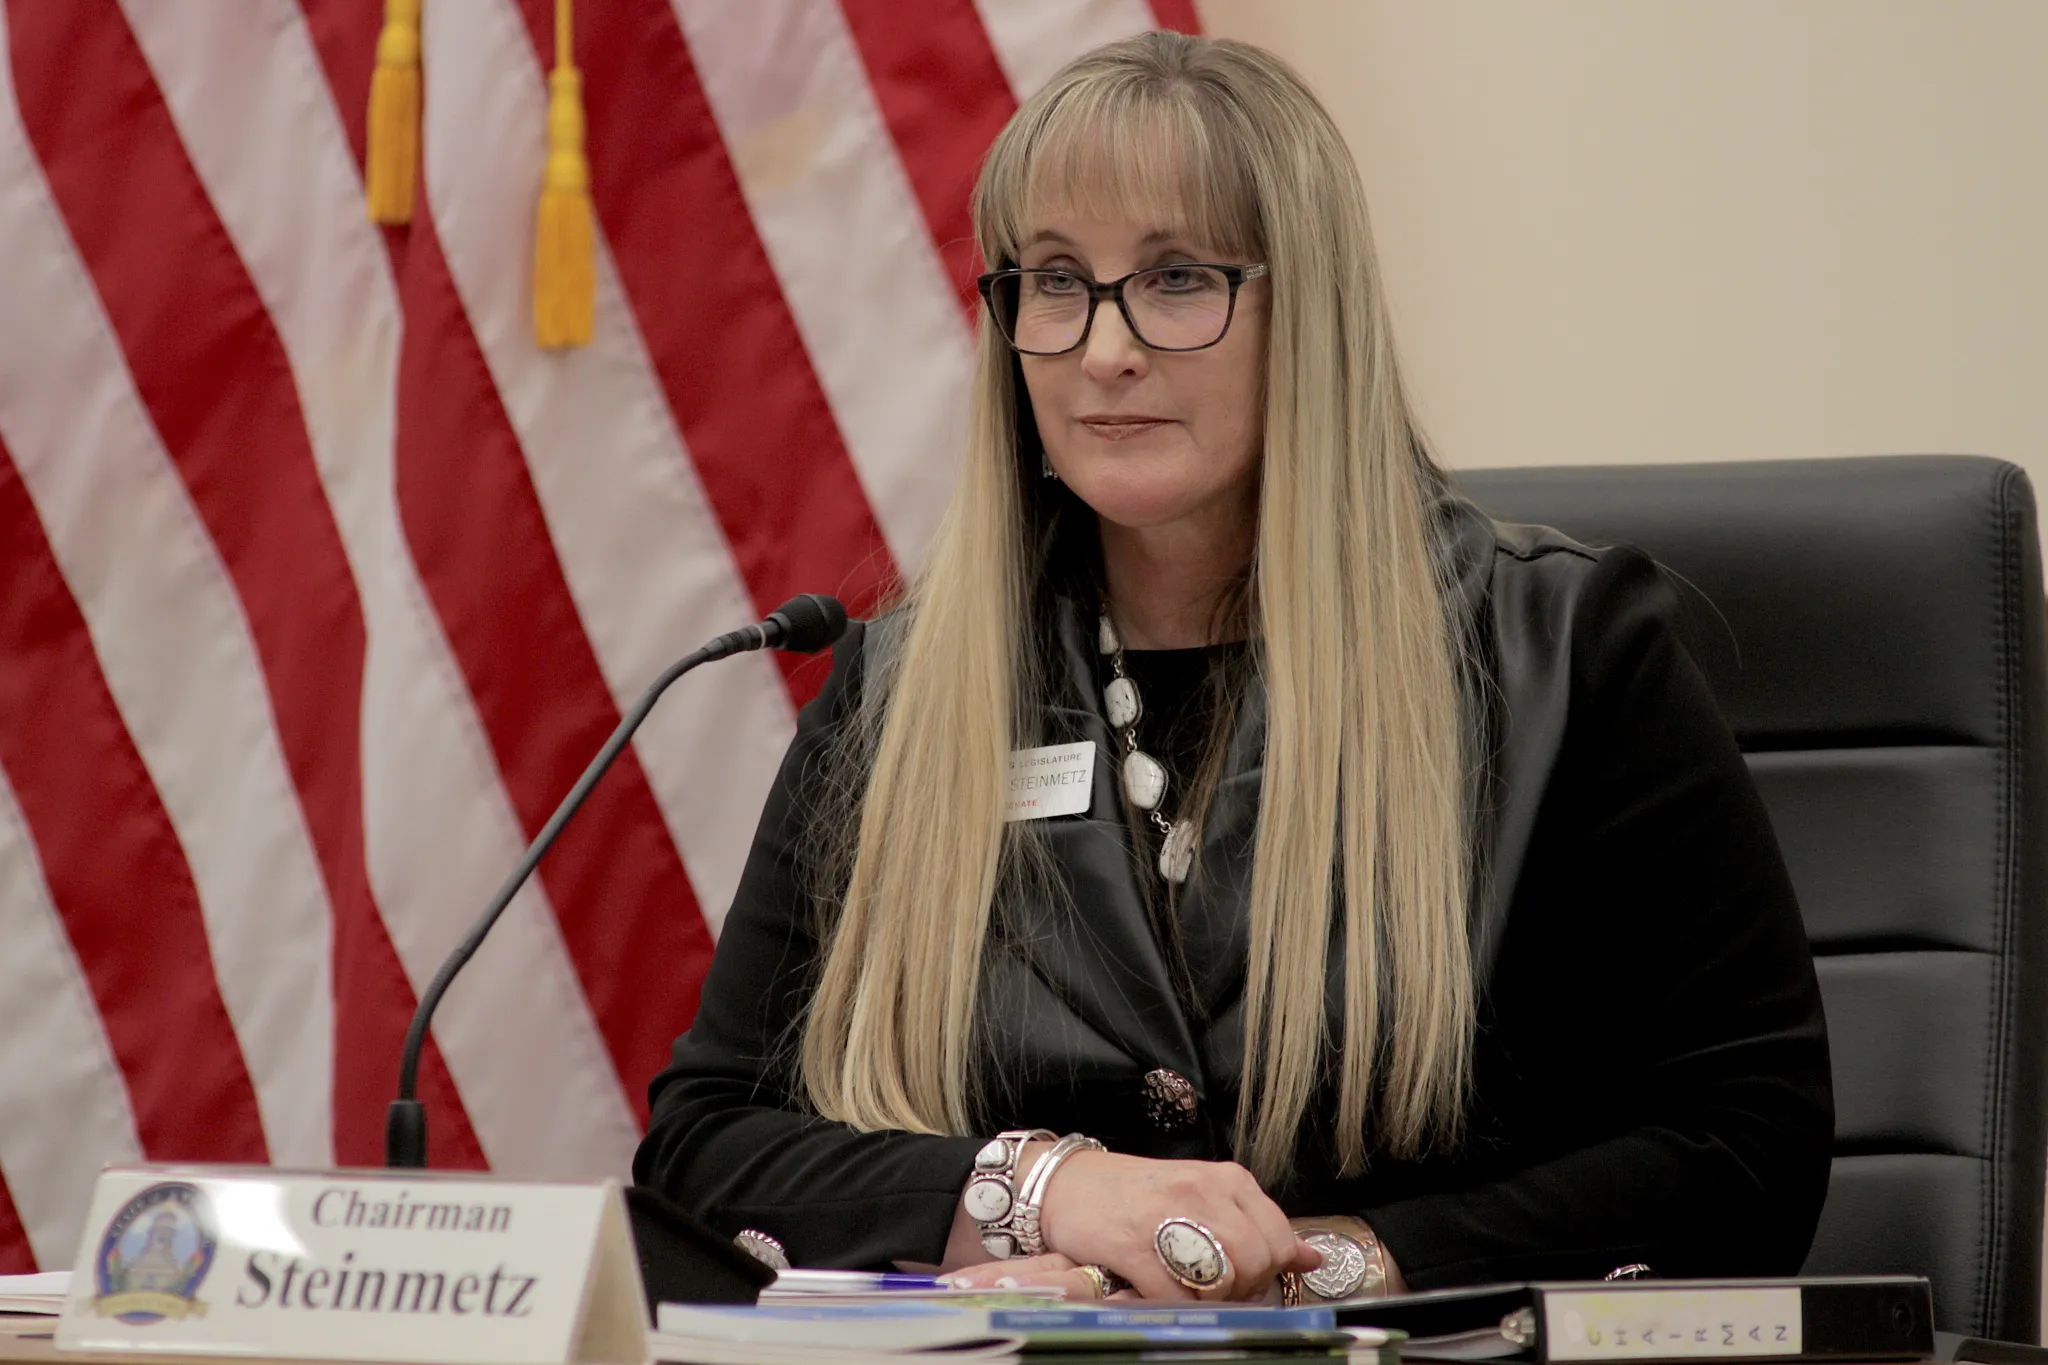
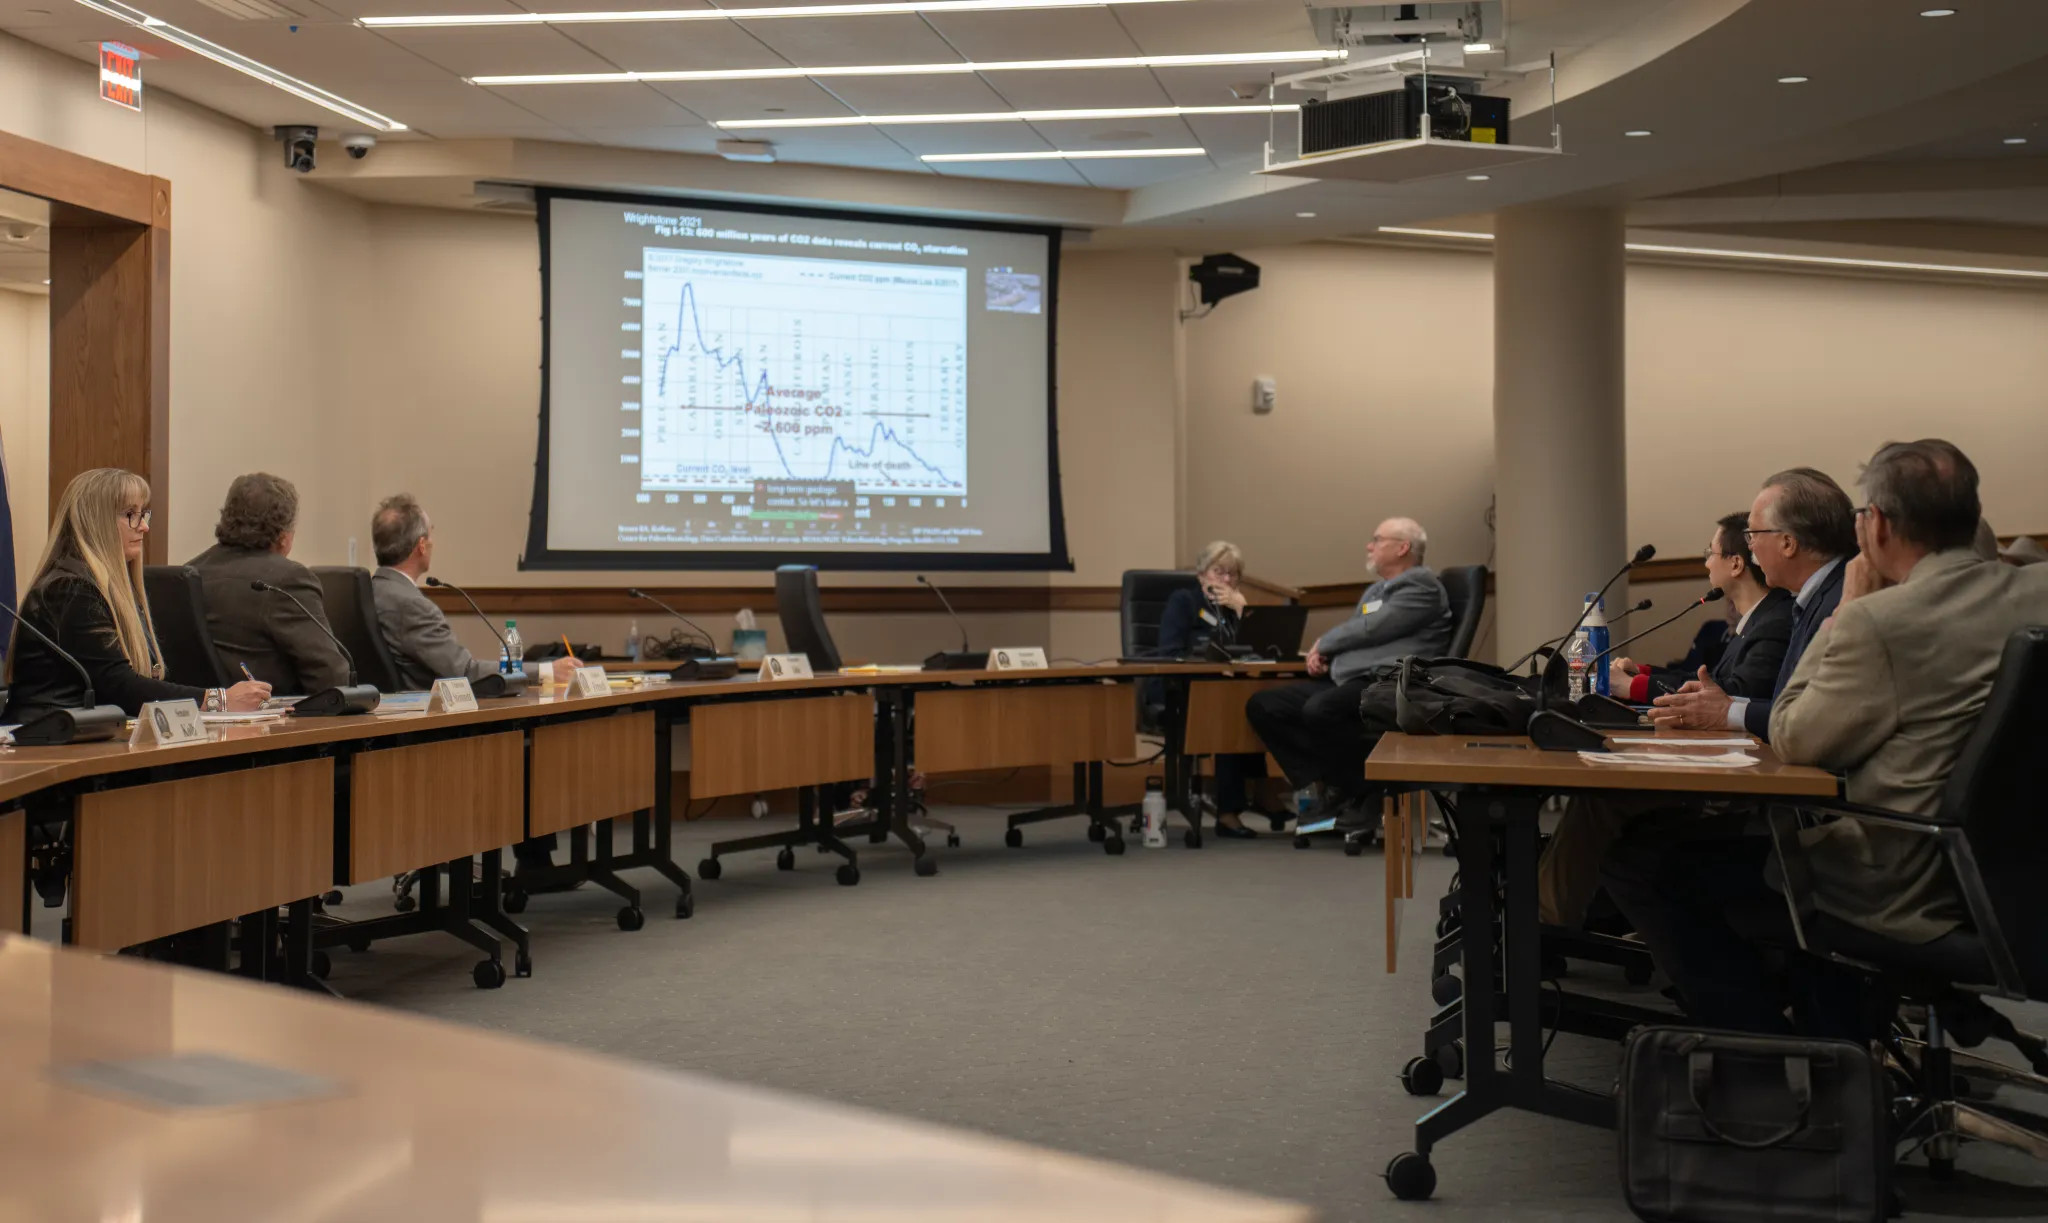
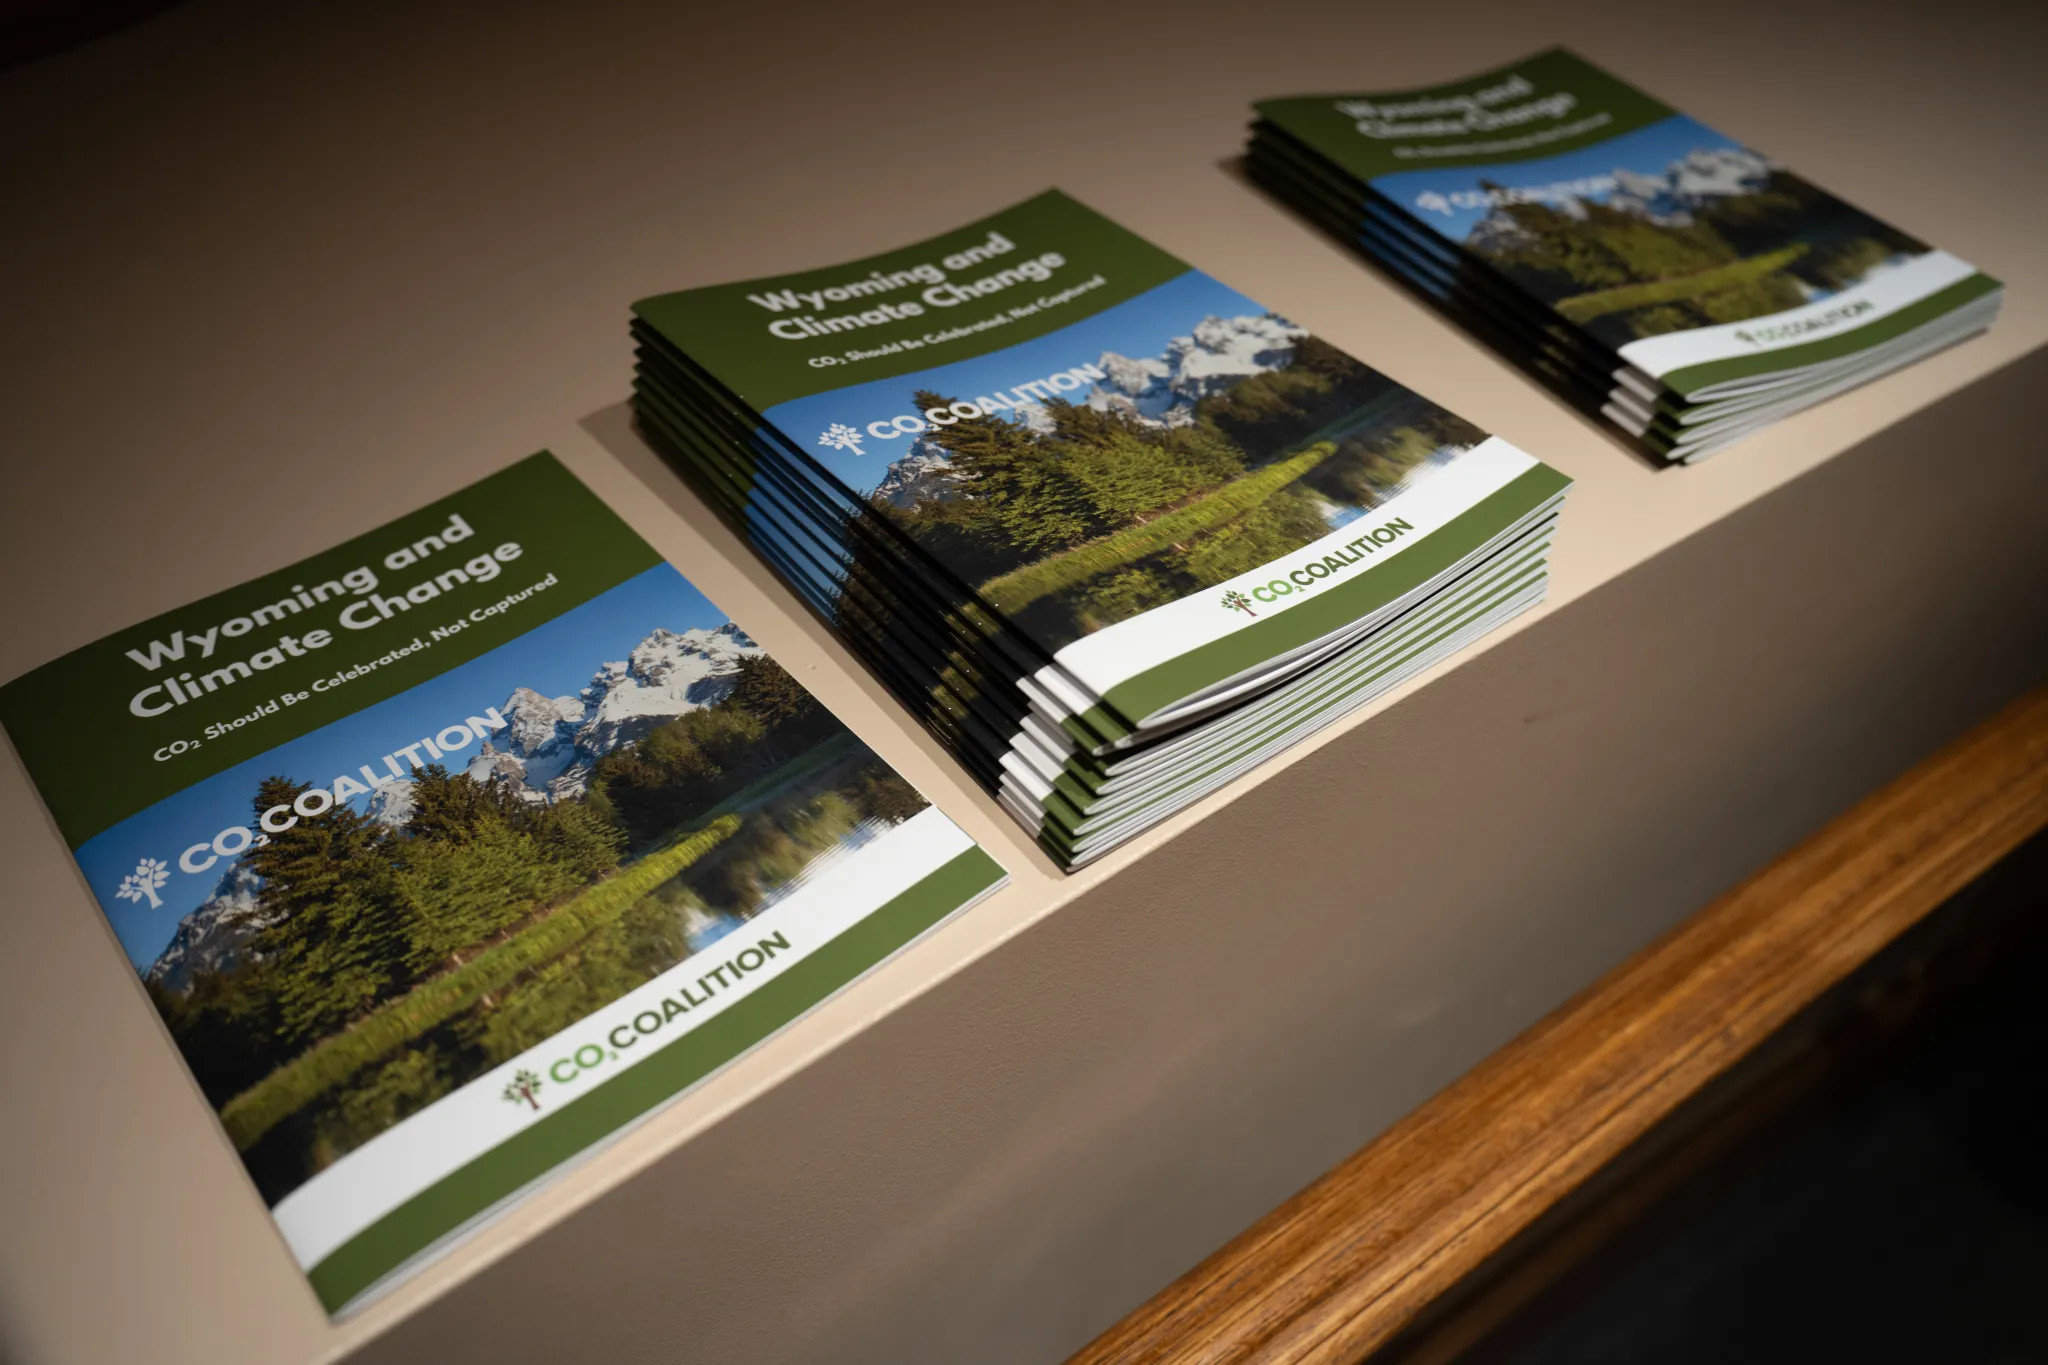
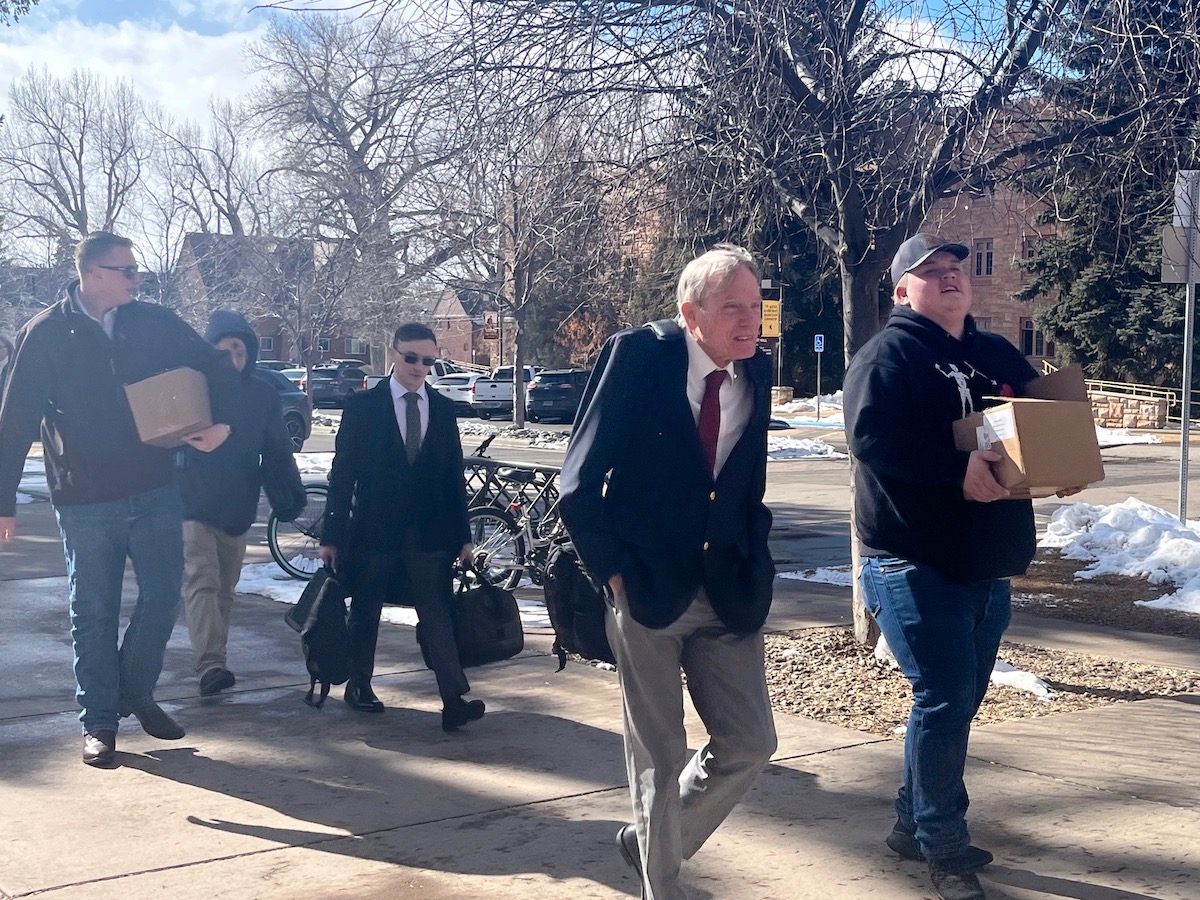
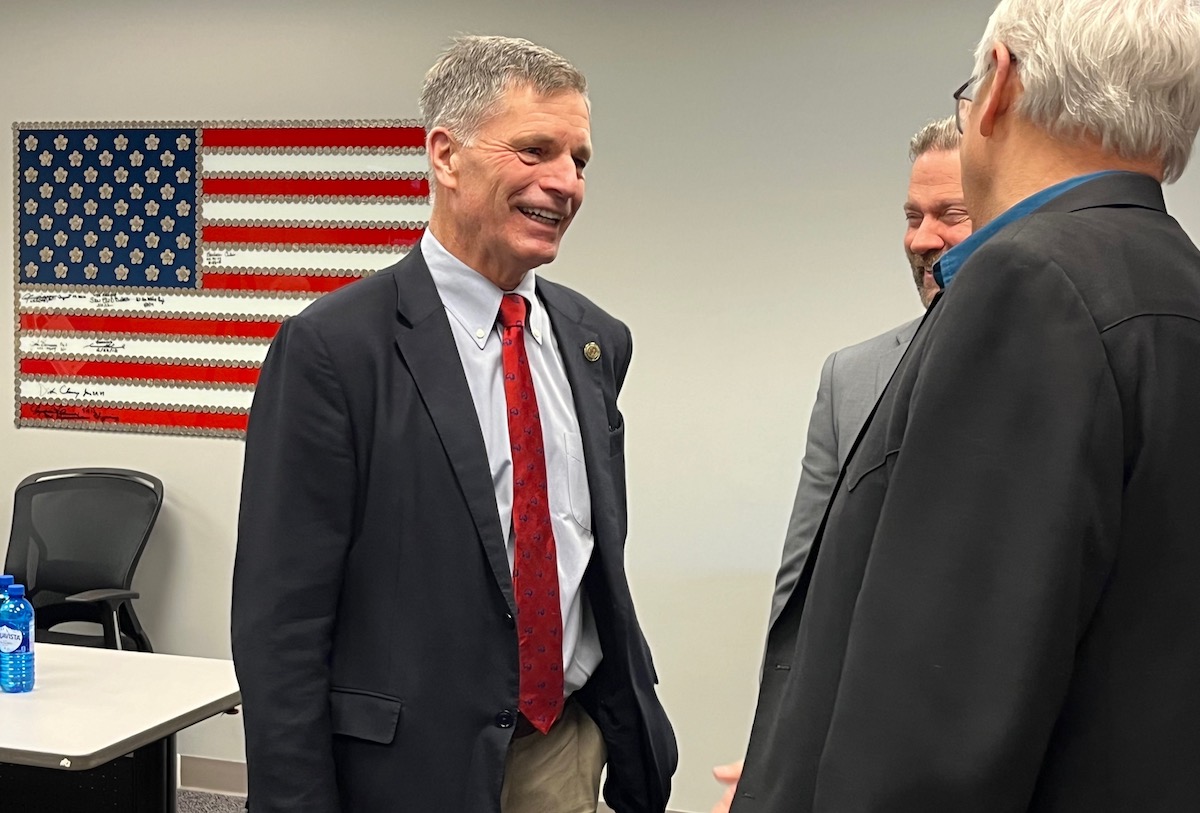

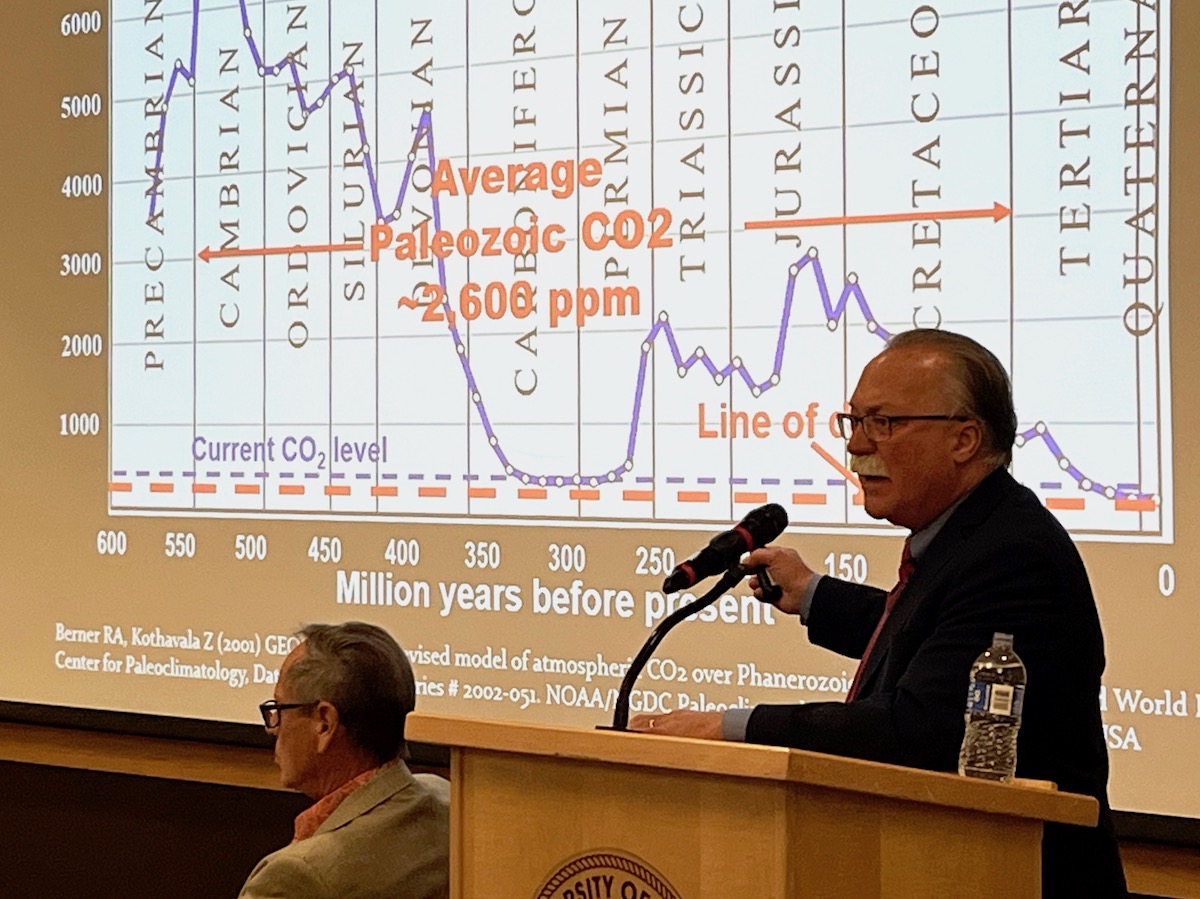
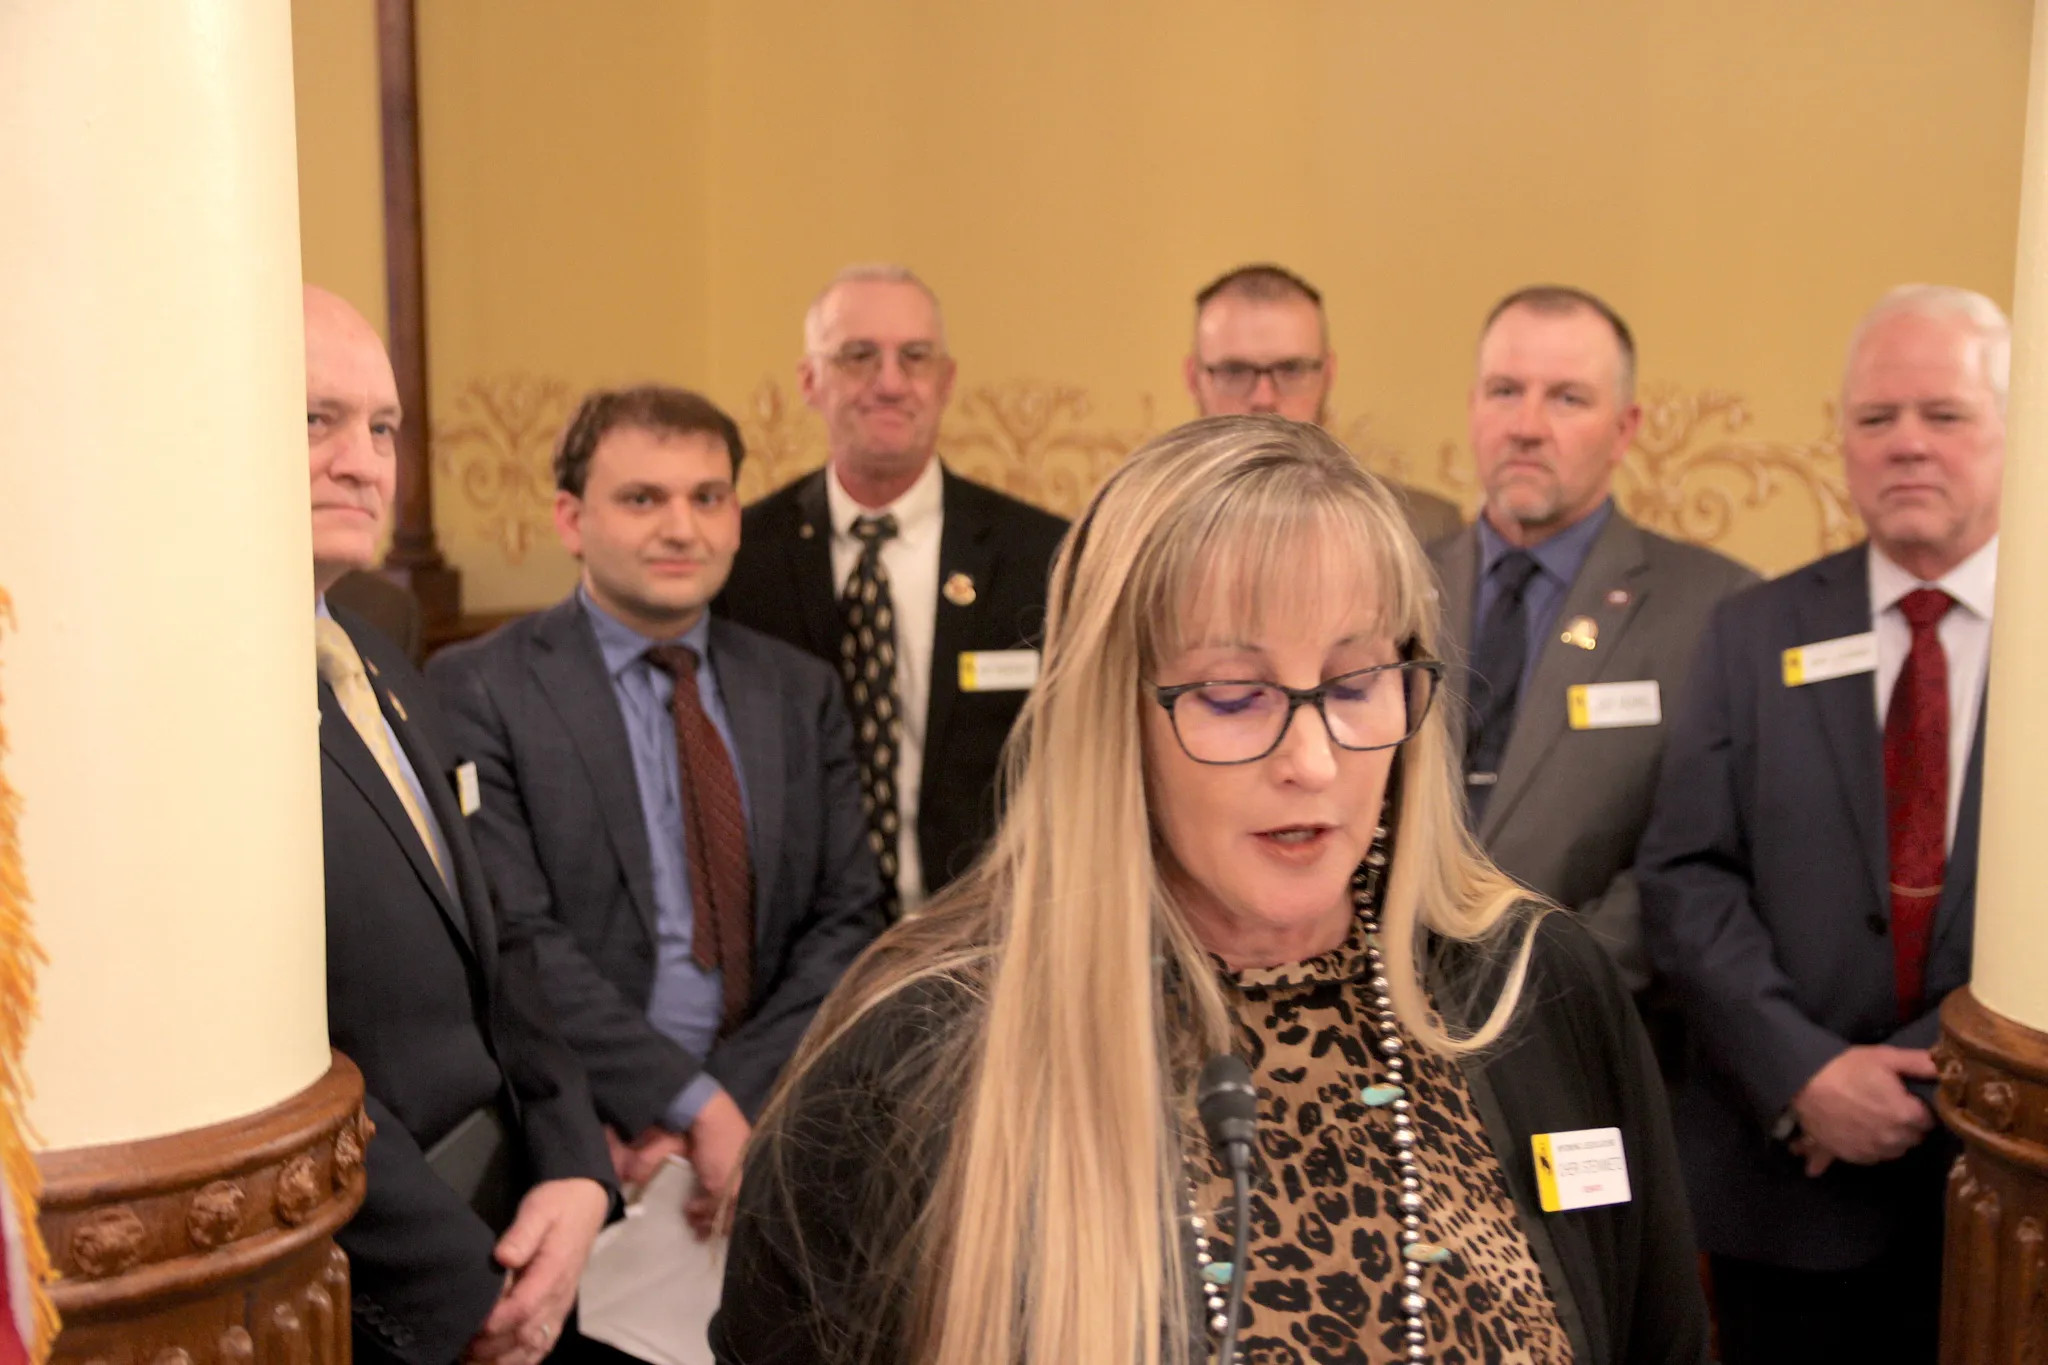
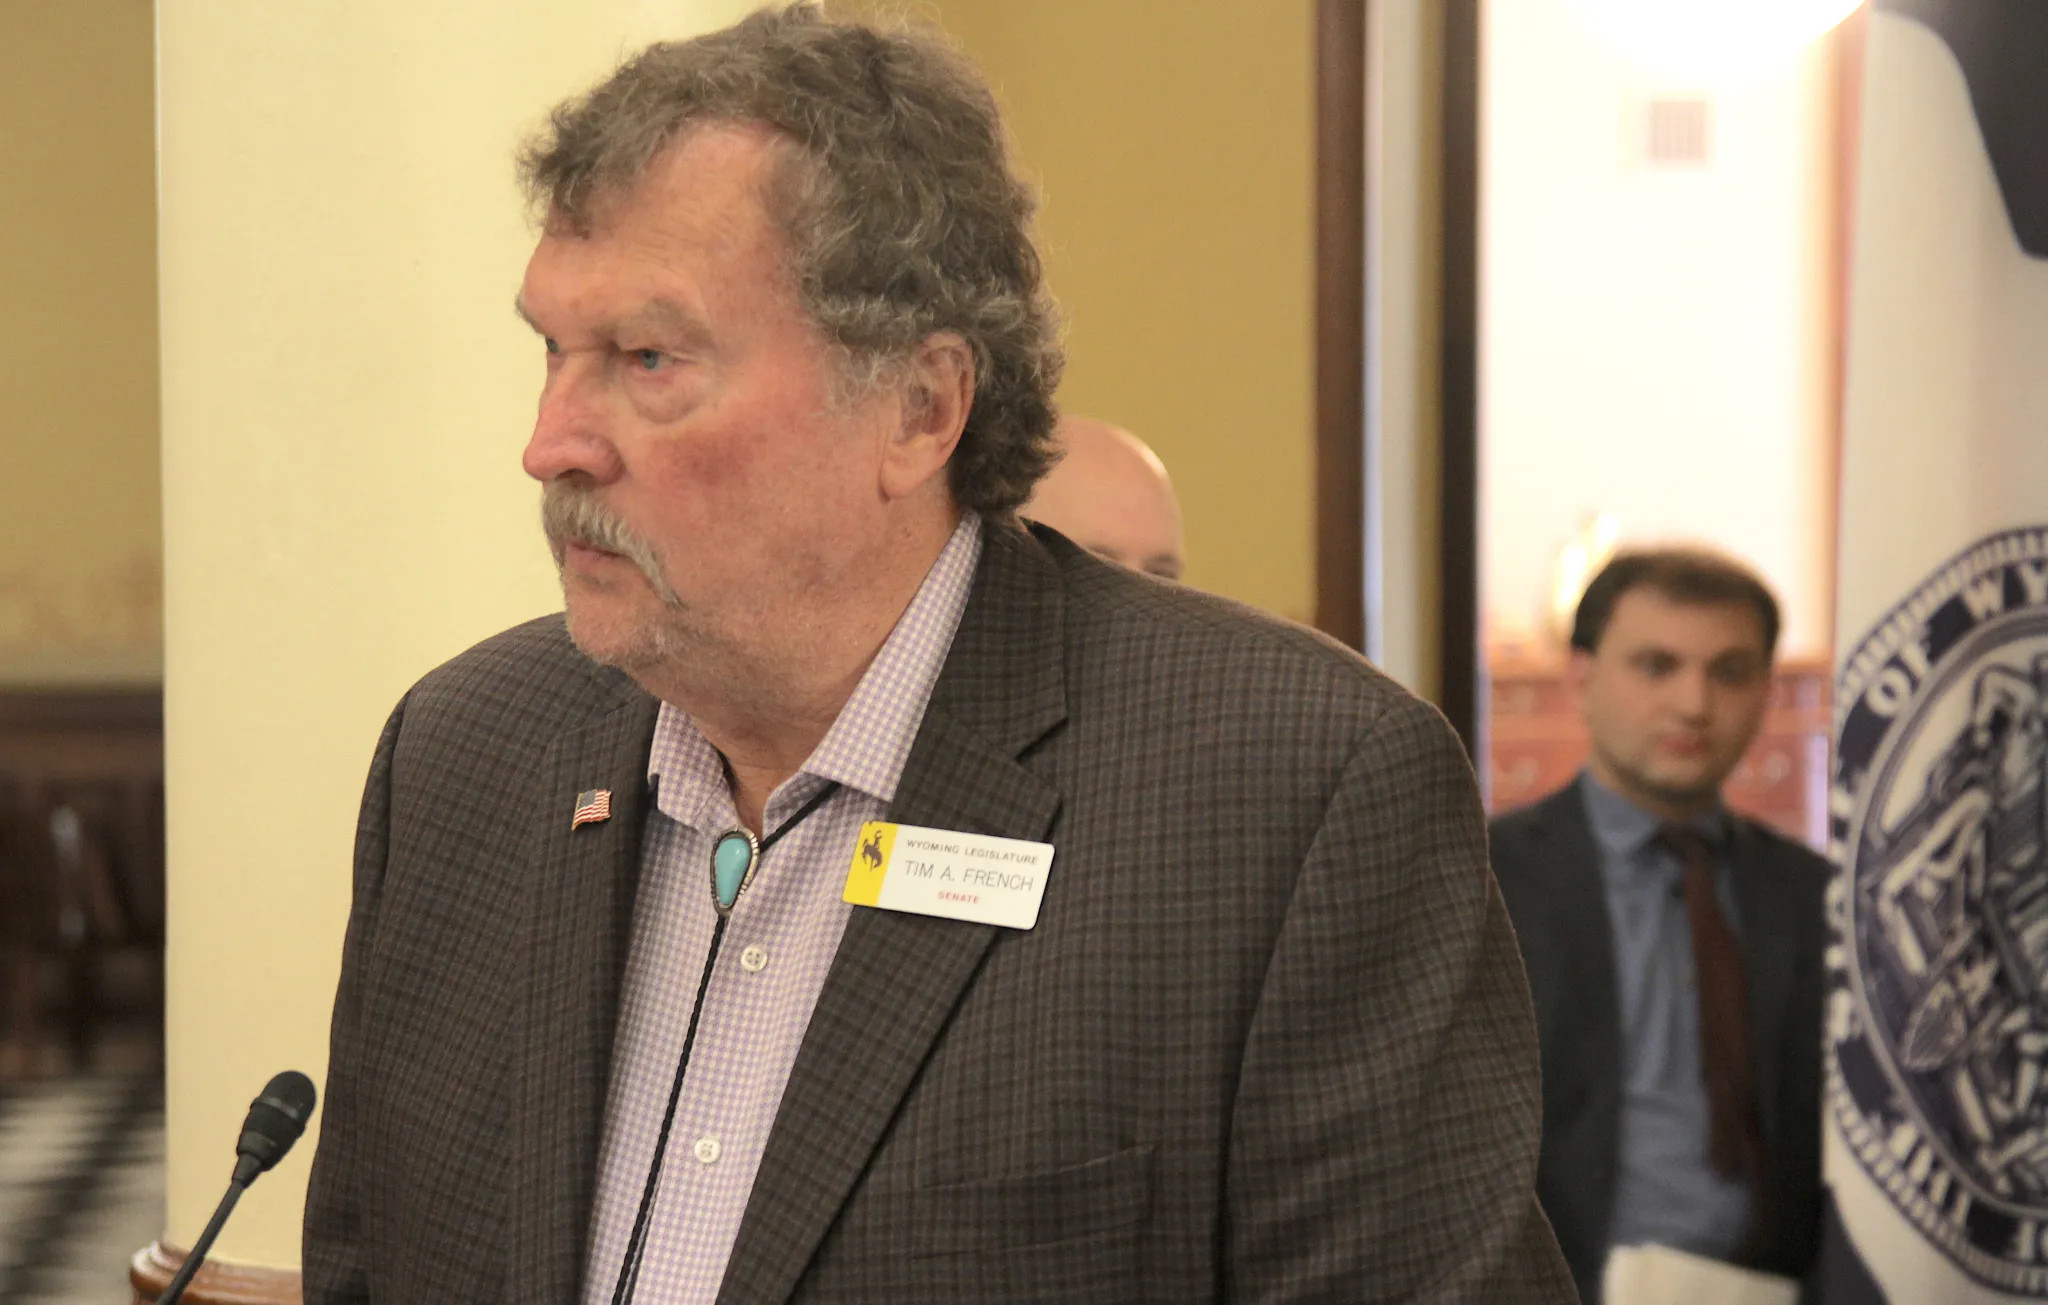
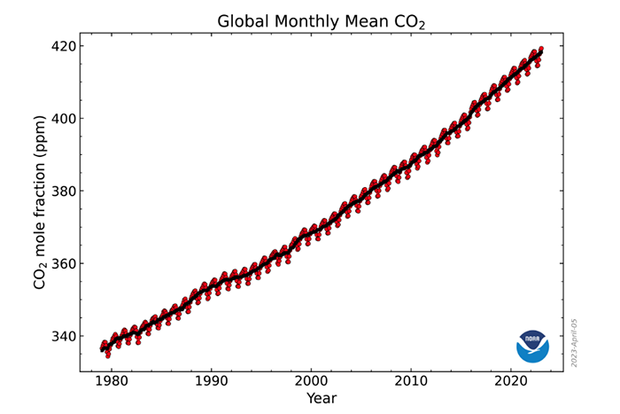
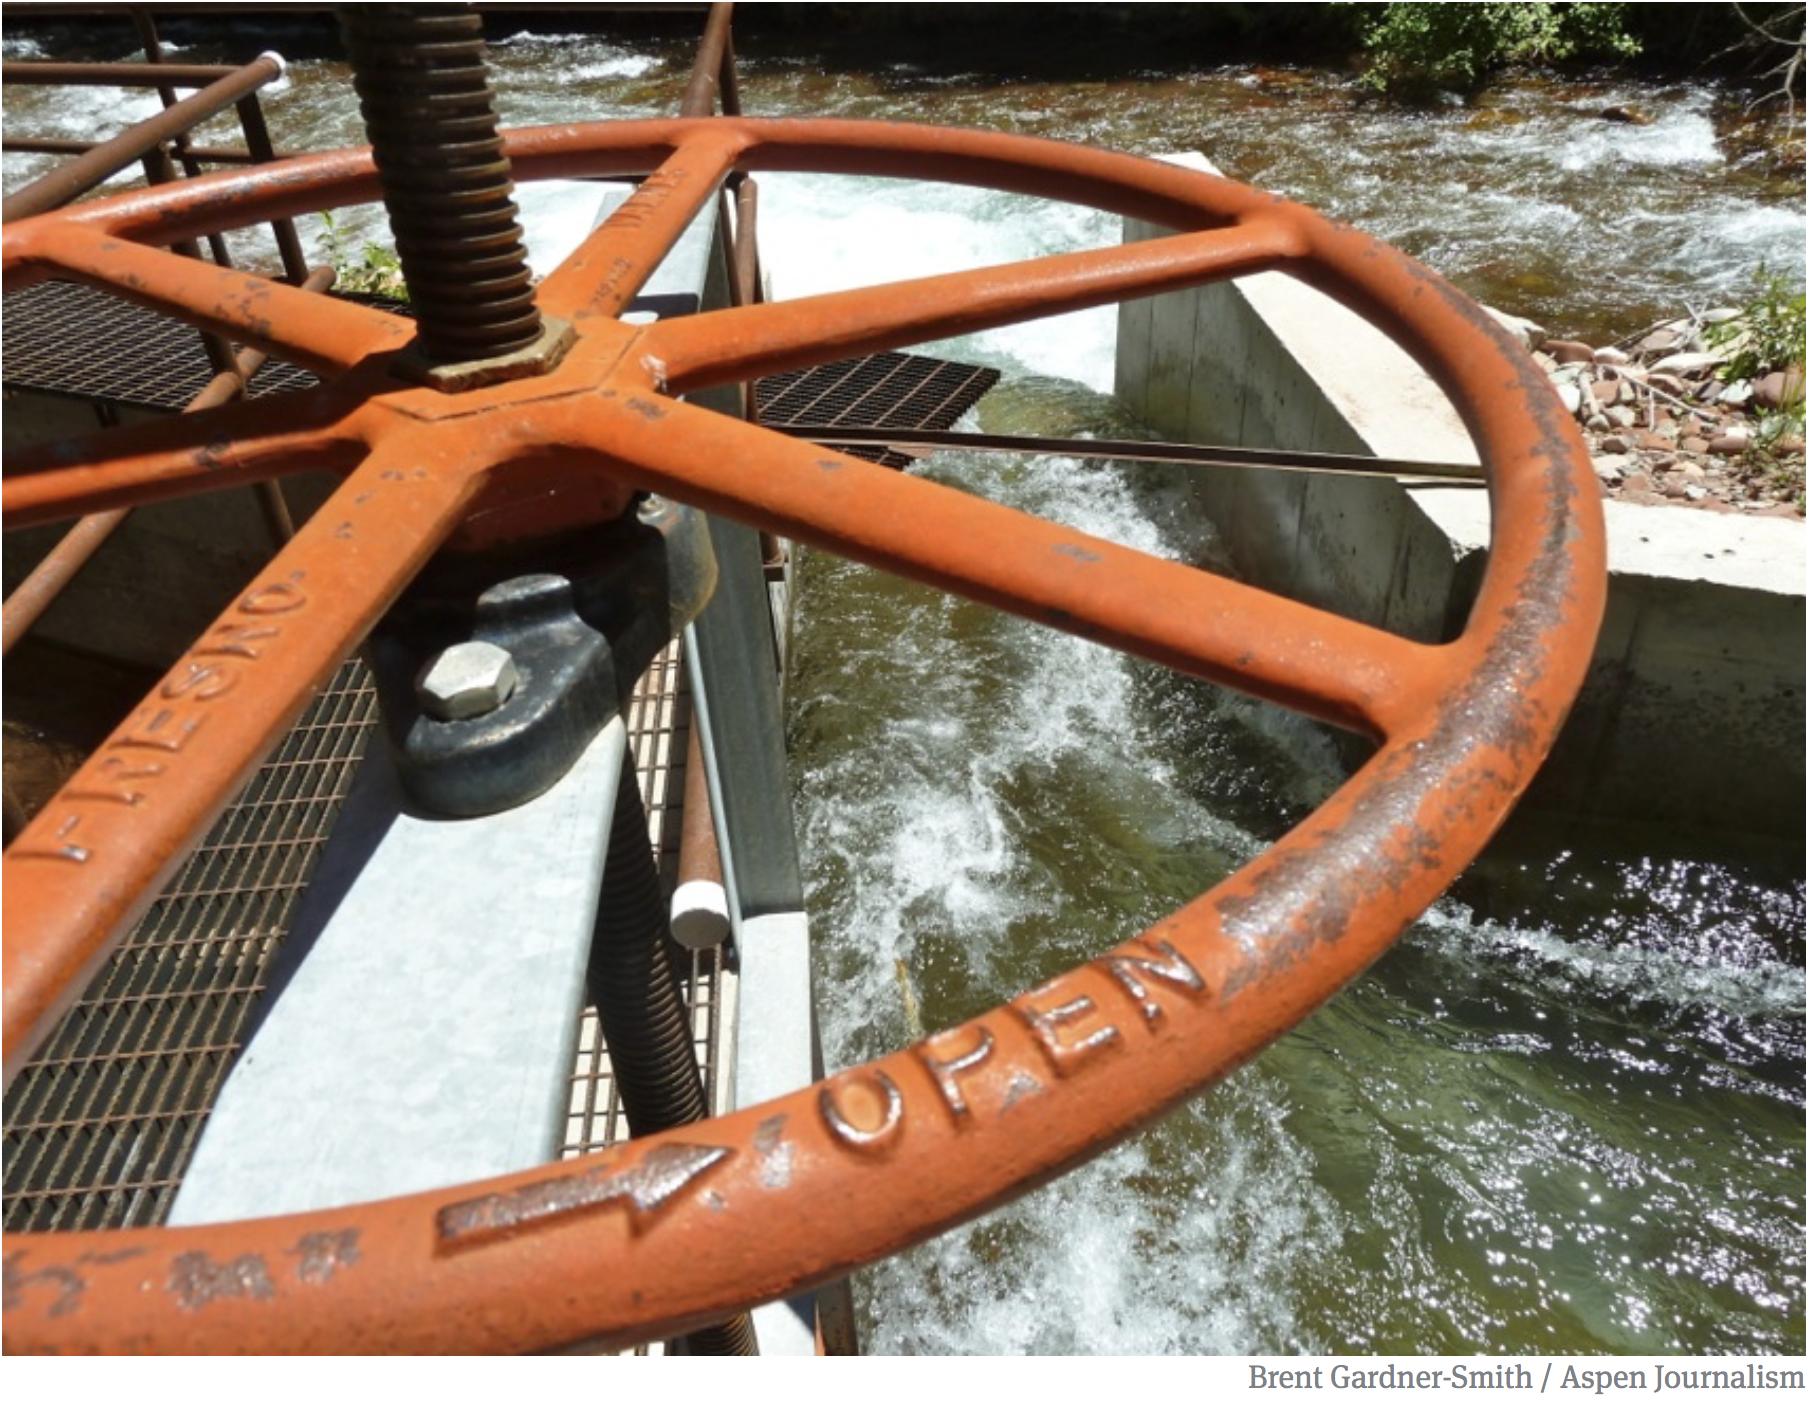

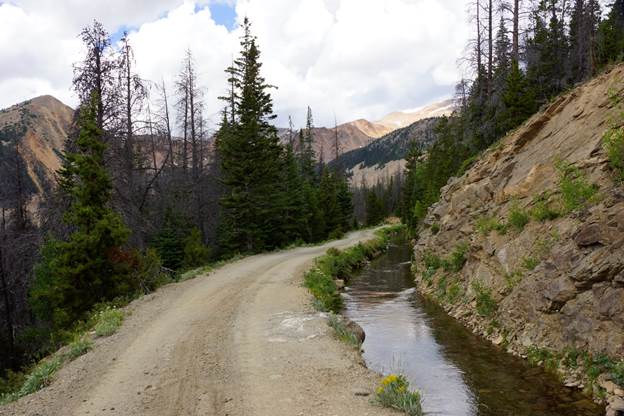
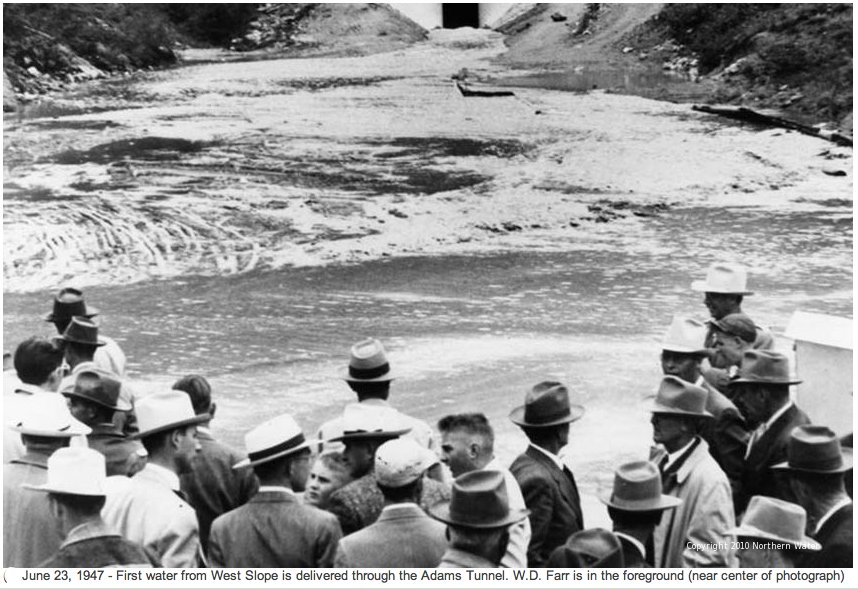

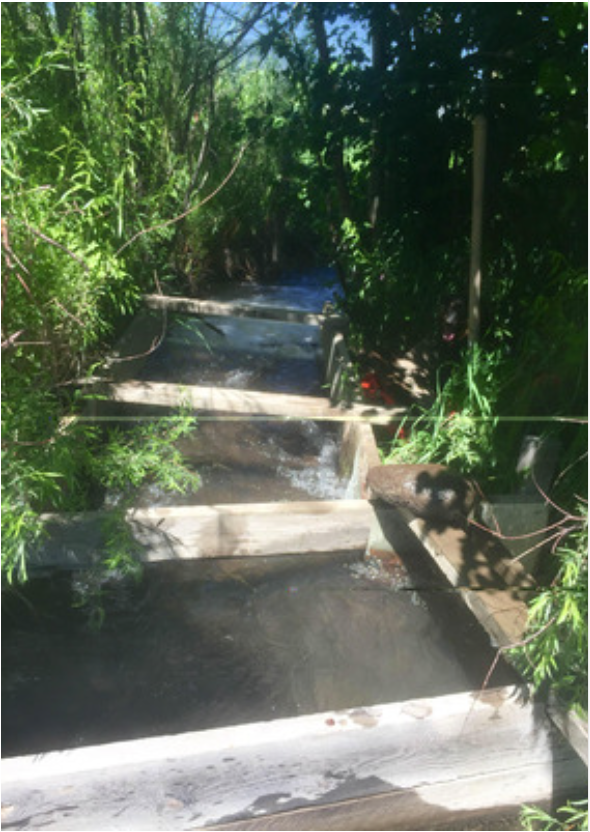


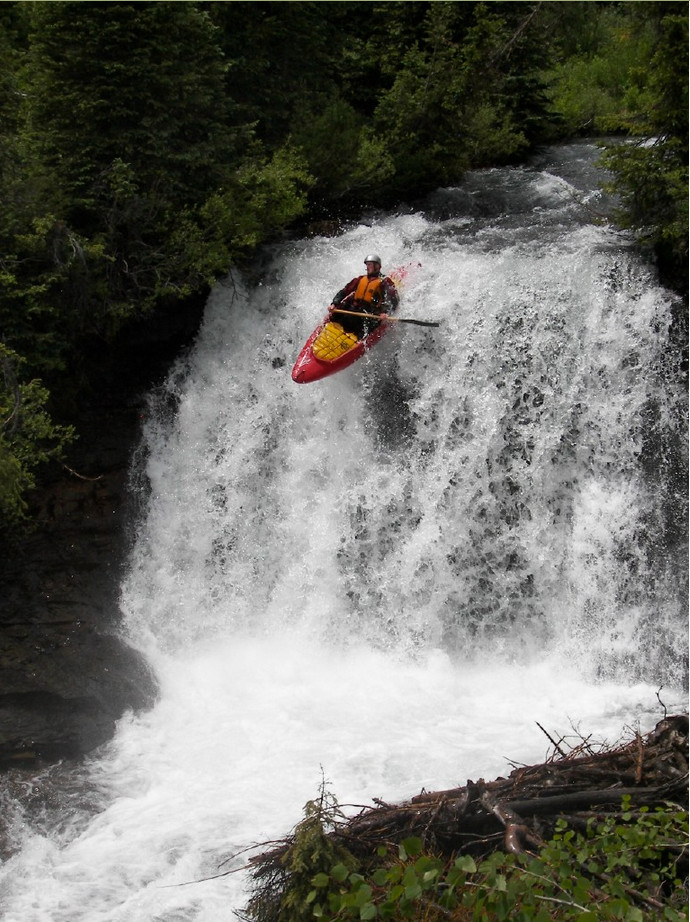
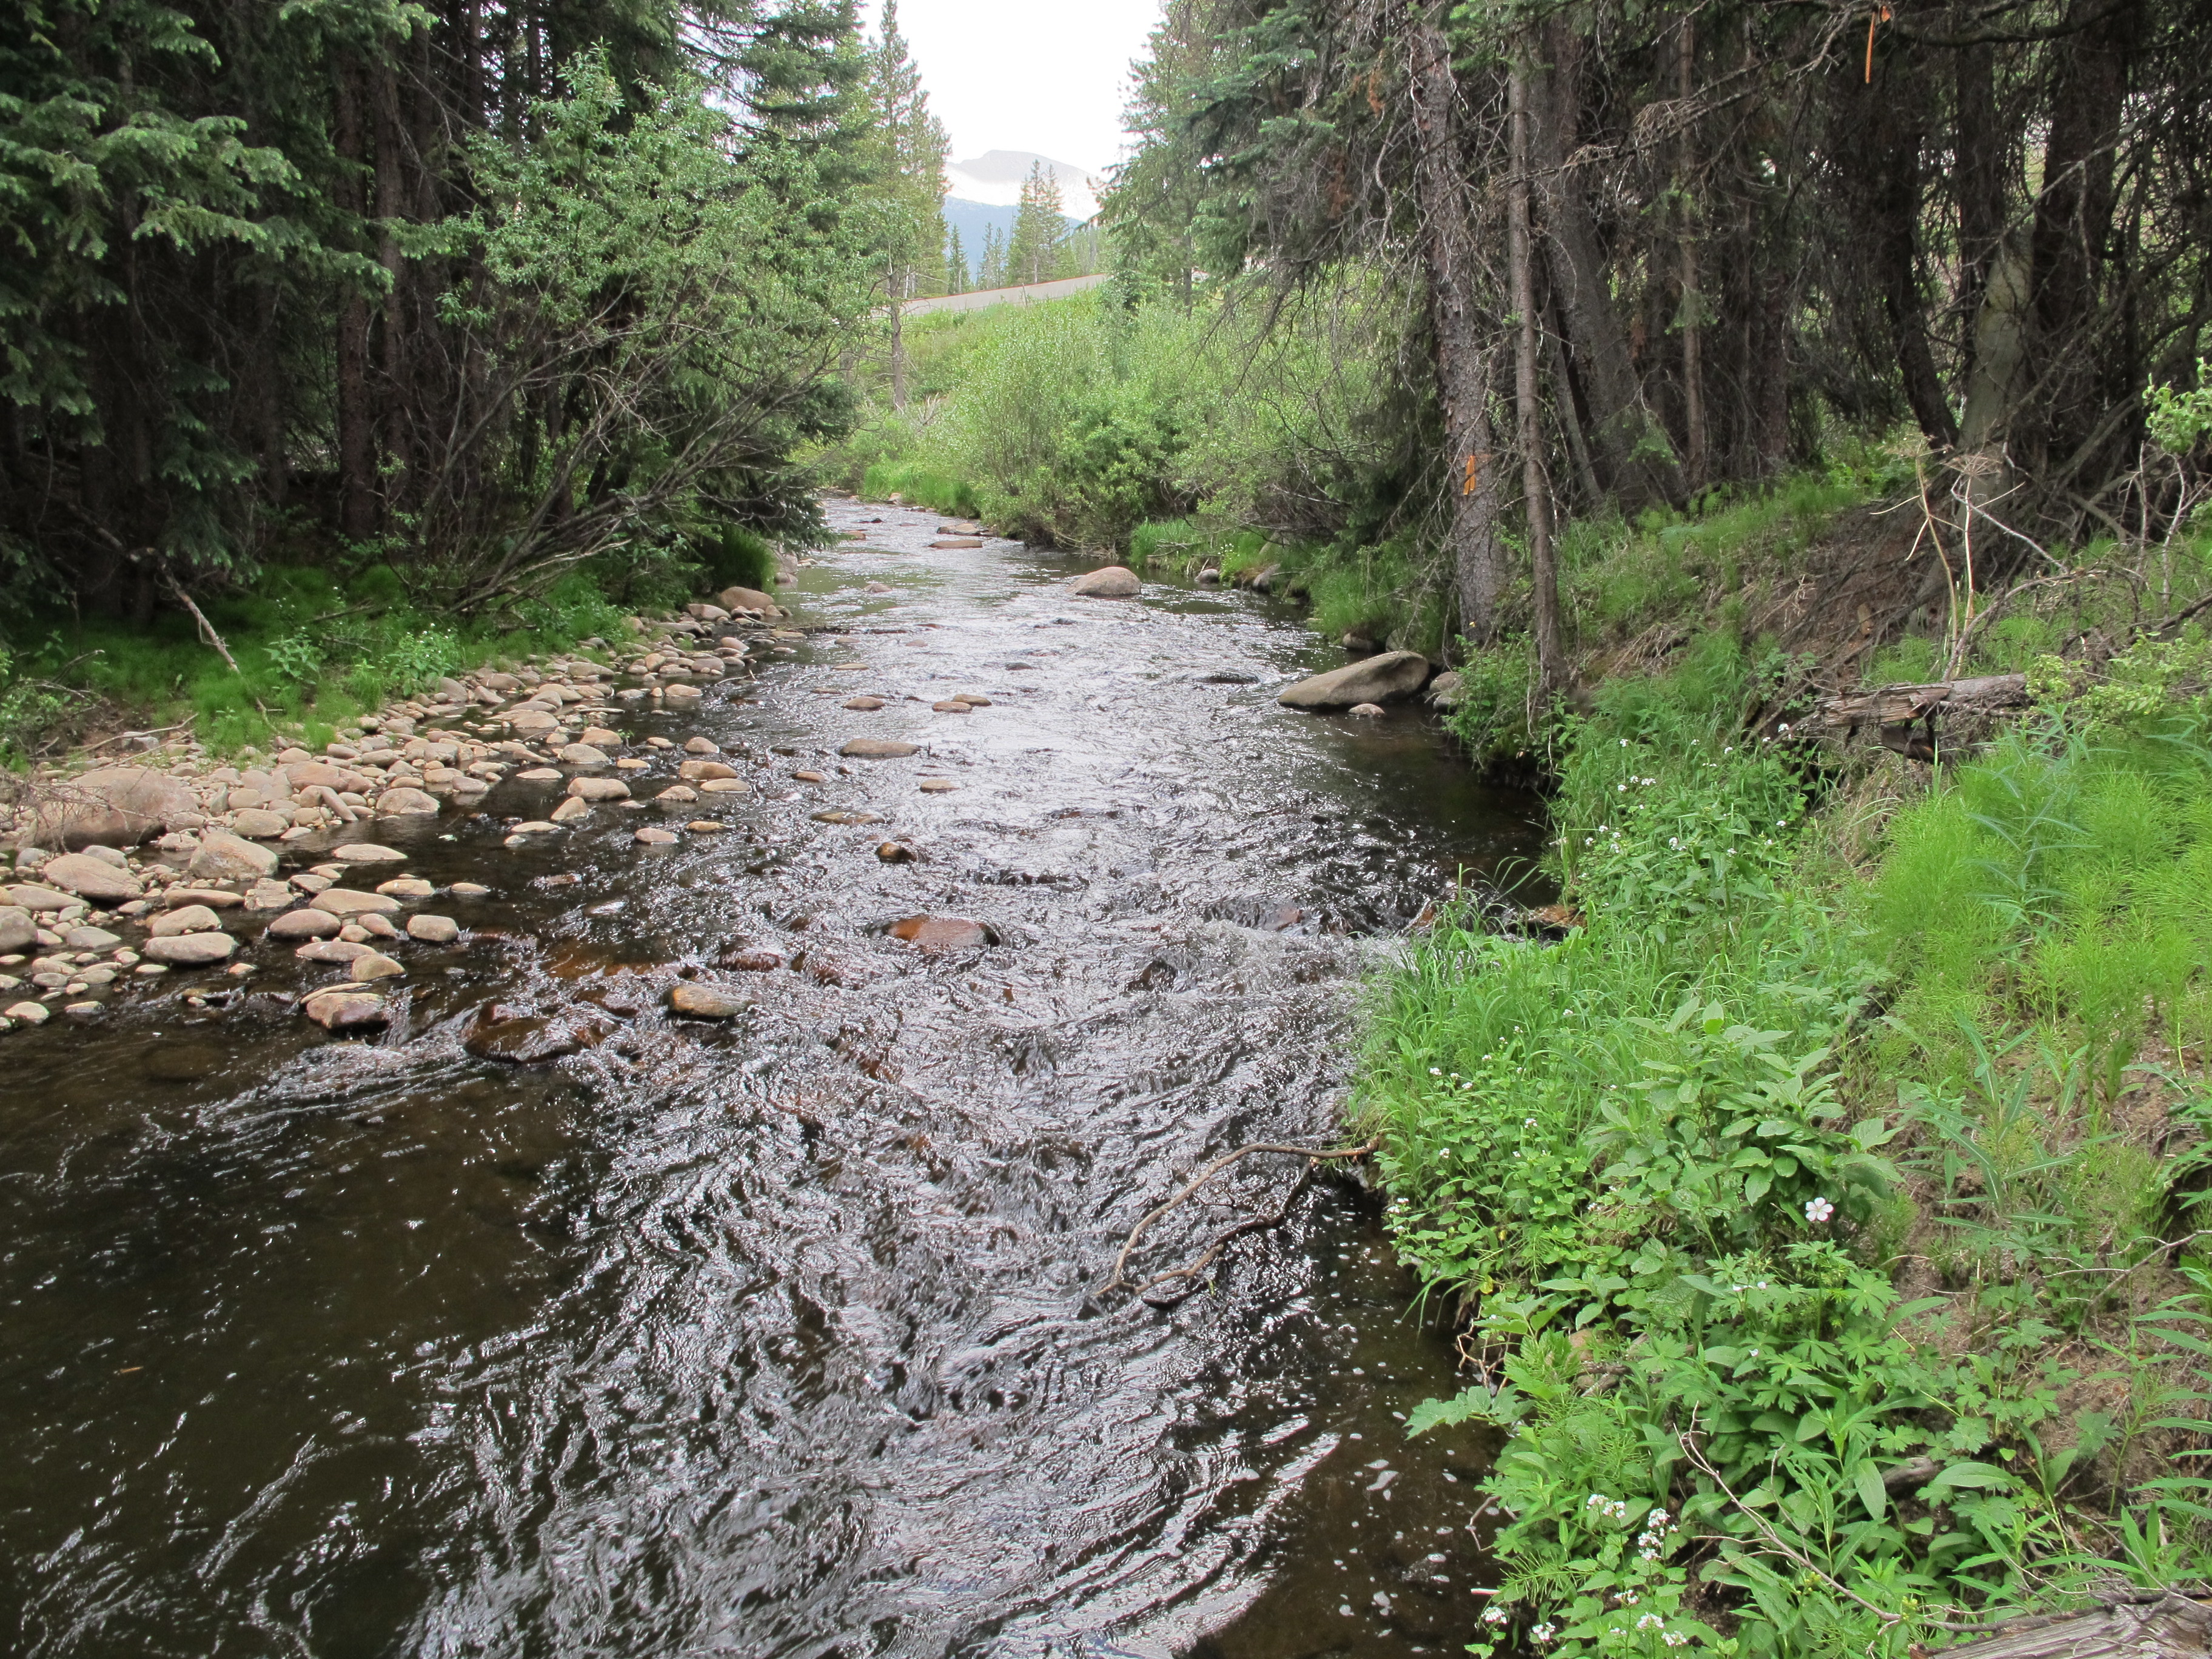
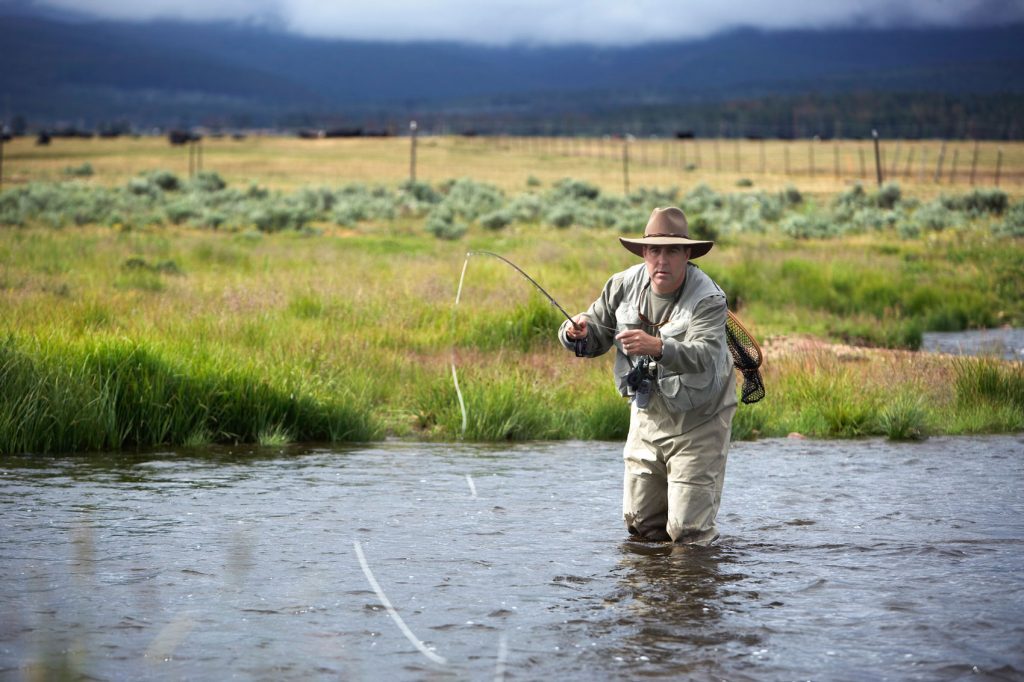
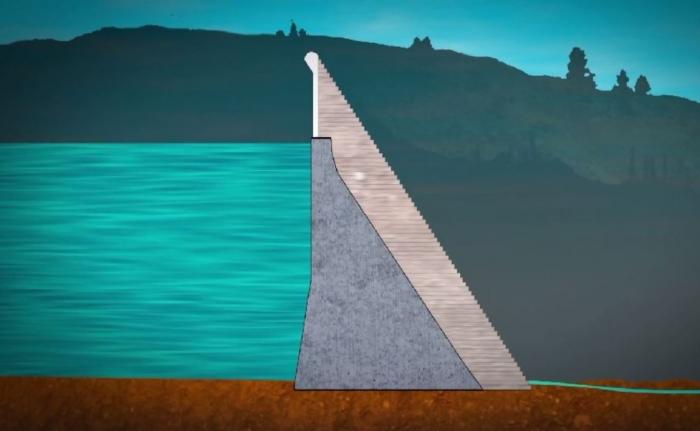
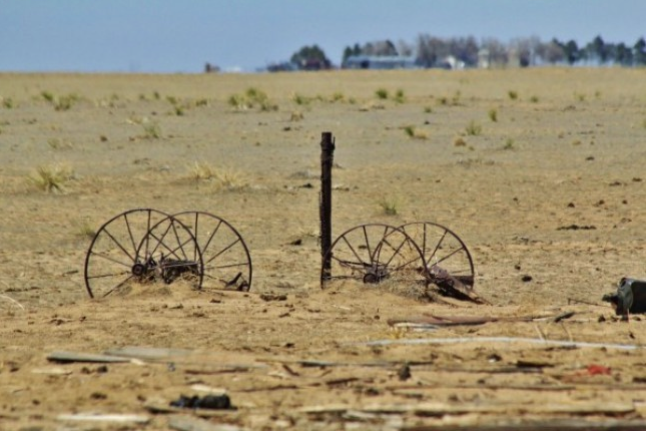
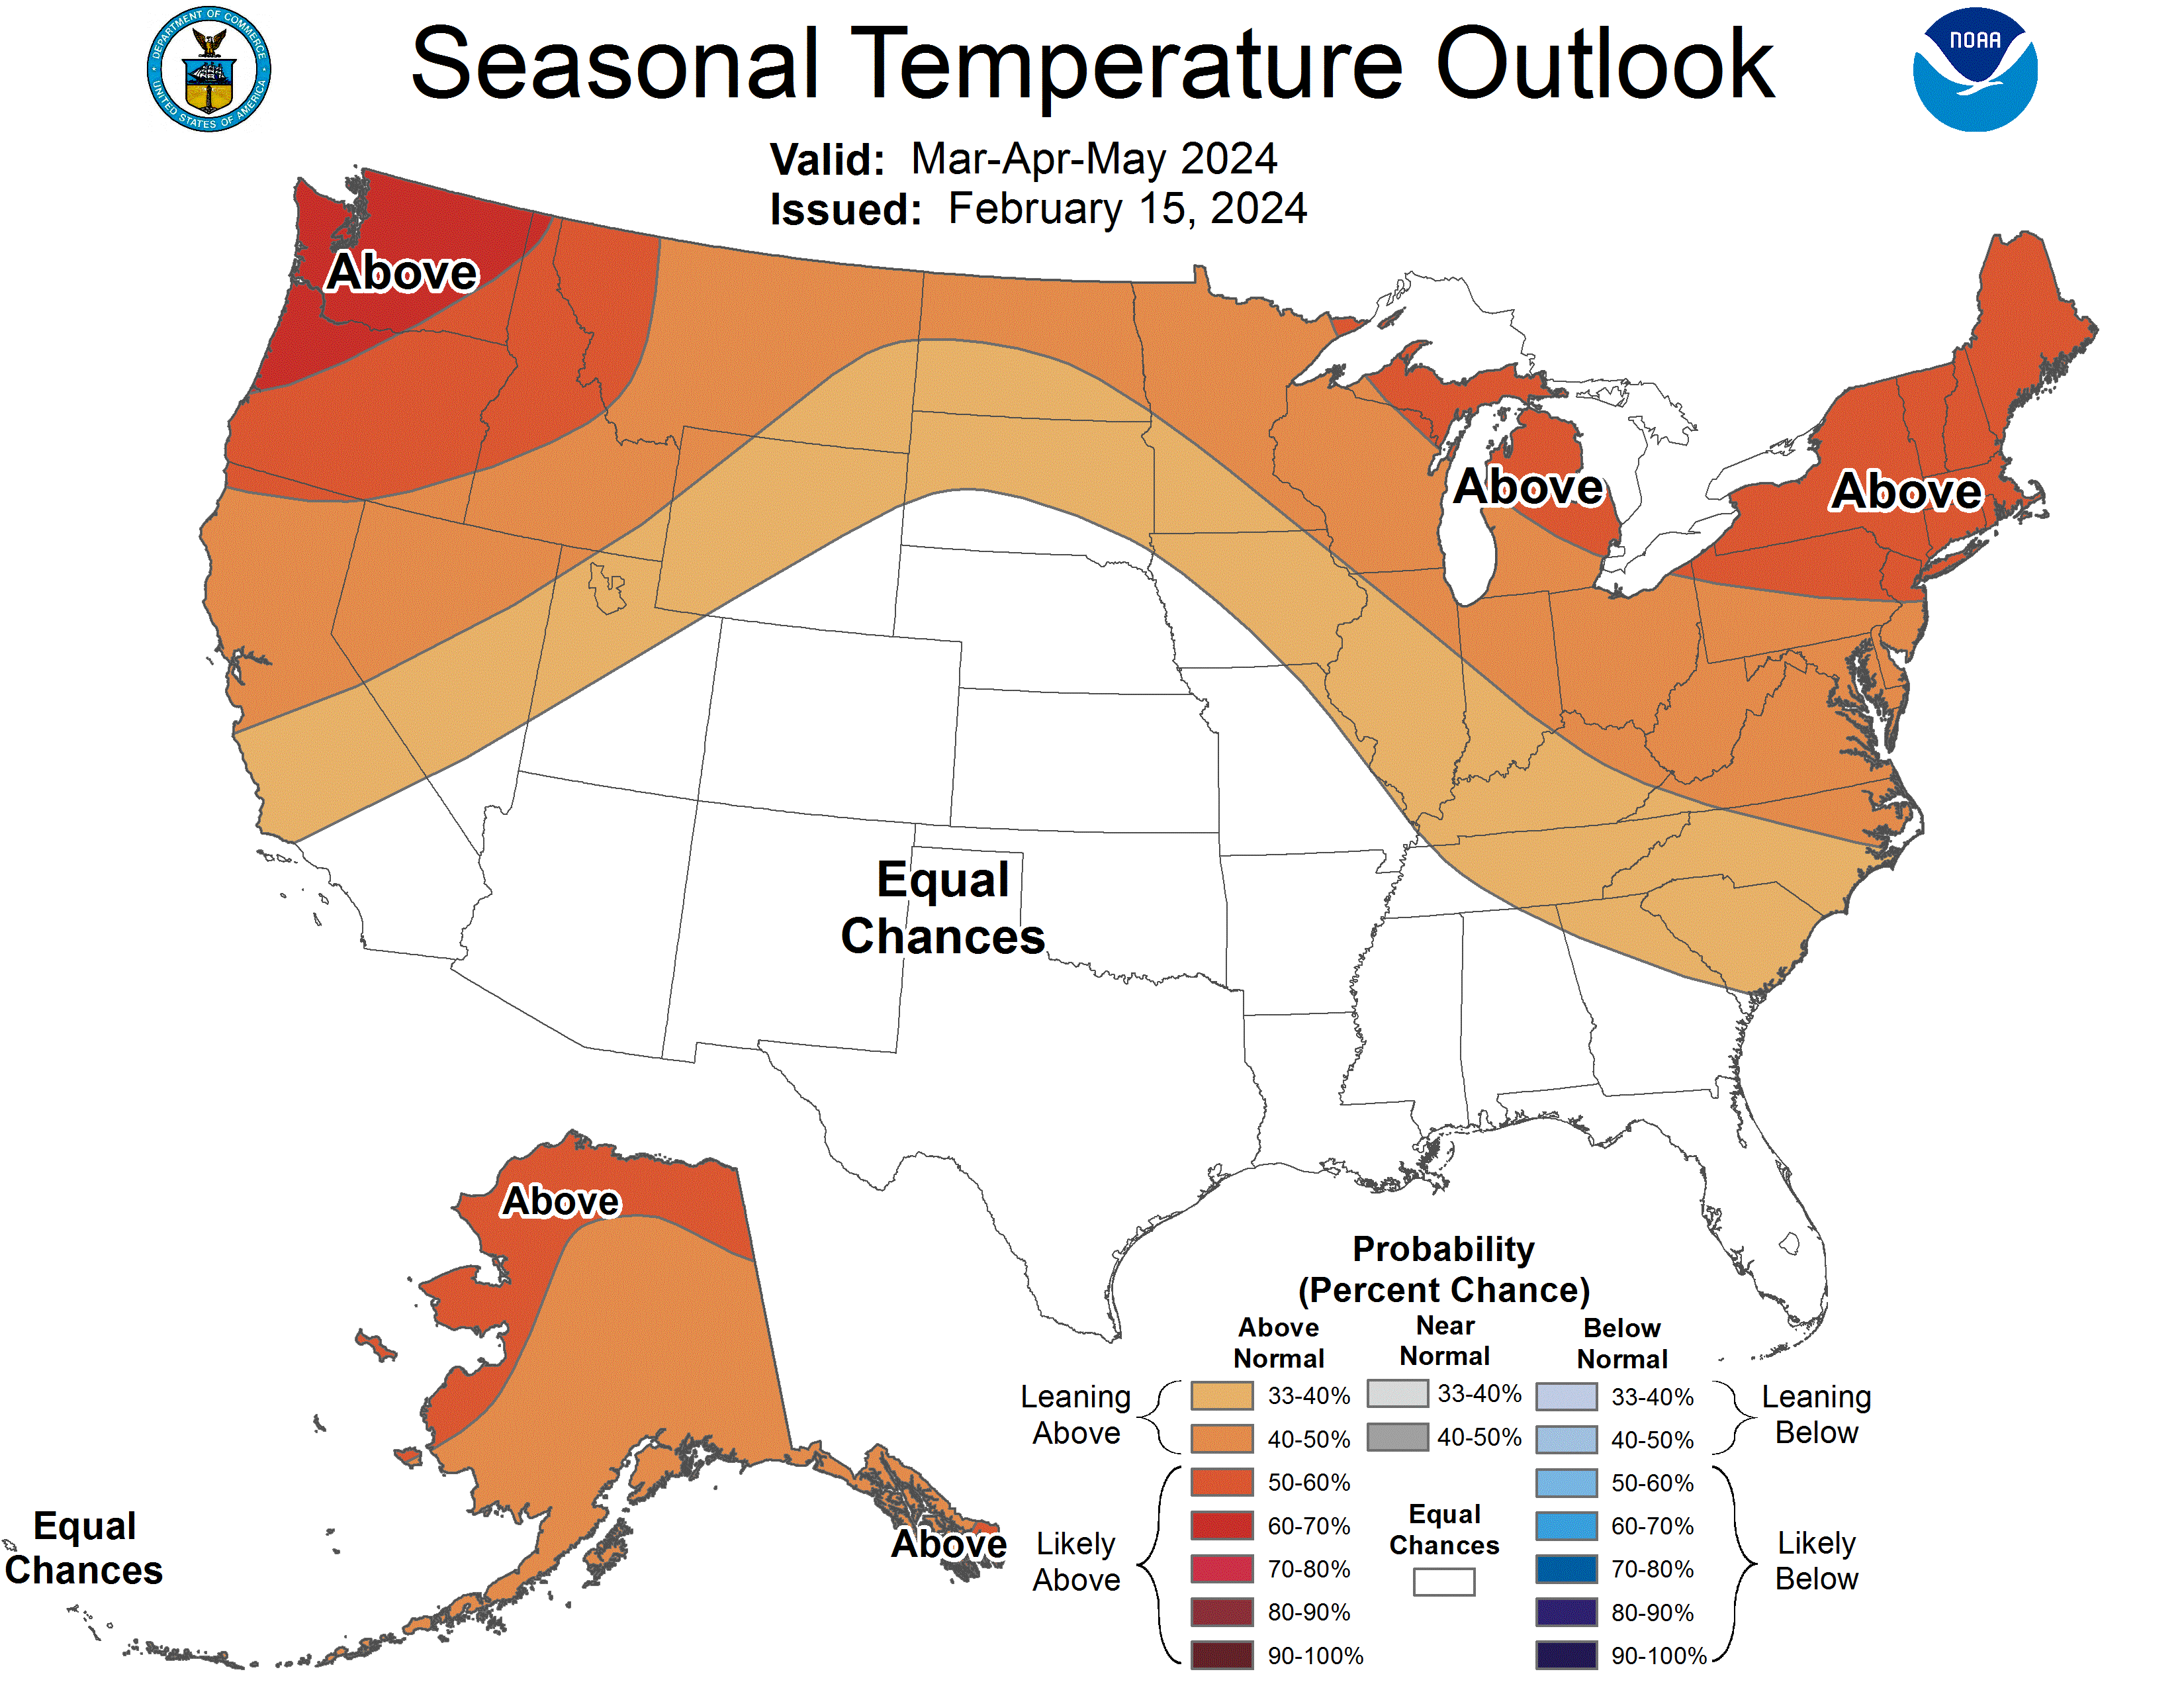
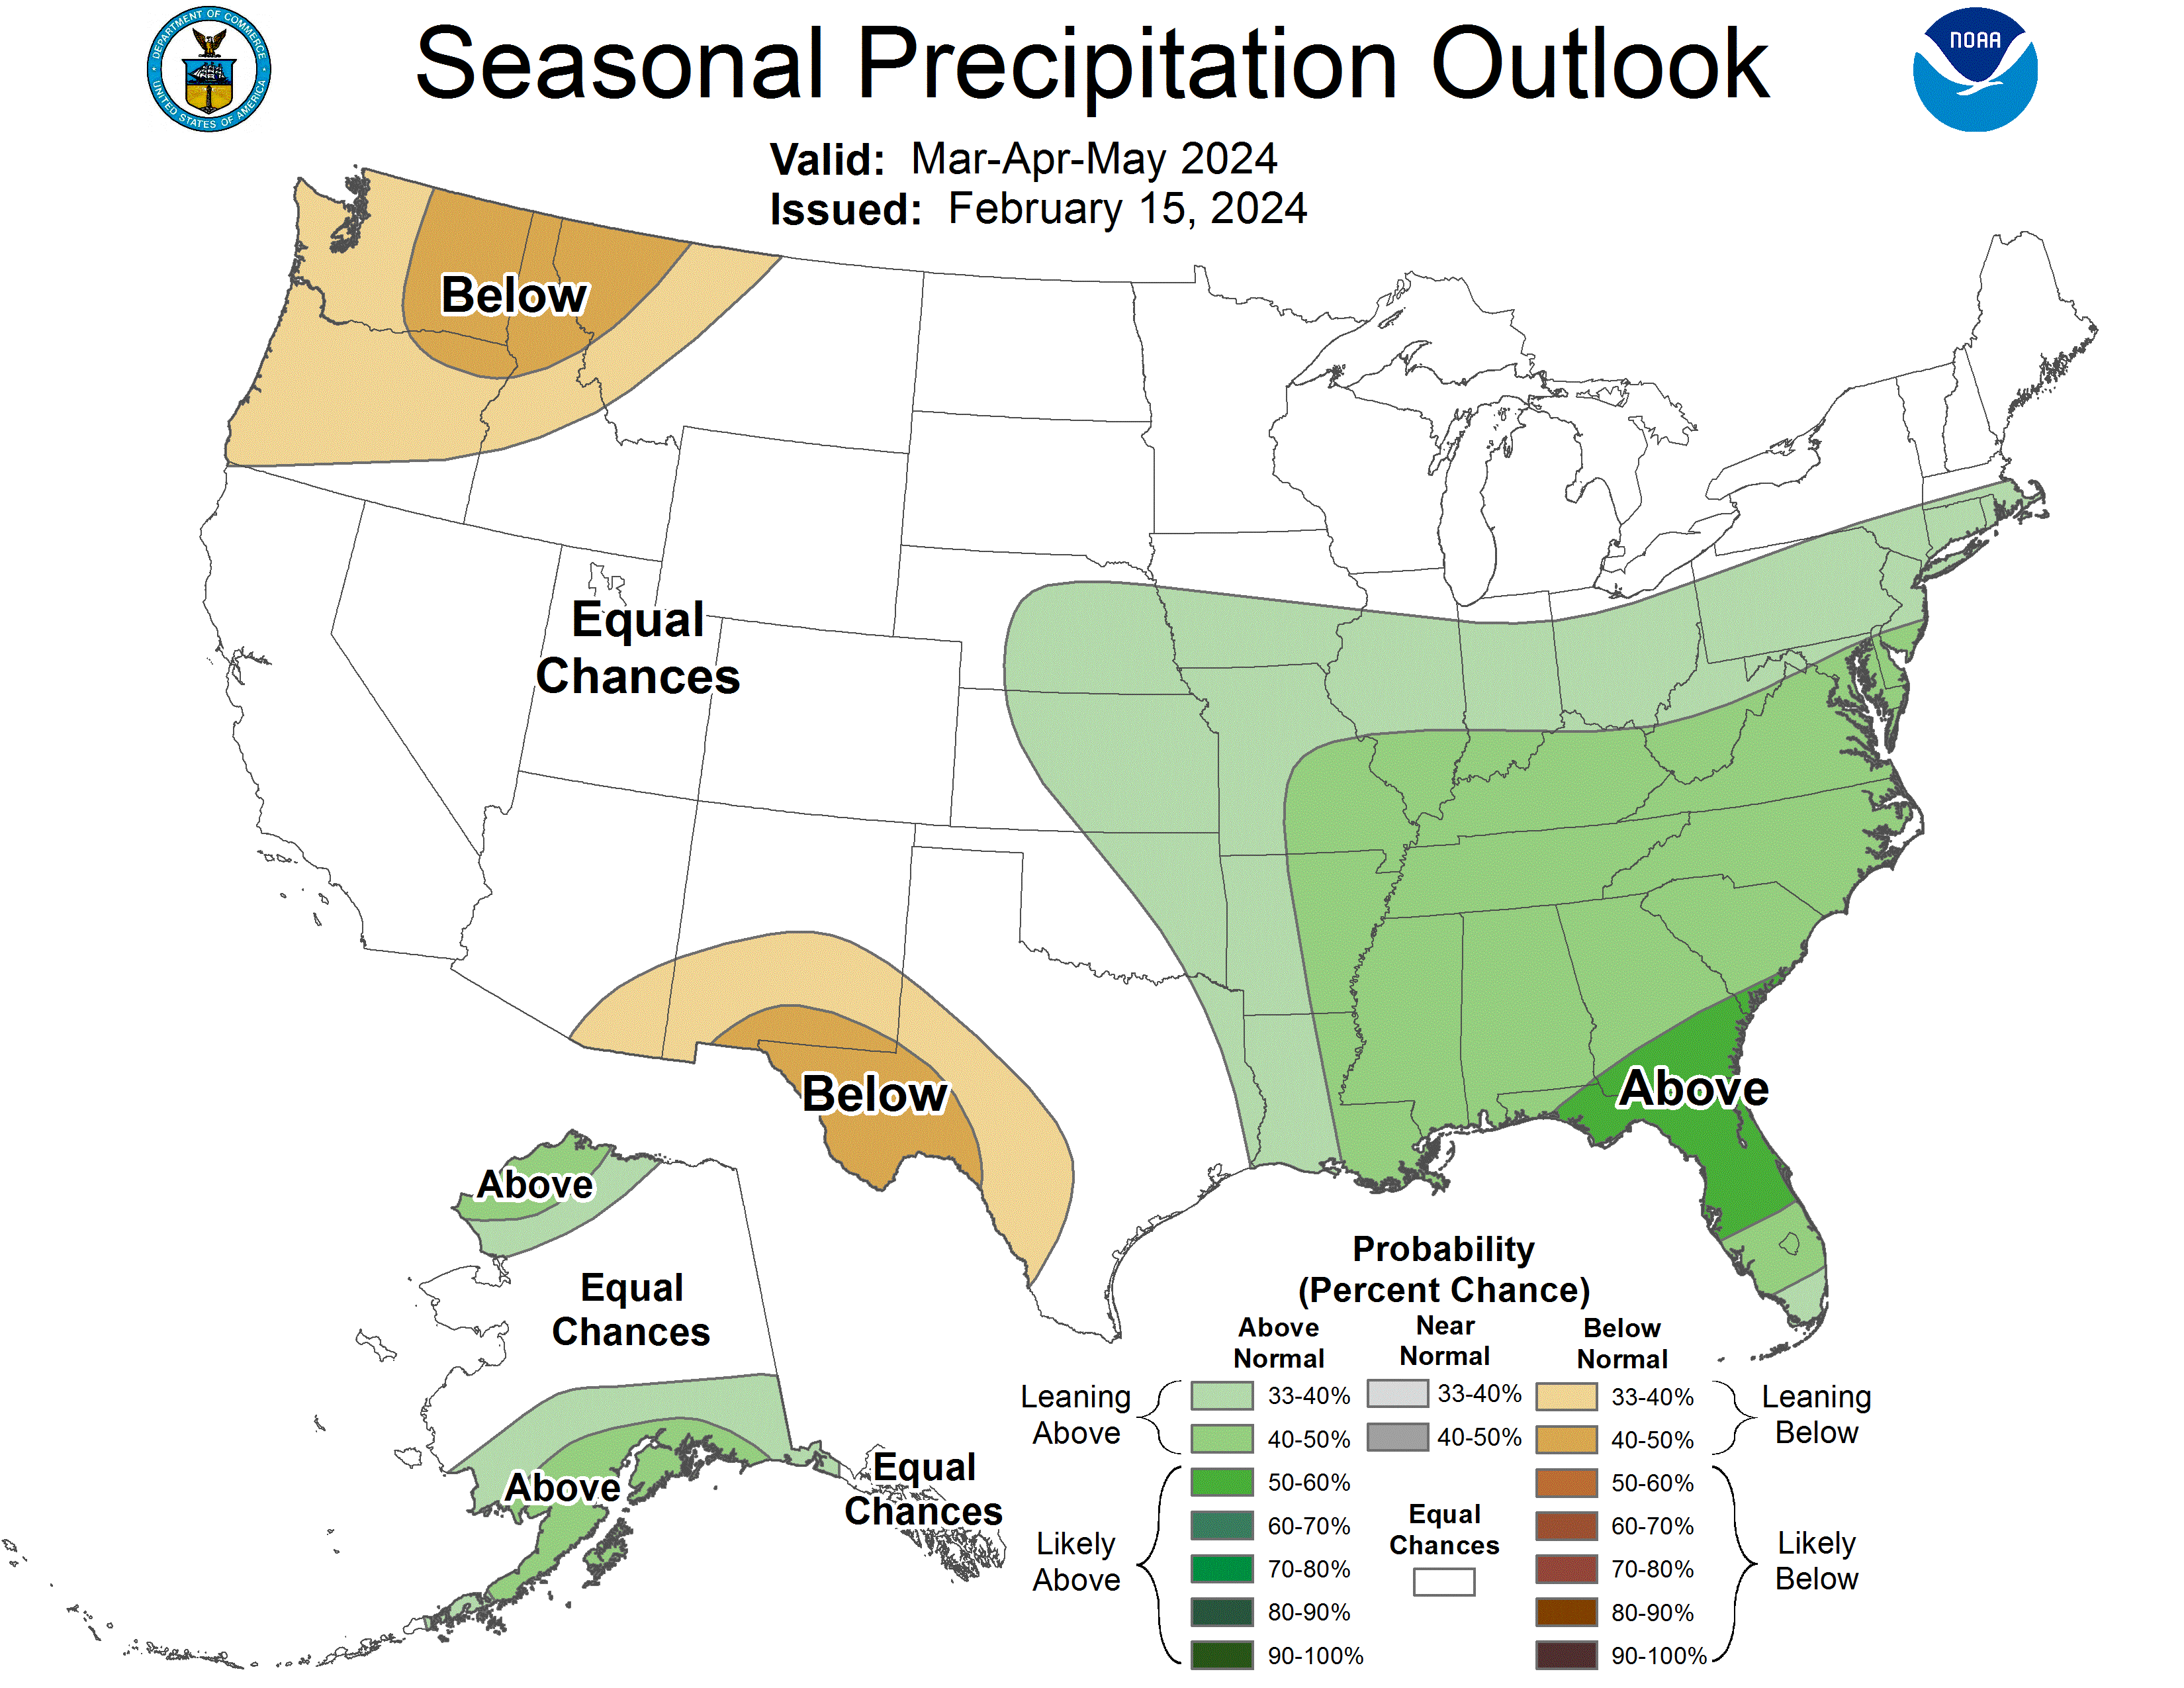

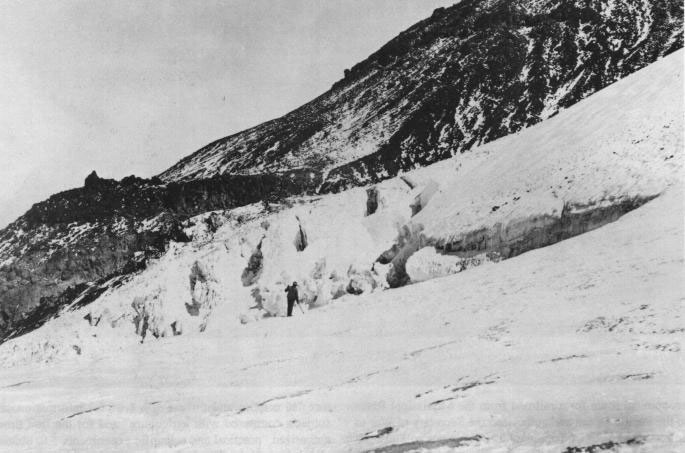
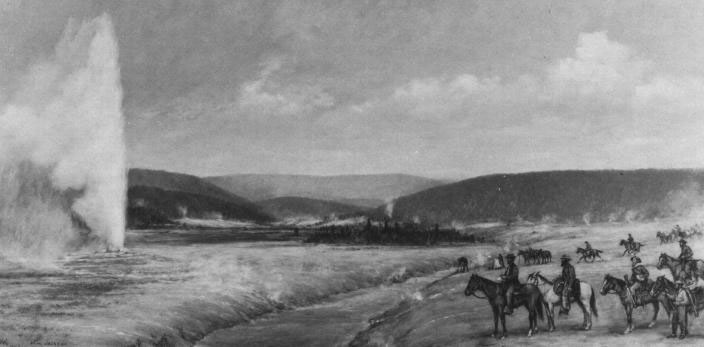


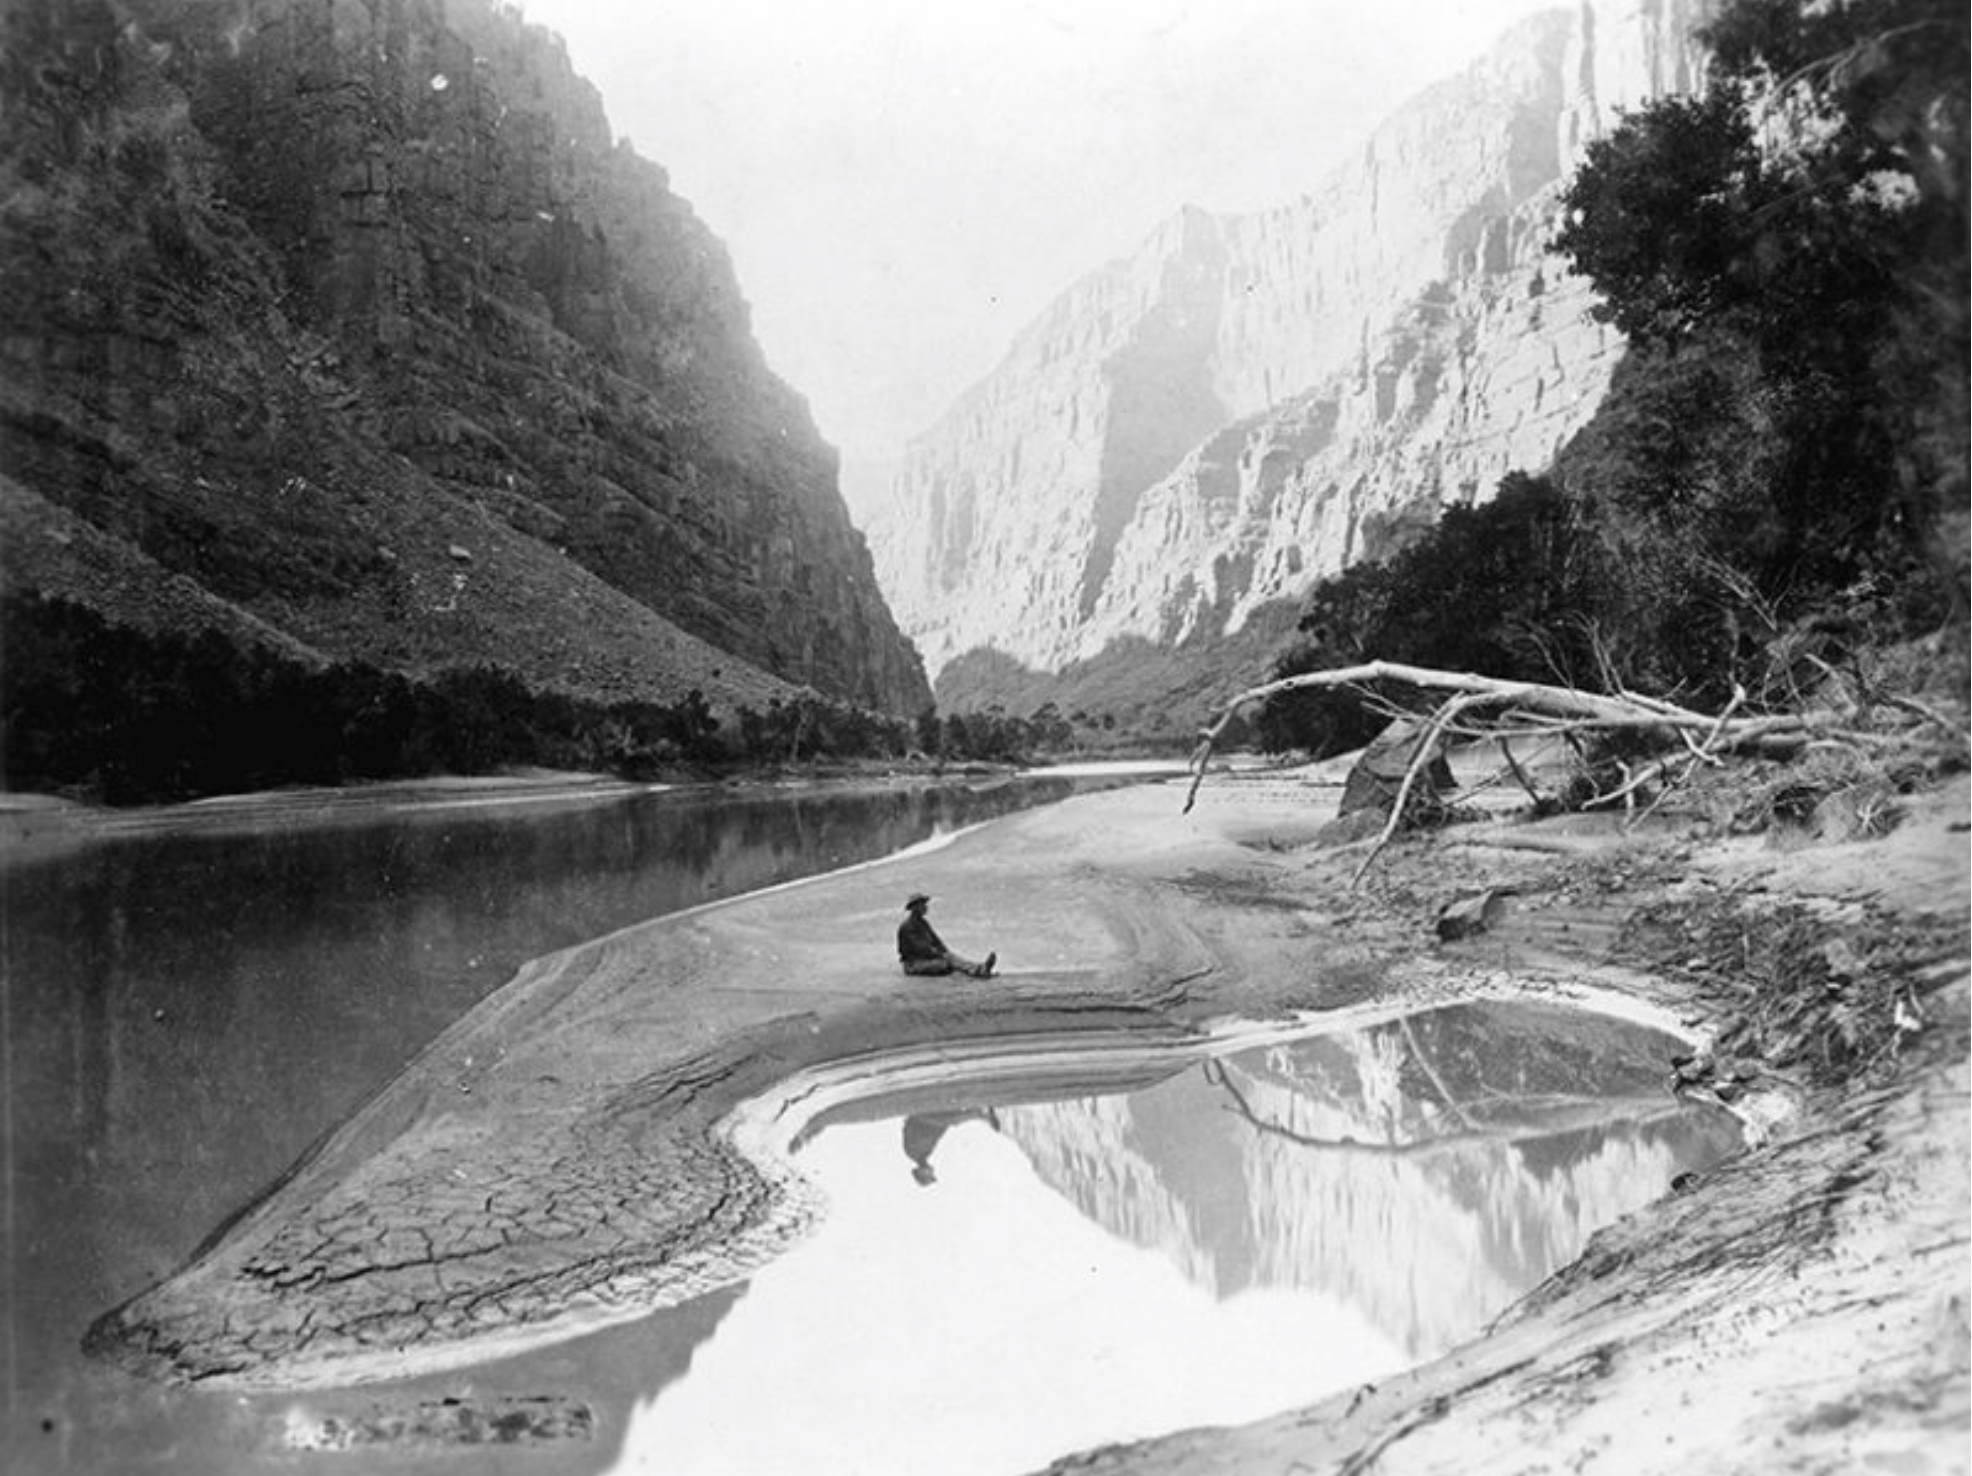
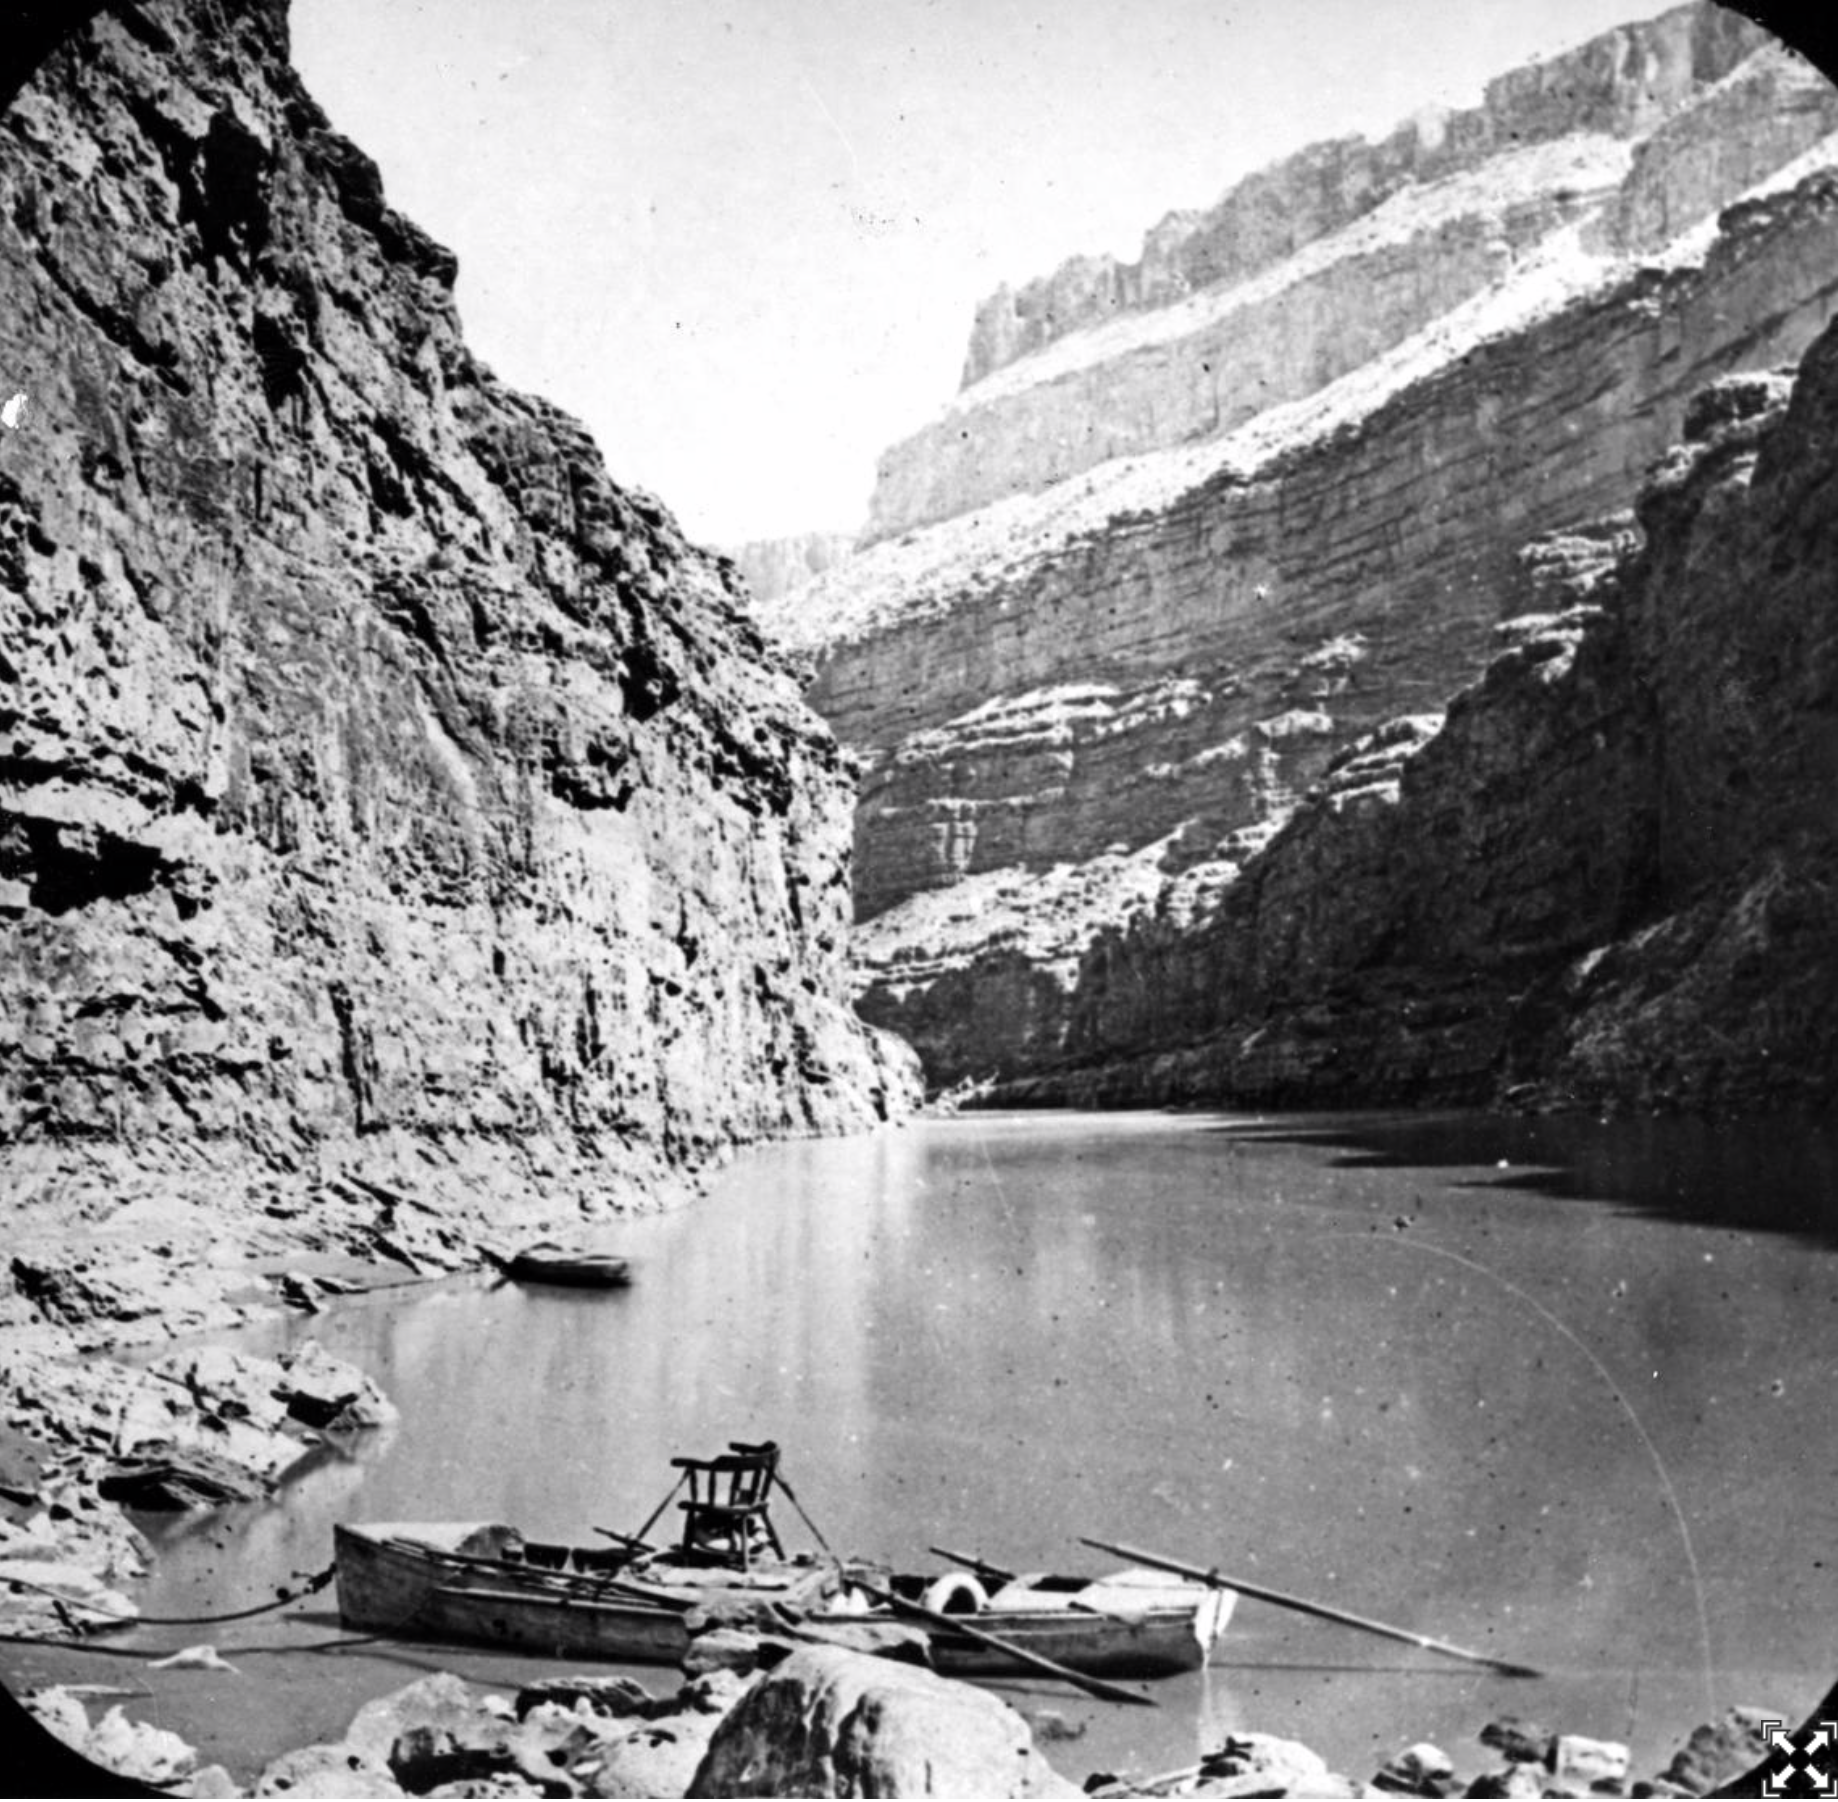


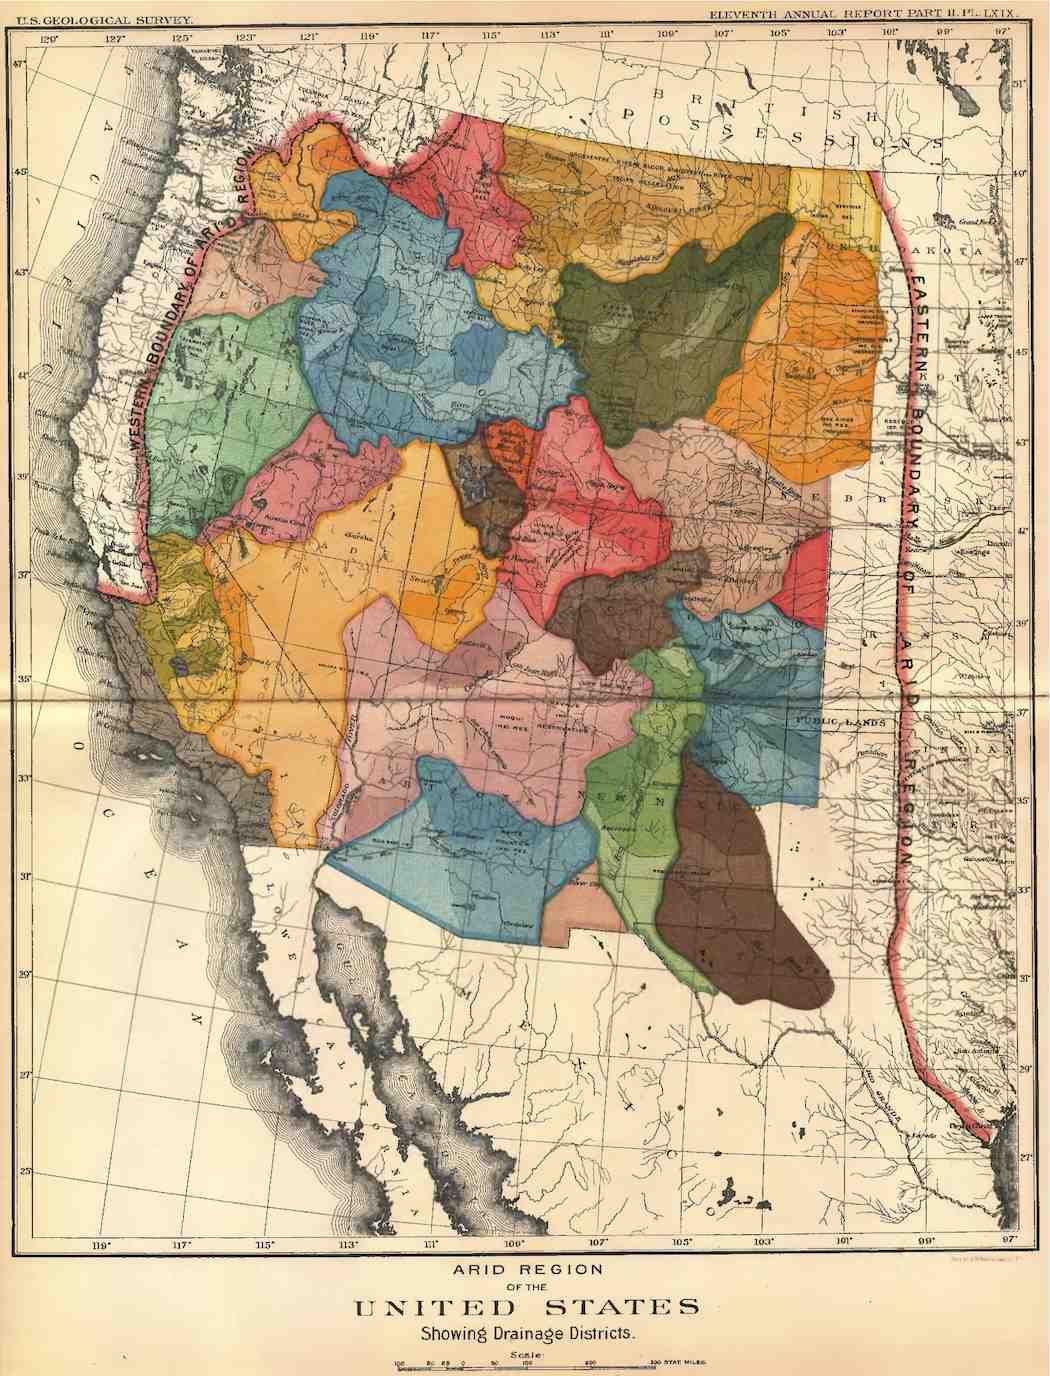
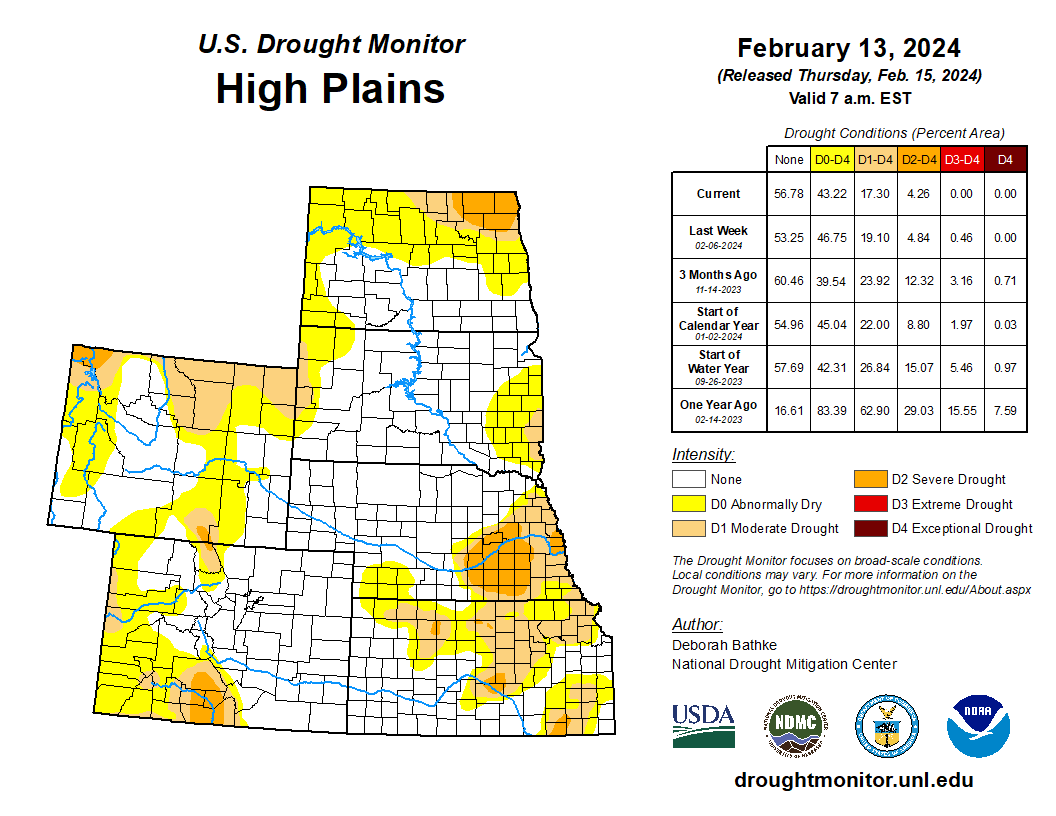
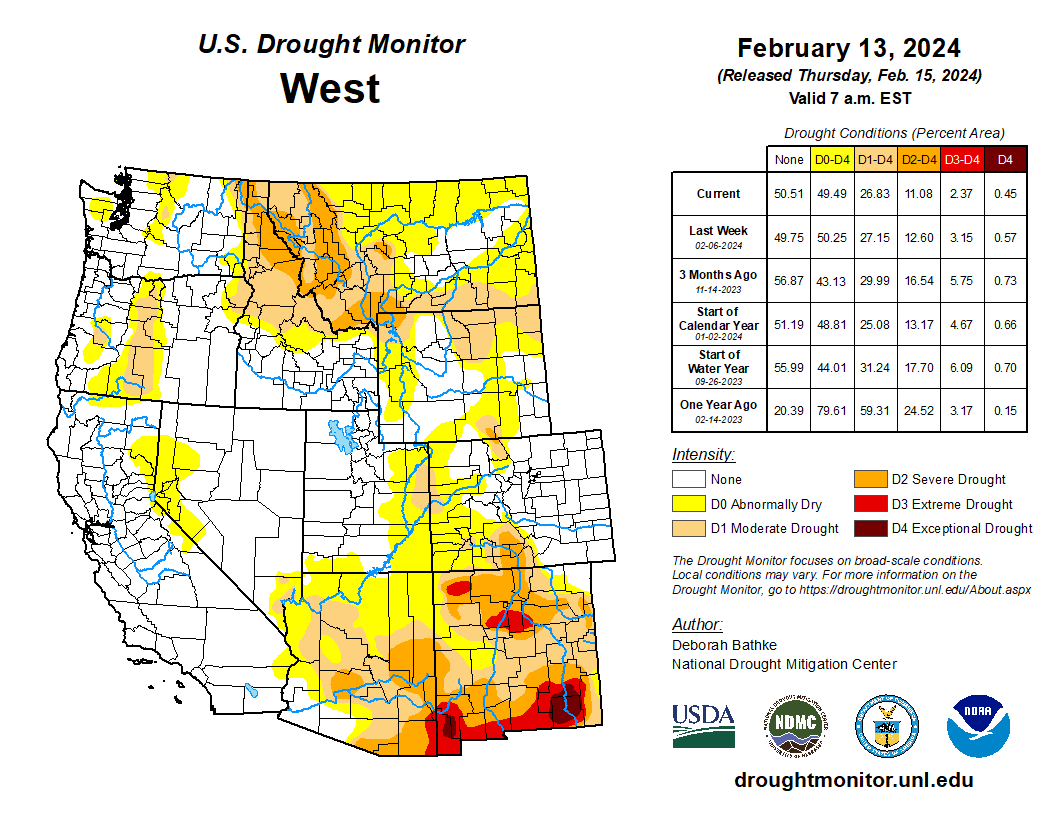
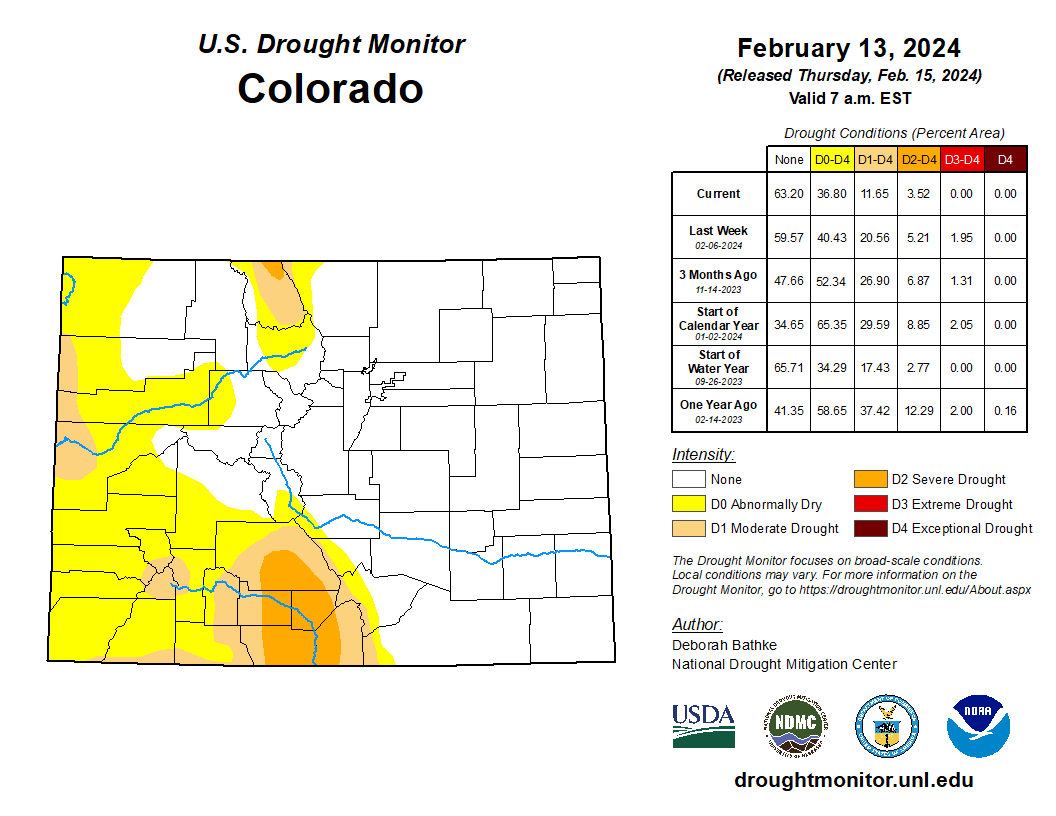
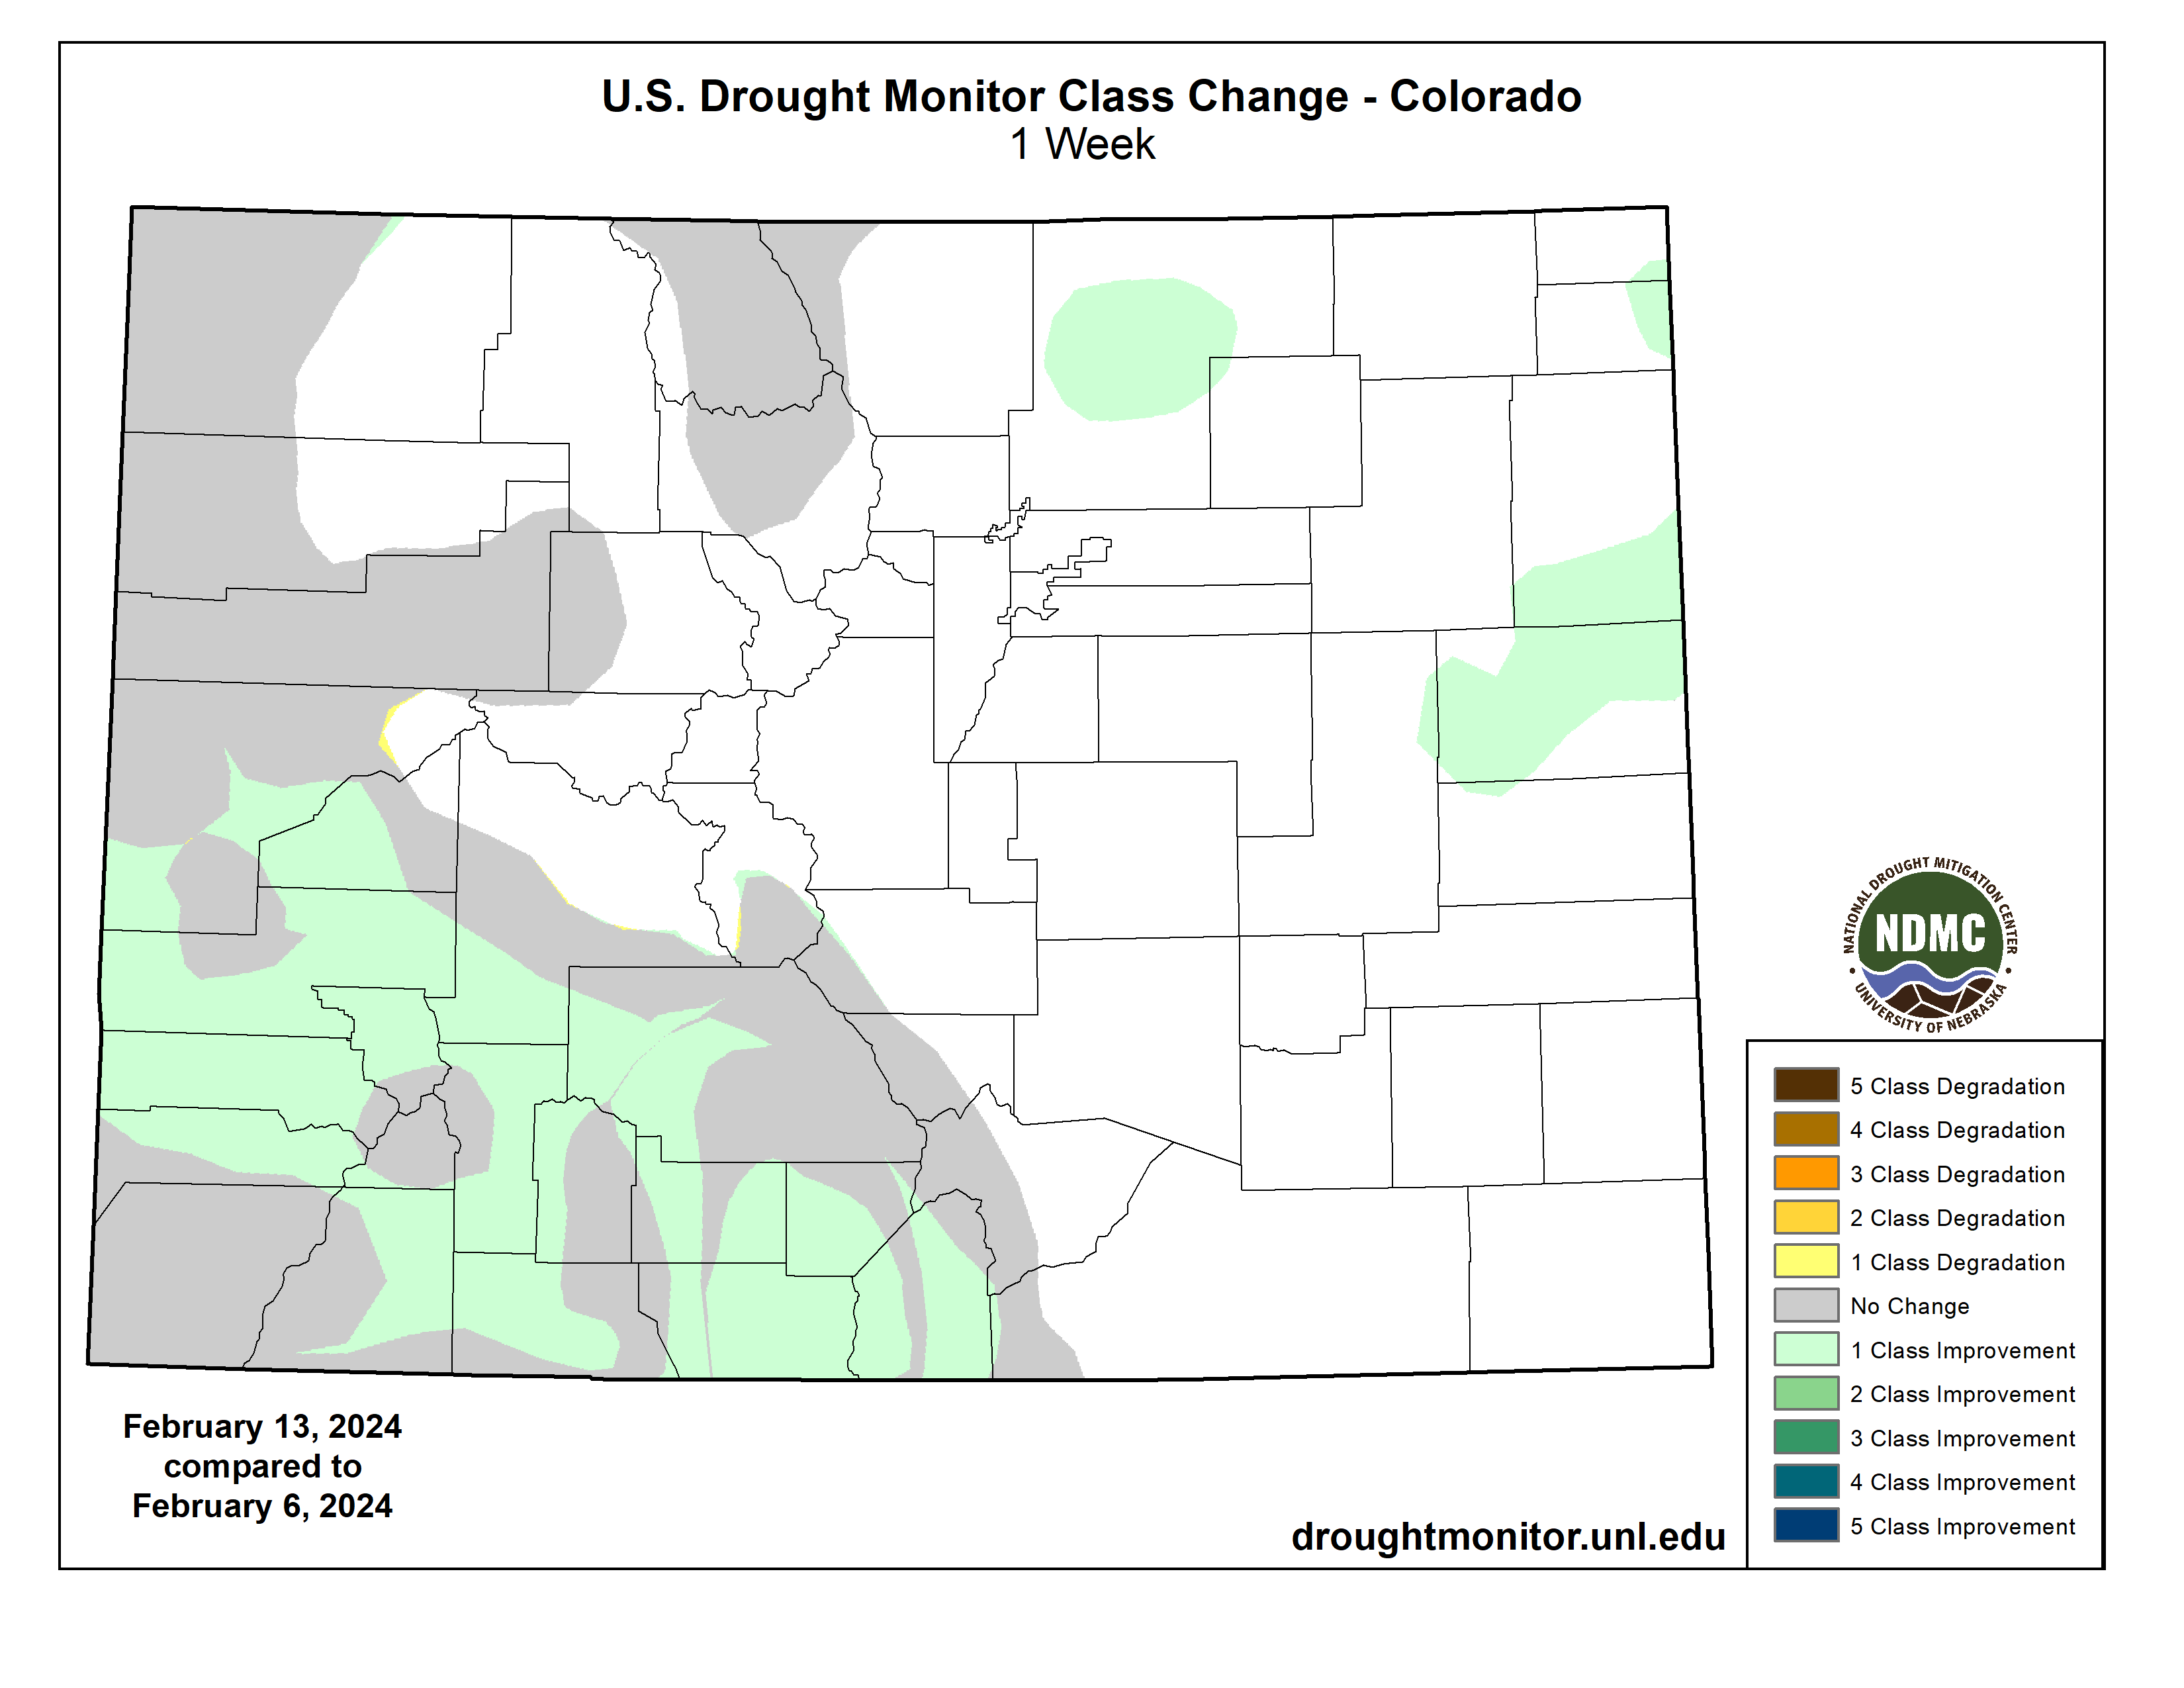
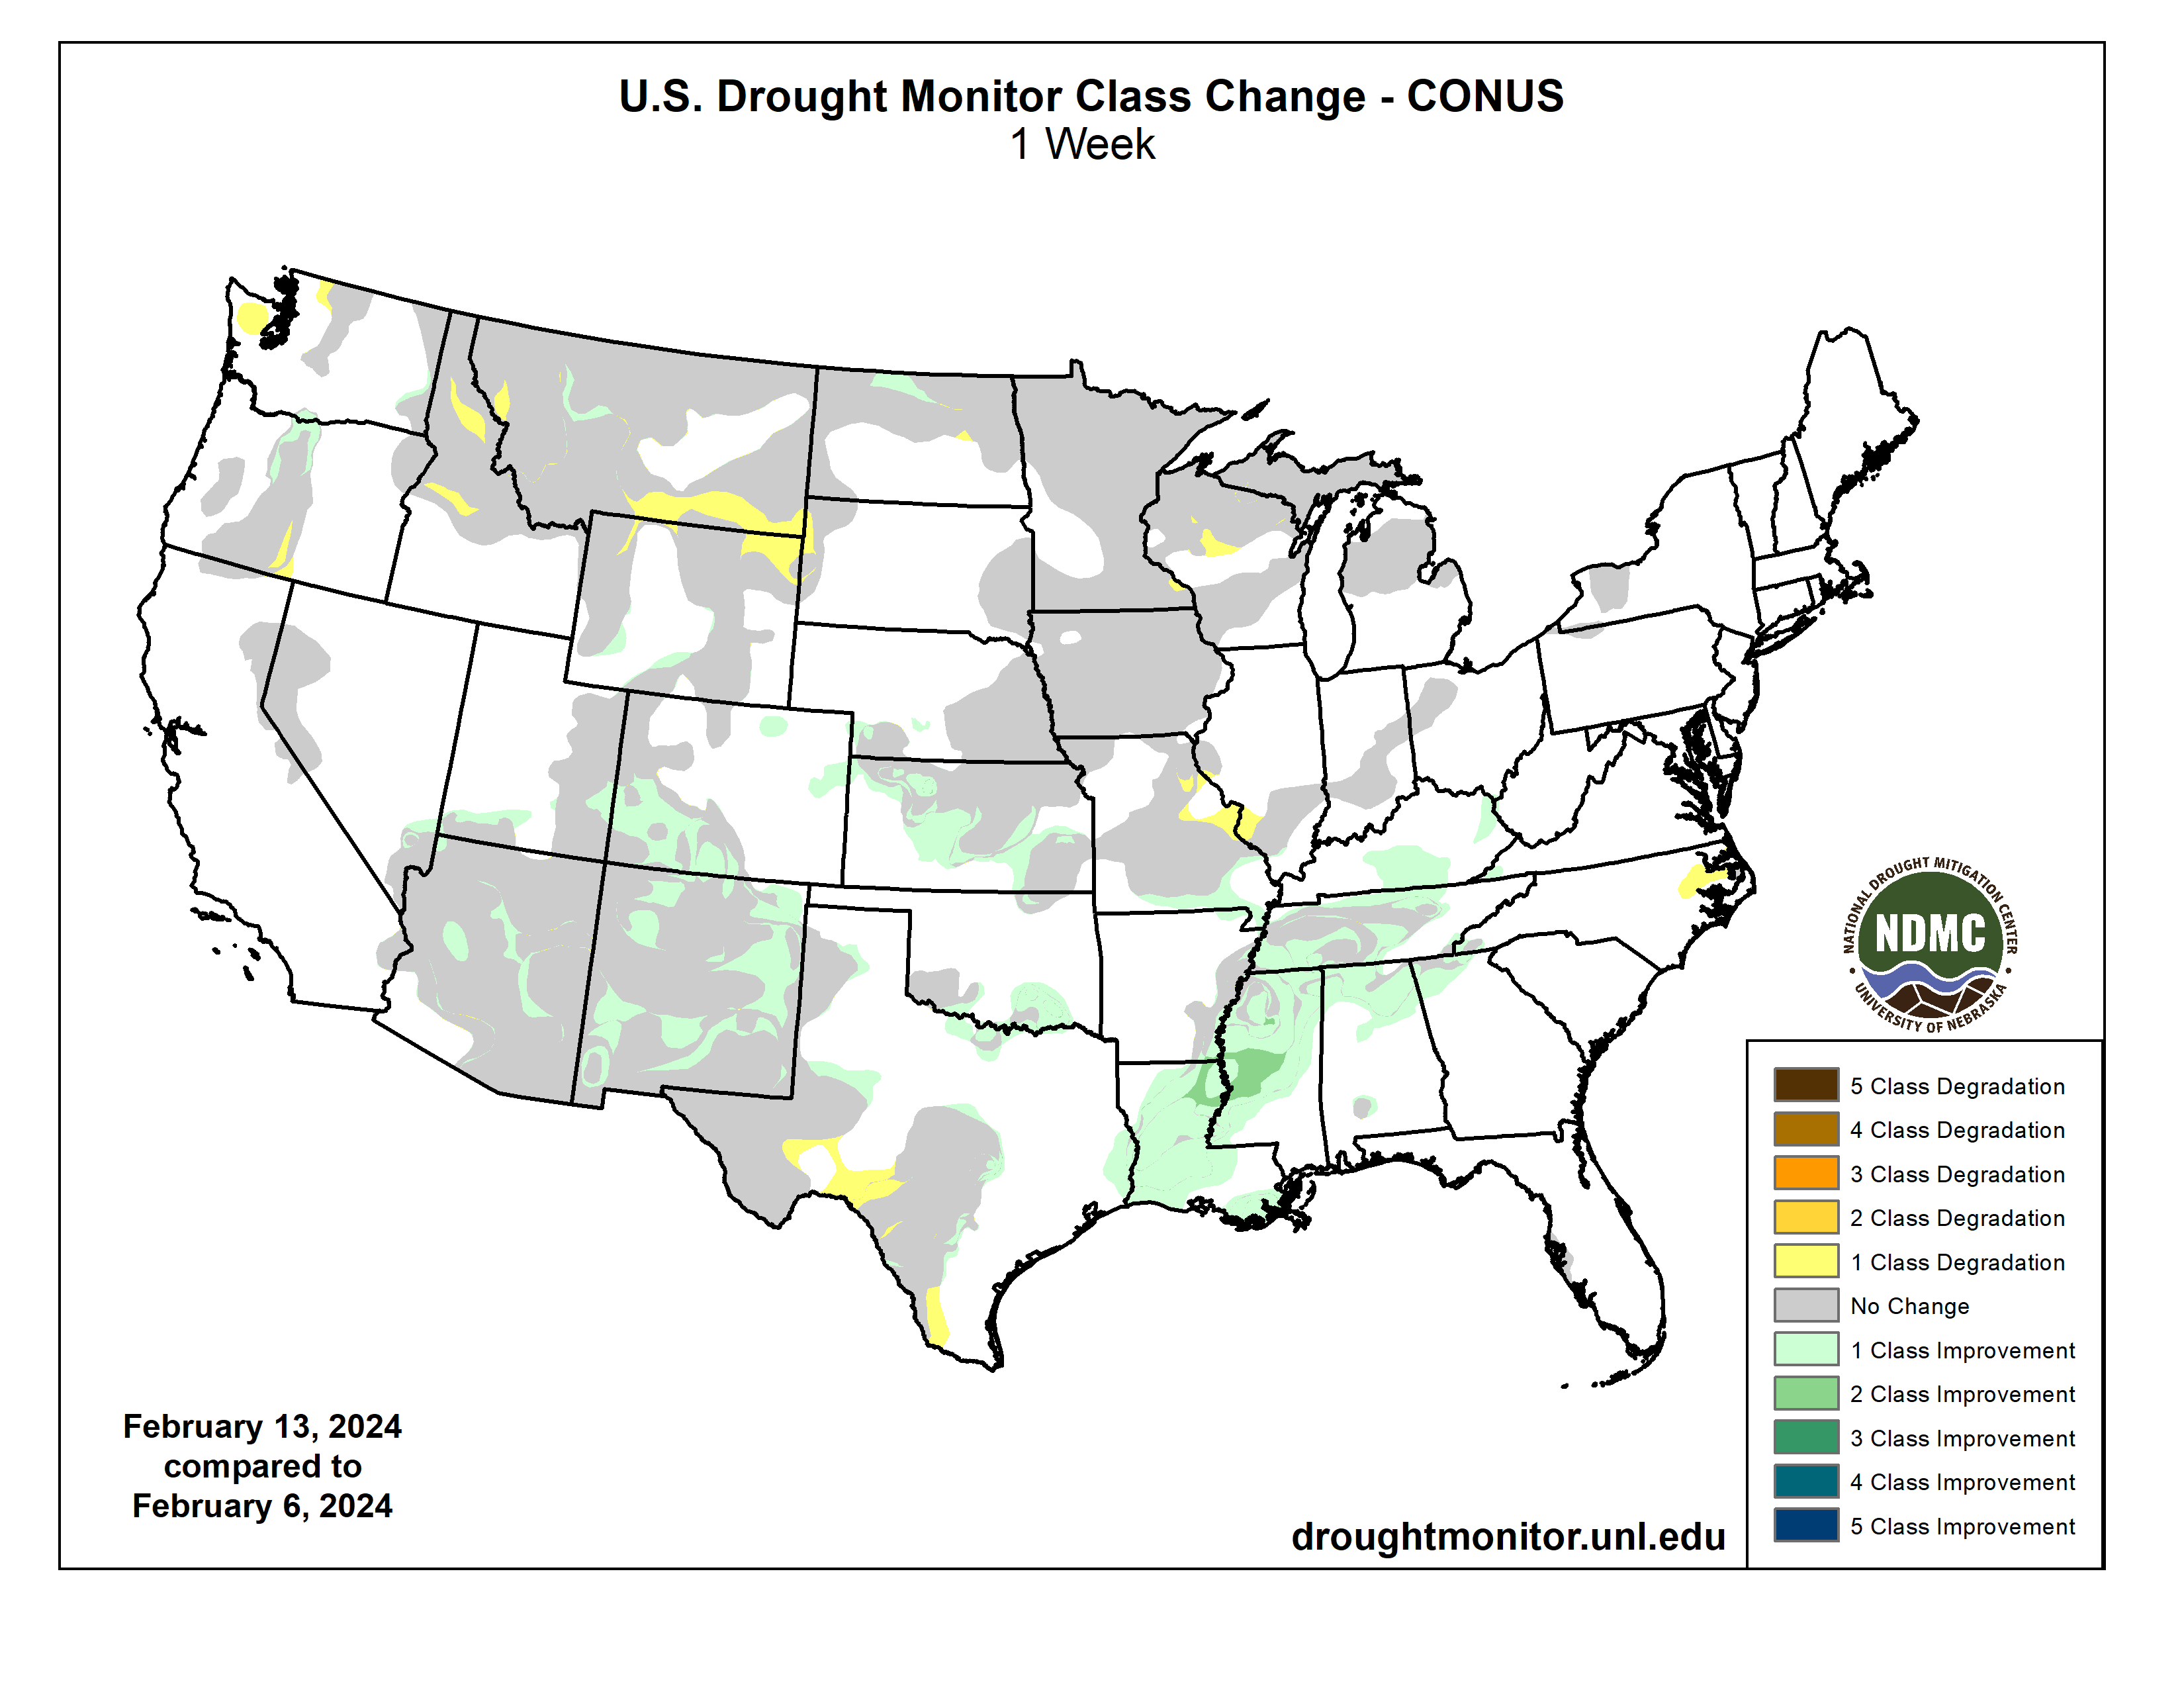


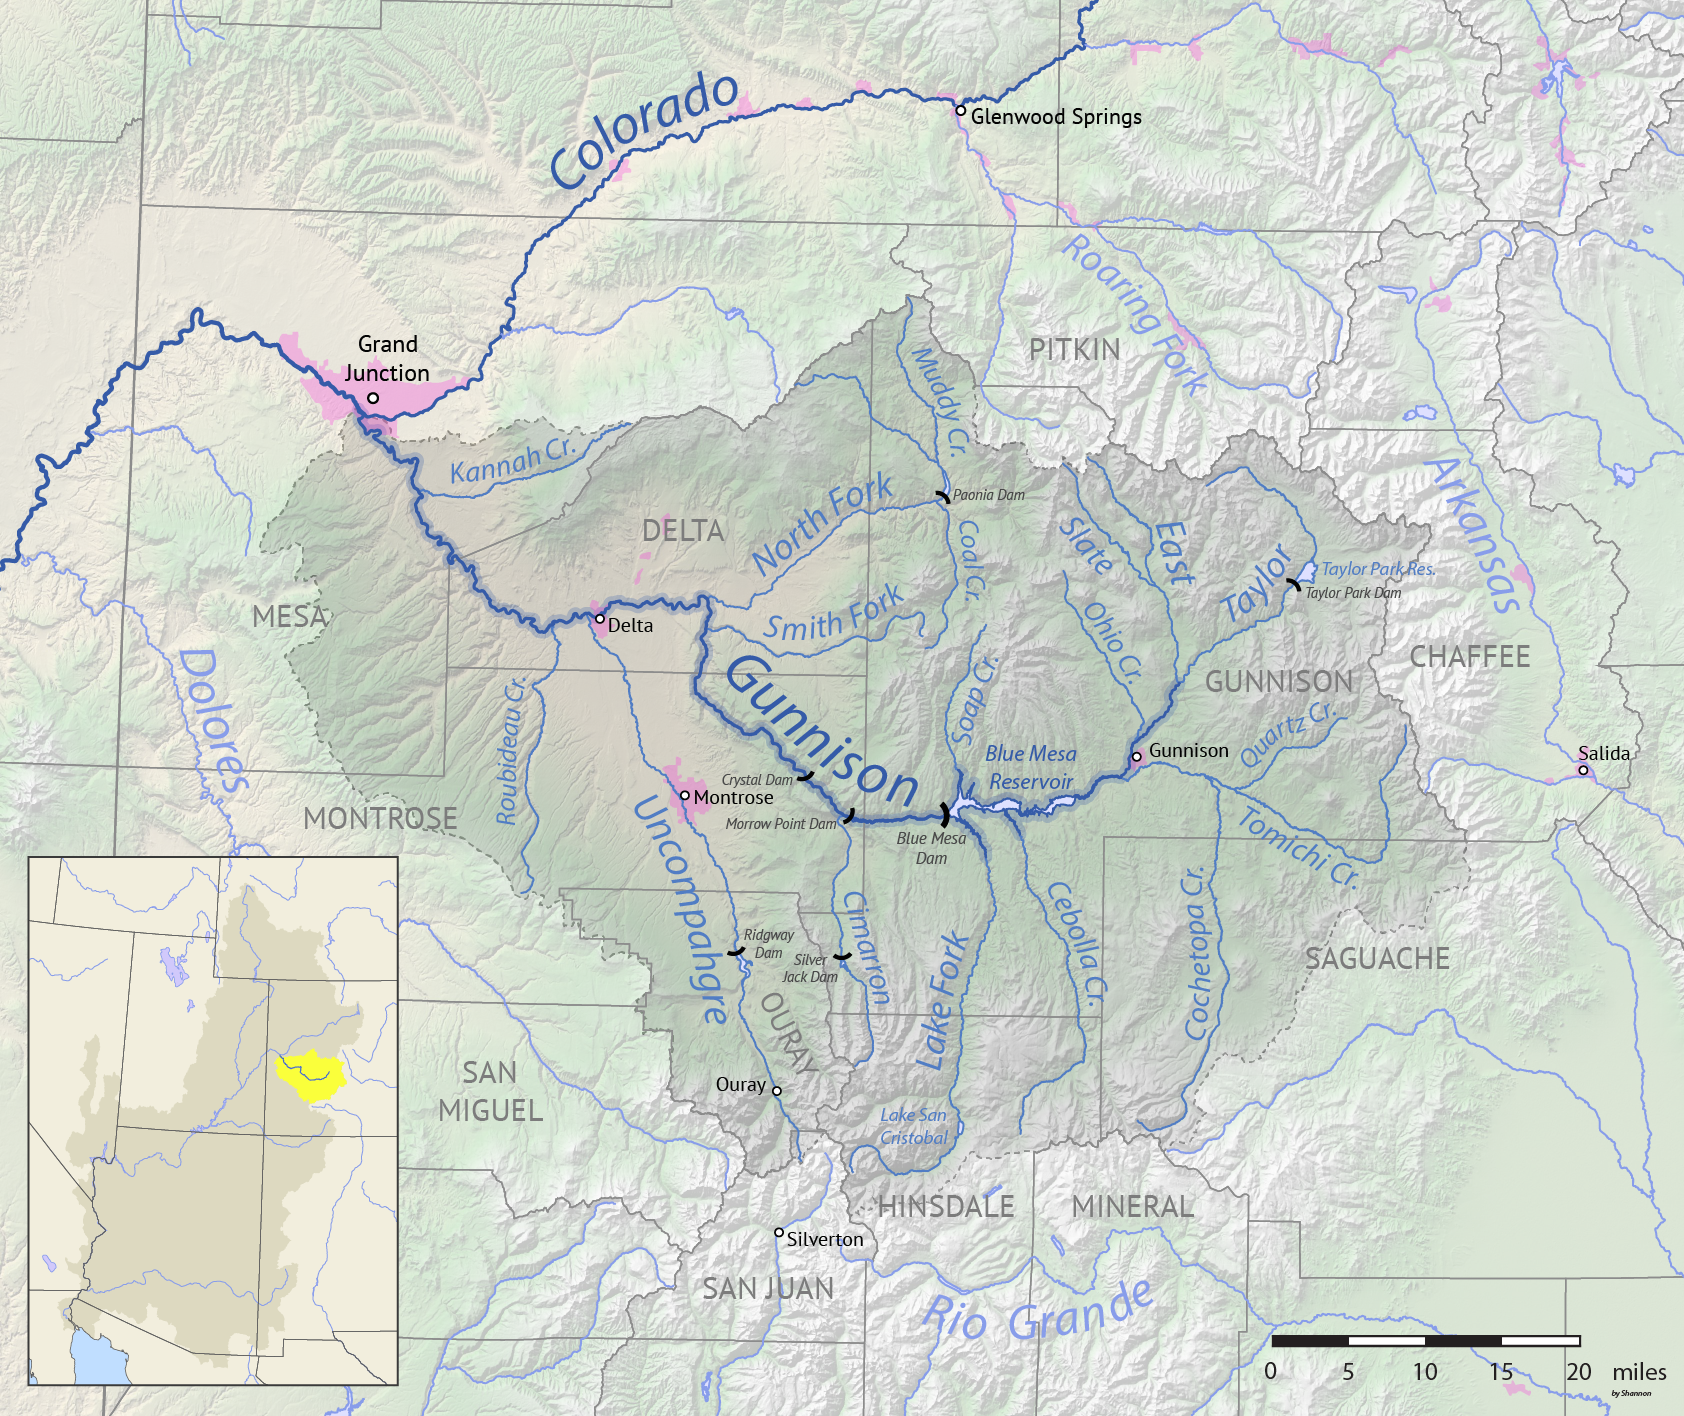


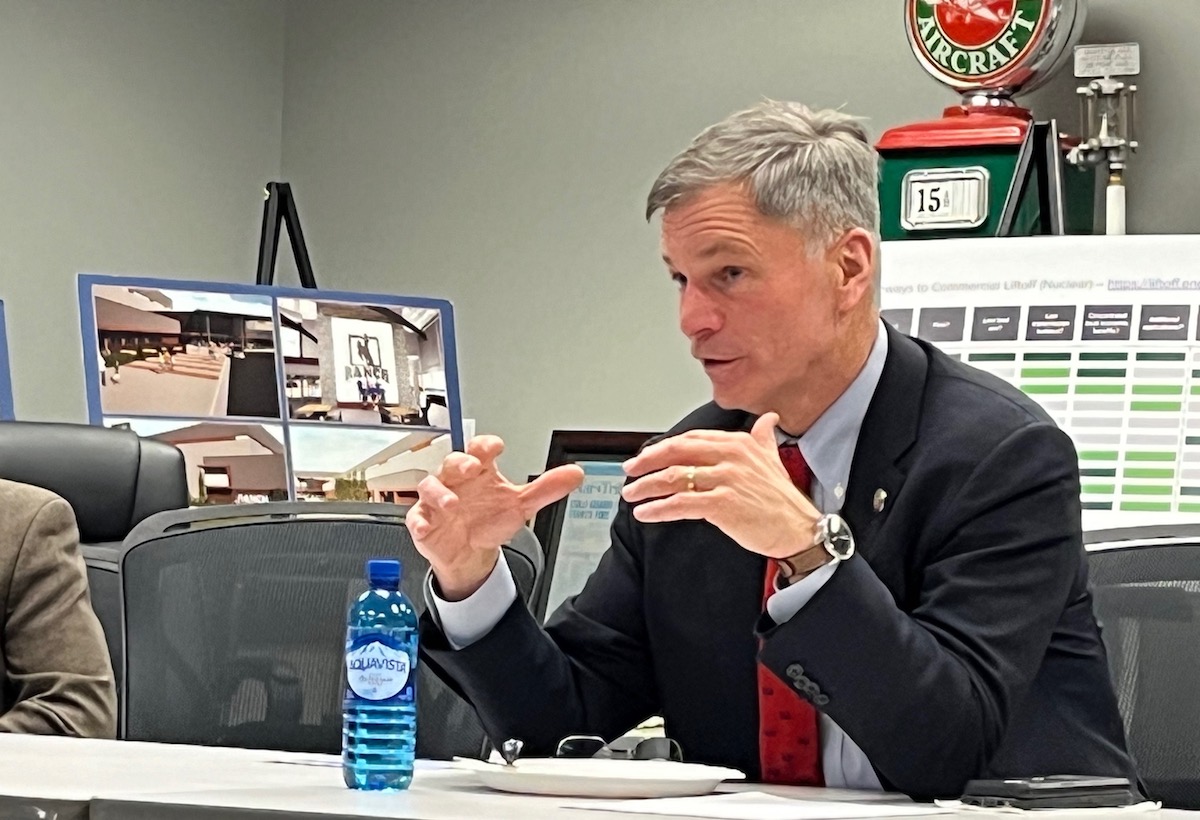
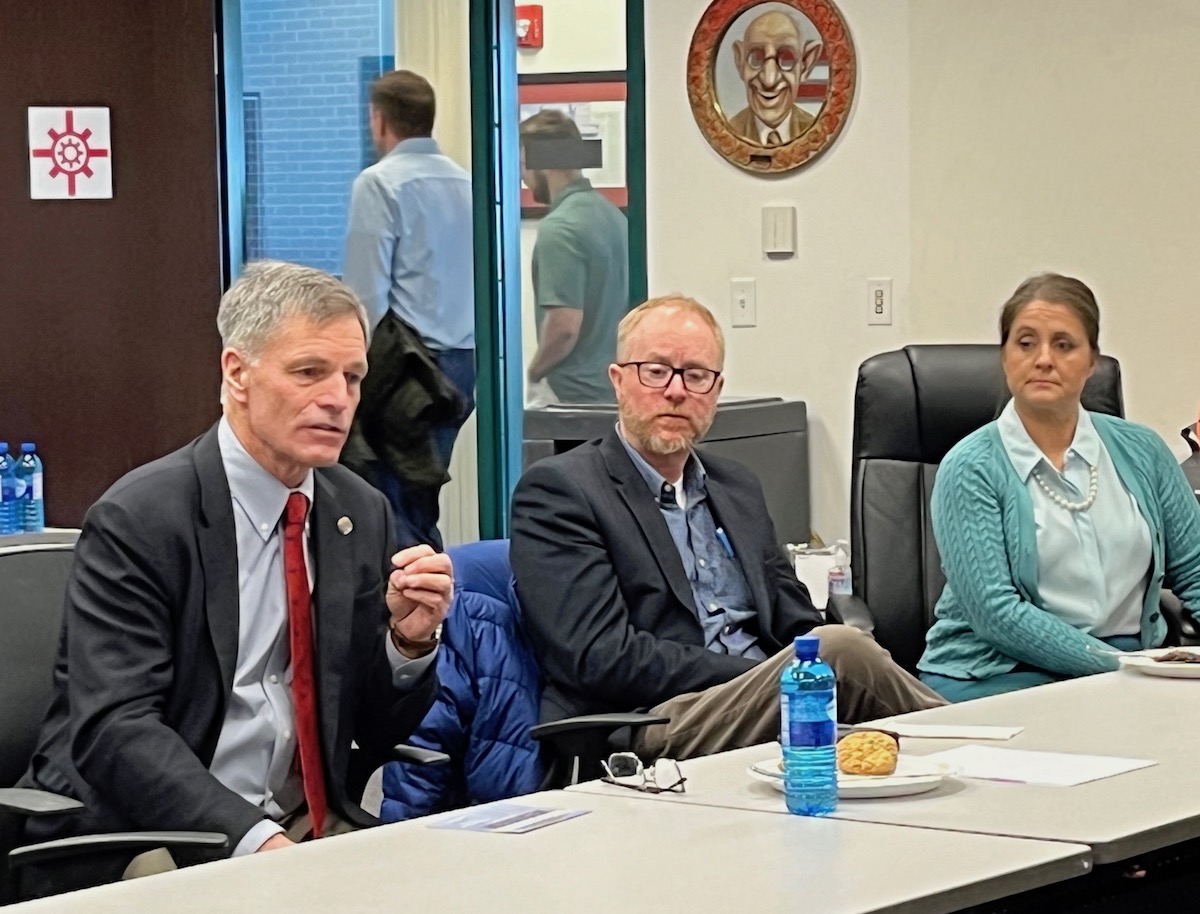
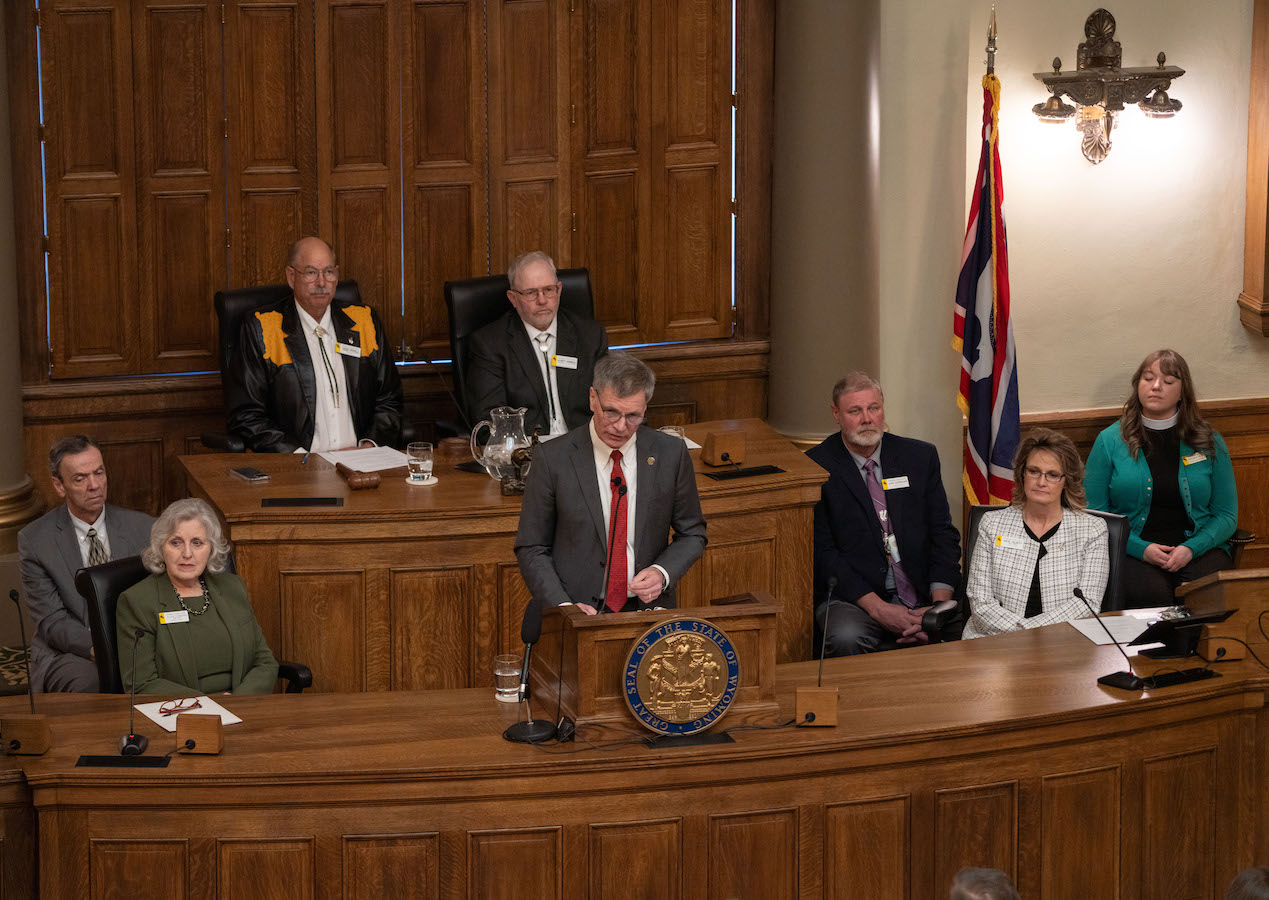
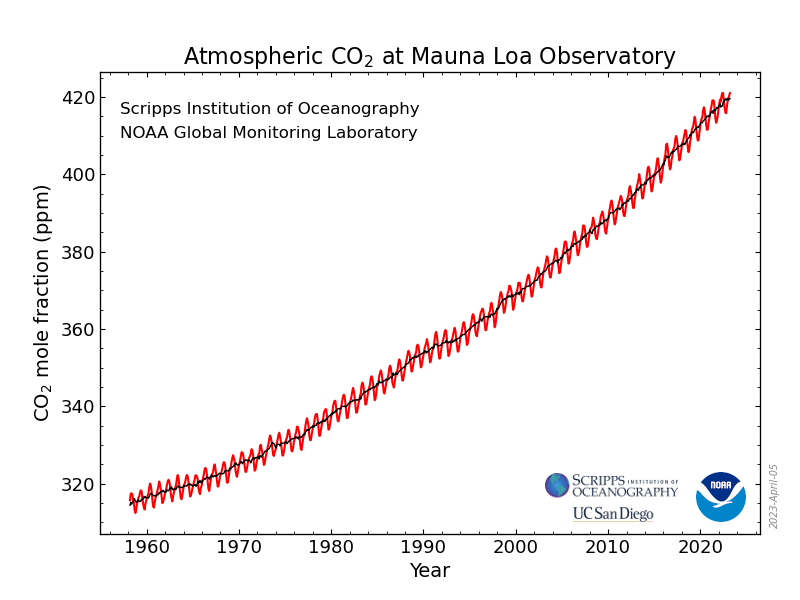


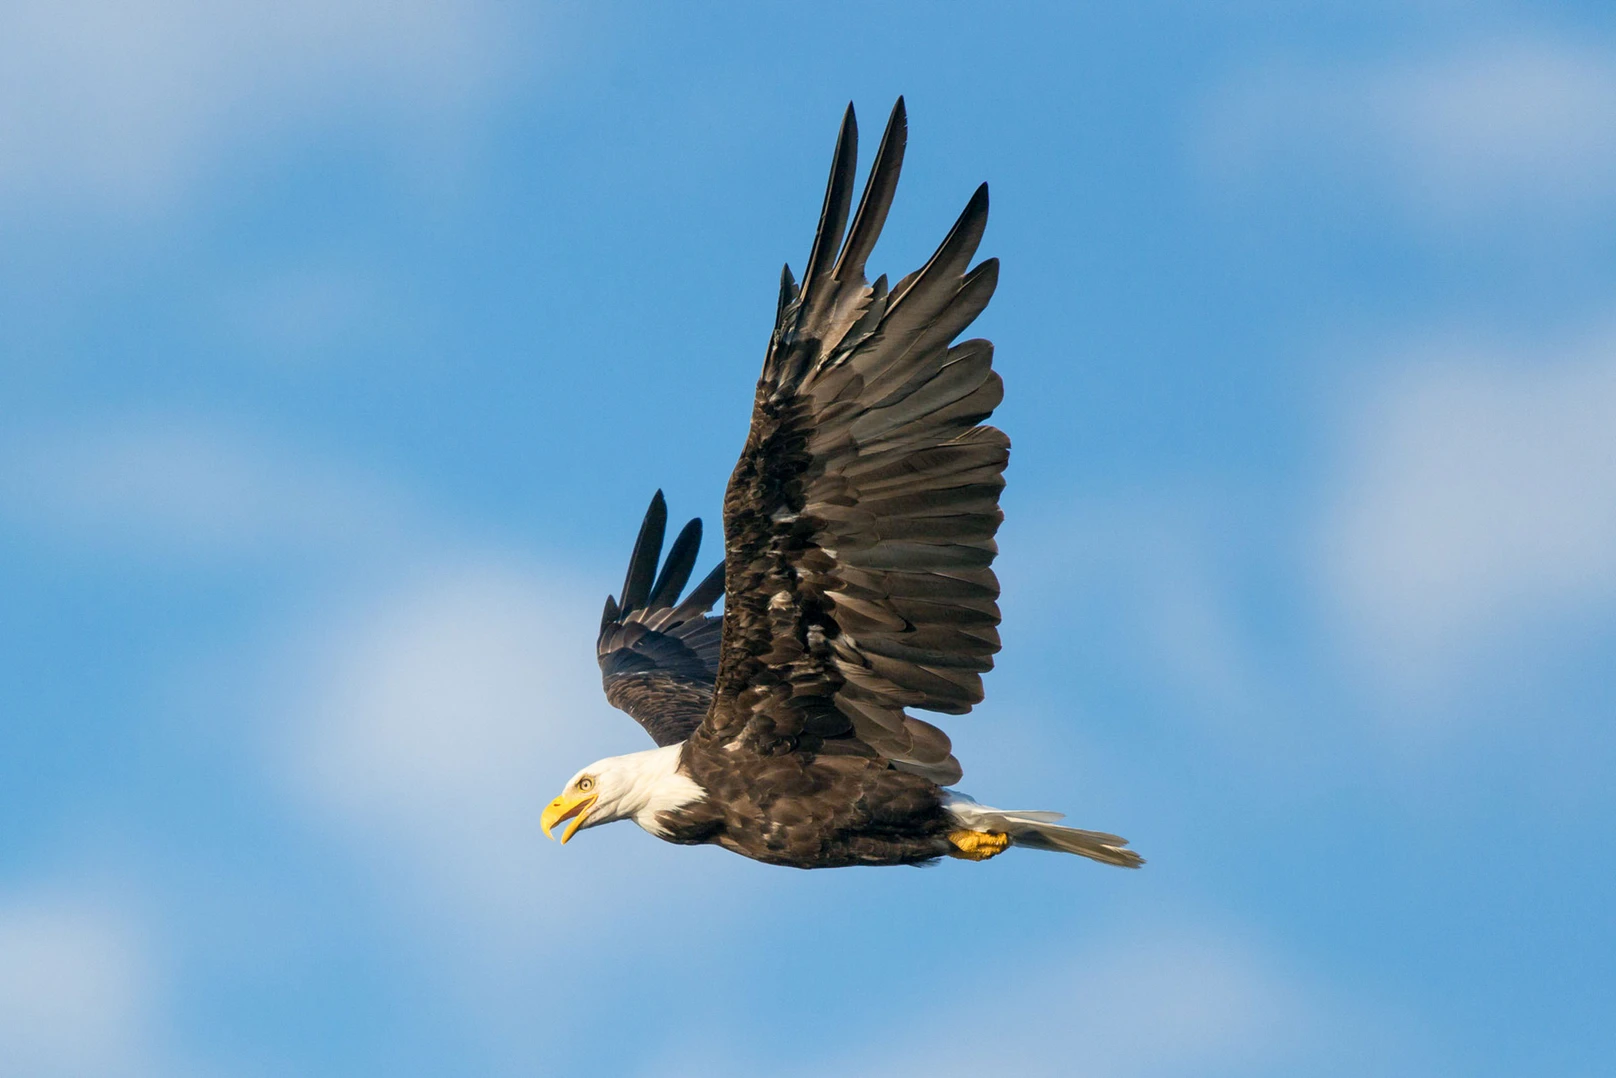

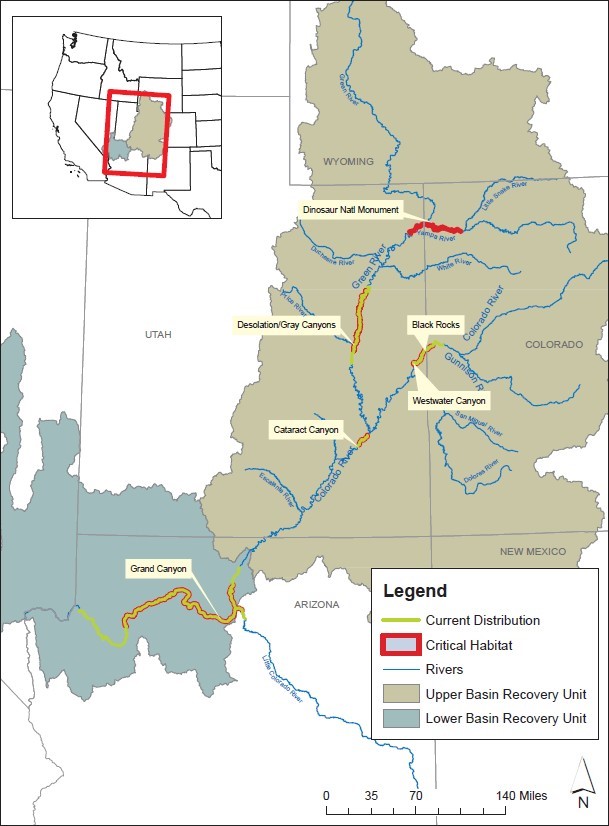
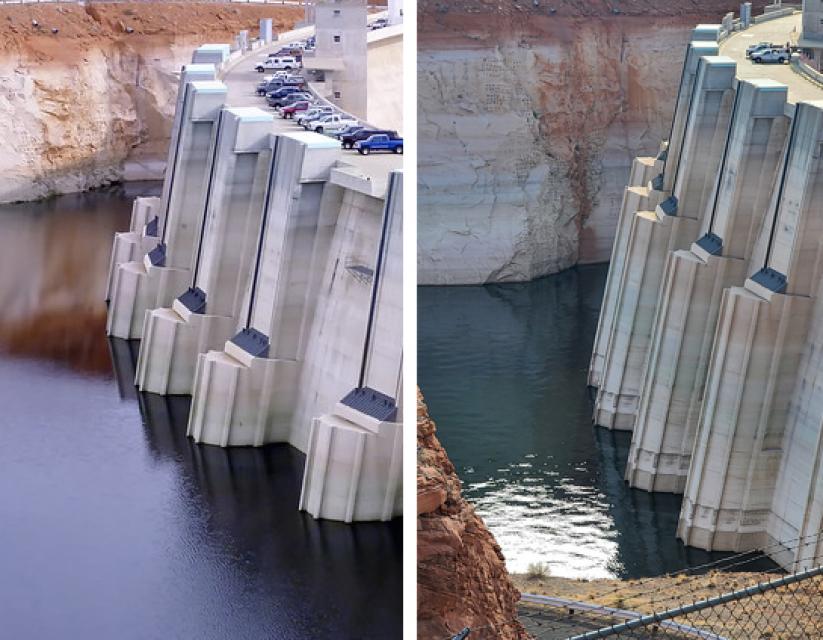


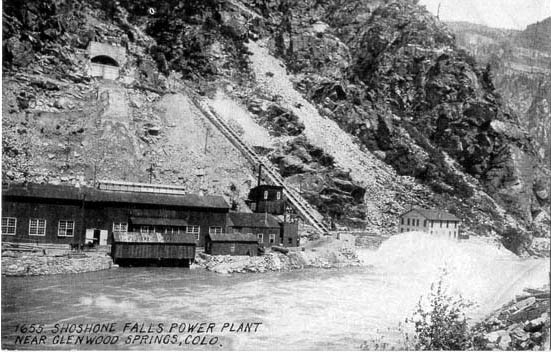


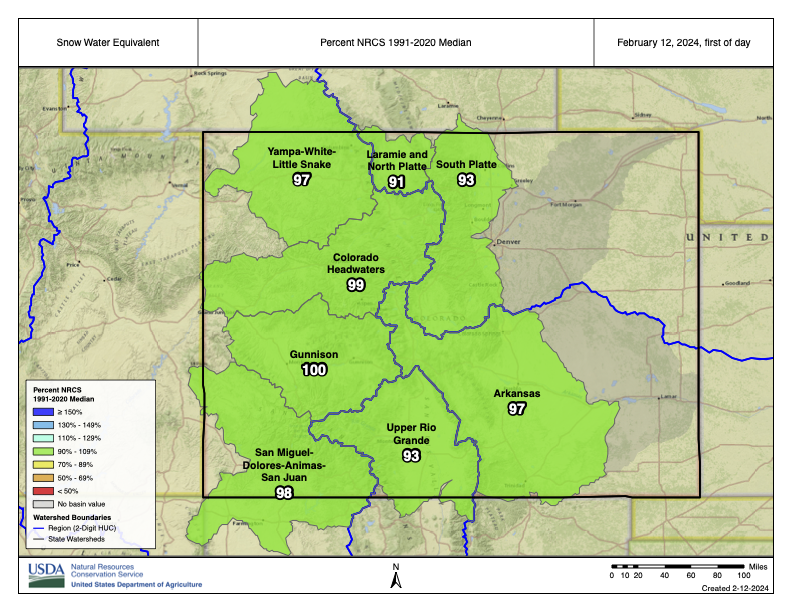
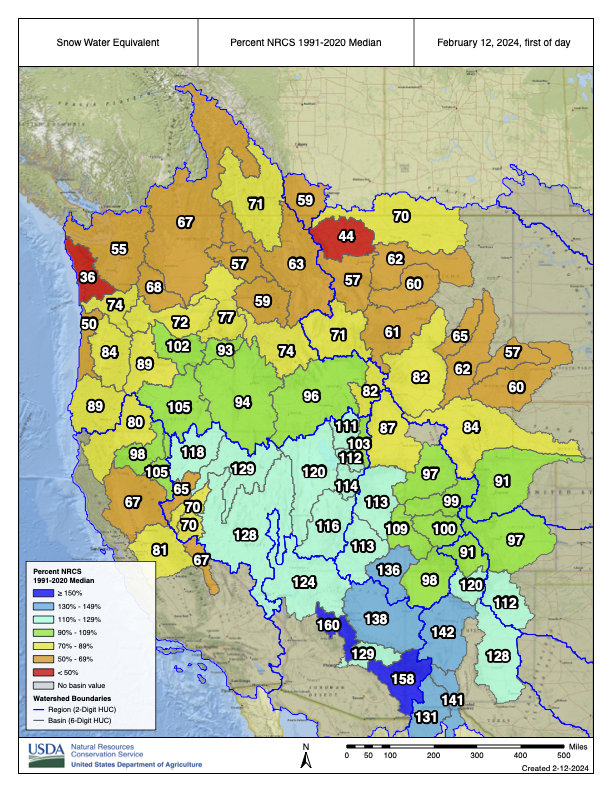

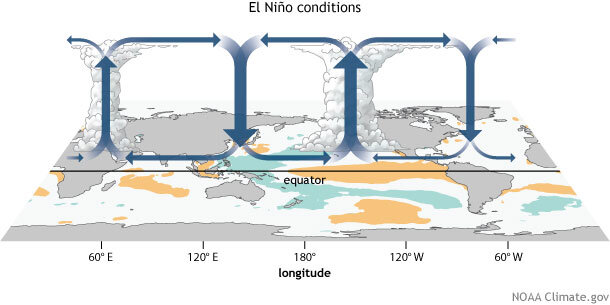
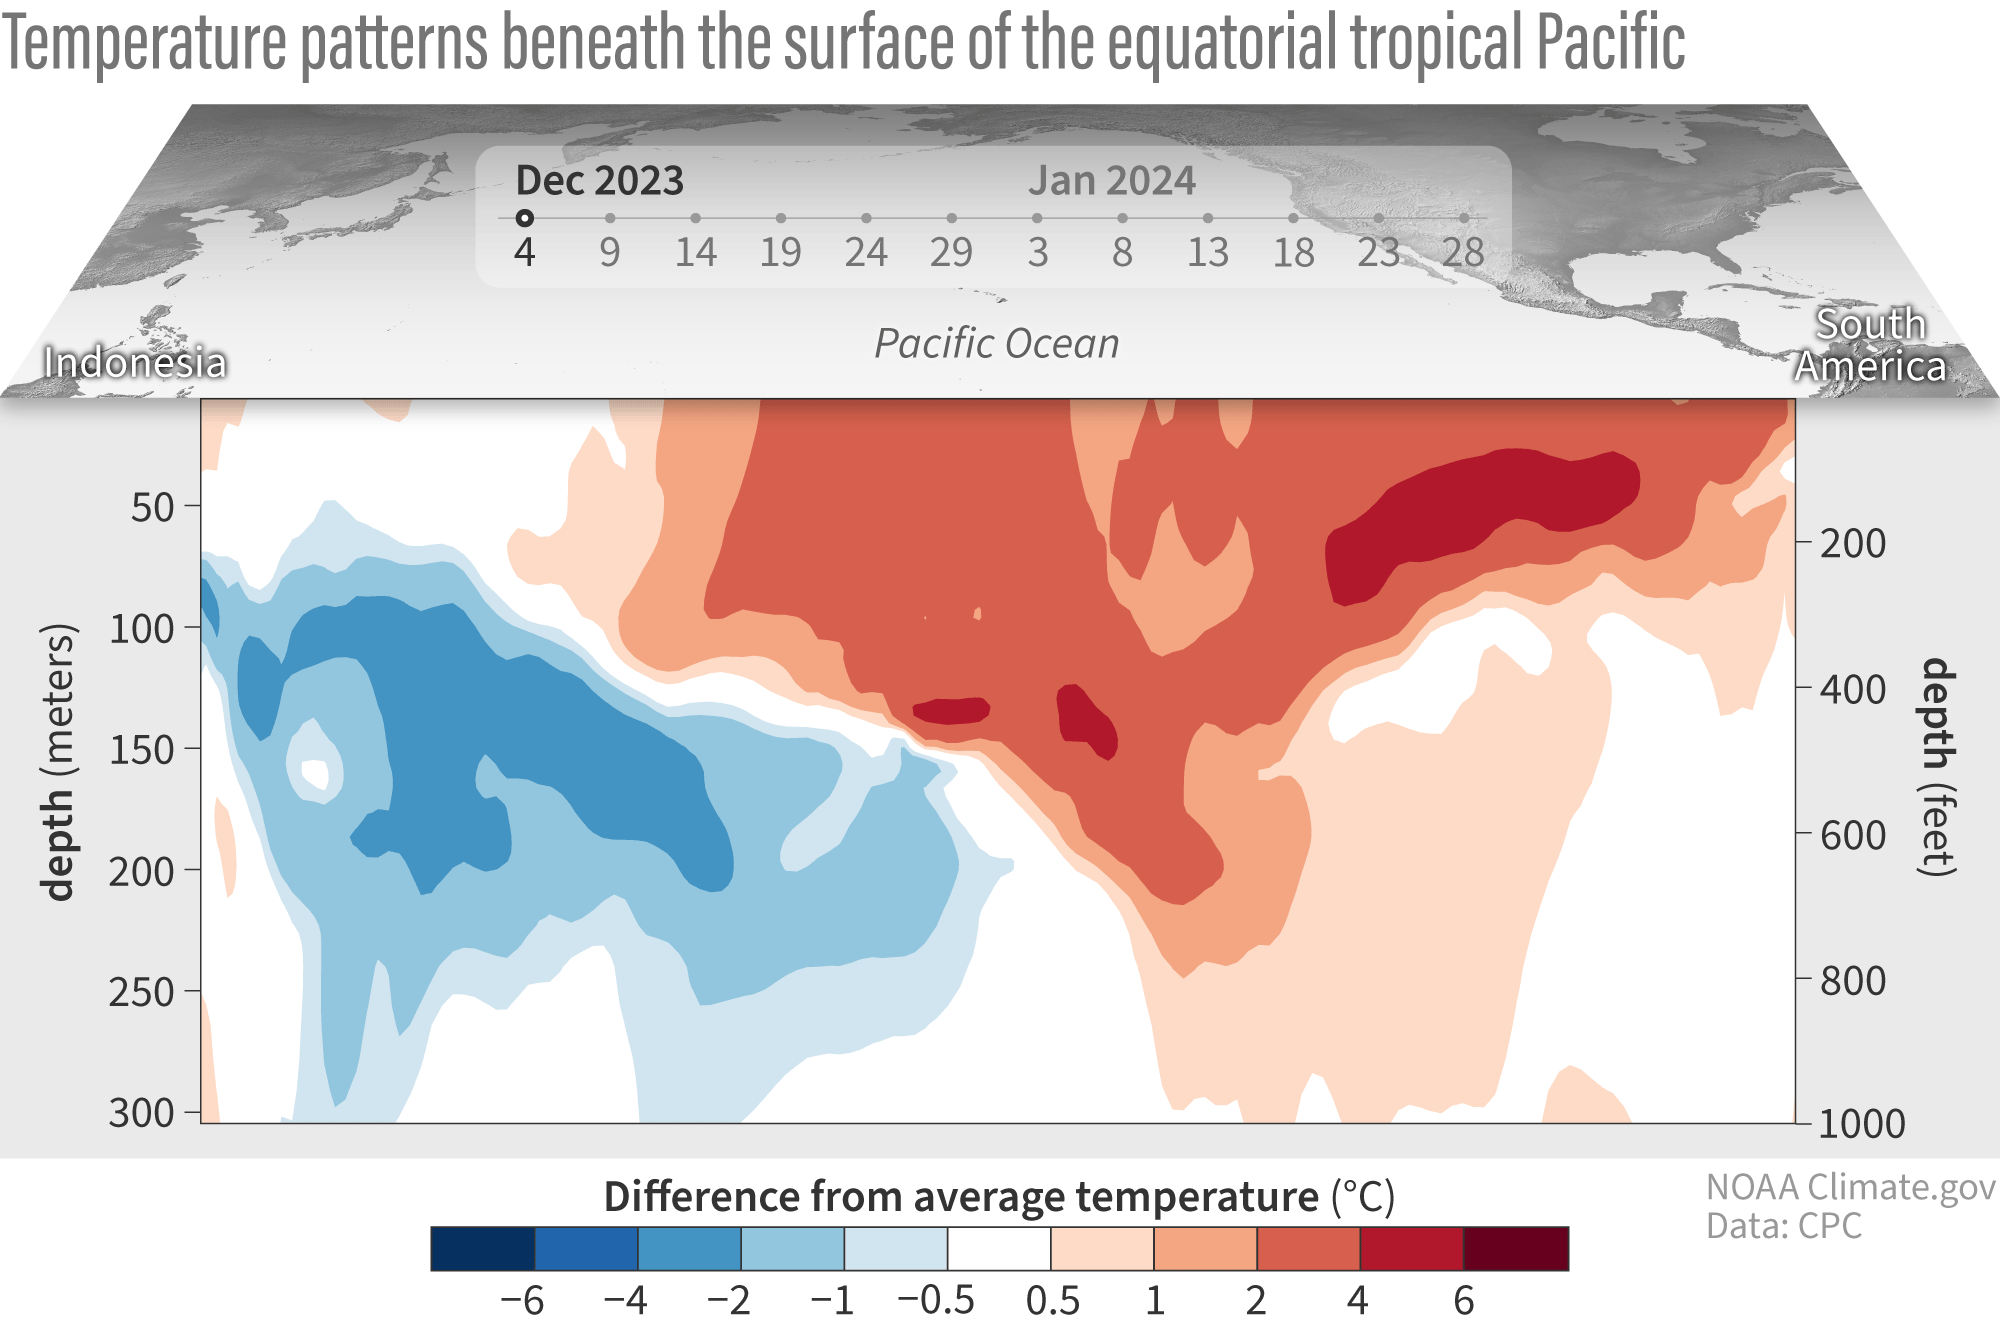
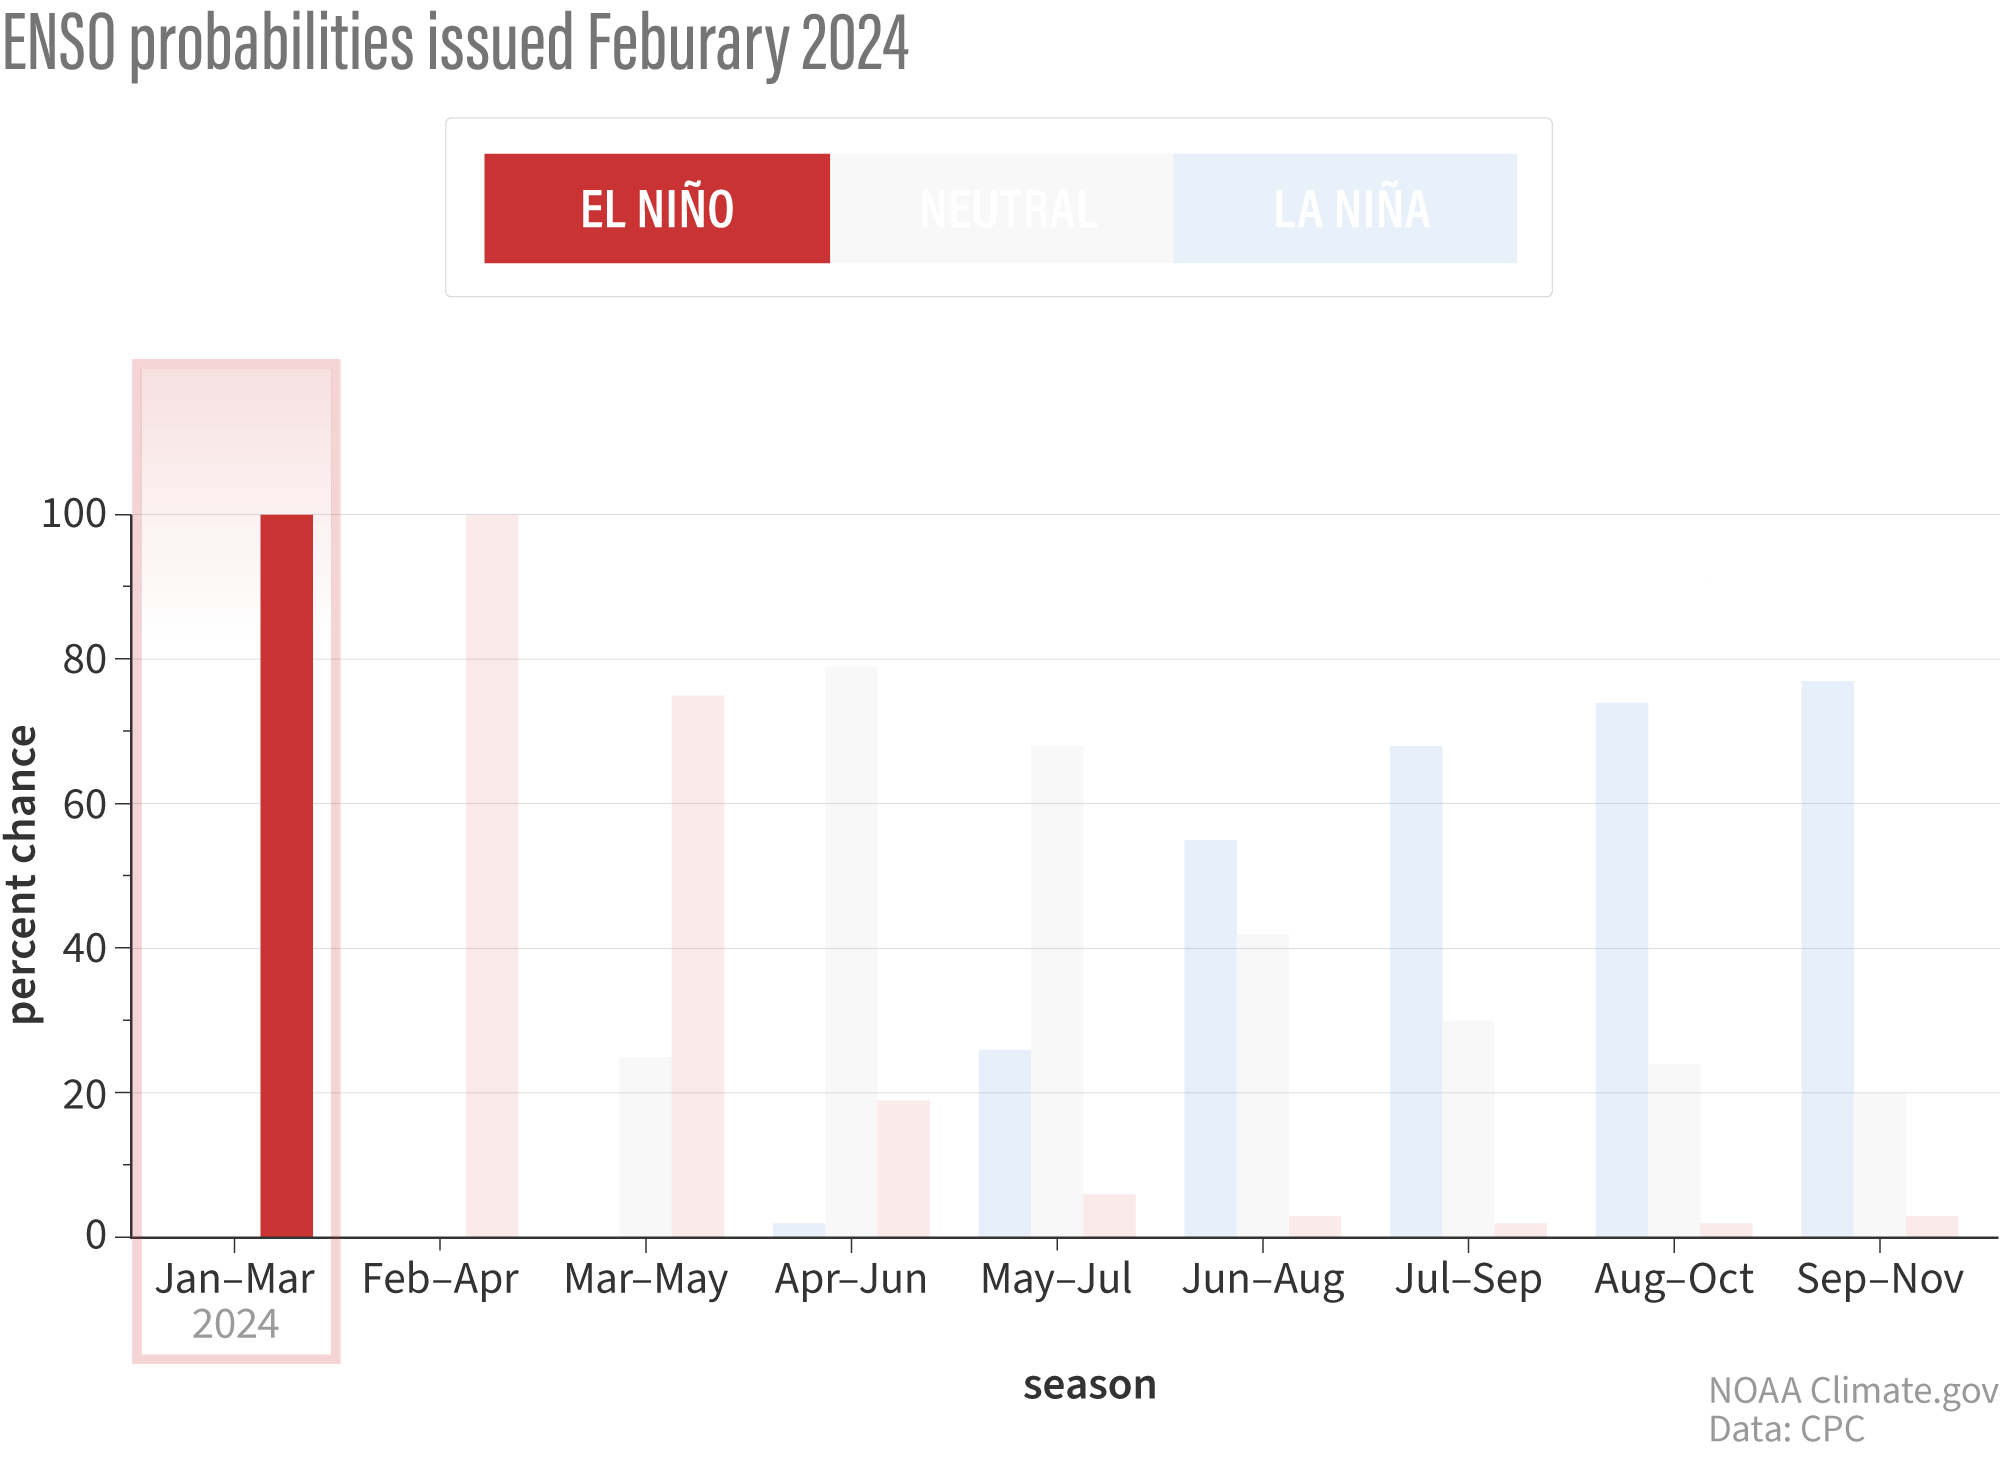

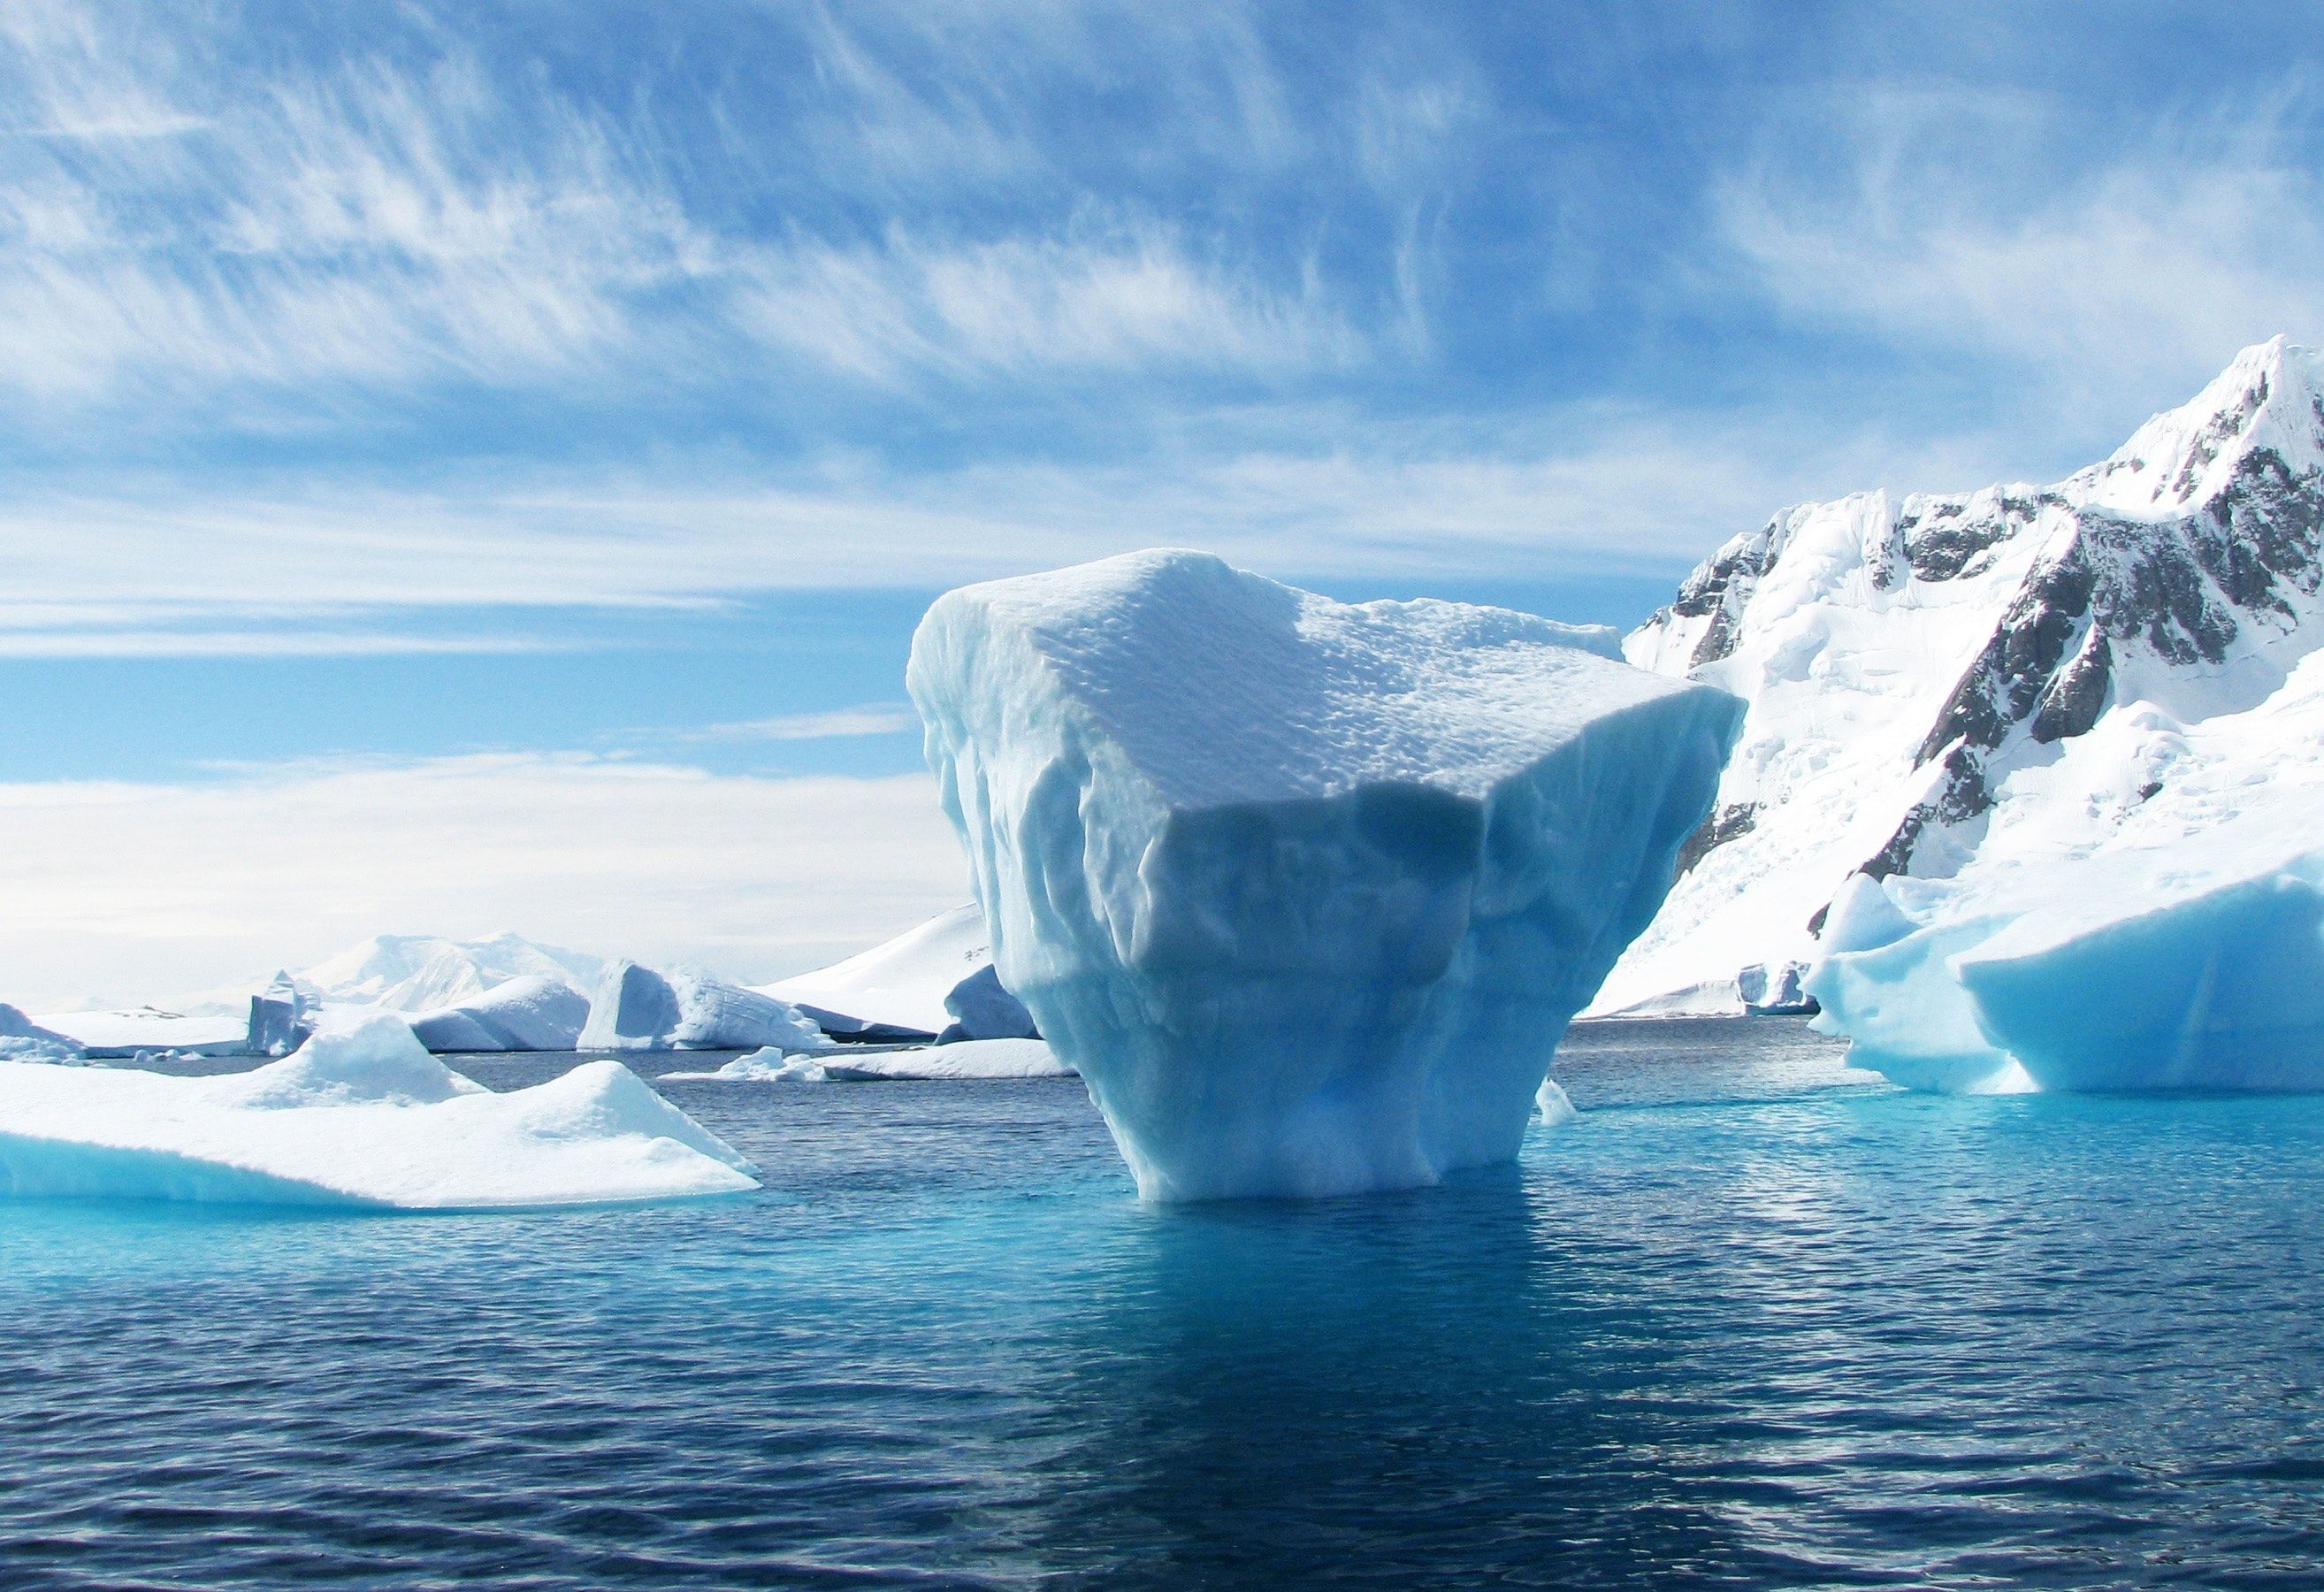

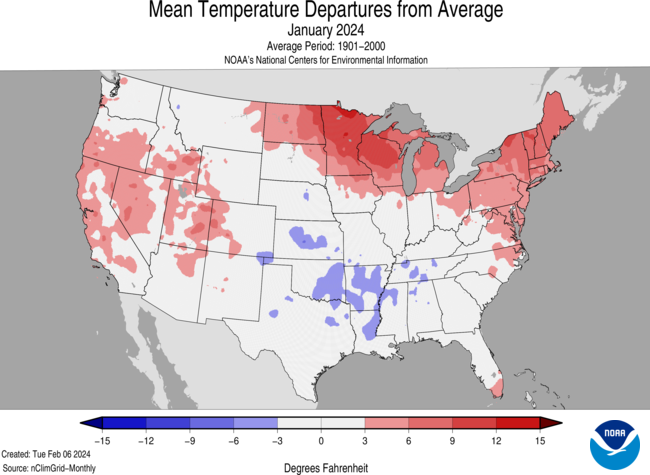
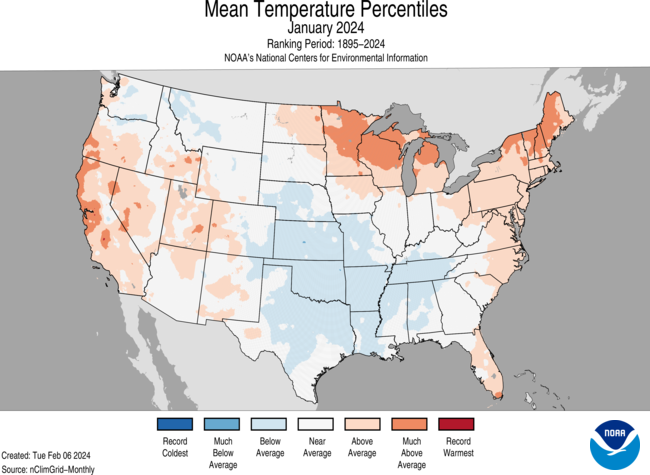
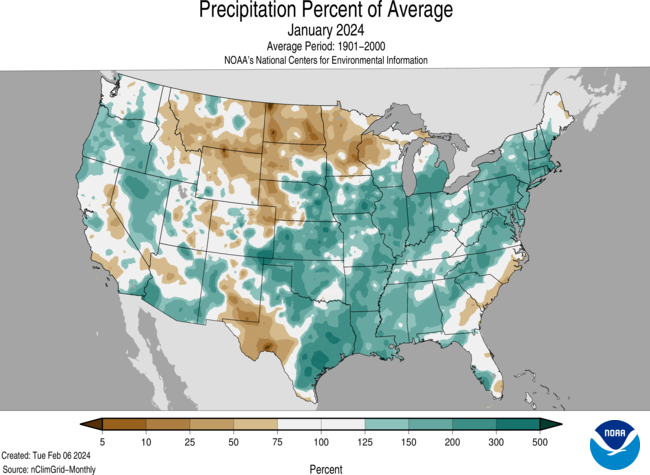
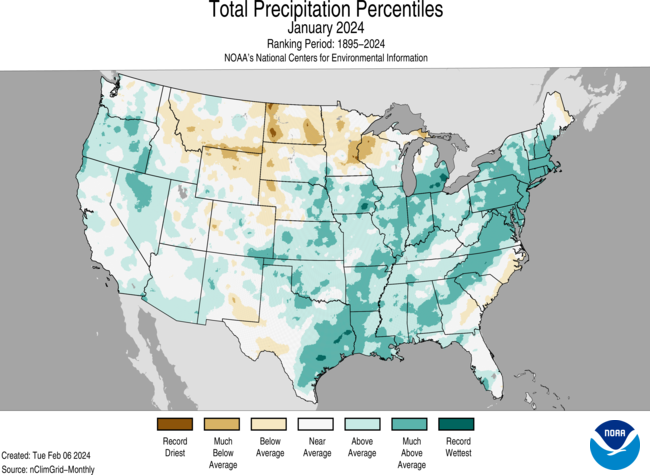
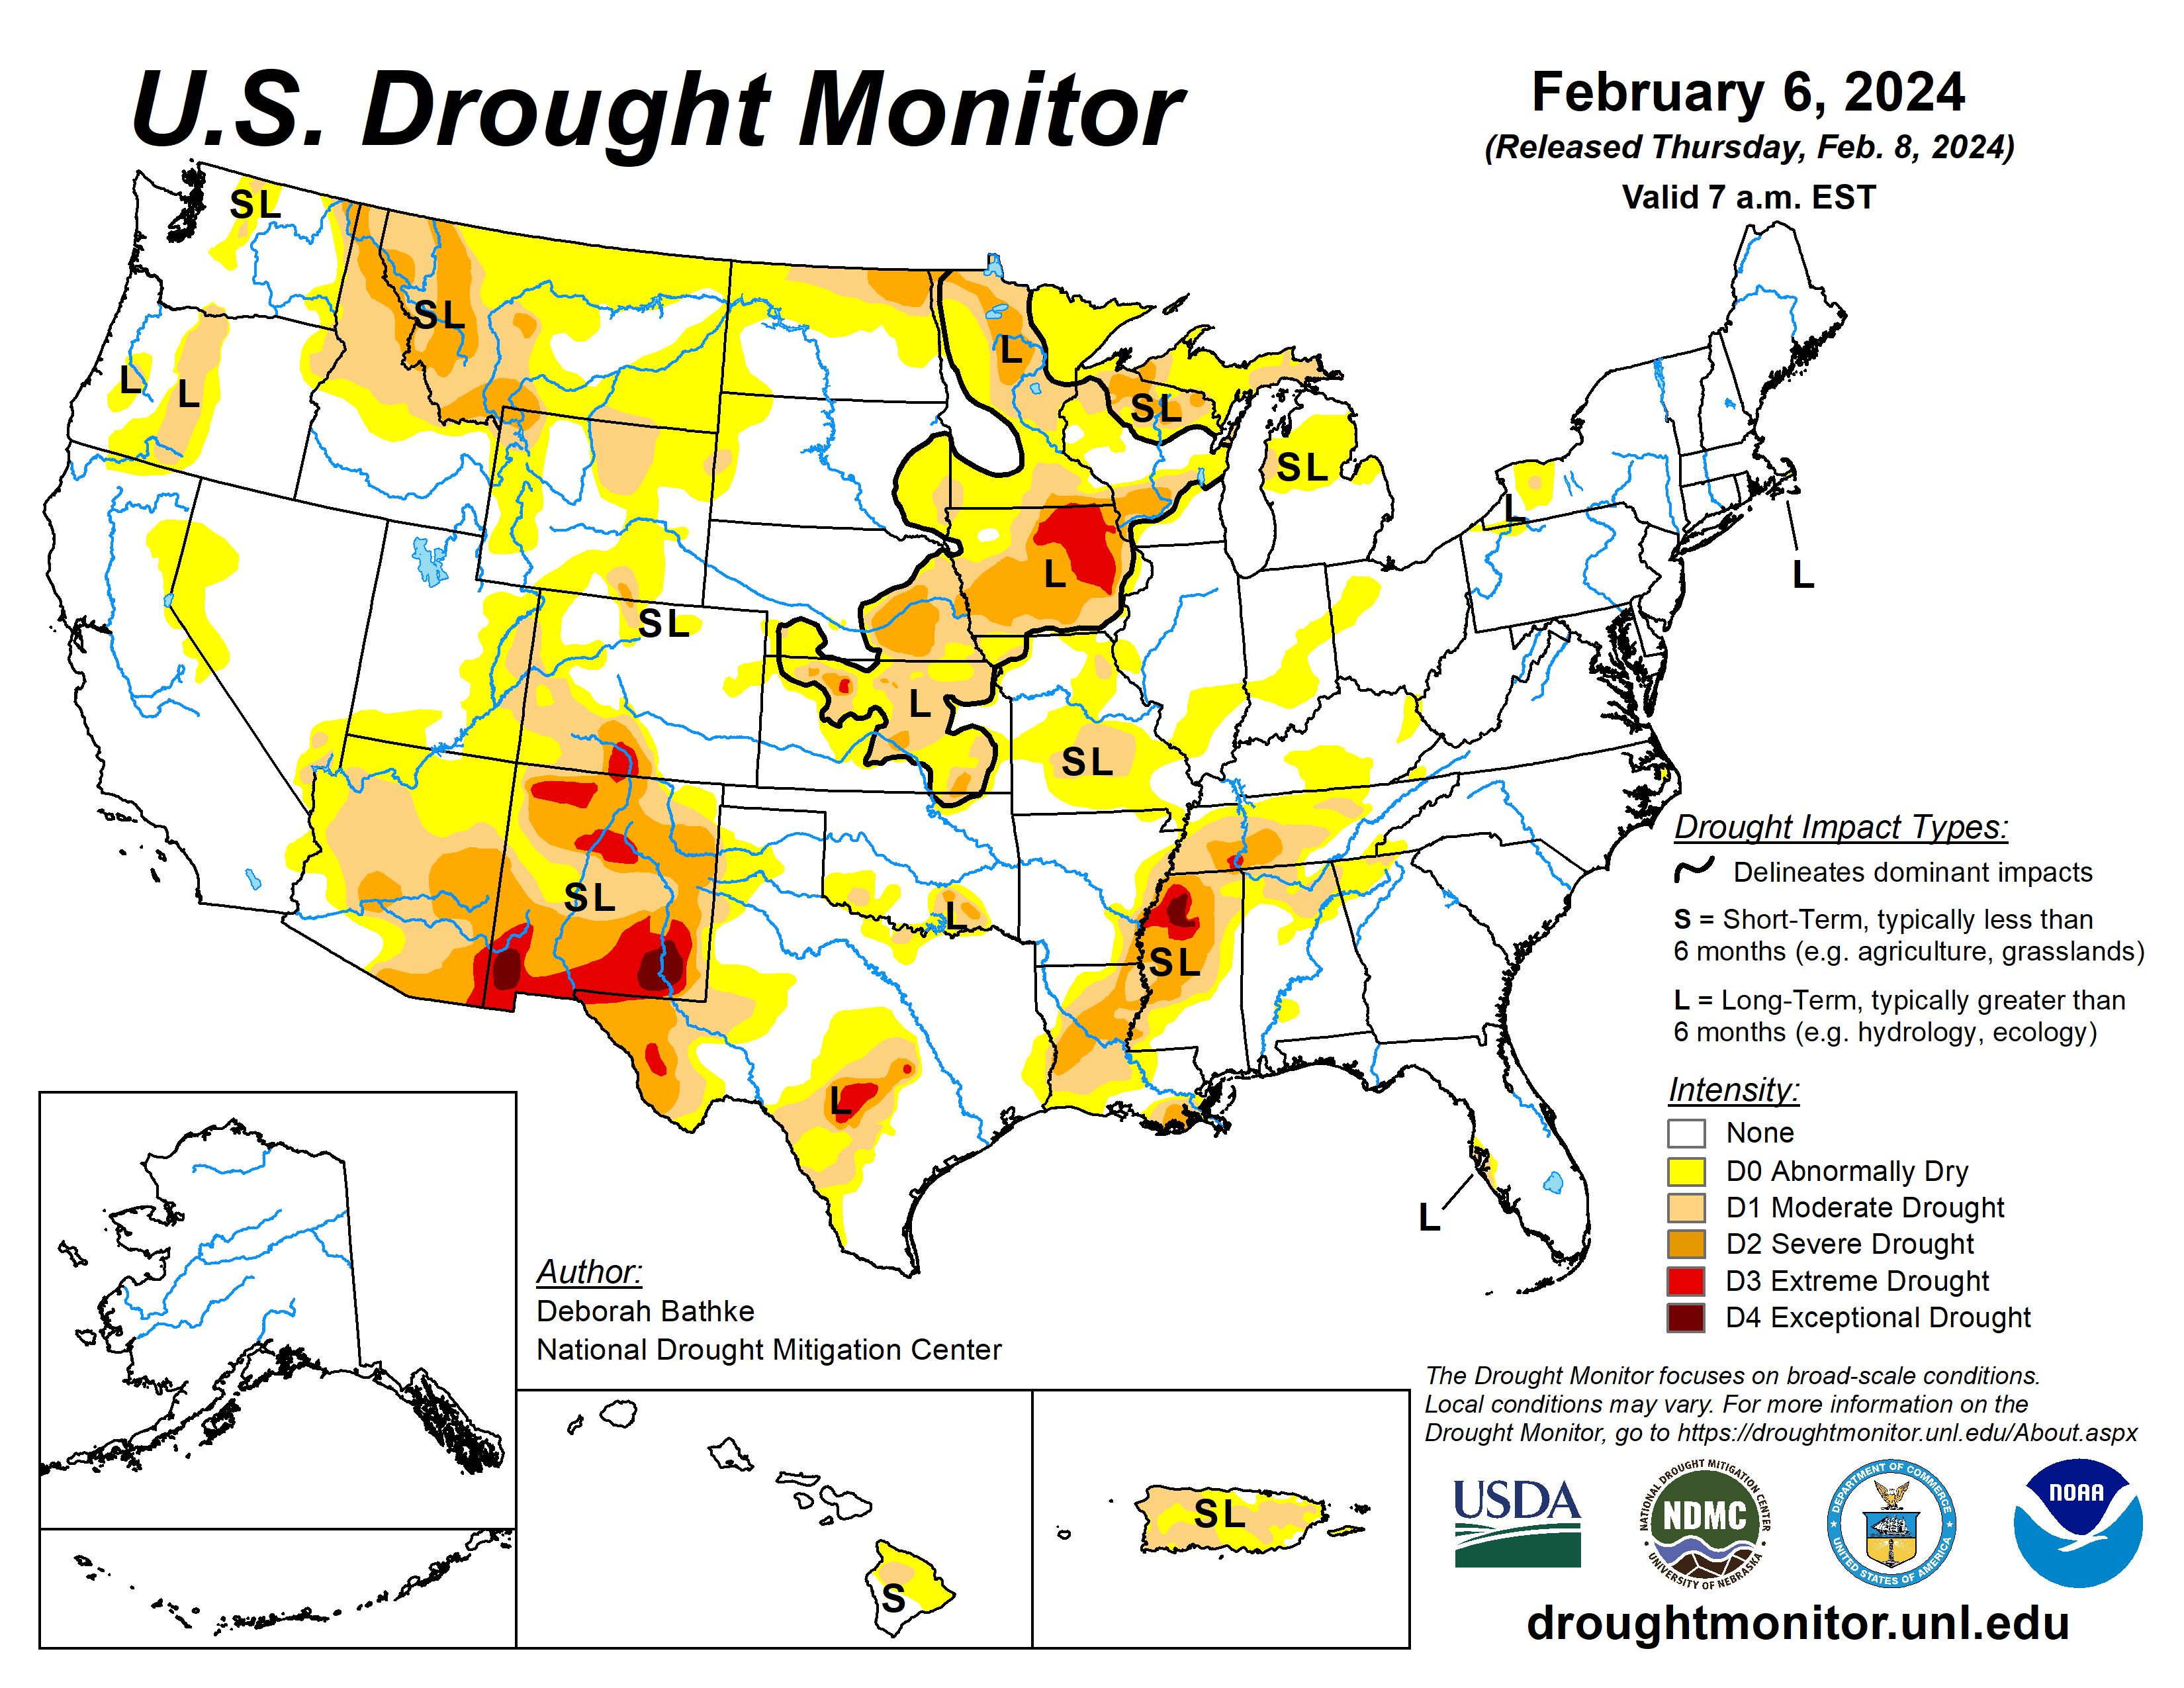


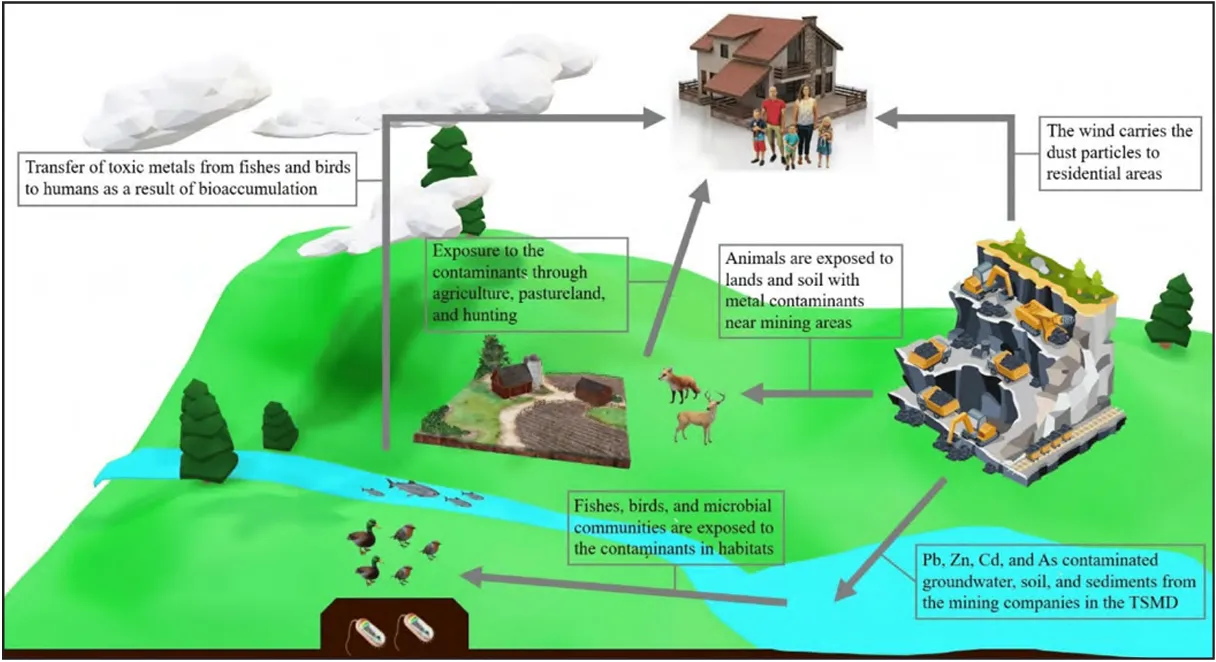
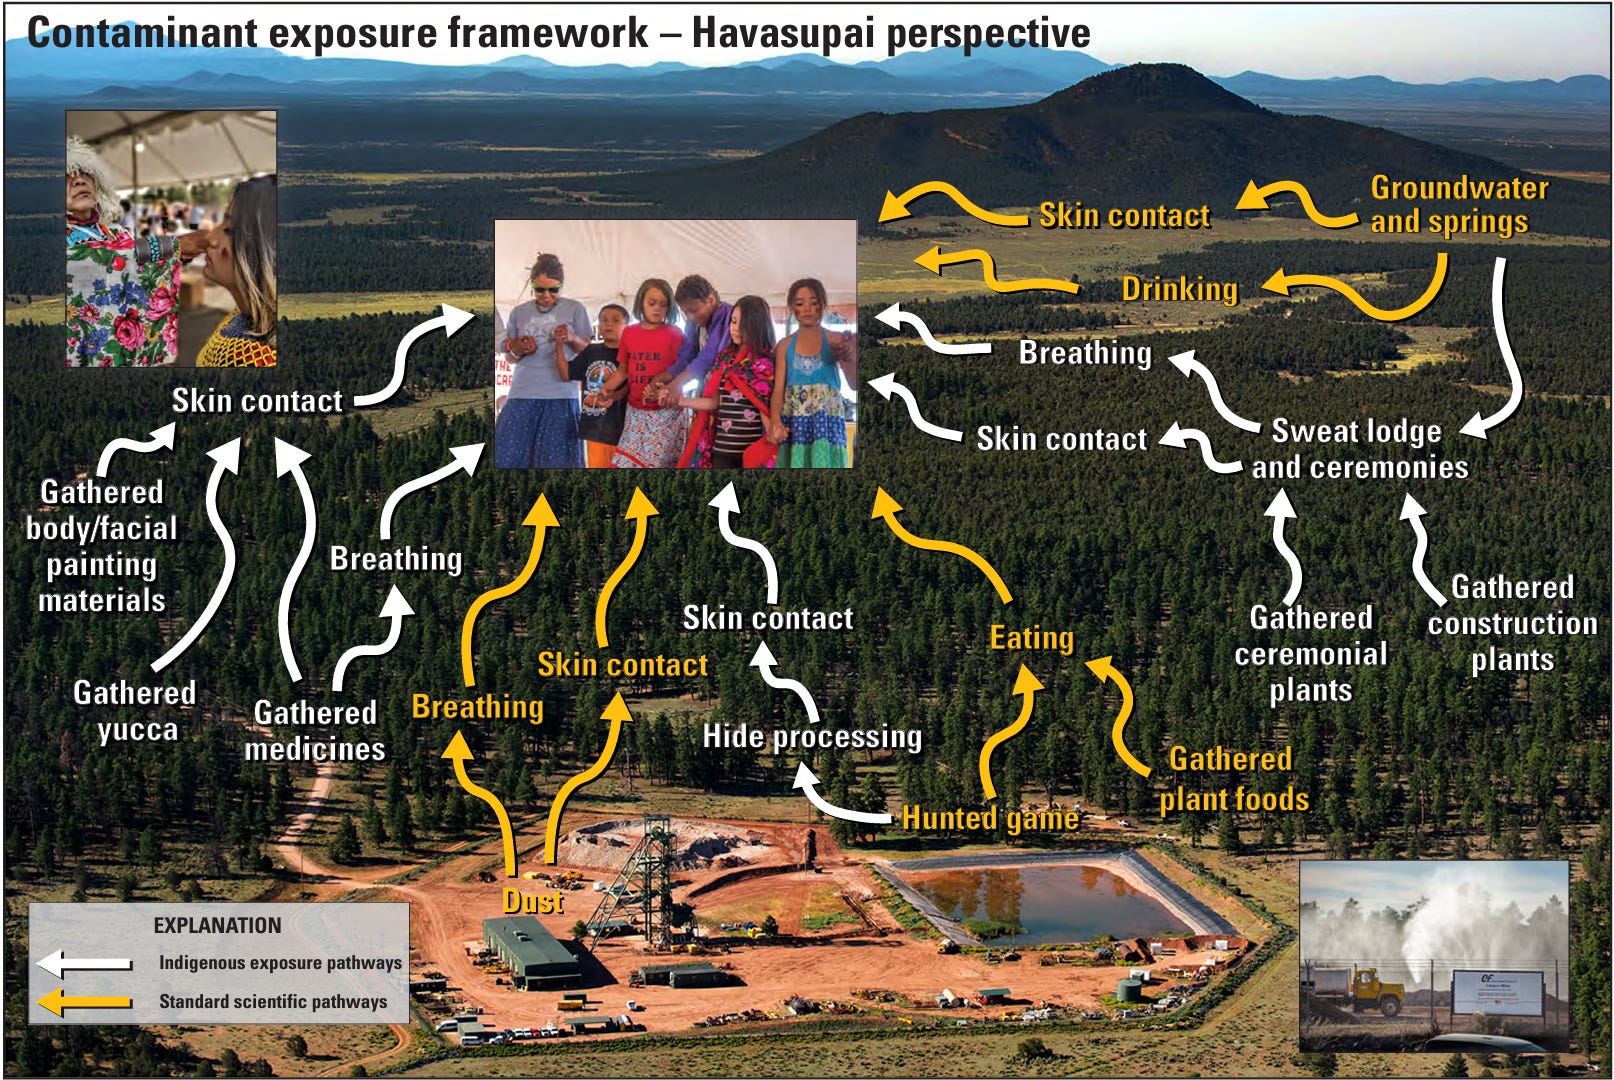
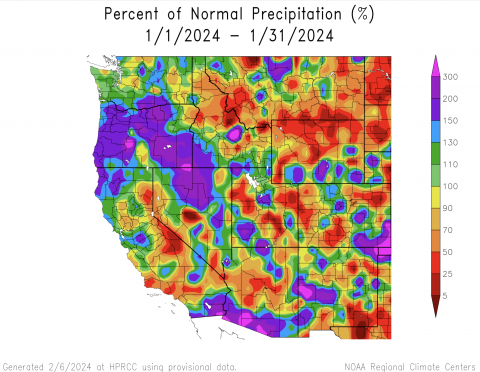

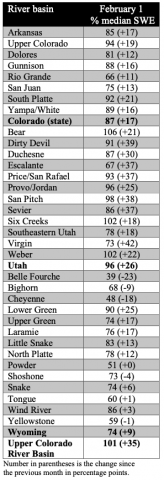

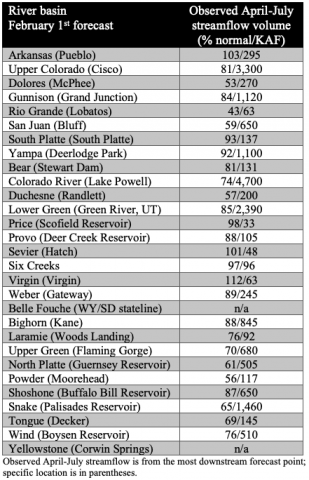
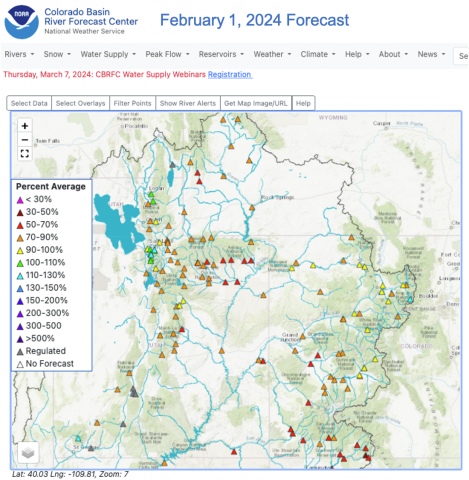
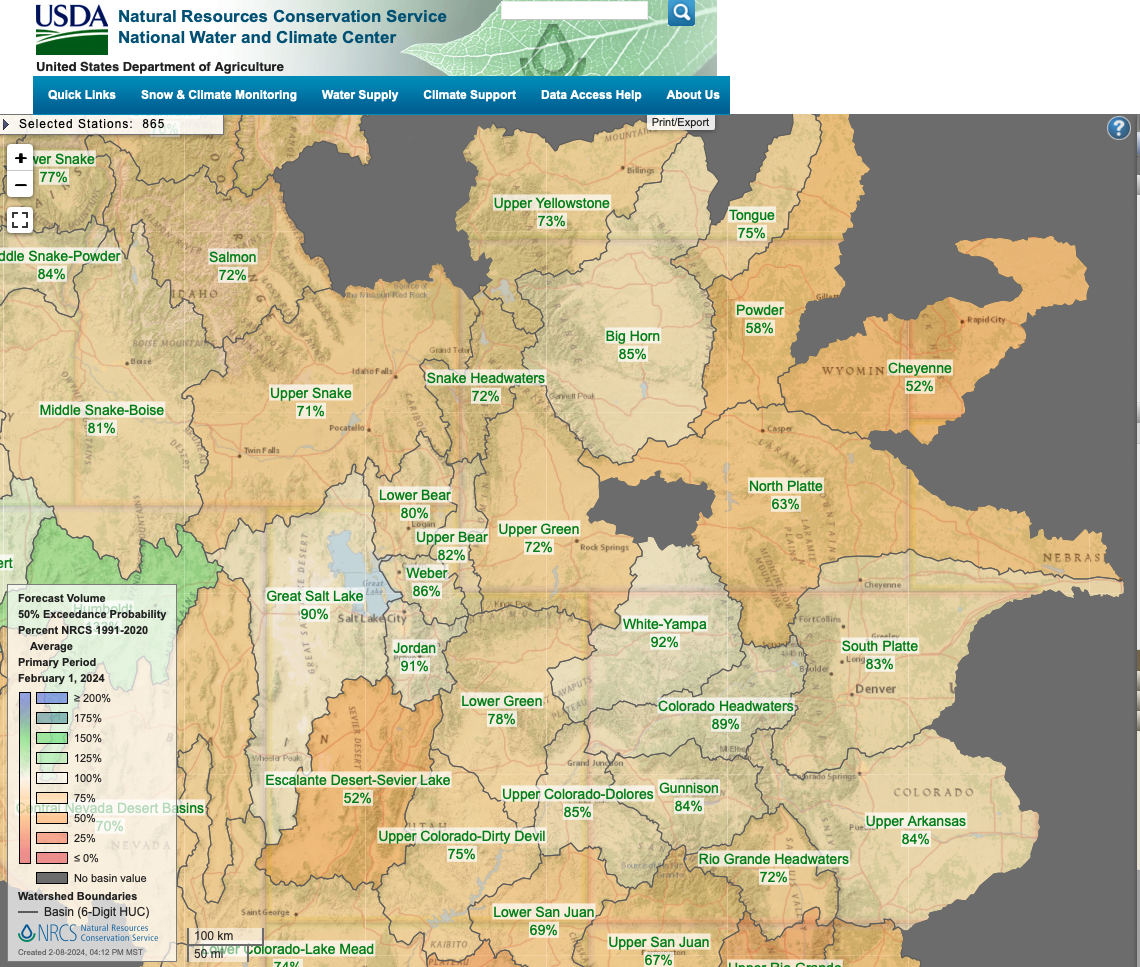
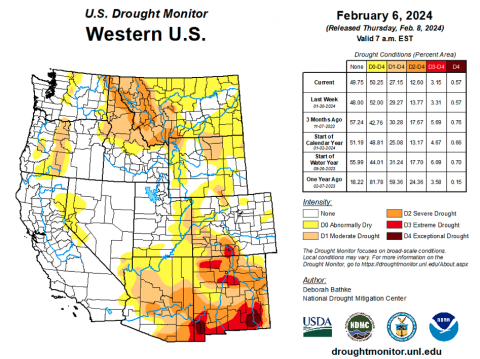
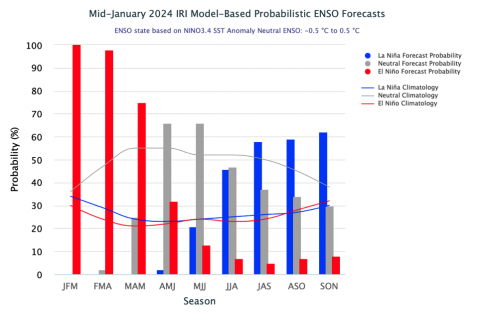

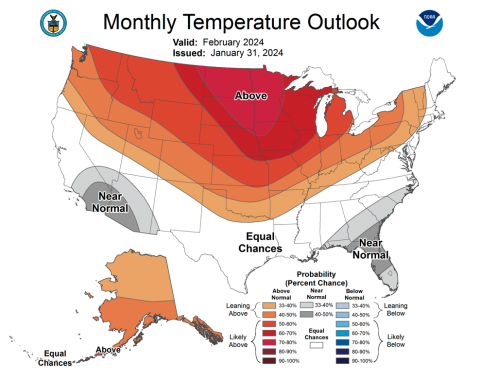
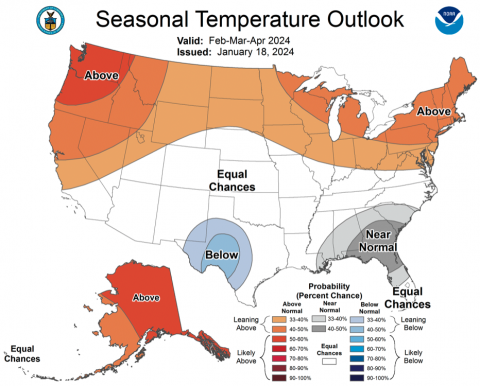
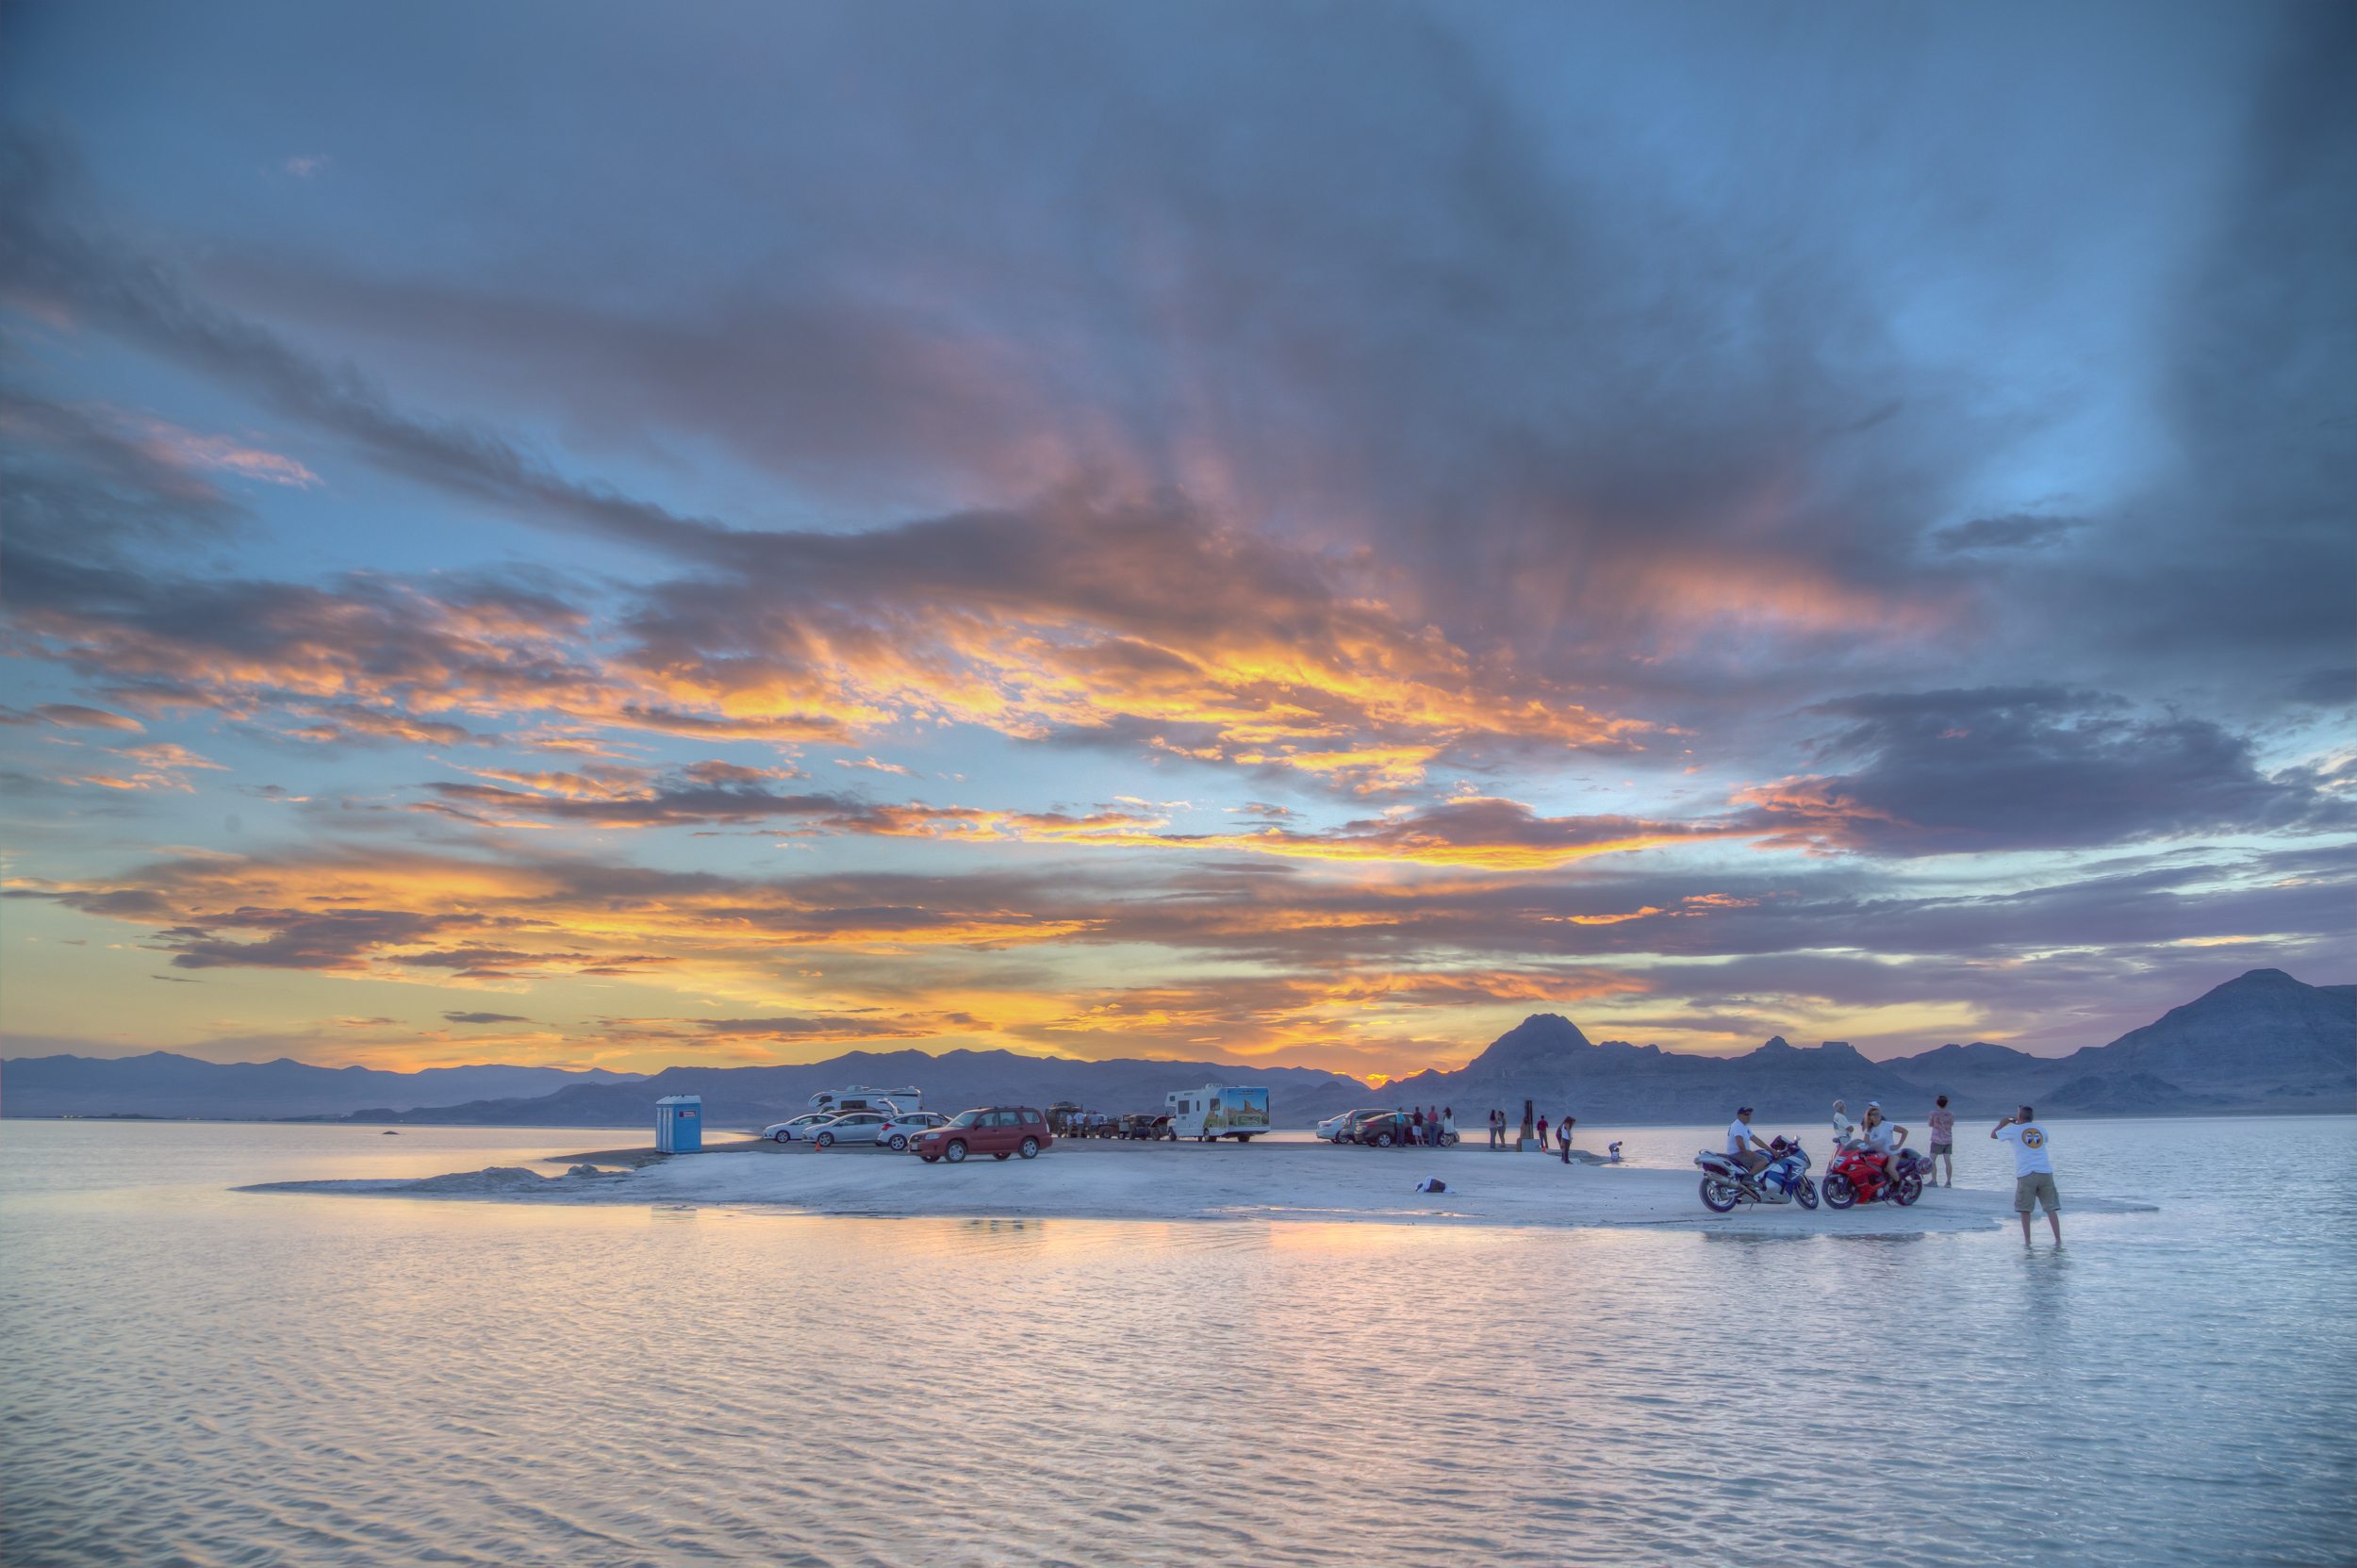
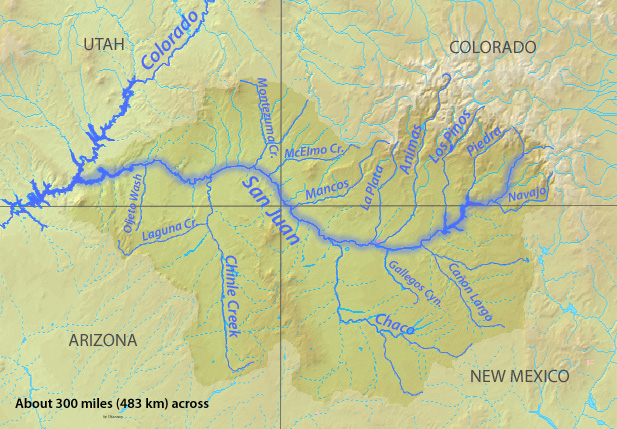


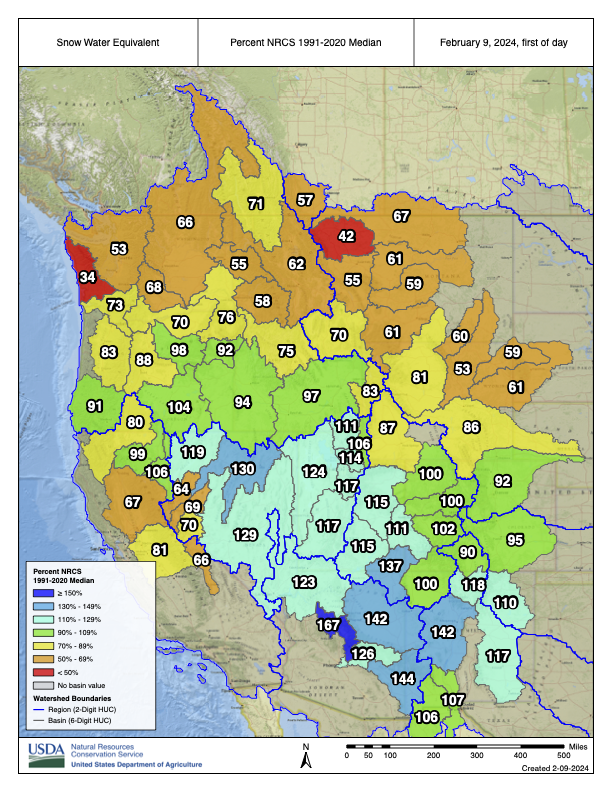


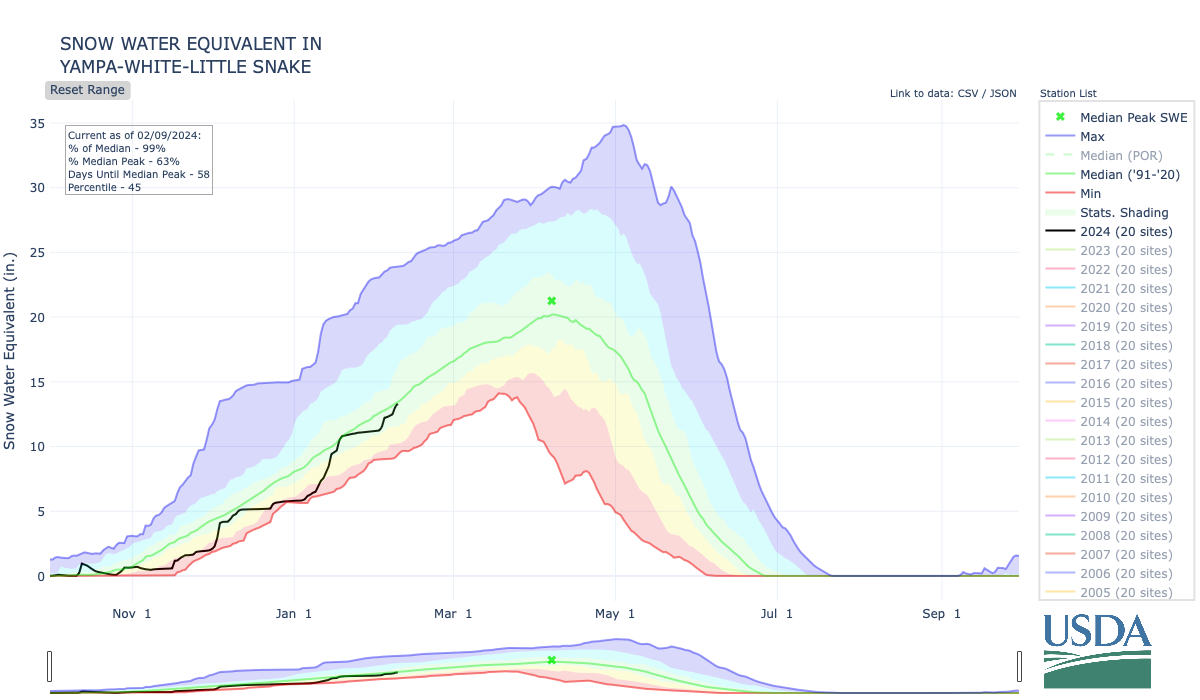
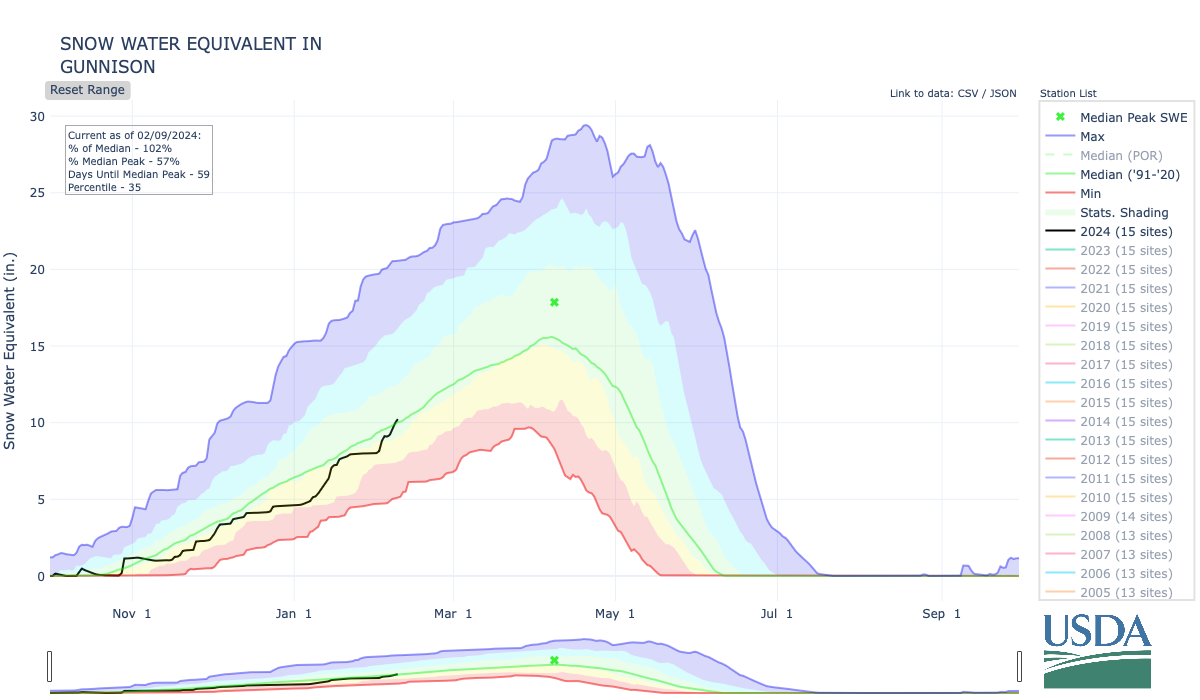
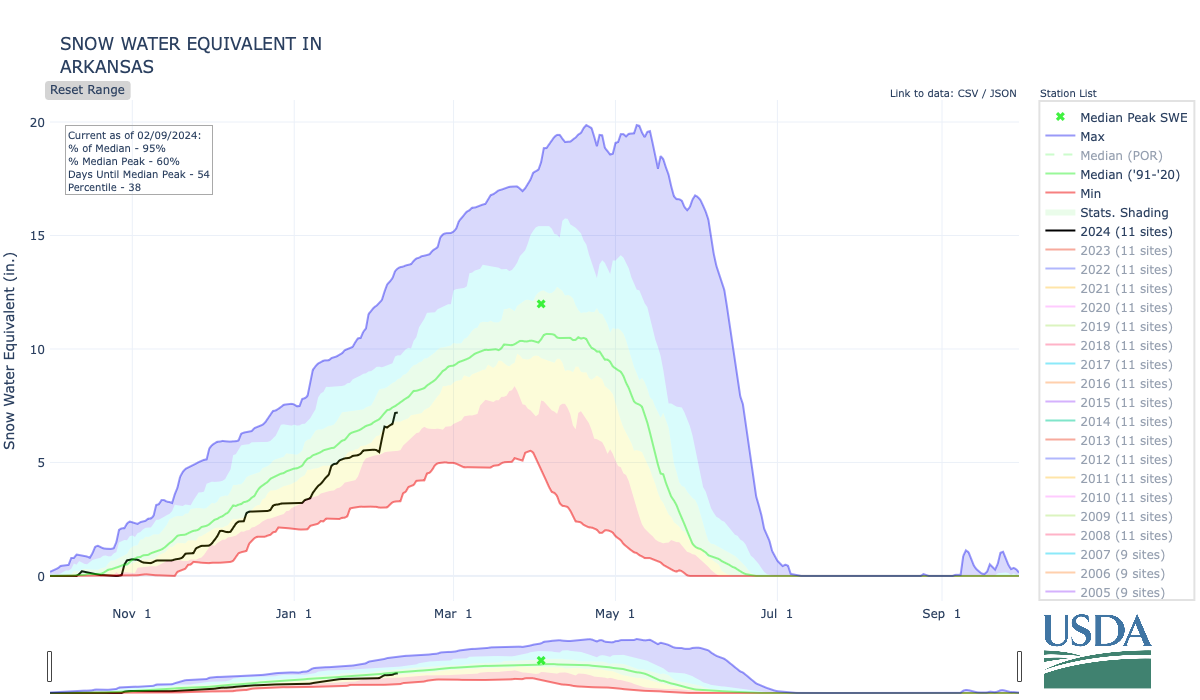

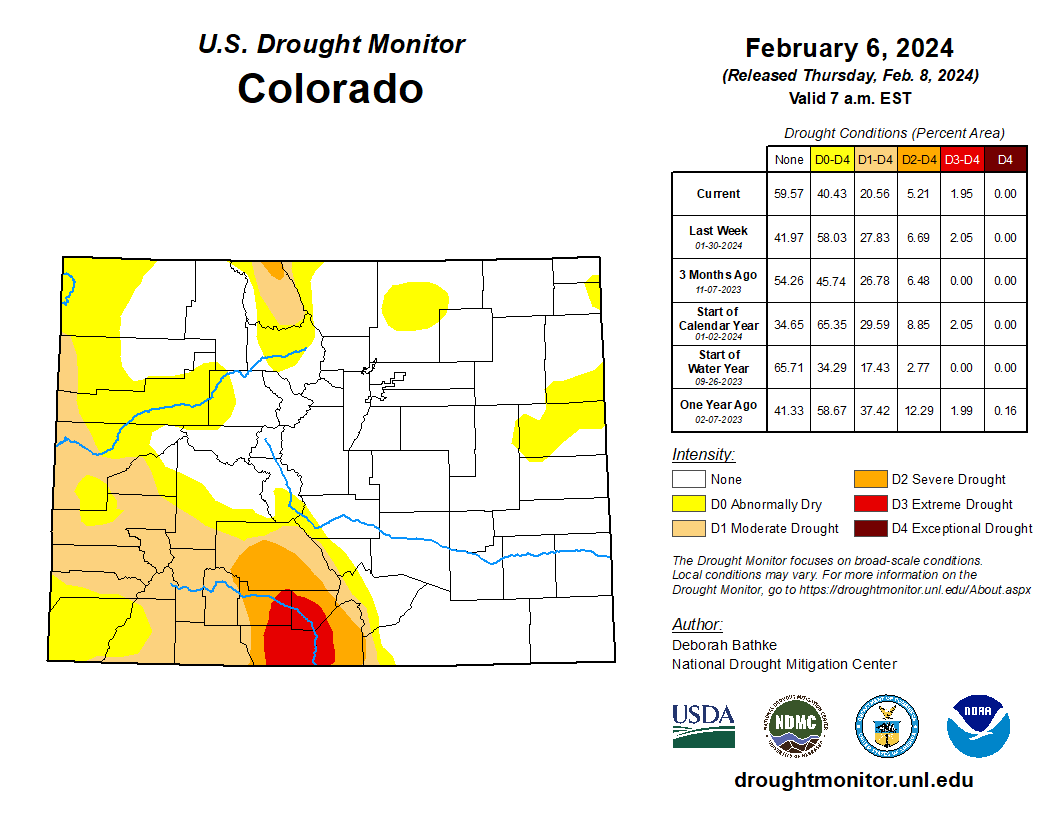
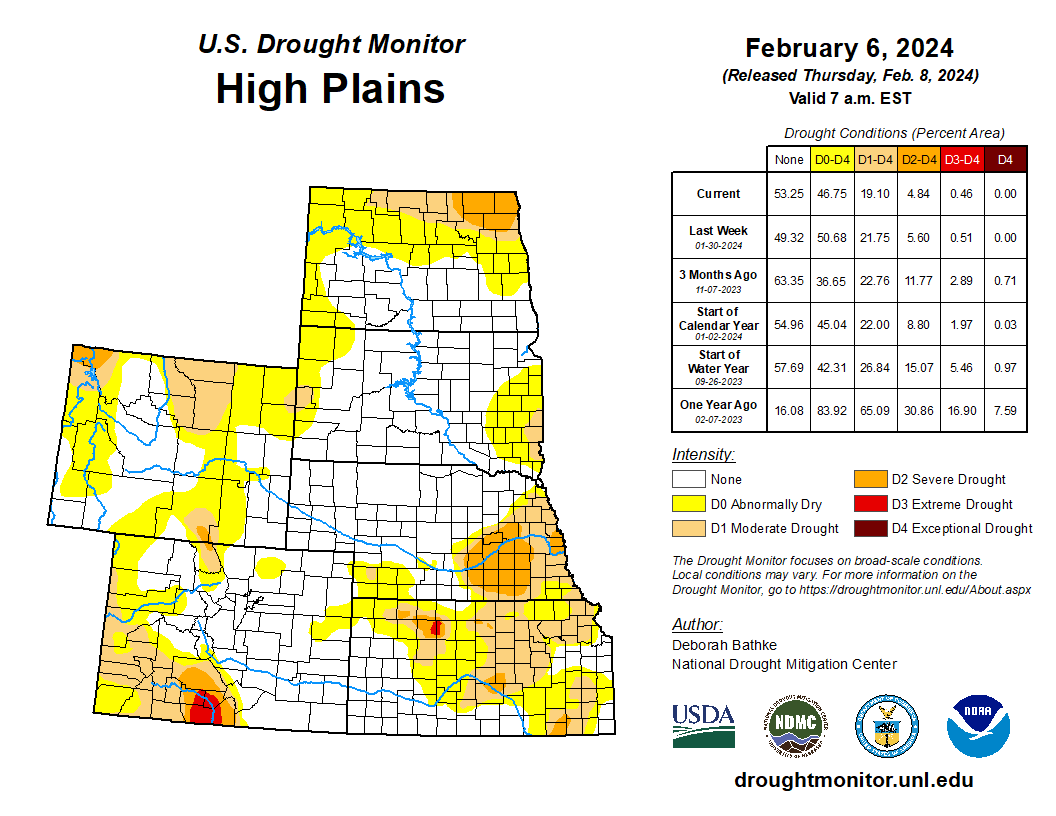
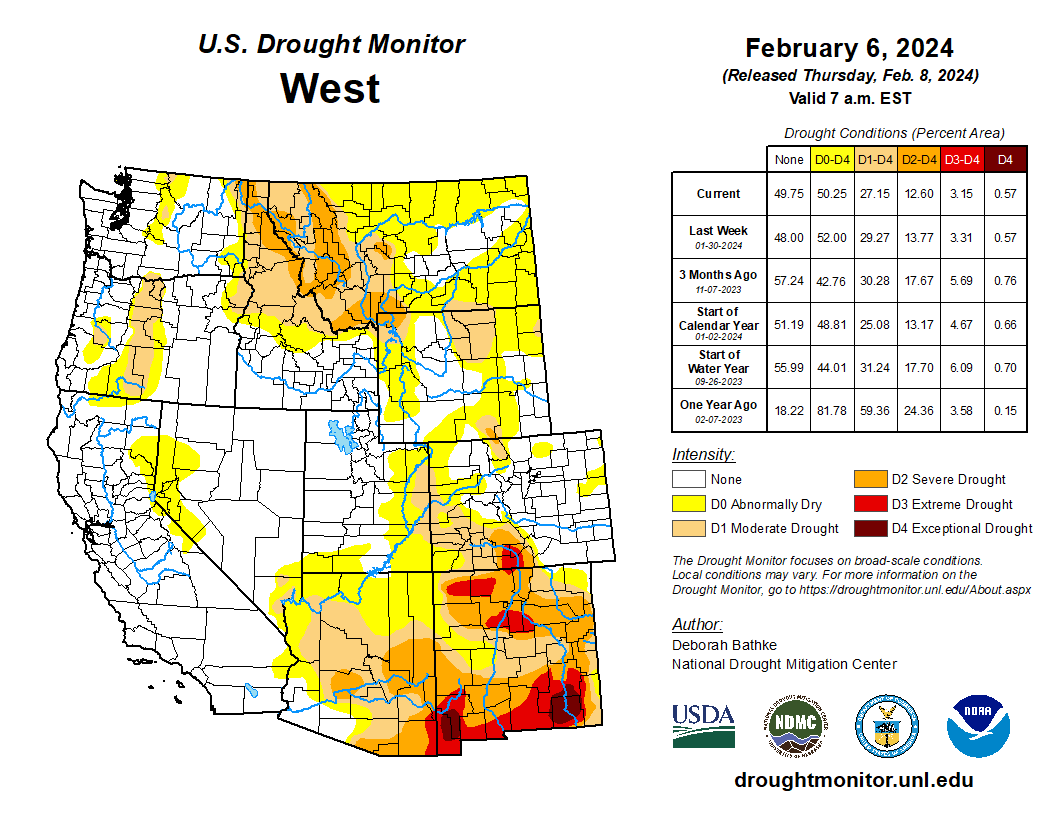
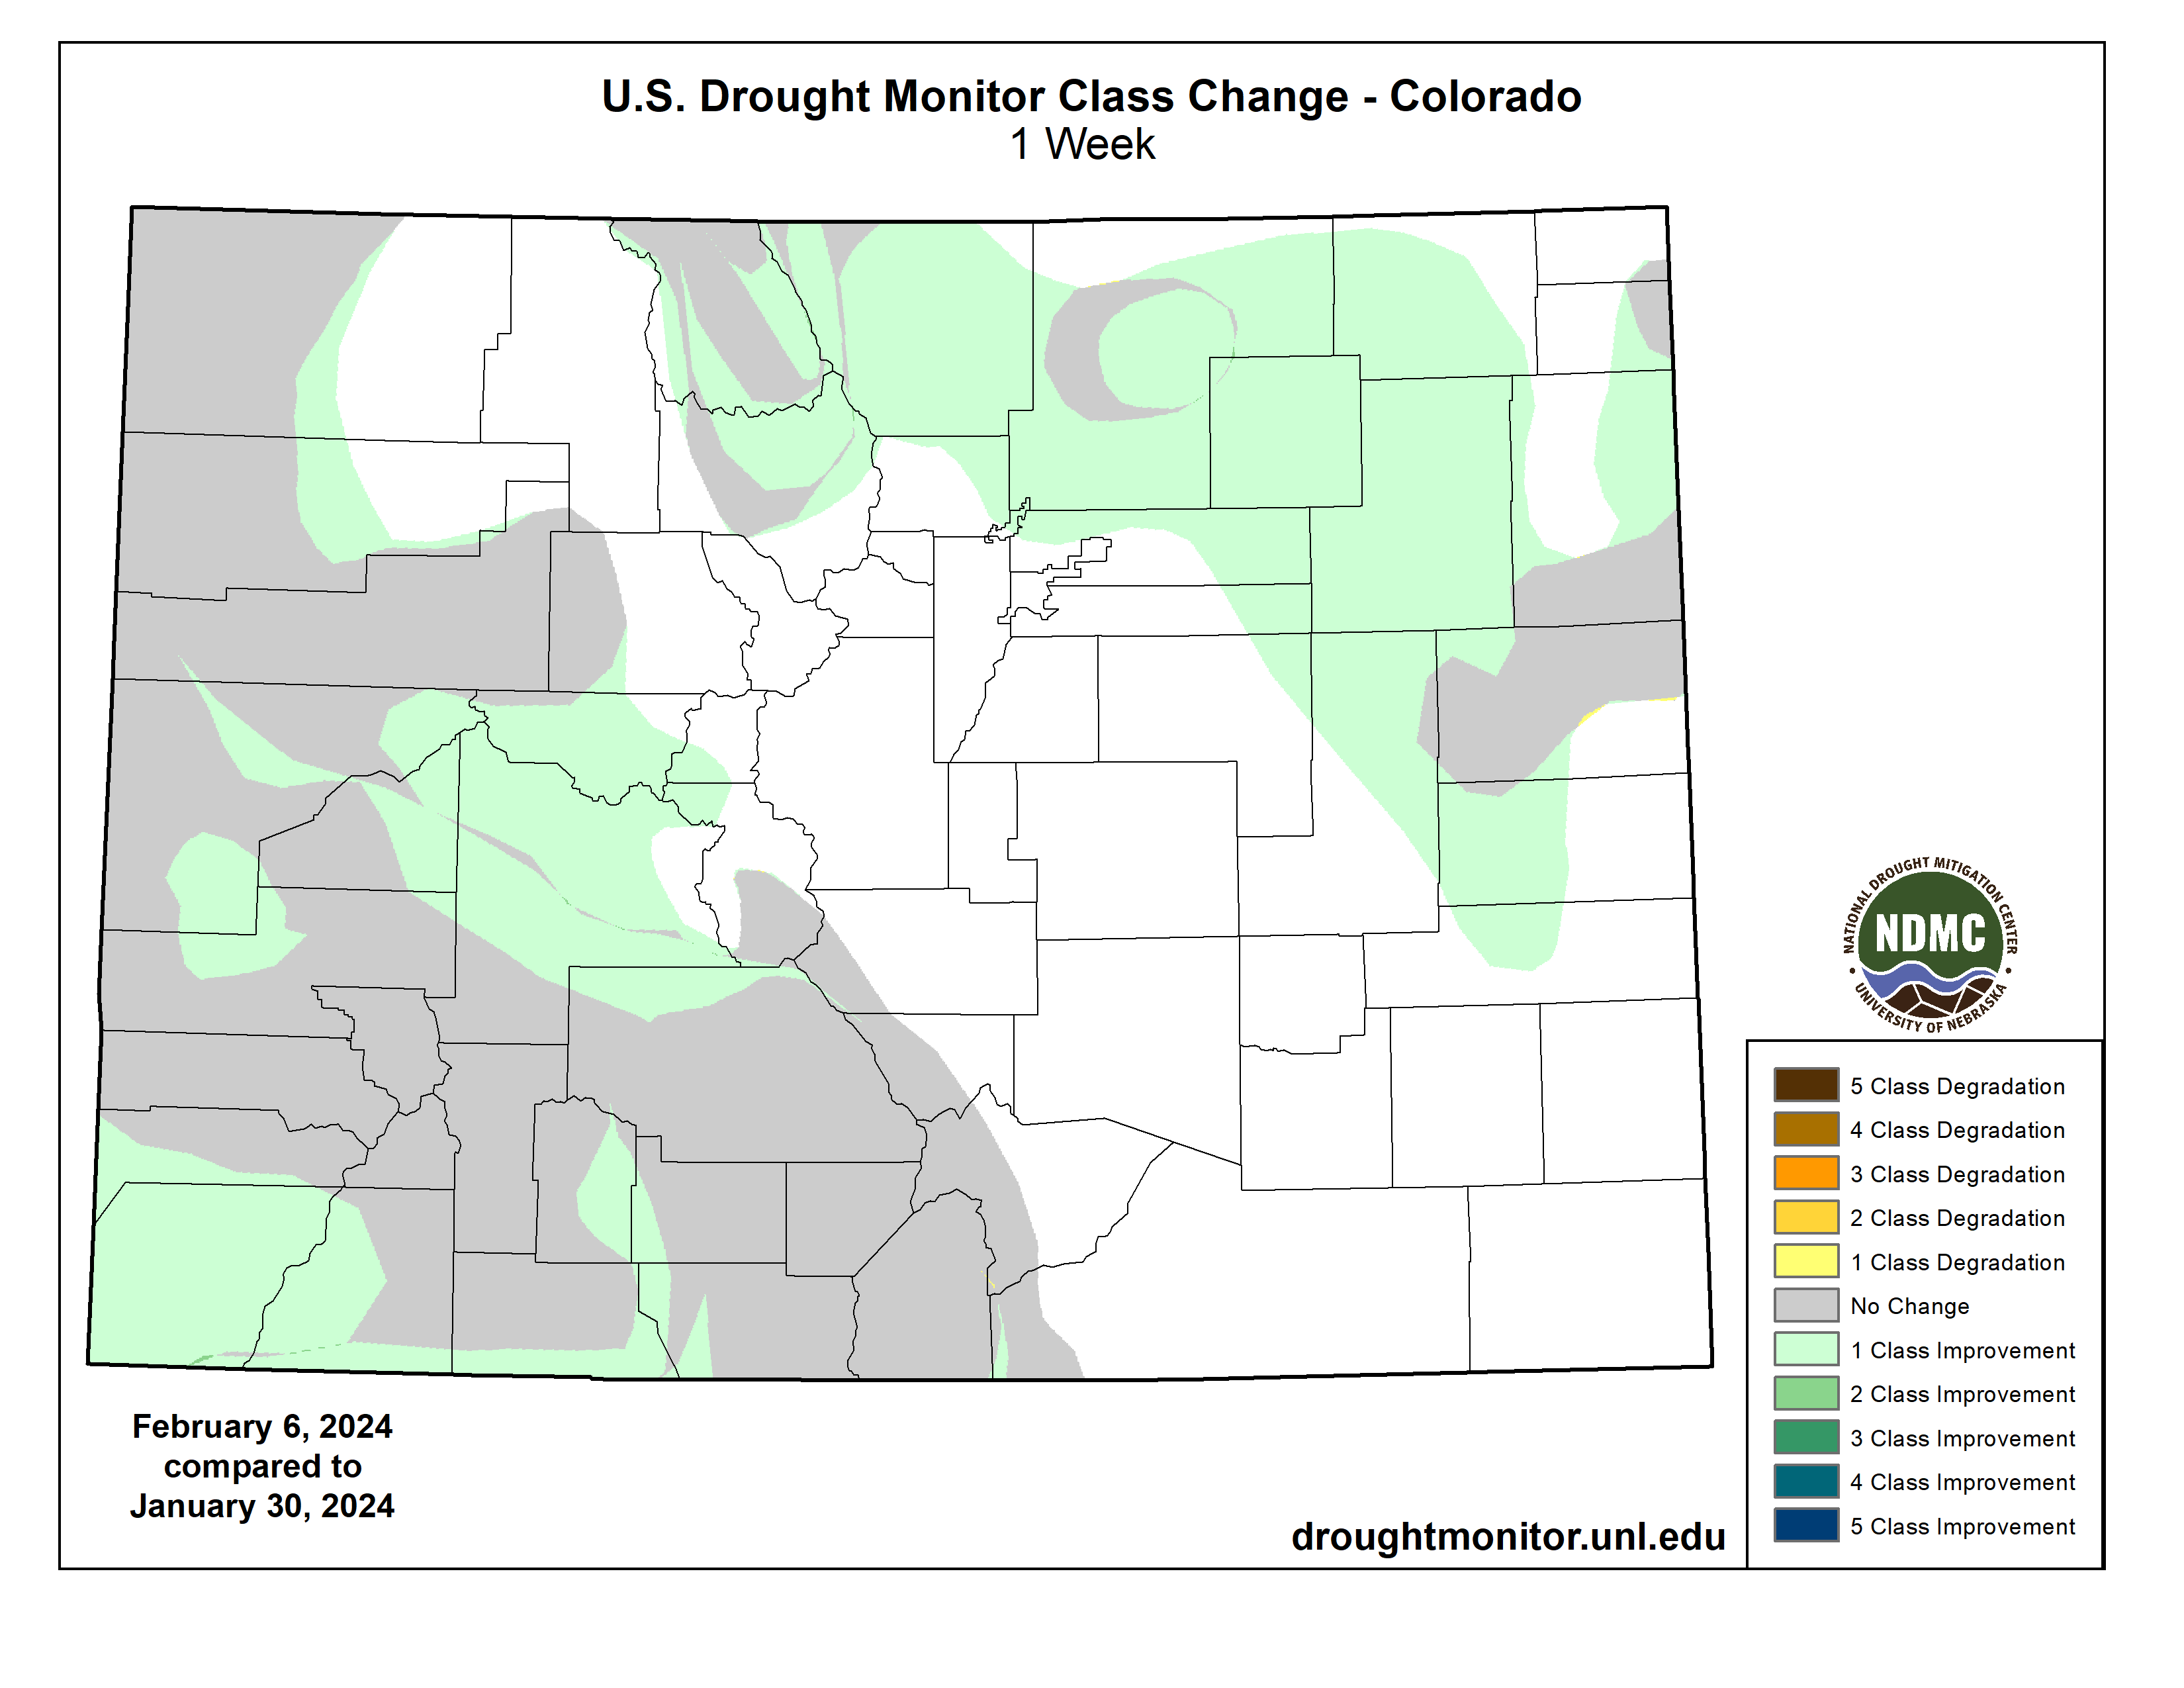
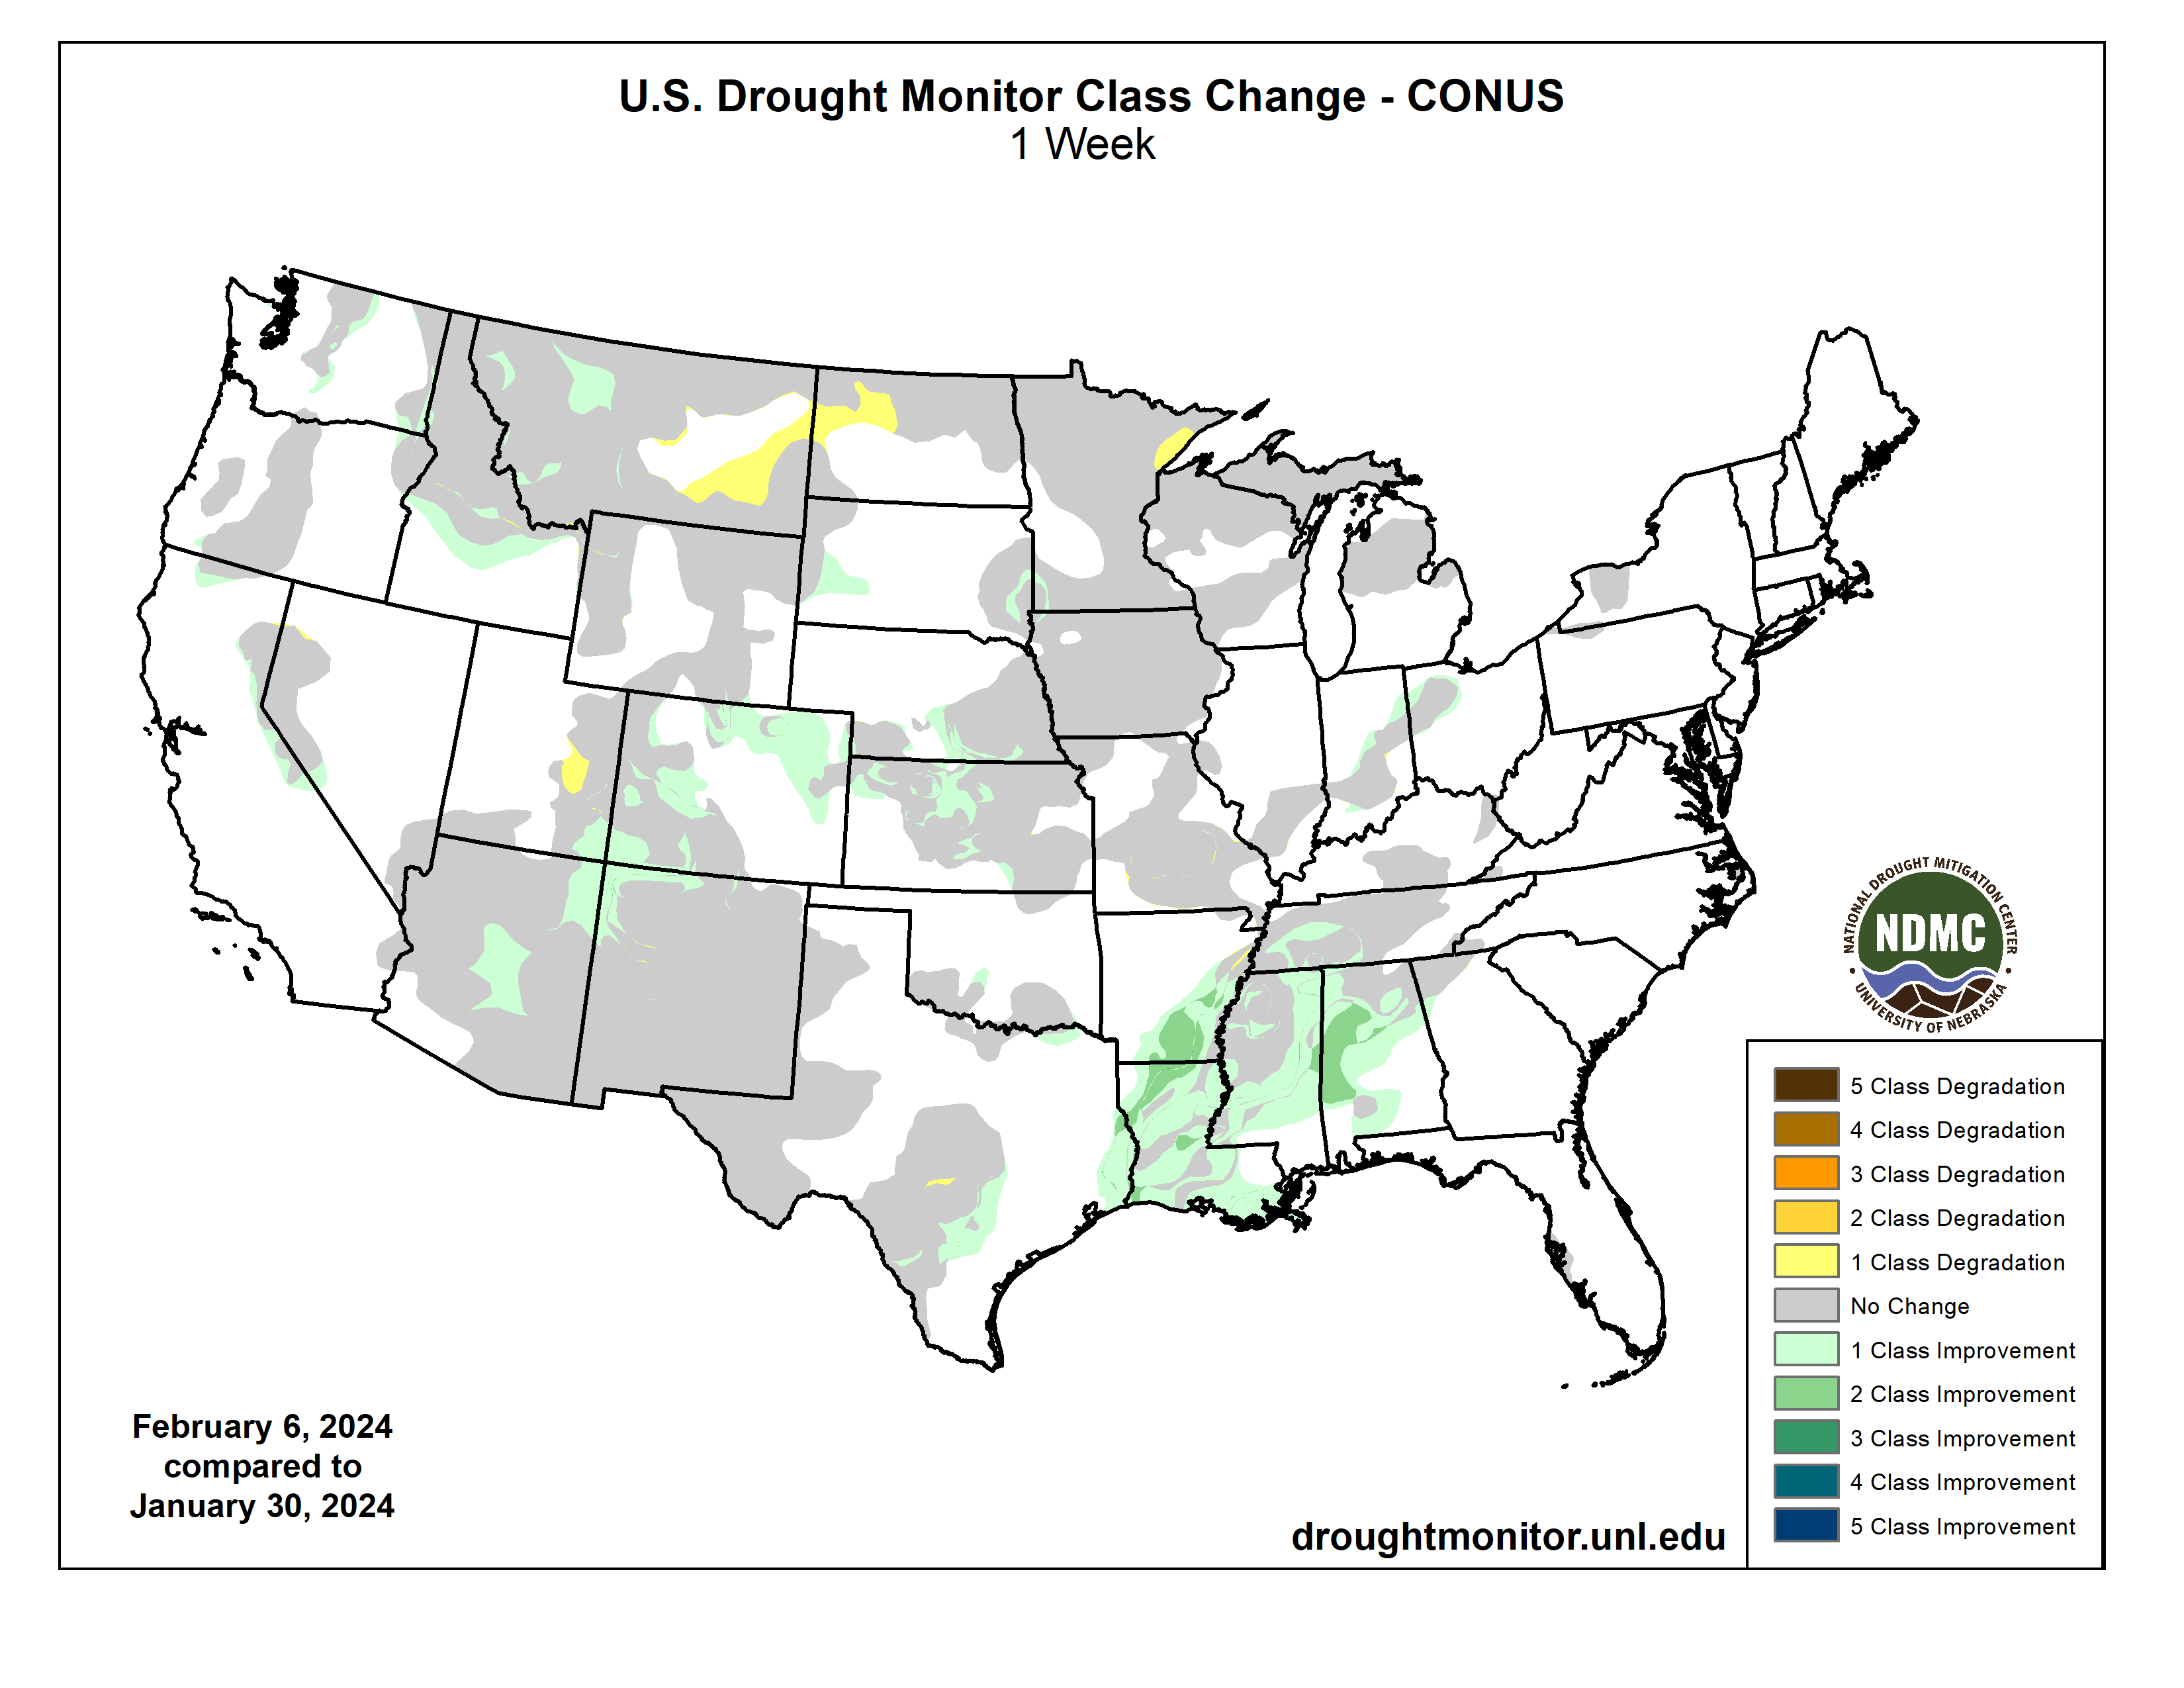
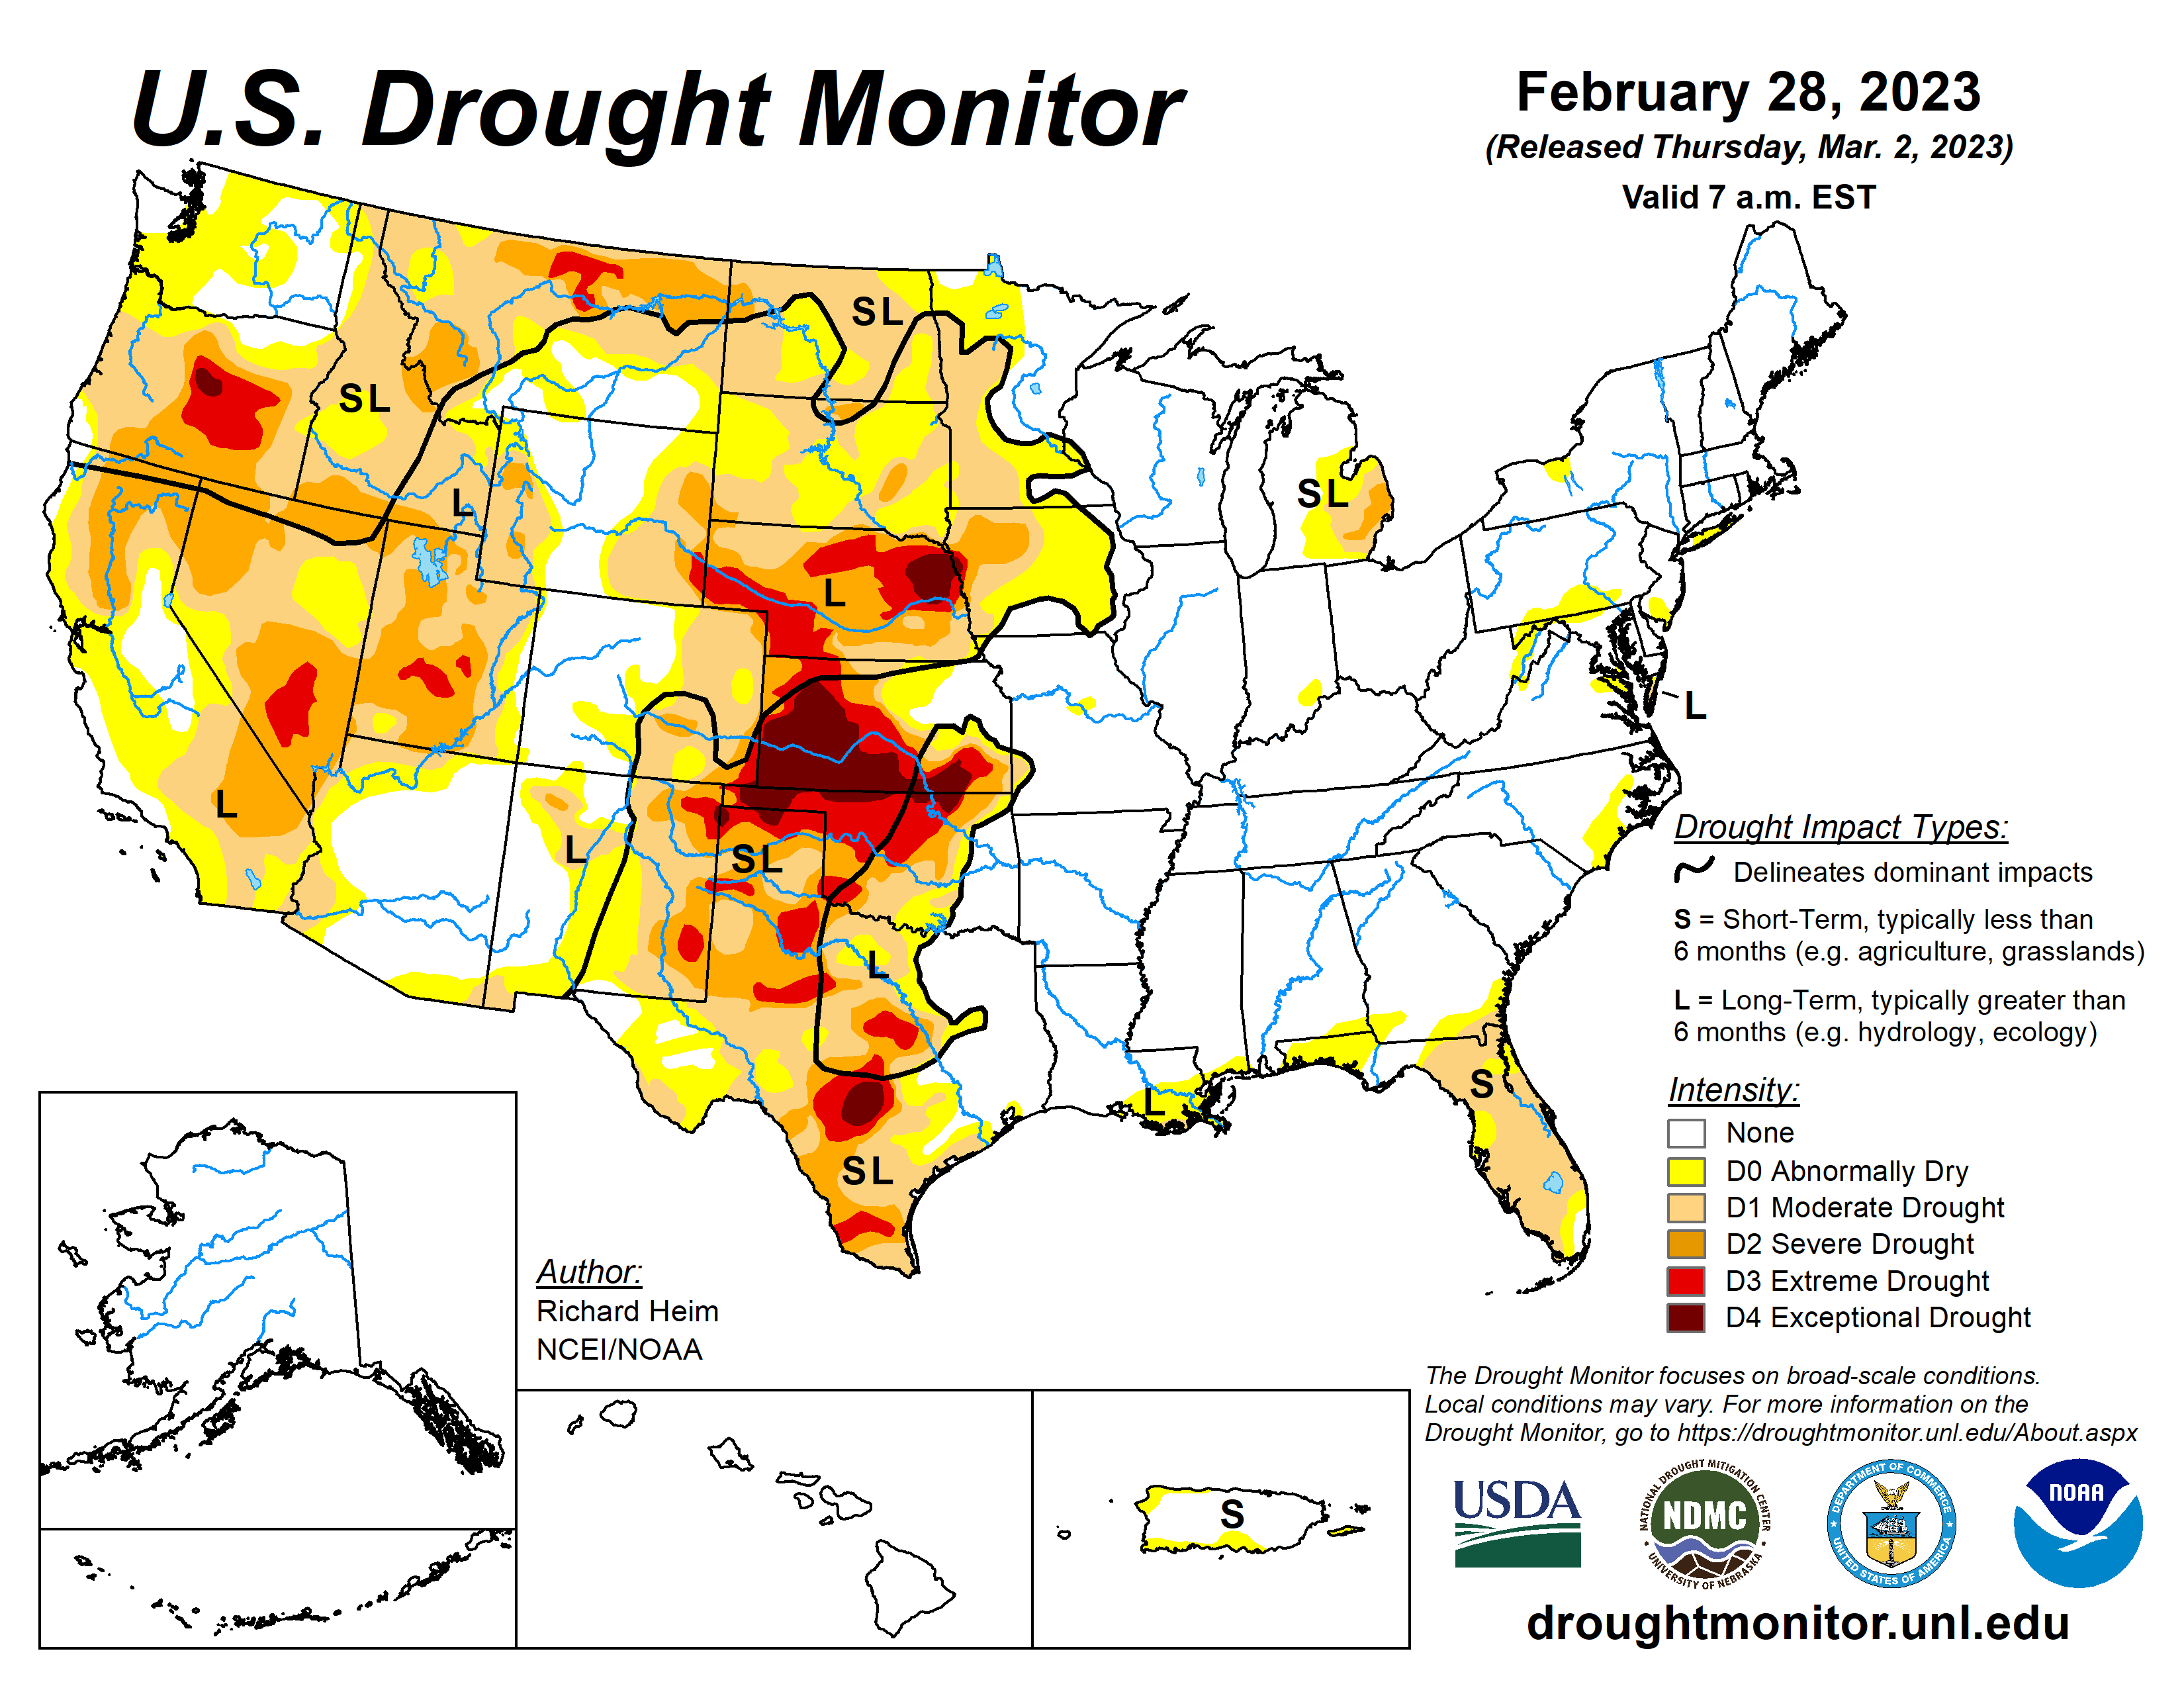


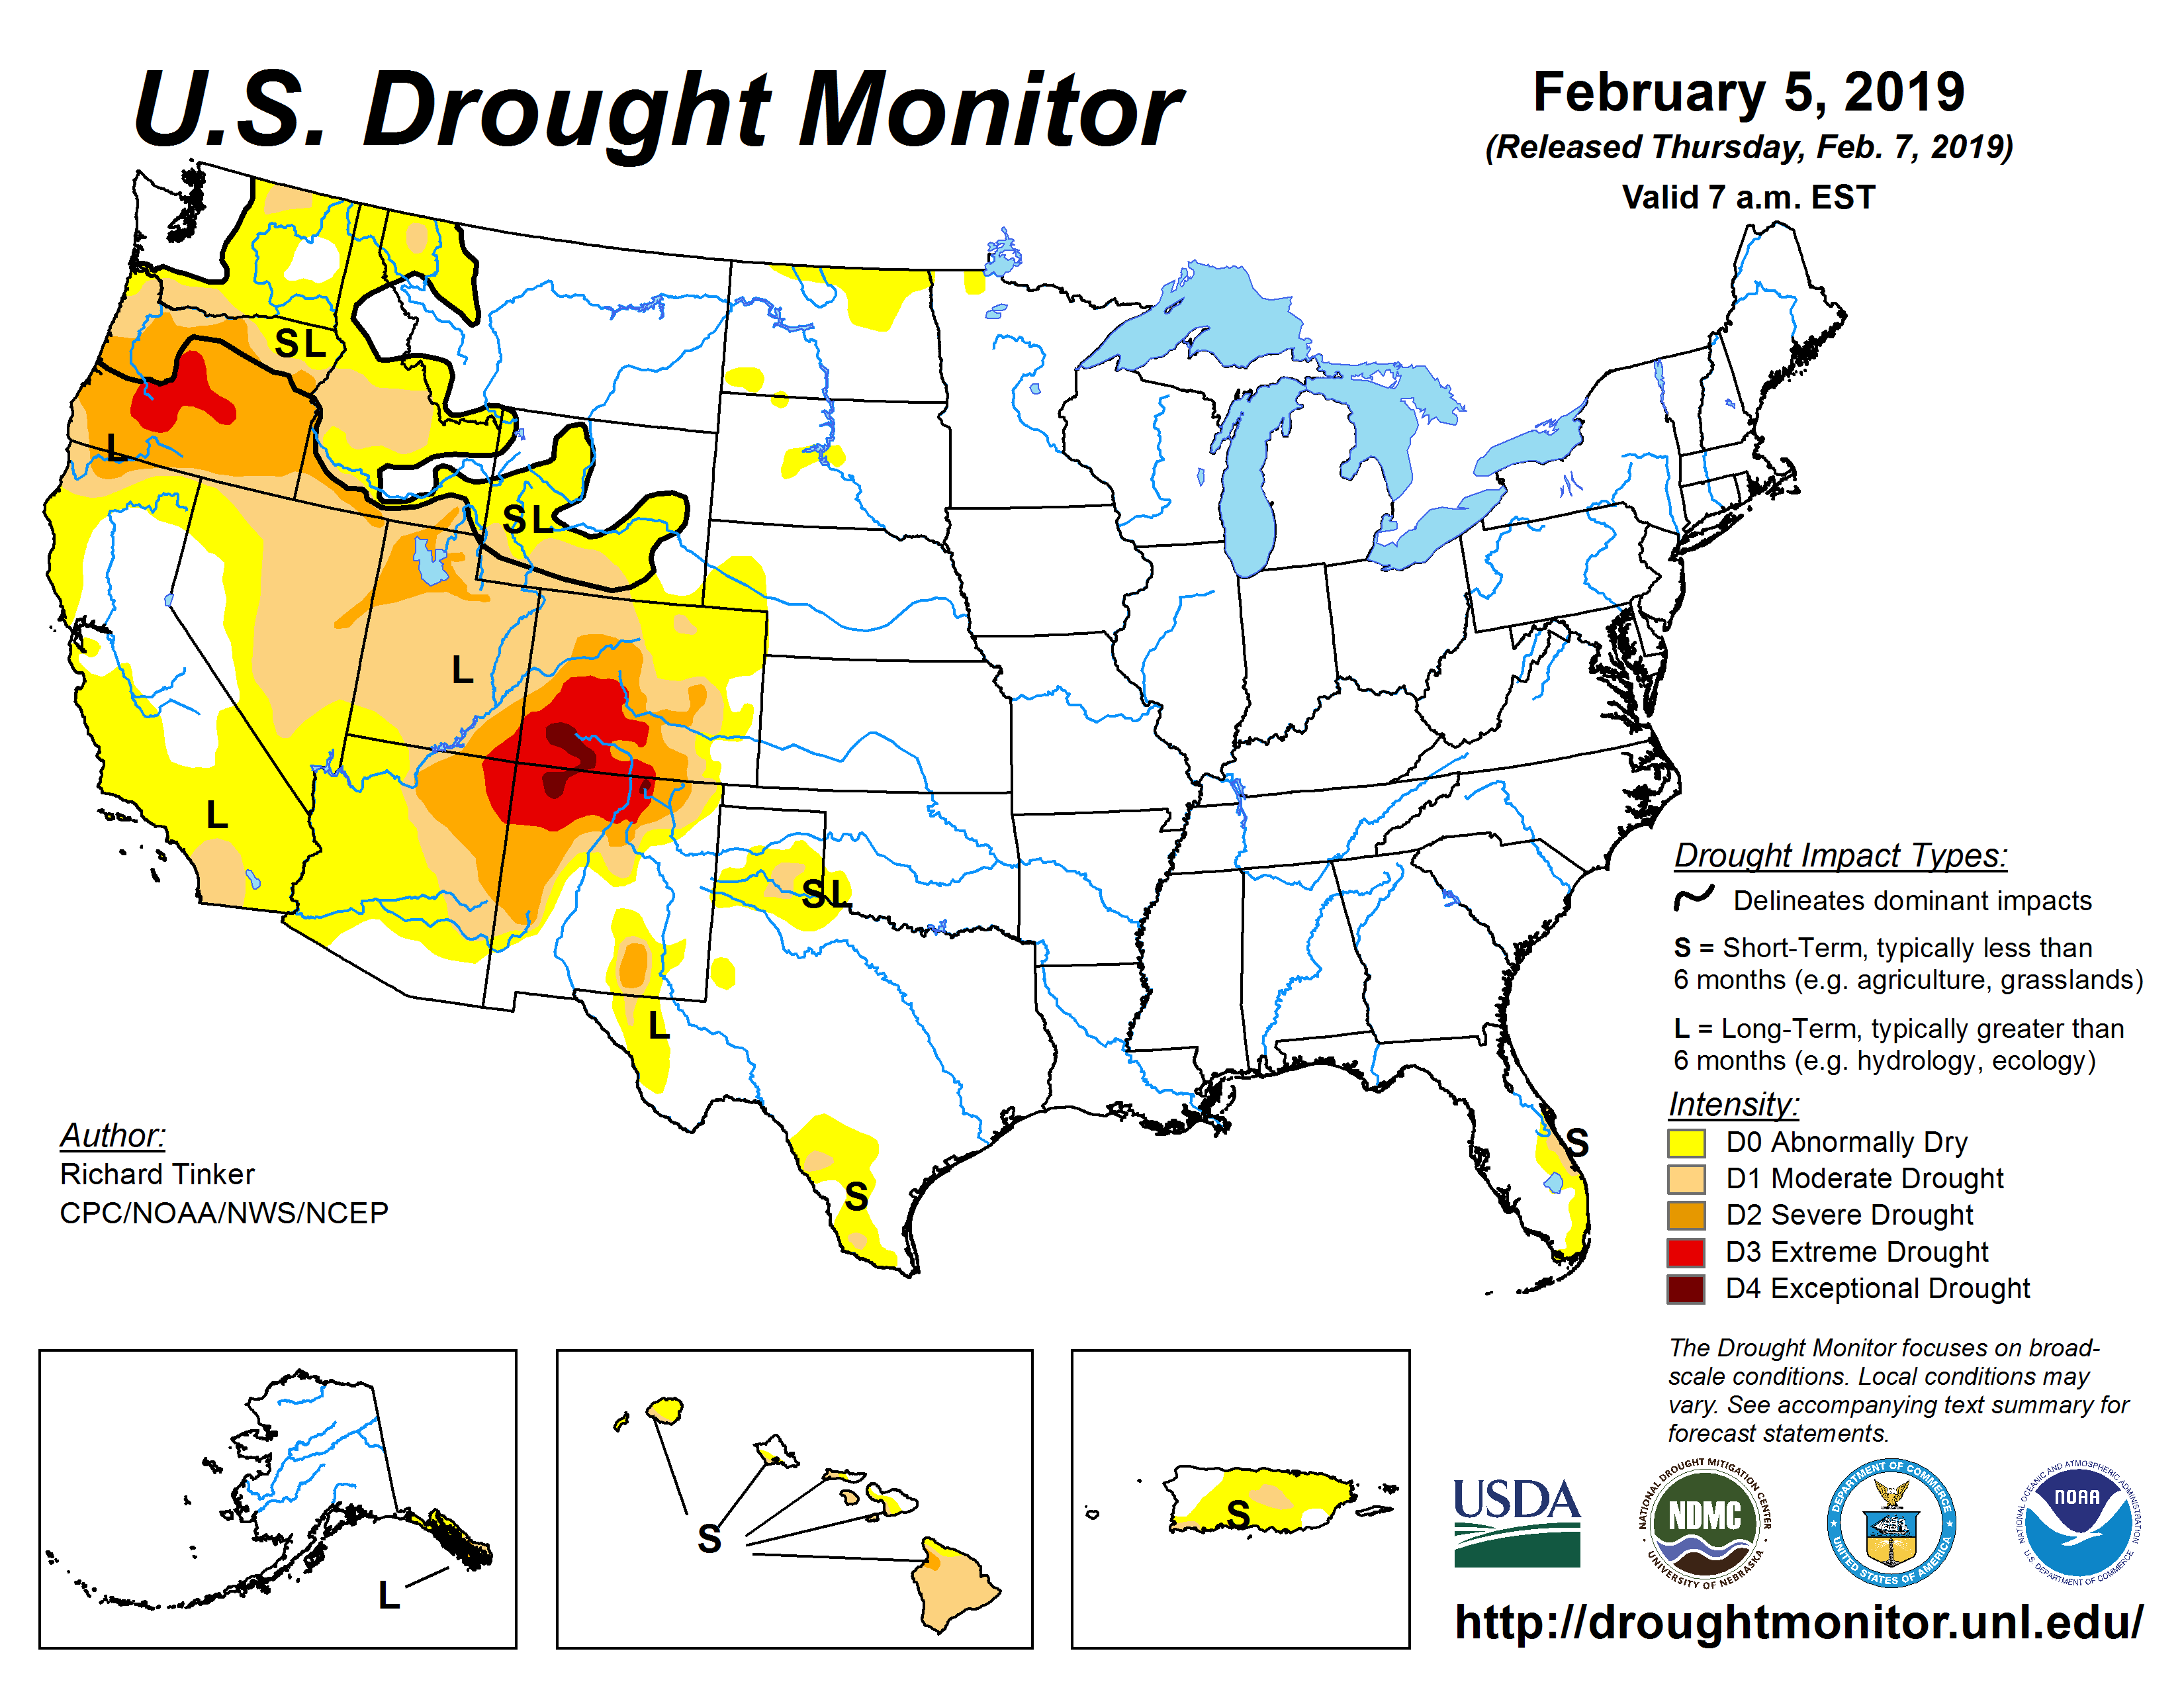

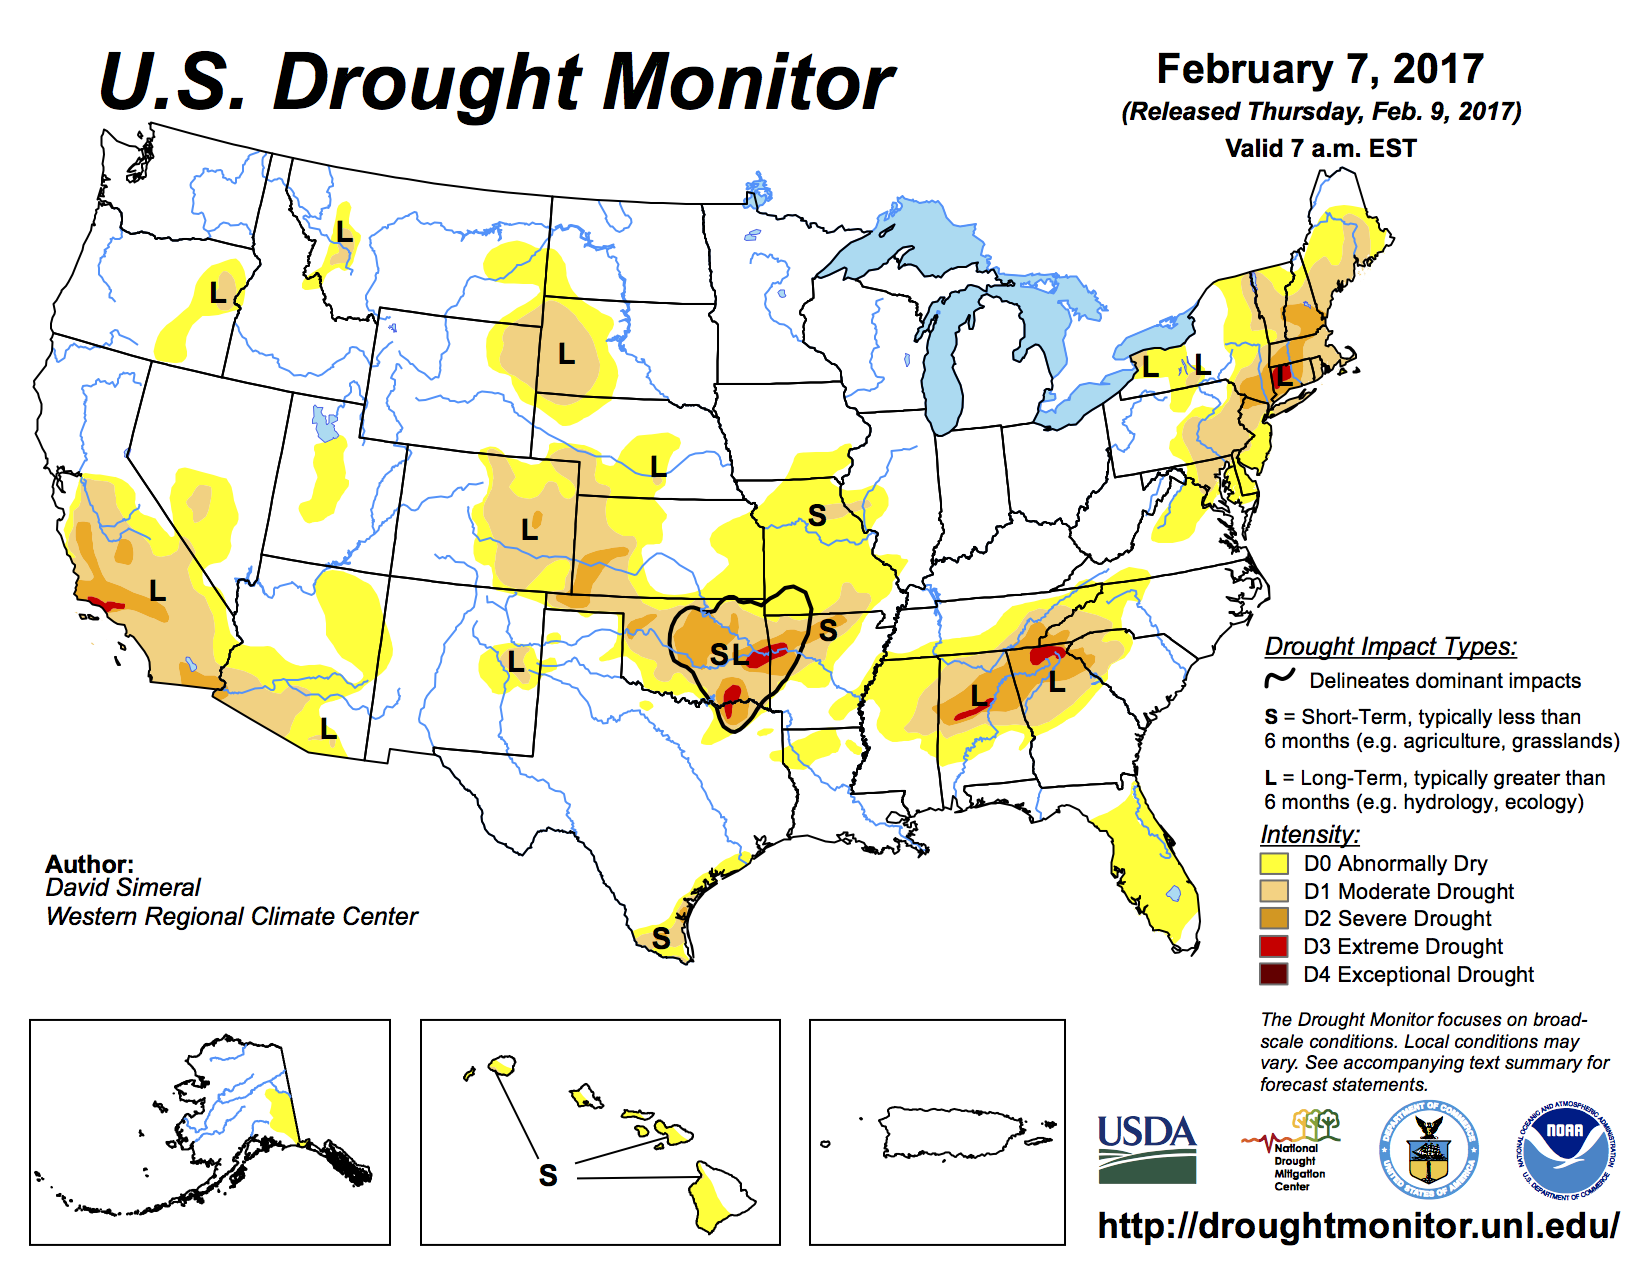
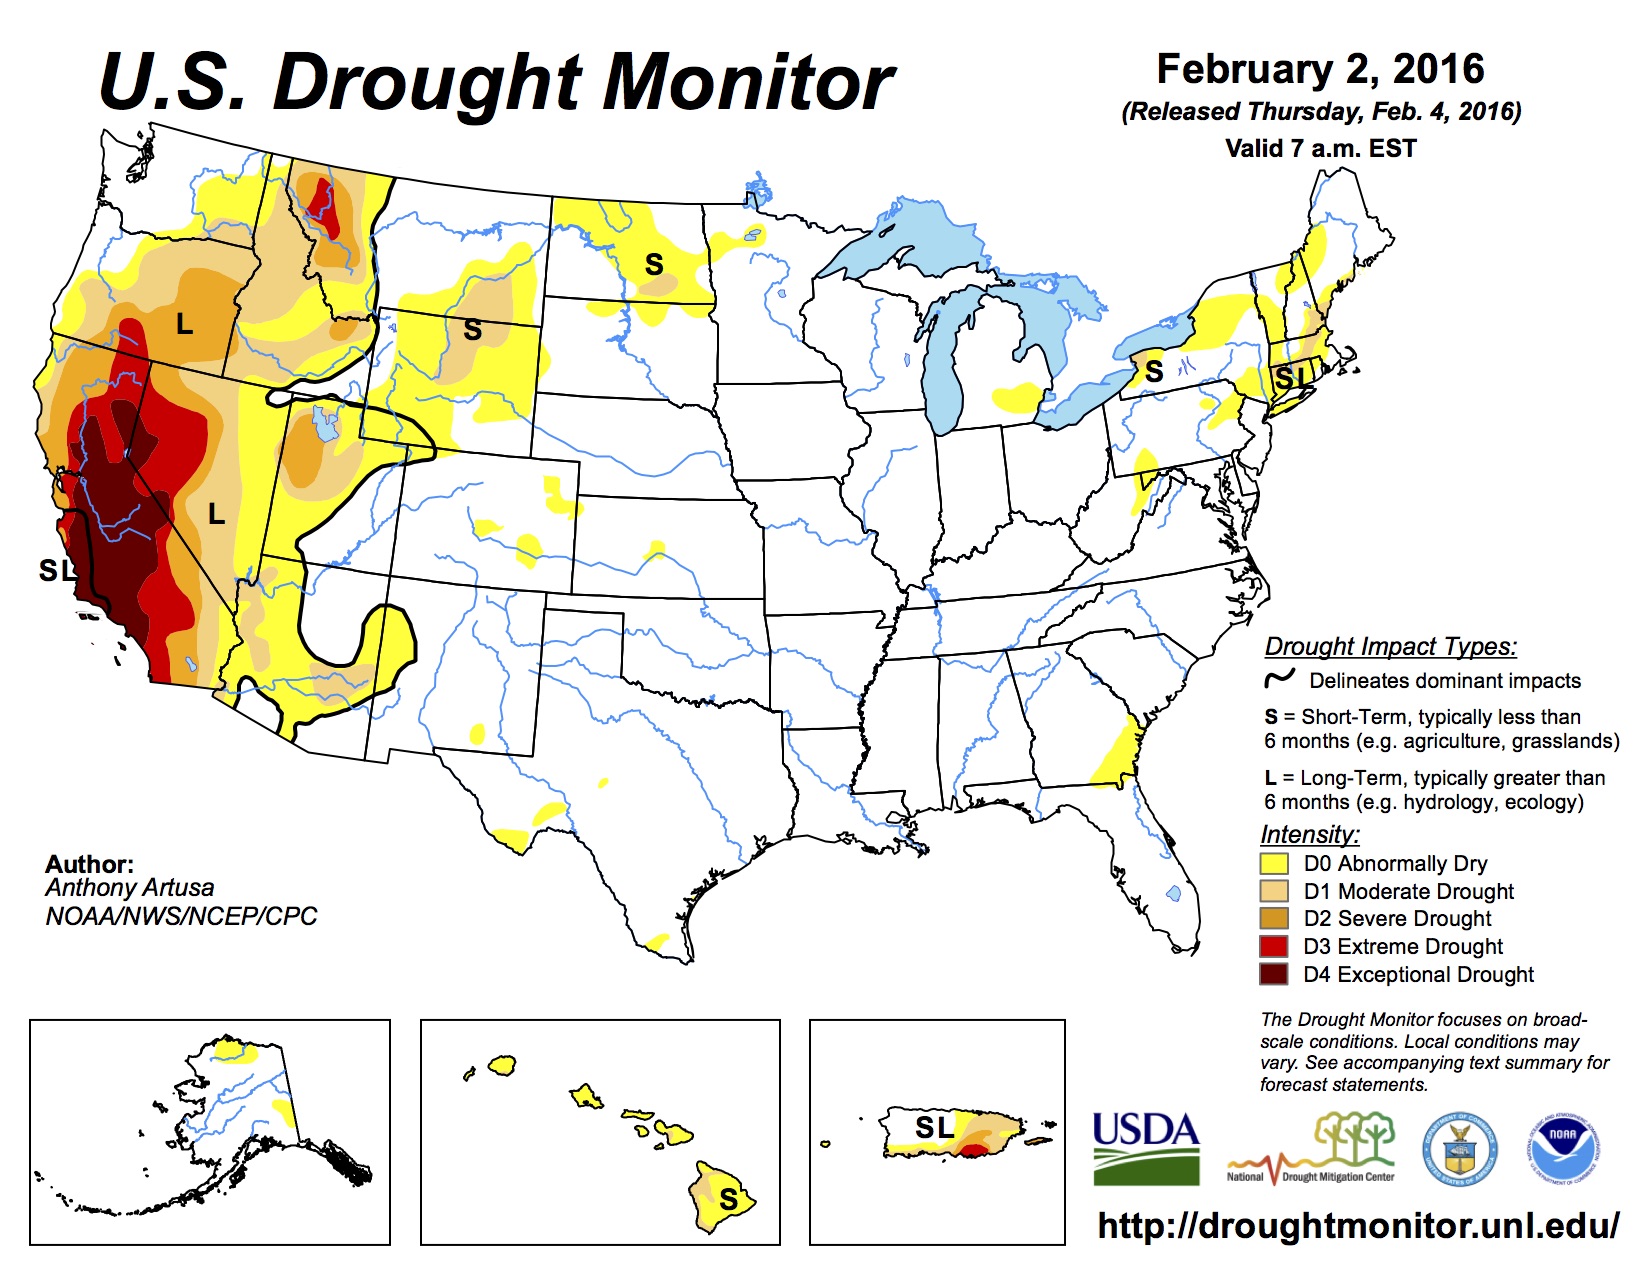
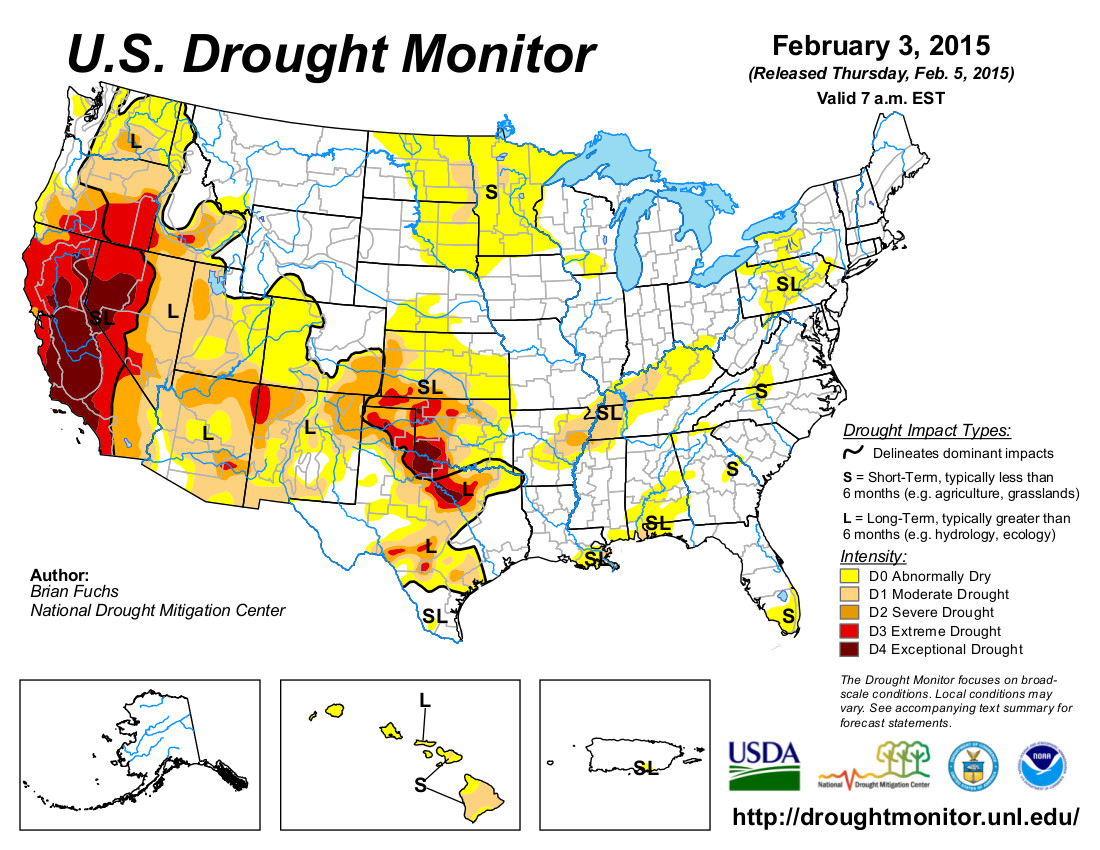

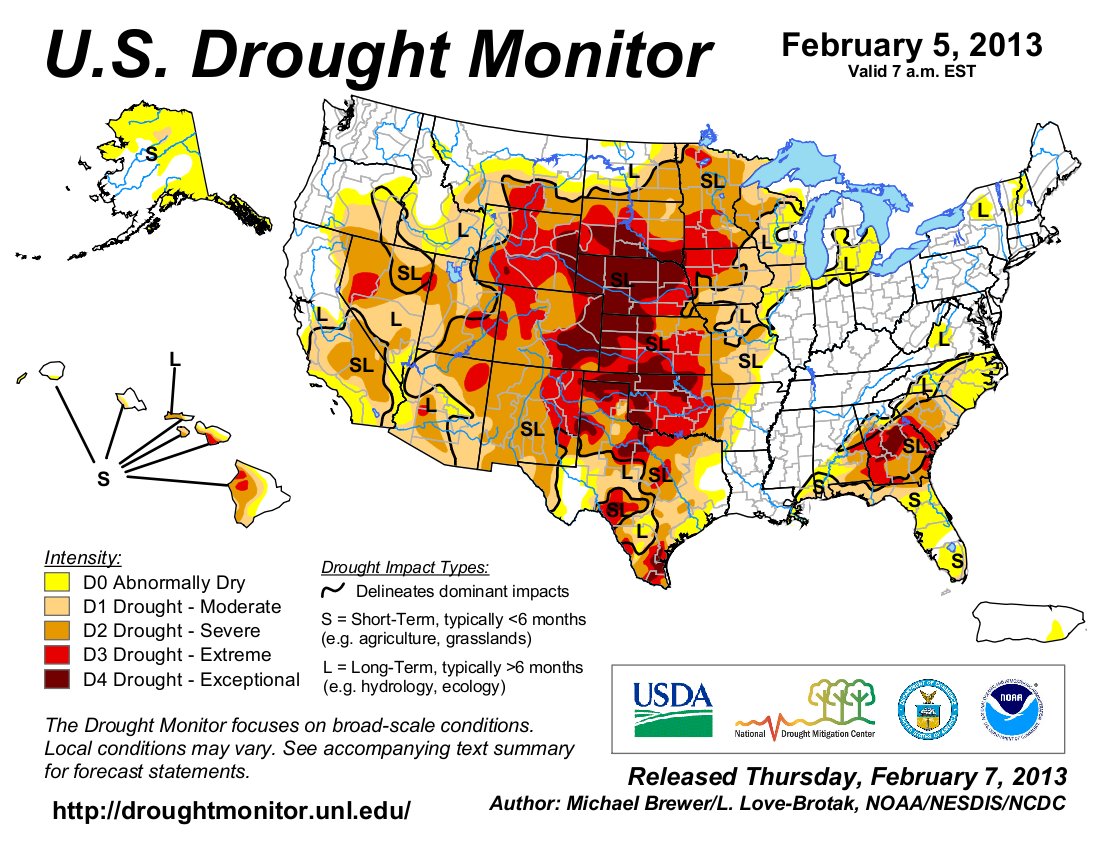
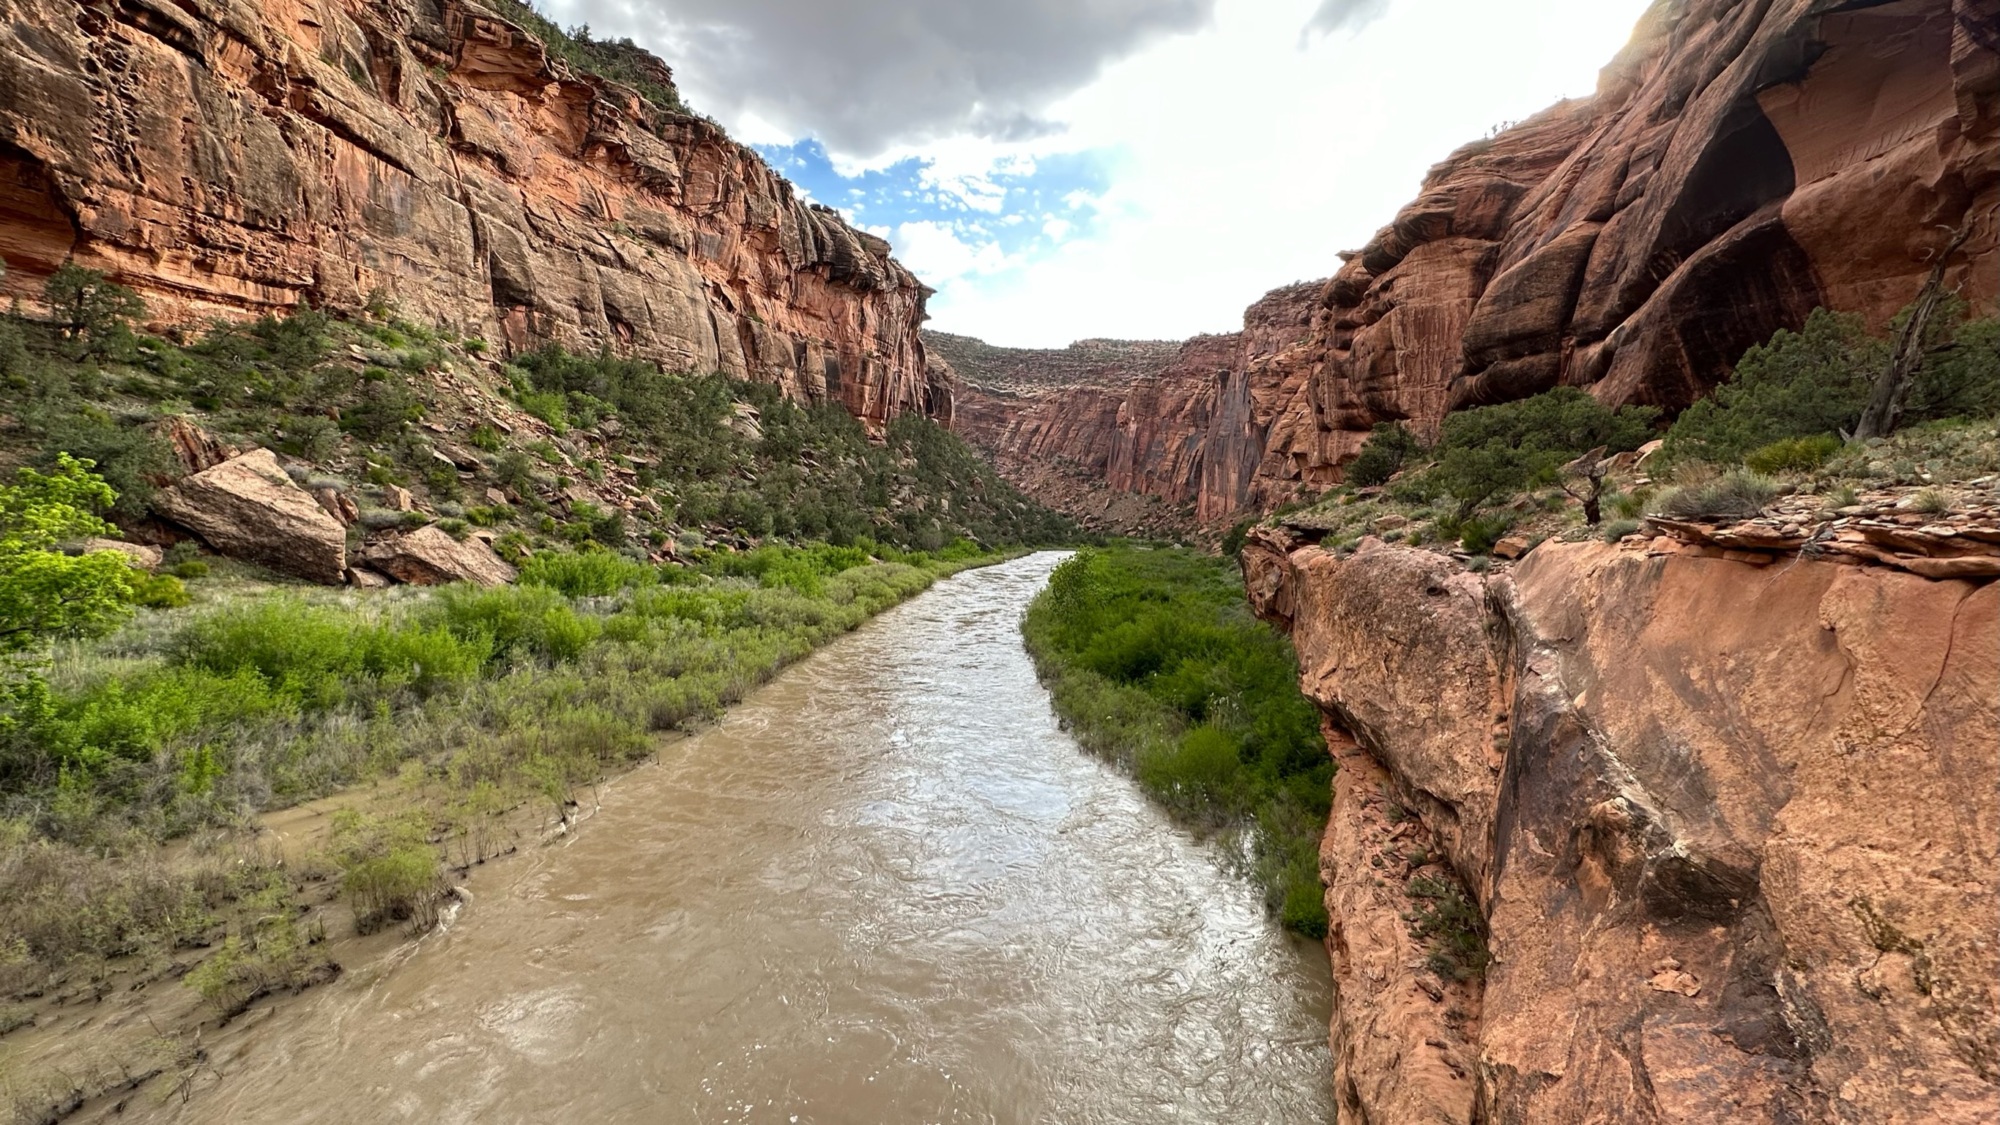


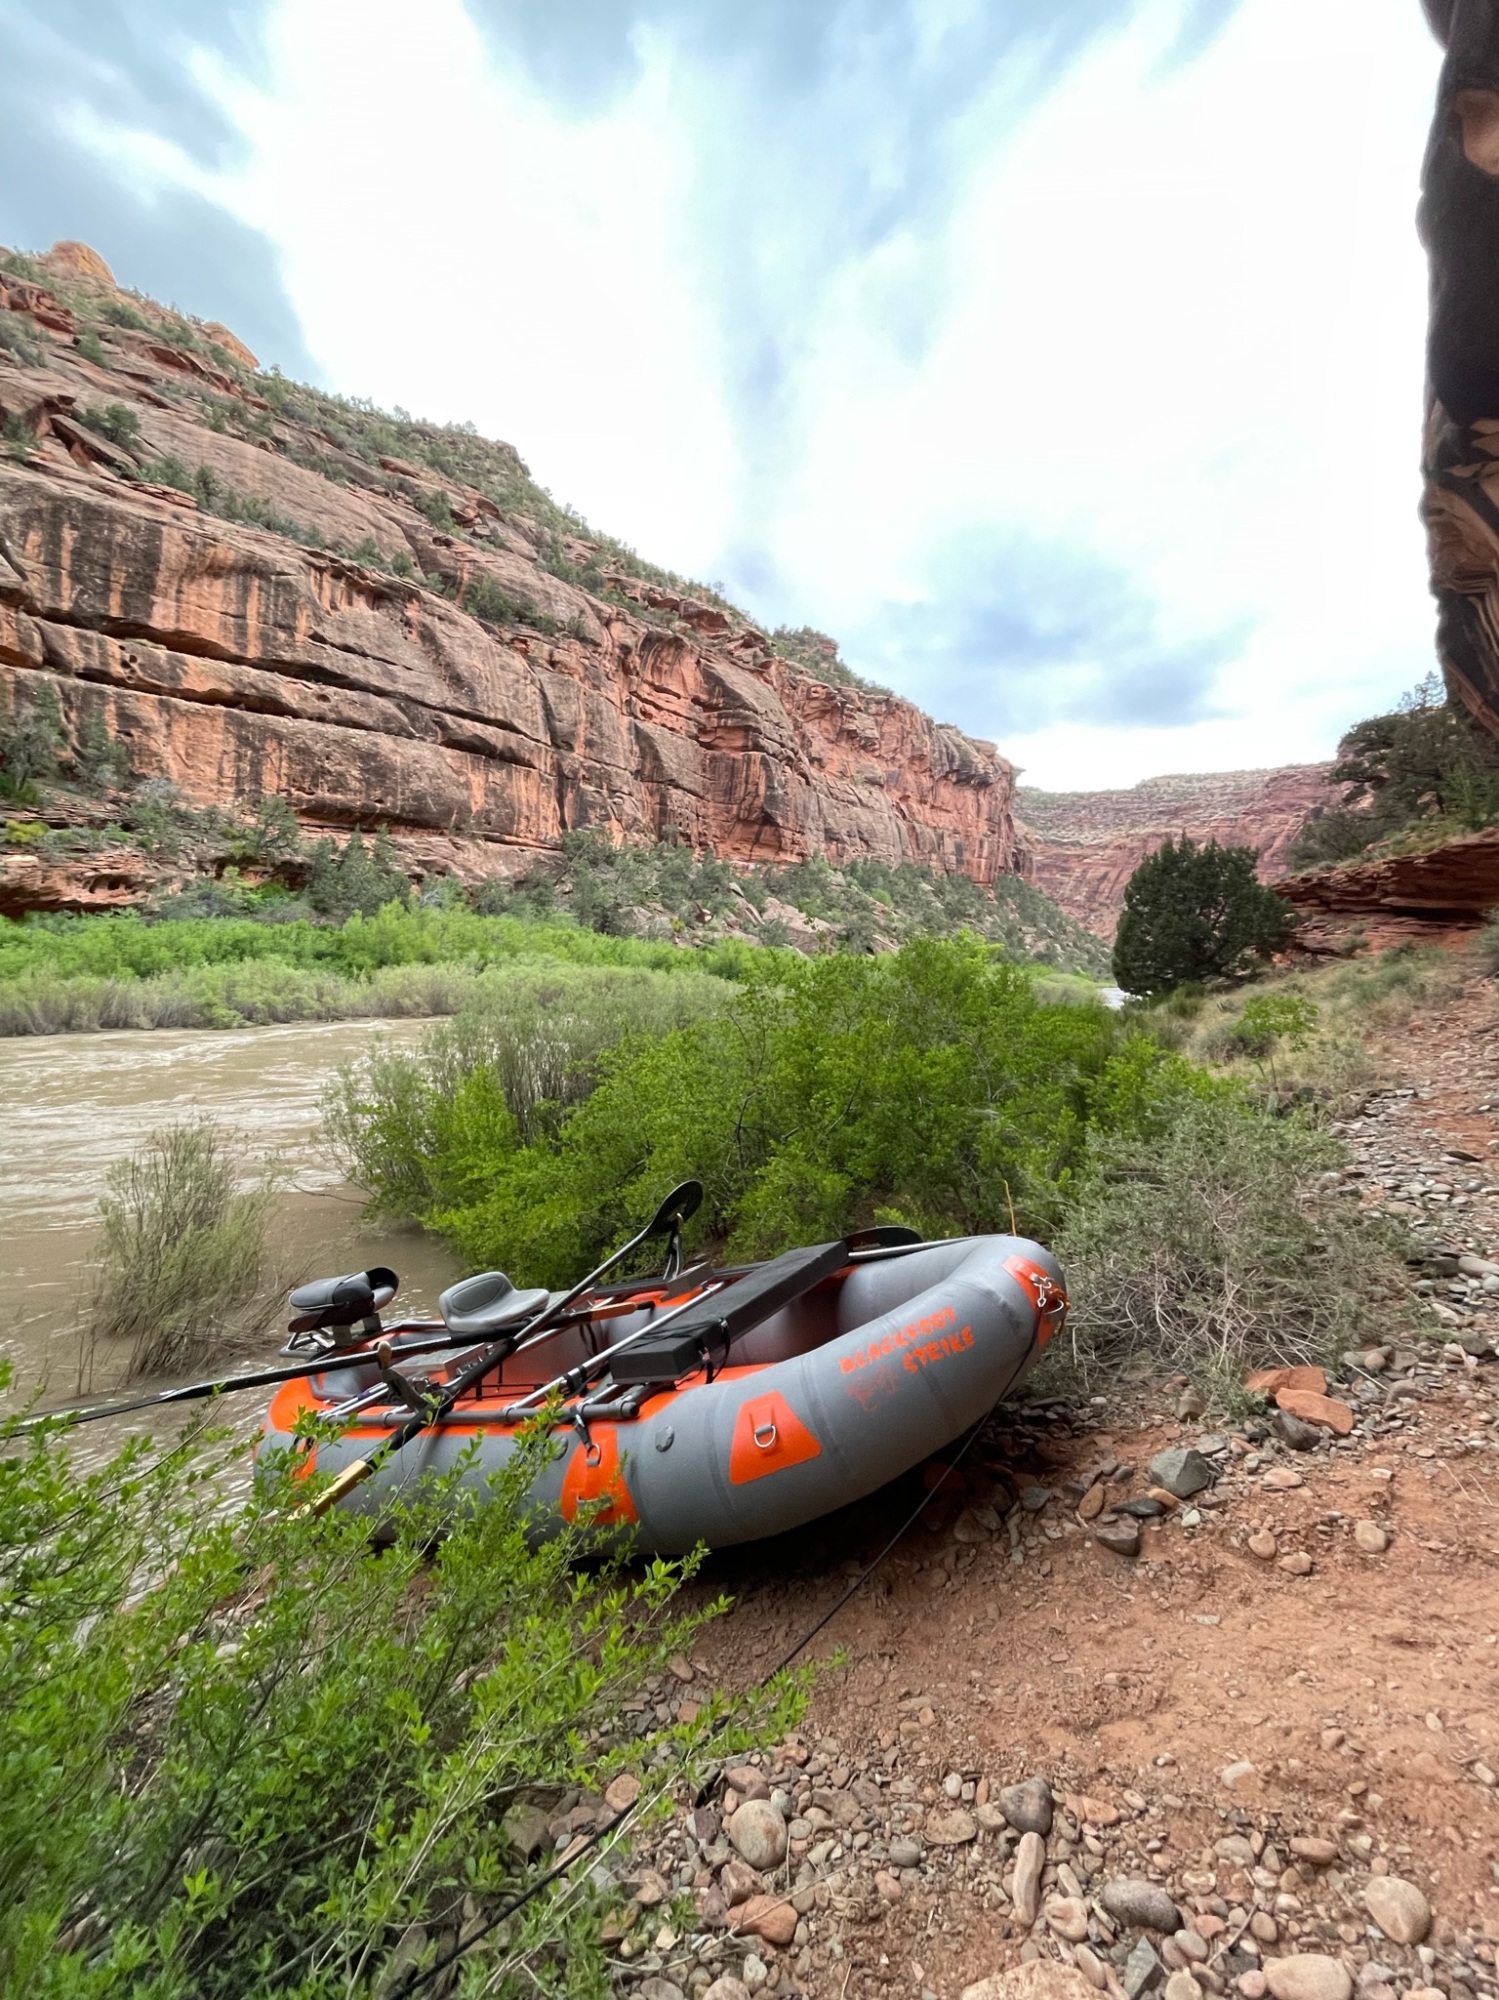

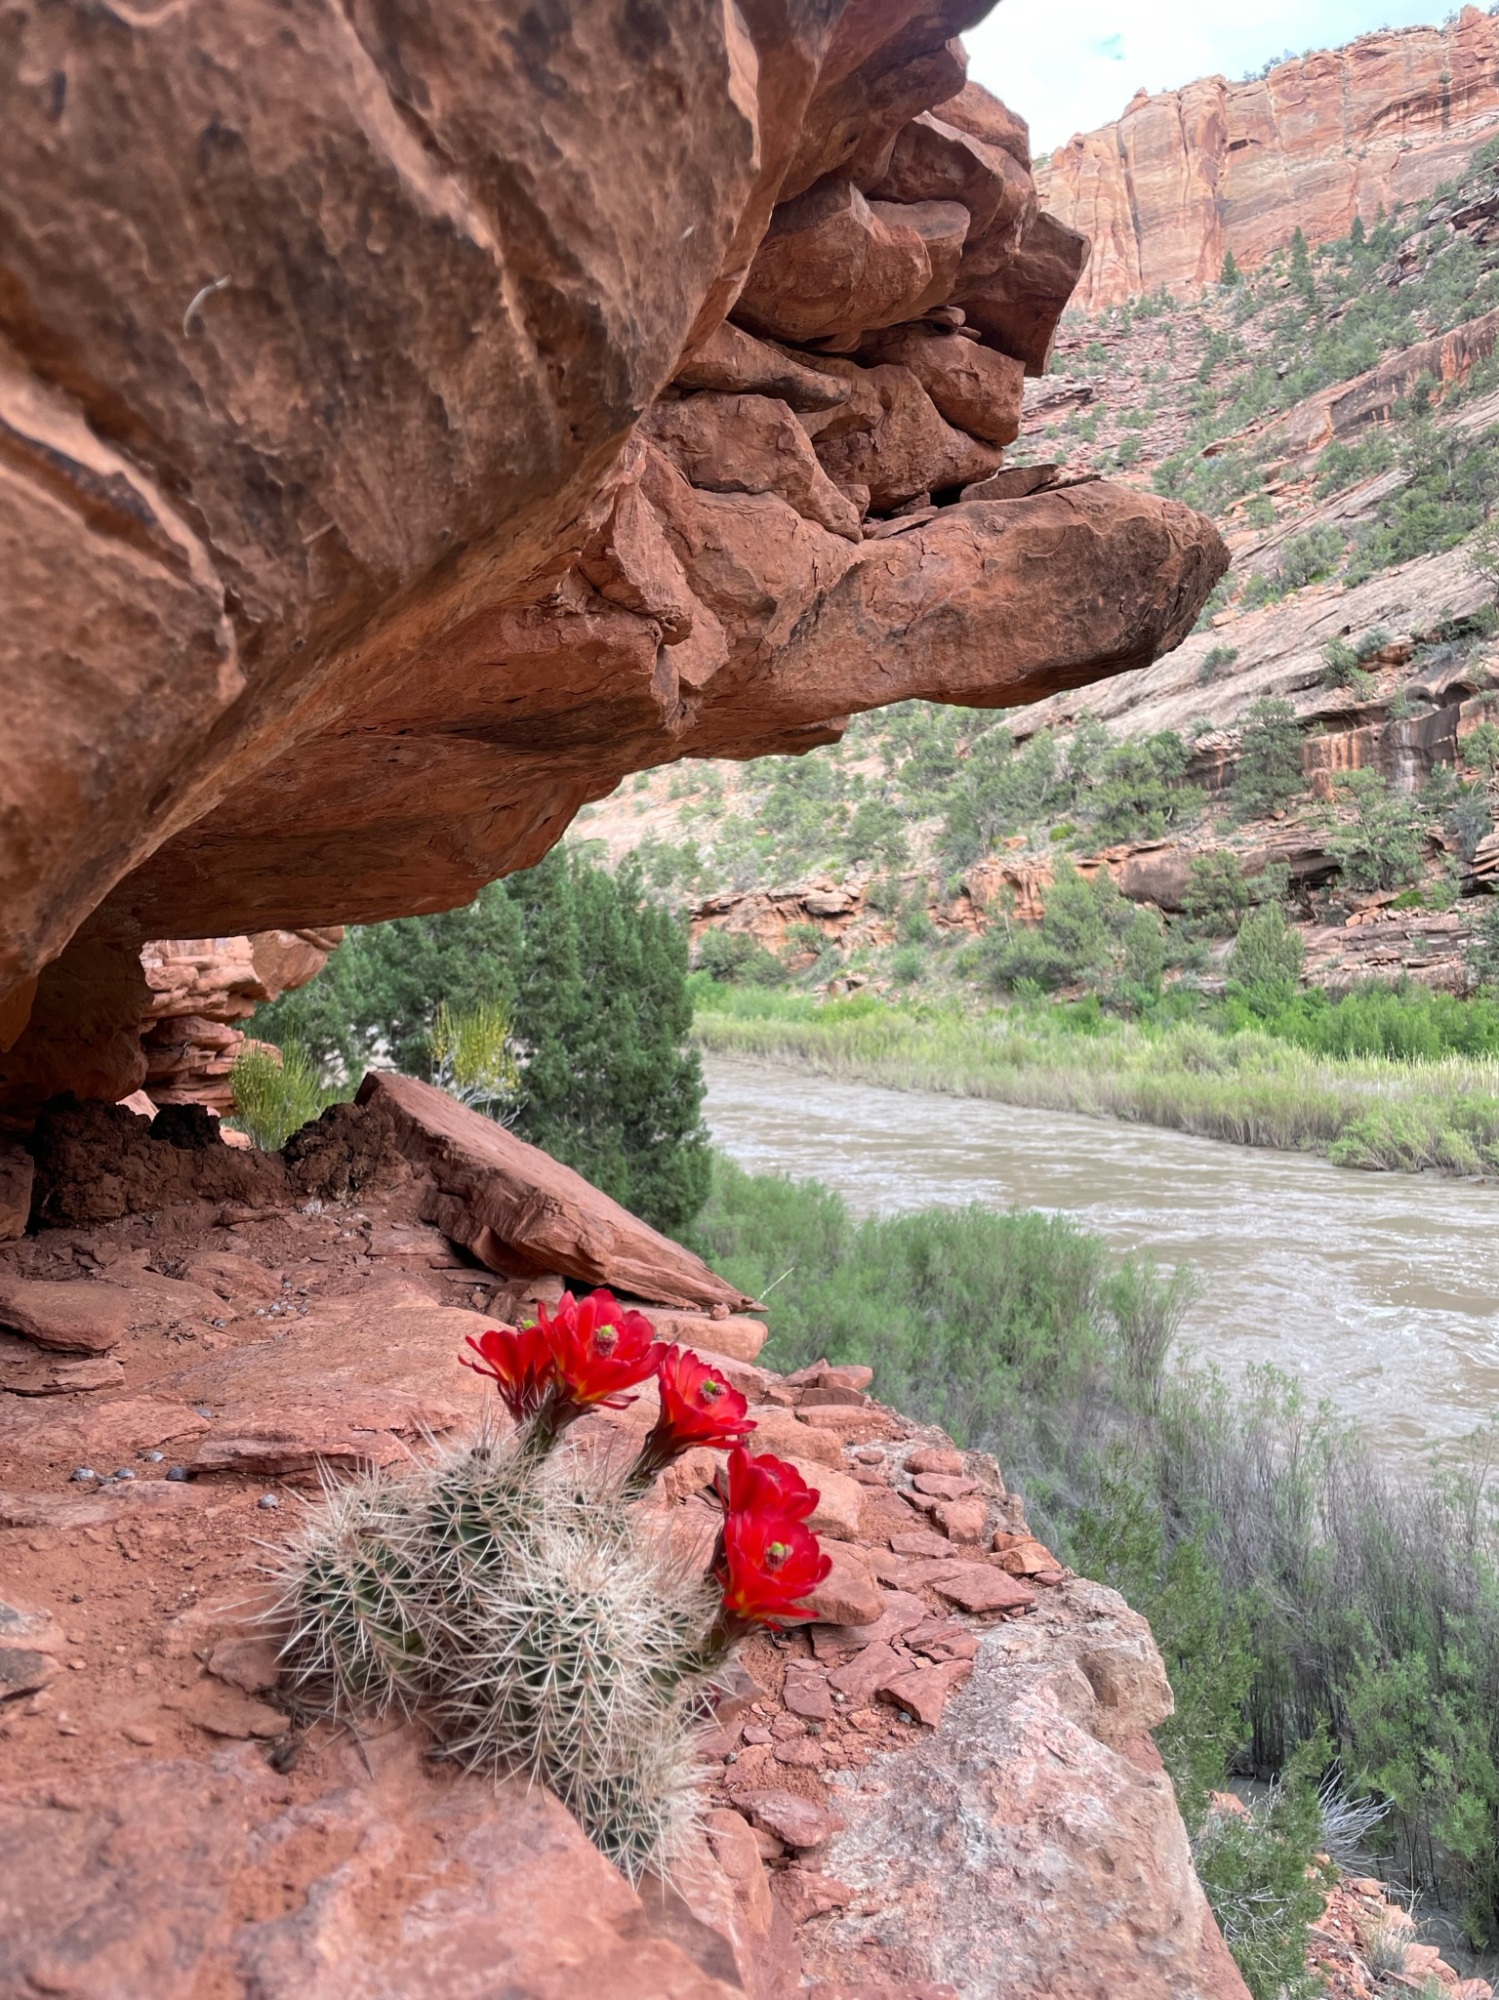

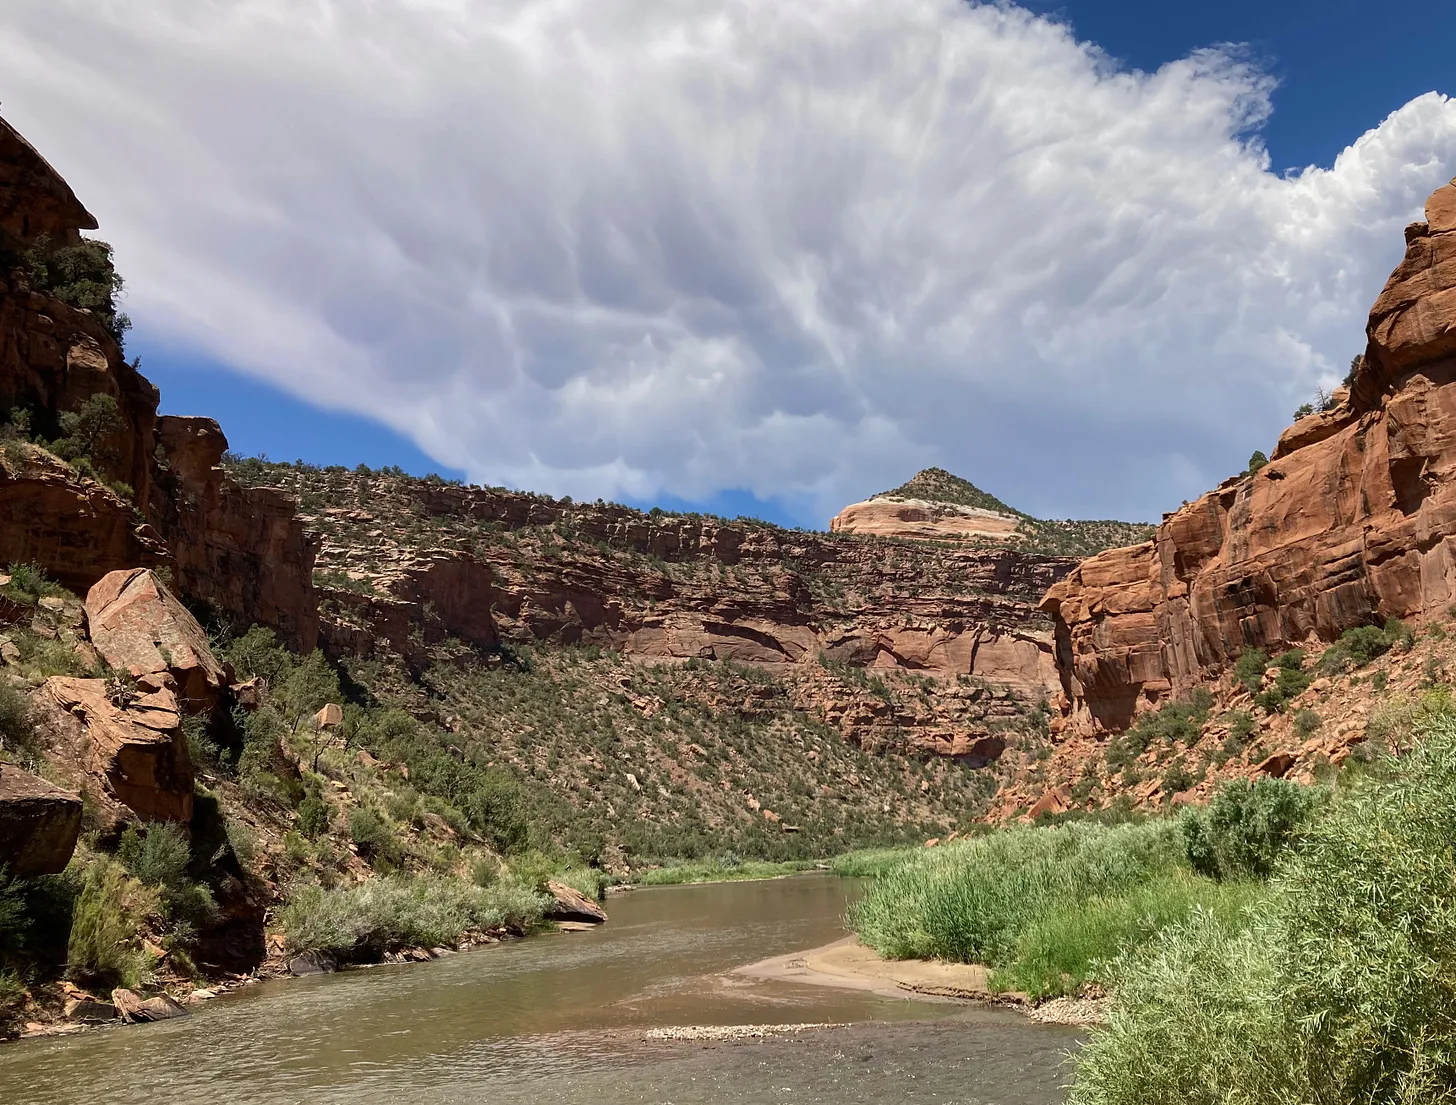


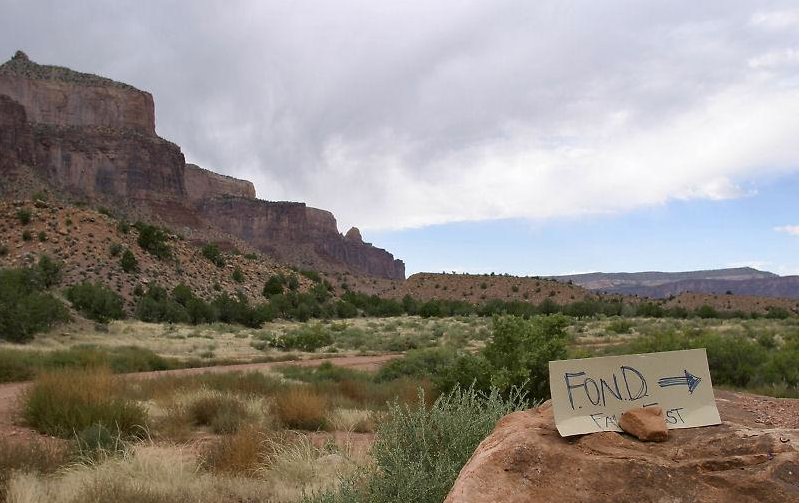


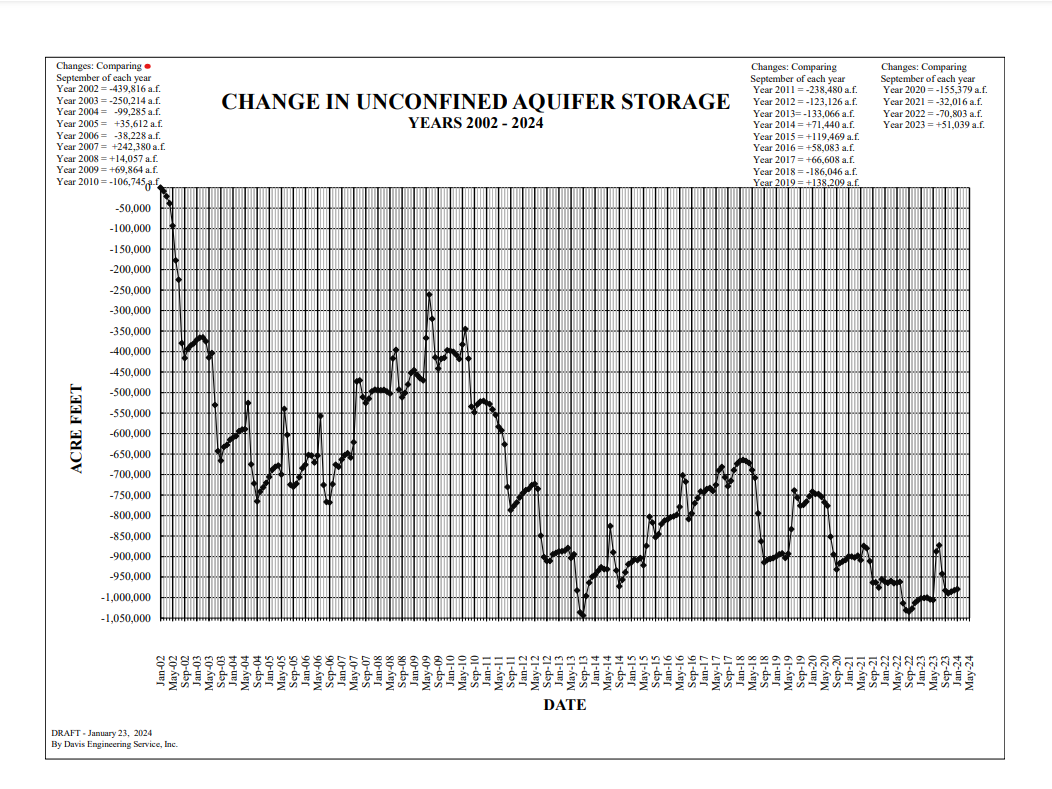
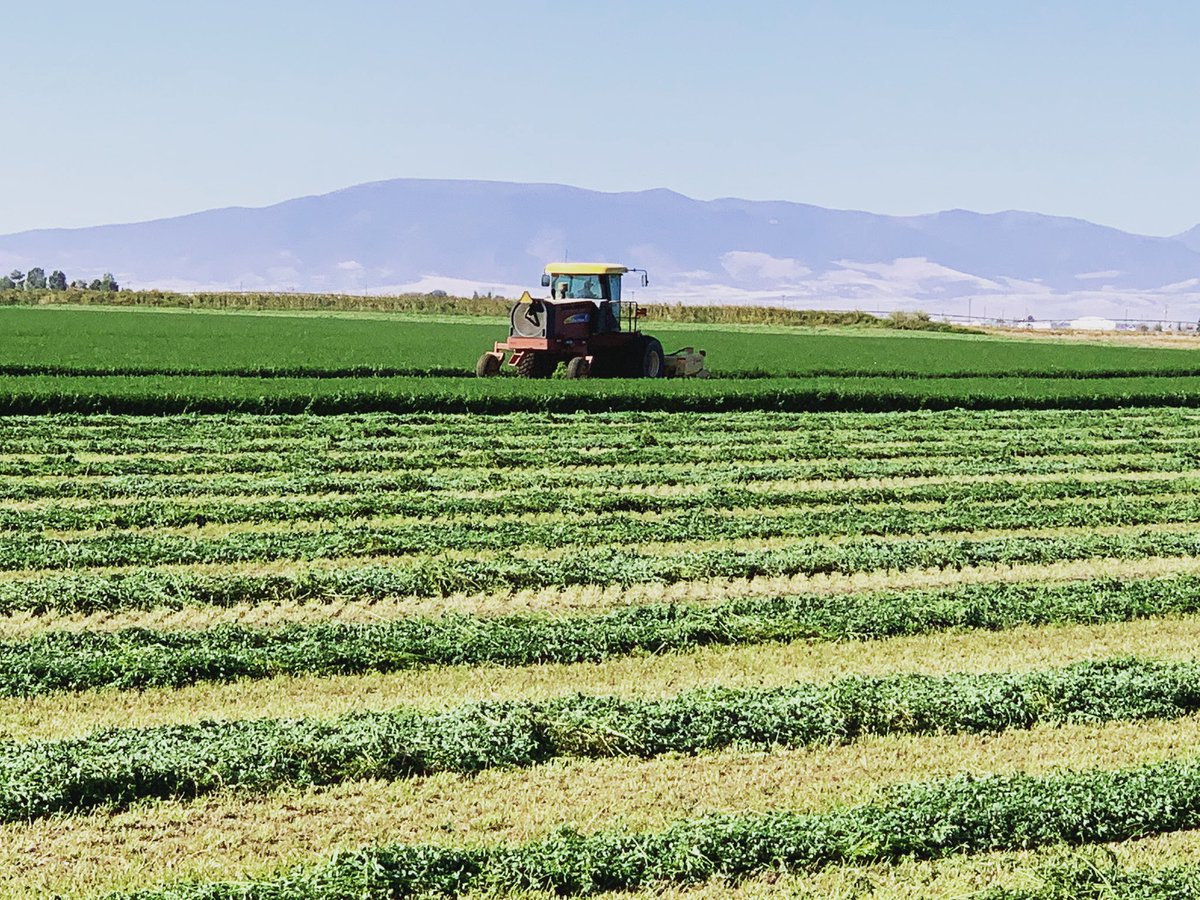


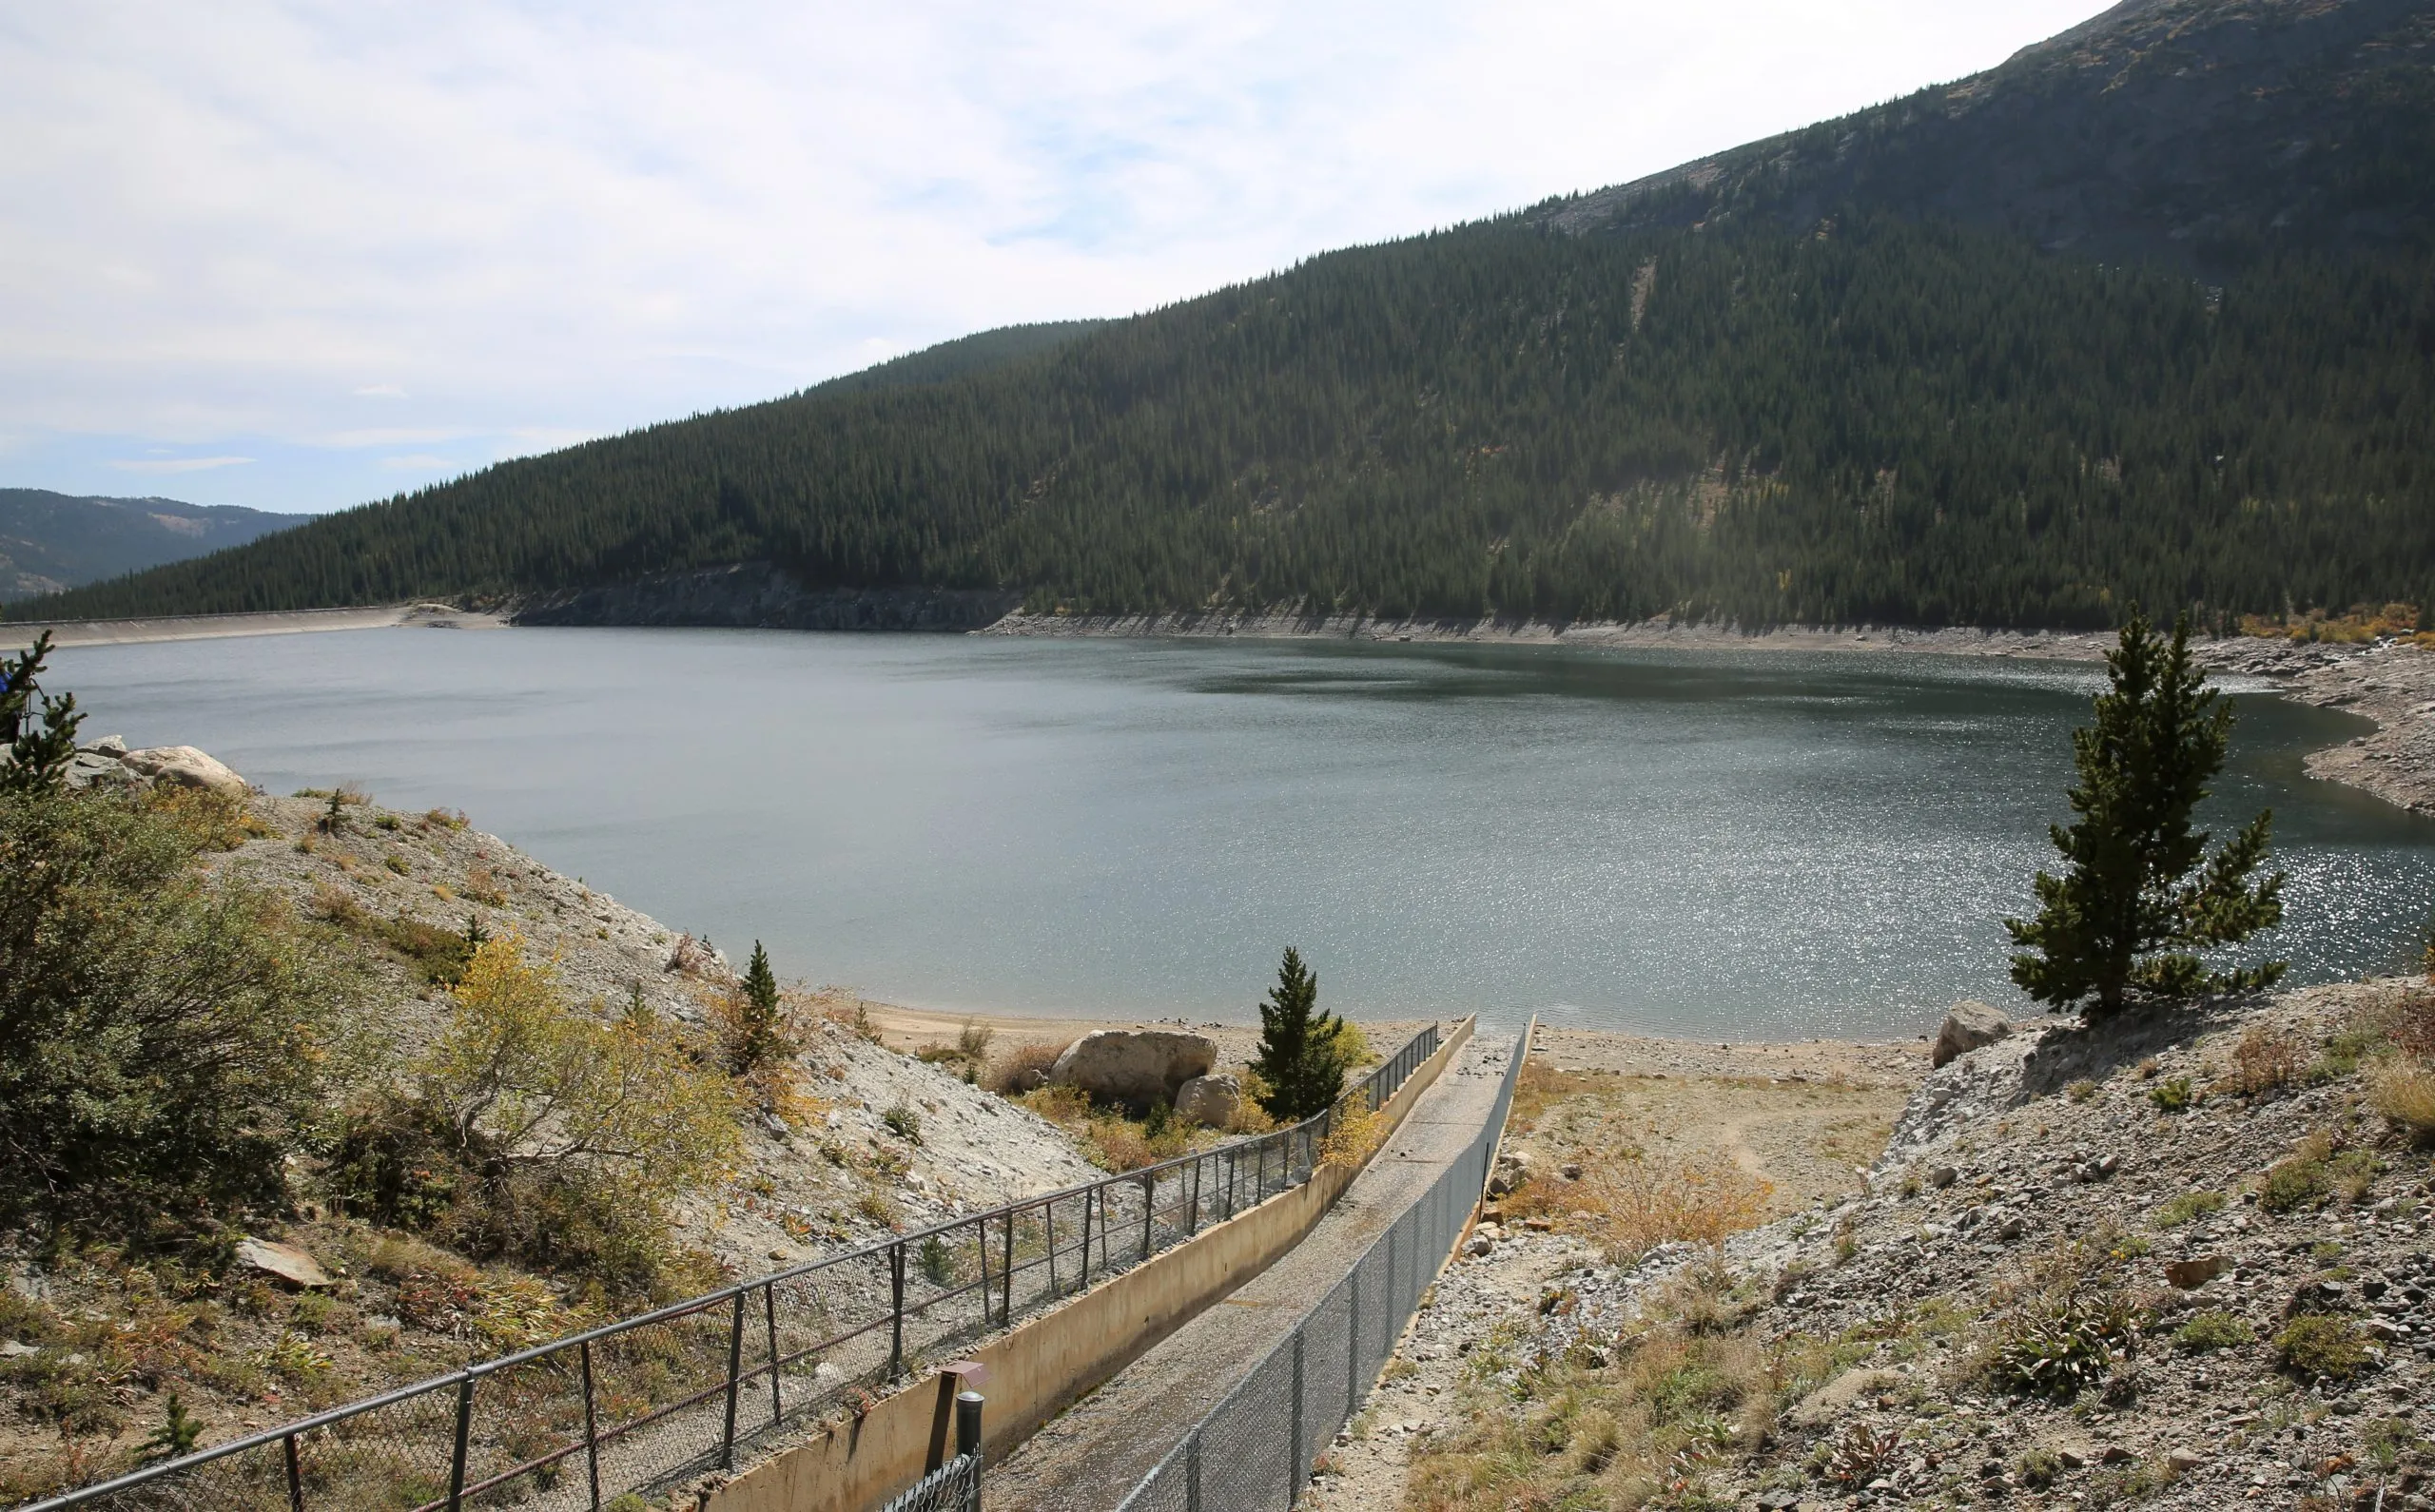


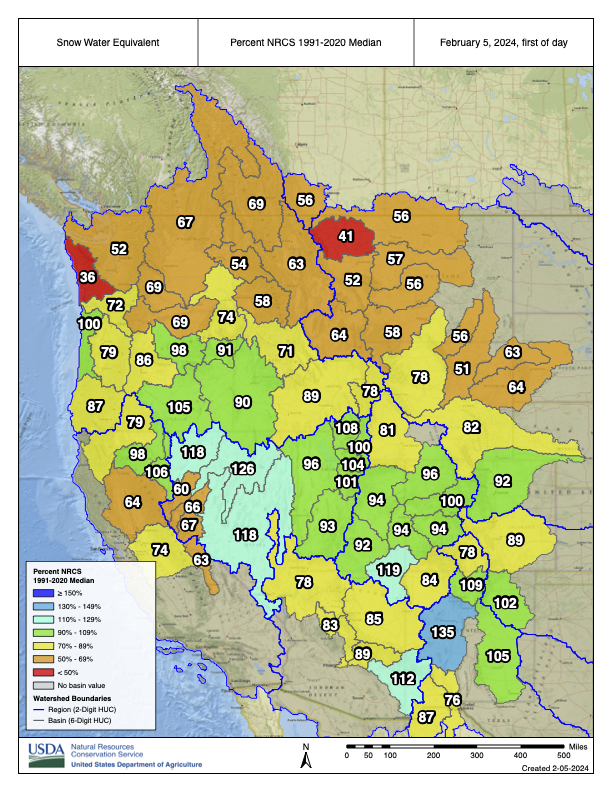

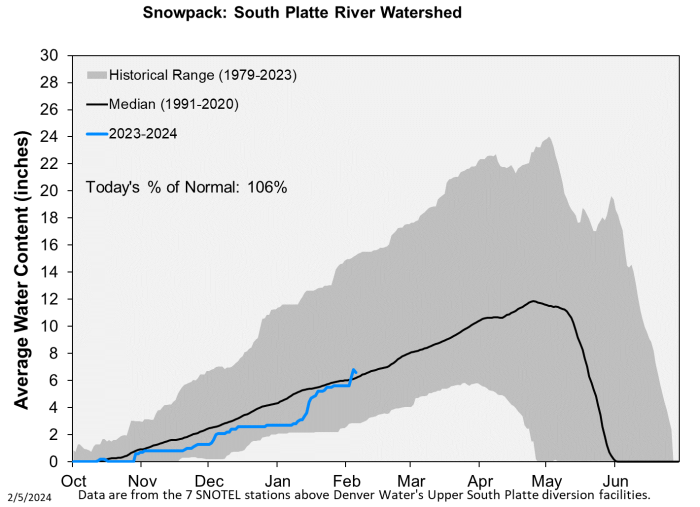

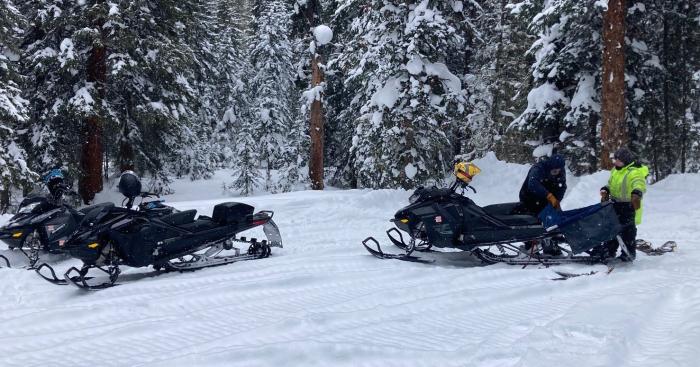
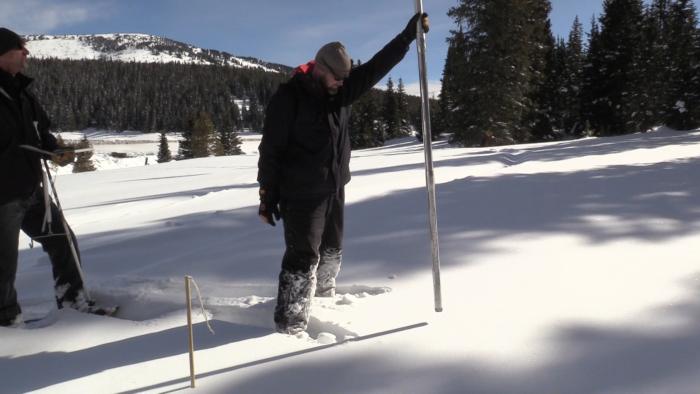

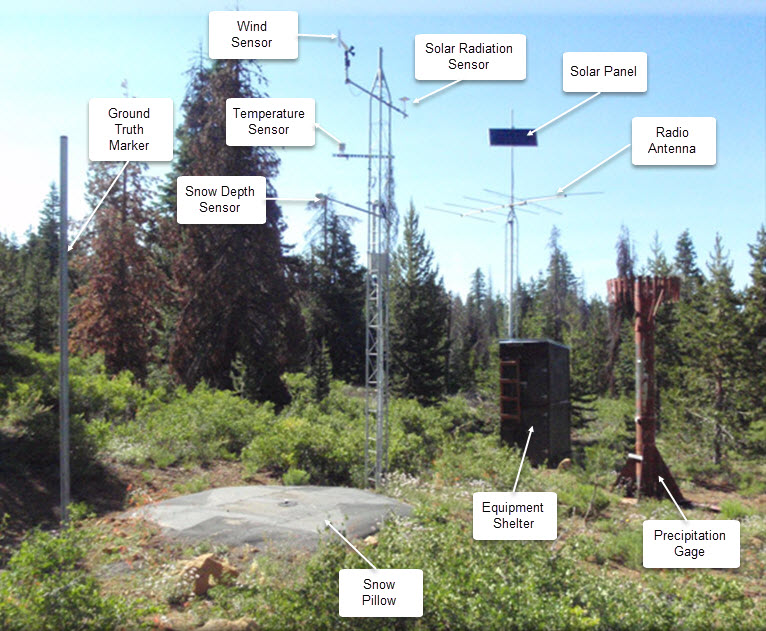
