
Click the link to read the article on The Land Desk website (Jonathan P. Thompson):
August 7, 2026
🌞 Good News! 😎
It’s safe to say that the Trump administration has been waging a war on solar and wind energy, both to spite its political adversaries and to bolster the fossil fuel industries.
After all, it froze utility-scale solar and wind permitting on public lands; cut federal tax incentives for both utility-scale and rooftop solar; clawed back federal grants for clean energy manufacturing, transmission upgrades, and climate programs; spent $4 billion (so far) in taxpayer funds to pay offshore wind developers to give up their leases; and halted Defense Department reviews of proposed onshore wind developments, thus stalling them indefinitely. That an administration is actively quashing new energy development even as it declares an “energy emergency” to try to prop up the dying coal industry and further pad petroleum corporations’ pockets is especially absurd.
The data show, however, that Trump’s war on clean energy isn’t going much better than the fight he picked with Iran. For one thing, courts keep slapping down many of his initiatives because, well, they’re illegal. More than that, though, solar and wind generation are making big gains on many state’s electrical grids and, in some cases, are outpacing both coal and natural gas generation, even in fossil fuel strongholds.
That’s in part because there were a lot of projects in the pipeline when Trump took office, such as Pattern Energy’s massive SunZia wind power facility in eastern New Mexico, which added a whopping 3.65 gigawatts to the grid when it came online a couple of months ago. Developers have also been scrambling to get projects built before the federal incentives expire, bringing more capacity online. And, even though federal land permitting has slowed, developers have been bringing new projects online on private land, including fallowed farm fields, with surprising frequency.
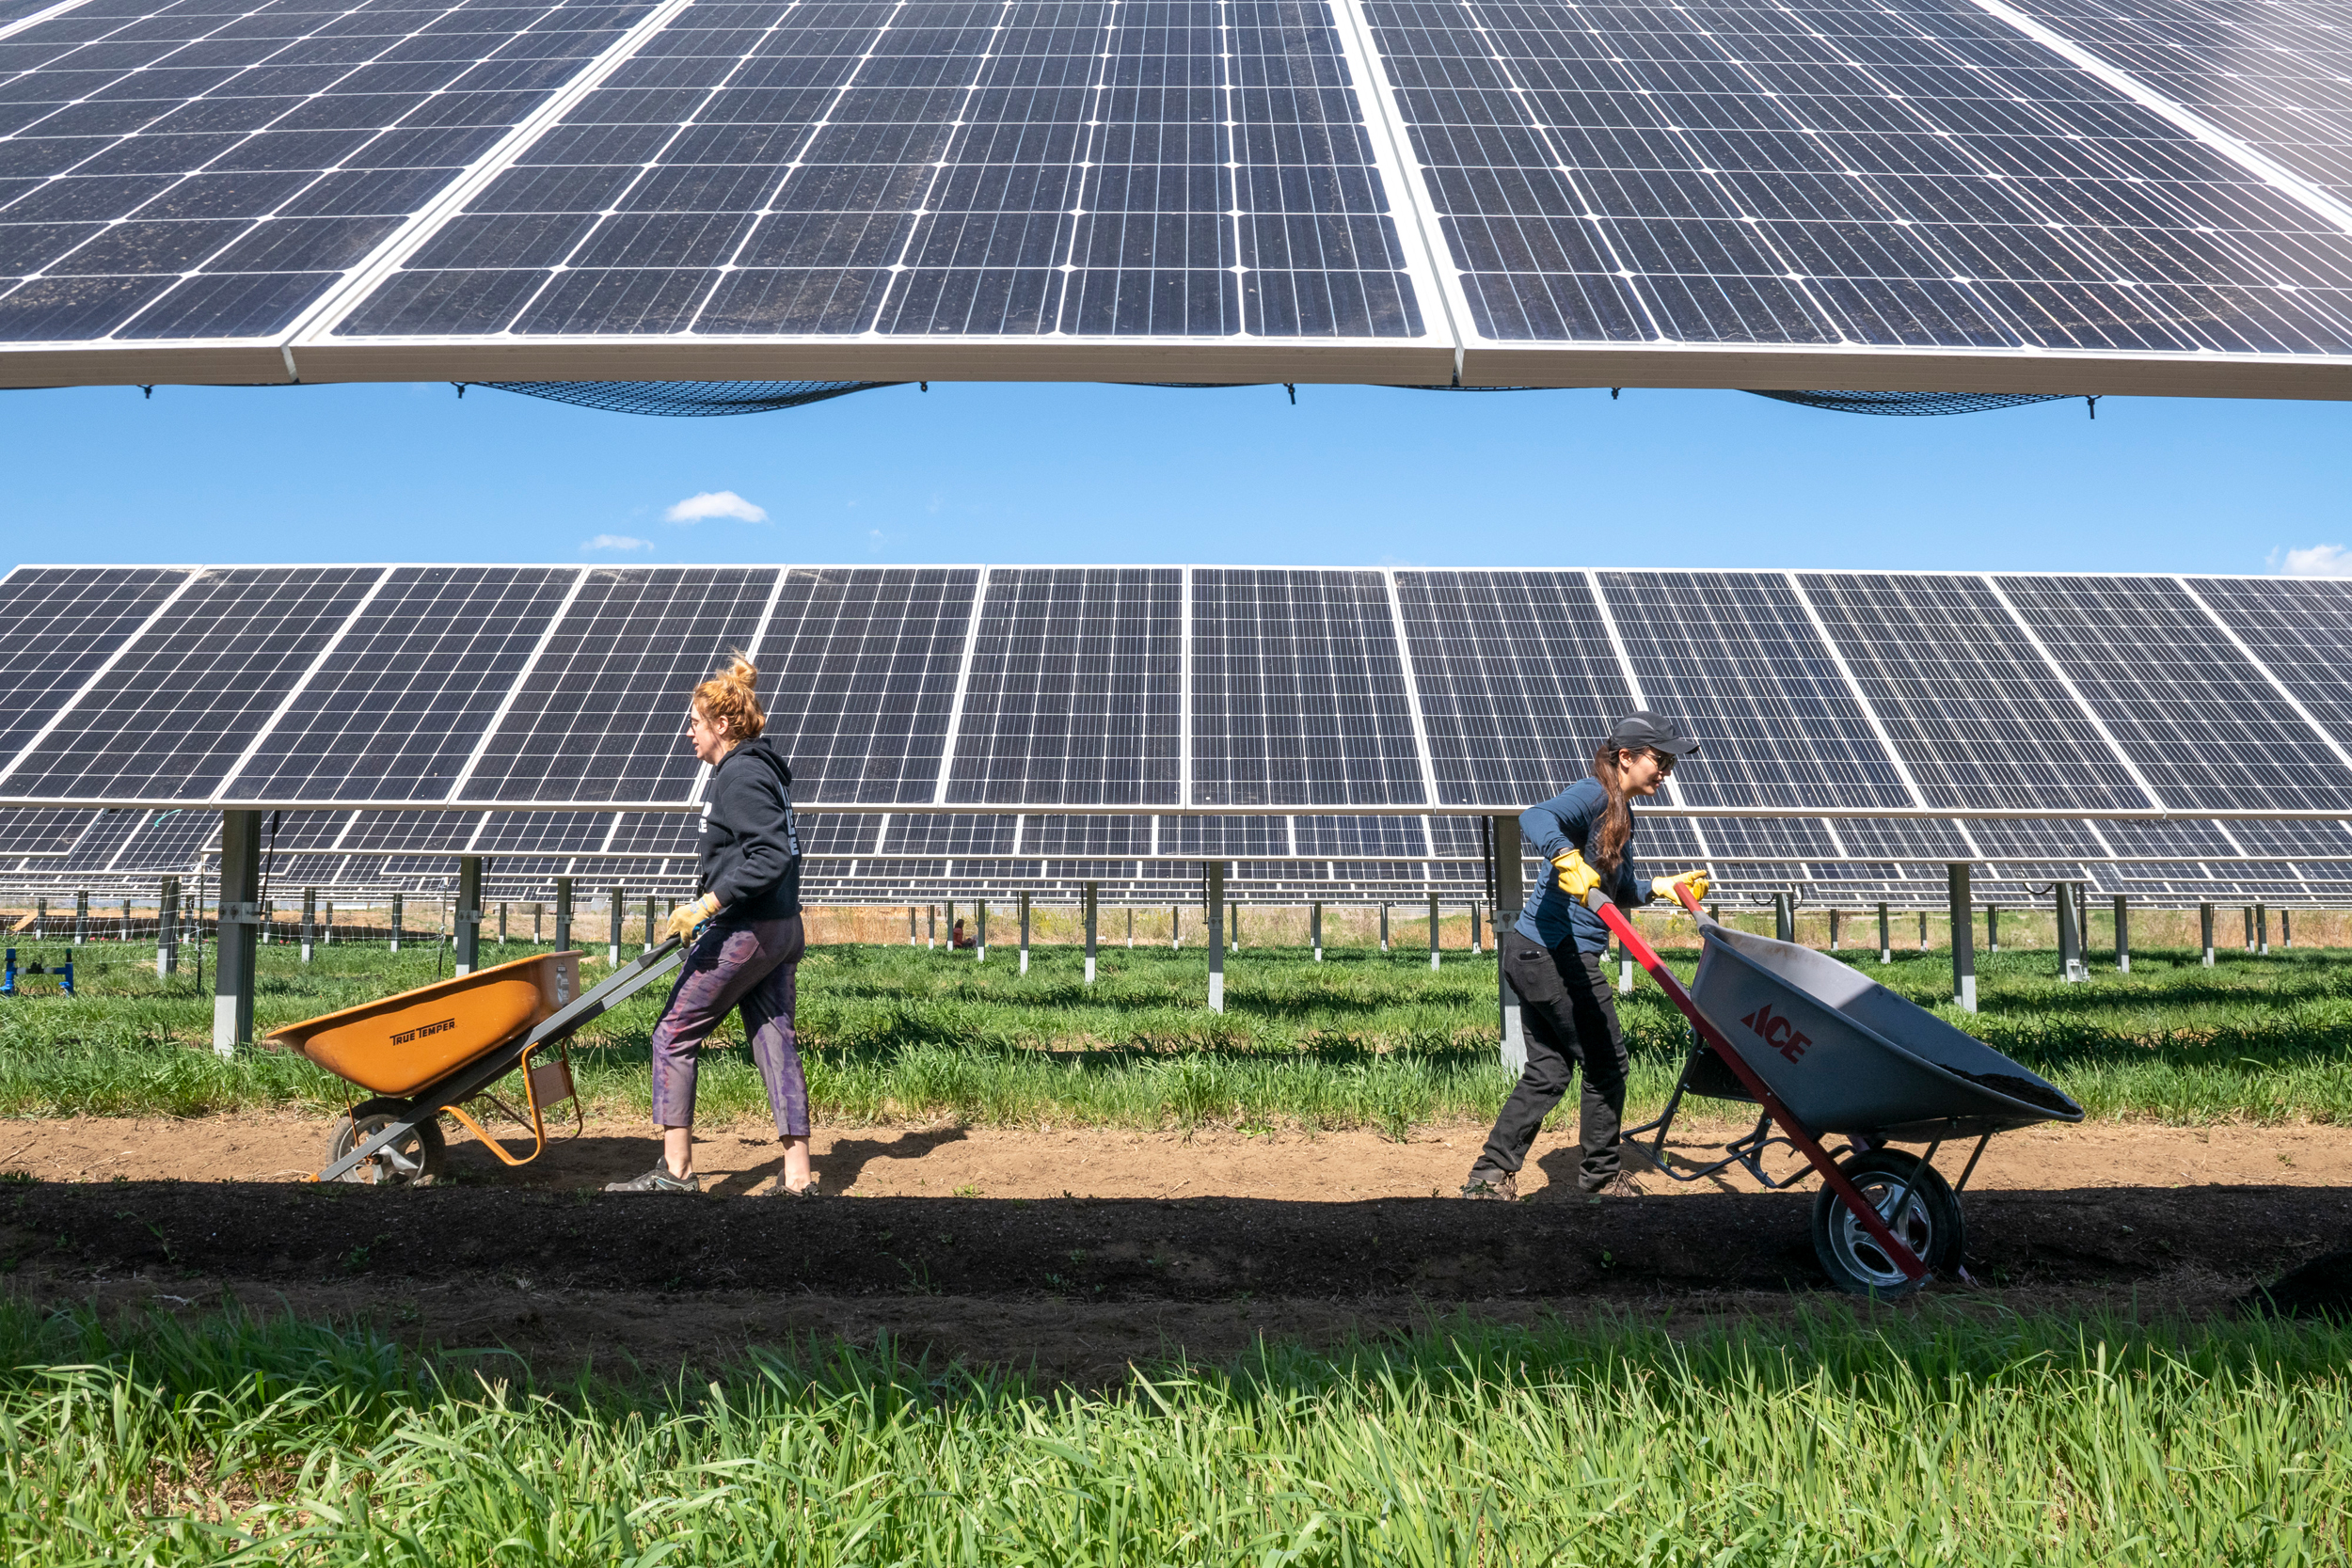
And there’s a lot more of that on its way: The Westlands Water District in California is moving forward with its Valley Clean Infrastructure Plan, which will develop a 20-gigawatt solar and battery storage project on more than 100,000 acres of water-constrained ag land in the Central Valley. As Land Desk reader Fred Porter often preaches, these increasingly arid times call for farmers to: “Stop irrigating, plant solar, harvest electrons.”
By putting these huge installations on already disturbed former farmland, it reduces the pressure to put them on more sensitive, ecologically rich public lands. Less irrigating will leave more water in the rivers. As solar and wind displace coal and natural gas generation, they’ll also reduce the need for water in those thermal power plants. And, generating more power will offset the electrons lost if/when hydropower generation stops at Glen Canyon Dam and/or Hoover Dam.
For the blurbs below, I’ve used a snapshot of energy use by state in May of this year, mostly because that’s the most recent data available for all of these states. Keep in mind that electricity demand, and the output of various energy sources, varies from month to month. May is a good month for solar because the sun’s shining, the days are long, and the sky is not obscured by wildfire smoke. Meanwhile, it’s usually not hot enough yet for air-conditioning-related demand spikes.
I’ve only included energy sources that provided 1% or more of a state’s total electricity use that month. In the states below, “other renewables” is geothermal…
California, as one might expect, is leading the clean energy charge. In May of this year, solar generation accounted for 51% of California’s total electricity production, a new world record (wind accounted for another 8%). Meanwhile, fossil fuels — which in California means natural gas — provided less than 15% of the state’s power in May. Hydropower, nuclear, and biofuels filled in the remaining 26%. A surge in grid-scale battery energy storage capacity in the state over the last few years has helped smooth out the solar “duck curve”; plentiful afternoon solar tops off the batteries, which can then discharge in the evening when solar drops off. There are still challenges, however: California’s grid operator continues to curtail solar generation, meaning it forces arrays to shut down or to pay other states to take it, because at times there’s more solar output than the grid can handle.
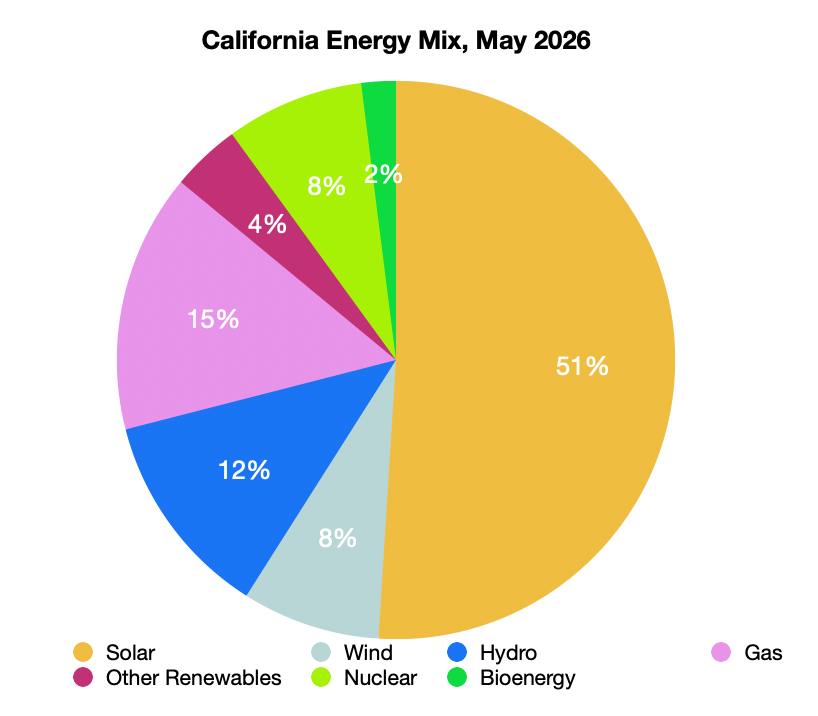
- Solar: 51%
- Gas: 15%
- Hydro: 12%
- Wind: 8%
- Nuclear: 8%
- Other renewables: 5%
Arizona should be the leader in solar, given how sunny it is, but its clean energy progress has been hampered by Trumpian state lawmakers and utility regulators, who tend to favor fossil fuels for reasons that confound me (I have no idea how energy sources became partisan or why). Still, solar is making huge gains, providing about 27% of the state’s electricity in May, compared to just 12% in 2021. That’s about the same share as nuclear’s, which is somewhat remarkable given that the state is home to the Palo Verde Nuclear Plant.
Salt River Project, the utility that serves most of the Phoenix metro area, continues to add both solar and battery storage. Meanwhile, Arizona Public Service plans to convert its currently shuttered Cholla coal plant near Holbrook to run on natural gas. This was one of the coal plants Trump said would reopen as part of his coal-fetish initiatives. It did not reopen, at least not to burn coal.
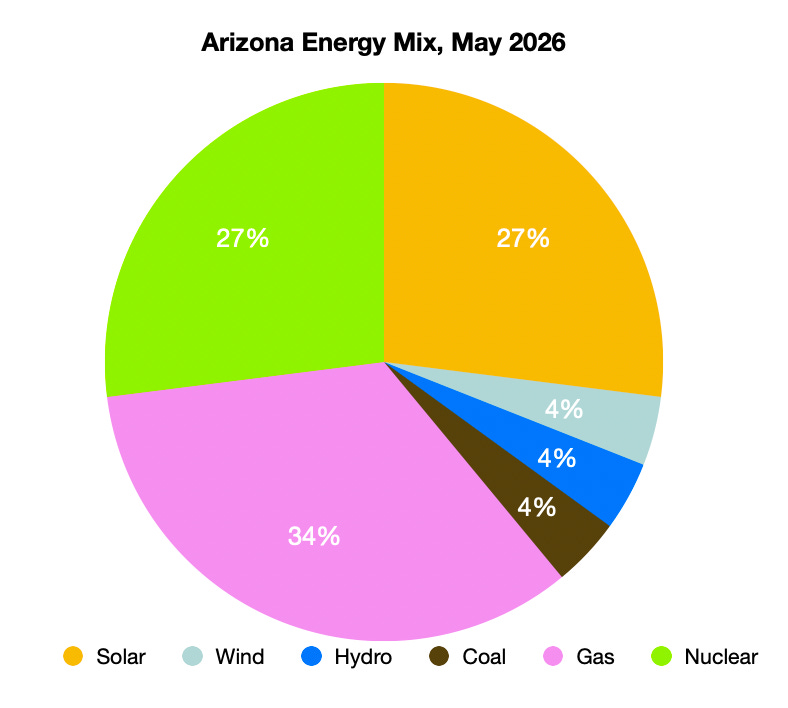
- Gas: 34%
- Solar: 27%
- Nuclear: 27%
- Wind: 4%
- Hydro: 4%
- Coal: 4%
Colorado. Just a decade ago, coal-fired generation dominated Colorado’s grid, accounting for about 50% of all generation in 2016. Stronger clean energy policies and the rising cost of coal has unseated the dirty fuel, with wind power taking over the top spot. Coal’s decline, however, has been slowed in the state by Trump administration orders blocking planned plant retirements, and by projections of data center-driven electricity demand increases.
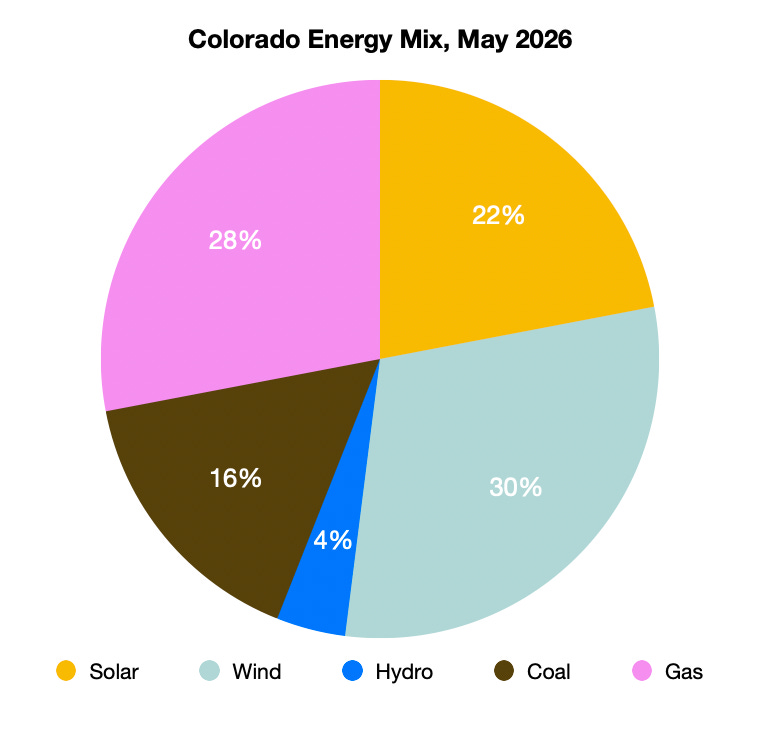
- Wind: 30%
- Gas: 28%
- Solar: 22%
- Coal: 16%
- Hydro: 4%
Idaho: Way back in 2006, when coal-fired generation was near its peak in the United States and the Powder River Basin mines were kicking out 1 billion tons of the stuff each year, Ray Ring wrote a story for High Country News about a band of Idaho residents pushing back on a new coal plant. The “West’s New Revolutionaries” ultimately prevailed. And not only did this one facility not get built, but the state has managed to stay off coal altogether. Nowadays, though, rural Idahoans are just as likely to be pushing back against solar and wind installations, the state’s largest utility is hostile toward rooftop solar, and multiple new gas plants are in the pipeline. So don’t expect solar and wind to crowd out other energy sources too soon.
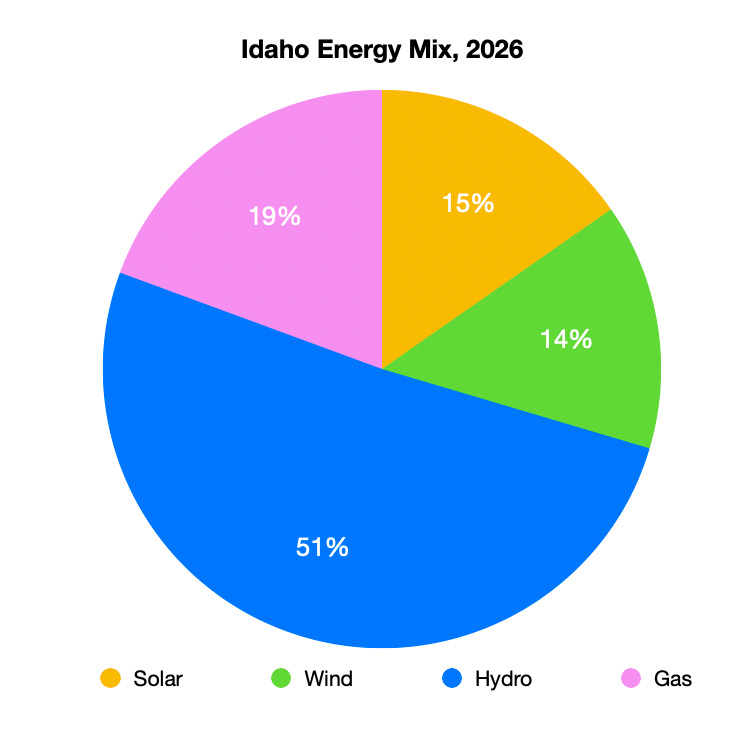
- Hydro: 50%
- Gas: 19%
- Solar: 15%
- Wind: 14%
Montana’s state lawmakers and utility regulators have a fondness for fossil fuels. Plus, it’s a big coal mining state and is home to the Colstrip coal power plant, one of the nation’s worst polluters. Nevertheless, coal doesn’t dominate the energy mix here, hydropower does. Wind, however, is making a run for the top spot.
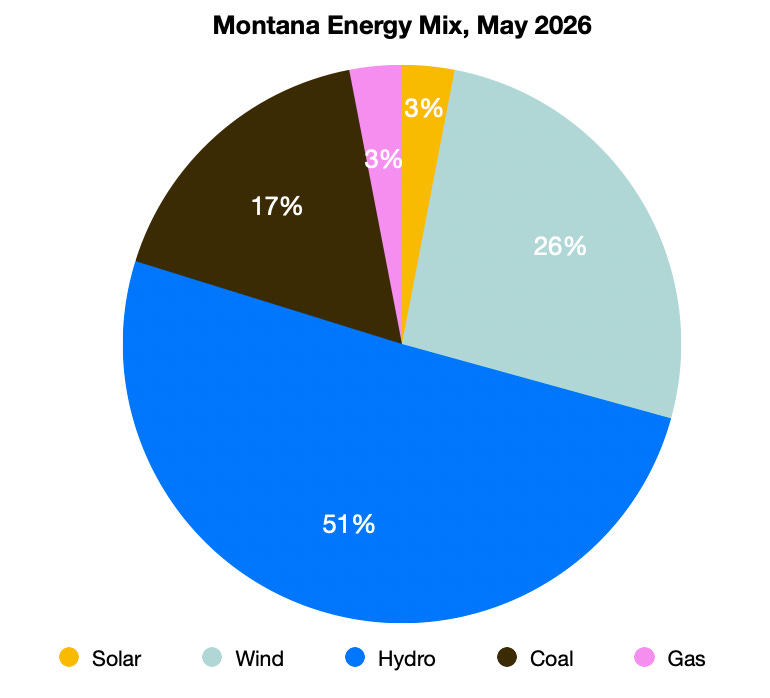
- Hydro: 50%
- Wind: 26%
- Coal: 17%
- Solar: 3%
- Gas: 3%
New Mexico produces oodles of methane, i.e. natural gas. The San Juan Basin was once one of the world’s largest gas fields, and in the Permian Basin oil fields the fuel is so plentiful (as an “associated gas” that comes up with the crude) that they just burn it off instead of putting it to use. Still, gas plants generated just 19% of the state’s electricity, while wind and solar combined accounted for 63%. That’s in part because New Mexico has good wind and solar potential, but more importantly it has forward-thinking, progressive policies such as the Energy Transition Act, which not only encourage renewable energy, but also provides a safety net to help coal communities, miners, and power plant workers transition away from the dirty fuel.
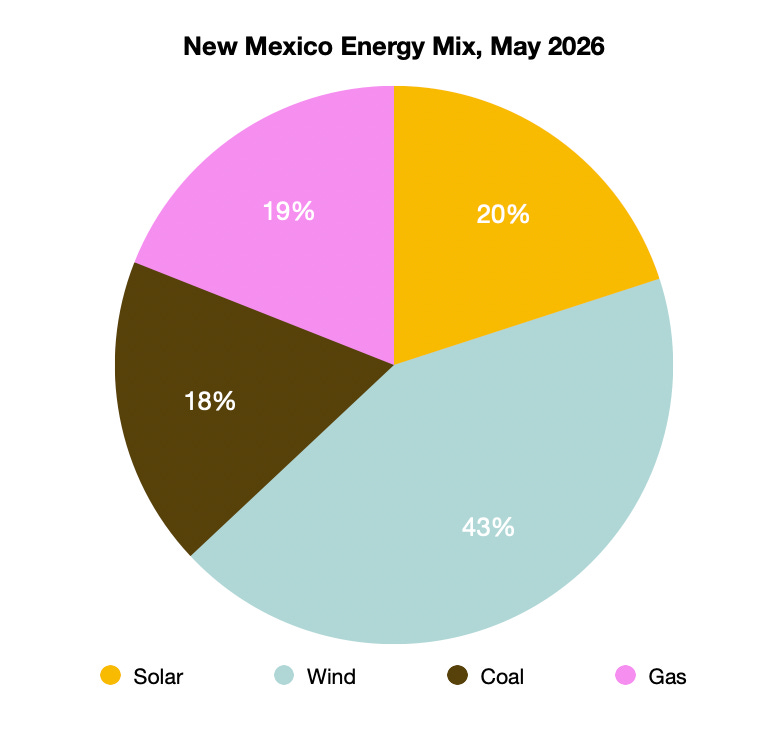
- Wind: 43%
- Solar: 20%
- Gas: 19%
- Coal: 18%
Nevada’s largest utility started moving away from coal years ago, and some of NV Energy’s biggest customers — Las Vegas casino resorts — have demanded clean energy to help them green up their brands. That, combined with Nevada’s large tracts of solar-ready public lands has helped utility-scale solar generation vie with gas as the leader of the state’s energy mix. With several large solar and geothermal projects in the pipeline, shares of those energy sources should continue to grow. The biggest hurdle standing in the way of the Silver State’s energy transition is the Big Data Center Buildup, which threatens to double or even triple overall electricity demand in the next decade or so. NV Energy plans to build more gas generation to keep up.
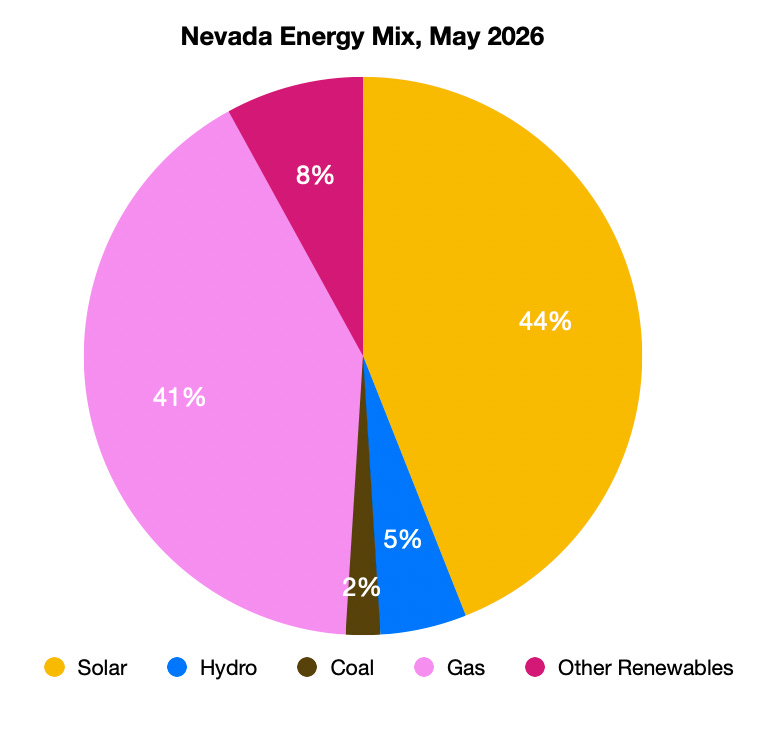
- Solar: 44%
- Gas: 41%
- Other renewables: 8%
- Hydro: 5%
- Coal: 2%
Oregon, like other Northwest states, relies heavily on hydropower from the Columbia River’s dams, but it has also added wind capacity at a fairly rapid rate. Like in many other Western states, Oregon’s energy supply is likely to be strained by data center-driven demand.
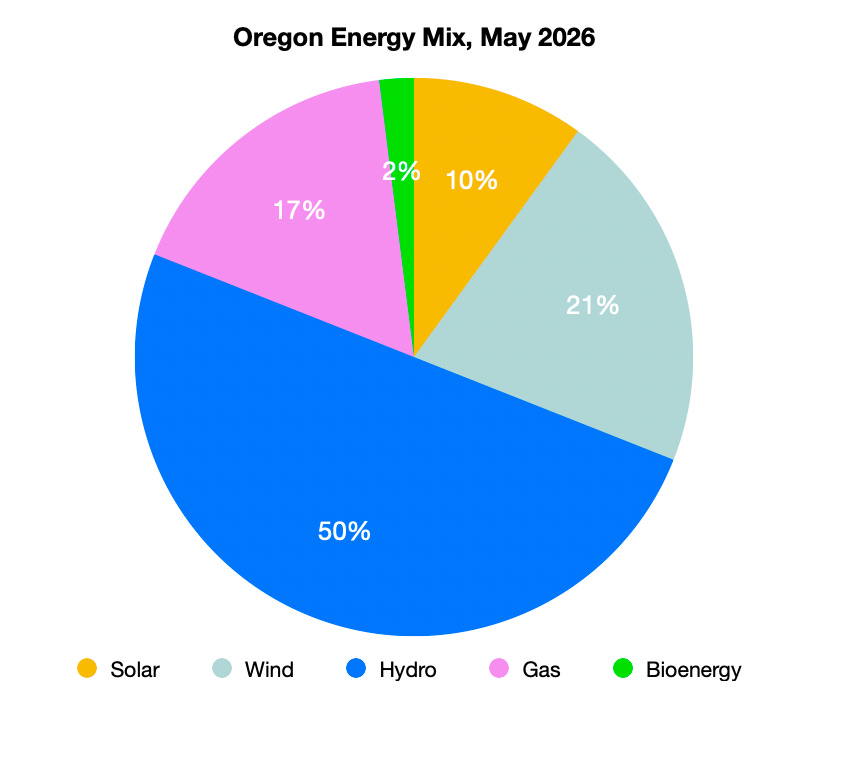
- Hydro: 50%
- Wind: 21%
- Gas: 17%
- Solar: 10%
- Bioenergy: 2%
Utah’s Republican-dominated legislature is packed with fossil fuel folks, who have devoted a lot of time and energy trying to keep the coal industry going. Gov. Spencer Cox, meanwhile, is a big nuclear fan, and is courting reactor startups and vying to host a Department of Energy “Nuclear Lifecycle Innovation Campus” that would include nuclear fuel fabrication, enrichment, and radioactive waste storage to add to the existing uranium mining and milling industry.
But for the month of May, at least, solar sat atop the state’s energy mix, bolstered by the new 400-MW Green River solar-plus-storage project, with coal falling to third place. While there’s a lot of talk about nukes, there is real action on the geothermal front in Utah, with Fervo advancing its Cape Station enhanced geothermal project in Beaver County. I’d bet that geothermal’s share climbs long before a reactor comes online in the state.
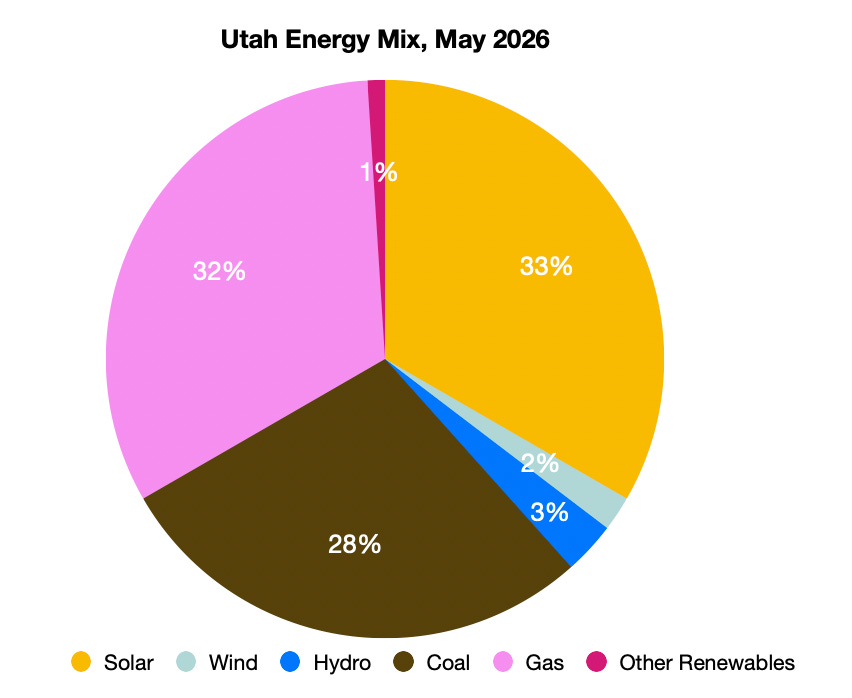
- Solar: 33%
- Gas: 32%
- Coal: 28%
- Hydro: 3%
- Wind: 2%
- Other renewables: 1%
Washington is a hydropower state, naturally, thanks to big dams on the Columbia River and its tributaries. It’s also one of the few Western states with a notable share of power generated by nuclear reactors. Coal is notably absent, in part due to state policy, despite the Trump administration’s order to keep the Centralia coal plant running past its December 31, 2025, retirement date. Centralia will convert to run on natural gas in coming years.
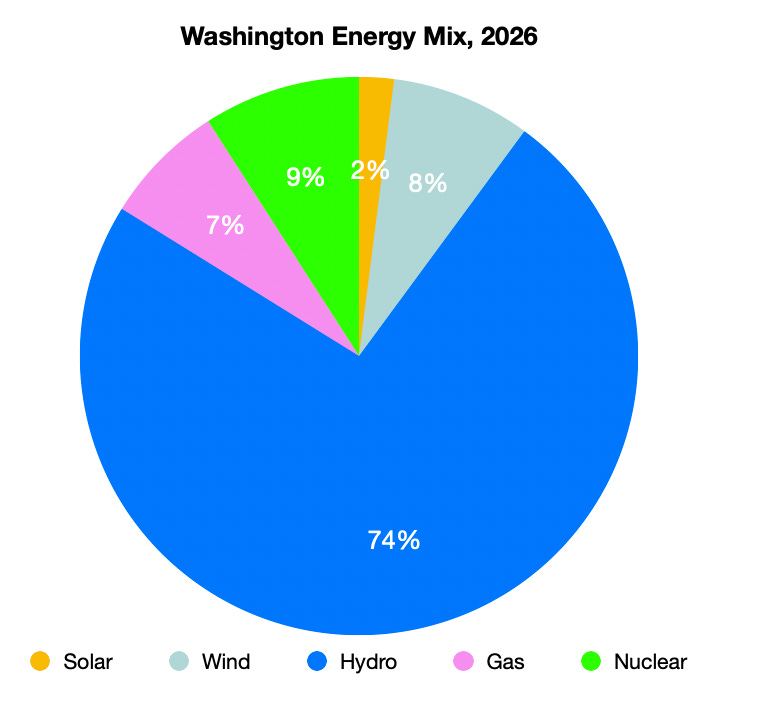
- Hydro: 73%
- Nuclear: 9%
- Wind: 8%
- Gas: 7%
- Solar: 2%
Wyoming has become synonymous with coal production ever since the Powder River Basin mines went big time back in the 1970s. It’s also big on coal-generation: In 2003, coal-fired power plants produced 97% of Wyoming’s electricity. Today, the gaping mines in the Powder River Basin continue to produce a lion’s share of the nation’s coal, but the fuel’s stature in the state’s energy mix is declining, while wind power excels.
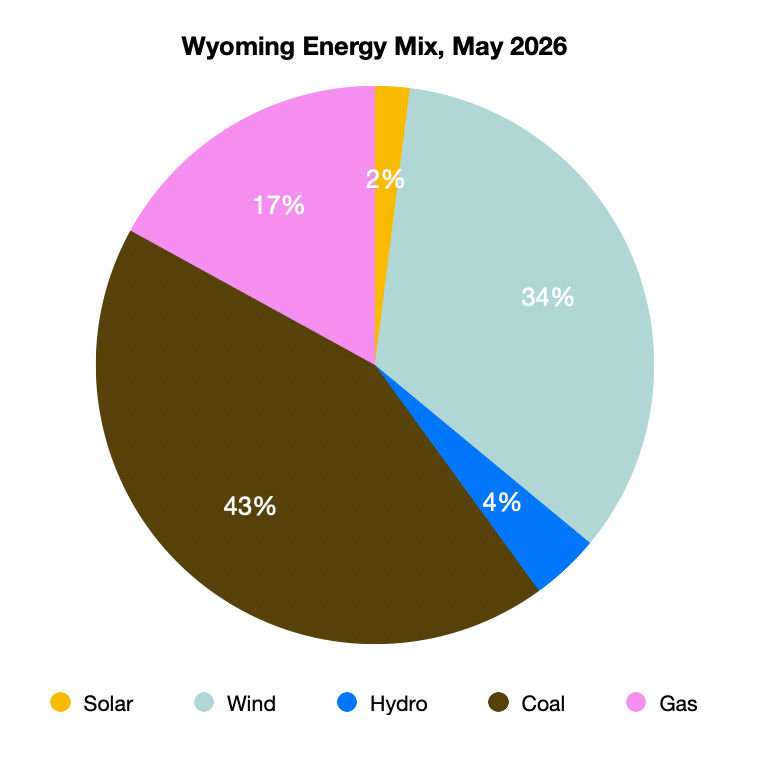
- Coal: 43%
- Wind: 34%
- Gas: 17%
- Hydro: 4%
- Solar: 2%