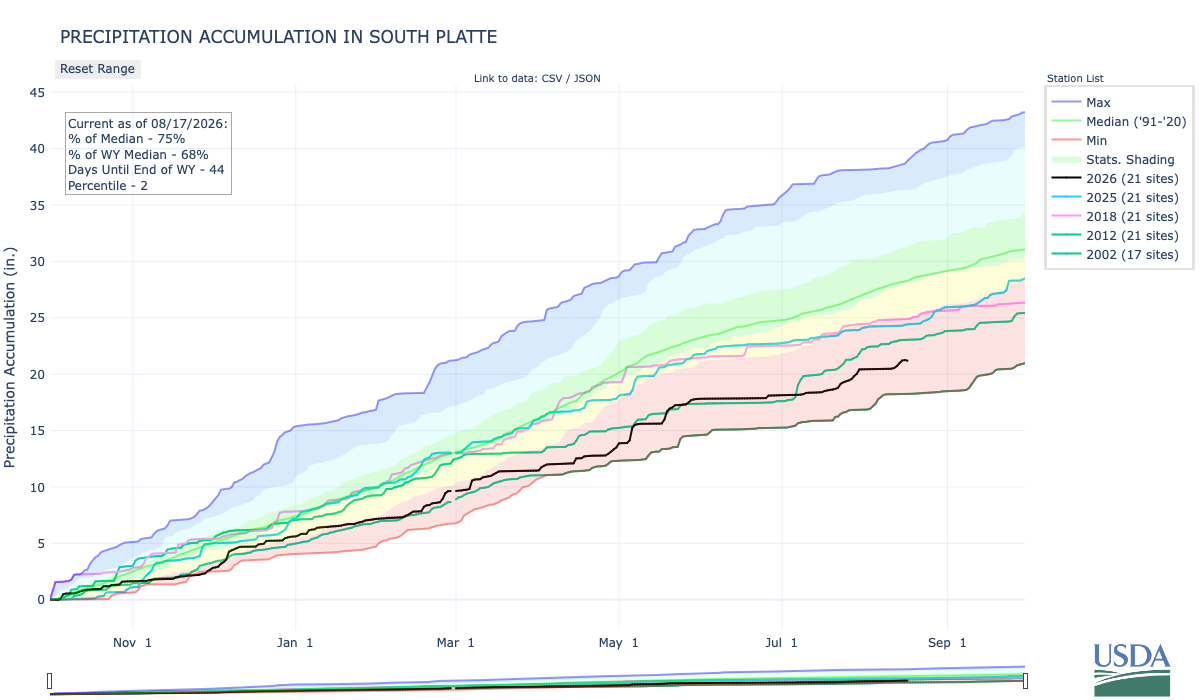
Below is the Precipitation Accumulation in South Platte graph from the NRCS for August 10, 2026. This morning precipitation is at 75% of the median (up 2% one week), and 68% of the water year median (up 2% one week). There are 44 days left in the water year.
There is a chance for thunderstorms Wednesday, a slight chance for thunderstorms Thursday, and chance for thunderstorms Friday, with showers likely Saturday, and showers and thunderstorms likely Sunday, in the central mountains. Showers are likely Wednesday, there is a slight chance for thunderstorms Thursday, a chance for thunderstorms Friday, with showers likely Saturday, and showers/thunderstorms likely Sunday, in the northern mountains. There is a chance for thunderstorms Tuesday and Wednesday, with a chance for showers and thunderstorms Saturday, and showers are likely Sunday, down here, about 160 miles from Steamboat Springs where the arrival of the Denver, Northwestern & Pacific Railway, in 1909, was transformative. From ChatGPT:
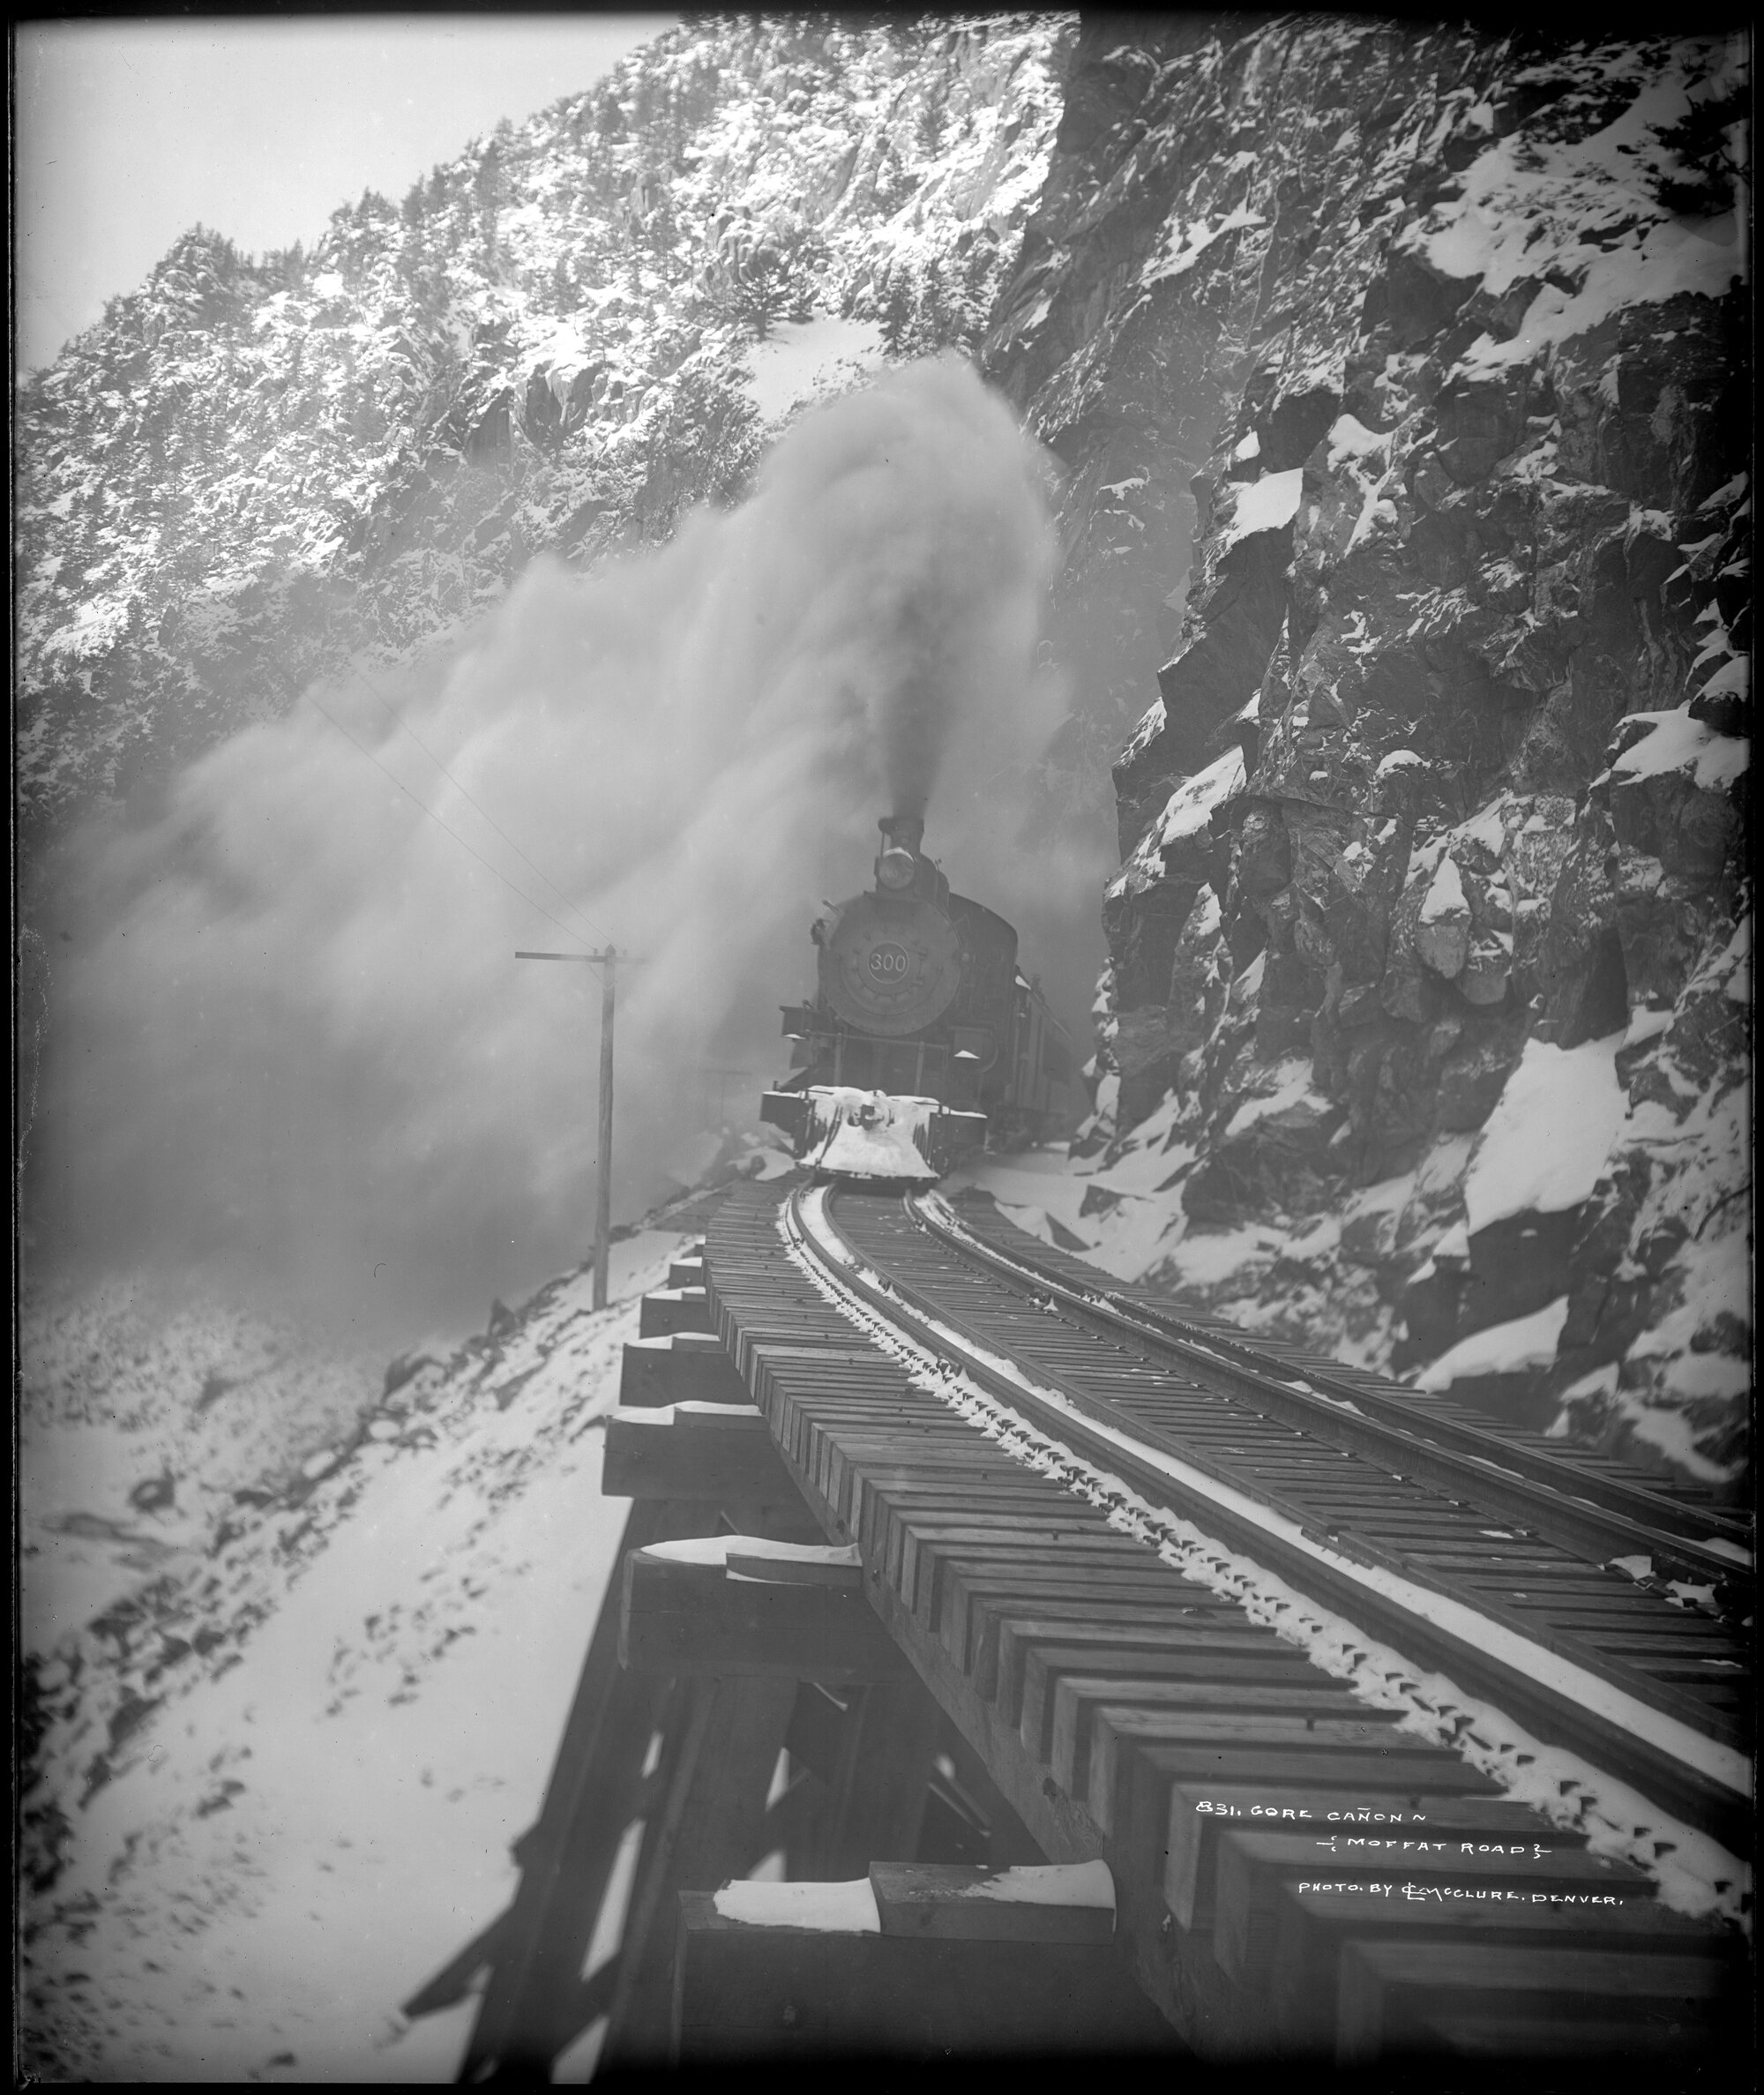
Before the railroad, Steamboat Springs and the Yampa Valley were quite isolated. Moving people, livestock, supplies, and agricultural products across the mountains was difficult and expensive. The Denver, Northwestern & Pacific Railway, associated with railroad entrepreneur David Moffat, was being pushed westward from Denver across the Continental Divide. The line finally reached Steamboat Springs in December 1908, with regular rail service beginning in 1909. The railroad dramatically changed the local economy. Ranchers could ship cattle and other products to distant markets, while the railroad made the Yampa Valley’s coal and timber resources much more commercially valuable. Manufactured goods and building materials could also be brought into town more easily. It also reduced Steamboat’s isolation. A journey that previously required difficult travel over mountain roads could increasingly be made by train, strengthening Steamboat’s connections with Denver and the rest of Colorado.
Denver, Northwestern & Pacific Railway (later called Denver & Salt Lake) engine number 300 pulling hard and starting across wooden trestle in Gore Canyon, Colorado; Moffat Road; standard gauge track in steep narrow canyon. Creator McClure, Louis Charles, 1867-1957. Date 1907-1913. Via Denver Public Library Digital Collections
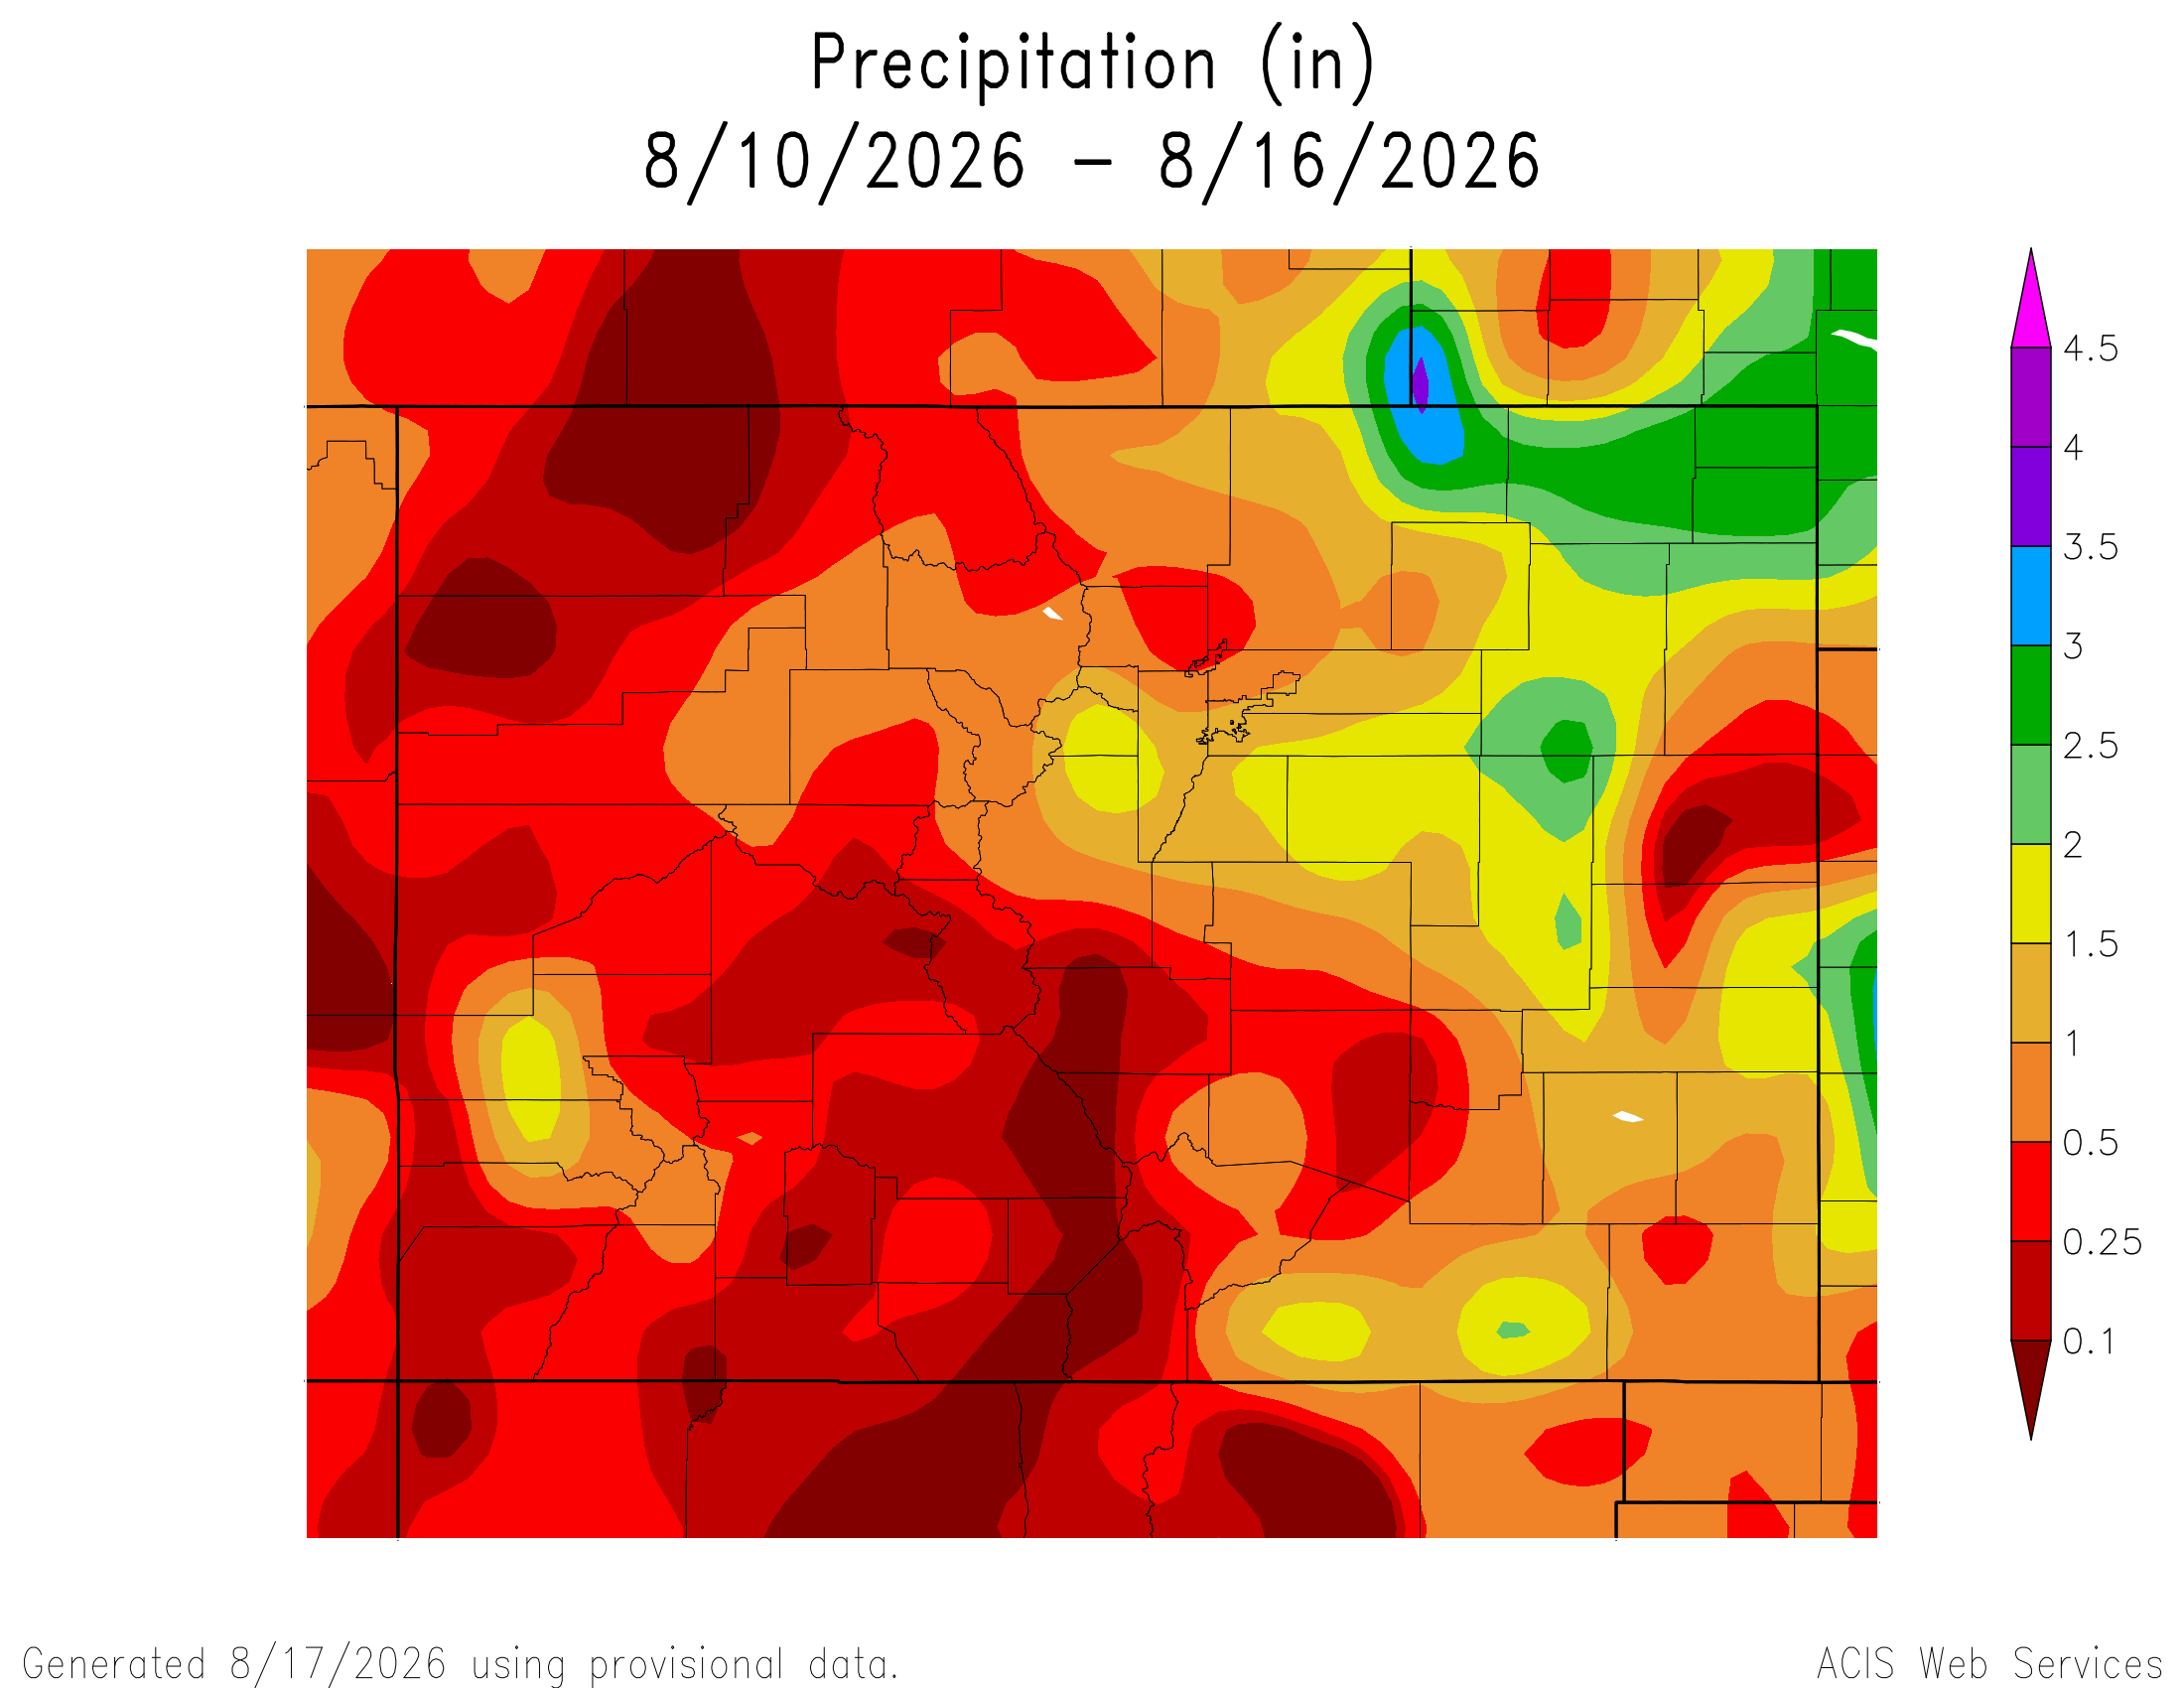
Here’s a look at the 7-Day Colorado precipitation map through August 16, 2026 from the High Plains Regional Climate Center. Precipitation in the South Platte Basin along the Continental Divide of the Americas ranged from 0.00” to 2.00”.
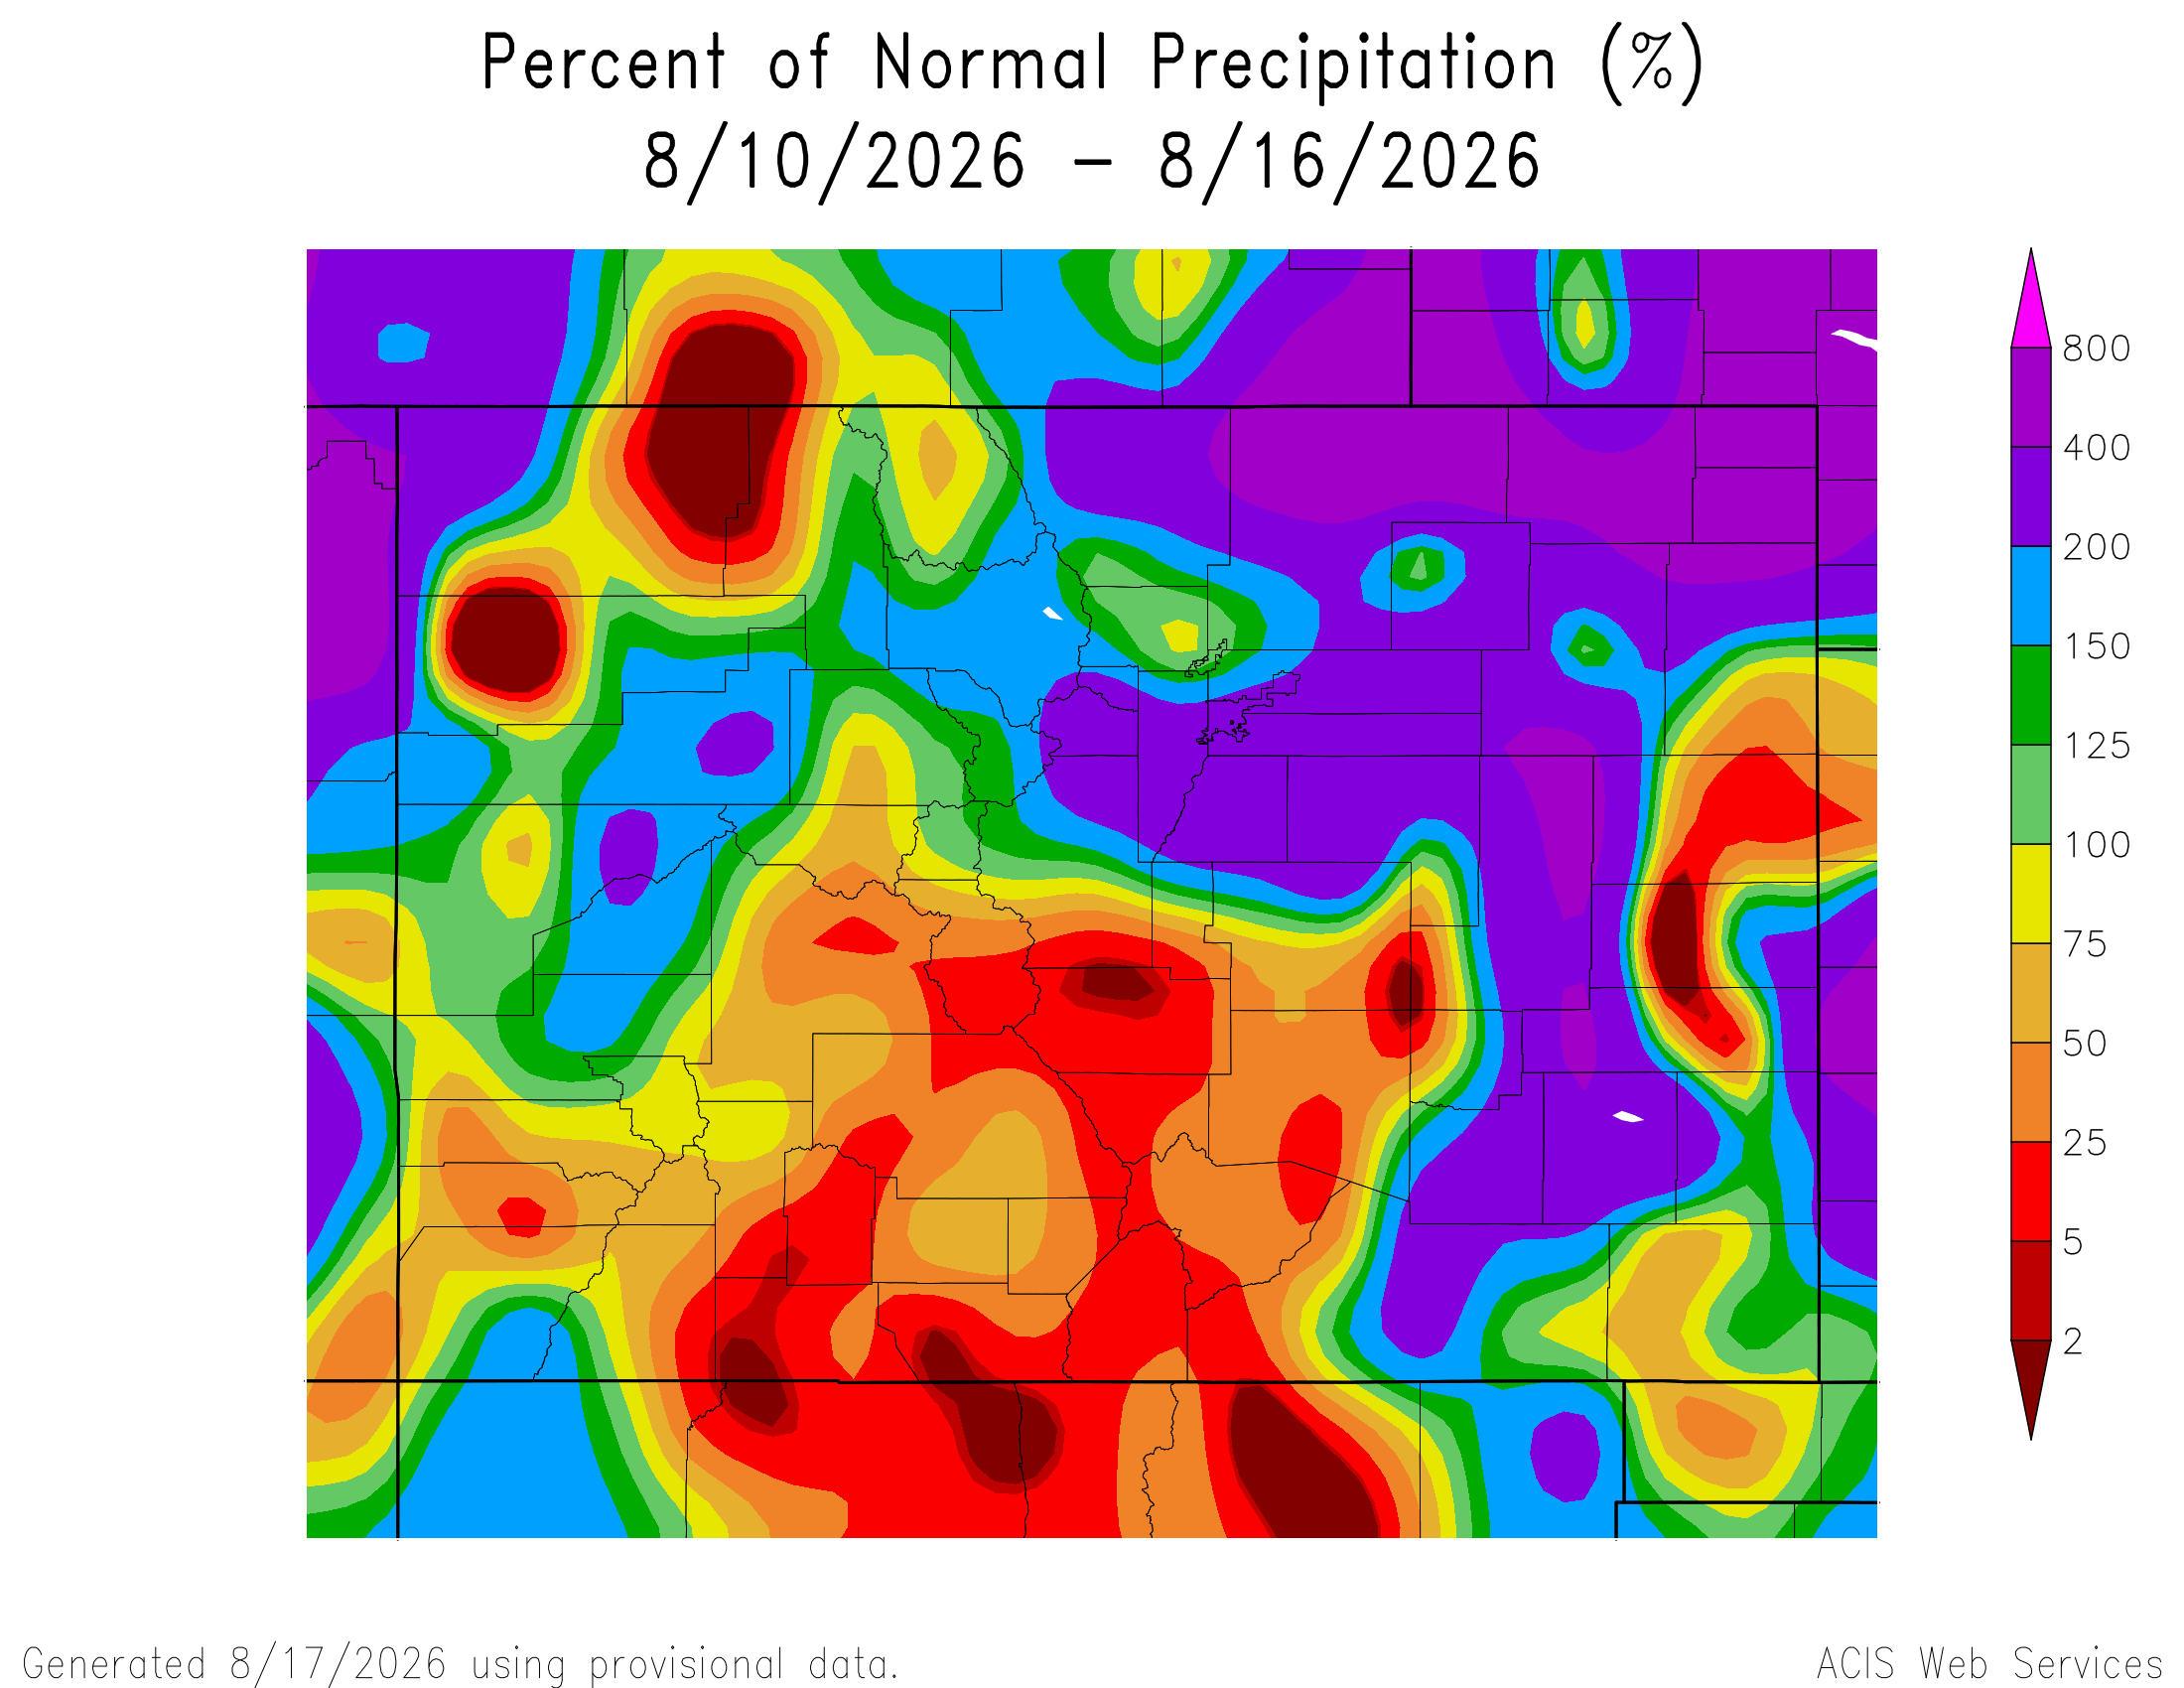
Here’s the 7-Day percent of normal precipitation map through August 16, 2026 from the High Plains Regional Climate Center. Precipitation in the South Platte River Basin along the Continental Divide of the Americas was 0% to 800% of normal.
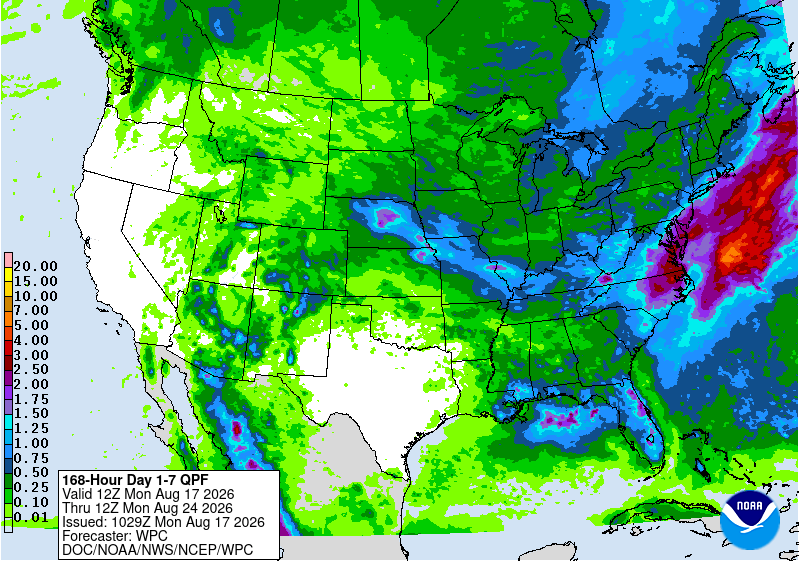
Below is the 7-day Quantitative Precipitation Forecast for the week of August 17, 2026. Precipitation is anticipated for the mountains of the South Platte River Basin and may total up to 0.75″.
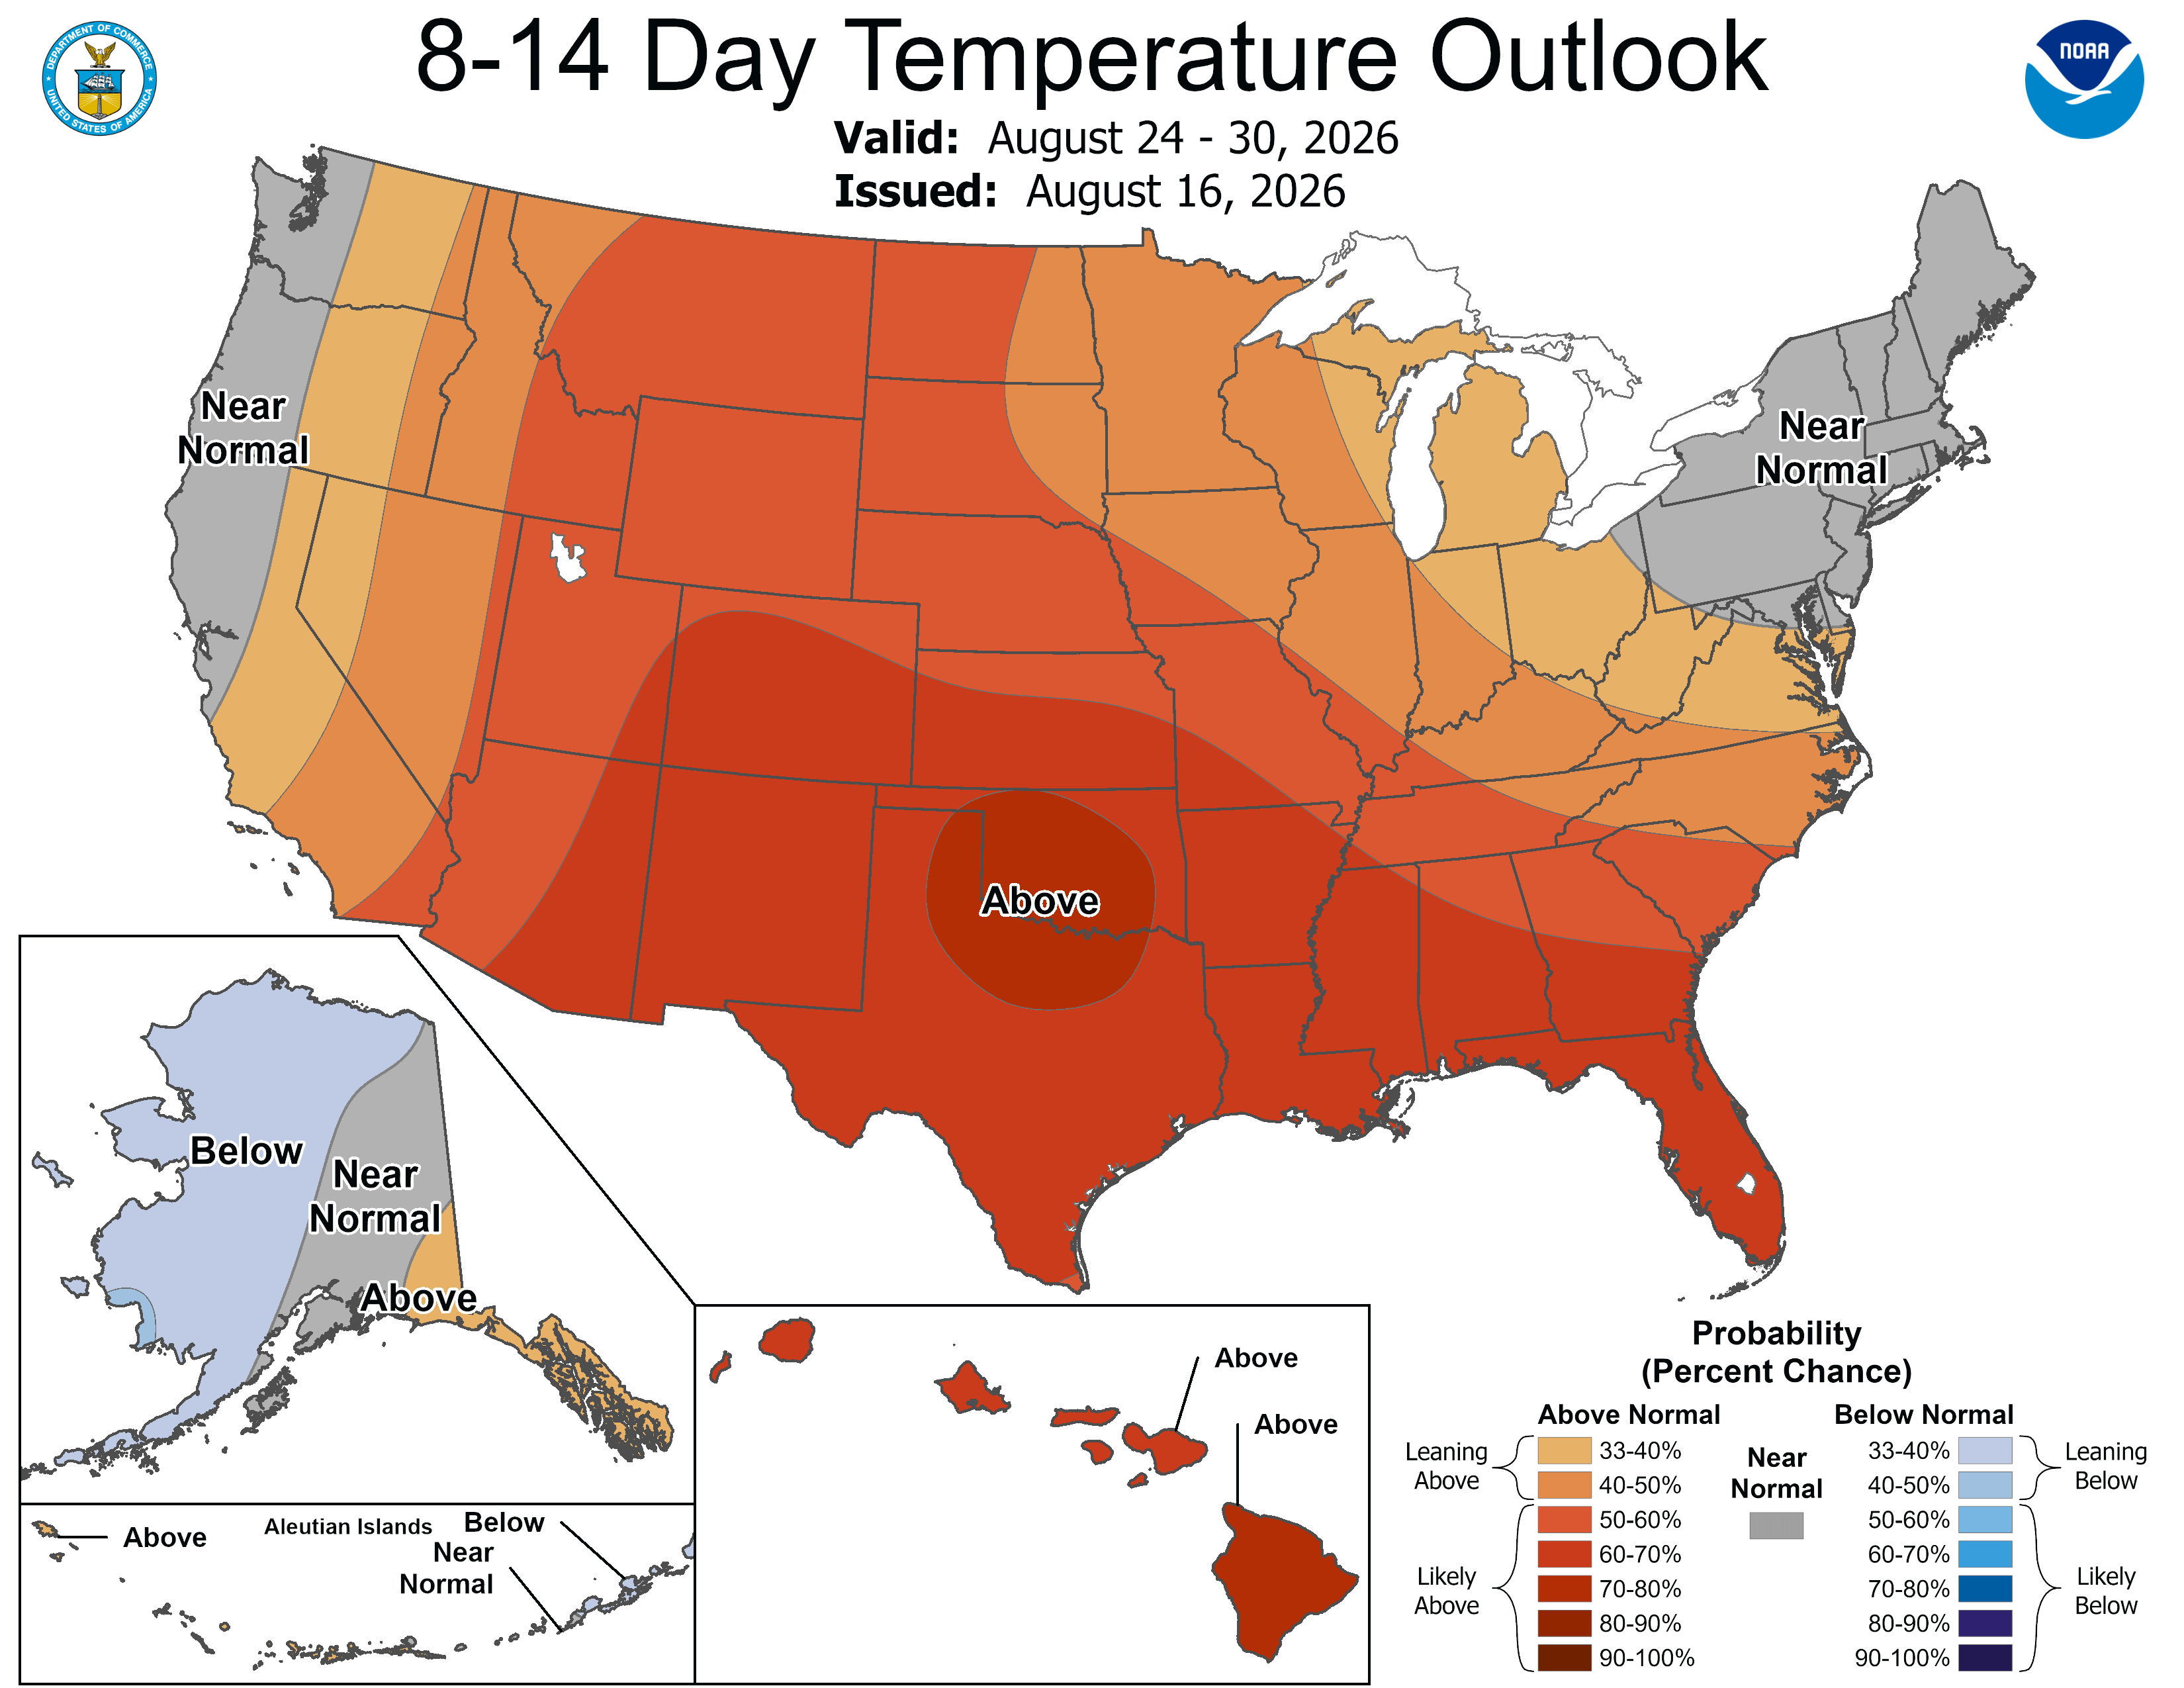
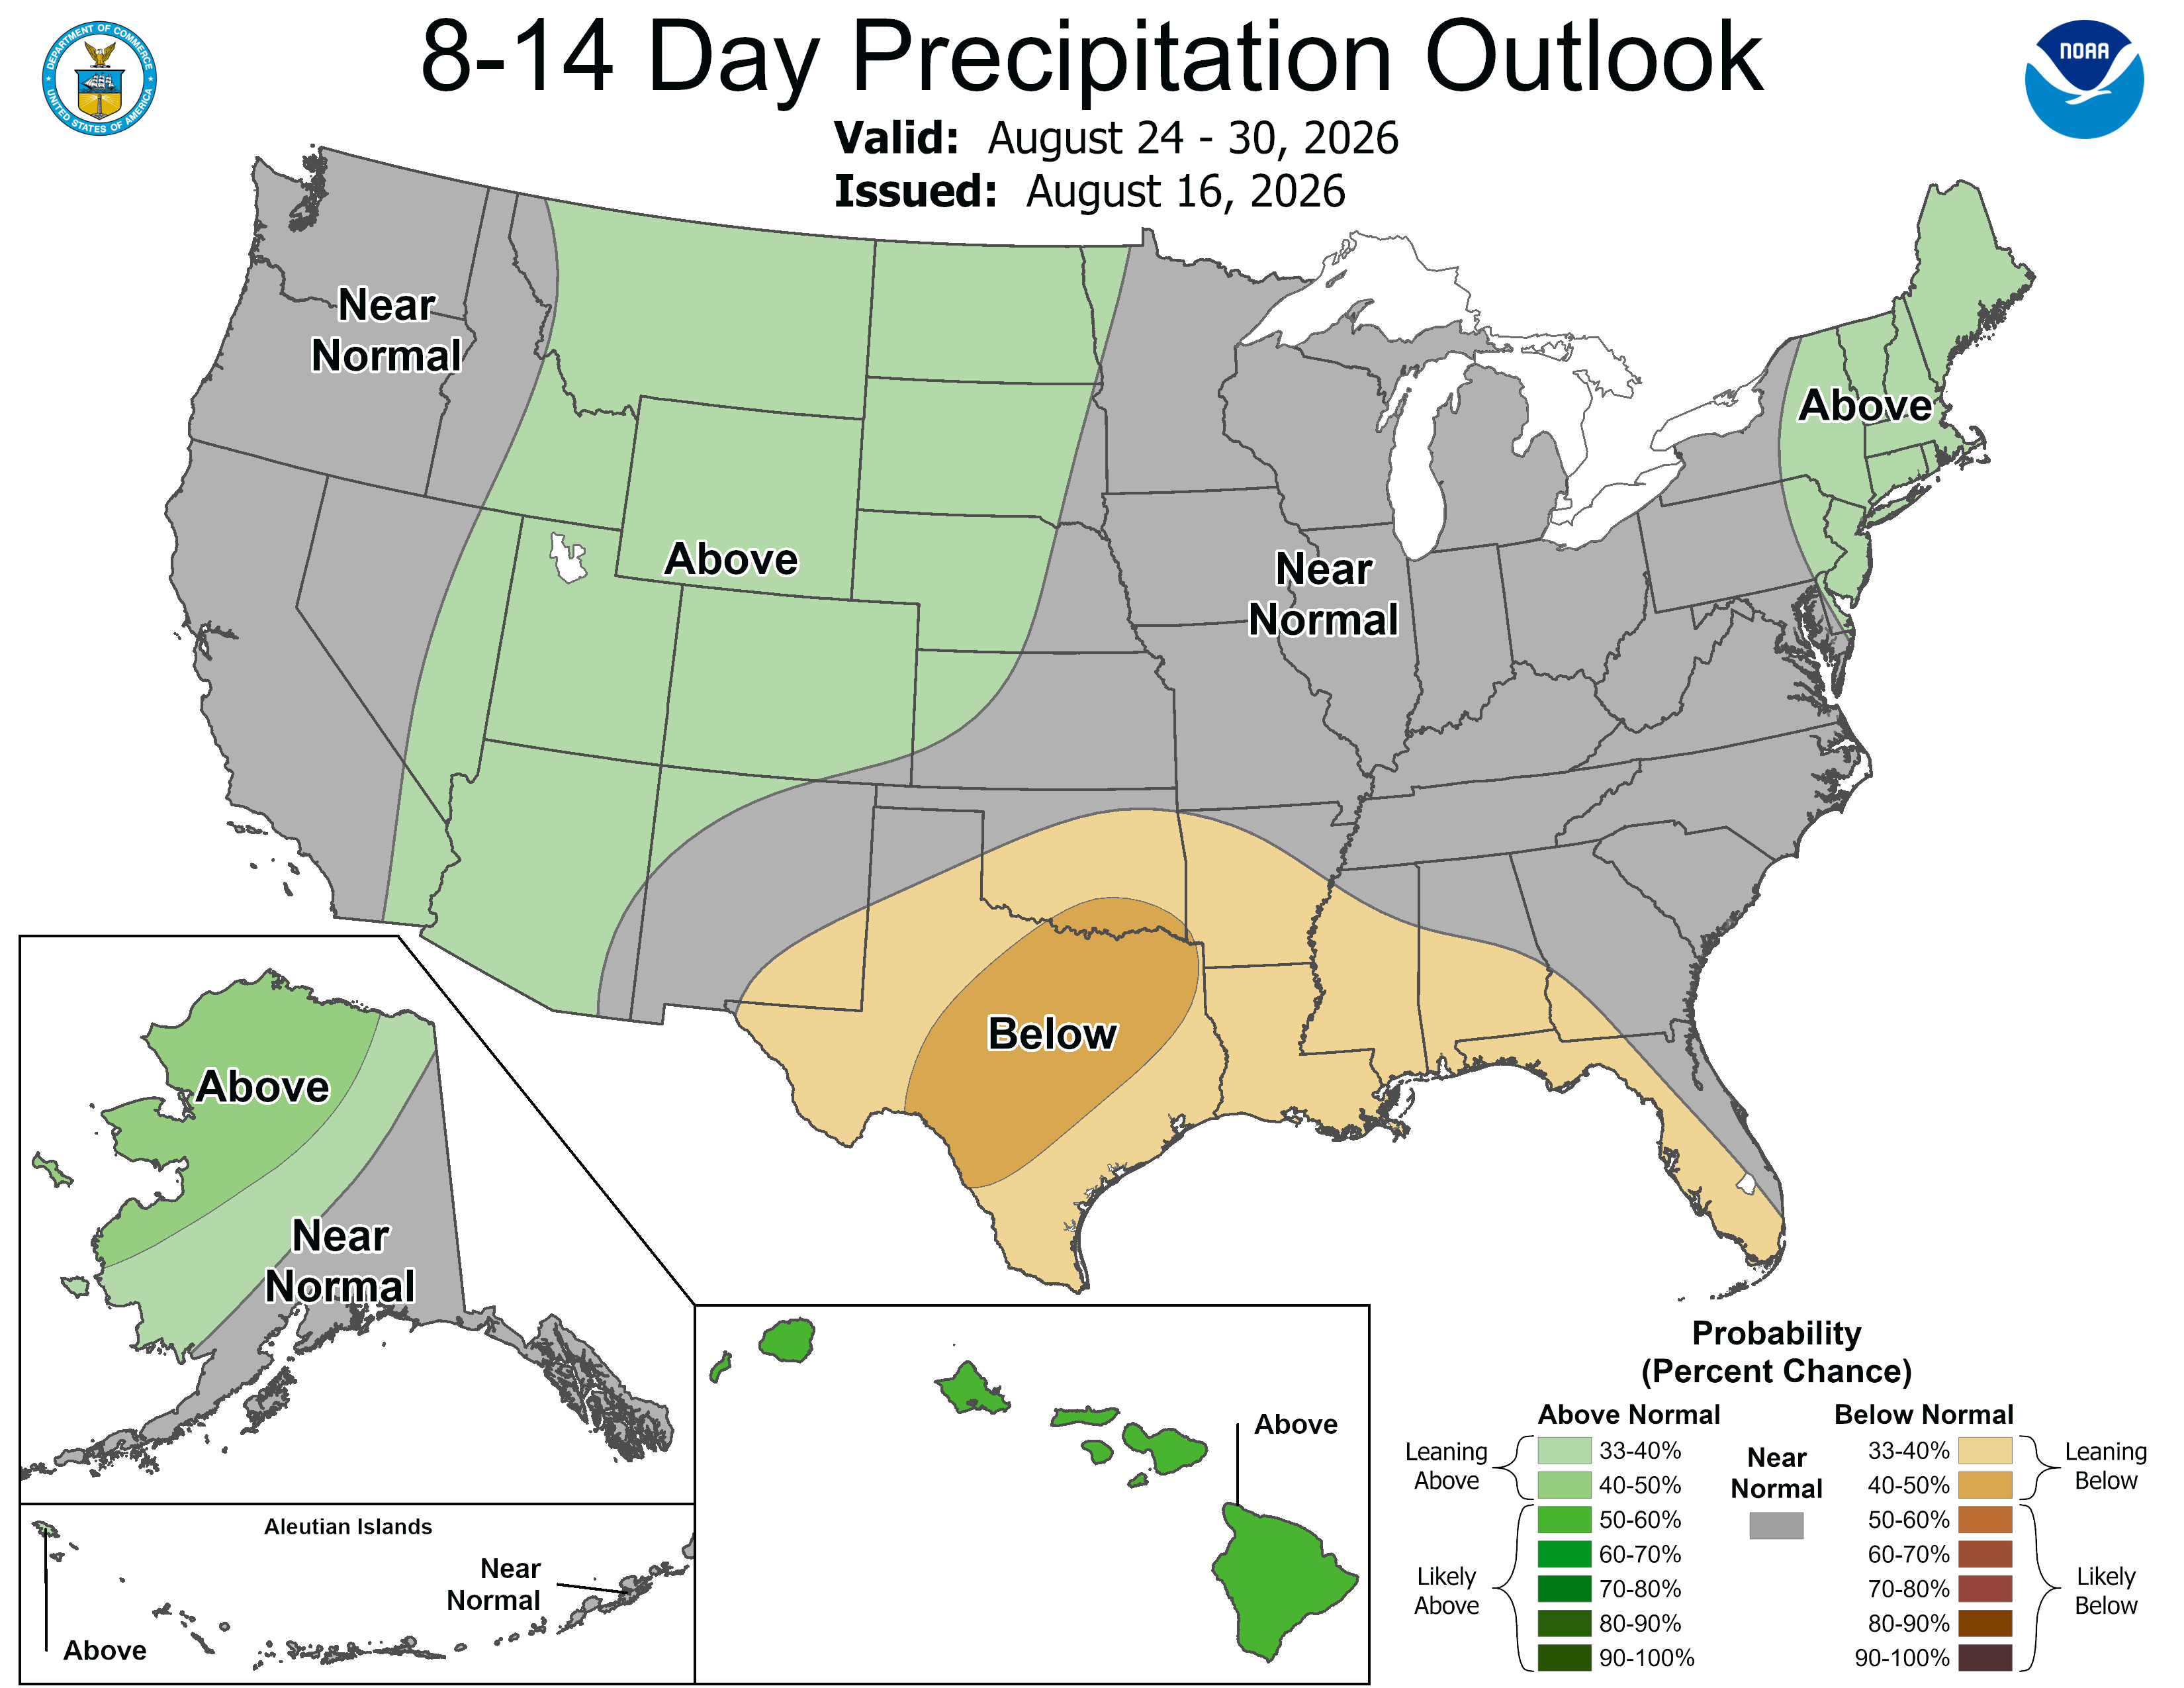
Below are the 8-14 day outlooks from the Climate Prediction Center, issued August 16, 2026, for temperature and precipitation, for the week starting August 24, 2026. The CPC expects above normal temperatures and above normal precipitation for the mountains of the South Platte River Basin.
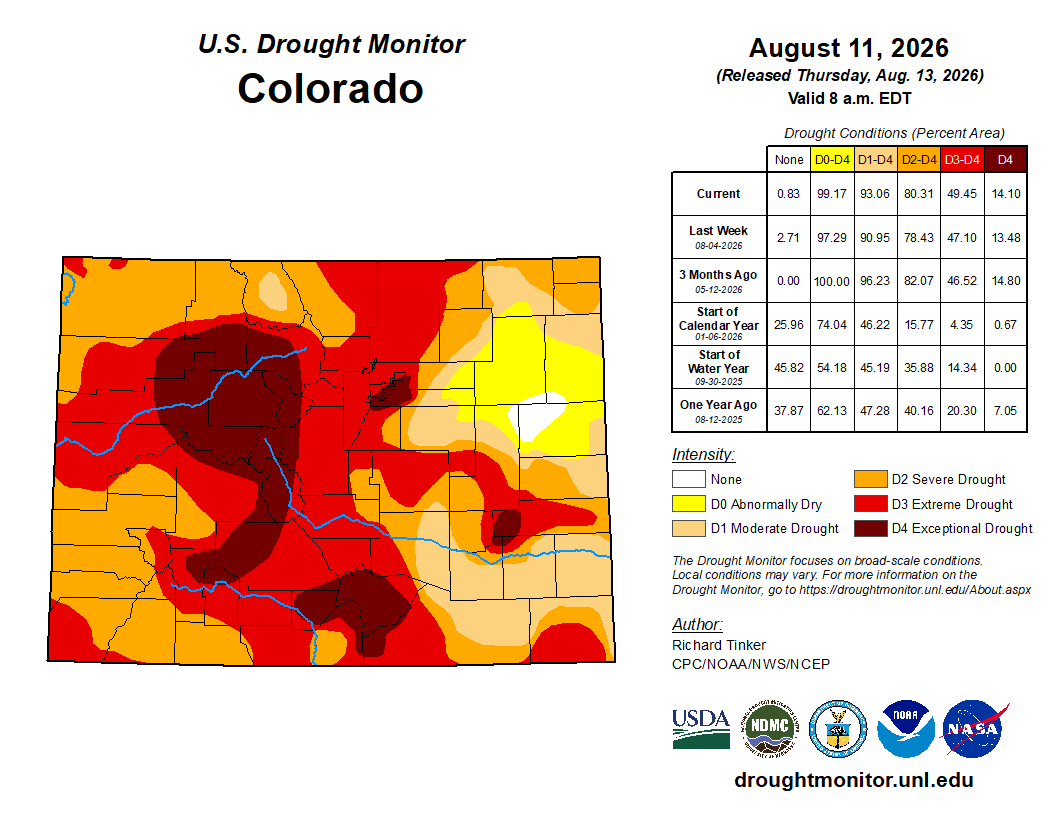
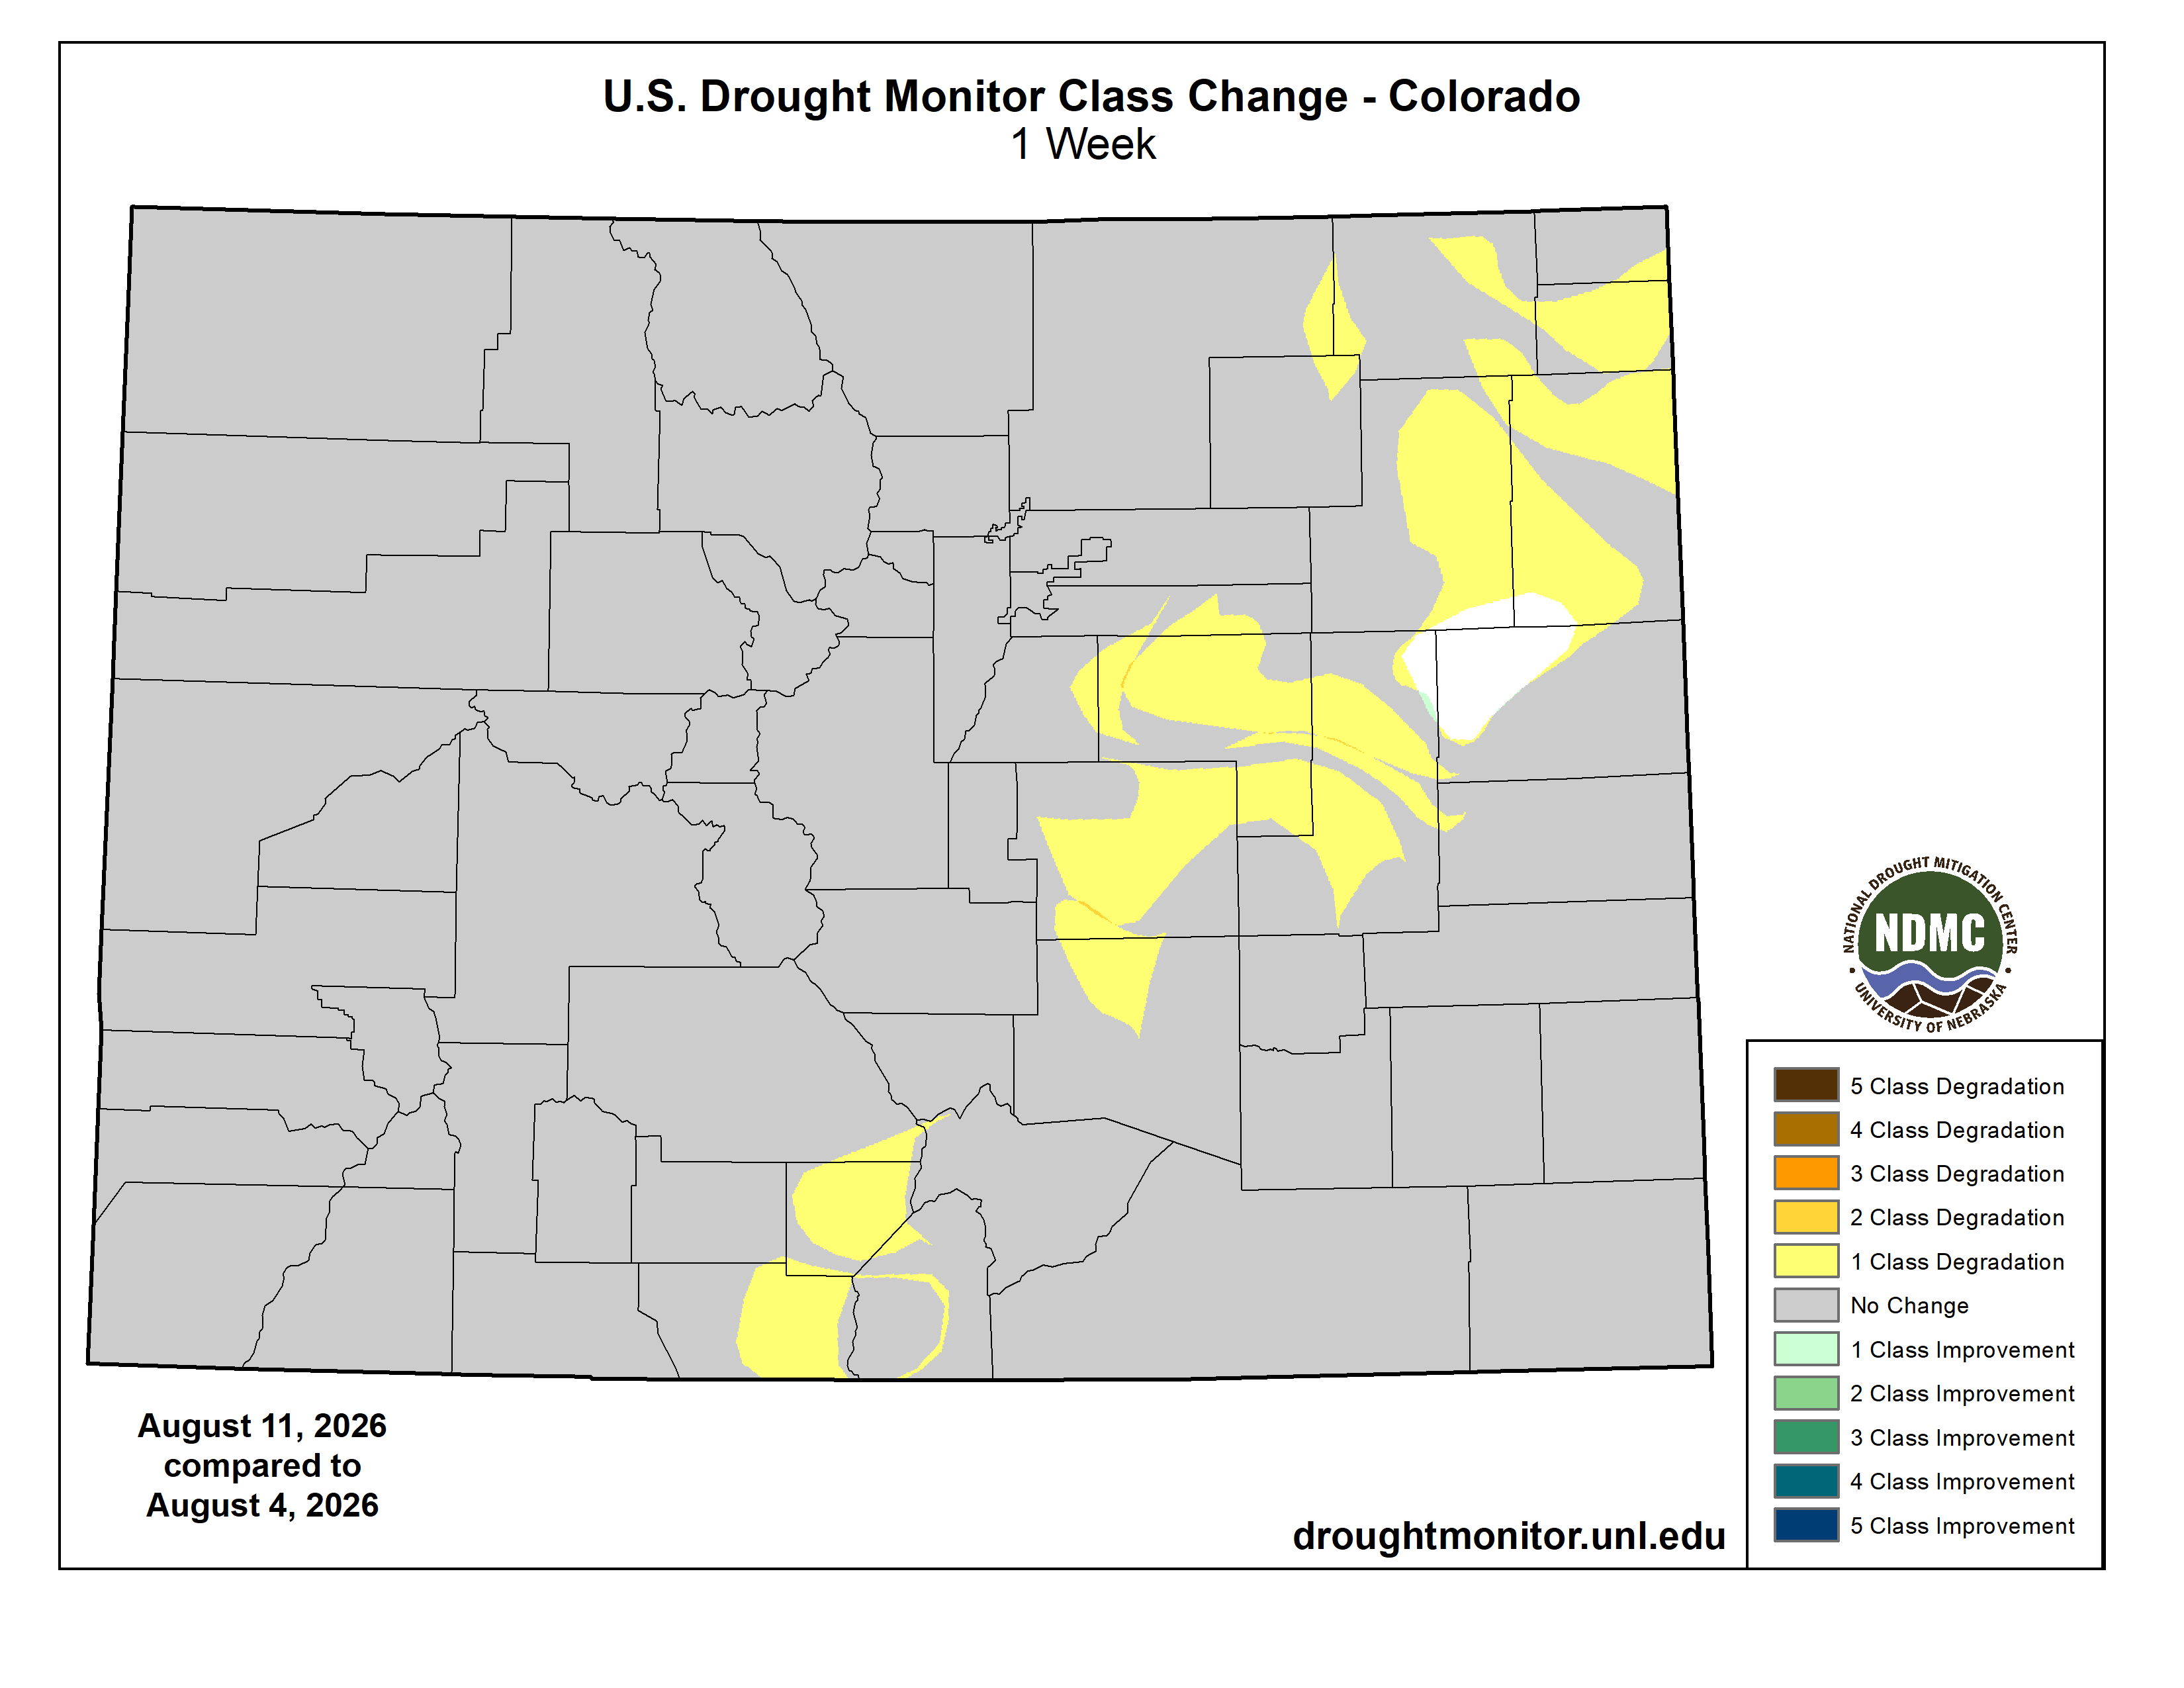
Below is the Colorado Drought Monitor map from August 11, 2026. There were one class degradations in Douglas, Arapahoe, Elbert, Morgan, Weld, Logan, and Sedgwick counties. Drought and abnormal dryness covers 99.17% of Colorado. The South Platte Basin is experiencing Abnormally Dry, Moderate, Severe, Extreme, and Exceptional drought conditions.
Below is the Colorado Drought Monitor one week change map ending August 11, 2026.
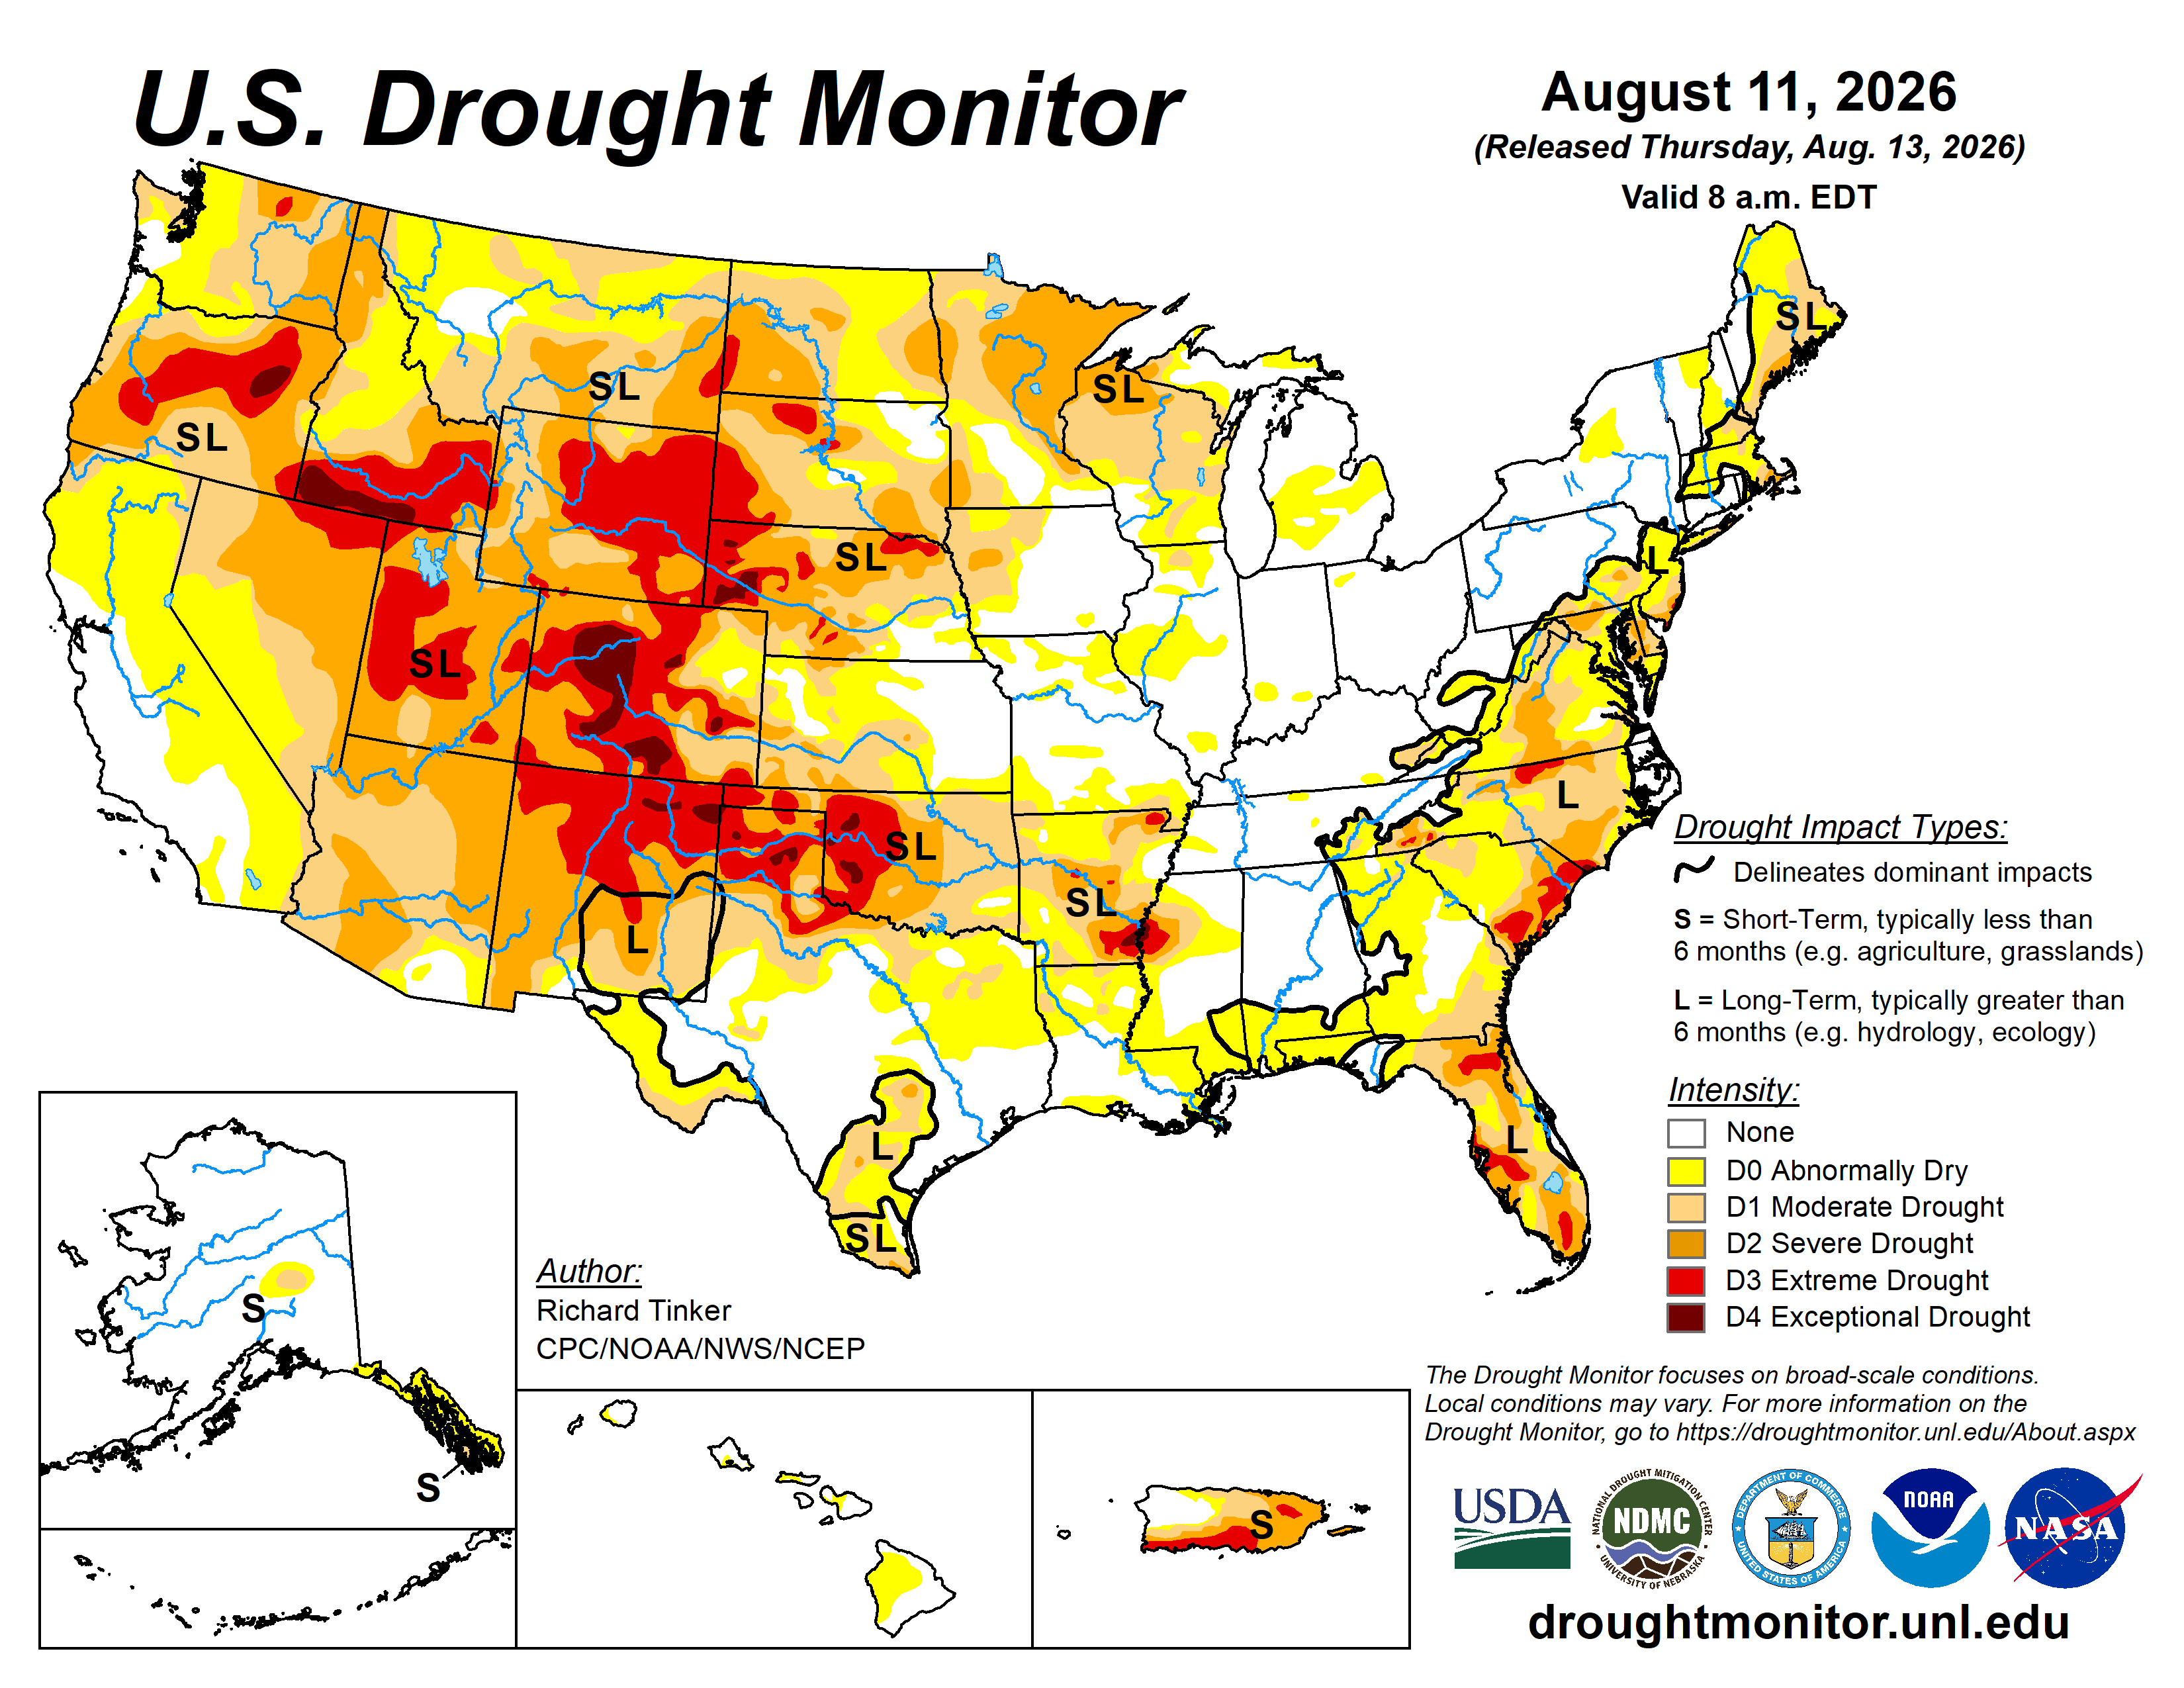
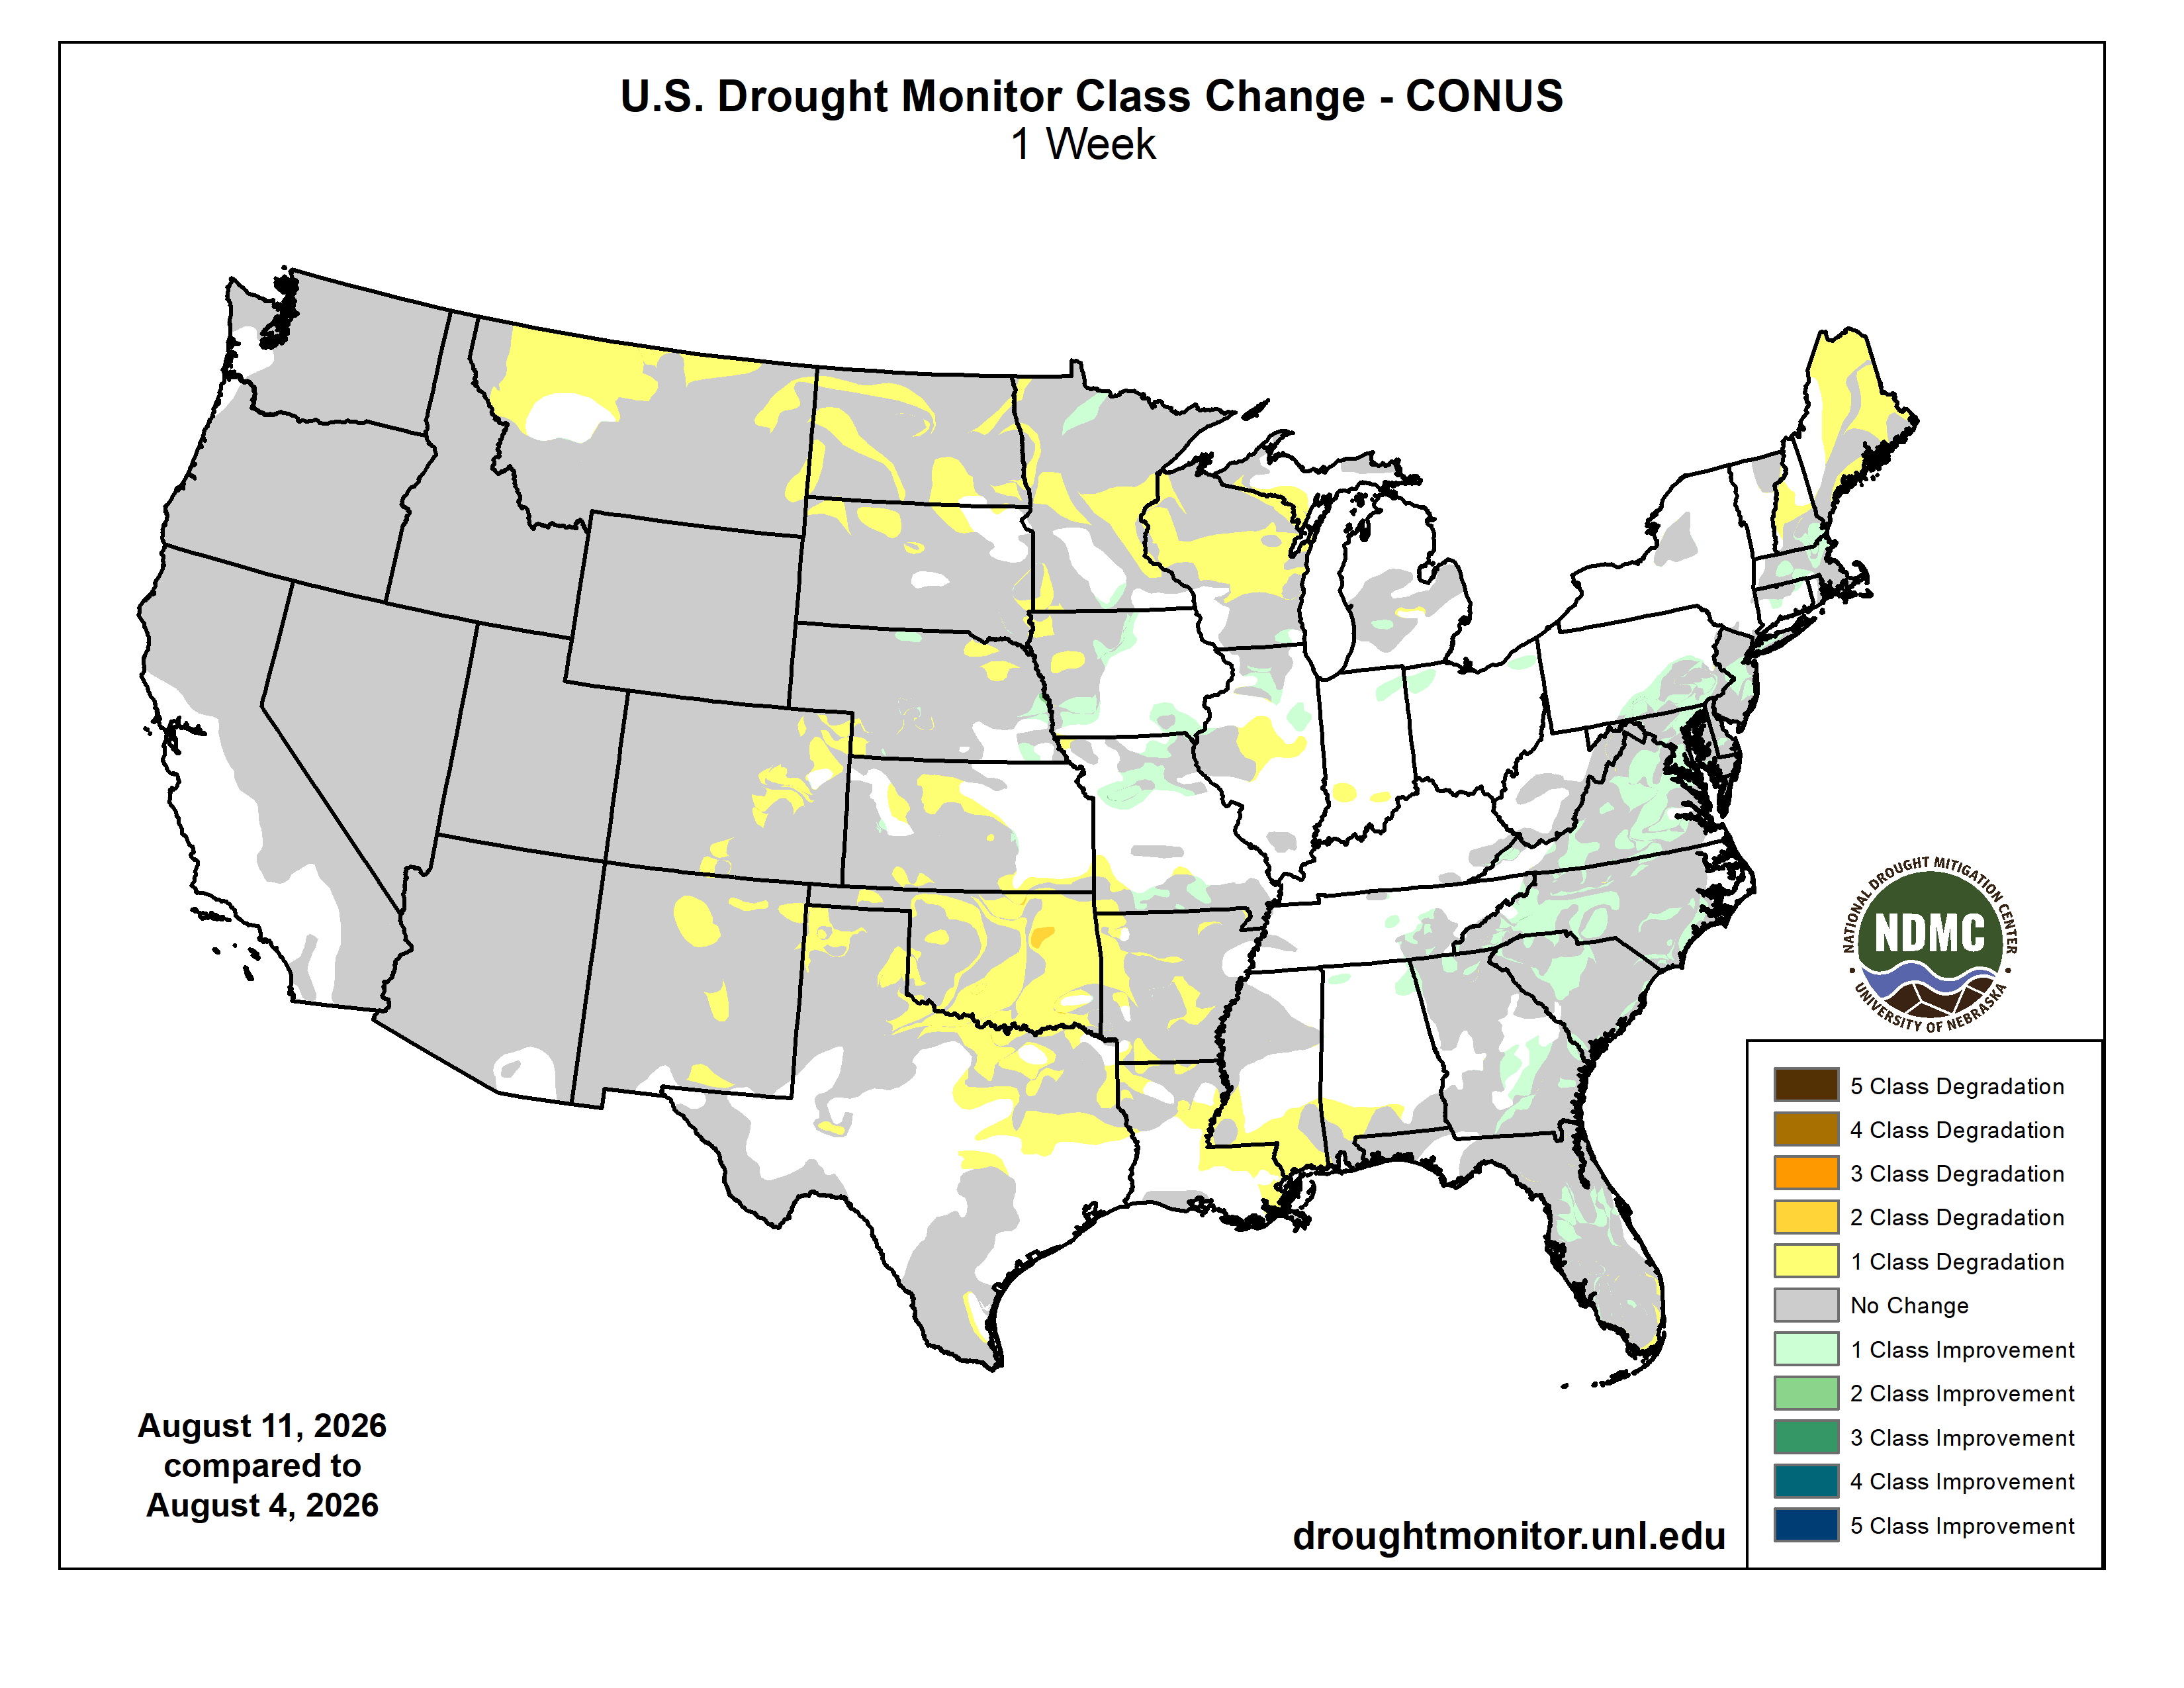
Here’s the US Drought Monitor Map from last week along with the one week U.S. change map.
Finally, Western Water Assessment released their latest Intermountain West Briefing recently. From the briefing:
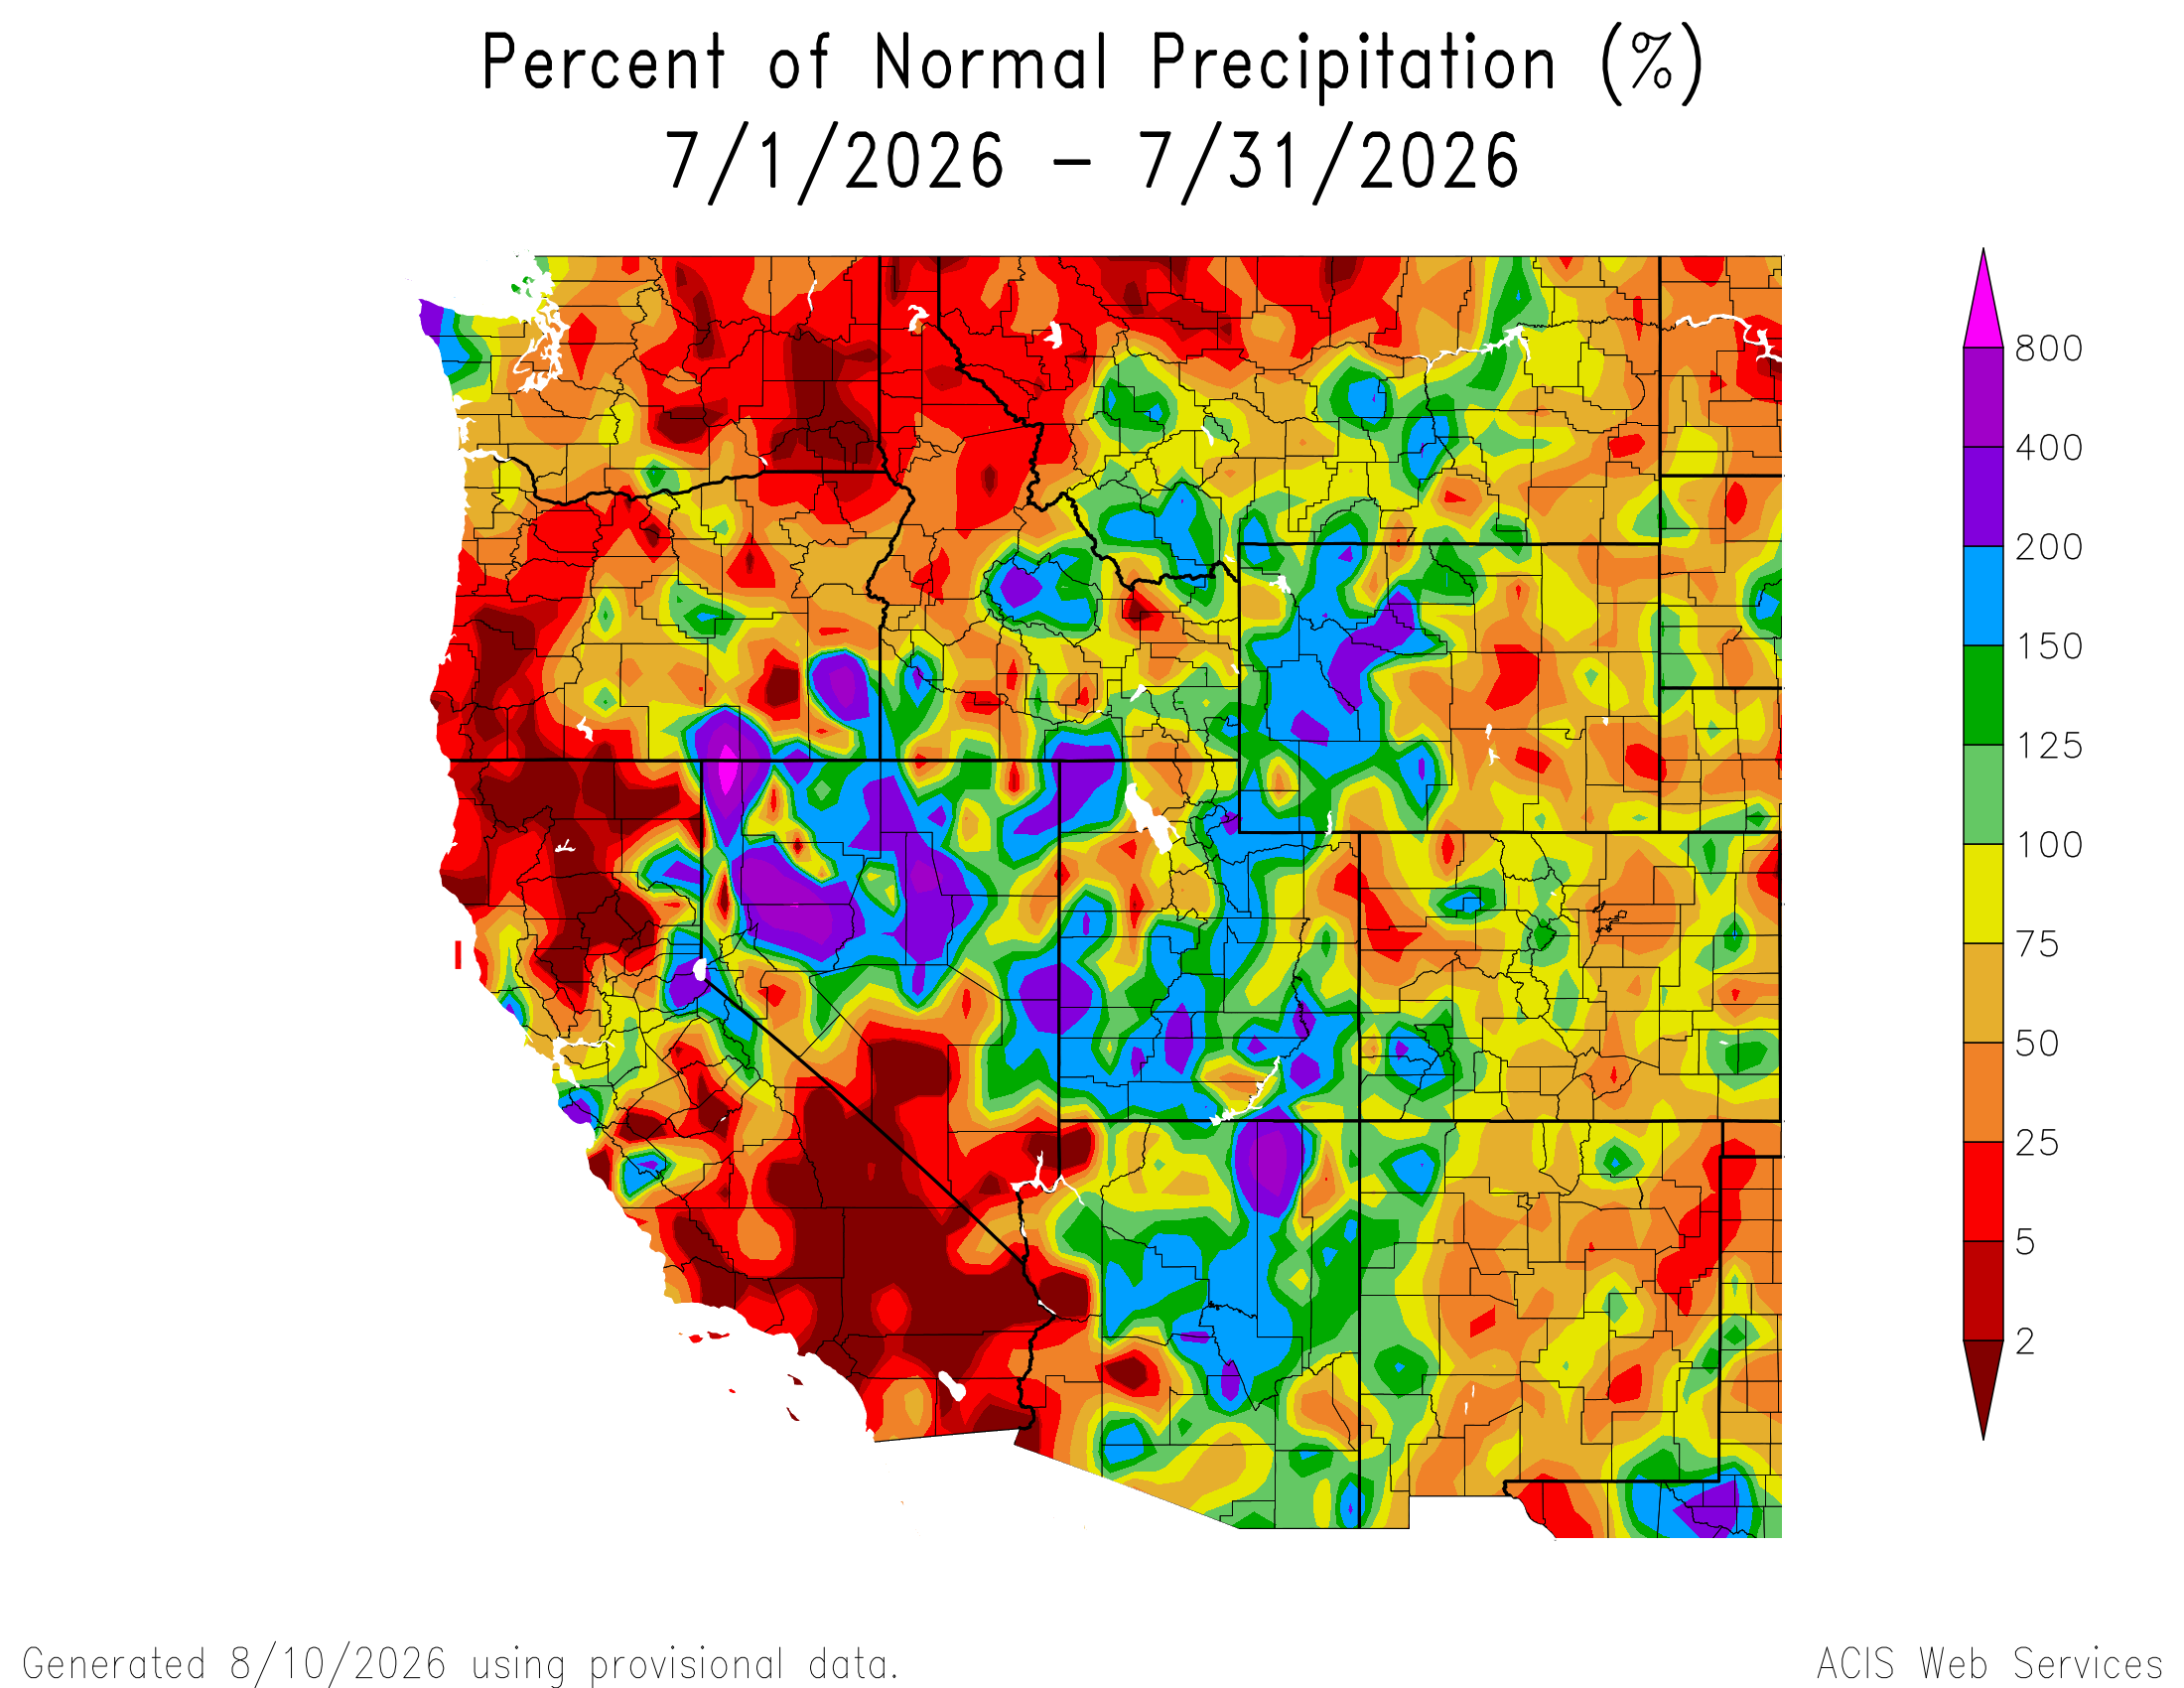
July precipitation was above average across much of Utah, western Colorado and western Wyoming, while below average precipitation fell in eastern Wyoming and much of Colorado. Regional temperatures were above to much above average across the region, and all-time daily maximum temperatures were set across all three states. Drought conditions prevail with 97% of the region covered by drought, and extreme or exceptional drought covered 35-45% of Colorado, Utah and Wyoming. Seasonal NOAA forecasts suggest active monsoonal precipitation and an increased probability of above average precipitation for the next three months. Monsoonal thunderstorms were responsible for six fatalities in Utah during July; a family of five drowned in a flash flood near Bicknell, UT and a hiker was killed by lightning in the Wasatch Mountains near Salt Lake City.Heavy rainfall also caused severe flooding and damage to 200 homes due to debris flows from the Cottonwood Fire burn scar near Beaver, Utah.
Glen Canyon Dam truly is a monumental structure, a 726-foot tall, 5-million-cubic-yard concrete plug that attempts to control and harness the tempestuous waters of the mighty Colorado River. It and the reservoir behind it serve as a water savings account that helps the Upper Basin states comply with the Colorado River Compact during dry years; they capture millions of tons of silt each year that would otherwise flow downstream and fill up Lake Mead; they provide a surface on which boaters can play; and the dam’s hydroelectric turbines are among the West’s largest power plants.
Now climate change-induced aridification and overconsumption has muddled the dam’s ability to serve its intended purposes aside from silt capture. Its savings are depleted, many of the boat ramps are unusable, and hydropower production has declined along with reservoir water levels.
The Bureau of Reclamation is now struggling to keep the dam viable, sort of, by trying to keep Lake Powell’s surface level from falling below 3,500 feet. This avoids reliance on the lower river outlet works, which are not designed for sustained use. But it also allows the dam to continue producing electricity.
Keeping the turbines turning is one of the main reasons the feds give for not even considering the proposal to reengineer the dam — either by fixing the river outlet works or boring a bypass tunnel through the canyon walls — to allow water releases at low reservoir levels. While it would give a lot more flexibility to dam operators and give “life” to currently “dead” storage, it would also zero out the hydropower production upon which, according to the Bureau of Reclamation and media reports, some 5 million people rely. Maximizing hydropower production is also the Bureau’s justification for ending cool mix releases aimed at mitigating smallmouth bass infestations downstream. This imperils both stocked and native endangered fish in the Colorado River.
This raises the question: What is the deal with hydropower and Glen Canyon Dam? And is it really that important to the Western power grid?
A visual look at Glen Canyon and Hoover Dam’s 2025 energy output compared to other generators in the Southwest (CA, NV, UT, CO, AZ, NM). Click here for an interactive look. Source: Land Desk dataviz using EIA data.
Eight generators sit at the toe of the dam, fueled by water channeled from the reservoir through the dam’s eight penstocks. Each generator has a nameplate capacity, or maximum rated output, of 165,000 kW, or 165 MW, for a total generating capacity of 1,320 MW, on a par with a large coal power plant (the Four Corners plant has a 1,540-MW capacity). In other words Glen Canyon Dam is a big power plant.
But capacity is really just potential, and what really counts is how completely and in what manner the power plant lives up to its potential. In that respect, Glen Canyon Dam has been a bit of a slacker lately.
That 1,320 MW of capacity is only true when the reservoir is at full pool, or 3,700 feet, when the water pressure needed to turn the turbines is at its highest level. As Lake Powell’s water levels drop, so does the hydroelectric “head,” or the vertical distance that the water falls, along with the water pressure. When the reservoir is full, or the level is at 3,700 feet, it takes about 1.9 acre-feet of water to generate 1 megawatt-hour of energy. At 3,500 feet, it takes 2.9 acre-feet to generate the same amount of electricity. As a result, at the reservoir’s current level (approx. 3,520 feet), the dam’s power plant has a capacity of just about 730 MW.
As the reservoir’s surface level drops, so too does water pressure, which in turn diminishes the turbine’s power capacity. The reservoir’s pool elevation sat just above 3,520 feet on August 13, 2026. Source: Bureau of Reclamation.
Naturally, a power plant’s output is also going to be determined by how much fuel you feed it, which in this case is water run through the penstocks, or releases from the dam. Back in the 1980s, when the reservoir was full (and then some), Glen Canyon Dam’s annual output was nearly 9 million megawatt-hours, or enough to power about 869,000 average American households for one year. But in 2025, it only produced 2.75 million megawatt-hours, or enough to power 269,370 homes. This year’s output will be considerably lower, since both reservoir levels (and thus, generating capacity) and dam releases have dropped significantly.
Glen Canyon Dam’s electricity production varies according to reservoir levels and releases through the penstocks/turbines. Source: Western Area Power Administration.
It throws the claims that some 5 million people rely on the power plant into dubious light, but it is still a lot of energy: Last year, Glen Canyon Dam had the 15th largest output among the Southwest’s hundreds of utility-scale power plants. But its output is dwarfed by Palo Verde nuclear plant’s 31.2 million megawatt-hours annually. Even Four Corners coal plant, which shuttered two of its units a decade ago, still puts out more than 8 million megawatt-hours per year, three times that of Glen Canyon. (Hoover Dam has a higher nameplate capacity than Glen Canyon, but its 2025 output was about the same as Glen Canyon’s).
Glen Canyon Dam is the largest generator in the Colorado River Storage Project, which is a part of the federal Western Area Power Administration’s Salt Lake City Area/Integrated Projects. WAPA markets the power from these projects at relatively low rates to about 140 municipalities, cooperatives, tribal nations, irrigation districts, and utilities across the West. Last year’s power sale revenues from WAPA’s SLCA projects totaled almost $179 million, money that goes into the Basin Fund, and then is used to operate the dams and other infrastructure, to purchase replacement power, to pay off debt, and to fund endangered species programs.
A hydropower dam’s value goes beyond its ability to produce a steady stream of energy and revenue. The power grid must stay in balance at all times, meaning that supply — or generation — must always be equal to demand. Throw off the balance and you risk a cascading failure that can lead to wide scale outages. Hydropower is super flexible, meaning a turbine’s output can be ramped up or down quickly by simply changing the amount of water entering the penstock. As more and more solar and wind, or variable renewable resources, are added to the grid, balancing the ups and downs becomes more challenging, making flexible tools like hydropower more critical.
In theory, Glen Canyon Dam’s operators could hold back water throughout the middle of the day, when electricity demand is lower and solar output is highest, and then open up the penstocks full blast in the late afternoon and evening, when solar drops off and the air-conditioners come on, driving up electricity demand, or load. Similarly, they could fire up the turbines, so to speak, if another power plant on the grid malfunctioned.
For the first 30 years of its existence, Glen Canyon Dam’s operators were fairly free to operate the power plant as a sort of grid-balancing peaker plant. On one July day in 1989, for example, the operators choked off flows to the turbines in the early morning hours when power demand was low, so that about 3,471 cubic feet of water per second was running through the dam at 5 a.m., a virtual trickle for the Colorado. As the day heated up and power demand climbed (there was barely any solar on the grid back then), they cranked up the amount of water flowing through the turbines and into the river to a monstrous 29,000 cfs—the maximum possible flow through the turbines—to inject a bunch of juice into the grid.
This was good for the grid, and good for revenues from power sales, since energy costs more during peak demand. It wasn’t so good for the river downstream or the folks who were using it, however. Imagine being a rafter on the Grand Canyon and watching the mighty Colorado shrink to less than 4,000 cfs, before growing more than eight times that in just 12 hours. That could wreak some serious havoc on one’s trip and, I imagine, a fish’s mojo.
Dam operators at the time wanted to further optimize this grid-balancing ability by installing turbines in the river outlet works so they could release more water and generate more power (and create even greater flow fluctuations downstream). The proposal was not only shot down, but also set off a string of events that ultimately led to the 1992 Grand Canyon Protection Act and the dam’s adaptive management program, which mandate minimum and maximum release rates and limit release fluctuation rates to protect Colorado River recreation and ecosystems downstream of the dam. The dam still serves as a grid-balancing tool, with releases and power generation peaking in the afternoon and reaching their low point in the early morning hours. But its effectiveness has been eroded by both the restrictions and by reduced capacity resulting from lower water levels.
Glen Canyon Dam is less and less critical to the Southwestern power grid with each passing year, and its importance is likely to continue to decline as aridification continues to rob it of its ability to produce power, and as more battery storage comes online to take up its grid-balancing role.
If and when Glen Canyon Dam loses its ability to produce power, it won’t result in millions of people sitting around in the dark with non-functioning air-conditioners. Nor will it bring back shuttered coal plants. The coal-fired Navajo Generating Station just up the road from Glen Canyon Dam put out more than 17 million MWh annually; it shut down in 2019 without crashing the grid or even causing noticeable strain. Same goes for the San Juan and Cholla coal plants.
Back in 2013 the San Onofre nuclear plant near San Diego shut down with little warning due to safety concerns. In the immediate aftermath, natural gas generation spiked as grid operators scrambled to replace the lost generation. But over time, as solar and wind and battery storage capacity was added to the state’s grid, the surge in gas generation subsided. Something similar — although at a much smaller scale — is likely to happen when Glen Canyon goes offline.
Which makes one wonder: Is it really worth it for the feds to expend so much energy and resources, to imperil downstream recreation and endangered fish, and cause so much Lower Basin gnashing of teeth and wringing of hands and possibly filing of lawsuits, to preserve a dam that just isn’t doing what it was intended to? [ed. emphasis mine]
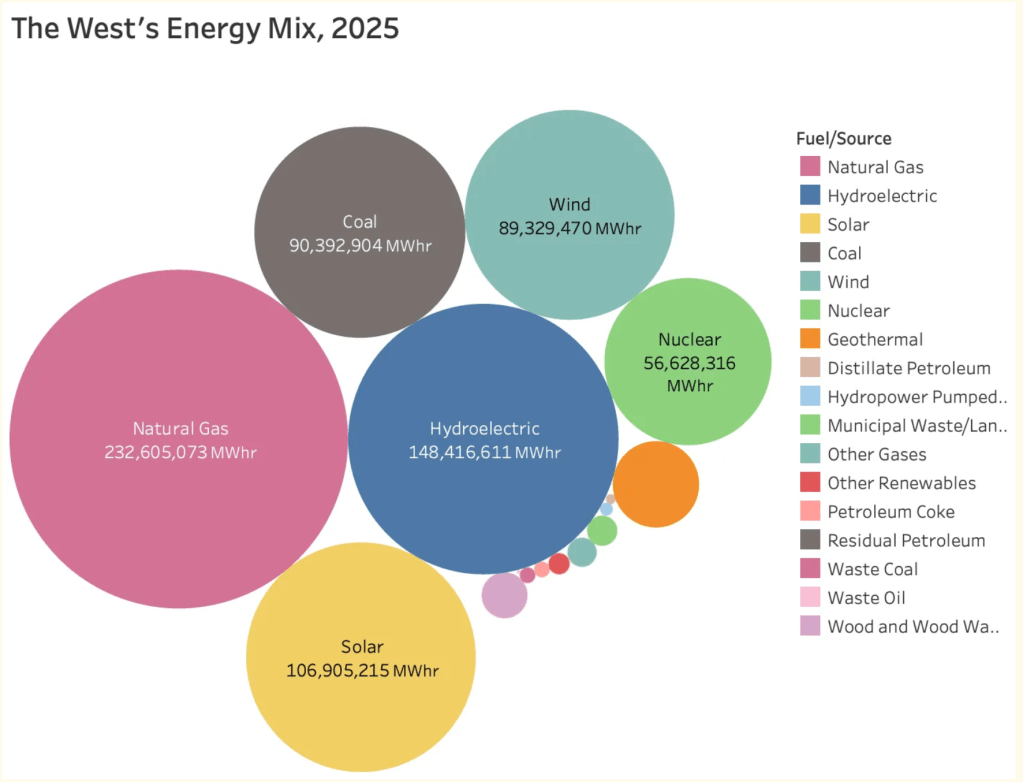
As long as we’re talking energy generation, I figured I’d give a little bit of a wider — and not quite as positive — view of the West’s energy generation and the transition. You may remember that last week I delivered the good news about solar taking over the grid — for the month of May. When you look at the same stats over the entire year of 2025, it doesn’t look quite so rosy, since natural gas generation clearly dominates the grid, at least for now.
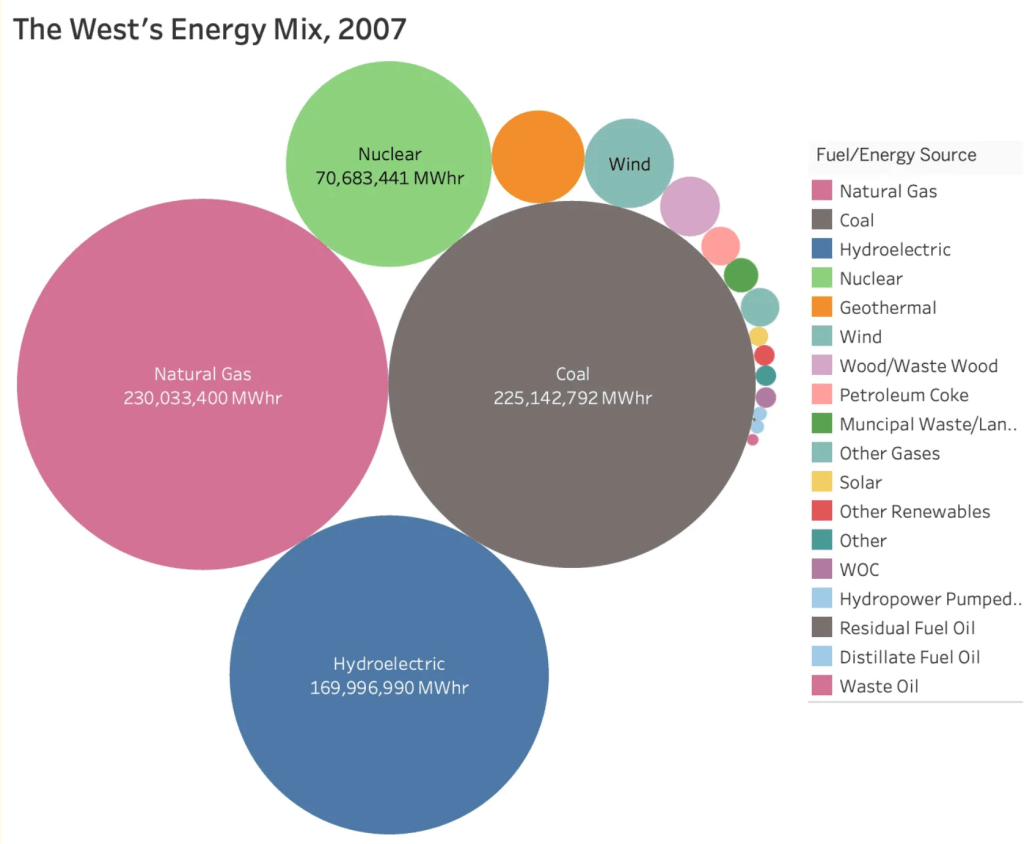
In search of some salvation, I went back to 2007 to make a comparison. Back then coal was king of the Western grid (with natural gas as queen), and solar was basically non-existent.
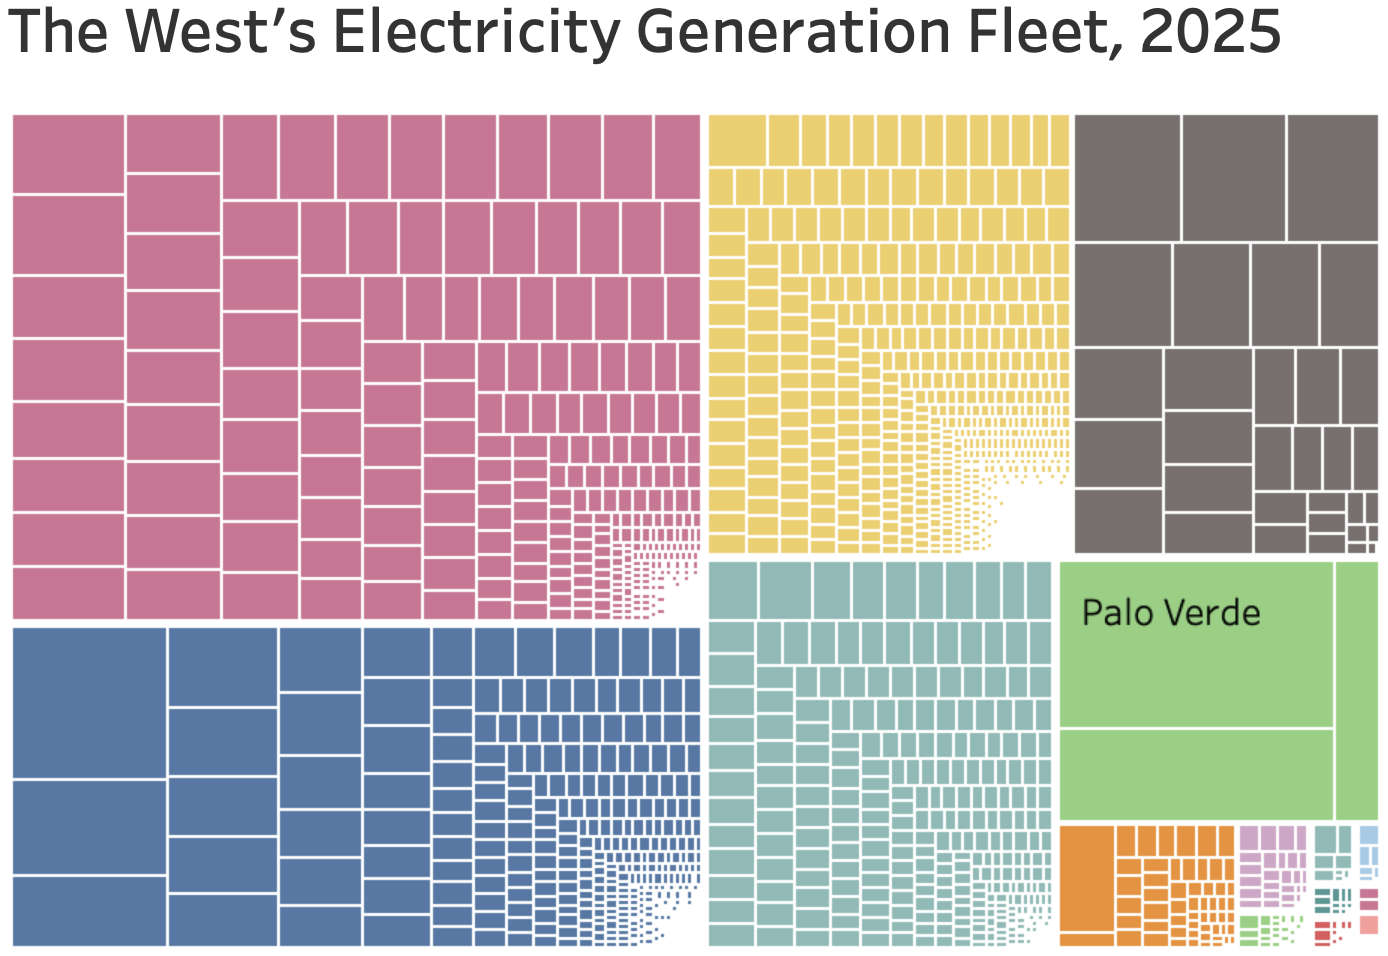
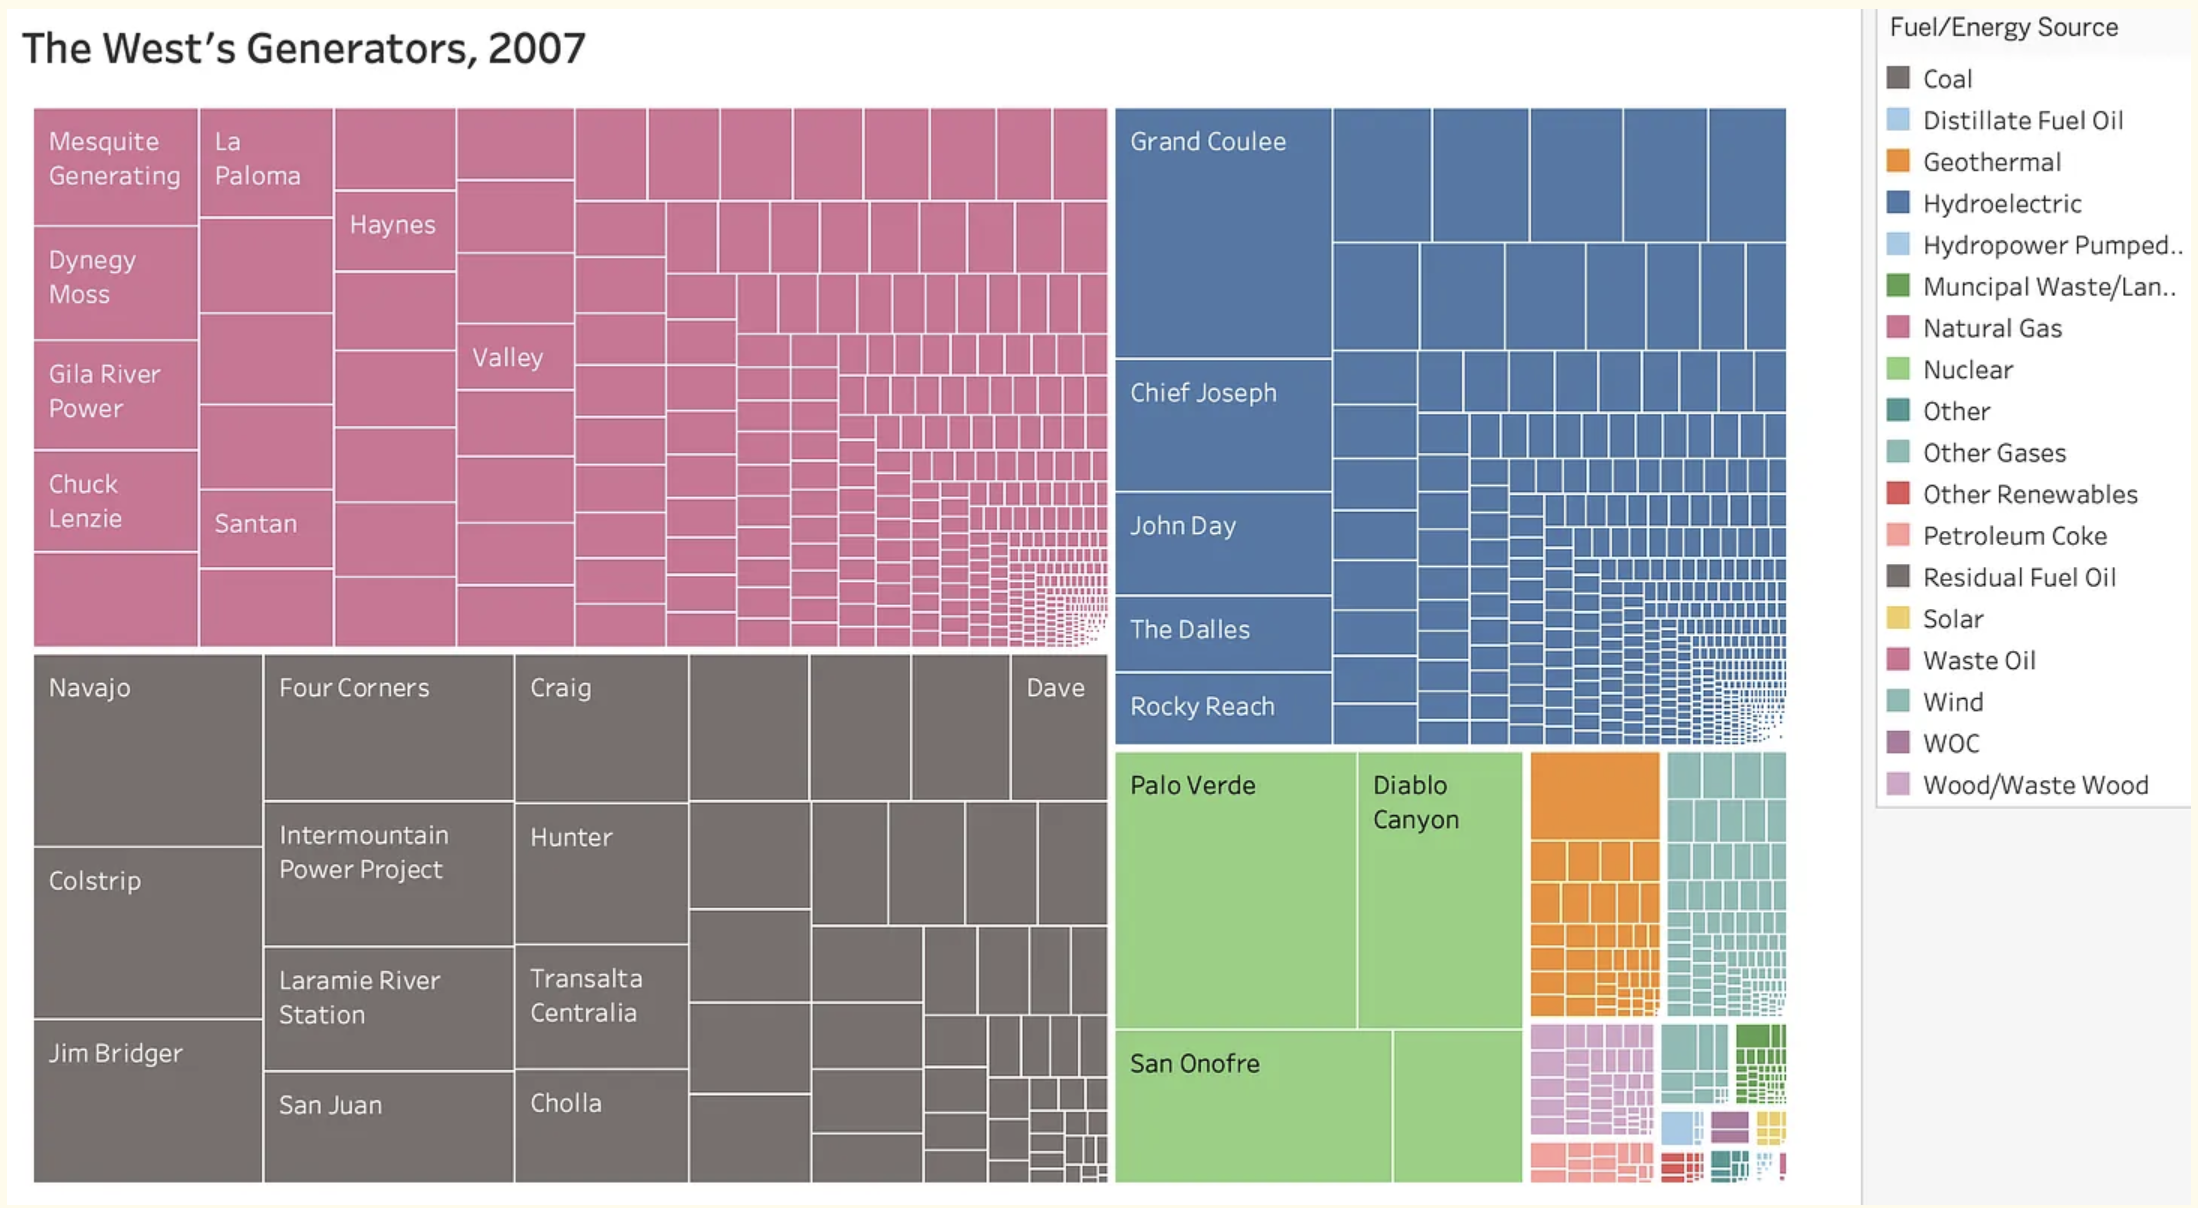
These graphics are available as interactive visualizations with a lot more information on every generator at Tableau. Unfortunately, I still don’t know how to embed them into Substack so that you can view them in situ. For a better view, click on the image or link in each caption.
In 2025, natural gas generation dominated the Western grid, with hydropower and solar rounding out the top three. Coal and wind are in a virtual tie for fourth place. Source: Land Desk dataviz made with EIA data.
This viz shows all of the generators of each kind on the Western grid sized in proportion to 2025 output. You can see that nuclear power plants are big, but few in number; solar plants are generally smaller and spread out. Source: Land Desk dataviz made with EIA data.
Looking at 2007, one can see the massive decline in coal-fired generation over the last couple of decades and the big buildup of solar. Most of the lost coal generation was replaced by solar and wind, not natural gas. Source: Land Desk dataviz using EIA data.
A look at the coal generators shows just how many huge coal plants have retired since 2007: e.g. Navajo, San Juan, Cholla, Centralia. Also note in the nuclear section that San Onofre is also gone. Source: Land Desk dataviz using EIA data.