Highlights from ‘State of the Climate in 2025’ — Climate.us

Click the link to read the release on the Climate.us website:

August 10, 2026

This press release text is by the American Meteorological Society. The graphics and captions are by Climate.us. 

####

According to the 36th annual State of the Climate report, greenhouse gas concentrations, global sea level, and ocean heat content all reached record highs in 2025.
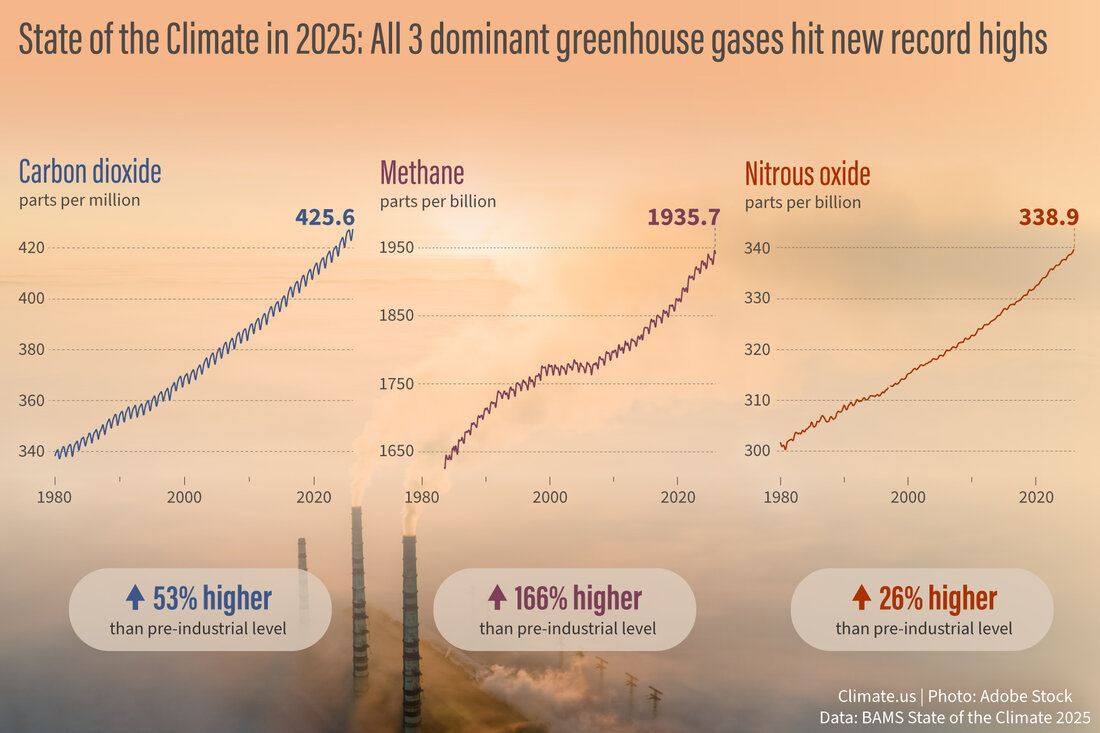
Three line graphs showing rising amounts carbon dioxide, methane, and nitrous oxide from 1980 to 2025. The amounts are 53%, 166%, and 26% higher than pre-industrial levels, respectively. The data is overlaid on a hazy Adobe stock photo of a smokestacks from a power plant churning out smoke and water vapor.
The three dominant greenhouse gases in Earth’s atmosphere—carbon dioxide (left), methane (center), and nitrous oxide (right)—all reached new highs in 2025. Climate.us image, adapted from Figure 2.61 in the BAMS State of the Climate in 2025. Background photo from Adobe Stock.

The international annual review of the world’s climate, published by the American Meteorological Society (AMS), is based on contributions from 625 scientists in 60 countries. It provides the most comprehensive update on Earth’s climate indicators, notable weather events, and other data collected by environmental monitoring stations and instruments located on land, water, and ice, as well as in space. The report is published as a supplement to the Bulletin of the American Meteorological Society (BAMS).

“The State of the Climate is a comprehensive, collaborative international effort to assess annual metrics for the atmosphere, oceans, and cryosphere,” says AMS President Alan Sealls. “It’s peer-reviewed data that paints a global picture of where we are, compared to benchmarks, and how fast things are changing. Consider it analogous to your annual health assessment from your physician. The State of the Climate connects to the health of all ecosystems. It presents critical measurements and trends which inform agencies, communities, businesses, and individuals for long-term planning.”

Notable findings from the international report include:

  • Earth’s greenhouse gas concentrations were the highest on record.Carbon dioxide (CO2), methane, and nitrous oxide⁠—Earth’s major atmospheric greenhouse gases⁠—once again reached record-high concentrations in 2025. The globally averaged CO2 level reached 425.6±0.1 parts per million, a 53% increase from the preindustrial level of ~278 ppm. Fossil fuel emissions in 2025 were also a record high in 2025, estimated to be 10.3±0.5 petagrams of carbon per year, more than three times the 3.0±0.2 petagrams of carbon per year in the 1960s. 
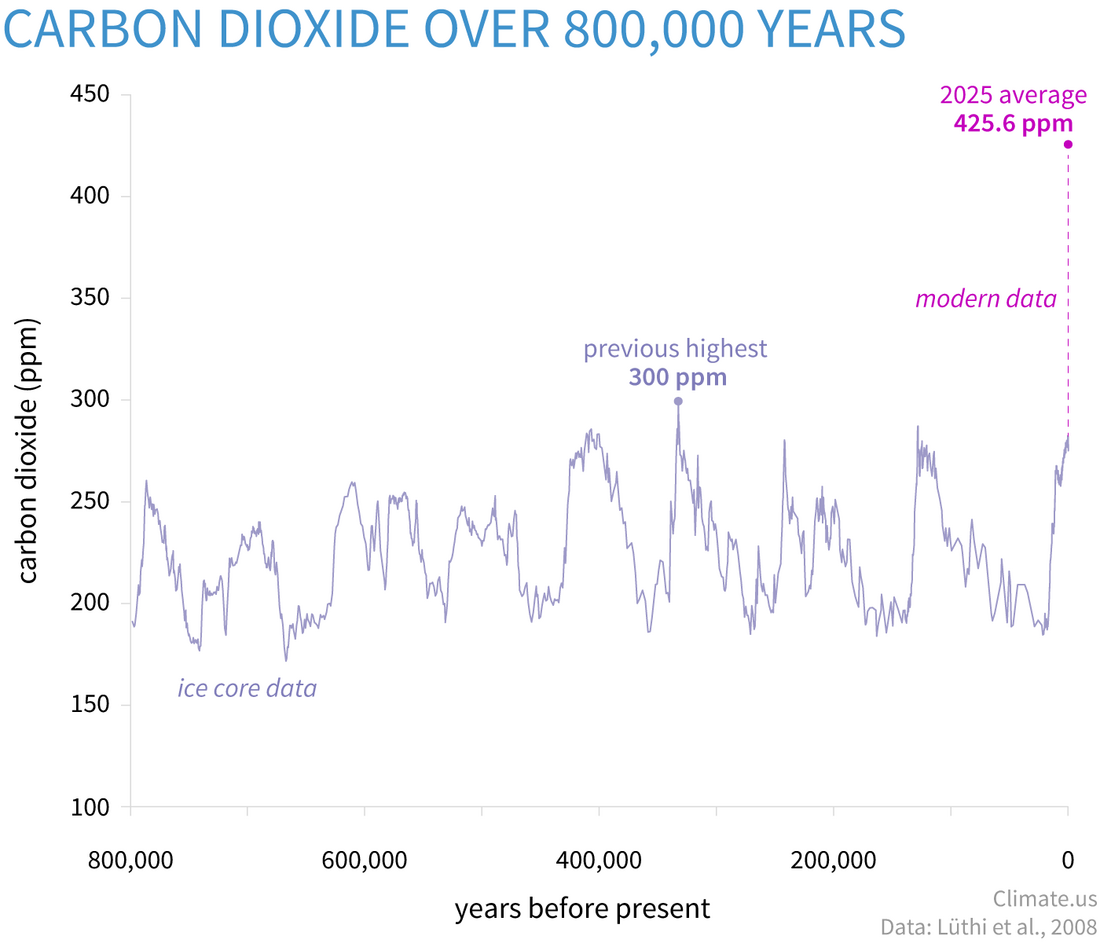
Atmospheric carbon dioxide (CO2) in parts per million (ppm) for the past 800,000 years based on ice-core data (light purple line) compared to 2025 concentrations (bright magenta dot). The peaks and valleys in the line show ice ages (low CO2) and warmer interglacials (higher CO2). Throughout that time, CO2 was never higher than 300 ppm (light purple dot, between 300,000 and 400,000 years ago). The increase over the last 60 years is 100 times faster than previous natural increases. In fact, on the geologic time scale, the increase from the end of the last ice age to the present value of 425.6 ppm (dashed magenta line) looks virtually instantaneous. Graph by Climate.us based on data from Lüthi, et al., 2008, via NOAA NCEI Paleoclimatology Program.
  • Record and near-record temperatures were notable across the globe. The global mean temperature across land and ocean was among the three highest years on record, with records dating back as far as the mid-1800s. Near-neutral and La Niña-like conditions occurred in the eastern Pacific Ocean throughout the year, making 2025 the warmest year on record in which no El Niño conditions were present. Europe reported its warmest year on record, and Russia, China, the Republic of Korea, and Argentina each reported their second warmest. All five major global temperature datasets used for analysis in the report agree that the last 11 years (2015–25) were the 11 warmest on record. 
  • Despite cool ENSO and weak La Niña conditions, sea surface temperatures were at near-record-high levels. Cool ENSO (El Niño-Southern Oscillation) conditions were sandwiched between weak La Niña conditions during 2025. Despite the cooler conditions in the equatorial Pacific Ocean throughout much of 2025, the mean annual global sea surface temperature was the third highest in the 172-year record, and 0.38°C above the 1991–2020 average. Approximately 87% of the ocean surface experienced at least one marine heatwave in 2025. Only 26% of the ocean surface experienced at least one marine cold spell. 
  • Ocean heat and global sea level were the highest on record. Over the past half-century, the oceans have stored almost 90% of the excess energy trapped in Earth’s system by greenhouse gases and other factors. The global ocean heat content, measured from the ocean’s surface to a depth of 2000 m, continued to increase, and reached new record highs in 2025.
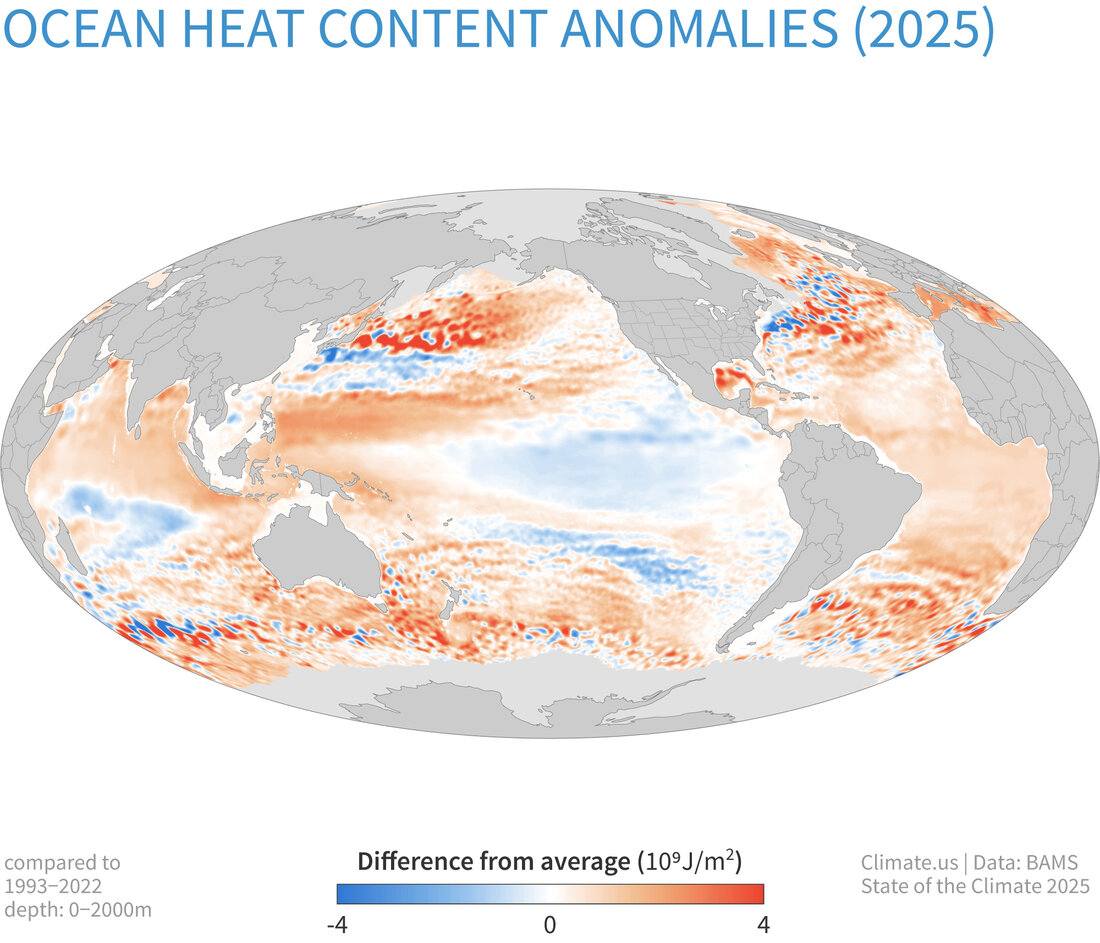
Global map showing the large areas of the ocean that are warmer than average compared to 1993-2022.
Global map of ocean heat content in the upper 2,000 meters (1.2 miles) of the ocean in 2025 compared to the 1993-2022 average. More places are warmer than average (orange) than cooler (blue). Adapted from Figure 3.5a in State of the Climate 2025 from the American Meteorological Society.

Global mean sea level was a record high for the 14th consecutive year, reaching about 111.2 mm above the average for 1993, when satellite altimetry measurements began. Warming oceans have contributed an average of 1.6±0.3 millimeters per year to rising sea levels since 2005, while melt from ice sheets and glaciers has contributed an average of 2.0±0.4 mm during that same period.
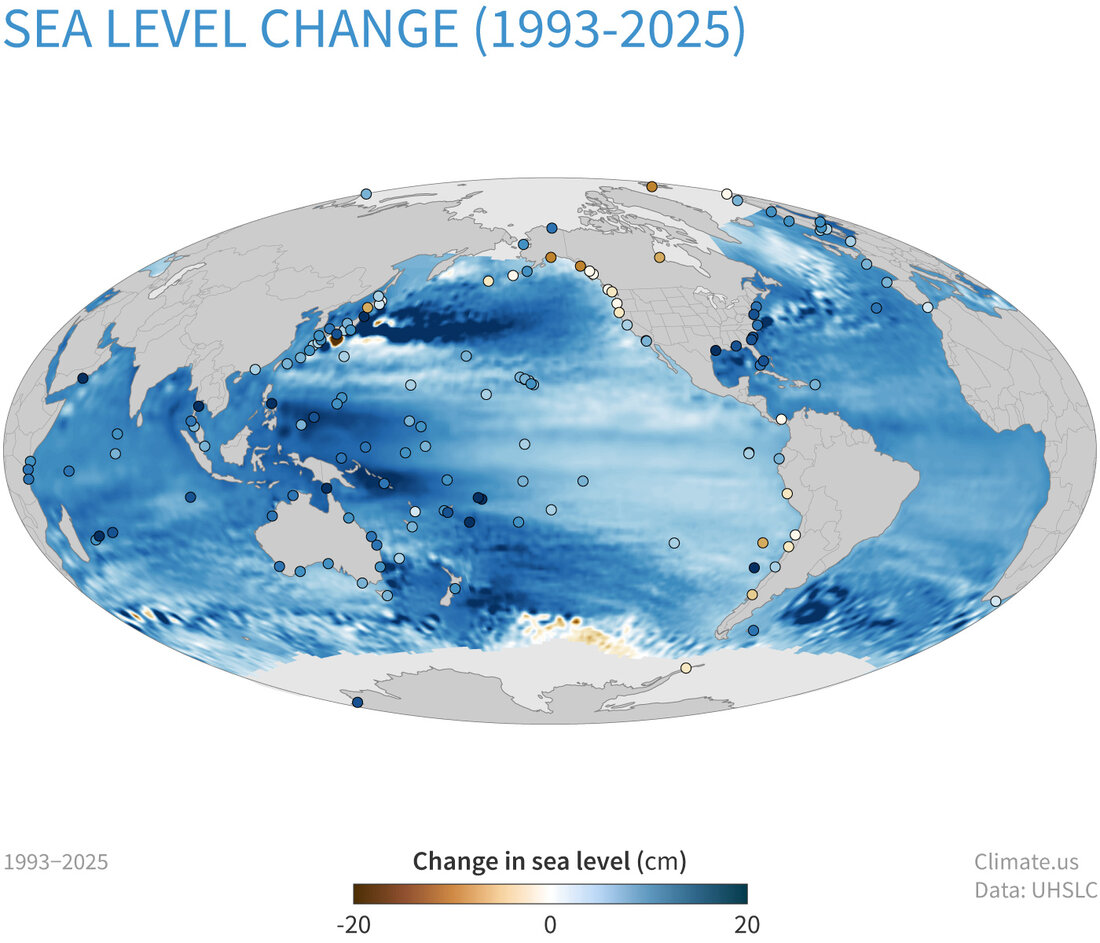
Global map of the change in the height of sea levels from 1993 to 2025, based on satellite and station data. The data is scaled from -20 to +20 cm in shades of brown and blue. Dots show the location of individual stations.
Between 1993 and 2025 mean sea level has risen across most of the world ocean (blue colors). In some ocean basins, sea level has risen 6-8 inches (15-20 centimeters). Rates of local sea level (dots) on the coast can be larger than the global average due to geological processes like ground settling or smaller than the global average due to processes like the centuries-long rebound of land masses from the loss of ice-age glaciers. Map by Climate.us based on data from University of Hawaii.
  • The Arctic saw near-record warmth. The Arctic had its second-warmest year in the 126-year record. Surface air temperatures in the Arctic are increasing at roughly three times the global average rate. Precipitation is also increasing across the region. In response to the precipitation and temperature increases, tundra plants have been increasing; 2025 marked the third highest value in the record with respect to greenness, a measure of the increase in plants and productivity. 
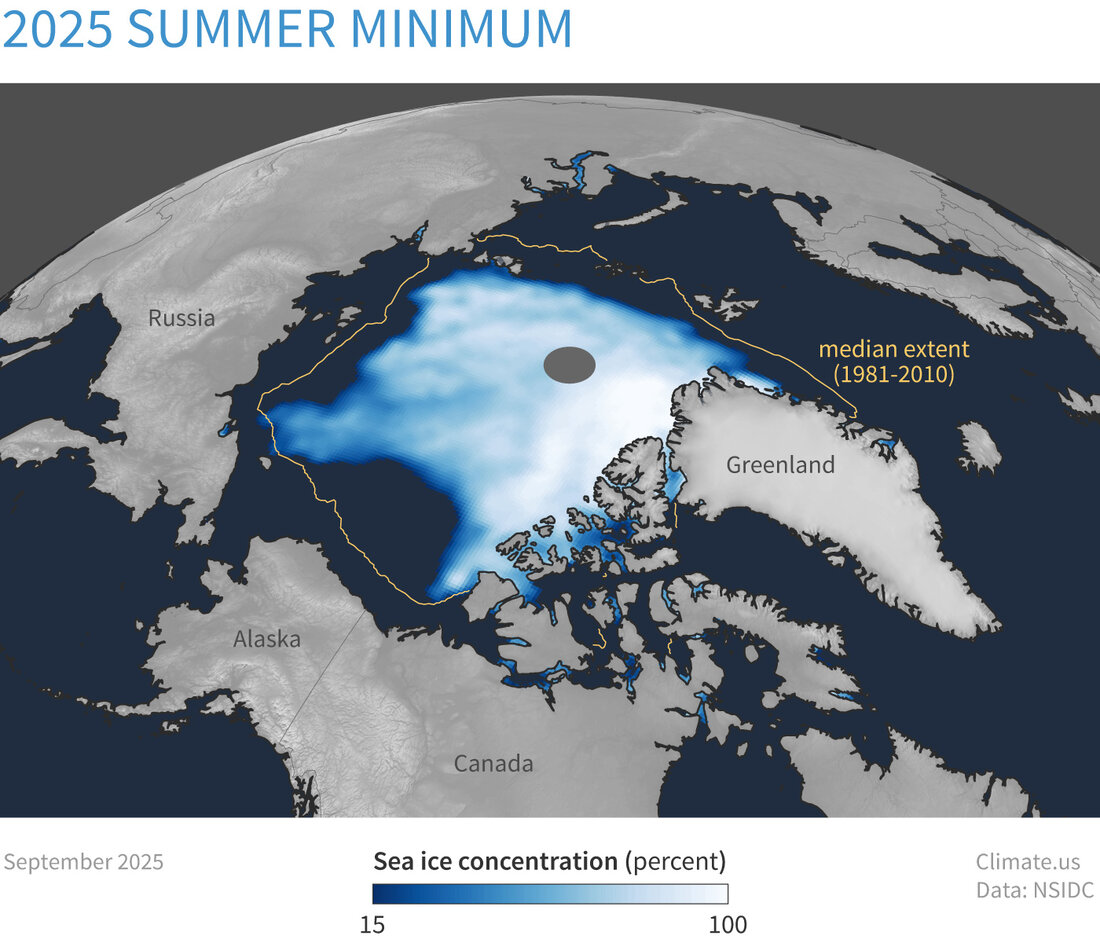
Map of Arctic Sea ice summer minimum extent for September 2025. The orange line shows the 1981 to 2010 average extent for that month. Climate.us image, based on data from the National Snow and Ice Data Center.
Sea ice concentration in September 2025, the month with the smallest ice extent of the year. Extent is the total area of ocean that’s at least 15 percent ice covered. The gold line is the median extent for 1981-2010: half of years had smaller extents, half had larger. Map by Climate.us, based on data from the National Snow and Ice Data Center.

In Arctic waters, maximum sea ice extent in 2025 was the lowest in the 47-year record, while minimum extent was the 11th lowest. The thickness of the sea ice, which is related to its age, has also been decreasing over time. Ice older than four years old is nearly absent, with only 95,000 square kilometers of older ice in September 2025 as compared to 1.5 million square kilometers in the 1980s.
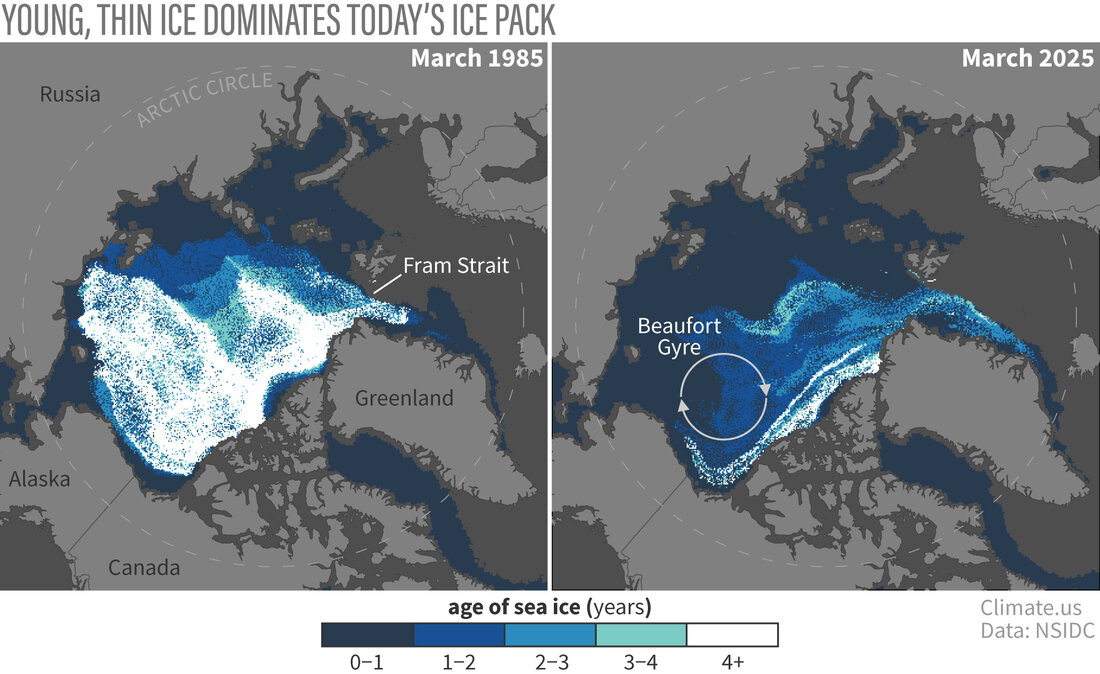
Two maps comparing Arctic sea ice age in March 1985 versus 2025. Only a small strip of very old ice remains, tucked up against the islands of the Canadian Arctic. More than half of the winter ice pack was less than a year old (dark blue).
Routine observations of Arctic sea ice thickness only began a little over a decade ago. Experts use the age of the ice pack—which has been observed since the 1980s—as a proxy for ice thickness. In March 1985 (left), the winter maximum ice pack was dominated by ice at least 4 years old (white). In 2025 (right), only a small strip of very old ice remained tucked up against the islands of the Canadian Arctic. More than half of the winter ice pack was less than a year old (dark blue). Historically, the Beaufort Gyre served as a nursery for young, growing ice, but conditions have grown too warm for ice to persist there. Climate.us image, based on data from the National Snow and Ice Data Center.
  • Antarctica saw record warmth and continued low sea ice. Antarctica observed its warmest year since the start of the record in 1979. Surface melt on the continent was above average on most ice shelves, and melt on the Antarctic Peninsula approached record levels in early January. Surrounding the continent, sea ice remained below average in 2025, following a nearly decade-long trend. Annual daily maxima and minima of sea ice extent were the third and fourth lowest on record, respectively. 
  • Glaciers around the world continued to melt. Land-based glaciers continued to lose ice for the 38th consecutive year, losing the equivalent of more than 1 meter of water on average for the fourth straight year. About 41% of the loss experienced by glaciers since 1976 has occurred in the last decade. 
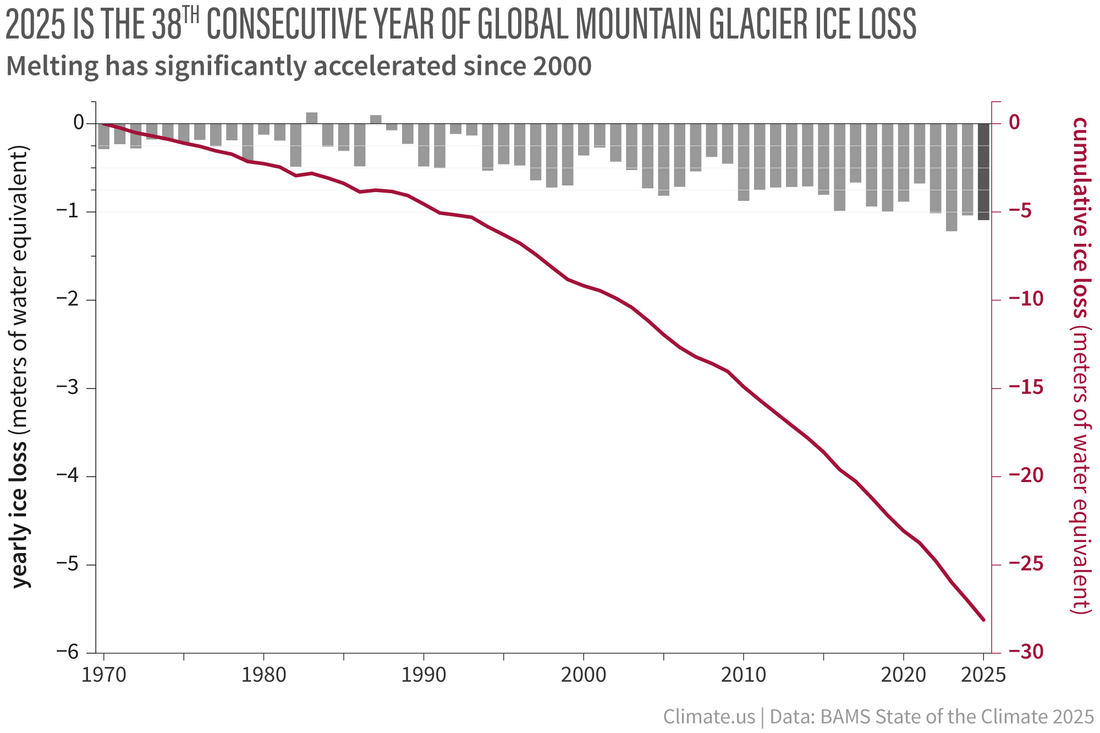
Yearly net gain or loss of ice mass in the World Glacier Monitoring Service “reference glacier” network since 1970 (gray bars, amount on left-hand vertical axis) combined with the running total ice loss through 2025 (red line, values on right-hand vertical axis.) Climate.us graph adapted from Figure 2.18 in State of the Climate in 2025.
  • Tropical cyclone activity was above average. A total of 97 named tropical cyclones were observed during the Northern and Southern Hemispheres’ storm seasons, above the 1991–2020 average of 87. Five storms reached Category 5 intensity. Three of these storms occurred in the North Atlantic, tying for the second most on record for that basin. Hurricane Melissa became one of the strongest Atlantic hurricanes on record, with a maximum intensity of 190 miles per hour and a minimum central pressure of 892 hPa on October 28. Melissa made landfall in Jamaica as a Category 5 storm, causing devastation on the western part of the island. The storm caused 95 fatalities and resulted in at least $12.2 billion (U.S. dollars) in damage. 

    There were 12 named storms in the Australian basin during the 2024/25 season, which was the most in a season since 2005/06. In February, Tropical Cyclone Zelia reached Category 5 intensity at sea and made landfall as a Category 4 storm in Western Australia. Flood heights at the town of Marble Bar due to heavy rainbands were nearly 2 meters above previous records. 

The State of the Climate report is a peer-reviewed series published annually as a special supplement to the Bulletin of the American Meteorological Society. The journal makes the full report openly available online

Topsoil Moisture % Short/Very Short by @usda_oce. 50% of the Lower 48 is short/very short, a 2% increase from last week. Every state in the West and Plains is over 50%, with Colorado (92%) and Wyoming (87%) at the highest levels of short/very short in the US. #drought @USDA

Deadpool Data Dump: The Western water situation is dire — Jonathan P. Thompson (LandDesk.org) #drought #aridification

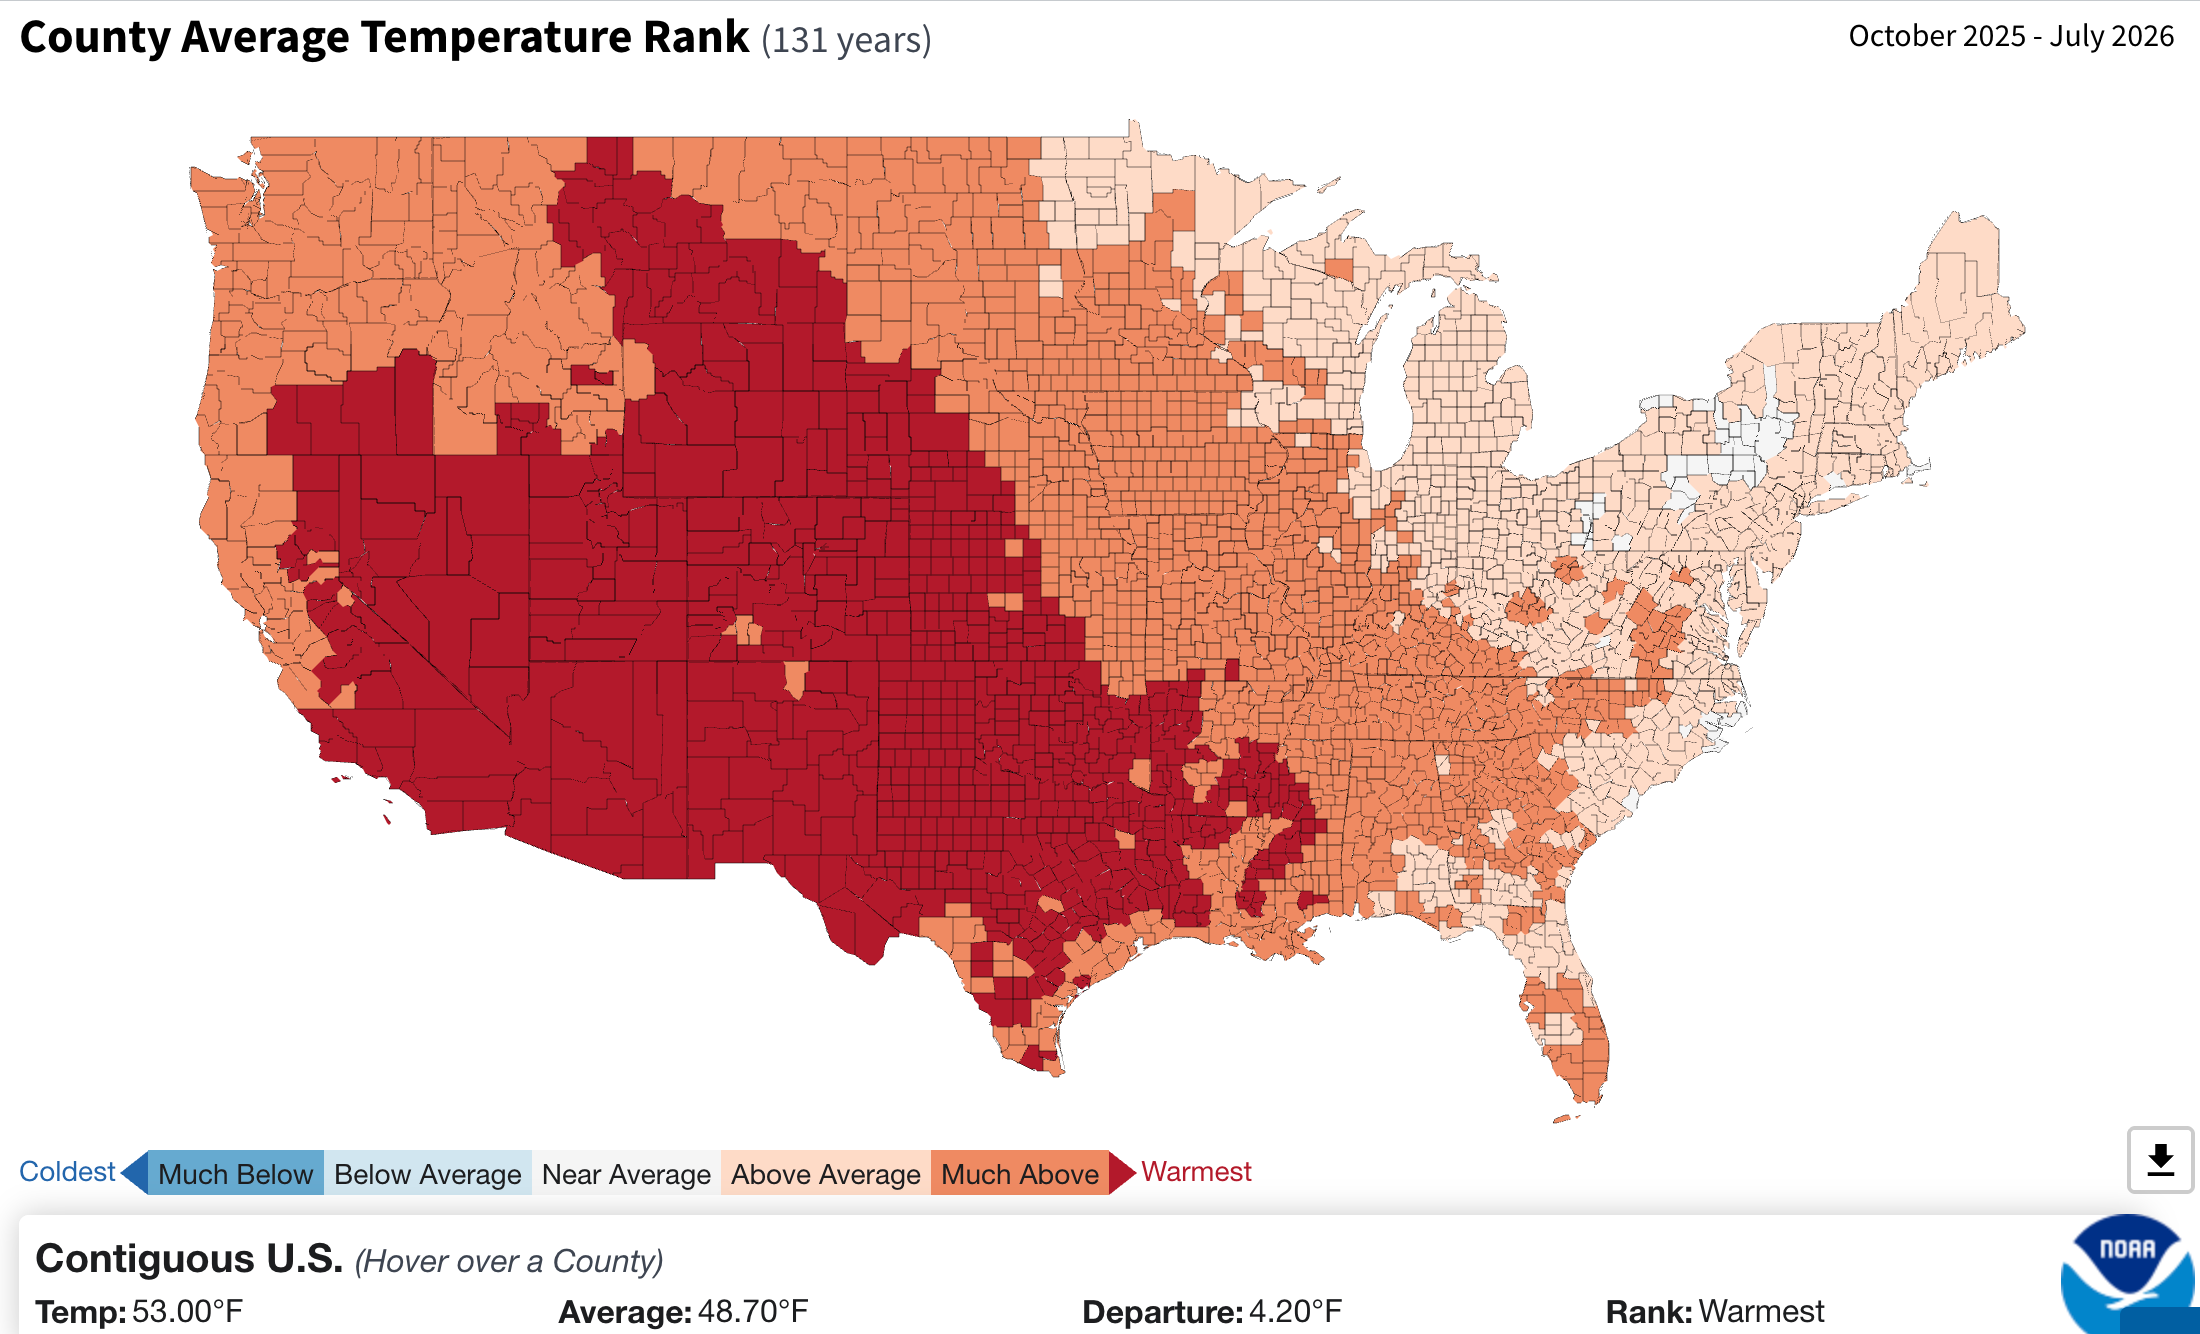
This water year (Oct. 1-Sept. 30) continues to be the warmest ever recorded in nearly every county in the Southwest and northern Rockies. Source: NOAA

Click the link to read the article on The Land Desk website (Jonathan P. Thompson):

August 11, 2026

💀 Deadpool Data Dump 🌊

No, Lake Powell’s not that close to actual dead pool — or the level at which water can no longer be released downstream. At least not yet. But it is now within 20 feet of de facto deadpool, or 3,500 feet, which is the surface elevation the feds have said they will “defend” to keep Glen Canyon Dam viable. Besides, in this case I’m using “deadpool” somewhat metaphorically to describe the current state of water on the Colorado River and the rest of the West, which is about as dire as “deadpool” sounds.

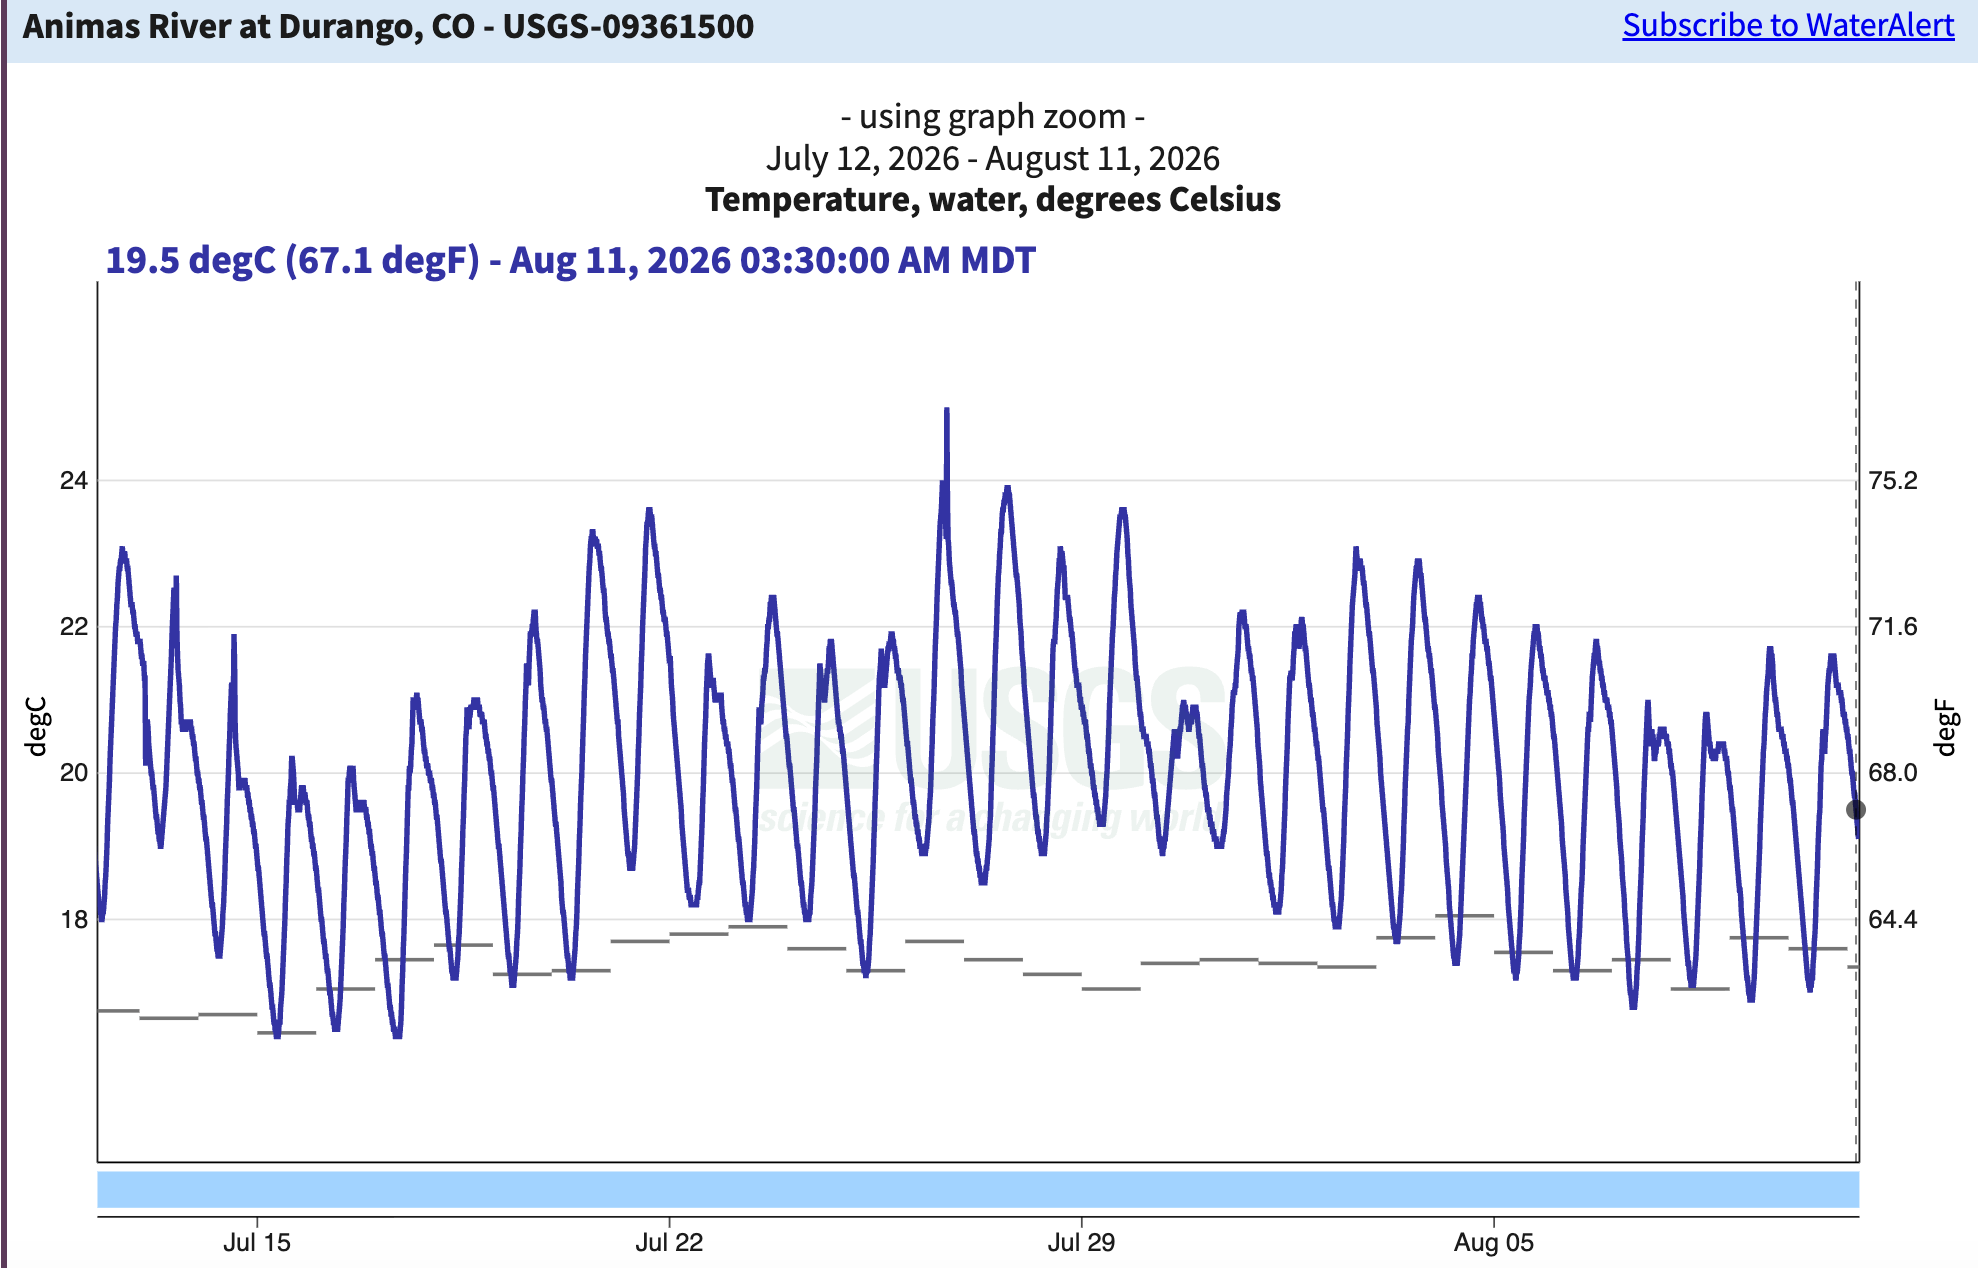
It’s normal for streamflows to drop in August as the last remnants of high-country snow disappear in the dog-days sun. But since most of the snow was gone by late June, and the monsoon has thus far dropped in only for brief, violent, and occasional visits, almost every creek and river in the West is flowing far below median levels for this time of year. The water is also unusually warm, which is bad for fish. The Animas River in Durango, for example has climbed up into the 70° F territory every day for the last several weeks.

In the Upper Colorado River Basin, irrigation ditches with junior water rights are getting shut down right and left, weeks earlier than normal and just ahead of the big harvesting season. It’s already been a tough summer for most farmers; if reliable rains don’t arrive soon it could get much worse.

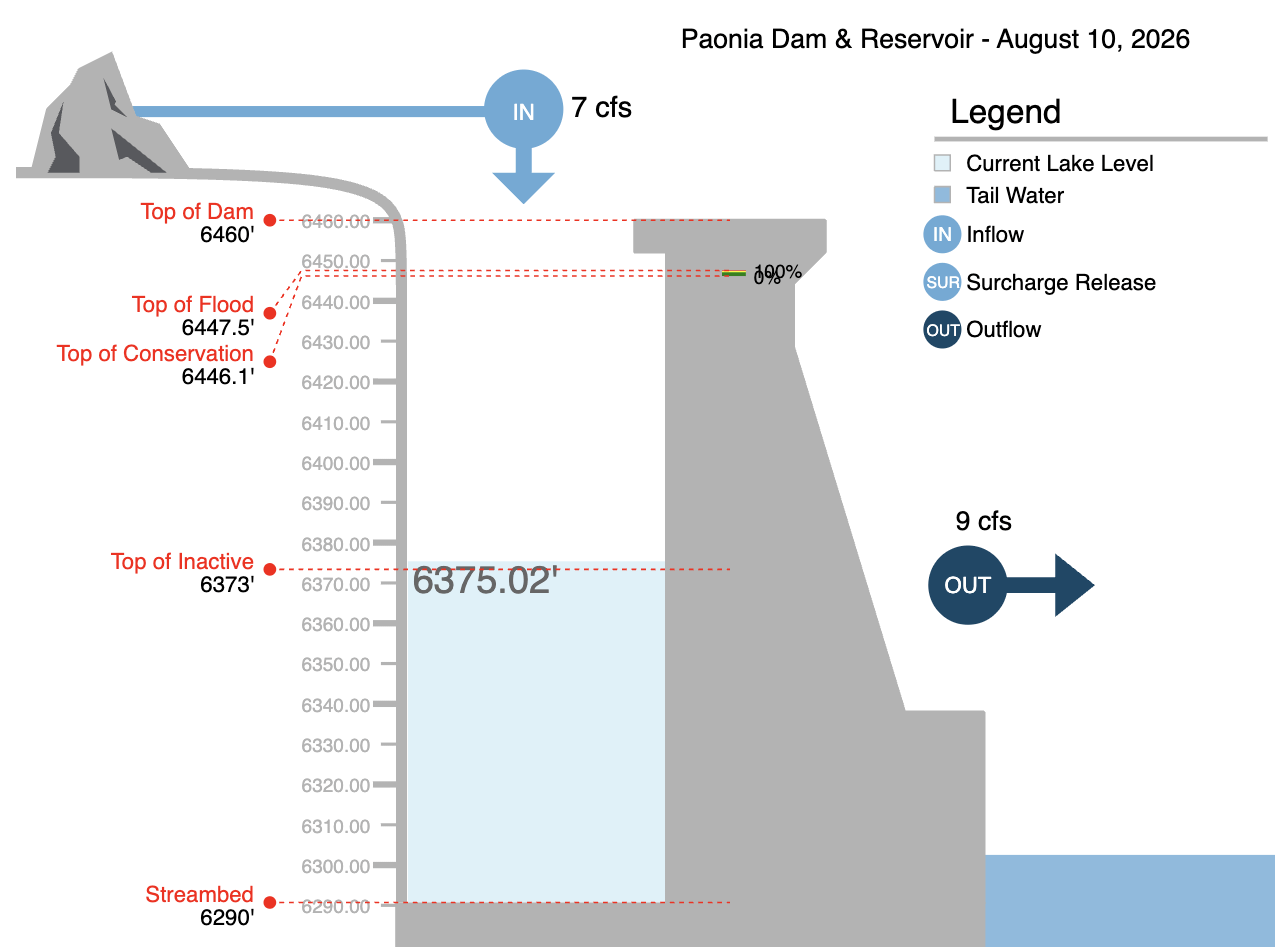
Paonia Reservoir in western Colorado has become a run-of-the-river operation, leaving downstream irrigation ditches in the North Fork Valley virtually dry — though those with senior rights continue to flow, for now.

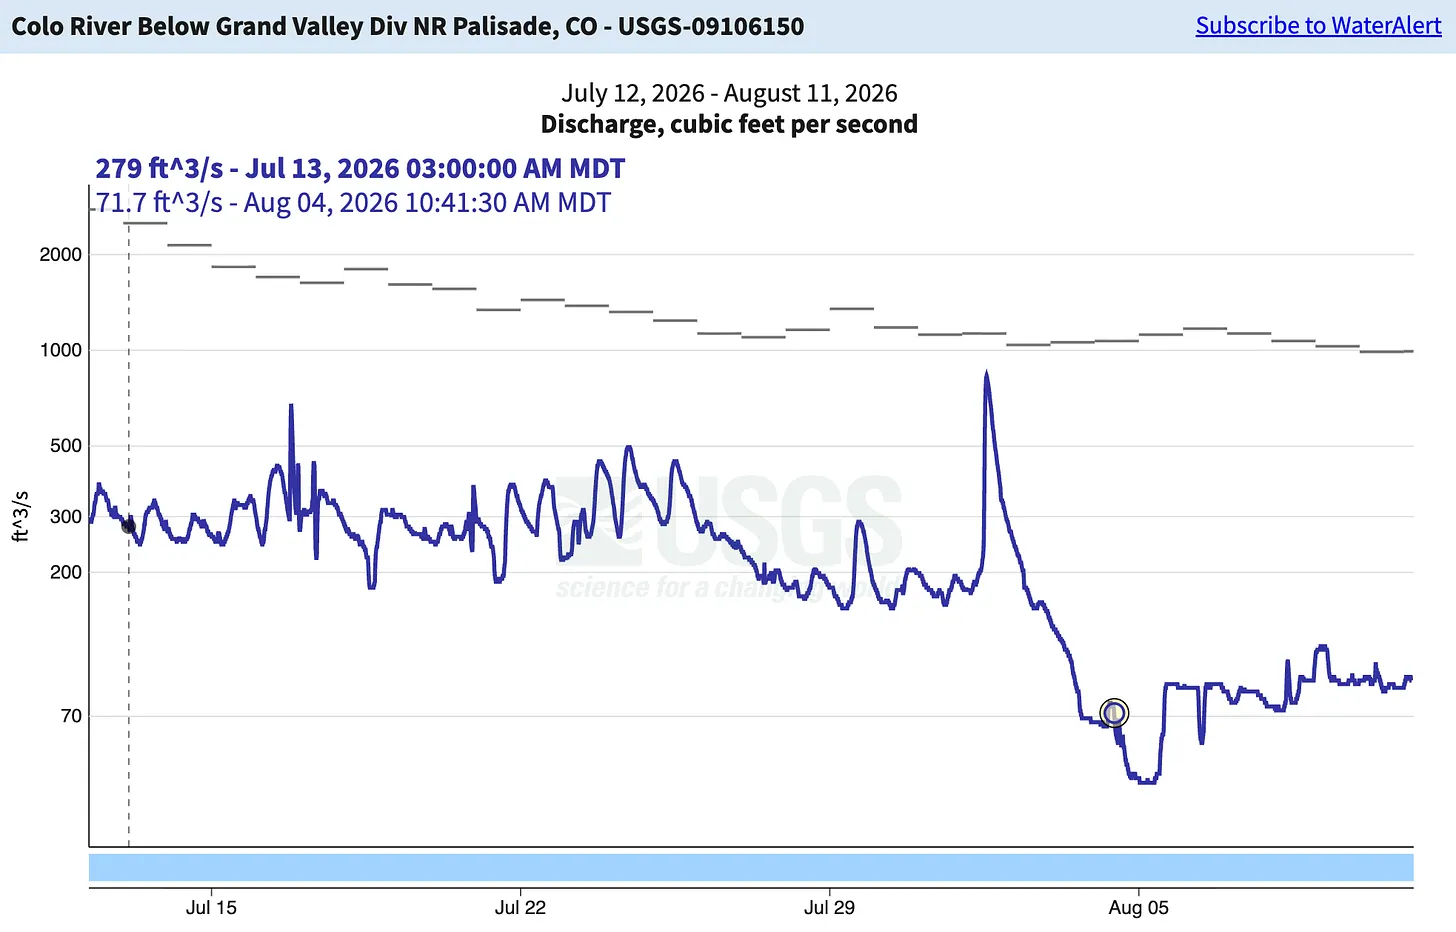
One of the scariest dry-time indicators of the summer so far was the Colorado River near Palisade, Colorado, which fell to 43 cubic feet per second in early August. To put that in context, McElmo Creek, which is basically a desert arroyo fed by irrigation runoff, has been running around 30 cfs for the last few weeks.

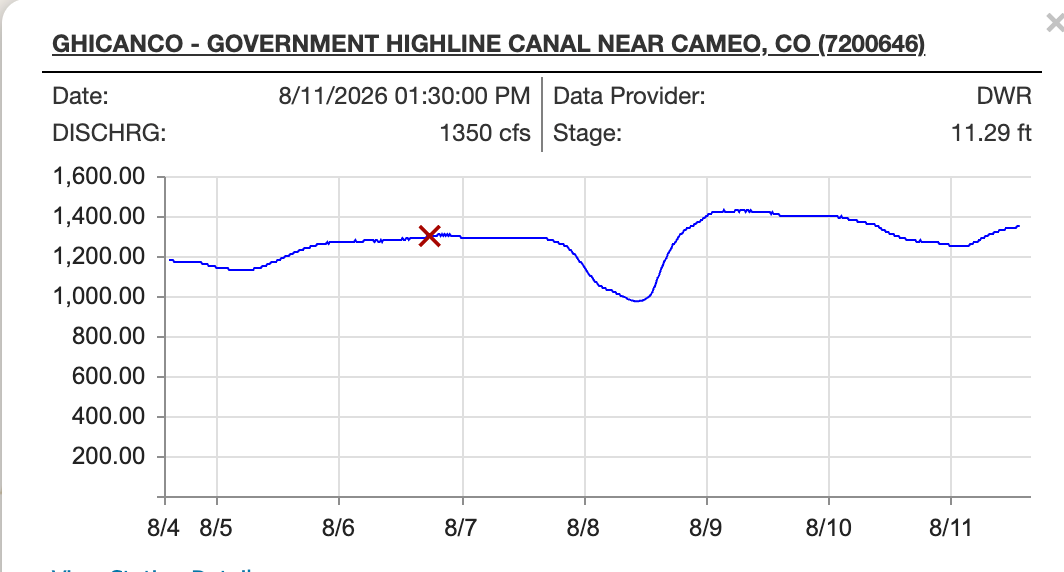
It’s important to note, however, that it’s not only drought, but also diversions, that are depleting the Colorado River. The river below Glenwood Springs, which is upstream of Palisade, has been running around 1,700 cfs. And major ditches — Cameco, Orchard Mesa, and Grand Valley canals — that pull water from the Colorado just upstream from the Palisade gage are together carrying some 2,000 cfs, meaning they are taking nearly all of the river’s water. Runoff from those ditches eventually runs back into the Colorado, bringing its flows back up somewhat before the river crosses the state line into Utah.

The Government Highline canal is pulling over 1,200 cfs from the Colorado River upstream of Palisade, and two other canals are drawing more than 500 cfs each, leaving the river almost dry for a segment in the Grand Valley. Source: Colorado Division of Water Resources.

The good news is that rains have started up again in southern Arizona (the National Weather Service’s Tucson office has issued a flash flood watch for tomorrow), and forecasters are predicting thunderstorms will be returning to the rest of the region soon. Hopefully they’ll bring nice, gentle, soaking moisture, and not just lightning and torrential flooding.

But let’s get back to our Lake Powell August update and some numbers:

  • 3,520.8 feet: Surface elevation of Lake Powell on Aug. 10, 2026. This is still about 9 inches higher than the previous all-time low of 3,519.9 in April of 2023. But that was April and there was already a bunch of snow in the high-country that would soon boost reservoir levels. The reservoir has been declining at a rate of about 2 inches per day, but that’s likely to speed up unless there is significant upstream precipitation in the coming weeks. So it’s not far-fetched to think it will drop to 3,500 feet as soon as this October.
  • 2,505 cubic feet per second: Lake Powell’s inflow on Aug. 10, 2026.
  • -387 cfs: Lake Powell’s unregulated inflow on Aug. 8, 2026. Yes, that is a negative number, which may seem impossible. But unregulated inflow is an estimate of what the inflows would be without supplemental releases from upstream dams. Which means that valuable water is being released from upstream dams to slow Lake Powell’s decline.
  • 7,710 cfs: Total average daily release from Glen Canyon Dam on Aug. 10, 2026.
  • 281,267 acre-feet: Total inflows in July 2026.
  • 83,824 acre-feet: Total unregulated inflows in July 2026 (meaning nearly 200,000 acre-feet was released from upstream dams to supplement the flows).
  • 24,164 acre-feet: Estimated evaporation from Lake Powell in July 2026.
  • 482,092 acre-feet: Total releases from Glen Canyon Dam in July 2026.
  • -224,989 acre-feet: Lake Powell’s water deficit in July 2026 (inflows – evaporation – releases = deficit)
  • -422,432 acre-feet: Lake Powell’s water deficit using unregulated inflow (or what it would be without supplemental water from upstream reservoirs).
  • 3.72 million acre-feet: Total Lake Powell inflows so far this water year. At this pace, the 2026 water year’s total inflows will be around 4.2 MAF.
  • 159 acre-feet: Total cool mix releases from Glen Canyon Dam in July 2026. This is where cooler water is released through the river outlet tubes — bypassing the hydropower turbines — to stifle smallmouth bass reproduction downstream of the dam. These releases have become necessary because during low reservoir levels, the warm-water loving bass are more likely to get sucked through the dam into the river, where they compete with and prey on native fish and stocked trout. But the Associated Press reports that the Bureau of Reclamation will not be doing any cool water mixing this year, since it would further reduce already diminished hydropower production from the dam (I’ll dig deep into the hydropower issue in this Friday’s Land Desk dispatch).

It’s not just Lake Powell that’s being drained, of course. During July, Flaming Gorge Reservoir ran an 87,000-acre-feet deficit; Blue Mesa Reservoir ran a 55,000 acre-feet deficit (and it received supplemental inflows from Taylor Park Reservoir); and Navajo Reservoir ran a 77,000-acre-feet deficit. Meanwhile, downstream, Lake Mead’s surface level fell to 1,040.2 feet, which is an all-time low. Deadpool watch, indeed.


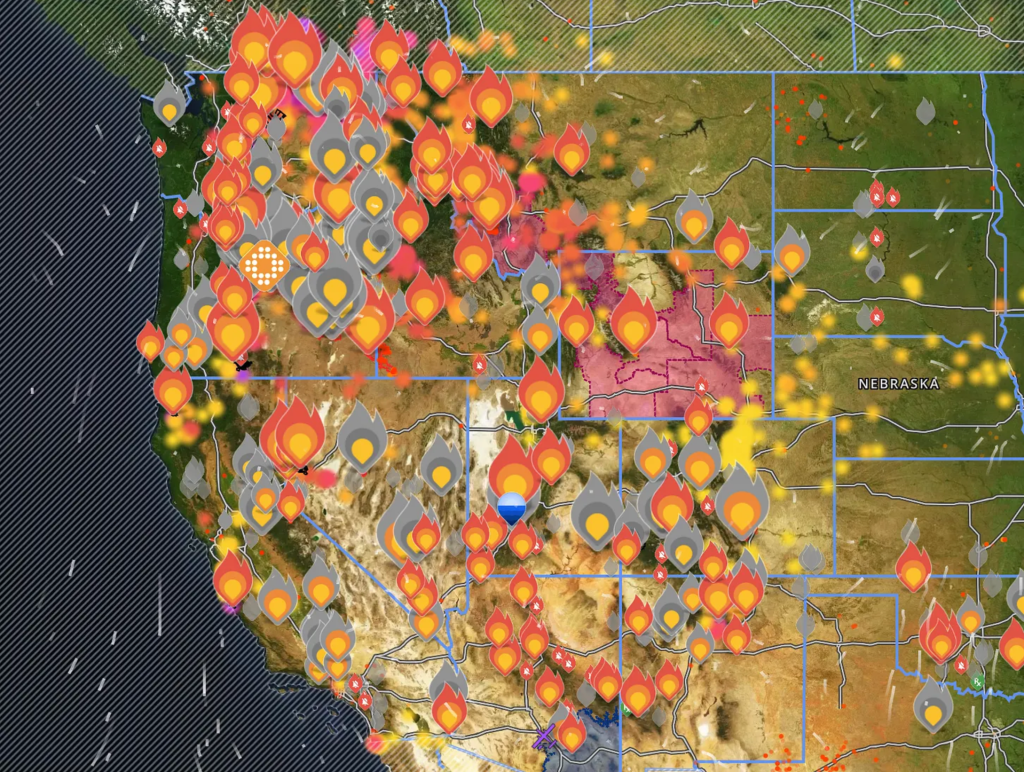
The Western wildfire view this morning as seen through the Watch Duty app. It’s a great tool, by the way, and even better if you fork out $25/year to become a member (which gives you weather radar and flight tracker powers). Source: Watch Duty

🔥 Wildfire Lookout 🔥

The wildfire situation in the West is just insane right now. It seems that every time one big blaze starts to die down and reaches containment, another one pops up and grows even larger. Under the Trump administration’s full-suppression regime — which seeks to extinguish every fire, even those in wilderness that don’t threaten homes or lives — it all becomes a giant and deadly game of whack-a-mole.

In Utah, for instance, the Cottonwood Fire reached 95% containment after burning through more than 97,000 acres; the Babylon Fire in Bears Ears National Monument then grew to 107,000 acres before being contained; and now the Widemouth 2 Fire has exploded to 121,226 acres, and has taken the lives of two firefighters aboard a helicopter that crashed this past weekend.

The Northwest is especially scary, with over 2 million acres burned so far this year. Current fires include the Big Grass Fire straddling the southern Oregon-Idaho border that had burned through more than 541,000 acres as of Monday morning; the Rowe Creek Complex northeast of Bend, Oregon, at 368,000 acres; the Grasshopper Fire, on the east slopes of Mt. Hood; and the Little Giant and Sinlahekin Fires in Washington, at 111,000 and 143,000 acres, respectively.

A small sampling of other active fires in the West:

  • The Bug Fire and Fred Mtn. Fire are burning along the California-Nevada border just north of Reno, and are forcing evacuations.
  • The Gold Mountain Fire in the San Juan Mountains north of Ouray, Colorado, is at 90% containment after burning nearly 40,000 acres. But to the east of it, the Elk Fire jumped in size to over 7,000 acres, and is forcing evacuations in Hinsdale County.
  • The Frijoles Fire in northern New Mexico east of Pojoaque blew up to 4,158 acres over the weekend, and is at 0% containment. It is burning in the Pecos Wilderness Area.

📸 Parting Shot 🎞️

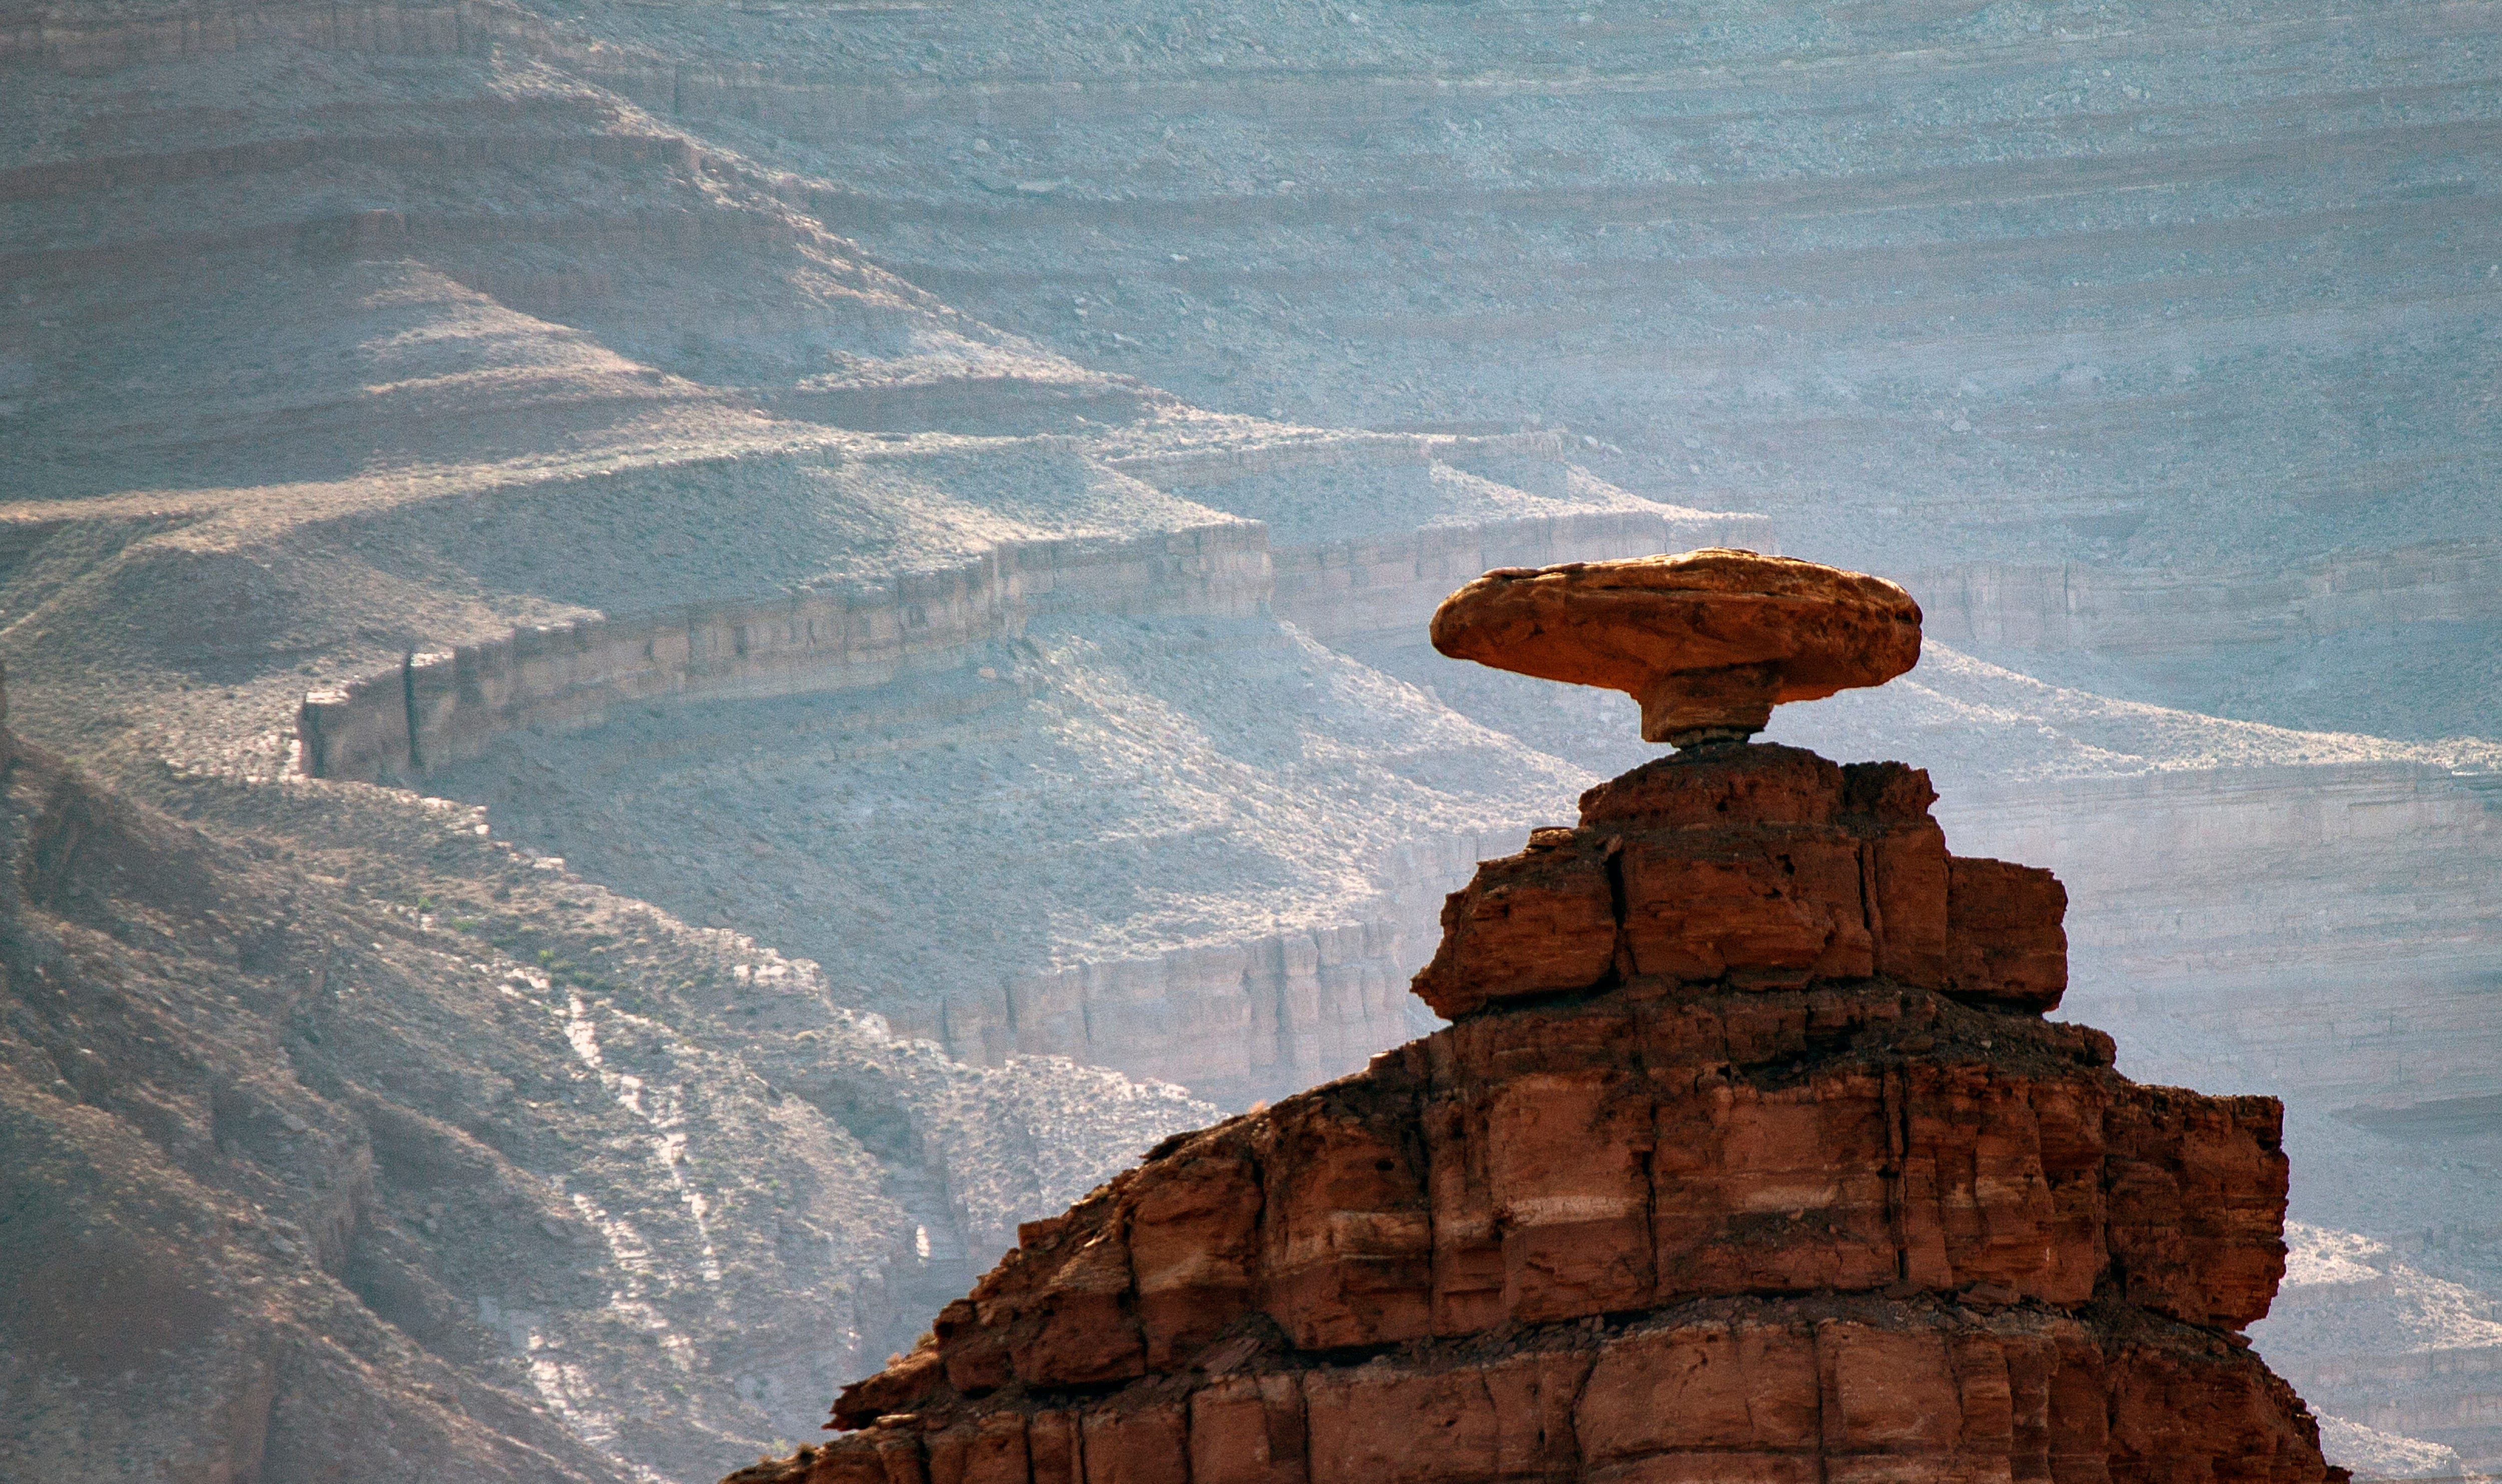
Mexican Hat rock in southeastern Utah with Raplee Ridge in the background. Jonathan P. Thompson photo.

#Drought news August 13, 2026: Little or no precipitation fell on most locations in the seasonably-dry Far West, the Great Basin, the Intermountain West, much of the central and northern Rockies, most of the Plains

Click on a thumbnail graphic to view a gallery of drought data from the US Drought Monitor website.

Click the link to go to the US Drought Monitor website. Here’s an excerpt:

This Week’s Drought Summary

Rainfall was highly variable across the Nation this past week. Totals exceeding 2 inches were widespread from northern and eastern Indiana through much of Ohio and into West Virginia and western Pennsylvania. Localized areas across central and eastern Indiana, central and southeastern Ohio, and western West Virginia recorded 5 to 7 inches. Interior sections of central and northern Missouri also saw widespread totals topping 2 inches, with a few isolated patches receiving 4 to 5 inches. Other areas with more scattered totals over 2 inches include the Upper Midwest, east-central Great Plains, the southern Great Lakes region, the central and southern Appalachians and adjacent foothills, the Carolinas, central and northern Georgia, and the Florida Peninsula. More moderate amounts, with isolated spots recording 2 to 3 inches, were dotted across the remainder of the Eastern Seaboard, Gulf Coast, Lower Mississippi Valley, and the Desert Southwest where a decent monsoonal circulation remained in place. Meanwhile, little or no precipitation fell on most locations in the seasonably-dry Far West, the Great Basin, the Intermountain West, much of the central and northern Rockies, most of the Plains, the Upper Mississippi Valley, the Great Lakes region, most of the Tennessee and Lower Ohio Valleys, portions of southern New England, the Virginia Tidewater, and adjacent locations. Farther north, a few tenths of an inch of precipitation were observed in central Alaska and the upper half of Southeast Alaska while little or no precipitation fell farther south there. The areas of Hawaii experiencing abnormal dryness (D0) recorded isolated amounts approaching an inch last week, but most of these areas received a few tenths of an inch at best.

Temperatures averaged at least slightly above normal along the West Coast and from the Great Basin and Southwest through the southern Plains and most of the Lower Mississippi Valley. Most areas from the eastern Great Lakes, Ohio Valley, and Mid-Atlantic regions northeastward to the Atlantic Ocean and Canadian Border also experienced a warmer than normal week. Numerous locations from near the Great Basin through Oklahoma and western Texas average 6 to 10 deg. F above normal, as did much of New England. Meanwhile, subnormal temperatures dominated the northern Plains. Other sites across the Lower-48 recorded near-normal temperatures for the week…

High Plains

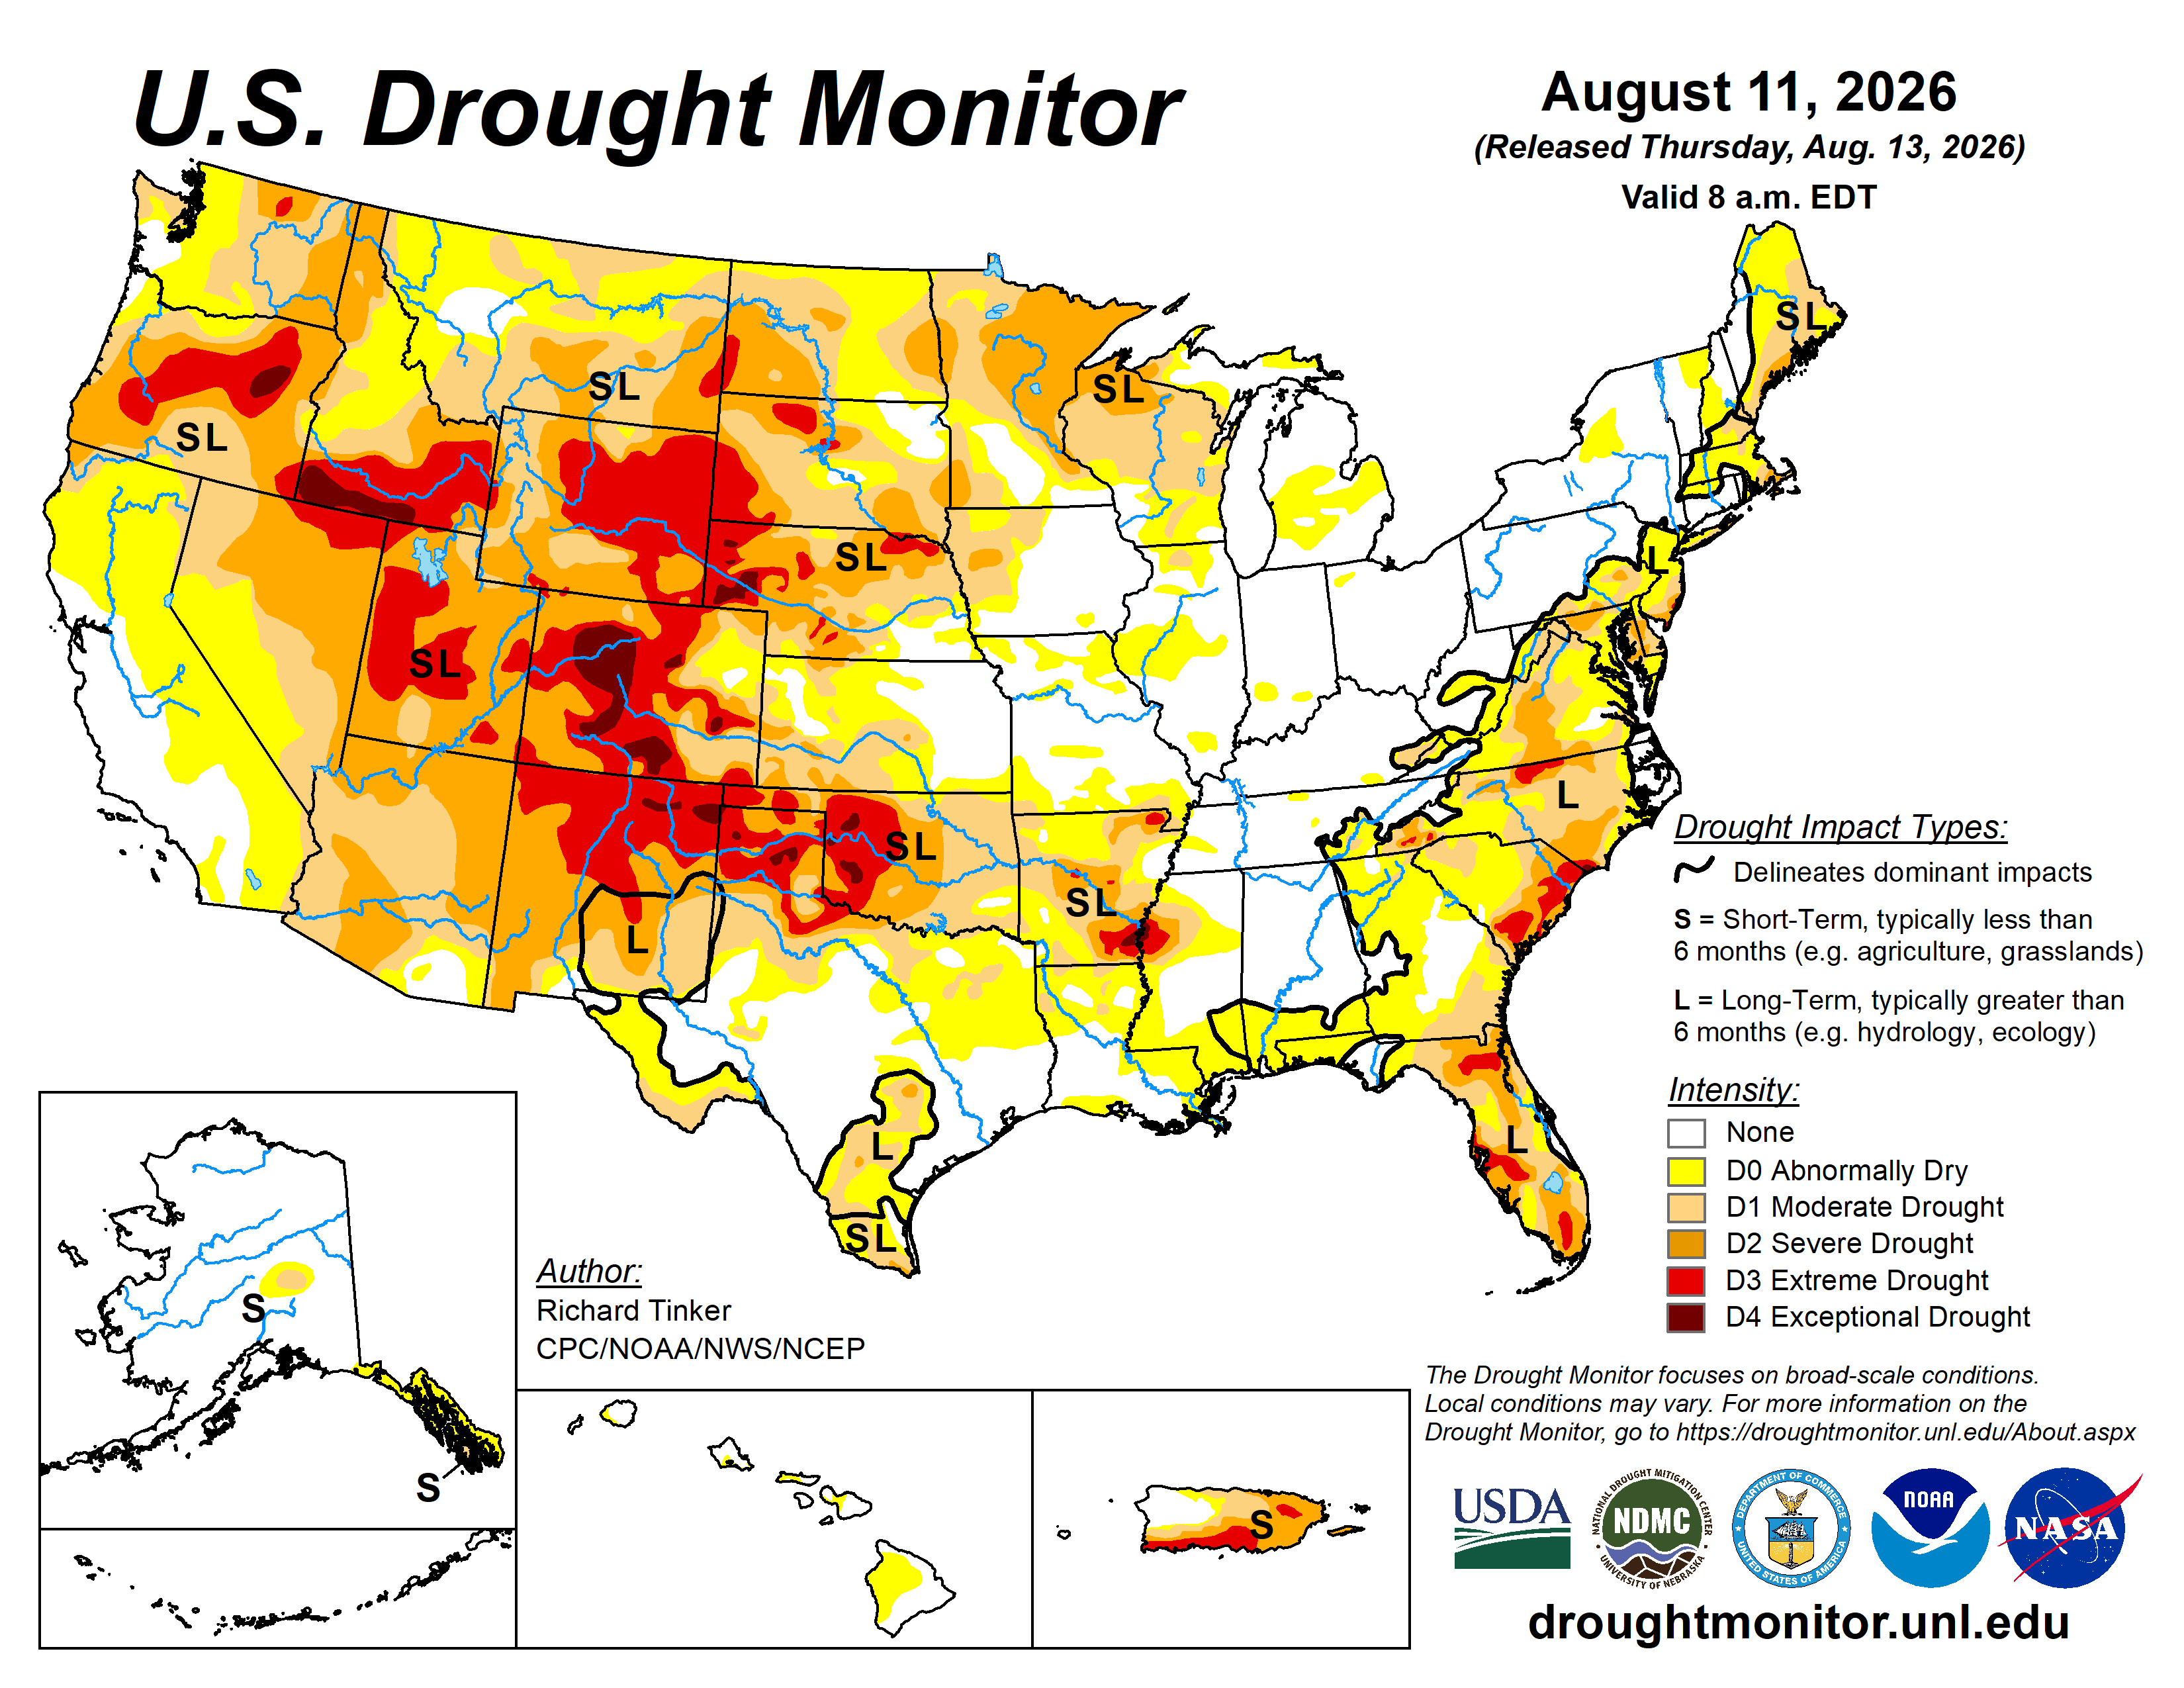
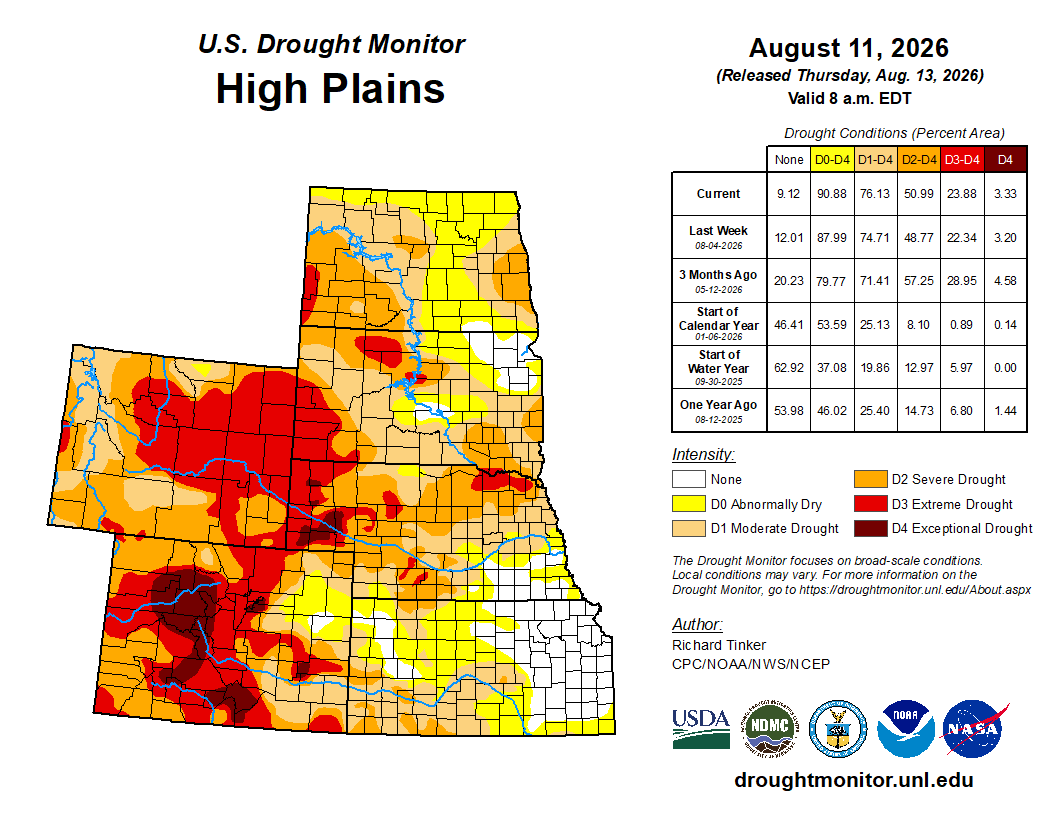
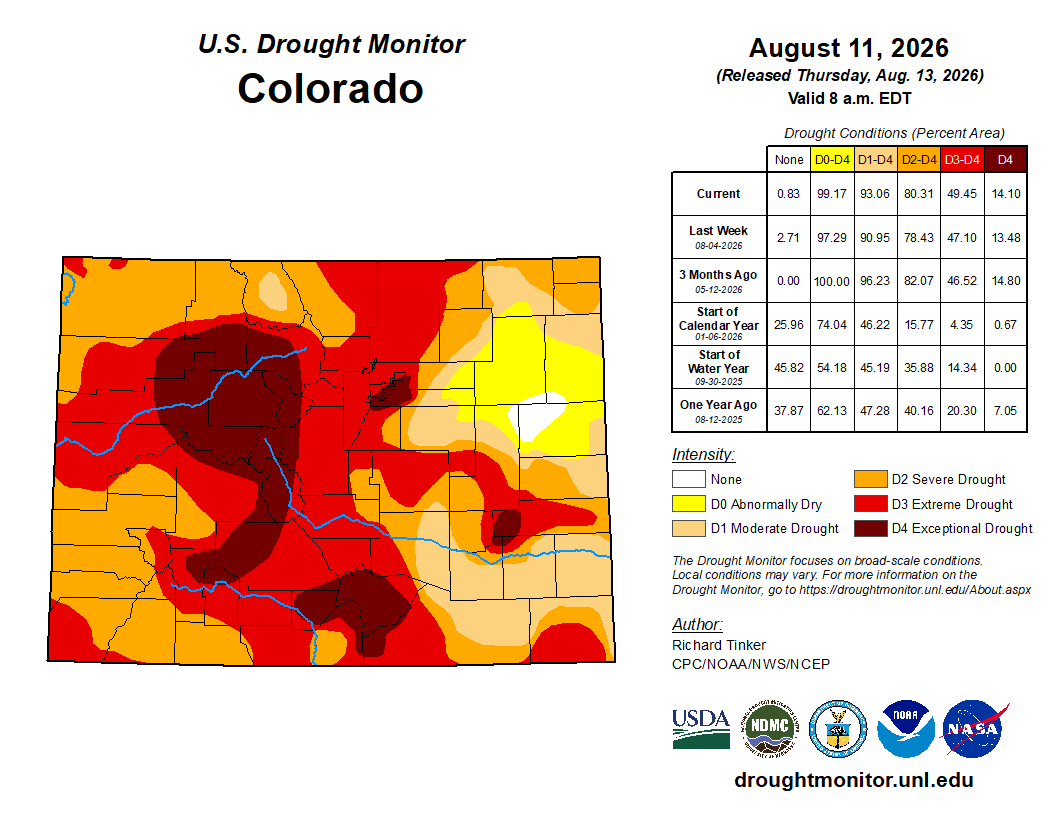
Moderate to heavy rainfall doused portions of eastern Kansas and adjacent Nebraska, leading to some limited relief, but totals were considerably lower elsewhere. Over 0.5 inch with isolated heavy amounts were observed in southern North Dakota, western and southern South Dakota, numerous patches across Nebraska, south-central and west-central Kansas, and the higher elevations of Colorado. Other locations measured a few tenths of an inch, if any. Improvements were restricted to small sections of north-central and southeastern Nebraska while dryness and drought persisted or intensified elsewhere. Areas from south-central through northeastern Colorado, southernmost and northwestern through north-central Kansas, northeastern Nebraska, and the northern half of the Dakotas saw the most widespread deteriorations. Over the past 30 days, most locations outside the highest elevations of Wyoming and Colorado have recorded well below normal precipitation, with less than 25 percent of normal amounts recorded over central and southwestern Kansas and much of North Dakota. There are a few stripes in the Great Plains with near or above-normal 30-day totals, but these conditions cover much smaller areas than those experiencing dryness and drought. Currently, large sections of Colorado and Wyoming are enduring severe to exceptional drought (D2 through D4), with the worst conditions affecting significant portions of Colorado and a few patches in western Nebraska. In the Great Plains, severe (D2) or extreme (D3) drought also extends across much of Nebraska and some adjacent locales, the central and western Dakotas, and a few patches in southeastern South Dakota and southwestern Kansas. The dryness is impacting especially surface moisture stores, including areas of reduced streamflows and degraded crops. Not all crop damage may be the result of dryness and drought, but it is the most significant contributing factor. In Colorado, 64 percent of pastures and rangelands are in poor or very poor condition (5-year average 23 percent), along with 70 percent of those in Nebraska (5-year average 30 percent), and 75 percent in Wyoming (5-year average 38 percent). Several crops in Colorado have a significant proportion in poor or very poor condition, including 46 percent of corn (5-year average 15 percent) and 57 percent of sorghum (5-year average 8 percent). In North Dakota, 53 percent of sorghum and 40 percent of corn are in similar condition (5-year averages of 13 and 15 percent, respectively). Significantly above-normal temperatures have also prevailed during the last 30 days, with temperatures averaging generally 6 to 9 deg F. above normal in the western Dakotas, the adjacent High Plains, central and western Colorado, and western Wyoming, with the largest departures observed in the latter region…

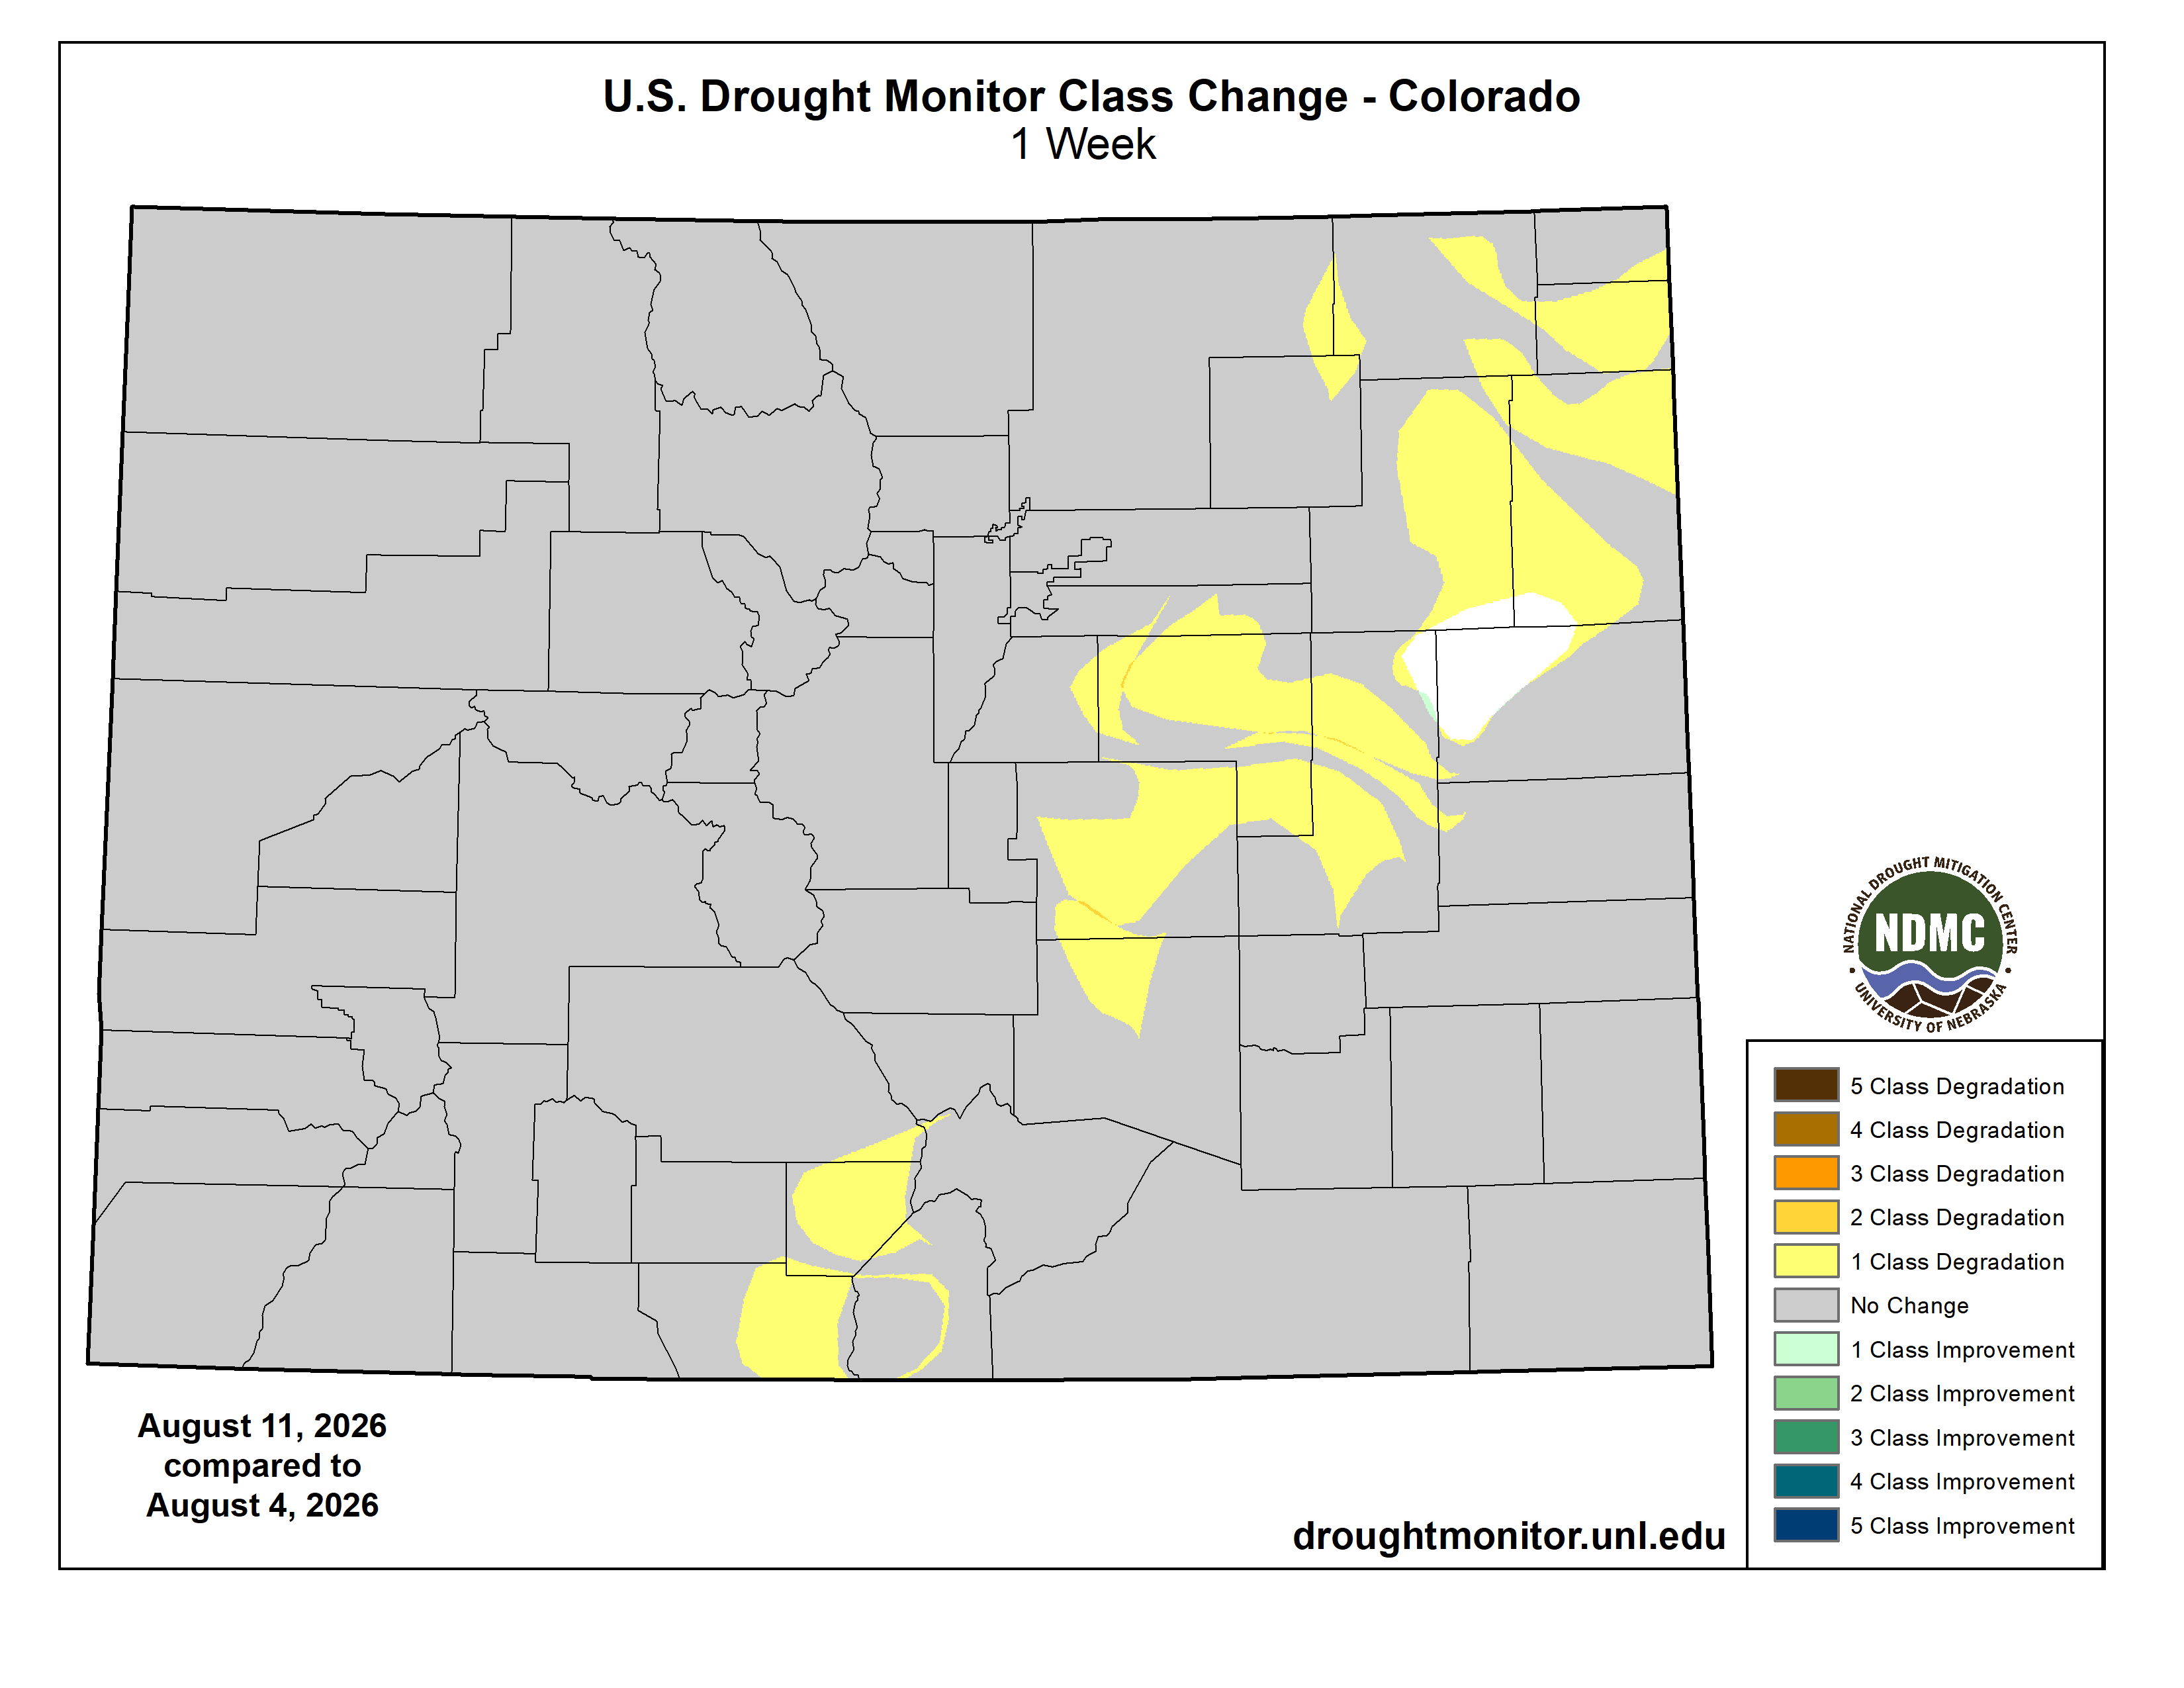
Colorado Drought Monitor one week change map ending August 11, 2026.

West

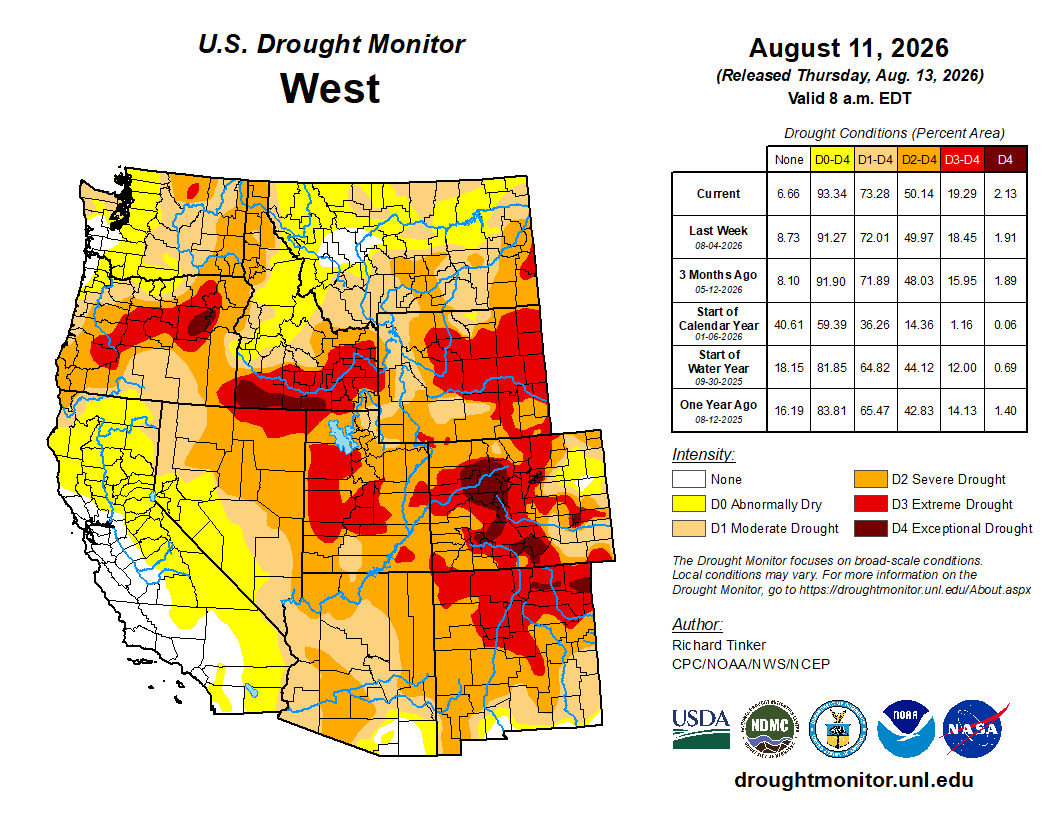
Moderate to locally heavy precipitation (0.5 to 3 inches) fell on much of Arizona and New Mexico primarily due to monsoonal convection. Farther north, a few tenths of an inch with isolated higher amounts of over an inch were recorded across Utah, much of the Great Basin, and some adjacent areas. The rest of the West Region was dry, with only isolated locations reporting as much as 0.2 inch. These conditions brought little change to dryness and drought across the West Region, with changes restricted to several areas of deterioration across the plains of Montana and part of the adjacent northern Rockies, similar to conditions farther east across the northern tier of the central Lower-48. Dryness and drought continue to cover a large proportion of the West Region, sparing only parts of central and western California, coastal areas near the Oregon/Washington border, and west-central Montana. Extreme to exceptional drought (D3-D4) is common across a large swath in interior Oregon, southern Idaho, the adjacent Great Basin, and a large section of Utah. Conditions have been exacerbated by 30-day temperatures averaging 4 to 8 deg F. above normal across Utah, southeastern Idaho, much of southern Montana, and -scattered locations across the Southwest. In Utah, 33 percent of winter wheat is in poor or very poor condition, compared to a 5-year average near zero. In addition, one-half to three-quarters of rangelands in Arizona, New Mexico, and Utah are in poor or very poor condition, which is well above average for this time of year. In addition, multiple years of persistently below-normal precipitation has left some large reservoirs in the West with extremely low water stores. The contents of Lake Mead have dropped to an all-time low since daily reports are available, back to 1937. By August 10, the amount of stored water dropped below 7 million acre-feet (capacity is over 28 million acre-feet)…

South

Dryness and drought have been expanding and worsening over much of the South Region for the past few weeks. Rapidly deteriorating conditions have been observed across Oklahoma, the Texas Panhandle, and adjacent areas of Arkansas, but almost all states saw declining conditions this past week. Tennessee was an exception, where more widespread heavier rainfall prompted some improvement in central and eastern parts of the state, with persisting or deteriorating conditions limited to northern and western parts of the state. Farther west, deterioration was introduced through most of Oklahoma (especially the eastern half of the state), the Red River Valley, Much of the Texas Panhandle and northeastern Texas, western Arkansas, northern and eastern Louisiana, and scattered patches across the remainder of the Region from the Lower Mississippi Valley westward. Oklahoma has seen very little precipitation over the last 30 days, with most locations reporting less than 25 percent of the normal. Temperatures averaging 3 to 7 deg F above normal mid-summer values significantly exacerbated the drying conditions across much of Oklahoma and northern Texas, including the Panhandle. Temperatures averaged near or up to 3 deg F above normal elsewhere. Much more abundant rainfall prior to the past 30 days is keeping longer-responding impacts from ramping up too quickly, but some crops and streamflows are being deleteriously affected. Almost half of Texas oats and over one-third of Oklahoma soybeans are in poor or very poor condition. Across Oklahoma, 44 percent of pastures and rangelands are in poor or very poor condition, as are 33 percent of those in Arkansas.

Looking Ahead

During August 13-17, 2026, moderate to heavy rain (over an inch) is forecast across the central and northern High Plains, the northern Rockies, the Colorado Rockies, scattered locations over the central and western Four Corners region and Great Basin, much of the northern and central Great Plains, the southern and central Great Lakes region, the northern Ohio Valley, and several patches across southern New England, the lower Northeast, southern Georgia, and both the southern and northern reaches of Florida. The highest totals (3 inches or more) are expected across part of east-central Montana, the northeastern quarter of Colorado, and much of a band from central Iowa into western Indiana. In contrast, light precipitation at best is anticipated across northern New England, interior sections of the Middle and Southern Atlantic States, northern portions of the Great Lakes and Minnesota, Lower Mississippi Valley, central and southern Plains, most of the Pacific Coast States, and lower elevations across the Great Basin and the central to southern Rockies. Meanwhile, areas from the south-central Great Plains across the Southeast are expected to record daily highs averaging 5 to 11 deg. F above normal, with the largest anomalies expected from Arkansas through central Tennessee. Farther north and west, daily highs should average 3 to 6 deg. F below normal over much of California and the Great Basin, the Northern Intermountain West, and northern reaches of the Rockies and Plains. Other locations should average closer to normal.

The 6- to 10-day outlook (August 18-23, 2026) at least marginally favors above-normal precipitation across the northern half of the Eastern Seaboard westward through the Great Lakes region, the northern halves of the Mississippi Valley and Plains, and from the Rockies to the West Coast. The best odds for wetter than normal weather (over 50 percent) cover the interior Pacific Northwest. Surplus precipitation is also favored throughout Alaska and Hawaii, with odds topping 40 percent in south-central Alaska and through the Hawaiian Island Chain. Subnormal totals are somewhat favored from the southern Great Plains through the Gulf Coast region and Florida. Meanwhile, warmer than typical mid-August conditions should dominate all 50 states, excepting only southwestern Alaska and the Aleutians, most of the central West Coast States and adjacent Great Basin, and the northern tier of the Lower-48 from the northern Plains through most of New England. The likelihood of unusual warmth top 70 percent from the southern Great Plains eastward through the Southeast and South Atlantic Coast, as well as southeastern Maui and the Big Island of Hawaii, and part of east-central Alaska. Chances exceed 80 percent from the central Lower Mississippi Valley into the interior central Gulf Coast States. Odds marginally favoring subnormal temperatures are restricted to the Aleutians and northern Maine.

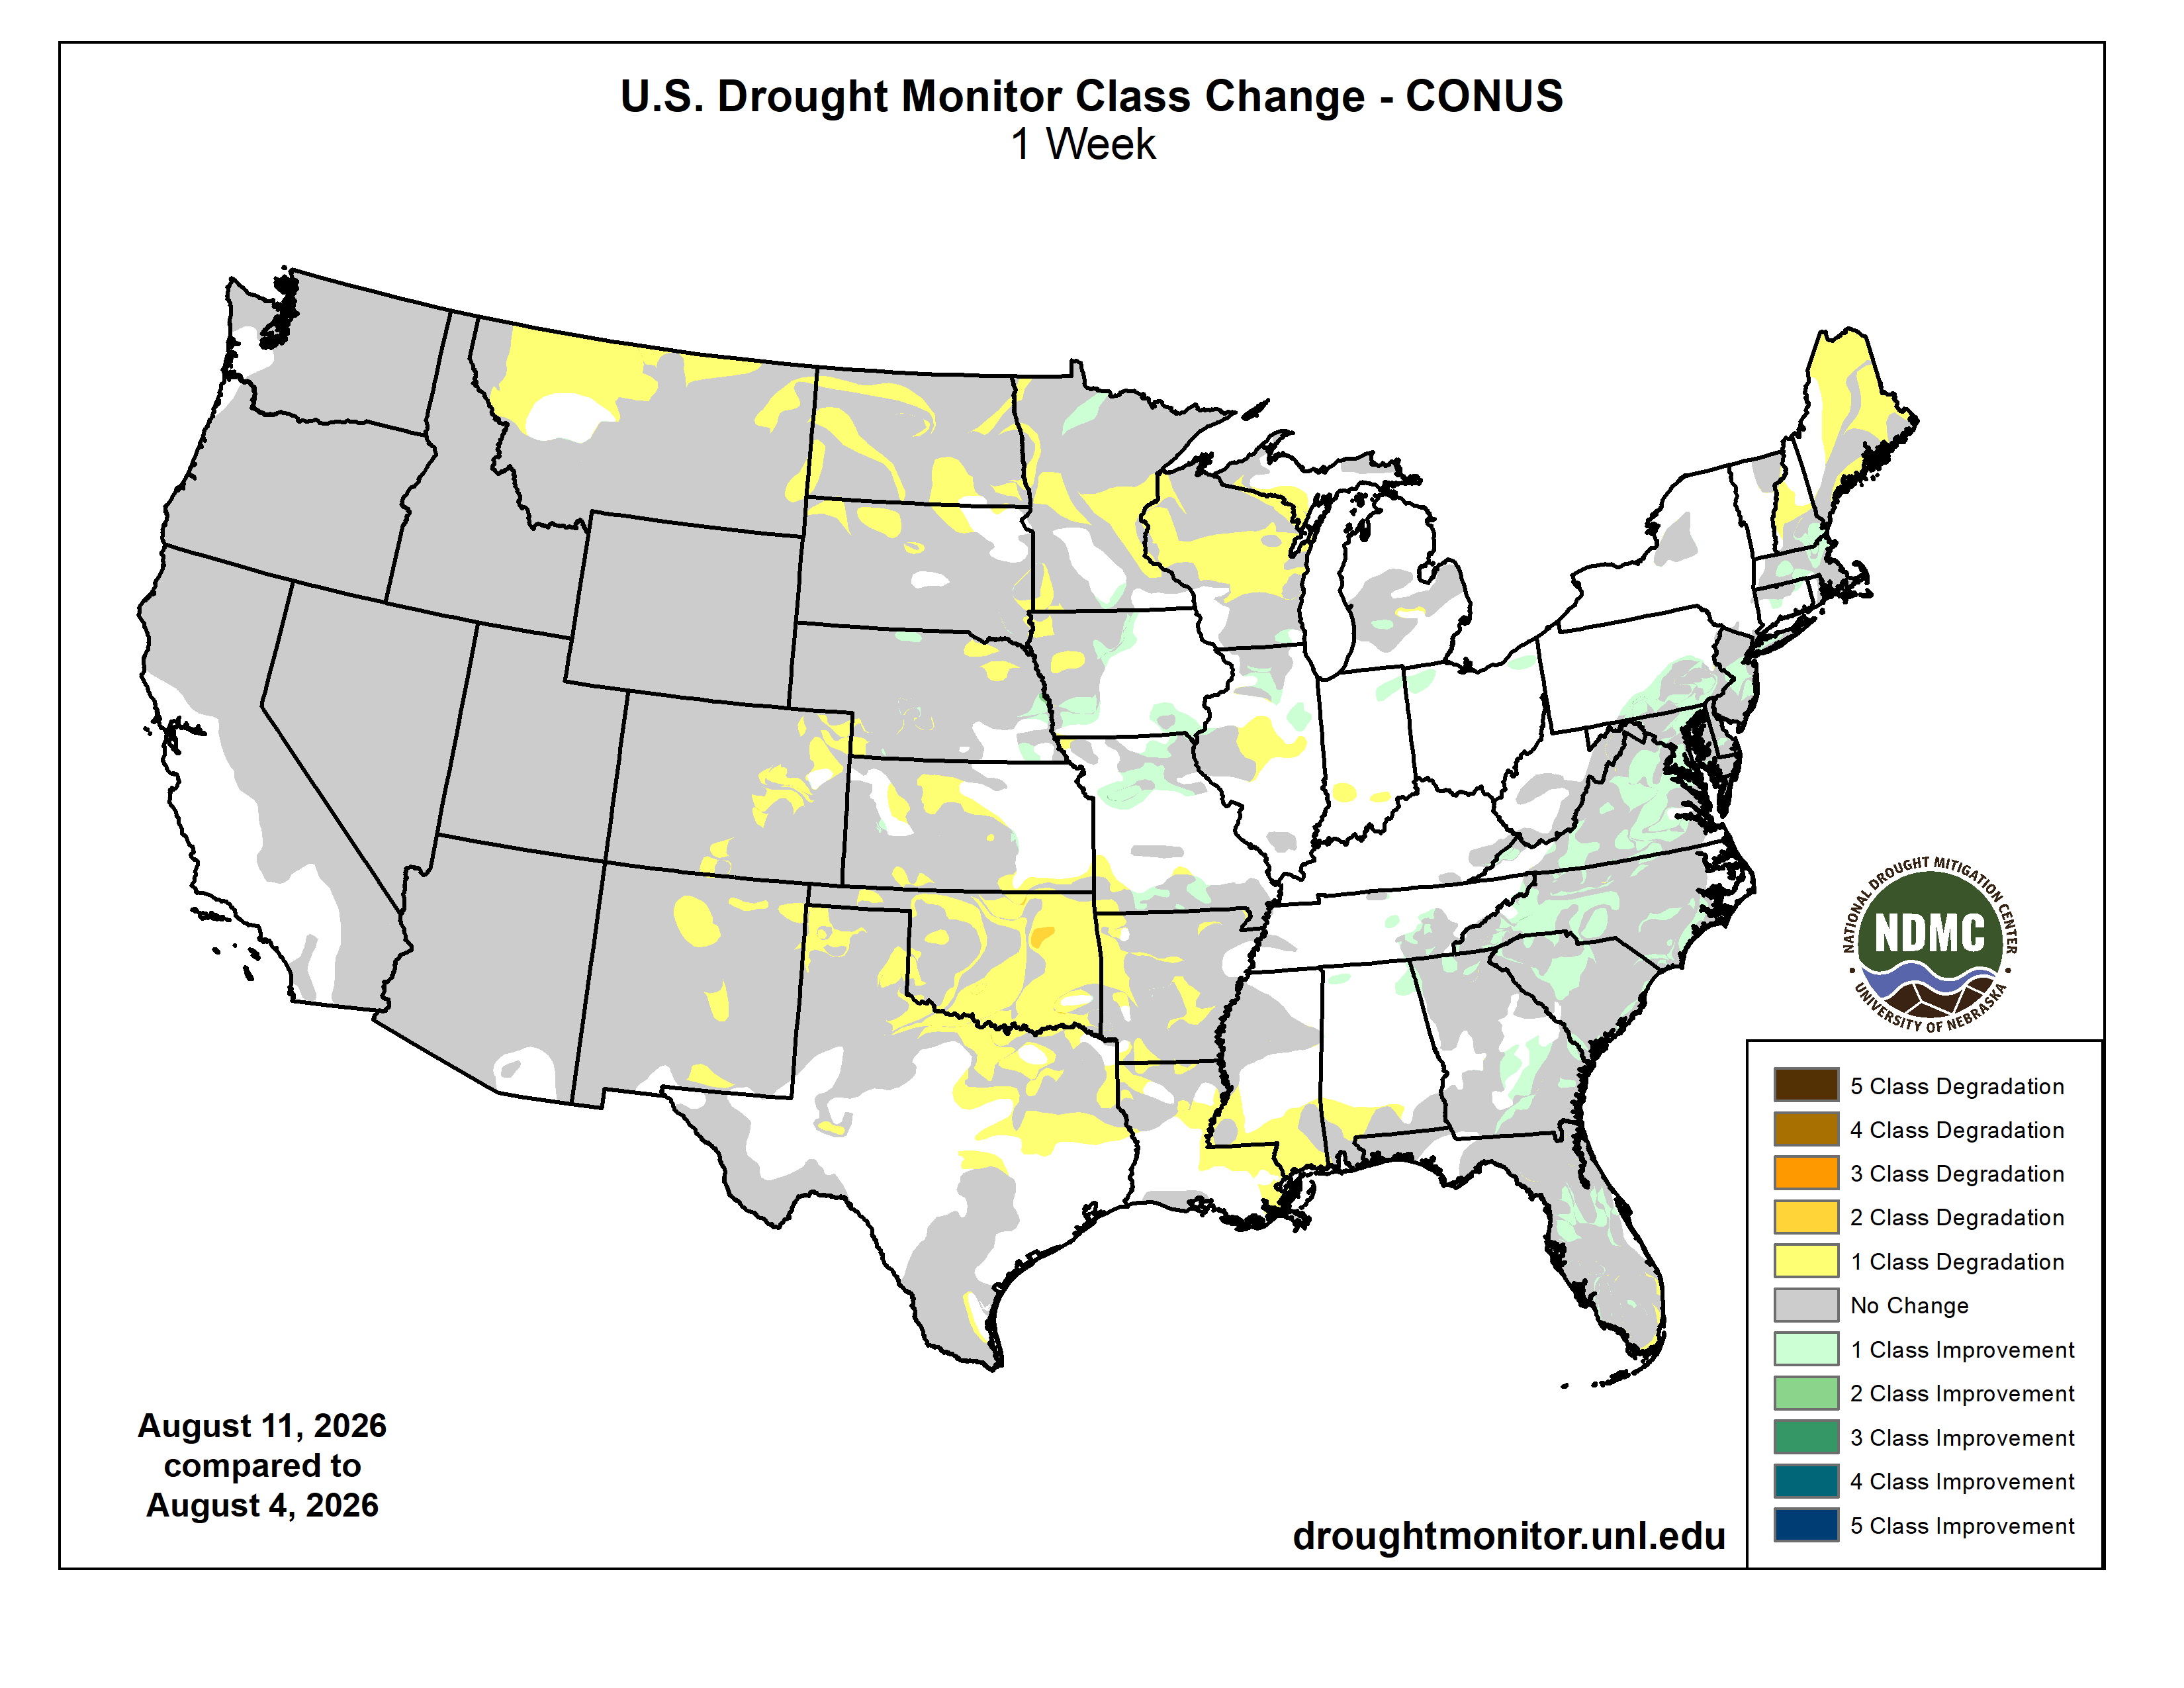
US Drought Monitor one week change map ending August 11, 2026.