The unanimous passing of Resolution 43-21 approved a United States Department of Agriculture (USDA) Loan Resolution for a project that will update the Glacier Creek Water Pre-Treatment Plant which was built in 1970. Presently, Estes Park, acting by and through its Water Activity Enterprise, provides drinking water service to most of the Estes Valley through the Glacier Creek and Mary’s Lake water treatment plants.
In 2018, The Colorado Department of Public Health and Environment’s (CDPHE) Disinfection Outreach and Verification Evaluation (DOVE) inspection resulted in the Glacier Creek Water Treatment Plant which was built in 1970 being de-rated from a ‘conventional’ plant to a ‘direct filtration’. Meaning the plant can no longer meet drinking water regulatory requirements.
According to Utilities Director Rueben Bergsten and Town Attorney Dan Kramer, the resolution will allow for the rebuilding of the existing pretreatment process to restore the conventional plant rating and bring the plant back into compliance under all operating conditions.
The improvements consist of a new pretreatment building with a rapid mix basin, flocculation, sedimentation with plate settlers, and supporting ancillary systems. The USDA will finance the total cost of the completed project with a guaranteed $7,675,000 loan at 1.375 percent interest rate over 40 years in addition to a $2,369,000 grant.
The Centers for Disease Control and Prevention (CDC) and the Agency for Toxic Substances and Disease Registry (ATSDR) have released the initial results of exposure assessments conducted in communities near current or former military bases known to have had per- and polyfluoroalkyl substances (PFAS) in their drinking water.
Individuals who participated in the assessments provided blood and urine samples to CDC and ATSDR for analysis. The assessment focused on El Paso County near Peterson Air Force Base, in the Fountain Valley and Security-Widefield areas.
The assessments measured the levels of three specific PFAS chemicals in 346 residents’ bodies: PFOS, PFHxS, and PFOA, and found levels higher than in the general U.S. population, as measured by National Health and Nutrition Examination Survey (NHANES). Most people in the United States have been exposed to PFAS and have PFAS in their blood…
Results of the 2020 PFAS exposure assessment in El Paso County. Courtesy Centers for Disease Control and Prevention and the Agency for Toxic Substances and Disease Registry
While levels of PFOA and PFOS chemicals were only slightly higher than the general population, levels of PFHxS in El Paso County residents were higher than any other population surveyed, except the people who manufactured the chemicals in Alabama. “What we’ve been fighting for, for five years, is identifying how contaminated we are from the toxic firefighting foam, the PFHxS,” said Rosenbaum. “We are highly contaminated in El Paso County.”
The most recent results from the CDC and ATSDR were presented alongside results from the 2018 and 2019 PFAS Aware study conducted by the Colorado School of Public Health, and showed a slight decrease in PFAS levels overall. “[PFAS Aware] did a 200 person blood study and then a final 50,” said Rosenbaum. “I was in the 200 and the final 50, and my levels dropped from 19 [micrograms per liter, μg/L] to 12 [μg/L]. You can see just how high we are from 2019, and it’s dropping a little by 2020, because as we’re not drinking this water, it’s not bio-accumulating in our system. What’s been in our system is slowly filtering out as we go to the bathroom.”
Stagecoarch Reservoir outflow June 23, 2019. Photo credit: Scott Hummer
Here’s the release from Colorado Parks & Wildlife (Travis Duncan):
Due to critically low water flow caused by dry conditions and minimal snowpack levels, Colorado Parks and Wildlife (CPW) will implement a mandatory fishing closure on a 0.6-mile stretch of the Yampa River between the dam at Stagecoach State Park downstream to the lowermost park boundary.
The closure begins May 25 and will continue until further notice.
“Should the flow rate increase substantially for a continuous period of time, CPW will re-evaluate the emergency fishing closure,” said CPW Senior Aquatic Biologist Lori Martin. “But because of the current conditions, we need to take this course of action now.”
CPW works closely with the Upper Yampa Water Conservancy District (UYWCD), who owns and operates Stagecoach Reservoir, to stay informed on reservoir releases and monitor drought conditions. UYWCD is finalizing a contract with the Colorado Water Trust for environmental releases later in the year.
“Timing (environmental releases) is critical to the health of the river system,” said UYWCD General Manager Andy Rossi. “We manage the reservoir and collaborate with our partners to ensure that water is available and legal mechanisms are in place to release water when the river needs it most. Unfortunately, flows are already low, but hot and dry summer months are still to come,” said Rossi.
Water releases are currently only at 20% of average, and will be dropping to less than 15% of average for this time period. When water flows are minimal, fish become concentrated in residual pool habitat and become stressed due to increased competition for food resources. The fish become much easier targets for anglers, an added stressor that can result in increased hooking mortality.
“We are trying to be as proactive as possible to protect the outstanding catch-and-release fishery we have downstream of Stagecoach Reservoir,” said CPW Area Aquatic Biologist Bill Atkinson. “This stretch of the river receives a tremendous amount of fishing pressure, especially in the spring when other resources might not be as accessible. This emergency closure is an effort to protect the resource by giving the fish a bit of a reprieve as they can become quite stressed during these extreme low-flow conditions. This spring we have not witnessed a spike in flows, which can offer fish protection and allow them to recoup energy following the spring spawn season.”
CPW advises anglers to find alternative areas to fish until the order is rescinded. Many other local areas will become more fishable soon as runoff tapers down. Several area lakes are also opening and should be fishing well.
CPW asks for cooperation from anglers, who should be aware the mandatory fishing closure will be enforced by law with citations issued for anyone violating the order.
Wildlife officials warn when a fish population is significantly affected by low stream flows or other unfavorable environmental conditions, it could take several years for it to fully recover if not protected. Given the extreme drought conditions we are currently faced with, other stretches of river in this area may be subject to additional closures this season.
Like many rivers and streams in western Colorado, the Yampa River offers world-class fishing and attracts thousands of anglers each year, providing a source of income to local businesses that depend on outdoor recreation.
“We ask for the public’s patience and cooperation,” said Stagecoach State Park Manager Craig Preston. “It is very important that we do what we can to protect this unique fishery, not only for anglers, but for the communities that depend on the tourism these resources support.”
For more information, contact Stagecoach State Park at 970-736-2436, or CPW’s Steamboat Springs office at 970-870-2197.
Upper Yampa River Water Commissioner, Scott Hummer, sent these photos via email this morning to show the conditions above Stagecoach Reservoir. He writes, “Not much water being produced in the Yampa headwaters in South Routt County. Photo of inflow at Stagecoach Inlet yesterday = 10 CFS / 9% of the historic iflow rate! This morning [May 25, 2021] Stagecoach inflow = 7.9 CFS! The photos depict the story in the upper Yampa…”
Yampa River below Oakton Ditch above Phippsburg May 2021. Photo credit: Scott Hummer
Yampa River at Stagecoach Res Inlet 10 CFS 5-24-21 May 2021. Photo credit: Scott Hummer
Yampa River at Phippsburg May 2021. Photo credit: Scott Hummer
Yampa River flows below Stafford Ditch May 2021. Photo credit: Scott Hummer
Stafford Ditch – Check Dam May 2021. Photo credit: Scott Hummer
The eight major river basins, plus the Denver metro area, are shown on this map from the South Platte River Basin Roundtable. Each basin has its own roundtable, made up of volunteers, to address local water issues. Credit: Colorado Water Conservation Board
The state water board is encouraging all nine basin roundtables to adopt a code of conduct requiring members to communicate in a professional, respectful, truthful and courteous way. But some Western Slope roundtables are pushing back.
Over roughly the last month, Colorado Water Conservation Board Director Rebecca Mitchell has been visiting the remote roundtable meetings on Zoom, answering questions about the code of conduct and urging the roundtables to adopt it. The goal of the document is to make sure everyone feels comfortable speaking up in meetings.
Mitchell said that with important and potentially contentious discussions on the horizon for water-short Colorado, it’s important to have a set of conduct standards in place to guide those discussions.
Gunnison River Basin Roundtable member Bill Nesbitt said at the May meeting it was a “third-grade sandbox question.” Mitchell agreed.
“I think it is similar to a third-grade sandbox, but not every sandbox is fair and some kids throw sand in other kids’ eyes,” Mitchell said. “We need to make the message clear about the expectations as we move forward to some of those really difficult discussions.”
Some members of the Southwest Basin Roundtable welcomed the code of conduct.
“I support adopting a policy,” said Mely Whiting, environmental representative and legal counsel for Trout Unlimited. “I think that things do get more and more controversial as we move forward. In my experience on this roundtable, in recent times things have gotten a little bit out of hand and quite a bit more aggressive. I’ve been, myself, uncomfortable quite often.”
The Colorado legislature created the nine basin roundtables — South Platte, Metro, Arkansas, Rio Grande, San Juan/Dolores (collectively known as Southwest) Gunnison, Colorado, Yampa/White/Green and North Platte — in 2005 to encourage locally driven collaborative solutions on water issues. They represent each of the state’s eight major river basins, plus the Denver metro area, and are made up of volunteers from different water sectors like agriculture, environment, recreation and municipal.
In addition to asking members to promote an inclusive environment that treats everyone fairly, the code also lays out best practices for conducting business. According to the code, the roundtables have the responsibility for noticing meetings, adhering to federal and state laws and public health orders and performing job tasks promptly and effectively.
Members at both the Southwest and Gunnison roundtables had issues with the best practices section. Montezuma County representative Ed Millard said the best practices section seemed more relevant to employees of the Division of Water Resources, not a volunteer board.
“I just think it’s going to have to be tuned to a volunteer organization before we adopt it,” he said at the April Southwest Roundtable meeting. “We certainly do need to resolve the tension and friction, but I don’t think adoption of (an) employee code is the way to do that.”
Southwest adopted the rest of the code of conduct, minus this best practices part at its May meeting. In the Gunnison basin, a motion to adopt the code of conduct failed; the discussion has been tabled until the July meeting.
Roundtable member Michael Murphy, who represents Hinsdale County, said the group already holds their meetings with respect and that the code was unnecessary.
“We are western Colorado. We don’t like being told what to do,” he said at the May Gunnison Basin Roundtable meeting.
The Colorado Water Conservation Board is hoping the nine basin roundtables adopt their code of conduct. From left, back row: Steve Anderson, Dan Gibbs, Kevin Rein, Jim Yahn, Heather Dutton, Russell George, Curran Trick, Greg Felt; front row: Jessica Brody, Gail Schwartz, Celene Hawkins, Jaclyn Brown, Becky Mitchell. CREDIT: HEATHER SACKETT/ASPEN JOURNALISM
While the code of conduct will be the policy of the Colorado Water Conservation Board, Mitchell admitted there was little the CWCB could do to enforce it on the roundtables, and the roundtables don’t have to adopt it.
“Being perfectly honest and transparent, enforcing a code of conduct on a volunteer roundtable is difficult,” she told the Southwest Roundtable. “(Enforcement) is as much a responsibility of me as a self-policing in the way we treat each other.”
Arkansas and Yampa/White/Green roundtables are aware of the code of conduct, but have not adopted it. The Rio Grande, South Platte and Metro basin roundtables have formally adopted it. The Colorado and North Platte basin roundtables have not discussed it yet.
This story ran in the May 24 editions of The Aspen Times and the Sky-Hi News.
Created by Imgur user Fejetlenfej , a geographer and GIS analyst with a ‘lifelong passion for beautiful maps,’ it highlights the massive expanse of river basins across the country – in particular, those which feed the Mississippi River, in pink.
The Arizona Legislature wants to look into the feasibility of pumping water from the Mississippi River to Arizona.
But the U.S. Bureau of Reclamation has already studied the idea, and weighed in on the project in 2012.
The agency studied factors such as cost, legal issues, power use and the amount of time the project would take.
A report estimated the project could cost up to $14 billion; the timetable was around 30 years.
“This is not a new idea. The concept of a massive pipeline to transport water from the Midwest into the Colorado River Basin, has been proposed in the past and evaluated, and the feasibility really isn’t there,” said Kim Mitchell of Western Resource Advocates…
Arizona still owes the federal government about a billion dollars for the Central Arizona Project, which pumps water from the Colorado River to the Phoenix and Tucson areas.
Middle and high school students from around Colorado competed May 15 and 16 in the 2021 FIBArk RunOff, a series of slalom and downriver races.
“The weekend of racing was a huge success, although water levels were lower than normal,” Alli Gober, FIBArk river events coordinator, said. “It’s always exciting to see younger paddlers stepping into the competition mind-set. Some of these young paddlers may go on to race internationally in the future, and it all starts here.”
From helping farmers keep an eye on their crops to capturing video footage for business marketing, Barn Owl Drone Services is working to take flight in Southeastern Colorado.
The business launched in August 2017 when Jaron Hinkley, his sister Sarah Hinkley and her husband, Brian Stafford, felt obligated to move “back home” to the La Junta area when their grandparents needed help due to medical issues…
Barn Owl Drone Services launched its drone and robotic services for farmers with the first drone in the air during the growing season of 2018. A fleet of seven drones helps the company’s five employees monitor crops and plant conditions.
On the robotics end the service uses “owl perches” which are artificial-intelligence supported weather stations, to detect insects and disease. The stations also can measure soil moisture and soil temperatures, to “help our farmers and to help reduce the use of resources like water,” Sarah said…
With hemp farmers the company offers male plant detection and removal. Although the company focuses on farmers, other clients from gravel pits and landfills to feed lots can benefit by having the drones keep tabs on volumes and supplies.
A Colorado Water Plan Scoping Workshop focusing on innovations in on-farm irrigation technology and water management.
About this event
This will be a two-hour, virtual (zoom) session facilitated by Colorado Water Conservation Board and the Irrigation Innovation Consortium (IIC). The focus of this session will be on bringing together knowledgeable stakeholders on innovations in on-farm irrigation technology and water management. The discussion will be centered around specific actions (e.g. programming, public policies, resources, research) to be included in the Colorado Water Plan Update.
Gathered around the campfire one evening during a rafting trip many years ago, the conversation was about classroom education of river guides. I remember it well almost 40 years later because I cracked a joke that got a round of laughter.
To make the educational experience complete, I said, somebody should throw a pail of cold water over those assembled to make it like a real river trip.
That memory was provoked by a recent visit to the Headwaters River Journey, a water-focused exhibit-slash-museum that occupies the ground floor of the Headwaters Center in Winter Park. It doesn’t leave you shivering like you just fell into a cold mountain stream. It does intend for visitors to gain an appreciation for mountain water and the consequences of its loss, in the case of the Fraser Valley to the benefit of metropolitan Denver.
Colorado has 25 ditches, tunnels, and other conveyances that ferry water over and through the Continental Divide, from the Western Slope where 80% of water originates, mostly in the form of snow, to the Front Range cities and the farms beyond, where 85% of Coloradans live. No place has been dewatered so severely as the Fraser Valley, where Winter Park is located.
Diversions that began in 1936 have resulted in 60% of the water from the Fraser Valley being diverted to metropolitan Denver. That percentage will increase to more than 80% if a long-contemplated project by Denver Water gets realized.
Headwaters River Journey seeks to deliver an appreciation for the natural environment of the Fraser and other mountain valleys and the cost to these ecosystems. It does so with an abundance of hands-on experiences.
One exhibit allows a literal hands-on demonstration of depletion of Jim Creek, one of the sources of metropolitan Denver’s water, as levels rise in Moffat Tunnel pipeline. Photo/Headwaters Center via The Mountain Town News
The hands-on learning is literal in an exhibit about Denver Water’s diversion from Jim Creek. The creek originates on the flanks of James Peak, across from the Winter Park ski area, meandering through a glacial-carved valley to a confluence with the Fraser River. Or, what’s left of the creek.
The exhibit has you lay hands on an operating wheel that is used to raise or lower a headgate at a diversion point. As you crank the red wheel, as if to divert water into a diversion ditch, a screen on the left shows water levels in the creek dropping. More cranks yet reveal cobbles, a creek nearly without its water. A panel on the right shows corresponding water levels rising in the water pipe in the Moffat Tunnel used by Denver to deliver water to South Boulder Creek, just one relatively minor hump away from Denver’s suburbs.
This was not news to me. I once lived in that valley, proudly wearing a “Dam the Denver Water Board” (as the water agency was formerly called) bumper sticker on my car. Now, I live on the receiving end of that water, in the Denver suburb of Arvada. Here, 78% of water for this city/suburb of 120,000 people comes through the Moffat Tunnel from Jim Creek and myriad other creeks in the Fraser Valley. More yet comes from the adjacent but far more remote Williams Fork Valley, two more tunnels away.
The plumbing before the water arrives at my garden hose is vast, complex, and expensive. The legal system for administration of Colorado’s water may be more byzantine yet.
Headwaters doesn’t dive deep on the history, legal system, or the plumbing. It’s more like a chapter in Colorado Water 101. It is geared to someone who knows relatively little about water.
Still, someone like myself, who has written about Colorado water off and on for more than 40 years, the exhibits can fill in gaps. One of my gaps is biology. One exhibit showed the life stages of stoneflies, an important component of the aquatic ecosystem. Through an interactive exhibit, I swam along a river bottom somewhat like a trout might, looking for food.
Another interactive experience allowed me to flap my arms as if a condor, flying over the geography from Berthoud Pass northward to Longs Peak and west along the Rabbit Ears Range. If a museum can be this much fun for an older guy, I wonder what it would be like to be a 10-year-old.
My companion, Cathy, was most touched by two exhibits that triggered her memories of living for almost 30 years in a very small mountain town in a house above the confluence of a creek and river.
One was a line of the life to be found along a mountain creek, from the bugs to the four-legged critters. She says it was a lovely reminder of “all the friends that I miss” now that she lives, sometimes with regret, a citified life.
The other was a wall-sized video immersion at the beginning of the exhibit that shows the changing of the seasons from one vantage point of a mountain slope. As the snow fell, there was a whoosh of chilled air. As the snow melted, there was the sound of water drops falling.
Colorado’s population has grown rapidly since the early 20th century, as the Headwaters Center exhibit graphically points out. Photo/Allen Best
The exhibit is the creation of Bob and Suzanne Fanch, owners for the last 20 years of the 6,000-acre Devil’s Thumb Ranch, which is 7 or 8 miles down the valley —and, perhaps not incidentally, just below some of Denver Water’s diversions on Ranch Creek. It’s one of the nation’s most high-end cross-country ski destinations.
Kirk Klancke, a neighbor of the Fanches on Ranch Creek and an active member of Trout Unlimited and other water-related causes, describes himself as a technical advisor.
The Fanches, he explains, got the bug for interactive exhibits after visiting a museum in Iceland. “What a great educational tool, and the Fanches have always been interested in the future of the Fraser River,” he says.
The vision was distilled by Suzanne, he says, in a discussion. She took the message from a Trout Unlimited movie about the plight of the river that was called “Tapped Out.” A Boulder couple, Chip and Jill Isenhart, who have a company called ECOS Communications, designed the exhibits.
“We are natural history and environmental storytellers, and our team of content experts and designers has been doing this for more than 30 years in Colorado,” says Chip Isenhart.
“Our passion is partnering with mission-driven clients like the Fanches, and they have done an amazing job creating a world-class exhibit in Grand County.”
Isenhart says the primary task in creating the exhibit was to connect the dots between the Fraser River and the Front Range residential water use. To do this, he and his team needed to see the story through the eyes of the locals.
“We would go out on the river with Kirk Klancke, and folks from CPW, and meet frustrated anglers due to fishing closures at 1 p.m. due to river temperatures being so high from the lack of water,” says Isenhart. “And at the same time we also got to work closely with Front Range water interests to make sure our story was balanced. That was very, very important to ECOS and the Fanches and Trout Unlimited, as this issue is beyond complicated. It’s actually fairly easy to paint a picture that’s more sensational than accurate.”
Once ECOS had the essentials of the story figured out, they set out to create a variety of fun, changeable, and—they hoped—memorable interactive experiences to tell that story.
One of my memories is of the bathroom stall. No opportunity for educational storytelling was missed.
See Headwaters River Journey for hours and location. Photo credit: Allen Best/The Mountain Town News
The take-home message of Headwaters River Journey is about personal responsibility.
“It’s taking the knowledge you’ve learned and actually making a difference using that knowledge and being a participant, rather than a spectator,” says Klancke. “That is what this museum is designed to do.”
The ideal audience would be somebody who lives in metropolitan Denver, a beneficiary of the exported water, or more broadly somebody from the Front Range. As such, it might better be located in Golden, for example, or even along the Platte River near downtown Denver. It was located in Winter Park, at least in part, because the municipality provided the 6 acres of land. Plus, there is an additional benefit. Immediately outside the backdoor of the exhibit is an illustration of beavers, willows and a braided mountain river.
But Isenhart says the exhibit can have value for remote learning, especially for classrooms along the Front Range. “That’s hopefully one of the next steps,” he reports.
I had intended to visit the exhibit in March 2020, on the way back to Denver after a trip to Craig. I was a bit late, and hence the curtain of covid descended the next week. My trip was delayed by 13 months.
It was worth the wait, though. Headwaters River Journey exceeded my expectations. And I’d go back again for a refresher.
This is from Big Pivots, an e-journal that tracks the energy and water transitions in Colorado and beyond. To get copies, go to http://BigPivots.com.
Recent rainfall has been a boon for eastern Colorado. The Front Range has enjoyed abundant precipitation and nearly half of the state’s geographic area has shed drought conditions, according to the U.S. Drought Monitor.
But the Western Slope hasn’t been blessed with the same precipitation levels, leaving a brutal drought and a high risk for fire to worry about.
Assistant state climatologist Becky Bolinger said it’s typical for conditions on one side of the Continental Divide to differ from the other. And western Colorado usually gets more precipitation than the east because of the jet stream…
Bolinger predicts snowpack to the west will melt by the end of the month…
Outlooks from the Climate Prediction Center suggest Colorado is headed for another hot and dry summer. On average, June is the driest time of year for southwest Colorado, where relief won’t come until the onset of the summer monsoon season. Bolinger said thunderstorms can pop up anywhere, even in dry conditions, that could provide some relief.
The latest report from the National Drought Mitigation Center shows that 48 percent of Colorado has shifted to drought-free or abnormally dry conditions since the start of the year. In January, all of the state was in some level of drought, with 77 percent in extreme or exceptional drought – the two worst categories.
Improvements – at least for eastern Colorado – began in mid-March as significant snow brought the first hints of relief. During May, thunderstorms have continued to bring rain to the state’s eastern plains, resulting in drought-free conditions for most northeast counties, with much of the southeast moving to abnormally dry, a step below moderate drought.
The first drought-free area in Colorado since mid-2020 appeared in late April.
Colorado Drought Monitor map May 18, 2021.
Over the past reporting period, between one-half and three inches of rain have fallen across the region, with storms producing higher amounts in localized areas.
Western Colorado continues to be dominated by extreme and exceptional drought. Portions of Moffat, Garfield and Rio Blanco counties have even seen conditions further degrade over the past few months, moving from extreme drought into exceptional.
Over the past week, nearly all of the eastern half of the state which had not already shifted to drought-free condition showed at least one category of improvement. Portions of El Paso, Elbert and Lincoln counties remained in moderate conditions, while southern Las Animas County saw severe drought shrink, though a strip remains along the border with New Mexico.
Southern Baca County saw two levels of category improvement, moving from severe to abnormally dry conditions. Much of central Huerfano, southern Pueblo and far north Las Animas counties also shifted by two categories, moving from moderate drought to drought-free. A remaining area of extreme drought in Las Animas County moved to severe conditions.
Colorado Drought Monitor one week change map ending May 18, 2021.
Kiowa County has seen a particularly dramatic improvement since the start of the year. At that time, the bulk of the county was in extreme drought, with a persistent bullseye of exceptional conditions covering the central part of the county for months. With the most recent report, western and eastern Kiowa County are abnormally dry, with the central area in moderate drought, dropping from severe last week.
Overall, 23 percent of the state is drought-free, up from 13 percent last week, with an additional 25 percent in abnormally dry conditions, up from 12 percent in the previous week. Moderate drought covered 13 percent of Colorado, down from 32 percent, while severe drought dropped from 14 to 10 percent. Extreme and exceptional drought were unchanged at 13 and 16 percent, respectively.
La Niña conditions have ended and NOAA forecasters estimate about a 67% chance that neutral conditions will continue through the summer. The ENSO forecast for the fall is less confident, with odds of a second-year La Niña currently hovering around 50–55%.
Spring cleaning
If you’ve been paying very close attention to the surface temperature of the tropical Pacific Ocean (and really, who doesn’t?!) you may have noticed that the April 2021 Niño 3.4 Index, at 0.75°C below average, still exceeds the La Niña threshold of 0.5°C below average. This is according to ERSSTv5, our primary sea surface temperature dataset.
Monthly sea surface temperature in the Niño 3.4 region of the tropical Pacific for 2020-21 (purple line) and all other years starting from first-year La Niña winters since 1950. Graph by Emily Becker based on ERSSTv5 temperature data.
By the way, “average” is now calculated over 1991–2020. Check out the second half of this post for more on what that means for measuring ENSO, and this climate.gov post by our esteemed editor for what it means as far as US climate.
April 2021 sea surface temperature departure from the 1981-2010 average (note that this image still uses the previous averaging period). Image from Data Snapshots on Climate.gov.
However, as we know from long experience, ENSO (El Niño/Southern Oscillation) is more than just the ocean surface temperature anomaly (the difference from the long-term mean). The atmospheric component is just as important, as it serves to reinforce the surface temperature anomaly and transmit ENSO’s impacts across the globe. Over the past few weeks, atmospheric conditions over the tropical Pacific no longer resemble the strengthened Walker circulation pattern that we expect during La Niña.
That strengthened Walker circulation is characterized by reduced rain and clouds over the central Pacific and more over the far western Pacific and Indonesia. This pattern was evident for the past several months, especially the drier-than-average region over the central tropical Pacific, but has dissipated as of early April.
Outgoing long-wave radiation anomalies for the past year. Regions with more clouds and rain than average are shown in purple; areas with fewer clouds and less rain are shown in orange. Each row in this type of image is the departure from average (1974-2020) at that time. The drier-than-average signature of La Niña in the central tropical Pacific is visible as the large orange area that ends in April 2021. NOAA Climate.gov image, based on data provided by the Climate Prediction Center.
Other signifiers, such as stronger-than-average trade winds, have also diminished across most of the Pacific Ocean in the past month. The Southern Oscillation Index and Equatorial Southern Oscillation Index, both of which measure the atmospheric component of ENSO (more details here), are also indicating neutral conditions. Hence, the ENSO forecast team has concluded that La Niña is over, despite the sea surface temperature anomaly.
A sea surface temperature anomaly of -0.5°C (or, in the case of El Niño, +0.5°C) isn’t a magic switch that causes an instant atmospheric reaction, as we’ve seen many times before. For example, a couple of months preceding the last El Niño featured sea surface temperature anomalies near or slightly exceeding the thresholds, but a coherent atmospheric response didn’t kick in right away. The atmosphere-ocean system is vastly complicated, of course, and there are always many different things going on at once, so a delayed response isn’t surprising. As an atmospheric scientist, I’d actually be very surprised if the atmosphere coupling occurred immediately upon crossing the ENSO threshold!
Finally, the water below the surface of the tropical Pacific is warmer than average and a downwelling Kelvin wave is moving eastward under the surface. This means that there are limited sources of cooler-than-average water to replenish the surface over the next few months, adding some confidence that La Niña is done… for now.
Springboard
What everyone would like to know, of course, is what will happen ENSO-wise later in the year, following the neutral conditions that are likely to remain through the summer. ENSO has a strong relationship with the Atlantic hurricane season (June–November), with El Niño tending to lead to a reduced number of tropical storms and hurricanes, and La Niña tending to enhance the season. Last year’s extremely active Atlantic hurricane season was influenced by La Niña, so of course we’d like to get an idea of what’s ahead.
Let’s start with the easier case—chances that El Niño will develop are low, hovering around 8%. El Niño has developed following a first-year La Niña in the past, but we’ve only seen that happen twice since 1950, and most of the computer models give the development of El Niño similarly low odds.
Climate model forecasts for the Niño3.4 Index. Dynamical model data (black line) from the North American Multi-Model Ensemble (NMME): darker gray envelope shows the range of 68% of all model forecasts; lighter gray shows the range of 95% of all model forecasts. NOAA Climate.gov image from University of Miami data.
A substantial amount of warmer-than-average subsurface water in the spring can sometimes give an early heads-up that El Niño is on the way, but this April’s average of 0.6°C is not particularly high, ranking 12th out of the 43 years we have on record. The February–April 2021 average is just about zero. Other springs with a similar value have been followed by El Niño, La Niña, or neutral in the subsequent fall. Our guest blogger Aaron Levine discussed springtime ENSO prediction—head over there for more details. So, to sum up: small chance of El Niño.
The Warm Water Volume anomaly during February-April compared against Niño-3.4 sea surface temperature (SST) during the following November-January. The La Niña years are colored in blue, the El Niño years in red, and ENSO-Neutral years in black. Large negative values of Warm Water Volume anomalies almost always lead to a La Niña event. However, large positive Warm Water Volume anomalies do not lead to El El Niño events. For SST data, OISST is used. Warm Water Volume comes from the PMEL analysis (http://www.pmel.noaa.gov/elnino/upper-ocean-heat-content-and-enso). Figure provided by Aaron Levine and modified by Climate.gov.
The likelihood of La Niña versus neutral after the summer is less clear. Many of the computer models are suggesting that we may see a second-year La Niña, a common occurrence in the historical record (and a topic that Nat will be covering in his post later this month). However, the spring predictability barrier—forecasts made in the spring tend to be less skillful than forecasts made in other times of the year—is still in effect for May predictions, reducing the confidence in forecasts for the fall and winter.
Editor’s note from R.L.: I’ve added this image without Emily’s express permission…because it’s a cartoon, and who doesn’t like a cartoon? Illustration by Emily Greenhalgh, NOAA Climate.gov.
Currently, forecasters estimate the chance of La Niña during August-October, the heart of the hurricane season, at 42%, which is slightly lower than the 50% chance of neutral.
There are other factors at play in the hurricane season besides ENSO, including Atlantic Ocean temperatures. NOAA’s team is hard at work on the 2021 outlook, which will be released on May 20th.
Declining levels at the second-largest reservoir in the U.S. have spurred officials in Colorado, Utah, Wyoming, and New Mexico to search for ways to prop it up.
Lake Powell on the Colorado River is dropping rapidly amid one of the southwestern watershed’s driest years on record. It’s currently forecast to be at 29% of capacity by the end of September — the lowest level since the reservoir first started filling in 1963. Its sister reservoir downstream on the Colorado River, Lake Mead, is also approaching a record low this year.
The amount of water flowing to Lake Powell since October has been less than what the river delivered during the same period in 2002, the driest year on record. Total reservoir storage in the Colorado River basin is projected to be at 39% of capacity by the end of September.
Current Upper Colorado River Basin Reservoir Status May 12, 2021 via the USBR.
Federal projections for the reservoir are prompting water officials to begin strategizing ways to keep Lake Powell from declining to a level where hydroelectric power generation is not possible. In a statement, the Upper Colorado River Commission announced it will begin developing a drought response operations plan, a measure outlined in a 2019 agreement. Earlier this year the reservoir’s declining level triggered monthly calls among the Upper Basin states and mandated a wider range of modeling.
Rows of recent planted of young pine trees. Photo via the University of Michigan
Here’s the release from the University of Michigan (Jim Erickson):
Some climate activists advocate large-scale tree-planting campaigns in forests around the world to suck up heat-trapping carbon dioxide and help rein in climate change.
But in a Perspectives article scheduled for publication May 21 in the journal Science, a University of Michigan climate scientist and his University of Arizona colleague say the idea of planting trees as a substitute for the direct reduction of greenhouse gas emissions could be a pipe dream.
“We can’t plant our way out of the climate crisis,” said Arizona’s David Breshears, a top expert on tree mortality and forest die-off in the West. His co-author is Jonathan Overpeck, dean of the U-M School for Environment and Sustainability and an expert on paleoclimate and climate-vegetation interactions.
Instead of wasting money by planting lots of trees in a way that is destined to fail, it makes more sense to focus on keeping existing forests healthy so they can continue to act as carbon “sinks,” removing carbon from the atmosphere through photosynthesis and storing it in trees and soils, according to the researchers. At the same time, emissions must be reduced as much as possible, as quickly as possible.
Overpeck and Breshears say they hope the role of the world’s forests—and specifically the urgent need to protect existing forests and keep them intact—is thoroughly debated when the world’s climate action leaders gather at the COP26 climate change conference in Glasgow this November.
“Policymakers need to enable new science, policy and finance mechanisms optimized for the disturbance and vegetation change that is unstoppable, and also to ensure that the trees and forests we wish to plant or preserve for the carbon they sequester survive in the face of climate change and other human threats,” Overpeck and Breshears wrote.
“Failure to meet this challenge will mean that large terrestrial stores of carbon will be lost to the atmosphere, accelerating climate change and the impacts on vegetation that threaten many more of the ecosystem services on which humans depend.”
Keeping forests healthy will require a new approach to forest management, one that Overpeck and Breshears call managing for change. As a first step, policymakers and land managers need to acknowledge that additional large-scale vegetation changes are inevitable.
Climate change has been implicated in record-setting wildfires in the western United States, Australia and elsewhere, as well as extensive tree die-offs that are largely due to hotter, drier climate extremes. Those disturbing trends are expected to accelerate as the climate warms, according to Overpeck and Breshears.
“Even in a world where climate change is soon halted, global temperature rise will likely reach between 1.5 and 2 C above pre-industrial levels, with all the associated extreme heat waves that brings, and thus global vegetation will face up to double the climate change already experienced,” they wrote.
At the same time, deforestation continues to expand globally and is especially damaging in tropical forests, which hold vast amounts of biodiversity and sequestered carbon.
The next step toward a new managing-for-change paradigm is to manage forests proactively for the vegetation changes that can be anticipated—instead of trying to maintain forests as they were in the 20th century, Overpeck and Breshears say.
Managing for change means, for example, more aggressive thinning of forests to reduce the buildup of fuels that stoke massive wildfires. It also means selectively replacing some trees—after a wildfire, for example—that are no longer in optimal climate zones with new species that will thrive now and in coming decades.
Such activities, where needed, will inevitably increase the costs of forest management, according to the researchers. But such costs should be considered a prudent investment, one that helps preserve an underappreciated service that forests provide to humanity for free: carbon storage, also known as carbon sequestration.
Forests are already managed to preserve the natural resources and ecosystem services they provide. In addition to supplying timber, fuelwood, fiber and other products, forests clean the air, filter the water, and help control erosion and flooding. They preserve biodiversity and promote soil formation and nutrient cycling, while offering recreational opportunities such as hiking, camping, fishing and hunting.
Carbon sequestration should rank high on the list of invaluable services that forests provide, and efforts to preserve and enhance this vital function should be funded accordingly, Overpeck and Breshears say.
For example, there’s a big opportunity to improve the ability of forests to store carbon through increased use of biochar, a form of charcoal produced by exposing organic waste matter—such as wood chips, crop residue or manure—to heat in a low-oxygen environment. Large amounts of wood generated during forest thinning projects could be converted to biochar, then added to forest soils to improve their health and increase the amount of carbon that is locked away, Overpeck says.
“Thinning of forests, conversion of the removed wood to biochar and burial of the biochar in forest soils is a way to bring new jobs to forested rural areas while allowing forests to play a bigger role in keeping carbon out of the atmosphere and thus fighting climate change,” he said. “Forest carbon management could be a boon for rural areas in need of new economic engines.”
In the long run, such projects are likely to benefit forests and enhance their ability to store carbon far more than massive tree-planting campaigns conducted without appropriate management strategies, according to Overpeck and Breshears.
“Tree-planting has great appeal to some climate activists because it is easy and not that expensive,” Breshears said. “But it’s like bailing water with a big hole in the bucket: While adding more trees can help slow ongoing warming, we’re simultaneously losing trees because of that ongoing warming.”
In their Perspectives article, Overpeck and Breshears explore the implications of a new study by Ondřej Mottl et al., also scheduled for publication May 21 in Science, titled “Global acceleration in rates of vegetation change over the past 18,000 years.”
In a photo from 2020, a distinct line around the rocky shore shows how much the water level has decreased in Nevada’s Lake Mead. Mead is expected to drop 15 feet in 2021 Photo credit: Roberto (Bear) Guerra/High Country News
Opinion: The latest forecast suggests for the first time that Lake Mead could fall into a Tier 2 shortage by 2023, thrusting even deeper water cuts on Arizona.
Lake Mead’s water levels are heading the wrong way and going there alarmingly fast.
If the forecast holds, it’s now likely that we will fall into a more severe Tier 2 shortage by 2023, spreading painful cuts to even more water users in Arizona.
That nugget of bad news comes from the U.S. Bureau of Reclamation’s 24-month study, which is updated each month to predict reservoir conditions for the next two years. In April, the projection was that Lake Mead – the reservoir that provides nearly 40% of Arizona’s water – would most certainly be in a Tier 1 shortage in 2022 but would miss the Tier 2 cutoff for 2023 by three-tenths of a foot.
Now, in May, the most likely projection is that Lake Mead will end 2022 at 1,048.83 feet of elevation – more than a foot past the trigger to put us in Tier 2.
We’re hot, dry and low – a volatile mix
The good news (if you can call it that) is that the predictions didn’t change nearly as rapidly from April to May as they did from March to April. Projected lake levels for December 2022 dropped last month by about 5 feet, thanks to horribly anemic and earlier-than-expected runoff.
It’s also worth noting that if we didn’t have the Drought Contingency Plan (DCP) in place to conserve water, we would already be in this shape. That agreement didn’t solve our problems, but it has bought us time and certainty as deeper cuts play out – which is exactly what it was intended to do.
West Drought Monitor map May 18, 2021.
That said, we’re still hot and dry, with more than half of the Colorado River basin now in extreme drought, the most severe category. Unless that trajectory changes, the forecast is probably not going to get much better.
And, even worse, we’re getting down into the V-shaped part of Lake Mead, meaning it takes a loss of less water to drop lake levels than it once did. Losing smaller volumes of water can have bigger impacts.
Which is why there’s also a 1 in 4 chance that we could fall into a Tier 3 shortage by 2025 – the worst-case scenario spelled out under DCP and one that would much more heavily impact metro Phoenix cities.
How a Tier 2 shortage could play out
But a Tier 2 shortage in 2023 wouldn’t be a walk in the park. Technically, there are two levels of Tier 2 shortage for Arizona – a Tier 2a that’s triggered at 1,050 feet of elevation on Lake Mead and a Tier 2b that would occur at 1,045 feet.
It’s a small variance in elevation, but it would increase required cuts statewide, from 592,000 to 640,000 acre-feet, and decimate Central Arizona Project’s Non-Indian Agriculture (NIA) pool, which despite its name mostly supplies tribes and cities.
Luckily, Arizona’s DCP implementation plan includes water to temporarily mitigate the impact of those cuts. But the amount replenished in 2023 would fall from 75% to 50% in a Tier 2b shortage. That will still be painful, particularly for metro Phoenix cities that use NIA water to serve a few existing customers.
The May projection is already within about 3 feet of reaching a Tier 2b shortage. And let me underline that – we’re talking about the most probable projection. Not the best or worst case, but the most likely.
We’ve planned for this, but it’ll still hurt
We’re also less than 20 feet from triggering what might be called the doomsday provision within DCP.
If the lake is projected to fall below 1,030 feet any time within two years, Arizona, California and Nevada must reconvene to decide what additional steps they will take to keep Mead from falling below 1,020 feet – an elevation that many consider the crash point. The next milestone below that is “dead pool,” where no water leaves the lake.
And that provision is triggered by any part of the forecast – not just the maximum or most probable scenario, but the minimum probable scenario, too.
It’s anyone’s guess what will happen then.
But, hey, at least we’ve got plans in place to handle Tier 2 and 3 shortages. And, in even better timing, Arizona has just completed a multiyear effort to flesh out how cities and other users can begin withdrawing the millions of acre-feet of water they have stored underground.
Explaining the benefits and pitfalls of that effort is for another blog on another day, but for now, let’s just say it’s a good thing we have water stored for a (non)rainy day.
Because the outlook for Arizona’s major renewable water source is parched and bleak – and growing more so every day.
Colorado River “Beginnings”. Photo: Brent Gardner-Smith/Aspen Journalism
Click here for all the inside skinny and to register:
Topic
Colorado State of the River
Description
Join the Colorado River District for the Colorado State of the River, a webinar addressing issues across the basin.
Learn how last year’s wicked wildfire season has impacted our water supplies and how to prepare for the impacts of post-fire floods. Get information about water availability amid impending summer drought and find out more about funding available for local water projects.
If you cannot attend the webinar live, register to receive a recording of the webinar in your email inbox to watch later.
Agenda:
• Welcome – Colorado River District
• Colorado River District’s Community Funding Program – Colorado River District Director of Strategic Partnerships Amy Moyer
• Water Supply Updates and Drought in the Colorado River Basin – Division 5 Assistant Division Engineer James Heath
• Impacts of 2020 Wildfires and Fire Recovery in the Colorado River Basin – U.S. Forest Service Hydrologist Liz Schnackenberg, Joel Cochran, Grand County Director of Emergency Management, Northern Water Source Water Protection Specialist Kimberly Mihelich and Middle Colorado Watershed Council Executive Director Paula Stepp
• Learning By Doing: Updates and Fire Recovery – Learning by Doing Coordinator Kiki Sayre and Water Quality Technical Assistance Consultant for Grand County Kayli Foulk
Time
May 27, 2021 06:00 PM in Mountain Time (US and Canada)
Possible reservoir a key element of [water] providers’ long-term plans
The Eagle River Water & Sanitation District and the Upper Eagle Regional Water Authority — separate entities that share offices — is looking at a possible plan to create a reservoir on the lake site just south of Minturn. The plan, if it comes to pass, could take 10 years to complete, at a still-unknown cost.
The water providers currently have a purchase contract for the lake site with the Battle North LLC, which owns the property, and has for some time envisioned housing near the site.
During the contract period — about 12 months — the district and authority will conduct feasibility studies for the lake.
District Director of Engineering and Water Resources Jason Cowles said that work will include soils testing and other evaluation. If the evaluation provides the right answers, the water providers will buy the site and get to work.
The current idea is to roughly triple the size of the old lake by digging down about 30 feet from the current empty lake bottom. That would keep the size of the new dam reasonable. The old dam was breached in the early 1990s for safety reasons. In addition, digging that much material would provide plenty of clean fill dirt to use for other purposes, including capping tailings from the Eagle Mine.
A near-perfect site
Eagle River Water & Sanitation District General Manager Linn Brooks said if the evaluation bears fruit, Bolts Lake is a nearly-perfect site for a reservoir.
The site is on private land, is the right size and is off the main channel of the Eagle River, Brooks said, adding that the environmental impacts would be minimal…
The upper valley’s water providers have long been looking for more water storage within the Eagle River basin. The providers get most of their water from streamflows…
Since the Bolts Lake reservoir wouldn’t take water directly from the river, Brooks said the reservoir would still keep streamflows whole. And, like the providers’ other reservoirs, the water would be used to augment streamflows in the river, which helps river health.
In an email, Tim McGuire of Battle North wrote that the company is excited to work with the water providers on the project.
From the Water Education Foundation (Gary Pitzer):
Jeff Kightlinger, longtime general manager, Metropolitan Water District of Southern California via Twitter.
Western Water Q&A: veteran water boss, retiring after 25 years with southern California water giant, discusses ‘permanent’ drought, conservation gains & the struggling Colorado River
When you oversee the largest supplier of treated water in the United States, you tend to think big. Jeff Kightlinger, general manager of the Metropolitan Water District of Southern California for the last 15 years, has focused on diversifying his agency’s water supply and building security through big investments.
Kightlinger spoke with Western Water about how his agency is poised to handle drought, the roadmap for sustainability on the Colorado River and why he believes practicality and necessity will pave the way for the completion of a Delta alternative conveyance facility for the State Water Project. Read the full article here.
Jeff Kightlinger, general manager of the Metropolitan Water District of Southern California for the last 15 years, has focused on diversifying his agency’s water supply and building security through investment. That means looking beyond MWD’s borders to ensure the reliable delivery of water to two-thirds of California’s population.
Kightlinger, 61, planned to retire at the end of 2020 but stayed on into 2021 to guide Metropolitan through the COVID-19 pandemic. An astute observer of California’s Byzantine water world, he exudes optimism amid a drying California climate and a tempestuous political landscape in which progress occurs at minimal increments. The past 15 years have been marked in part by an ambitious yet controversial proposal backed by Metropolitan to build twin tunnels (since scaled back to one) under the Sacramento-San Joaquin Delta to keep the water flowing to Southern California while protecting endangered fish species.
Meanwhile, Kightlinger has to deal with his agency’s other chief water source, the Colorado River, and the increasingly dire conditions there. Stakeholders, including Kightlinger’s successor, will soon convene in earnest to build a new set of river management guidelines for 2026 even as a declared shortage seems all but assured.
Kightlinger joined Metropolitan in 1995, serving as deputy general counsel and assistant general counsel before becoming general counsel in 2002. He took the reins as general manager in 2006. Working for Metropolitan has embodied Kightlinger’s career for such a long time, his decision to step away was bracing in some respects.
“All of a sudden it’s real,” he said. “They’ve interviewed people, they have a short list, and I’ll be replaced rather shortly. It’s one thing when it’s off in the future. Now, it’s like, gosh, this is real. It is a little unsettling.”
In an interview with Western Water, Kightlinger shed light on how his agency is poised to handle drought and why he believes practicality and necessity will pave the way for the completion of a Delta alternative conveyance facility for the State Water Project.
Lake Mead on the Colorado River, a major source of water for MWD. Photo/Allen Best
WW: What’s been the biggest change in California water since you became general manager?
KIGHTLINGER: I think probably the biggest change has been sort of a transition into kind of a permanent drought cycle. Frankly, my 15 years as GM have basically been drought with a couple of wet years sprinkled in here. The reality of the West is that we are in a permanent drought cycle. We have to build into our thinking that this is not a dry period, this is our reality.
WW: General managers are typically engineers. Has your legal background influenced your approach to managing the district?
KIGHTLINGER: I think so. You’re seeing more GMs these days with either a legal background or a chief financial officer background. That’s a reflection of the challenges we face now. We know how to engineer and design things. It’s just gotten incredibly hard to actually get the political process to support building things. And it’s also become very difficult with financing now that the federal and state governments have gotten out of the business of paying for infrastructure and they never seem to have any money. You … are seeing lawyers and CFOs because the big challenges are getting stuff permitted and authorized to be built. Getting stuff financed to be built has actually become more challenging than designing how to build it.
MWD’s Diamond Valley Lake, in Inland Southern California. The reservoir provides a cushion for MWD in years of drought. (Source: Metropolitan Water District of Southern California)
WW: Metropolitan has long pursued projects to solidify its water supply portfolio. Will that trend continue?WW: What’s going to happen on the Colorado River as conditions worsen?
KIGHTLINGER: It’s going to be hard and there’s going to be pain. The reality of the Colorado River is that we are struggling. You start with the premise that it is over-allocated and oversubscribed. You have to make cutbacks just to get into balance. And our latest thinking seems to be that we’ve lost at least 10 percent of our supply due to climate change … and that’s not the bottom. … [The] Drought Contingency Plan (DCP, signed in 2019) was a Band-Aid. We put the bandage on, good for us, that was painful. We dealt with the emergency, now we’ve got five years to figure out, OK, what’s the roadmap to sustainability? It’s going to have to be a mixture of cuts that will have to be shared and then on top of that, we’re going to have to also get creative to find opportunities to help each other. That is where the Southern Nevada Water Authority comes into mind where they can invest major money in Southern California for recycled water and we can exchange Colorado River water back to them. That is the kind of partnerships we’re going to have to do on the river for the future.
WW: Native American tribes in the Colorado River Basin are asserting their long-standing water rights to the river. How will that affect existing users like MWD?
KIGHTLINGER: Clearly, the tribes have been left out in the mix and for the next iteration of guidelines on the river that will be adopted in 2026, the tribes have to be at the table and have to be a partner. They have to understand they cannot just grow into their entitlements willy-nilly. This is all something that has to be carefully planned and worked out with the existing users, and we have to make room for them at the table and room for them to use water. The DCP was a good first step on that. California doesn’t have the same tribal issues that some of the other states have. In the DCP process, the tribes were at the table in Arizona and were a partner. That is what will be needed for the 2026 guidelines.
WW: Los Angeles is well known for its reduced rate of water use even with population growth. What’s the next tier that’s reachable in the near future?
Metropolitan Water District of Southern California scouting team looking for where to site our Colorado River Aqueduct intake on the Colorado River. Boats powered w Model T motor! — Jeffrey Kightlinger via Twitter. I will miss the photos that Mr. Kightlinger published from the Metropolitan archives.
KIGHTLINGER: We’ve done a remarkable job in Southern California. In 1990, Metropolitan sold 2.5 million acre-feet of water and we had 14 million people. This year we’re going to sell 1.65 or so million acre-feet and we have 19 million people.
We have grown 30-some percent and we’ve shrunk our water use regardless by 35 percent. That’s all through efficiency and it’s been very effective. Can we do more? We have picked most of the low-hanging fruit. We have pretty much retrofitted every toilet in Southern California and every shower head. Most of your dishwashers and clothes washers are high efficiency. We are also trying to get people to change their lifestyle, which is really focused on the outdoors. We’ve made a lot of progress, but we can do more.
The proposed Delta Tunnel is years away from being complete, assuming all goes according to plan. Will California ever solve the conundrum of protecting the Delta while ensuring reliable water supplies through the State Water Project?
KIGHTLINGER: The progress is very slow, there is no denying that, and it’s frustrating. But on the other hand, I do think there is reason for optimism. … If you look at our last three governors, Schwarzenegger employed a blue-ribbon committee to look at all the California water issues and the conclusion was that we need to enhance our conveyance. Gov. Brown picked it up and pushed forward with the twin tunnels project. Gov. Newsom said that was a little overly ambitious but agreed something needs to be done and supports a single tunnel project. … Having the elected leadership of our state, for the last 15 years, basically say we need to address this problem, tells me that eventually we’re going to get it done.
This year, Archuleta County experienced its driest April in 127 years, according to the National Integrated Drought Information System (NIDIS).
The NIDIS also indicates that the driest year-to-date for January through April in the past 127 years occurred this year.
According to the NIDIS website, as of 1 p.m. on Wednesday, May 19, 2021 100 percent of the county is abnormally dry and is in a moderate drought stage.
The website also indicates that 99.36 percent of the county is in a severe drought stage and 50.06 percent of the county is in an extreme drought stage.
Additionally, 6.4 percent of the county is in an exceptional drought stage.
The NIDIS website indicates that the western portion of the county is in an extreme and exceptional drought stage, while the eastern portion is in a severe drought stage.
According to the NIDIS, under the severe drought stage, the fire season is extended and the snow- pack is low, along with a reduced river flow…
Under the exceptional drought stage, dust storms and topsoil removal is widespread, and agricultural and recreational losses are large…
River report
According to the U.S. Geological Survey, the San Juan River was flowing at a rate of 775 cfs in Pagosa Springs as of 1 p.m. on Wednesday, May 19.
Based on 85 years of water records at this site, the average flow rate for this date is 1,390 cfs.
The highest recorded rate for this date was in 1948 at 3,860 cfs. The lowest recorded rate was 170 cfs, recorded in 1977.
As of 1 p.m. on Wednesday, May 19, the Piedra River near Arboles was flowing at a rate of 536 cfs.
Based on 58 years of water records at this site, the average flow rate for this date is 601 cfs.
The highest recorded rate was 4,000 cfs in 1973. The lowest recorded rate was 110 cfs in 2002.
Snow report
According to the U.S. Department of Agriculture National Water and Climate Center’s snowpack report, the Wolf Creek summit, at 11,000 feet of elevation, had 16.3 inches of snow water equivalent as of 1 p.m. on May 12.
That amount is 54 percent of the May 19 median for this site.
The average snow water equivalent for this date at the Wolf Creek summit is 30.4 inches.
This year, New Mexican officials have a message for farmers who depend on irrigation water from the Rio Grande and other rivers: Unless you absolutely have to plant this year, don’t.
Years of warming temperatures, a failed rainy season last summer and low snowpack this winter have combined to reduce the state’s rivers to a relative trickle. The agency that controls irrigation flows on the Rio Grande forced the issue. To conserve water, it opened its gates a month later than usual.
Severe drought — largely connected to climate change — is ravaging not only New Mexico but the entire Western half of the United States, from the Pacific Coast, across the Great Basin and desert Southwest, and up through the Rockies to the Northern Plains.
In California, wells are drying up, forcing some homeowners to drill new ones that are deeper and costlier. Lake Mead, on the border of Arizona and Nevada, is so drained of Colorado River water that the two states are facing the eventual possibility of cuts in their supply. And 1,200 miles away in North Dakota, ranchers are hauling water for livestock and giving them supplemental forage, because the heat and dryness is stunting spring growth on the rangelands.
The most significant, and potentially deadly, effect of a drought that is as severe and widespread as any seen in the West is the wildfires that are raging amid hot and dry conditions. And this is well before the full blast of summer’s heat arrives.
California, Arizona and New Mexico have each had two large blazes, unusual for this early in the year. None has been fully contained, including the Palisades Fire, which has burned 1,200 acres on the outskirts of Los Angeles…
…at the root of the drought are warmer temperatures and changing precipitation patterns, which are linked to emissions of carbon dioxide and other greenhouse gases into the atmosphere, where they trap the sun’s heat. The result has been extremely dry conditions that have persisted across much of the Southwest and California for years, and that are spreading throughout the West…
US Drought Monitor map May 18, 2021.
According to the United States Drought Monitor, 84 percent of the West is now in drought, with 47 percent rated as “severe” or “extreme.”
Experts do not see much prospect for improvement, as another hot and dry summer is forecast. Rather, they expect conditions to worsen…
Brad Udall: Here’s the latest version of my 4-Panel plot thru Water Year (Oct-Sep) of 2019 of the #coriver big reservoirs, natural flows, precipitation, and temperature. Data goes back or 1906 (or 1935 for reservoirs.) This updates previous work with @GreatLakesPeck
In the Southwest, especially, the drought has lingered for so long — since 2000, with only a few wet years sprinkled in — that climate scientists now talk of an emerging “megadrought,” one that may rival those that occurred periodically over the past thousand years. Those Southwestern megadroughts, which were discovered by analyzing ancient tree rings, lasted decades — in one case, 80 years.
April 2021 was “exceptionally dry” according to the latest statistics from the USDA’s National Resource Conservation Service. NRCS Hydrologist Joel Atwood noted “Many SNOTEL sites reported record low precipitation for April west of the Continental Divide. Snowpack has also declined in all basins except the South Platte, due to higher temperature and below-average precipitation.”
West Drought Monitor map May 18, 2021.
According to the U.S. Drought monitor, the region is experiencing D4 drought level classified as “exceptional drought,” the highest level under extreme (D3), severe (D2), moderate (D1) and abnormally dry (D0).
Despite the well-below-average precipitation levels in the Yampa–White River Basin last month, reservoir storage is sitting at 106% of average. NRCS’ latest report notes however that consistent dry conditions since last summer combined with last month’s lack of precipitation compounded drought conditions. Atwood said, “With much of the snowpack in many basins already melted out, persistent dry soil conditions, and little hope for substantial precipitation moving into summer, runoff volumes will continue to be meager.” Streamflow volumes for all basins west of the Continental Divide are projected between 34 and 73 percent this summer…
Severe to exceptional drought conditions persist across much of the state, with many Western Slope counties seeing the most significant decreases in precipitation and available water in storage. As an example, SNOTEL sites in the San Juan region are reporting just 40% median snowpack.
Statewide, apart from the South Platte River Basin (which has 102% median snowpack), all other basins are reporting less than 80% average snowpack. Snowpack in the Yampa/White River basin is at 73% of median for this time of year.
Every week, the US drought monitor analyzes a week of data through Tuesday, releasing the latest drought levels on Thursday.
And with no surprise, a great improvement was found in the front range and eastern plains this week in Colorado.
Colorado Drought Monitor map May 18, 2021.
From last week, the percent area of the state under at least abnormally dry conditions dropped from 86.95% to 76.7%. And the percent area of at least D1 drought dropped from 75.19% to 51.8%. And the drought has been completely erased in the northeast corner of the state, including Denver, Boulder, Fort Collins, and Greeley.
Unfortunately, the western slope saw no improvement in the worst drought levels D3 and D4.
Current Upper Colorado River Basin Reservoir Status May 12, 2021 via the USBR.
Here’s the release from the Upper Colorado River Commission:
On May 14, 2021, the Bureau of Reclamation (Reclamation) released its May 24-Month Study (and accompanying narrative) showing the elevation of Lake Powell declining to 3,525.57 feet as early as March 2022 under the Most Probable hydrology forecast. The 24-Month Study is released monthly and projects Lake Powell elevations 24 months into the future. Lake Powell is currently at an elevation of 3,560.60 feet and is approaching its lowest recorded level since the reservoir began filling in the early 1960s.
Maintaining Lake Powell elevations at or above 3,525 feet promotes the compliance of the states of Colorado, New Mexico, Utah, and Wyoming with a century-old compact and preserves regional benefits derived from hydropower production at Glen Canyon Dam.
Under the 2019 Drought Response Operations Agreement between Reclamation and Colorado, New Mexico, Utah, and Wyoming, the May 24-Month Study signals the need for the parties to begin the development of a drought response operations plan to reduce the likelihood of Lake Powell dropping below 3,525 feet. Such a plan would first consider the operational flexibilities at Lake Powell, consistent with existing legal and operational constraints.
f those flexibilities are unable to prevent Lake Powell elevations from falling below 3,525 feet, the parties will consider releases of water to Lake Powell from the upstream reservoirs of Flaming Gorge, Blue Mesa, and Navajo (“Initial Units” under the Colorado River Storage Project Act). Releases could be made from some or all of the Initial Units and would likely occur in varying quantities and times but consistent with current legal and operational requirements at the facilities. A plan would also include the recovery of water at the participating Initial Units to restore operating elevations at those facilities to their pre-plan levels.
Currently, the parties are beginning the process of developing a drought response operations plan in accordance with the Agreement. However, such a plan will not be finalized until Reclamation’s April 24-Month Study Most Probable forecast shows Lake Powell falling to a target elevation of 3,525 feet or below within a 12-month period and after consultation with the states of Arizona, California, and Nevada. If the Secretary of the Interior determines that there is an imminent need to protect Lake Powell elevations from dropping below 3,525 feet, she has the discretion to take emergency action after consulting with the Colorado River Basin States.
Lake Powell ended the 2020 “water year” at an elevation of 3,596 feet above sea level. That is 104 feet below what is considered Powell’s full capacity. The “water year” is a term used by the U.S. Geological Survey to measure the 12-month hydrologic cycle between Oct. 1 and Sept. 30. The October start date is used to mark when snow begins to accumulate in the mountains. Photo credit: Denver Water
From email from the Colorado Water Conservation Board (Sara Leonard):
Commissioner Mitchell Statement on Lake Powell Elevation Forecast
May 20, 2021 (Denver, CO) – On May 14, the Bureau of Reclamation released its monthly study showing the elevation level in Lake Powell as critically declining.
The study predicts a significant probability that Lake Powell will decline to approximately 3,525.41 feet as early as March 2022. Lake Powell, which currently sits at elevation 3,560.60 feet, is approaching its lowest level since it was filled in the early 1960s.
Statement from Colorado River Commissioner Rebecca Mitchell:
“Our team of Colorado River hydrology experts have been closely monitoring conditions and analyzing the impacts on river operations, and are very aware of the daunting projections. Colorado and all of the Upper Basin states are – and have been – experiencing severe water shortages that affect our industries and our citizens. Colorado stands ready to work with our neighboring Upper Basin states to implement all aspects of the Drought Contingency Plan if conditions warrant. As Colorado River Commissioner tasked with negotiating new river operations on behalf of Colorado, I am mindful of the importance of the Colorado River to more than 40 million people and the $1.4 trillion annual economy it supports. I am committed to engaging with our partners and stakeholders across the state and the Basin to work as efficiently and effectively as possible in order to make informed decisions.”
Scott Hummer, water commissioner for District 58 in the Yampa River basin, checks out a recently installed Parshall flume on an irrigation ditch. Hummer said most water users in the Yampa are complying with a state order issued nearly a year ago that requires measuring devices. Photo credit: Heather Sackett/Aspen Journalism
Click here for all the inside skinny and to register:
CCA’s Ag Water NetWORK is conducting a survey of ag water right holders to better understand producer irrigation infrastructure needs.
The purpose of this survey is to determine what irrigators perceive as their greatest challenges in making desired improvements to their irrigation systems. This includes individual surface and groundwater diverters, and shareholders in incorporated and non-incorporated irrigation water delivery entities.
The aggregate results of this survey will be published in report format. No information will be released that enables identification of a specific survey respondent.
Ag water right holders that complete the 5 minute survey will be eligible to win a $25 or $50 Bass Pro gift card! There will be a total of 6 random drawings during the survey period.
Click on a thumbnail graphic to view a gallery of drought data from the US Drought Monitor.
US Drought Monitor map May 18, 2021.
West Drought Monitor map May 18, 2021.
High Plains Drought Monitor map May 18, 2021.
Colorado Drought Monitor map May 18, 2021.
Click here to go to the US Drought Monitor website. Here’s an excerpt:
This Week’s Drought Summary
Troughing over the western CONUS and ridging over the East resulted in strong southerly flow over the Southern and Central Plains, leading to widespread heavy rainfall (0.5 to 3 inches, and more) over portions of the Great Plains, Lower Mississippi Valley, and into western areas of the Corn Belt this week. The heaviest precipitation fell over southeastern Texas and southern Louisiana, where some locations received over 10 inches of rainfall. The heavy rainfall resulted in widespread removal and improvement in drought conditions from the Front Range eastward to Nebraska and Kansas, and southward to the Mexico border. Unfortunately, the moisture was unable to make it farther north than Nebraska, resulting in continued degradations across the Northern Plains, Upper Midwest, and Great Lakes. The Northeast experienced below normal precipitation, but due to below normal temperatures and near-normal precipitation over the past 30-60 days across much of the region, only minor changes to abnormally dry (D0) areas were warranted in southeastern Pennsylvania. In the Southeast, portions of Virginia and North Carolina have continued to dry out over the past 90 days, warranting D0 expansion. Locally heavy rainfall (2 inches) also fell over areas experiencing abnormally dry and moderate drought (D1) in South Carolina and Florida, leading to some modifications in those locations based on rainfall 7-day rainfall totals. The La Nina signal in the West was evident in the precipitation totals at the end of the climatological wet season in March. The presence of this antecedent dryness has resulted in much below-normal snowpack throughout much of the West, leading to continued drought deterioration since the region began its transition into a climatologically drier time of year during April…
Colorado Drought Monitor one week change map ending May 18, 2021.
The High Plains Region was a tail of two extremes. From Nebraska southward, and westward to the Front Range saw widespread heavy precipitation (0.5 to 3 inches, with locally higher amounts of greater than 5 inches stretching from west to east across Kansas), leading to large reductions in D0 (abnormally dry) to D2 (severe drought) coverage in Colorado, Nebraska, and Kansas, with some D3 (extreme) reduction in southeastern Colorado. Some moderate precipitation also fell across portions of the Front Range of Wyoming also, further improving SWE across the Big Horn Basin. This warranted some improvements from D2 (severe drought) to D1 (moderate drought) along the east-facing slopes of the Absaroka and Wind River Ranges, and D1 was also improved to D0 for interior parts of the basin. In addition, AHPS percent of normal precipitation exceeds 150% for all periods going back at least 90 days, SPIs indicate near to abnormally dry conditions going back 180 days, and USGS 7-day and 28-day average stream flows are near normal. NASA SPoRT and NASA GRACE also show improvements in soil moisture and groundwater, respectively. Across the Dakotas, near to above normal temperatures and below normal precipitation this week warranted some further degradations. Targeted expansions of D1 and D2 drought occurred in South Dakota, as the state continues to fall behind during a climatologically wetter time of year, which are depicted in the 30-90 day SPIs. There are also continued reports of poor water quality in livestock water sources in northwestern parts of the state. In North Dakota, warm (2°F to 4°F positive average temperature anomalies), dry, and windy conditions continued. CPC soil moisture ranks in the bottom 1% across much of the state, USGS 7-day average stream flows are much below normal, and VegDRI and VHI indicate extreme stress on vegetation. As such, D4 (exceptional drought) was introduced for parts of north-central North Dakota. Furthermore, many farmers have been forced to plant in dry soils this year, but erosion and lack of rainfall have resulted in poor and/or a lack of germination. Fire also continues to remain a high risk across the state and most counties have imposed burn restrictions. Since the beginning of the year, there have been more than 1,000 fires reported across North Dakota, with over 100,000 acres burned…
Most basin snow water equivalent (SWE) percentiles across the Western Region are well below normal for the period of record (near and below the 65th percentile), especially in the Four Corners region (below the 5th percentile in Arizona and New Mexico). Only parts of the Pacific Northwest and areas of central Montana experienced near and above-normal seasonal snowfall. However, above-normal temperatures over much of the West over the past 60 days has resulted in rapid snowmelt and, due to dry topsoil, much of the melt water has not made it into the rivers, lakes, and reservoirs. In California, the water level in Lake Tahoe is 2.5 feet lower than this time last year. USGS 7-day average stream flows across the coastal ranges near the Bay Area have dropped below the 2nd percentile. In addition, CPC soil moisture ranks below the 1st percentile, NASA GRACE indicates severely depleted groundwater, and vegetation indices (VegDRI and VHI) indicate severe vegetation stress. There are increasing reports of reduced pasture forage, livestock requiring supplemental feed and/or being sold off, and some reports of livestock mortality. Additionally, stock ponds are running dry and farmers have been forced to haul water in some locations. Given the worsening conditions, drought was deteriorated from D3 (extreme) to D4 (exceptional) in areas along the coastal ranges near the Bay Area. Targeted degradations were also made in portions of Idaho as a result of deteriorating soil moisture conditions (NASA SPoRT 0-10 cm and 0-40 cm depths and CPC soil moisture below the 5th percentile state-wide), supported by widespread D1-D3 30-90 day SPIs. New Mexico was the only state in the Western Region where improvements were warranted, as severe weather along the Front Range of the Rockies resulted in some small improvements in areas experiencing D3 and D4 drought conditions in northern and eastern parts of the state…
Heavy rainfall and flooding was the main concern in many areas of the Southern Region. Across eastern Texas, the Ark-La-Tex, and southern Louisiana, many areas received in excess of 3 inches of rainfall. Southeastern Texas and southern Louisiana were the hardest hit areas, with several locations receiving up to, and exceeding, 10 inches of rainfall. On Monday, the National Weather Service issued flood warnings in the Lake Charles, Louisiana area, where 11 inches of rain fell in a 6-hour period. Near Baton Rouge, Louisiana, locations east, southeast, and south of the city picked up nearly 12 inches of rainfall Monday night into Tuesday. Farther west in Texas, large reduction in drought coverage was warranted in areas receiving over 2 inches of rainfall. Some locations in southern Texas picked up 5 to 10 inches of rain, warranting 2 to 3-category improvements and removal in the drought depiction. From northern Mississippi to central Tennessee, 30-day rainfall deficits are beginning to increase. This area remains drought free this week, but bears watching if deficits continue to increase…
Looking Ahead
During the next 5 days (May 20 to 24), the Southern and Central Plains, much of the Corn Belt, and Northern Tier states are favored to remain wet. Temperatures are also forecast to remain below-normal for much of the period across the Northern Tier. High pressure is expected to dominate over the eastern U.S., coinciding with little to no rainfall and above-normal temperatures. The Southwest and Coastal California will likely remain dry also. However, temperatures are favored to remain below-normal, moderating to near-normal as the week progresses toward Tuesday.
The CPC 6-10 day extended range outlook (valid from May 25 to 29) favors above normal temperatures across the eastern U.S. and Central and Southern Plains, with enhanced probabilities in the Southeast. Above normal temperatures are also favored over northern and western Mainland Alaska, with above-normal probabilities extending to the eastern Aleutians. Below-normal temperatures are favored from the Pacific Northwest eastward to the Dakotas. Above-normal precipitation is predicted across the Southern and Central Plains, Corn Belt, and Lower Great Lakes. In Alaska, odds tilt toward above-normal precipitation for the Southwest Mainland, Eastern Aleutians, and along the South Coast to the Northwest Panhandle. Below-normal precipitation is favored in the Southeast U.S. and along the East Coast, with enhanced probabilities in the Deep South and Florida. Below-normal precipitation is also favored for the Central Pacific Coast, Great Basin, and Eastern Rockies to the High Plains.
US Drought Monitor one week change map ending May 18, 2021.
A new study conducted by researchers from The University of New Mexico has found that wildfires — which have been increasing in frequency, severity and extent around the globe — are one of the largest drivers of aquatic impairment in the western United States, threatening our water supply.
The research, “Wildfires increasingly impact western U.S. fluvial networks,” was published recently in Nature Communications. Authors include former UNM graduate students Grady Ball (now at the U.S. Geological Service) and Justin Reale (now at U.S. Army Corps of Engineers); former postdoctoral researcher Peter Regier (now at Pacific Northwest National Laboratory); associate professor Ricardo González-Pinzón (Department of Civil, Construction and Environmental Engineering) and research assistant professor David Van Horn (Department of Biology).
The study found that about 6 percent of the length of all the streams and rivers in the western U.S. were directly affected by wildfire disturbances (defined by being located in burned areas) between 1984 and 2014, and that every year there are about 342 new kilometers of them directly affected. When the researchers accounted for the longitudinal propagation of water quality disturbances within and across watersheds, it was estimated that wildfires affect about 11 percent of the total stream and river length.
“More than 10 percent of the rivers in the western U.S. have been impacted by wildfires,” González-Pinzón said. “That’s a lot and puts wildfires as one of the top causes of water impairment in the country. It’s a big deal.”
The authors said that there have been few studies on the impact of wildfires on fluvial (river) networks, so this study is significant because it was the first large-scale analysis to utilize remote sensing of burn perimeter and severity, in-situ water quality monitoring, and longitudinal modeling to determine estimates of stream and river length impacted by wildfires at a continental scale.
“It is distressing to realize how little we know about the impacts of wildfires to rivers,” González-Pinzón said. “Especially because this is relevant to the daily life of those living in the western part of the country and particularly in New Mexico, a state that is currently and commonly experiencing up to 100 percent severe droughts.”
Although the direct impact of wildfires in places such as California has been widely reported, particularly in terms of lives and structures lost (the 2018 California wildfire season claimed 100 lives, damaged 24,000 structures and resulted in $2 billion in insurance claims, the study reports), the direct and extended impacts of wildfires have not been thoroughly quantified.
The study alerts that there is growing evidence that wildfires trigger cascading impacts in river networks. Although wildfires are not specifically mentioned on the U.S. Environmental Protection Agency’s Clean Water Assessment, wildfire disturbances contribute to at least 10 of the top 20 most critical disturbances listed in the assessment, such as elevated sediments, nutrient enrichment, organic enrichment and oxygen depletion, elevated temperature, elevated metal concentrations, habitat alterations, elevated turbidity, flow alterations, elevated salinity and/or total dissolved solids, and changes to pH and conductivity. Since forested watersheds supply drinking water for around two-thirds of those living in the western U.S., the impact is massive, in terms of both economics and water security.
Credit: The University of New Mexico
The authors point out that wildfires impact water flow and quality since they originate on hillslopes and cause decreased infiltration capacity and groundwater recharge, a severely reduced capacity for vegetation to grow on impacted land, and a higher frequency of landslides and avalanches. Also, dangerous substances including metals in levels that exceed the World Health Organization’s safe drinking water standards are found in surface water long after wildfires are extinguished.
Van Horn said one of the motivations for this study was witnessing the impacts of the 2011 Las Conchas wildfire, the second-largest wildfire in New Mexico’s history, resulting in rapid and massive flooding in the burned area and a measurable decrease in the water quality of the Rio Grande near the burned site of hundreds of kilometers downstream.
“We were fortunate in a sense to have the fire in our highly instrumented back yard, where we could study its impacts as it was happening,” he said.
There was a dramatic decrease in oxygen in the water, as well as the transportation of large quantities of ash and sediment that forced a two-month shutdown of the City of Albuquerque’s only surface water intake, which provides about 70 percent of the drinking water to the area.
“Wildfires are impacting fluvial networks in time and spatial scales that we don’t fully understand,” Van Horn said. “Thus, we need to investigate how long and how far they remain an issue in watersheds.”
“What we found was concerning, and there is a huge need for more research to be done,” González-Pinzón said.
In the near future, their team will focus on creating rapid response teams that can conduct research safely, on-demand, soon after wildfires are contained. That research will focus on answering how far downstream can wildfire disturbances propagate in fluvial networks and what are the main controlling factors. Due to climate change and current forest management practices that have allowed fuels to build up instead of naturally burning in smaller fires, wildfires are only predicted to become worse in the future.
“We can’t really engineer an easy solution to this because it occurs at the scale of continents, but we definitely need to improve how we can increase the resilience of aquatic ecosystems and alert people about the impacts of water quality degradation driven by wildfires to their day-to-day lives; that means that we need to acknowledge that wildfires will continue to happen and that we need to learn how to deal with them,” González-Pinzón said.
Funding for this study was provided by the National Science Foundation and the U.S. Army Corps of Engineers’ Upper Rio Grande Water Operations Model.
An aerial view of Windy Gap Reservoir, near Granby. The reservoir is on the main stem of the Colorado River, below where the Fraser River flows into the Colorado. Water from Windy Gap is pumped up to Lake Granby and Grand Lake, and then sent to the northern Front Range through the Adams Tunnel. Photo credit: Aspen Journalism
Here’s a guest column from Merrit S. Linke, Jack Buchheister, Kathy Chandler-Henry, and Marti Whitmore that’s running in The Colorado Sun:
As Western Colorado leaders, we congratulate the parties involved in continuing a history of cooperative solutions to benefit water users and choosing collaboration over litigation.
The history of Western Colorado’s water is told in stories of hard-fought wins and losses, of lawsuits and government petitions, of tough negotiations and collaboration.
In Grand County, the history of West Slope water — and Front Range demand for that water — is more visible than in other areas west of the Continental Divide. It is visible at the base of a concrete spillway below Windy Gap Reservoir that disconnects our state’s namesake river; and at the Fraser River’s edge, where visitors see only a fraction of the river that once carved its way downstream.
Top row: Merrit S. Linke, Jack Buchheister. Bottom row: Kathy Chandler-Henry, Marti Whitmore. Credit: The Colorado Sun
But Grand County has also been the backdrop for stories that center on the importance of collaboration and negotiation. Stories of water users coming together to protect and preserve Western Colorado’s water security, communities and local economies.
A recently-announced $15 million settlement between environmental groups and Northern Water’s Municipal Subdistrict is a win for the Western Slope, adding to the nearly $100 million in benefits already secured for water users in Grand County and further downstream.
We commend the parties for reaching this settlement and look forward to partnering with them on projects to further restore and enhance the aquatic environment in Grand County.
The settlement allows the Windy Gap Firming Project to move forward with construction of Chimney Hollow Reservoir near Loveland. It also unlocks the benefits of water, reservoir storage and funding outlined in a nearly 10-year-old agreement and clears the way for the long-promised Colorado River Connectivity Channel to break ground in Grand County.
The enhancements secured by the prior agreement will create a healthier river system and benefit irrigators, communities and people who recreate on Grand County’s rivers.
In 2012, after years of negotiation, the Colorado River District, Grand County, Middle Park Water Conservancy District and the Northwest Colorado Council of Governments signed an intergovernmental agreement with Northern Water that secured hard-fought yet collaborative resolutions to restore and protect the health of our rivers and communities in Grand County.
This agreement provides a secure water supply for Middle Park water users in Grand and Summit counties. It also secures perpetual reservoir releases for the environment, which will improve aquatic habitat and water quality and boost flows for recreation and endangered fish downstream in the Colorado River.
These releases will provide more cool water in the river when it is most needed, alleviating low flow in the hottest, driest portion of summer and early fall. In addition, Grand County residents and visitors will enjoy preserved open space and public access to Willow Creek.
Finally, the agreement supports the Colorado River Connectivity Channel, which will boost river health by reconnecting the Upper Colorado River to its channel around Windy Gap Reservoir. The Connectivity Channel demonstrates how diverse interests can collaborate on solutions that benefit both water supply and watershed health.
Security of our West Slope resources remains at the forefront for Grand County leaders, and the agreement includes important protections barring Northern Water from future water development or water rights acquisitions in Grand County without prior approval from Grand County and the Colorado River District.
Each of these enhancements contribute to better water quality and a healthier river, and they will increase the resilience of our water supply in drought years. This is an achievement for everybody who uses the river.
When the Chimney Hollow Reservoir was first proposed more than a decade ago, West Slope leaders had the foresight to secure these protections for water users.
We congratulate the parties involved in the recent settlement in continuing a history of cooperative solutions to benefit West Slope water users and choosing collaboration over litigation.
Merrit S. Linke is the chair of the Grand County Board of County Commissioners. Jack Buchheister is the president of the Middle Park Water Conservancy District. Kathy Chandler-Henry is the chair of the Northwest Colorado Council of Governments’ Water Quality and Quantity Committee. Marti Whitmore is the president of the Colorado River District Board of Directors.
Northern Colorado is getting its biggest new reservoir in about 70 years, at the cost of diminished Colorado River flows.
Construction of Chimney Hollow Reservoir will begin in August southwest of Loveland, just west of Carter Lake. An April legal settlement between project proponent Northern Water and environmental advocacy groups cleared the way for the project, which began the permitting process in 2003.
The 90,000-acre-foot reservoir is the main component of the Windy Gap Firming Project, a plan to increase the reliability of Colorado River water rights in the Windy Gap Project. The project’s 12 participants include Platte River Power Authority, Loveland, Broomfield, Longmont and Greeley. Construction is expected to take until August 2025, after which it will take about three years to fill the reservoir.
The reservoir’s water will come from the Colorado River, decreasing flows below Lake Granby by an annual average of 15%. Most diversions will take place in May and June.
The 18-year journey toward construction demonstrates the extensive maneuvering required to build new reservoirs in Colorado as rivers become increasingly stressed from climate change and heavy diversions as growing Front Range communities seek to shore up their water supplies. Northern Water won approval from key government agencies and some advocacy groups with a suite of mitigation measures and spending commitments for areas impacted by the project.
Map from Northern Water via the Fort Collins Coloradan.
Northern Water spokesman Jeff Stahla described Chimney Hollow as “in the right place at the right time.” The reservoir site has a few qualities that have helped Northern Water avoid some common setbacks for new water project construction: It’s near existing Colorado Big Thompson Project infrastructure, so Northern Water won’t have to build much new infrastructure for water deliveries, and there are no homes or businesses at the site, which Northern has owned since the 1990s.
“The one assumption you have to make is that water storage is part of the future way that we’re going to provide water,” Stahla said, and he thinks it is. “If you get past the ‘Do we need storage’ question, this ends up being an incredible site that will meet lots of needs, including the ancillary needs of recreation, into the future.”
[…]
Northern Water Engineering Director Jeff Drager acknowledged the new reservoir’s impact on Colorado River flows, but he said the project’s targeted mitigation efforts still offer a major value and are a key reason why it crossed the regulatory finish line.
Restoring a river channel in the Upper Colorado Basin
One of the most significant mitigation measures, known as the Colorado River connectivity channel, will involve shrinking the existing Windy Gap Reservoir in Grand County to about half its current size and building a new channel around it. The Windy Gap dam currently blocks the Colorado River, preventing movement of fish, silt and sediment.
The connectivity channel will allow the river below the reservoir to act more like “a stream without a reservoir on it” when Northern Water’s water rights aren’t in priority, Drager said. The mitigation measures will also open up a mile of stream to public fishing in an area where private landowners possess most of the land adjacent to riverbanks…
During wetter years, Lake Granby can overflow and the water that would’ve been delivered to Windy Gap users flows downstream. During drier years, Northern Water is often unable to divert the full extent of its water right because it is a junior right, meaning more senior water users get access to water first. During the 23-year period between 1985 and 2008, for example, no Windy Gap water was delivered for seven of those years.
Despite quite a bit of snow that has landed in the state of Colorado throughout May, SNOTEL data shows that the snow water equivalent is well below the to-date median.
Statewide snowpack graph May 20, 2021 via the NRCS.
Statewide, snowpack is at 67 percent of the to-date median, though this number is greatly boosted by lingering snow in the South Platte basin, which includes the area around Estes Park, Boulder, and Denver. The South Platte Basin is at 113 percent of the to-date median.
Elsewhere in the state, snowpack is dwindling fast.
In the southwest corner, the San Miguel, Dolores, Animas, and San Juan River basin is at a very low 27 percent of the to-date median. The nearby Upper Rio Grande basin is at 32 percent.
Despite being adjacent to the above-median South Platte basin, the North Platte basin is at 74 percent of the to-date median and the Colorado basin is at 80 percent of the to-date median. Basins in the northwest corner of the state and the southeast corner of the state are also short on snowpack with the Yampa and White basin in the northwest at 62 percent of the to-date median and the Arkansas basin in the southeast at 58 percent.
Colorado’s most populated area has been getting quite a bit of snow and rain in recent days and weeks, but this hasn’t been the case elsewhere in the state. As dry conditions continue and snowpack starts to dwindle, Coloradans can expect big fire concerns come summer.
Colorado Drought Monitor map May 18, 2021.
Recent data from the US Drought Monitor shows that around 16 percent of Colorado remains under the most severe level of drought conditions monitored, compared to none of the state on the same date last year.
Colorado has some of the United States’ most ambitious climate goals, targeting 50% remissions reductions in 2030 and 90% emissions reductions by 2050. These goals are bolstered by sector-specific policies enacted in 2019 including legislation requiring the state’s dominant utility Xcel to cut emissions 80% by 2030, along with tax credits and partnerships to build charging stations and accelerate the zero-emission vehicle transition.
But new research shows the state’s existing policies, excluding those that are planned but not enacted as part of the state’s Greenhouse Gas Reduction Roadmap, will only reduce emissions 18% by 2050 – falling far short of Colorado’s climate ambition.
Colorado straddles one of the fastest-warming regions in the U.S. and climate impacts like record wildfires, dwindling snowpack, and severe drought are already harming its economy and communities. With less than a decade left to avoid locking in the worst climate damages, state policymakers must move quickly to cut emissions and transition to a clean energy economy.
As debate intensifies around Colorado’s next steps on climate policy, new modeling from Energy Innovation and RMI shows implementing stronger policies, many of which are included as part of the state’s GHG Roadmap, can be a climate and economic boon. Ambitious decarbonization of the state’s electricity, transportation, industry, building, and land-use sectors can help limit warming to 1.5 degrees Celsius while adding more than 20,000 new jobs and $3.5 billion in economic activity per year by 2030 – and up to 36,000 jobs and $7.5 billion annually by 2050.
The time between rainfalls has become longer and the rains occurred more erratically in the Southwest during the last 50 years.. Photo credit: The Mountain Town News/Allen Best
Cheap clean energy empowers decarbonization – but policy still needed
Colorado embodies the clean energy transition accelerating across the U.S. – a state where fossil fuels once underpinned energy supply and economic activity, but where fast-falling clean energy prices have made decarbonization the cheapest option.
Those favorable economics have made Colorado’s climate ambition possible, but the state is now embarking on the tougher task of determining how to achieve its emissions reductions goals..
Colorado could reap billions in economic growth from its climate ambition
So how can Colorado meet its climate action goals and build a clean energy economy? New modeling using the Colorado Energy Policy Simulator (EPS) developed by Energy Innovation and Colorado-based RMI outlines a policy package that can decarbonize the state’s economy and put it on a pathway to achieve the Intergovernmental Panel on Climate Change’s recommended target of limiting warming to 1.5°C – while generating sustainable economic growth. Some of these policies overlap with those outlined in the state’s GHG Roadmap.
The free, open-source, peer-reviewed Colorado EPS empowers users to estimate climate and energy policy impacts on emissions, the economy, and public health through 2050 using publicly available data. All model assumptions, key data sources, and scenario development used by the EPS are documented online for full transparency. EPS models have been developed for nearly a dozen countries and several subnational regions, including California, Minnesota, Nevada, and Virginia. The Colorado EPS is one of at least 20 planned state-level EPS models being developed by EI and RMI…
Fortunately, the Colorado EPS finds implementing stronger policies across the state’s electricity, transportation, buildings, industrial, land-use, and agricultural sectors can put it on a 1.5°C -compliant pathway that meets Colorado’s emissions reductions goals. The associated air pollution reductions would also prevent 350 deaths and more than 10,000 asthma attacks per year by 2030, and more than 1,400 deaths and nearly 44,000 asthma attacks per year by 2050 – even with a conservative estimate, these monetized health and social benefits reach $21 billion annually by 2050.
This low-carbon transition would supercharge the state’s economy, generating more than 20,000 new jobs and $3.5 billion in economic activity per year by 2030, and adding nearly 36,000 new jobs and more than $7.5 billion to the economy per year by 2050. These jobs would be created by building new solar and wind projects, retrofitting buildings, installing vehicle charging infrastructure, and more. Increased economic activity would come from new jobs paying wages 25% higher than the national media wage, as well as savings from reduced expenditures on volatile fossil fuel supplies.
Projected changes in jobs relative to BAU in the 1.5°C Scenario
A policy pathway for Colorado to achieve its climate goals
The 1.5°C policy package introduced by the Colorado EPS incorporates all existing state policy that has been enacted into law, legally enforceable power plant retirements, improvements in building and transportation energy efficiency, and electric vehicle adoption; it then goes further to address the state’s unique emissions profile.
While electricity and transportation lead emissions in most states, industry generates the largest percentage of emissions with 32 percent, primarily from oil and gas production. A mix of electrification, energy efficiency, hydrogen fuel switching, and methane leak reduction drive industrial emissions reductions under this 1.5°C Scenario. Several regulations have been proposed and legislation has been introduced in the state legislature to address these sectors, particularly methane leak reduction and beneficial electrification.
Rapid decarbonization of the state’s electricity sector is foundational to reducing emissions across all other sectors as an increasingly clean grid powers electrification of demand from buildings, industry, and transportation. The 1.5°C Scenario implements an 80% clean electricity standard by 2030 which rises to 100 percent by 2035. This would expand Xcel’s 80% emissions reduction target to cover all state utilities, accelerate the target date from 2035, and make the target legally enforceable – in line with Biden administration efforts to implement an 80% by 2030 clean energy standard. Under this scenario battery storage would increase seven-fold over existing state targets, transmission capacity would double, and additional demand response capacity would increase grid flexibility and reliability.
Colorado is already targeting a 40% reduction in transportation emissions by 2030, which would add 940,000 light-duty electric vehicles on the road. The 1.5°C Scenario would go even further, primarily by requiring all new passenger car and SUV sales be electric by 2035 and all new freight truck sales be electric by 2045. These goals align with ambitious zero-emission light-duty vehicle goals adopted by 10 states as well as the multi-state agreement targeting zero-emission medium- and heavy-vehicles signed by 15 states (including Colorado) and the District of Columbia, would add nearly 1.5 million electric vehicles by 2030, and ensure most on-road vehicles are electric by 2050.
Buildings would be transitioned away from fossil fuels through increased efficiency targets for new buildings and deep efficiency retrofits of existing buildings, along with a sales standard requiring all new building equipment sales be fully electric by 2030 to shift gas heating and cooking equipment to highly efficient electric alternatives.
This wedge chart aggregates some policy levers to improve figure readability; a full interactive wedge graph is available on the Colorado EPS
Colorado’s rivers and streams are rising after a year of pandemic quarantine and social distancing, and the anticipation of rafters and kayakers is rising as well. But water resource experts and outfitters are cautioning that the second year in a row of below-average and unseasonably warm spring temperatures will contribute to a short float season.
“We’ve had another dry year. Last year wasn’t that great either,” said Aldis Strautins, hydrologist for the National Weather Service in Grand Junction. “The summer was dry. Fall was dry. Soil moisture is very dry. This doesn’t bode well for rafting and kayaking. Things can change but we’re not seeing any indication of that right now.”
As of last week, Strautins said the moisture content of snowpack remaining in the Upper Colorado River Basin is 79 percent of normal, while the Rio Grande and Yampa basins stand at 78 percent, the Gunnison basin is at 73 percent, and the San Miguel, Dolores and San Juan rivers are at 66 percent.
The exceptions are the Arkansas and South Platte river basins. In the Arkansas, snowpack is at 84 percent of normal, and due to some late winter storms, the South Platte Basin is close to 100 percent of normal.
Kyle Johnson, co-owner of Rocky Mountain Adventures in Fort Collins, said the near-normal snowpack in the South Platte Basin will provide his company with enough snowmelt to keep customers on the Poudre River happy this summer.
“We currently have the best snowpack in the state,” Johnson said. “The Poudre has been at runnable levels for the past three weeks. Although we definitely don’t anticipate high water, we’re looking forward to a nice, even flow season.”
Andy Neinas, owner of Echo Canyon Outfitters in Cañon City, said the COVID-19 pandemic provided a tough learning experience for his operation and other outfitters.
“We’re using 2020 as a North Star. We learned things. We were washing paddles. Now we know that was an unnecessary precaution,” Neinas said.
But the company continues to be vigilant, especially in protecting its workers. “Here at Echo Canyon any team member that wants to be tested or vaccinated can do it on the clock. We’re giving our team members a $100 bonus for getting vaccinated.”
Bob Hamel, executive director of the Arkansas River Outfitters Association, said the his basin’s stored water supplies, though well below normal, are holding up and will help ensure rafters have enough liquid to float. “We’re not going to have any problems with water. It won’t be too high but it’ll be sufficient. We’ve seen a pretty good early start already.”
Coping with COVID-19 in 2020 was one of the greatest challenges in Colorado’s commercial rafting history, according to a new report by the Colorado River Outfitters Association. Commercial river use declined by more than 20 percent in 2020, with visitor spending dropping from nearly $185 million in 2019 to $148 million last year.
“We had a lot of anxiety in the rafting business,” Hamel said. “But once we got going, people were ready to get outside. We saw that everywhere on public lands. Rafting was no surprise. We survived last year and we’re appreciative that we’re still in business.”
Dean Krakel is a photographer and writer based in Almont, Colo. He can be reached at dkrakel@gmail.com.
The mountain ranges above Dillon Reservoir, seen through the lens of the data collected by sophisticated equipment onboard a plane that flew over the Blue River Basin to measure the amount of water frozen in the snow above Denver Water’s largest reservoir. Image credit: Airborne Snow Observatory Inc.
New generation of high-tech snow measurements feeds Denver area’s water supply models.
On April 18, a Beech A90-1 King Air stuffed with sophisticated equipment took off from Gunnison’s regional airport and soared over the mountains above Dillon Reservoir.
The flight occurred toward the end of the 2020-21 snow season, a nail-biter that has seen streaks of unusually warm, sunny days — and record-breaking heat in early April — broken by waves of storms and inches of snow that extended the ski season at some resorts.
In the air for three hours, the plane cruised above 20,000 feet, flying back and forth across the 335 square miles of high-country snow drifts that make up the Blue River Basin. Snow melting off high peaks and tumbling down the basin’s creeks ultimately ends up in Dillon Reservoir and the Blue River below Denver Water’s dam.
And as the Airborne Snow Observatories Inc. plane crisscrossed the sky, lidar equipment it carried shot beams of light at the snow below, capturing reflections from its frozen surface and measuring its depth. The company grew out of a seven-year research effort by NASA’s Jet Propulsion Laboratory.
Reams of data collected during the flight provide Denver Water with an assessment of the amount of water frozen in the snow.
Those calculations will in turn feed the utility’s forecast of the amount of water expected to flow into the largest reservoir in the utility’s system that 1.5 million people rely on for drinking water.
Red splashed across the mountains in the Blue River Basin show where the snow was the deepest in mid-April. The line of dots down the mountain is a ski run at Breckenridge Ski Resort where snow-making machines have added snow to the ground. Image credit: Airborne Snow Observatory.
“About 80% of Denver Water’s supply comes from snowpack and we want to be able to forecast spring runoff as accurately as possible,” said Nathan Elder, Denver Water’s manager of water supply.
“Getting more and better information improves accuracy and that helps us know if we have to go on watering restrictions, or what the impacts of runoff will be on the environment and recreation, how we should manage and move our water resources,” he said.
The mid-April flight was timed to be at or close to the peak of the season’s snowpack. It was the first of two flights Denver Water commissioned to collect data over the Blue River Basin this season.
Information from the first flight indicated there were normal amounts snow in the middle and lower elevations, but less than expected at higher elevations, Elder said.
“That’s important to know, because where the snow is on the mountain will dictate when it starts melting for the runoff,” Elder said.
A second flight in late May or early June will collect information about how much snow might be lingering at the highest elevations.
he flight path of a plane tasked with collecting data on the snowpack above Dillon Reservoir in mid-April, as it flew a pattern back and forth across the Blue River Basin. Photo credit: Denver Water.
That’s important because by then, snow at the four SNOTEL measurement sites in the basin, perched at about 11,000 feet, will have already melted away, leaving the utility and other snow watchers blind to water that might still be frozen in place at higher elevations — or may have already melted away.
“Based on the measurements and history we have, we can overpredict the amount of water in the snow or underpredict. Either way has consequences for how we operate our system, and is something we want to avoid,” Elder said.
Historically, Denver Water and other water watchers gather information about snowpack and water supplies by looking at data from SNOTEL sites scattered across the mountains, including four in the Blue River Basin area, and information collected by crews snowshoeing to remote locations. Information collected during the season is compared to historical data.
But Elder compares the SNOTEL measurement spots to pixels in a TV screen.
“If you have four sites in the Blue River Basin, imagine watching TV and you have four pixels for the entire screen – you won’t be able to tell what’s going on. And if the pixels are in a line across the middle, like the SNOTEL sites are all between 10,500 and 11,400 feet, you can’t see anything above or below that line,” Elder said.
Throw in additional layers of uncertainty in shifting weather patterns due to climate change, and the confidence in data collected the same way it’s been done for decades starts to slide.
Denver Water caretaker Per Olsson snowshoes through the woods to access snow-measuring sites. Olsson retired from Denver Water in 2018 after 26 years of service. Photo credit: Denver Water.
“What we see now isn’t the same as what we’ve seen in the past. You can’t base today’s forecast on yesterday’s data, conditions are changing,” Elder said.
Gathering data on the snowpack by flying above it started in California and Colorado in 2013 and has occurred occasionally in various river basins across Colorado for several years, as utilities and others have had money available to commission flights.
Denver Water flew two flights above the Blue River Basin in 2019, then skipped 2020 amid the pandemic.
But several Colorado water utilities and entities are looking at the possibility of banding together to coordinate future flights, sharing costs and also sharing the data that comes from the flights.
“When Denver Water did the first Airborne Snow Observatory flights in 2019, we found incredible value from the information and we started to tell the story of those pilot flights at conferences,” said Taylor Winchell, a water resource engineer at Denver Water who works on climate change adaptation and water supply planning issues.
“There’s a lot of interest, but there also are a lot of questions about the cost, the information, timing – when do you fly – and where those flights might be the most useful,” Winchell said.
Information collected from the flights is another tool to be integrated into the wealth of information that exists about Colorado’s snowpack, and how it might change in coming years, he said.
How many inches of water were frozen in the snow in mid-April? The shaded blue band shows how the amount of water changed as you go from 9,000 feet to 14,000 feet on the mountains above Dillon Reservoir. Image credit: Airborne Snow Observatory.
In April, the Colorado Water Conservation Board gave $45,000 to fund the Colorado Airborne Snow Observatory Expansion Plan, allowing the group to work through all the questions.
“This project isn’t designed to pay for the flights, but to create a plan for developing a sustainable operation in Colorado with consistent flights, across many watersheds, every year, with costs and information shared – similar to the California program,” Winchell said.
The planning team includes Denver Water, Northern Water, Dolores Water Conservancy District, Airborne Snow Observatories Inc. (a company that grew out of the NASA-led pilot flights in California) and Lynker, which specializes in water resources planning and analysis.
Winchell said the planning process is expected to get a diversity of water perspectives across Colorado, spanning state and federal agencies, agriculture and recreation interests, water providers, cities, researchers, environmental groups and Native American tribal groups.
“Airborne snow flights have benefits for everyone who is involved in water management,” Winchell said. “We’re trying to make sure all perspectives are included in developing this program.”
Looking to the south from a plane above Dillon Reservoir in June 2019, during an Airborne Snow Observatory flight to gather data on the snowpack above the reservoir for Denver Water. Photo credit: Quantum Spatial.
Abstract
In the Southwest and Central Plains of Western North America, climate change is expected to increase drought severity in the coming decades. These regions nevertheless experienced extended Medieval-era droughts that were more persistent than any historical event, providing crucial targets in the paleoclimate record for benchmarking the severity of future drought risks. We use an empirical drought reconstruction and three soil moisture metrics from 17 state-of-the-art general circulation models to show that these models project significantly drier conditions in the later half of the 21st century compared to the 20th century and earlier paleoclimatic intervals. This desiccation is consistent across most of the models and moisture balance variables, indicating a coherent and robust drying response to warming despite the diversity of models and metrics analyzed. Notably, future drought risk will likely exceed even the driest centuries of the Medieval Climate Anomaly (1100–1300 CE) in both moderate (RCP 4.5) and high (RCP 8.5) future emissions scenarios, leading to unprecedented drought conditions during the last millennium.
INTRODUCTION
Millennial-length hydroclimate reconstructions over Western North America (1–4) feature notable periods of extensive and persistent Medieval-era droughts. Such “megadrought” events exceeded the duration of any drought observed during the historical record and had profound impacts on regional societies and ecosystems (2, 5, 6). These past droughts illustrate the relatively narrow view of hydroclimate variability captured by the observational record, even as recent extreme events (7–9) highlighted concerns that global warming may be contributing to contemporary droughts (10, 11) and will amplify drought severity in the future (11–15). A comprehensive understanding of global warming and 21st century drought therefore requires placing projected hydroclimate trends within the context of drought variability over much longer time scales (16, 17). This would also allow us to establish the potential risk (that is, likelihood of occurrence) of future conditions matching or exceeding the severest droughts of the last millennium.
Quantitatively comparing 21st century drought projections from general circulation models (GCMs) to the paleo-record is nevertheless a significant technical challenge. Most GCMs provide soil moisture diagnostics, but their land surface models often vary widely in terms of parameterizations and complexity (for example, soil layering and vegetation). There are few large-scale soil moisture measurements that can be easily compared to modeled soil moisture, and none for intervals longer than the satellite record. Instead, drought is typically monitored in the real world using offline models or indices that can be estimated from more widely measured data, such as temperature and precipitation.
One common metric is the Palmer Drought Severity Index (PDSI) (18), widely used for drought monitoring and as a target variable for proxy-based reconstructions (1, 2). PDSI is a locally normalized index of soil moisture availability, calculated from the balance of moisture supply (precipitation) and demand (evapotranspiration). Because PDSI is normalized on the basis of local average moisture conditions, it can be used to compare variability and trends in drought across regions. Average moisture conditions (relative to a defined baseline) are denoted by PDSI = 0; negative PDSI values indicate drier than average conditions (droughts), and positive PDSI values indicate wetter than normal conditions (pluvials). PDSI is easily calculated from GCMs using variables from the atmosphere portion of the model (for example, precipitation, temperature, and humidity) and can be compared directly to observations. However, whereas recent work has demonstrated that PDSI is able to accurately reflect the surface moisture balance in GCMs (19), other studies have highlighted concerns that PDSI may overestimate 21st century drying because of its relatively simple soil moisture accounting and lack of direct CO2 effects that are expected to reduce evaporative losses (12, 20, 21). We circumvent these concerns by using a more physically based version of PDSI (13) (based on the Penman-Monteith potential evapotranspiration formulation) in conjunction with soil moisture from the GCMs to demonstrate robust drought responses to climate change in the Central Plains (105°W–92°W, 32°N–46°N) and the Southwest (125°W–105°W, 32°N–41°N) regions of Western North America.
RESULTS
We calculate summer season [June-July-August (JJA)] PDSI and integrated soil moisture from the surface to ~30-cm (SM-30cm) and ~2- to 3-m (SM-2m) depths from 17 GCMs (tables S1 and S2) in phase 5 of the Coupled Model Intercomparison Project (CMIP5) database (22). We focus our analyses and presentation on the RCP 8.5 “business-as-usual” high emissions scenario, designed to yield an approximate top-of-atmosphere radiative imbalance of +8.5 W m−2 by 2100. We also conduct the same analyses for a more moderate emissions scenario (RCP 4.5).
Over the calibration interval (1931–1990), the PDSI distributions from the models are statistically indistinguishable from the North American Drought Atlas (NADA) (two-sided Kolmogorov-Smirnov test, p ≥ 0.05), although there are some significant deviations in some models during other historical intervals. North American drought variability during the historical period in both models and observations is driven primarily by ocean-atmosphere teleconnections, internal variability in the climate system that is likely to not be either consistent across models or congruent in time between the observations and models, and so such disagreements are unsurprising. In the multimodel mean, all three moisture balance metrics show markedly consistent drying during the later half of the 21st century (2050–2099) (Fig. 1; see figs. S1 to S4 for individual models). Drying in the Southwest is more severe (RCP 8.5: PDSI = −2.31, SM-30cm = −2.08, SM-2m = −2.98) than that over the Central Plains (RCP 8.5: PDSI = −1.89, SM-30cm = −1.20, SM-2m = −1.17). In both regions, the consistent cross-model drying trends are driven primarily by the forced response to increased greenhouse gas concentrations (13), rather than by any fundamental shift in ocean-atmosphere dynamics [indeed, there is a wide disparity across models regarding the strength and fidelity of the simulated teleconnections over North America (23)]. In the Southwest, this forcing manifests as both a reduction in cold season precipitation (24) and an increase in potential evapotranspiration (that is, evaporative demand increases in a warmer atmosphere) (13, 25) acting in concert to reduce soil moisture. Even though cold season precipitation is actually expected to increase over parts of California in our Southwest region (24, 26), the increase in evaporative demand is still sufficient to drive a net reduction in soil moisture. Over the Central Plains, precipitation responses during the spring and summer seasons (the main seasons of moisture supply) are less consistent across models, and the drying is driven primarily by the increased evaporative demand. Indeed, this increase in potential evapotranspiration is one of the dominant drivers of global drought trends in the late 21st century, and previous work with the CMIP5 archive demonstrated that the increased evaporative demand is likely to be sufficient to overcome precipitation increases in many regions (13). In the more moderate emissions scenario (RCP 4.5), both the Southwest (RCP 4.5: PDSI = −1.49, SM-30cm = −1.63, SM-2m = −2.39) and Central Plains (RCP 4.5: PDSI = −1.21, SM-30cm = −0.89, SM-2m = −1.17) still experience significant, although more modest, drying into the future, as expected (fig. S5).
Fig. 1 Top: Multimodel mean summer (JJA) PDSI and standardized soil moisture (SM-30cm and SM-2m) over North America for 2050–2099 from 17 CMIP5 model projections using the RCP 8.5 emissions scenario. SM-30cm and SM-2m are standardized to the same mean and variance as the model PDSI over the calibration interval fromthe associated historical scenario (1931–1990). Dashed boxes represent the regions of interest: the Central Plains (105°W–92°W, 32°N–46°N) and the Southwest (125°W–105°W, 32°N–41°N). Bottom: Regional average time series of the summer season moisture balance metrics from the NADA and CMIP5models. The observational NADA PDSI series (brown) is smoothed using a 50-year loess spline to emphasize the low-frequency variability in the paleo-record. Model time series (PDSI, SM-30cm, and SM-2m) are the multimodel means averaged across the 17 CMIP5models, and the gray shaded area is the multimodel interquartile range for model PDSI.
In both regions, the model-derived PDSI closely tracks the two soil moisture metrics (figs. S6 and S7), correlating significantly for most models and model intervals (figs. S8 and S9). Over the historical simulation, average model correlations (Pearson’s r) between PDSI and SM-30cm are +0.86 and +0.85 for the Central Plains and Southwest, respectively. Correlations weaken very slightly for PDSI and SM-2m: +0.84 (Central Plains) and +0.83 (Southwest). The correlations remain strong into the 21st century, even as PDSI and the soil moisture variables occasionally diverge in terms of long-term trends. There is no evidence, however, for systematic differences between the PDSI and modeled soil moisture across the model ensemble. For example, whereas the PDSI trends are drier than the soil moisture condition over the Southwest in the ACCESS1-0 model, PDSI is actually less dry than the soil moisture in the MIROC-ESM and NorESM1-M simulations over the same region (fig. S7). These outlier observations, showing no consistent bias, in conjunction with the fact that the overall comparison between PDSI and modeled soil moisture is markedly consistent, provide mutually consistent support for the characterization of surface moisture balance by these metrics in the model projections.
For estimates of observed drought variability over the last millennium (1000–2005), we use data from the NADA, a tree-ring based reconstruction of JJA PDSI. Comparisons between the NADA and model moisture are shown in the bottom panels of Fig. 1. In the NADA, both the Central Plains (Fig. 2) and Southwest (Fig. 3) are drier during the Medieval megadrought interval (1100–1300 CE) than either the Little Ice Age (1501–1849) or historical periods (1850–2005). For nearly all models, the 21st century projections under the RCP 8.5 scenario reveal dramatic shifts toward drier conditions. Most models (indicated with a red dot) are significantly drier (one-sided Kolmogorov-Smirnov test, p ≤ 0.05) in the latter part of the 21st century (2050–2099) than during their modeled historical intervals (1850–2005). Strikingly, shifts in projected drying are similarly significant in most models when measured against the driest and most extreme megadrought period of the NADA from 1100 to 1300 CE (gray dots). Results are similar for the more moderate RCP 4.5 emissions scenario (figs. S10 and S11), which still indicates widespread drying, albeit at a reduced magnitude for many models. Although there is some spread across the models and metrics, only two models project wetter conditions in RCP 8.5. In the Central Plains, SM-2m is wetter in ACCESS1-3, with little change in SM-30cm and slightly wetter conditions in PDSI. In the Southwest, CanESM2 projects markedly wetter SM-2m conditions; PDSI in the same model is slightly wetter, whereas SM-30cm is significantly drier.
Fig. 2 Interquartile range of PDSI and soil moisture from the NADA and CMIP5 GCMs, calculated over various time intervals for the Central Plains. The groups of three stacked bars at the top of each column are from the NADA PDSI: 1100–1300 (the time of the Medieval-era megadroughts, brown), 1501–1849 (the Little Ice Age, blue), and 1850–2005 (the historical period, green). Purple and red bars are for the modeled historical period (1850–2005) and late 21st century (2050–2099) period, respectively. Red dots indicate model 21st century drought projections that are significantly drier than the model simulated historical periods. Gray dots indicate model 21st century drought projections that are significantly drier than the Medieval-era megadrought period in the NADA.
When the RCP 8.5 multimodel ensemble is pooled together (Fig. 4), projected changes in the Central Plains and Southwest (2050–2099 CE) for all three moisture balance metrics are significantly drier compared to both the modern model interval (1850–2005 CE) and 1100–1300 CE in the NADA (one-sided Kolmogorov-Smirnov test, p ≤ 0.05). In the case of SM-2m in the Southwest, the density function is somewhat flattened, with an elongated right (wet) tail. This distortion arises from the disproportionate contribution to the density function from the wetting in the five CanESM2 ensemble members. Even with this contribution, however, the SM-2m drying in the multimodel ensemble is still significant. Results are nearly identical for the pooled RCP 4.5 multimodel ensemble (fig. S12), which still indicates a significantly drier late 21st century compared to either the historical interval or Medieval megadrought period.
Fig. 3 Same as Fig. 2, but for the Southwest.Fig. 4 Kernel density functions of PDSI, SM-30cm, and SM-2m for the Central Plains and Southwest, calculated from the NADA and the GCMs. The NADA distribution (brown shading) is from 1100–1300 CE, the timing of the medieval megadroughts. Blue lines represent model distributions calculated from all years from all models pooled over the historical scenario (1850–2005 CE). Red lines are for all model years pooled from the RCP 8.5 scenario (2050–2099 CE).
With this shift in the full hydroclimate distribution, the risk of decadal or multidecadal drought occurrences increases substantially. We calculated the risk (17) of decadal or multidecadal drought occurrences for two periods in our multimodel ensemble: 1950–2000 and 2050–2099 (Fig. 5). During the historical period, the risk of a multidecadal megadrought is quite small: <12% for both regions and all moisture metrics. Under RCP 8.5, however, there is ≥80% chance of a multidecadal drought during 2050–2099 for PDSI and SM-30cm in the Central Plains and for all three moisture metrics in the Southwest. Drought risk is reduced slightly in RCP 4.5 (fig. S13), with largest reductions in multidecadal drought risk over the Central Plains. Ultimately, the consistency of our results suggests an exceptionally high risk of a multidecadal megadrought occurring over the Central Plains and Southwest regions during the late 21st century, a level of aridity exceeding even the persistent megadroughts that characterized the Medieval era.
Fig. 5 Risk (percent chance of occurrence) of decadal (11-year) andmultidecadal (35-year) drought, calculated from the multimodel ensemble for PDSI, SM-30cm, and SM-2m. Risk calculations are conducted for two separate model intervals: 1950–2000 (historical scenario) and 2050–2099 (RCP 8.5). Results for the Central Plains are in the top row, and those for the Southwest are in the bottom row.
DISCUSSION
Within the body of literature investigating North American hydroclimate, analyses of drought variability in the historical and paleoclimate records are often separate from discussions of global warming–induced changes in future hydroclimate. This disconnection has traditionally made it difficult to place future drought projections within the context of observed and reconstructed natural hydroclimate variability. Here, we have demonstrated that the mean state of drought in the late 21st century over the Central Plains and Southwest will likely exceed even the most severe megadrought periods of the Medieval era in both high and moderate future emissions scenarios, representing an unprecedented fundamental climate shift with respect to the last millennium. Notably, the drying in our assessment is robust across models and moisture balance metrics. Our analysis thus contrasts sharply with the recent emphasis on uncertainty about drought projections for these regions (21, 27), including the most recent Intergovernmental Panel on Climate Change assessment report (28).
Our results point to a remarkably drier future that falls far outside the contemporary experience of natural and human systems in Western North America, conditions that may present a substantial challenge to adaptation. Human populations in this region, and their associated water resources demands, have been increasing rapidly in recent decades, and these trends are expected to continue for years to come (29). Future droughts will occur in a significantly warmer world with higher temperatures than recent historical events, conditions that are likely to be a major added stress on both natural ecosystems (30) and agriculture (31). And, perhaps most importantly for adaptation, recent years have witnessed the widespread depletion of nonrenewable groundwater reservoirs (32, 33), resources that have allowed people to mitigate the impacts of naturally occurring droughts. In some cases, these losses have even exceeded the capacity of Lake Mead and Lake Powell, the two major surface reservoirs in the region (34, 35). Combined with the likelihood of a much drier future and increased demand, the loss of groundwater and higher temperatures will likely exacerbate the impacts of future droughts, presenting a major adaptation challenge for managing ecological and anthropogenic water needs in the region.
MATERIALS AND METHODS
Estimates of drought variability over the historical period and the last millennium used the latest version of the NADA (1), a tree ring–based reconstruction of summer season (JJA) PDSI. All statistics were based on regional PDSI averages over the Central Plains (105°W–92°W, 32°N–46°N) and the Southwest (125°W–105°W, 32°N–41°N). We restricted our analysis to 1000–2005 CE; before 1000 CE, the quality of the reconstruction in these regions declines.
The 21st century drought projections used output from GCM simulations in the CMIP5 database (22) (table S1). All models represent one or more continuous ensemble members from the historical (1850–2005 CE) and RCP 4.5 (15 models available) and 8.5 (17 models available) emissions scenarios (2006–2099 CE). We used the same methodology as in (13) to calculate model PDSI for the full interval (1850–2099 CE), using the Penman-Monteith formulation of potential evapotranspiration. The baseline period for calibrating and standardizing the model PDSI anomalies was 1931–1990 CE, the same baseline period as the NADA PDSI. Negative model PDSI values therefore indicate drier conditions than the average for 1931–1990.
To augment the model PDSI calculations and comparisons with observed drought variability in the NADA, we also calculated standardized soil moisture metrics from the GCMs for two depths: ~30 cm (SM-30cm) and ~2 to 3 m (SM-2m) (table S2). For these soil moisture metrics, the total soil moisture from the surface was integrated to these depths and averaged over JJA. At each grid cell, we then standardized SM-30cm and SM-2m to match the same mean and interannual SD for the model PDSI over 1931–1990. This allows for direct comparison of variability and trends between model PDSI and model soil moisture and between the model metrics (PDSI, SM-30cm, and SM-2m) and the NADA (PDSI) while still independently preserving any low-frequency variability or trends in the soil moisture that may be distinct from the PDSI calculation. The soil moisture standardization does not impose any artificial constraints that would force the three metrics to agree in terms of variability or future trends, allowing SM-30cm and SM-2m to be used as indicators of drought largely independent of PDSI.
Risk of decadal and multidecadal megadrought occurrence in the multimodel ensemble is estimated from 1000 Monte Carlo realizations of each moisture balance metric (PDSI, SM-30cm, and SM-2m), as in (17). This method entails estimating the mean and SD of a given drought index (for example, PDSI or soil moisture) over a reference period (1901–2000), then subtracting that mean and SD from the full record (1850–2100) to produce a modified z score. The differences between the reference mean and SD are then used to conduct (white noise) Monte Carlo simulations of the future (2050–2100) to emulate the statistics of that era. The fraction of Monte Carlo realizations exhibiting a decadal or multidecadal drought are then calculated from each Monte Carlo simulation of each experiment in both regions considered here. Finally, these risks from each model are averaged together to yield the overall risk estimates reported here. Additional details on the methodology can be found in (17).
UPPLEMENTARY MATERIALS
Supplementary material for this article is available at http://advances.sciencemag.org/cgi/ content/full/1/1/e1400082/DC1
Fig. S1. For the individual models, ensemble mean soil moisture balance (PDSI, SM-30cm, and SM-2m) for 2050–2099: ACCESS1.0, ACCESS1.3, BCC-CSM1.1, and CanESM2.
Fig. S2. Same as fig. S1, but for CCSM4, CESM1-BGC, CESM-CAM5, and CNRM-CM5.
Fig. S3. Same as fig. S1, but for GFDL-CM3, GFDL-ESM2G, GFDL-ESM2M, and GISS-E2-R.
Fig. S4. Same as fig. S1, but for INMCM4.0,MIROC-ESM, MIROC-ESM-CHEM, NorESM1-M, and NorESM1-ME models.
Fig. S5. Same as Fig. 1, but for the RCP 4.5 scenario.
Fig. S6. Regional average moisture balance time series (historical + RCP 8.5) from the first ensemble member of each model over the Central Plains.
Fig. S7. Same as fig. S6, but for the Southwest.
Fig. S8. Pearson’s correlation coefficients for three time intervals from the models over the Central Plains: PDSI versus SM-30cm, PDSI versus SM-2m, and SM-30cm versus SM-2m.
Fig. S9. Same as fig. S8, but for the Southwest.
Fig. S10. Same as Fig. 2, but for the RCP 4.5 scenario.
Fig. S11. Same as Fig. 3, but for the RCP 4.5 scenario.
Fig. S12. Same as Fig. 4, but for the RCP 4.5 scenario.
Fig. S13. Same as Fig. 5, but for the RCP 4.5 scenario.
Table S1. Continuous model ensembles from the CMIP5 experiments (1850–2099, historical + RCP8.5 scenario) used in this analysis, including the modeling center or group that supplied the output, the number of ensemble members, and the approximate spatial resolution.
Table S2. The number of soil layers integrated for our CMIP5 soil moisture metrics (SM-30cm and SM-2m), and the approximate depth of the bottom soil layer.
This is an open-access article distributed under the terms of the Creative Commons Attribution-NonCommercial license, which permits use, distribution, and reproduction in any medium, so long as the resultant use is not for commercial advantage and provided the original work is properly cited.
Given the size and tremendous heat capacity of the global oceans, it takes a massive amount of heat energy to raise Earth’s average yearly surface temperature even a small amount. The 2-degree increase in global average surface temperature that has occurred since the pre-industrial era (1880-1900) might seem small, but it means a significant increase in accumulated heat. That extra heat is driving regional and seasonal temperature extremes, reducing snow cover and sea ice, intensifying heavy rainfall, and changing habitat ranges for plants and animals—expanding some and shrinking others.
Conditions in 2020
According to the 2020 Global Climate Report from NOAA National Centers for Environmental Information, every month of 2020 except December was in the top four warmest on record for that month. In December, the presence of a moderately strong La Niña event cooled the tropical Pacific Ocean and dampened the global average warmth. The month turned out as “only” the eighth warmest December on record.
This animation shows maps of monthly temperatures for January–December 2020 compared to the 1981–2010 average, with warm anomalies in red and cool anomalies in blue. The final frame of the animation shows the 2020 average. Note that the temperature range on the monthly maps is broader than the range for the annual average (plus or minus 9 degrees versus plus or minus 5 degrees). Image by NOAA Climate.gov, based on data from NOAA NCEI.
Despite La Niña, 2020 ranked as the second-warmest year in the 141-year record for the combined land and ocean surface, and land areas were hottest on record. Many parts of Europe and Asia were record warm, including most of France and northern Portugal and Spain, most of the Scandinavian Peninsula, Russia, and southeastern China. An even larger portion of the globe was much warmer than average, including most of the Atlantic and Indian Oceans. The heat reached all the way to the Antarctic, where the station at Esperanza Base, at the tip of the Antarctic Peninsula, appeared to set a new all-time record high temperature of 65.1 degrees Fahrenheit (18.4 degrees Celsius) on February 6, 2020.
For more regional details and 2020 climate statistics, see the 2020 Annual Climate Report from NOAA’s National Centers for Environmental Information.
Change over time
Though warming has not been uniform across the planet, the upward trend in the globally averaged temperature shows that more areas are warming than cooling. According to NOAA’s 2020 Annual Climate Report the combined land and ocean temperature has increased at an average rate of 0.13 degrees Fahrenheit ( 0.08 degrees Celsius) per decade since 1880; however, the average rate of increase since 1981 (0.18°C / 0.32°F) has been more than twice that rate.
Changes in global average surface temperature from 1990-2019. Places that warmed by up to 1° Fahrenheit over the past 30 years are red, places that have cooled by up to 1° F are blue, and places where we don’t have enough observations to calculate a trend are light gray. NOAA Climate.gov map, based on NCEI data.
The 10 warmest years on record have all occurred since 2005, and 7 of the 10 have occurred just since 2014. Looking back to 1988, a pattern emerges: except for 2011, as each new year is added to the historical record, it becomes one of the top 10 warmest on record at that time, but it is ultimately replaced as the “top ten” window shifts forward in time.
By 2020, models project that global surface temperature will be more than 0.5°C (0.9°F) warmer than the 1986-2005 average, regardless of which carbon dioxide emissions pathway the world follows. This similarity in temperatures regardless of total emissions is a short-term phenomenon: it reflects the tremendous inertia of Earth’s vast oceans. The high heat capacity of water means that ocean temperature doesn’t react instantly to the increased heat being trapped by greenhouse gases. By 2030, however, the heating imbalance caused by greenhouse gases begins to overcome the oceans’ thermal inertia, and projected temperature pathways begin to diverge, with unchecked carbon dioxide emissions likely leading to several additional degrees of warming by the end of the century.
About surface temperature
The concept of an average temperature for the entire globe may seem odd. After all, at this very moment, the highest and lowest temperatures on Earth are likely more than 100°F (55°C) apart. Temperatures vary from night to day and between seasonal extremes in the Northern and Southern Hemispheres. This means that some parts of Earth are quite cold while other parts are downright hot. To speak of the “average” temperature, then, may seem like nonsense. However, the concept of a global average temperature is convenient for detecting and tracking changes in Earth’s energy budget—how much sunlight Earth absorbs minus how much it radiates to space as heat—over time.
To calculate a global average temperature, scientists begin with temperature measurements taken at locations around the globe. Because their goal is to track changes in temperature, measurements are converted from absolute temperature readings to temperature anomalies—the difference between the observed temperature and the long-term average temperature for each location and date. Multiple independent research groups across the world perform their own analysis of the surface temperature data, and they all show a similar upward trend.
Temperature records from NOAA, NASA, and the University of East Anglia all show an increase from the start of the 20th-century through 2019. The year 2019 counted among the top three warmest years on record. Background image from NOAA DISCOVR/EPIC. Graph by NOAA Climate.gov based on data from the Bulletin of the American Meteorological Society’s State of the Climate 2019.
Across inaccessible areas that have few measurements, scientists use surrounding temperatures and other information to estimate the missing values. Each value is then used to calculate a global temperature average. This process provides a consistent, reliable method for monitoring changes in Earth’s surface temperature over time. Read more about how the global surface temperature record is built in our Climate Data Primer.
References
Sánchez-Lugo, A., Berrisford, P., Morice, C., and Argüez, A. (2018). Temperature [in State of the Climate in 2018]. Bulletin of the American Meteorological Society, 99(8), S11–S12.
NOAA National Centers for Environmental Information, State of the Climate: Global Climate Report for Annual 2020, online January 2021, retrieved on March 15, 2021 from https://www.ncdc.noaa.gov/sotc/global/202013.
IPCC, 2013: Summary for Policymakers. In: Climate Change 2013: The Physical Science Basis. Contribution of Working Group 1 to the 5th Assessment Report of the Intergovernmental Panel on Climate Change [Stocker, T.F., D. Qin, G.-K. Plattner, M. Tignor, S.K. Allen, J. Boschung, A. Nauels, Y. Xia, V. Bex and P.M. Midgley (eds.)]. Cambridge University Press, Cambridge, United Kingdom and New York, NY, USA.
Scientists in the University of Arizona’s Department of Atmospheric Sciences are experts on our monsoon storm season. This video from 2011 explains how the monsoon works, and shows some of the cool computer models used to predict monsoon storm patters.
Members of the Upper Arkansas Water Conservancy District board of directors agreed to support a stream restoration project for a 2-mile section of Oak Creek on the Van Norman Ranch near Cañon City.
Luke Javernick, executive director of Cañon City-based River Science, provided an overview of the project at the District’s May board meeting.
As a demonstration project, the endeavor promises to provide important information to guide future restoration efforts, and since the land lies within the Upper Ark District, directors and staff agreed on the importance of being involved to better understand the risk to water rights as well as the benefits.
Javernick said the benefits of “process-based stream restoration” include wildfire suppression and habitat improvements in the stream as well as in the riparian zone. “But the real impact is restoring hydrologic connectivity between the surface water and groundwater.”
Process-based restoration involves hand-building stream features that mimic natural structures, he said. “We’re mimicking nature, encouraging natural river processes for beneficial restoration,” and those structures can be modified or removed to accommodate the dynamics of the stream. “It takes time … five to 10 years.”
From the District’s perspective, one of the most important questions the project will attempt to answer is how stream restoration effects flows and, therefore, water rights.
“If you’re slowing the water down and allowing it to soak into the aquifer, when do you get that equilibrium?” Javernick asked. “We need UAWCD support because you’re the experts in water rights administration. … We need your help in navigating what types of creative solutions might be available.”
The Van Normans have an Oak Creek water right. However, the Town of Rockvale has the senior water right on Oak Creek, Javernick said, and “the Town is onboard.”
The Colorado Water Conservation Board has awarded a $99,900 grant to the Van Norman Project, and Javernick indicated that the Phase I project budget includes $10,000 for the Upper Ark District. “We’re asking for a $10,000 (in-kind) match.”
Delta County farmer Paul Kehmeier kneels by gated pipes in his family’s alfalfa field. He received funding to replace an unlined canal with the pipes in 2014 from the U.S. Department of Agriculture’s Natural Resources Conservation Service. Piping unlined canals, which is one of the primary methods used to prevent salt and selenium from leaching into the water supply, is critical to the protection of endangered fish in the Gunnison and Colorado river basins. Photo credit: Natalie Keltner-McNeil/Aspen Journalism
The U.S. Department of Agriculture’s (USDA) Natural Resources Conservation Service (NRCS) is investing up to $15 million to support the development of new tools, approaches, practices and technologies to further natural resource conservation on private lands through the Conservation Innovation Grants (CIG) program.
CIG partners use creative problem solving and innovation to address our nation’s water quality, air quality, soil health and wildlife habitat challenges, all while improving agricultural operations. This year, funded CIGs will focus on climate-smart strategies for water resources, soil health (focused on carbon sequestration and climate resilience), nutrient management, grazing lands conservation and strategies to increase conservation adoption.
“Through Conservation Innovation Grants, we’re able to co-invest with partners on the next generation of agricultural conservation solutions,” said Acting NRCS Chief Terry Cosby. “Using creative problem solving and innovation, CIG partners work to address our nation’s most pressing natural resource concerns, all while helping to ensure the health and longevity of American agriculture.”
All U.S.-based non-Federal entities and individuals are eligible to apply. Proposals must be submitted through Grants.gov by 11:59 p.m. ET on July 19, 2021.
The CIG program has three components, CIG Classic, CIG On-Farm Conservation Innovation Trials and state-level CIG. Today’s funding opportunity announcement is for CIG Classic, which supports early pilot projects or demonstrations of promising new conservation approaches, tools and technologies.
CIG Classic grantees must match each federal dollar invested at least one to one.
NRCS intends to expend at least 10% of the total funding for CIG Classic on projects that are focused on providing conservation benefits to historically undeserved producers.
In April, USDA announced $25 million for CIG On-Farm Conservation Innovation Trials, which features collaboration between NRCS and partners to implement on-the-ground conservation activities and then evaluate their impact. Incentive payments are provided to producers to offset the risk of implementing new approaches. The On-Farm Conservation Innovation Trials funding opportunity deadline is June 21, 2021.
More Information
For more information on CIG, please visit the CIG website.
Under the Biden-Harris Administration, USDA is engaged in a whole-of-government effort to combat the climate crisis and conserve and protect our nation’s lands, biodiversity and natural resources including our soil, air and water. Through conservation practices and partnerships, USDA aims to enhance economic growth and create new streams of income for farmers, ranchers, producers and private foresters. Successfully meeting these challenges will require USDA and our agencies to pursue a coordinated approach alongside USDA stakeholders, including State, local and Tribal governments.
USDA touches the lives of all Americans each day in so many positive ways. In the Biden-Harris Administration, USDA is transforming America’s food system with a greater focus on more resilient local and regional food production, fairer markets for all producers, ensuring access to healthy and nutritious food in all communities, building new markets and streams of income for farmers and producers using climate smart food and forestry practices, making historic investments in infrastructure and clean energy capabilities in rural America, and committing to equity across the Department by removing systemic barriers and building a workforce more representative of America. To learn more, visit http://www.usda.gov.
Watering restrictions are in place for Glenwood Springs residents, according to a news release.
Odd numbered home addresses can water on odd days of the month and even numbered home addresses can water on even days of the month.
Watering on both odd and even numbered days is prohibited from 10 a.m. to 6 p.m…
Glenwood Springs spokesperson Bryana Starbuck said the watering schedule was enacted during the response to the Grizzly Creek Fire last year as a necessary precaution to maintain water capacity due to fire activity near one of the city’s water sources…
The city expects the water schedule to remain in effect throughout the summer to help encourage water conservation during the drought conditions, Starbuck said.
Jessica Woelfel’s family is weighing whether or not they can continue living in their home of six years in Midway, south of Fountain, as affordable water options dry up.
“It’s forcing us out of our home,” said Woelfel. “We’re going to have to move and we own this place. We’re kind of down to the last resort here.”
Because her family doesn’t live in Fountain City limits, they can’t receive Fountain City water. Because they don’t live in Pueblo, they can’t get a key for access to Pueblo water. The family says Wigwam utilities quoted them $50,000 for a new water tap and pipes to their home. Unable to afford that hefty bill, her household pays Koury Transport to truck in water from the Pueblo area at a rate of $85 per 1,000 gallons…
Owner of Koury Transport, Grant Koury, says he does everything he can to keep costs low. But the business model factors in upfront water costs, rising fuel prices, heavy equipment, insurance, delivery, and labor fees.
Koury told 13 Investigates the company services 20 to 40 Midway-area homes twice a week. Each roundtrip takes about five hours. Koury says his business also faces limited water supply coupled with increasing demand…
Meanwhile, the Fountain Utilities Department is evaluating how it can accommodate thousands of new taps amid rapid development plans…
The city of Fountain currently provides water to 8,700 taps. A recent study revealed a way to improve the water delivery system. City leaders are implementing a plan that would increase the number of available water taps in Fountain by 1,000 to 1,200…
The Fountain Utilities Department calculated the demand for new water taps across all proposed development projects. It’s more than three times the current supply.
The U.S. Army Corps of Engineers, Omaha District, will conduct its annual sediment flushing exercise at Cherry Creek Reservoir, Colorado, Wednesday, May 26.
Katie Seefus, water manager, Omaha District said that the exercise involves high releases from Cherry Creek Dam, located south of Interstate 225 near Aurora.
“When the gates are opened, the high velocity of the water leaving the reservoir scours the area immediately upstream of the gates and transports sediment with the flow,” she said. “This sediment flush is required to allow proper operation of the outlet gates.”
Cherry Creek Dam will begin releasing 50 cubic feet per second on Tuesday, May 25, at 2:30 p.m. The actual flushing exercise will take place Wednesday, May 26, beginning at 9:00 a.m. and ending at 12:30 p.m. when the release will be set back to normal levels. The exact times are subject to change based on conditions. Each of the five gates will take turns releasing a maximum of 250 cfs. The water’s travel time from Cherry Creek Dam to the streamgage located at the Champa Street Bridge is approximately six hours.
Col. Mark Himes, Omaha District commander asks the public to be aware that high flows will take some time to reach the downtown channel and flows from the last gate opened will not reach the downtown channel until Wednesday evening.
“In the interest of public safety I urge the public not to attempt to cross the stream during this event,” Himes said.
The high flows will cause higher than normal creek levels and potential flooding of bike paths and stream crossings, he added.
We need collaborative, inclusive and community-led solutions for the West’s hardest-working river
In the West, our future is intimately tied to how we choose to manage our rivers and our water resources – especially within the Colorado River Basin.
In the face of growing populations and a rapidly changing climate, the need to create a healthy and sustainable Colorado River Basin has never been more urgent. It sounds simple enough, but creating more effective water management systems will require concerted effort on all sides: public officials and farmers and ranchers who recognize the need for innovative approaches, engaged environmental advocates, business leaders who understand that common-sense conservation is good for business, and journalists committed to keeping the public informed.
We are facing real and dramatic challenges in the Colorado River Basin. The work ahead of us is significant, but we’ve already achieved real successes.
By incentivizing water conservation practices, rather than promoting outdated ideas that encourage water users to “use it or lose it,” we’re laying the groundwork for a cultural shift in how we understand and safeguard our water resources. Similarly, we’re supporting farmers and ranchers across the Colorado River Basin to find collaborative solutions to help sustain the West’s vital agricultural industry and heritage. From the innovative projects at Bruchez Ranch in the headwaters of the Colorado River watershed, down to the Grand Valley Water Users Association conserved consumptive use program near Colorado’s state line, we’re helping to fund creative solutions while mitigating social and environmental impacts.
But the fundamental truth within the Colorado River Basin is that we are going to have to learn to live with less water and more variability in our hydrology.
Without tools to manage this risk, we all stand to lose. The ways we manage the risks facing this basin cannot fall on the backs of any one country, any one basin, any one state or any one sector. Farmers and ranchers, cities, tribes, environmental organizations, state leaders, federal agencies and companies must all come together to help shape the solutions.
As sobering as this future is – we know that, collectively, we can rise to meet this challenge. The foundation is committed to playing our part.
It’s in this spirit that we just unveiled our next five year strategic plan. Over the last five years, our Colorado River work has focused primarily on ensuring that we can stabilize the system by supporting the development of new water conservation approaches.
Colorado River. Photo credit: University of Montana
Over the next five years, we will continue to promote water conservation in the face of climate change, but we are more deliberately focusing on promoting healthy watersheds and improving and protecting flows within the Colorado River Basin.
This means we will:
Elevate the voices of those most affected by water policies – and help bring their perspectives to bear in crafting policy solutions that strengthen environmental and economic outcomes in their communities.
Work with on-the-ground partners to support innovation – including developing, testing and driving the widespread use of nature-based solutions (forest management, flood plain reconnection, etc.) and innovative agricultural practices.
Help to bolster sustainable agriculture throughout the Colorado River Basin by supporting community leaders who are using market demand for sustainably produced products to improve how farmers and ranchers operate.
And lastly, we will work with stakeholders from within and beyond the environmental field. Our work in the Colorado River Basin is driven by the knowledge that those closest to the problem are those closest to the solutions. That’s why our efforts center on working hand in hand with local partners and experts who have been engaged in sustaining this river for decades. Now, we must do more to deepen our support of communities of color, who disproportionately experience the most severe impacts of climate change.
For the past 13 years, we have worked to help ensure a secure and stable supply of water in the West. Today, we are more committed than ever to ensuring the Colorado River Basin, and the people, environments and economies that rely on it, can thrive – for the next five years and beyond.
Click here to read the newsletter. Here’s an excerpt:
Southwestern Water Conservation District Hires New General Manager
Steven W. Wolff. Photo credit: The Water Information Program
Southwestern Water Conservation District (SWCD) is pleased to announce the hiring of its newest General Manager, Steven W. Wolff.
Board President Jenny Russell expressed the board’s enthusiasm in naming Wolff as General Manager for the Southwestern District. “Steve immediately stood out in an impressive pool of candidates for the GM position,” said Russell.
Wolff is currently Administrator of the Interstate Streams Division within Wyoming’s State Engineer’s Office in Cheyenne. The Interstate Streams Division oversees Wyoming’s rights and responsibilities outlined in the seven interstate water compacts and three interstate water decrees the state is signatory to. Wolff is also responsible for the development of technical and policy recommendations on inter- and intra-state water issues. The Southwestern board was also pleased and impressed with Wolff’s work with river basin planning efforts of the Wyoming Water Development Commission for each of Wyoming’s seven major river basins. He will be winding down his representation of Wyoming over the next month.
Wolff’s interstate experience will be invaluable to the Southwestern District in its involvement in complex interstate negotiations on the Colorado River, state and federal water policy advocacy, local water planning efforts, water education, and other critical, water-related matters.
“I am honored to be offered this opportunity to contribute to the District’s leadership on West Slope water issues and look forward to becoming an active part of the Southwestern community. I thank the board for their confidence in me,” Wolff said. “We are undoubtedly entering a critical period in providing a reliable water supply for all uses, and no place is more significant than the Colorado River basin. Water management is challenging at a local, regional, and national scale. I look forward to working with the Southwestern District board and the many stakeholders to define and implement a vision for sustainable water resources in southwest Colorado,” added Wolff.
Wolff currently serves as gubernatorial appointee representing Wyoming to the Western States Water Council, the Colorado River Basin Salinity Control Forum, and the Glen Canyon Dam Adaptive Management Program. He also currently serves as chair of the Upper Colorado River Commission’s Engineering Committee and the Upper Colorado River Endangered Fish Recovery Program’s Management Committee.
“We look forward to Steve’s long and productive leadership with the Southwestern District,” concluded Russell.
The Southwestern Water Conservation District was created by the Colorado legislature 80 years ago to protect, conserve, and develop the water resources of the San Juan and Dolores River basins and to safeguard for all of Colorado the waters of the Colorado River basin to which the state is entitled.
Wyoming’s Powder, Bighorn and North Platte rivers serve as headwaters of the Missouri River. They begin as trickles in the mountains and rush down into bottomlands as they gain volume. Once, all three ran full with a buffet of warm- and cool-water fish, from the prehistoric, armor-plated shovelnose sturgeon to the shimmery goldeye.
That’s where their similarities end.
Today, the Powder River remains one of the longest free-flowing rivers in the West. The Bighorn River has several dams, but still retains some of its native species. The North Platte River, on the other hand, has been fundamentally altered. What pollution didn’t kill was largely extirpated by dams and irrigation projects…
It’s no surprise then, that the uninterrupted Powder River still retains the same suite of native fish as it had millennia ago. Sauger, plains minnow, sturgeon chub and many other species swim in its waters. The North Platte, meanwhile, transformed slowly over the course of the mid-to-late 1900s into a thriving cold-water fishery with trophy brown and rainbow trout.
But biologists see a future where at least some of those native fish can be restored not only to the Bighorn River, where species have been lost or are struggling, but also to the lower stretches of the North Platte…
Sauger once ran up and down the North Platte River in such abundance that historical records show they were a major food source for soldiers stationed at Fort Laramie. Sauger are a bit smaller than their nonnative but more popular cousin the walleye, and have telltale black spots on their dorsal fins, said David Zafft, the Wyoming Game and Fish Department’s fisheries management coordinator…
But where sauger struggled in the Platte, they held on in the undammed and relatively untouched Powder River. They can also be found in sections of the Wind River, and have maintained strongholds in the Bighorn River — the same stream by a different name — largely downstream of Worland…
If you wondered what a swimming dinosaur might have resembled, take a look at the shovelnose sturgeon.
The ancient fish is covered in armored plates and has a giant forked tail and long nose used to scoot sand away from river bottoms to find food. Wyoming’s state record is only 10 pounds — big but not notable for a fish in the state — but that record catch measured an impressive 44 inches long…
Unfortunately, the shovelnose sturgeon went the same way as the sauger in the North Platte River. It needs long expanses of uninterrupted running water to spawn and survive, something the Platte lacked once it was developed into a series of reservoirs.
They are doing well in the Powder River, but were largely extirpated from the Bighorn River until reintroduction efforts in the mid-90s, Zafft said. Shovelnose sturgeon were stocked almost every year between 1996 and 2020, when the final batch poured in…
One of the largest channel catfish recorded in the state in its native range came from a fish survey in Glendo Reservoir. Biologists estimated it weighed between 25 and 30 pounds, but an exact measurement proved impossible because it was too big for the scale.
Channel catfish are often associated with southern states, but they were also abundant in the Platte, Powder and Bighorn. Like the others, channel catfish were gone from the Platte by the mid-1900s, but unlike other species, they are now thriving in places like Glendo Reservoir, Zafft said.
There, fisheries biologists have been stocking about 20,000 a year, with another 8,000 stocked in the North Platte River above Glendo. These catfish are not completely the original, though. Native channel catfish are part of a harder-to-obtain northern strain, and biologists have been reintroducing a southern strain imported from Arkansas.
Channel catfish are still sustainably reproducing in the Bighorn and Powder rivers, and are, according to Zafft, one of the state’s “most underutilized game fish.”
[…]
Hiodon alosoides Goldeye. Photo credit: USGS
Goldeye
Somewhere in the slow-moving expanses of the Powder River near the Montana border is a nongame fish that looks like a herring.
The goldeye — a member of the mooneye family — has a compressed body, keeled belly and giant eyes.
They’re not classified as game fish, but they’re aggressive and “fight like crazy,” said Zafft. They also grow to be up to 15 inches long.
They’re gone now from the North Platte, and likely won’t be reintroduced. Biologists say they couldn’t naturally reproduce anymore because of the system of dams and reservoirs.
But goldeye are another fish that still thrives in the strange Powder River system.
In March of 2018 Karl Wetlaufer, a hydrologist and assistant supervisor with the National Resources Conservation Service Colorado Snow Survey, gestures to indicate how high snowpack has been in past years at the McClure Pass site. Data collectors would have to climb the rungs up to the second, higher door to access the shelter. Photo credit: Heather Sackett/Aspen Journalism
FromColorado Public Radio (Michael Elizabeth Sakas):
Brian Domonkos straps on a pair of cross-country skis and glides through the trees along Mosquito Creek west of Fairplay.
It’s May, but there’s still snow in Colorado’s mountains near the headwaters of the South Platte River.
Domonkos, the Colorado Snow Survey supervisor, gets to work measuring how much snowpack is left from the winter to runoff into streams, rivers and reservoirs this summer. These mountains trap snow in a natural reservoir. As it melts, it becomes the primary source of water for Colorado and much of the West.
Climate change is disrupting this delicate system in multiple ways. The overall trend shows less snowpack accumulation due to warmer temperatures. What does collect melts sooner and faster, which means less snow on the ground and a greater chance for wildfires.
Karl Wetlaufer (NRCS), explaining the use of a Federal Snow Sampler, SnowEx, February 17, 2017.
To measure the snowpack, the total seasonal accumulation of snow on the ground, Domonkos skis to specific points on what’s called a snow course. He then jabs a tall metal pipe into the snow to collect a core sample…
The snowpack at the South Platte’s headwaters is over 110 percent of normal levels for this time of year, but that’s not the case for the rest of the state. In southwest Colorado, it’s less than 40 percent in areas that are already experiencing a historic drought…
Year after year, unusually dry soils from warmer than normal temperatures and a lack of moisture are absorbing a lot of the water that melts from the snowpack. This means a lot of water isn’t making it into rivers and streams, essentially limiting the efficiency of the melting snow.
Even a year with an above-normal snowpack might not push Colorado out of a shorter-term drought, Domonkos said…
Dry soils are taking water
Colorado has also been missing out on its late summer monsoon rains the last few years. Assistant state climatologist Becky Bolinger said that means the soils don’t have a chance to catch up on moisture until the snow melts…
In years that start with a water deficit, like this one, melting snowpack saturates the soil first…
Bolinger said the Colorado Climate Center is working on a project that looks more closely at how much soil moisture plays a role in the snowmelt season…
The effects ripple downstream
Poor snowpack efficiency doesn’t just impact Colorado. Reservoirs Lake Powell and Lake Mead are projected to shrink to historic lows in the coming months, which could trigger the federal government’s first-ever official shortage declaration. That would mean mandatory water cutbacks in Arizona and Nevada.
The Colorado River, which starts in the Rocky Mountains of Colorado, feeds those reservoirs. The snowmelt supplies water to millions of people downstream. The forecast for Lake Powell is just 28 percent of average levels…
From recreation to ranching
Some parts of Colorado rely on snowpack as its central water source. Sonja Chavez manages the Upper Gunnison River Water Conservancy District, where snowpack levels are around half of normal. With less snow melting off quicker, Chavez said it’s shortening the recreational season. If the snowpack was above-average, she said there could be six months of a season on the rivers.
“When you’re in drought like we are right now, that season is concentrated into maybe four months,” she said. Low river flows can mean bad water quality from higher concentrations of metals and other contaminants, she said.
The lack of snow and monsoon rains also has a big impact on ranchers in the area, who are reporting lower hay production and smaller herd sizes…
What it means for fire season
Chavez said there’s a lot of worry about wildfires since the Gunnison River Basin is surrounded by federal lands. Kelly Gleason is an assistant professor of ecohydrology at Portland State University. She’s researched how the effects of climate change on snowpack influence wildfire activity.
Gleason said that snowpack has declined dramatically across the West and other mountain states. When that snow melts earlier, it’s like opening a dam in the spring, she said. The result is less water available in the summer months for both people and ecosystems. Another symptom of snow disappearing from the landscape earlier is an extended drought and fire season, Gleason said.
While extreme and exceptional drought continue to plague western Colorado, the northern mountains and eastern plains have seen substantial improvements in conditions over the past four weeks according to the National Drought Mitigation Center.
Recent rain and snow, including storms over the past week with significant moisture, contributed to drought reduction. Much of the northeast is now drought-free or abnormally dry. The greatest improvements are in central Jefferson, northwest Douglas and a small portion of southwest Arapahoe counties, where severe drought has been replaced by drought-free conditions over the past month. Surrounding areas have moved to moderate drought or abnormally dry conditions.
Colorado Drought Monitor map May 11, 2021.
Further south, extreme drought across southern Las Animas and southwest Baca counties has largely moved to severe conditions. A portion of central Kiowa County, which was in exceptional drought at the start of the year and extreme conditions last week, has moved to severe drought. Most of the remaining area in the southeast has shifted to moderate drought, with potential for additional improvement following a series of storms Friday and Saturday which produced as much of four inches of rain in some areas…
Overall, 13 percent of the state is drought-free, up from eight percent last week, with an additional 12 percent in abnormally dry conditions, unchanged from the previous week. Moderate drought covered 32 percent of Colorado, up from 28 percent, while severe drought dropped from 21 to 14 percent. Extreme drought also fell, dropping to points to 13 percent. Exceptional conditions are unchanged at 16 percent.
Just about every indicator of drought is flashing red across the western U.S. after a dry winter and warm early spring. The snowpack is at less than half of normal in much of the region. Reservoirs are being drawn down, river levels are dropping and soils are drying out.
It’s only May, and states are already considering water use restrictions to make the supply last longer. California’s governor declared a drought emergency in 41 of 58 counties. In Utah, irrigation water providers are increasing fines for overuse. Some Idaho ranchers are talking about selling off livestock because rivers and reservoirs they rely on are dangerously low and irrigation demand for farms is only just beginning.
Scientists are also closely watching the impact that the rapid warming and drying is having on trees, worried that water stress could lead to widespreadtree deaths. Dead and drying vegetation means more fuel for what is already expected to be another dangerous fire season.
U.S. Interior Secretary Deb Haaland and Agriculture Secretary Tom Vilsack told reporters on May 13, 2021, that federal fire officials had warned them to prepare for an extremely active fire year. “We used to call it fire season, but wildland fires now extend throughout the entire year, burning hotter and growing more catastrophic in drier conditions due to climate change,” Vilsack said.
Several types of drought are converging in the West this year, and all are at or near record levels.
When too little rain and snow falls, it’s known as meteorological drought. In April, precipitation across large parts of the West was less than 10% of normal, and the lack of rain continued into May.
Rivers, lakes, streams and groundwater can get into what’s known as hydrological drought when their water levels fall. Many states are now warning about low streamflow after a winter with less-than-normal snowfall and warm spring temperatures speeding up melting. The U.S. Bureau of Reclamation announced it would cut off water to a canal serving farms in the Klamath Project on the Oregon-California border because of low water supplies. It also warned that Lake Mead, a giant Colorado River reservoir that provides water for millions of people, is on pace to fall to levels in June that could trigger the first federal water shortage declaration, with water use restrictions across the region.
These factors can all drive ecosystems beyond their thresholds – into a condition called ecological drought – and the results can be dangerous and costly. Fish hatcheries in Northern California have started truckingtheir salmon to the Pacific Ocean, rather than releasing them into rivers, because the river water is expected to be at historic low levels and too warm for young salmon to tolerate.
Snow drought
One of the West’s biggest water problems this year is the low snowpack.
The western U.S. is critically dependent on winter snow slowly melting in the mountains and providing a steady supply of water during the dry summer months. But the amount of water in snowpack is on the decline here and across much of the world as global temperatures rise.
Several states are already seeing how that can play out. Federal scientists in Utah warned in early May that more water from the snowpack is sinking into the dry ground where it fell this year, rather than running off to supply streams and rivers. With the state’s snowpack at 52% of normal, streamflows are expected to be well below normal through the summer, with some places at less than 20%.
More people are moving into the U.S. West, increasing demand for water and irrigated farmland. And global warming – driven by human activities like the burning of fossil fuels – is now fueling more widespread and intense droughts in the region. These two factors act as additional straws pulling water from an already scarce resource.
As demand for water has increased, the West is pumping out more groundwater for irrigation and other needs. Centuries-old groundwater reserves in aquifers can provide resilience against droughts if they are used sustainably. But groundwater reserves recharge slowly, and the West is seeing a decline in those resources, mostly because water use for agriculture outpaces their recharge. Water levels in some wells have dropped at a rate of 6.5 feet (2 meters) per year.
The result is that these regions are less able to manage droughts when nature does bring hot, dry conditions.
California fish hatcheries have started trucking their salmon to the Pacific Ocean because the rivers they are usually released into are too low and warm. AP Photo/Rich Podroncelli
Rising global temperatures also play several roles in drought. They influence whether precipitation falls as snow or rain, how quickly snow melts and, importantly, how quickly the land, trees and vegetation dry out.
Extreme heat and droughts can intensify one another. Solar radiation causes water to evaporate, drying the soil and air. With less moisture, the soil and air then heat up, which dries the soil even more. The result is extremely dry trees and grasses that can quickly burn when fires break out, and also thirstier soils that demand more irrigation.
Alarmingly, the trigger for the drying and warming cycle has been changing. In the 1930s, lack of precipitation used to trigger this cycle, but excess heat has initiated the process in recent decades. As global warming increases temperatures, soil moisture evaporates earlier and at larger rates, drying out soils and triggering the warming and drying cycle.
A lifeline in the desert that has not only made human survival possible, but also feeds much of the U.S. and helps fuel a regional economy that would, by some accounts, be the fifth-largest in the world if the Colorado River Basin were a separate nation. Rising in the Rocky Mountains, the Colorado River traverses 1,450 miles of some of the most beautiful and inhospitable territory on earth, flowing through Wyoming, Colorado, New Mexico, Utah, Arizona, Nevada and California before entering the Mexican states of Sonora and Baja California and ultimately emptying into the Gulf of California.
The river forms a common thread through two countries and across diverse range of cultures, and it is a source of both unity and controversy. It has served as an anvil on which debates over the value of free-flowing rivers and the broader modern environmental conscience have been formed. And in the 21st century, it is has become ground zero for addressing challenges such as population growth, drought, food security, social justice, and climate change.
The effort to confront those challenges is breaking down many old barriers and has given rise to an unprecedented sense of collaboration. Yet, taking the river into the next century may demand an even stronger spirit of compromise and sacrifice.
One of the most significant changes reflected on the map—which the Babbitt Center for Land and Water Policy produced in partnership with the Center for Geospatial Solutions—is the inclusion of the river’s entire 1,450-mile route, from its origins in the Rocky Mountains of Colorado to its terminus at the Sea of Cortez in Mexico. Most conventional maps align the Colorado River Basin’s southern edge with the U.S.-Mexico border, a legacy of administrative and engineering decisions made by the U.S. government in the 20th century.
Although Brian Werner has served on the WEco Board of Trustees for just over a year, he was involved with helping found the organization nearly 20 years ago. Now retired from his 38-year career as the Communications Department Manager and Public Information Officer at Northern Water, and still a life-long water historian, Brian has written and given hundreds of presentations on the role of water in the settlement and development of Colorado and the West. We spoke with Brian about Northern Water’s storage, the impacts of fire on water storage, permitting, and more.
How long have you been on the WEco board?
I’ve been involved with WEco since WEco has been around. I was involved with the first couple incarnations of water education efforts in Colorado in the late 80’s and early 90’s, and then I helped when WEco came into being in 2002. I was never on the board, until a couple of years ago. It was something I wanted to do towards the end of my career and I retired just last year in January 2020. Luckily I was appointed to the board and I’ve truly enjoyed it.
What kind of experience do you bring to the group?
I think the fact that I had a 38-year career in the water business with Northern Water is an asset. At Northern Water, I’d established relations with people from all over the state and I also coordinated probably 150 to 200 different children’s water festivals, so clearly I was into education. I’m really a big believer in the trickle up theory of water knowledge. Where if you can educate the kids, that knowledge is going trickle up to mom and dad, and those kids will somebody be parents themselves. Ultimately, I’ve been trying to build that ethic in what I’ve been about for most of my career.
How would you describe your experience being on the board?
I’ve really enjoyed being on the board. I’ve watched it and been very much involved for a long time. Both Nicole Seltzer and Jayla Poppleton worked with me at Northern Water, so I have a personal vested interest in them succeeding, and they really have. Nicole moved the organization in a wonderful direction and Jayla has just been top-notch in where she has taken WEco. It has been really interesting because we have a diverse board, and I have enjoyed getting to know people who I didn’t know previously.
Screenshot of the Colorado-Big Thompson Project boundaries via Northern Water’s interactive mapping tool , June 5, 2019.
I understand you recently retired from Northern Water, can you tell me what your role with them was and maybe what Northern Water does in a general sense?
Northern Water is the largest water conservancy district in the state of Colorado and operates a large Bureau of Reclamation project that is one of the largest in the entire western United States; the Colorado-Big Thompson project. It brings a quarter-million acre-feet a year from the West Slope into Northeastern Colorado to supplement both urban and rural supplies, meaning that it is both a municipal as well as an agricultural water supply. Now there are well over a million people that get a portion of their water supply from that project, but back in 1937, there were only 50,000 people living within Northern Water’s boundaries. So, nobody could have foreseen the growth that occurred since then. This growth has brought all sorts of issues and concerns, but Northern Water is one of the top water agencies in the state and I certainly had a wonderful career there and couldn’t have asked for anything better.
Personally, I was a public information officer for 35 of those 38 years. My role, in essence, was to be the public face of Northern Water and so I talked about Northern Water and its activities all the time. I was able to use my historical training, I have a master’s degree in history, to discuss the historical background of both water development and Northern Water. I focused very much on education, but ultimately, I spent my entire career talking all things water, which was a lot of fun.
I was also the manager of our communications department as we expanded and grew. As we grew, we brought on writers and pushed publications and annual reports, and then we got into the social media craze. So, for some time I managed that department. But really, it was about telling people what Northern Water was all about.
The map above displays estimates of the likelihood of debris flow (in %), potential volume of debris flow (in m3), and combined relative debris flow hazard. These predictions are made at the scale of the drainage basin, and at the scale of the individual stream segment. Estimates of probability, volume, and combined hazard are based upon a design storm with a peak 15-minute rainfall intensity of 24 millimeters per hour (mm/h). Predictions may be viewed interactively by clicking on the button at the top right corner of the map displayed above. Map credit: USGS
Perhaps a topical question, but how have the numerous forest fires affected the work that Northern Water does in trying to ensure water storage?
That is going to be Northern Water’s principal focus this coming year. Both of our major watersheds burned last year, the Upper Colorado with the East Troublesome wildfire, and then the Poudre watershed with the Cameron Peak wildfire. And both of these watersheds are where we get the vast majority of our water. Luckily, Northern Water had been looking at forest water management for years. Northern Water has been working with the U.S. Forest Service, the counties, the Bureau of Reclamation, and the National Parks Service. It wasn’t that these fires hit us and Northern Water had no idea what to do. We learned quite a lot from Denver Water after the Hayman Fire, with all of the issues that they had centering around water quality. Northern Water isn’t pleased, but we are certainly going to see some water quality impacts because of these fires.
We went in with our eyes open and with some plans in place for post-fire activities. We always said, ‘it’s not if, it’s when those fires hit.’
What do these fires mean for water supply and water quality now, as well as moving into the future?
One of the things that we see from these fires is a greater level of awareness in terms of forest management, not just if you have a house in a forest or nearby, but for those people living in major metropolitan areas, too. Those people in Denver, Fort Collins, and Colorado Springs are all paying attention now, because they saw the two largest fires in Colorado history and what it did to our environment. And I think now there will be a lot more attention focused on the post-fire impacts, which obviously include water. People will certainly be paying attention to the water piece of the post-fire mitigation and clean-up. Overall, I think moving into the future we will have a better awareness, which is always a good thing. There is no way around it, it is going to take money, and where we are at with COVID-19 that discussion is not easy, but the state is making a concerted effort to put monetary resources and people into handling the situation.
First water through the Adams Tunnel. Photo credit Northern Water.
How the present or future storage planning is different than what the state has done historically?
One thing I would point out is that the Federal government is no longer in the water storage building business. For years Reclamation, which had been established in 1902 helped jumpstart and build water projects, as they did the Colorado-Big Thompson Project in the 1930s, ’40s and ’50s. The Federal government neither has the resources nor are they paying for water storage anymore. Now, water storage is something that is having to be more or less self-funded. Meaning that the growing cities are trying to figure out how they can finance additional water for their future citizens.
We are also now looking at the multiple uses of water. Nowadays, water is being used for environmental purposes, which means that we are looking to make sure that there is enough to release into the rivers to help the aquatic habitat. This is a much larger part of the picture today. At a base level of awareness, we want people to understand why we need storage reservoirs. It is a dry year, and it sure looks like we are only getting drier, and when you have the drier years you better make sure that you store when you have the wetter periods to carry you through. I think we are going to have difficulties trying to match up the storage, which we are going to continue to need, with all the environmental issues and issues surrounding the development of water infrastructure.
Northern Integrated Supply Project (NISP) map July 27, 2016 via Northern Water.
In the past 20 years, Northern has been in permitting so can you talk about that process?
We say water project permitting works at a glacial pace. When I started working on the Northern Integrated Supply Project permitting at Northern Water, I told my wife that I thought we would have a permit in around 5 years … I’m now retired. Northern Water is going on 17 years later, and they still haven’t received that permit. That’s frustrating. This wasn’t for lack of energy; I mean we were really working hard to secure that permit. These things take much longer than you would probably expect. You have to have a lot of perseverance because the process can really drive you crazy, but my hope is that in the future this process will become much better for all parties involved.
The view looking upstream on the Crystal River below Avalanche Creek. A Pitkin County group wants to designate this section of the Crystal as Wild & Scenic. CREDIT: CURTIS WACKERLE/ASPEN JOURNALISM
Colorado water shortage plays role in difficulty of securing designation
According to Crystal River valley resident Chuck Ogilby, there are three ways to protect rivers in Colorado. The first two involve using the state’s water court and water rights system. But the third is the one he places the most faith in.
“Who’s going to look after and be the parents, so to speak, of a free-flowing river? It’s the people,” Ogilby said. “The people of Colorado are the thing that will save our rivers. We have the right to fight for it the way we want, and we can advocate for free-flowing streams.”
Ogilby is one of a handful of river advocates in Pitkin County who are reviving a grassroots effort to secure a federal Wild & Scenic designation on the Crystal. But in a state where the value of water is tied to its use, and landowners’ fear of federal government involvement stokes opposition, a campaign to leave more water in the river for the river’s sake may face an uphill battle.
Proponents want protection of 39 miles of river from the headwaters of both the north and south forks, in the Maroon Bells-Snowmass Wilderness, to the Sweet Jessup headgate, the first major agricultural diversion on the lower end of the river. Advocates have three goals: no dams on the main stem, no diversions out of the basin and protection of the free-flowing nature of the river. As the Crystal is one of the last undammed rivers in Colorado, they want to keep it that way.
“I can’t tell you what the experience of walking up to a river and being on the river, whether I catch fish or not, does to me,” Ogilby said. “I can’t put it into words. It’s, I want to say, a religious experience. It’s very emotional.”
Crystal River Valley resident Chuck Ogilby on the banks of the river near the confluence with Avalanche Creek. Ogilby believes a Wild & Scenic designation on the Crystal is the best way to protect it from dams and out-of-basin diversions. CREDIT: HEATHER SACKETT/ASPEN JOURNALISM
A history of development plans and pushback
The Wild & Scenic River Act of 1968 brings protection from development. For example, new dams cannot be constructed on a designated stretch, and federal water-development projects that might negatively affect the river are not allowed. The National Wild & Scenic Rivers System seeks to preserve rivers with outstandingly remarkable scenic, recreational, geologic, fish and wildlife, historic and cultural values in a free-flowing condition.
There are three categories under a designation: wild, which are sections that are inaccessible by trail, with shorelines that are primitive; scenic, with shorelines that are largely undeveloped, but are accessible by roads in some places; and recreational, which are readily accessible by road or railroad and have development along the shoreline.
The U.S. Forest Service determined that the Crystal, which flows through both Gunnison and Pitkin counties, was eligible for designation in the 1980s and reaffirmed that finding in 2002. There are four segments being proposed: about seven miles of the north fork inside the wilderness boundary would be classified as wild; from the wilderness boundary on the north fork to the junction of the south fork, about two miles, would be classified as scenic; from the headwaters of the south fork through its confluence with the north fork and on to Beaver Lake, about 10 miles, would also be scenic, and from Beaver Lake to the Sweet Jessup headgate, about 20 miles, would be recreational. The outstandingly remarkable values are scenic, historic and recreational.
In 2012, conservation group American Rivers deemed the Crystal one of the top 10 most endangered rivers. This was spurred by plans from the Colorado River Water Conservation District and the West Divide Conservation District to renew their conditional water rights for nearly 200,000 acre-feet worth of storage in the form of Placita and Osgood reservoirs. Osgood would have inundated Redstone.
The dam and reservoir projects were eventually abandoned after they were challenged in water court by Pitkin County, but the memory of the threat lingered for river activists, who decided to actively pursue a Wild & Scenic designation in 2012, with the goal of eliminating the possibility of this type of development in the future.
The group shelved the discussion with the presidential election of Donald Trump in 2016. Some trace the moment they realized they were temporarily defeated to a community meeting in Marble and subsequent opinion piece by former director of the Bureau of Land Management William Perry Pendley. A 2016 column for the conservative Washington Times, which also ran in Western Ag Reporter, titled “When ‘wild and scenic’ spells trouble,” stoked fear among landowners in the town of Marble and Gunnison County that a designation means the federal government has power over private property.
“There were some mistruths spread in Marble that really moved them in the wrong direction from my perspective,” said Matt Rice, director of American Rivers’ Colorado Basin Program.
But the meeting was enough for the opposition to gain ground. If the town of Marble wouldn’t support the designation, neither would Gunnison County. The proposal was dead in the water.
Larry Darien was one of those opponents in 2016. He remains opposed to the Wild & Scenic proposal this time around because he said federal involvement in river management could bring unintended consequences. Darien owns a ranch on Gunnison County Road 3 that borders the Crystal.
“Whatever they come up with probably looks real good until you end up with something you didn’t bargain for,” he said. “I don’t want the federal government having anything to do with my property.”
Darien said he doesn’t want to see dams or reservoirs on the Crystal either, but a federal designation is not the right way to go about preventing that. He would support a designation of the headwaters that flow through the wilderness, but would prefer if private property owners downstream along the river were left out of it.
The Crystal River near the town of Marble forms a wetland area. A Pitkin County group wants to designate this section of the Crystal as Wild & Scenic. CREDIT: CURTIS WACKERLE/ASPEN JOURNALISM
Wild & Scenic Act
While the Wild & Scenic Rivers Act does give the federal government the ability to acquire private land, there are many restrictions on those abilities. Condemnation is a tool that is rarely used. The legislation written for each river is unique and can be customized to address stakeholders’ values and concerns.
White River National Forest Supervisor Scott Fitzwilliams has worked on Wild & Scenic designations in Oregon, where there are more than 65 sections of designated rivers. He said that in the next step of the process, which would be a suitability determination and an Environmental Impact Statement by the Forest Service, the protection of private property rights would be paramount.
“I’ve often said that if they changed the name to ‘leave the river as it is act,’ which is really what it does, people would be less concerned,” Fitzwilliams said.
Although Wild & Scenic supporters initially squabbled about the best way to address opposition — some said engaging staunch opponents was like inviting a wolf into the hen house — most now agree the best way forward is to bring them into the conversation early.
Pitkin County Commissioner Kelly McNicholas Kury is heading up a steering committee, which will decide how to proceed with the campaign. Pitkin County supports Wild & Scenic and commissioners have allocated an additional $100,000 to the Healthy Rivers board to work on getting a designation.
Committee members are tight-lipped about their strategy moving forward, and have not yet laid out a plan for spending the money, but many are eager to not repeat what they view as the mistakes from the first time around. McNicholas Kury stresses that this time the group will engage any and all stakeholders who want to participate in the process, even and especially those who have been vocally opposed to a federal designation. She said the group will probably hire a neutral facilitator to direct the process and bring all the perspectives to the table.
“The challenge will be ensuring we will reach all the interested parties and they will have a meaningful opportunity to contribute to what the final designations and river protections will be,” McNicholas Kury said. “It may require personally knocking on someone’s door and saying, ‘we need to hear from you.’”
Darien said he would be interested in participating in a stakeholder process, but that so far no one from the advocacy group or Pitkin County has reached out to him.
Avalanche Creek flows into the Crystal River north of Redstone near Avalanche Ranch. A group of Pitkin County river advocates are gearing up for another attempt at getting a Wild & Scenic designation on the Crystal. CREDIT: HEATHER SACKETT/ASPEN JOURNALISM
Colorado protective of water use
Despite its renowned river rafting, fishing and scenic beauty, which contribute to the recreation-based economy of many Western Slope communities, Colorado has just 76 miles of one river — the Cache La Poudre — designated as Wild & Scenic. That’s less than one-tenth of 1% of the state’s 107,403 river miles, according to the National Wild and Scenic Rivers System website.
By comparison, Oregon — a state with a contentious history of clashes between ranchers and the federal government over land management — has 110,994 miles of river, of which 1,916.7 miles are designated as wild & scenic—almost 2% of the state’s river miles.
Instead of backing the federal designation on its rivers, the state of Colorado instead funds a program for an alternative designation that carries some of the same protections as Wild & Scenic. In June of 2020, the Bureau of Land Management and the Forest Service approved an alternative management plan on the Upper Colorado River which takes the place of a Wild & Scenic designation. The process took 12 years and involved cooperation between many stakeholders.
Experts say the main reason there is opposition from water managers to Wild & Scenic in Colorado is not fear of a federal land grab, but the shortage of water in an arid state that is only getting drier with climate change. Fitzwilliams called water “the most valuable commodity in Colorado, without question.” A designation would lock up water in the river, making it unavailable for future development.
“In these very, very arid states where we just don’t have the water, we are very protective of making sure that water is available for all public uses,” said Jennifer Gimbel, interim director of Colorado State University’s Water Center and former director of the Colorado Water Conservation Board. “As we try to figure out how to manage the drought, we want to maybe figure out better how to move water from here to there and that Wild & Scenic designation would play a big part in that for better or for worse.”
The two main ways to ensure water stays in the river in Colorado are instream flow rights and recreational in-channel diversion water rights. Instream flow water rights are a minimum streamflow set by the Colorado Water Conservation Board with the goal of preserving the natural environment to a reasonable degree. A recreational in-channel diversion creates a water right for a recreational experience, like the waves in the Basalt whitewater park.
But Ogilby says these state protections don’t go far enough for the Crystal.
“We have to be able to convince people that getting it out of the Colorado adjudication system is the way we are going to ultimately protect it,” he said. “We are not going to save it with Colorado water law. We’ve got to get a (federal) overlay.”
Fears of development have recently returned in response to a study of a back-up water supply plan for the Crystal, undertaken by the same conservation districts who were behind the dam projects. The results aren’t in yet, but the study could find the need for storage to meet the demands of downstream water users in dry years.
A view of the former coal mining village of Placita, with the upper Crystal River winding along the valley floor as seen from from Colorado 133 as it climbs up McClure Pass. CREDIT: BRENT GARDNER-SMITH/ASPEN JOURNALISM
Early indications of support
The next few months will be crucial for the steering committee as they chart a path forward and decide how best to spend the money from Pitkin County. Broad-based local support is critical and there is some evidence the idea of Wild & Scenic is gaining ground.
As part of her capstone project in sustainable studies at Colorado Mountain College, Carbondale resident Monique Vidal is conducting an online survey about recreation on the Crystal River. So far, she has received about 65 responses, about 95% of which support moving forward with Wild & Scenic legislation.
“Our community overwhelmingly so far is supportive,” Vidal said.
Ogilby owns Avalanche Ranch, a small hot springs resort near the Crystal River just north of Redstone. He has spent much of his life advocating for rivers in the Vail Valley and Crystal River valley, and has helped defeat plans for Front Range water providers to take more from the headwaters of the Colorado River. He served for years on the Colorado Basin Roundtable as a representative of Eagle County and is now a member of Pitkin County’s Healthy Rivers board.
“I felt a little frustrated being on the roundtable because our position didn’t always gain ground,” he said. “We were up against the big boys. When I came over here, I feel this is my home. And maybe I can’t change everything about all the rivers in Colorado, but maybe I can make a real difference on the Crystal.”
For Wild & Scenic proponents, the clock is now ticking if they hope to get a designation while there is a Democratic administration under President Joe Biden. Ogilby said he feels a sense of urgency.
“Everybody feels that,” he said. “It feels like, oh my god, we have been blessed so let’s get after it. We are going to be pushing.”
Aspen Journalism covers water and rivers in collaboration with The Aspen Times and Swift Communitications publications. This story ran in the May 17 edition of The Aspen Times.
In response to forecast increasing runoff and flows in the critical habitat reach, the Bureau of Reclamation has scheduled a decrease in the release from Navajo Dam from 400 cubic feet per second (cfs) to 300 cfs on Tuesday, May 18th, starting at 0400 AM. Releases are made for the authorized purposes of the Navajo Unit, and to attempt to maintain a target base flow through the endangered fish critical habitat reach of the San Juan River (Farmington to Lake Powell).
The San Juan River Basin Recovery Implementation Program recommends a target base flow of between 500 cfs and 1,000 cfs through the critical habitat area. The target base flow is calculated as the weekly average of gaged flows throughout the critical habitat area from Farmington to Lake Powell. Please be advised, due to the dry conditions this year, more release changes than usual may occur.

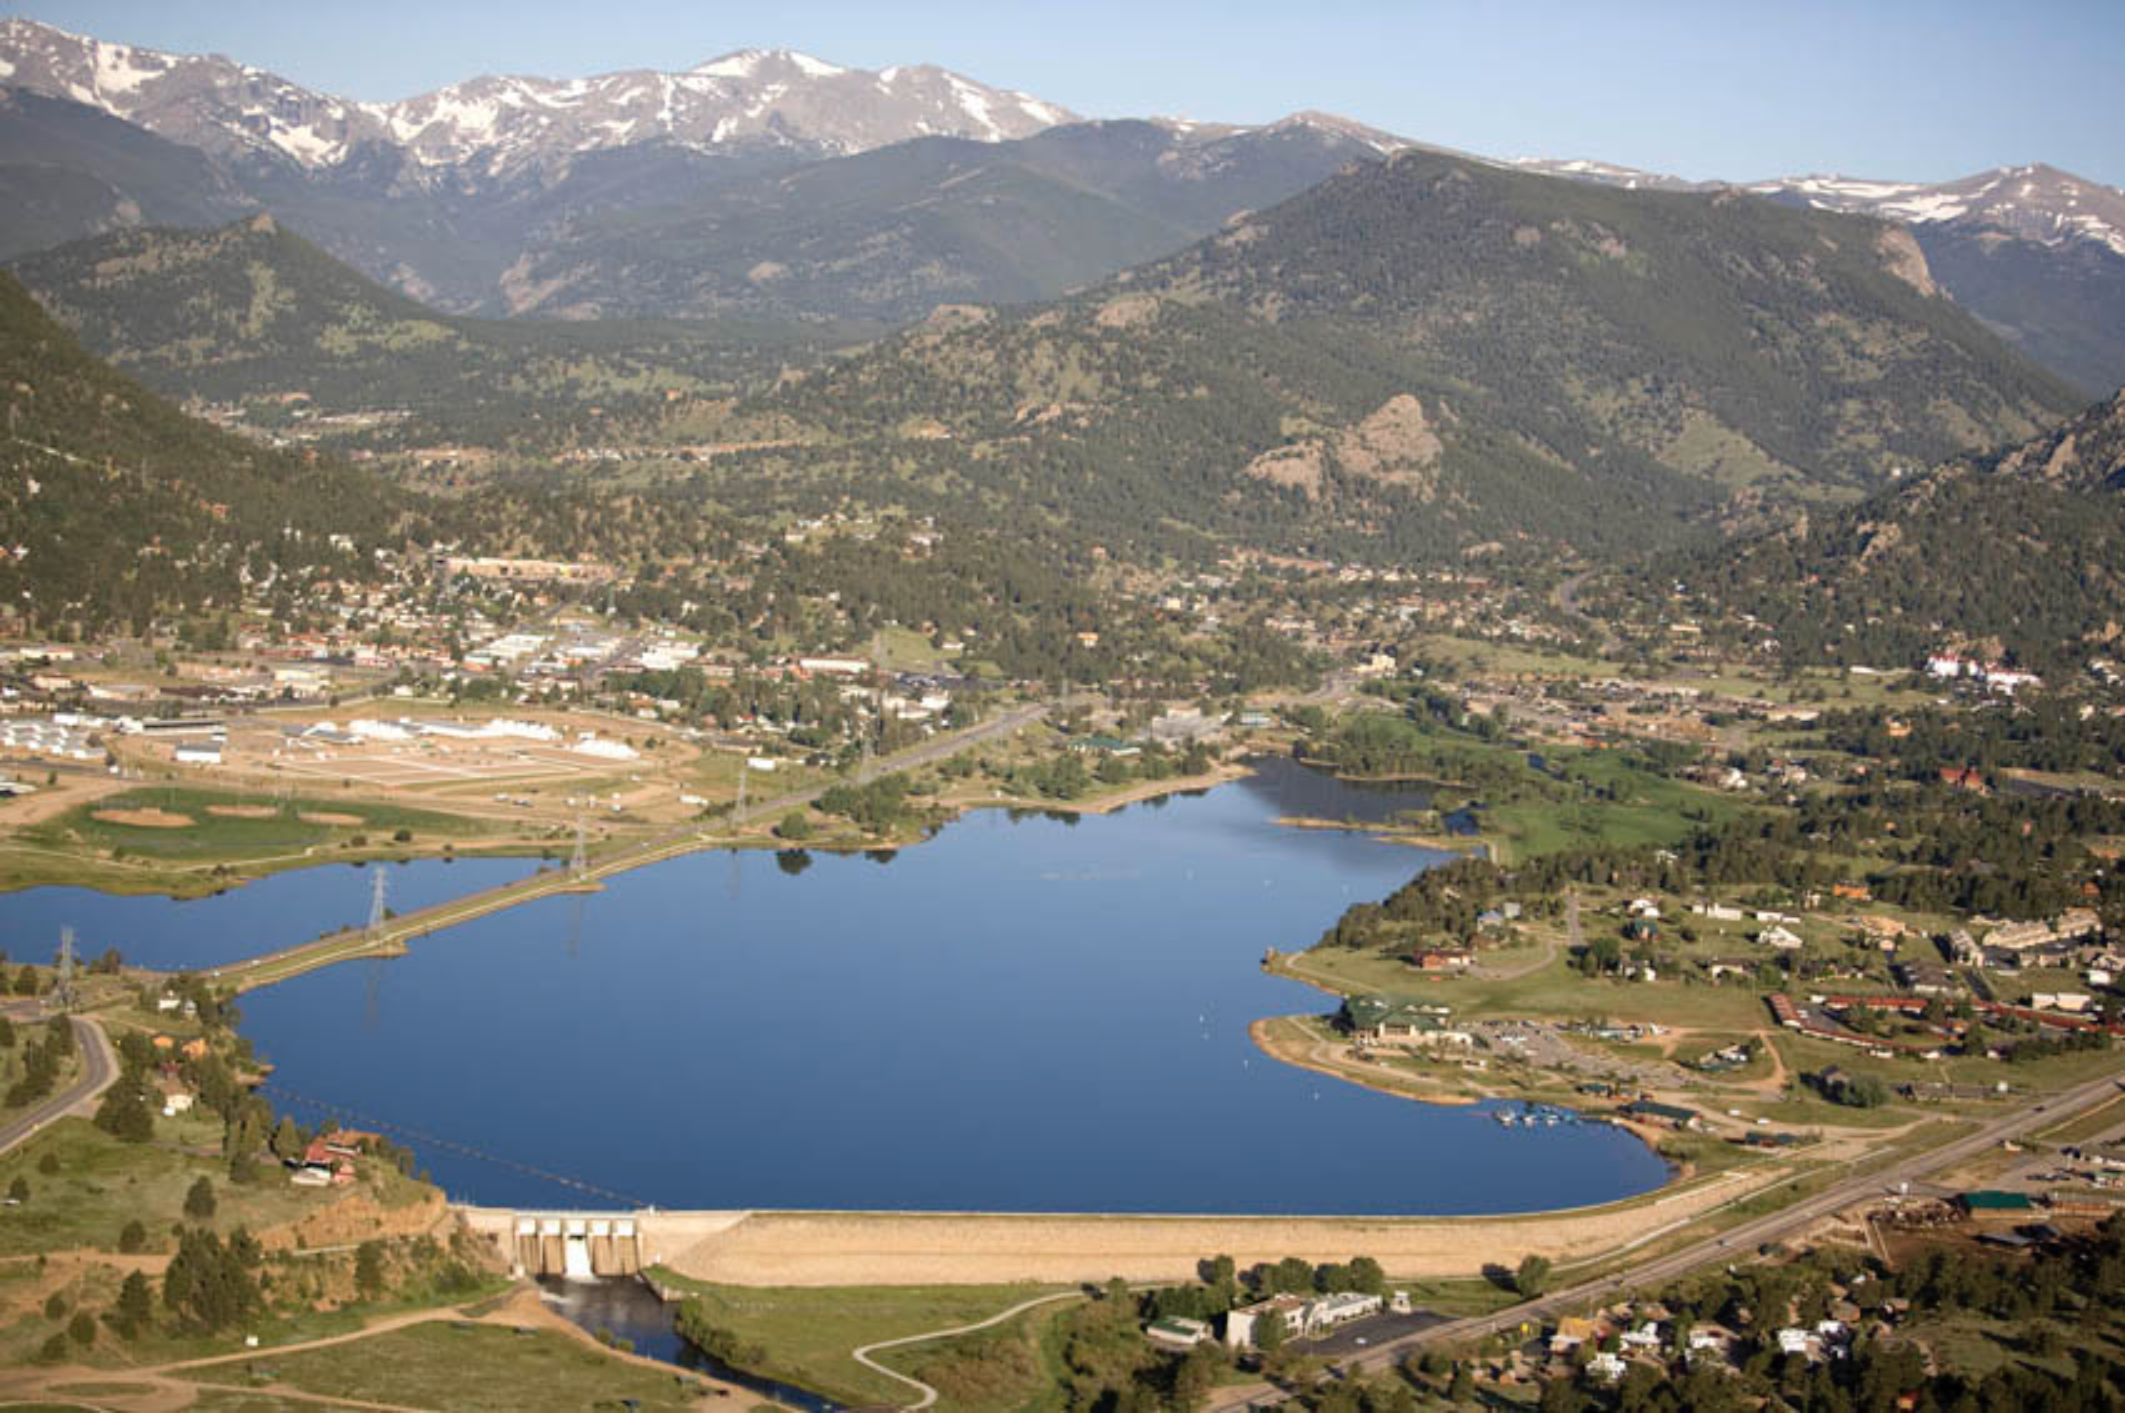
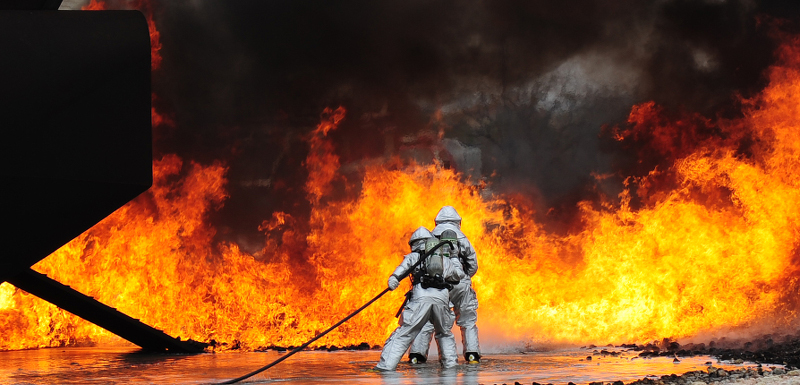
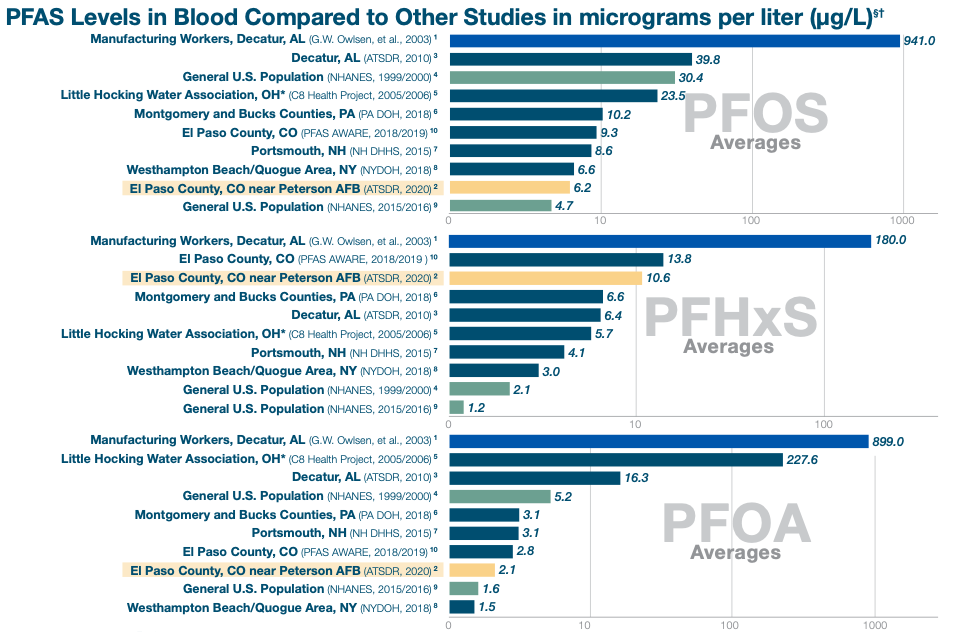
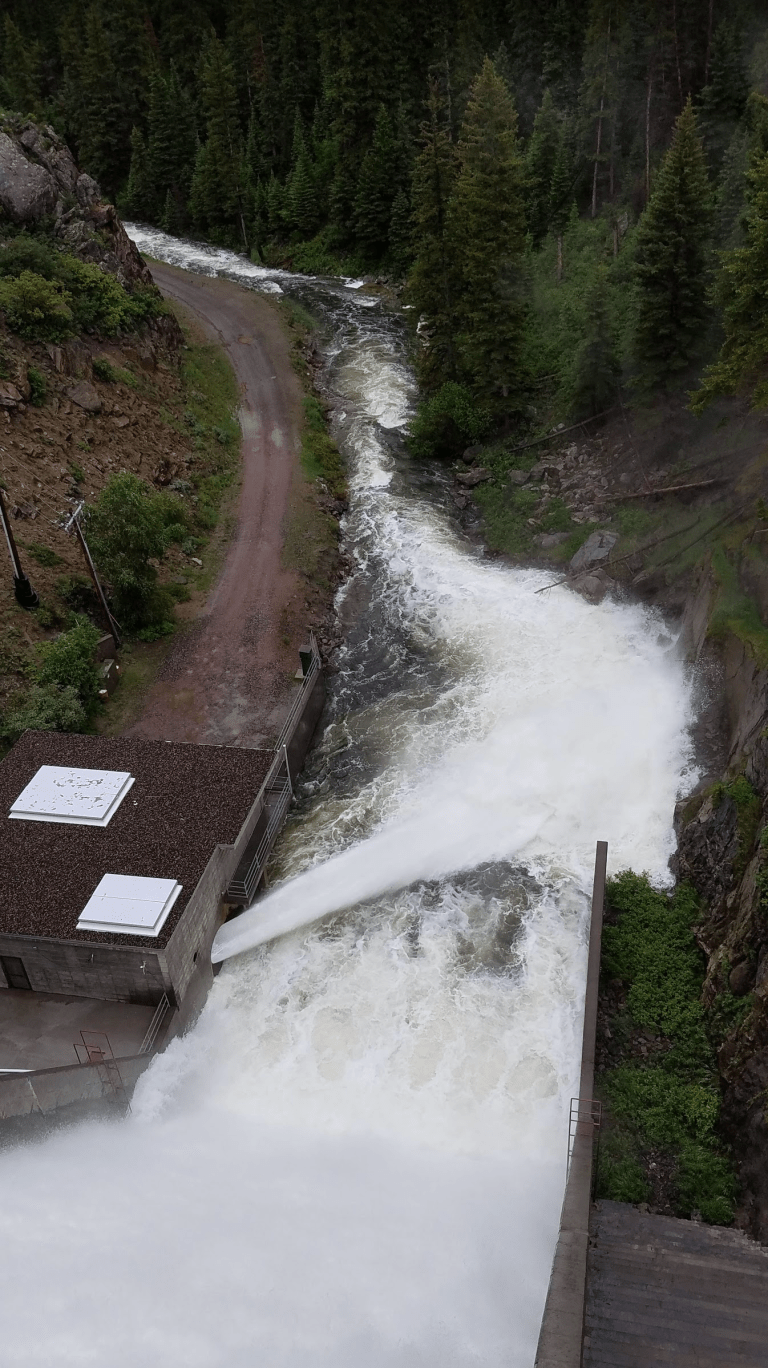


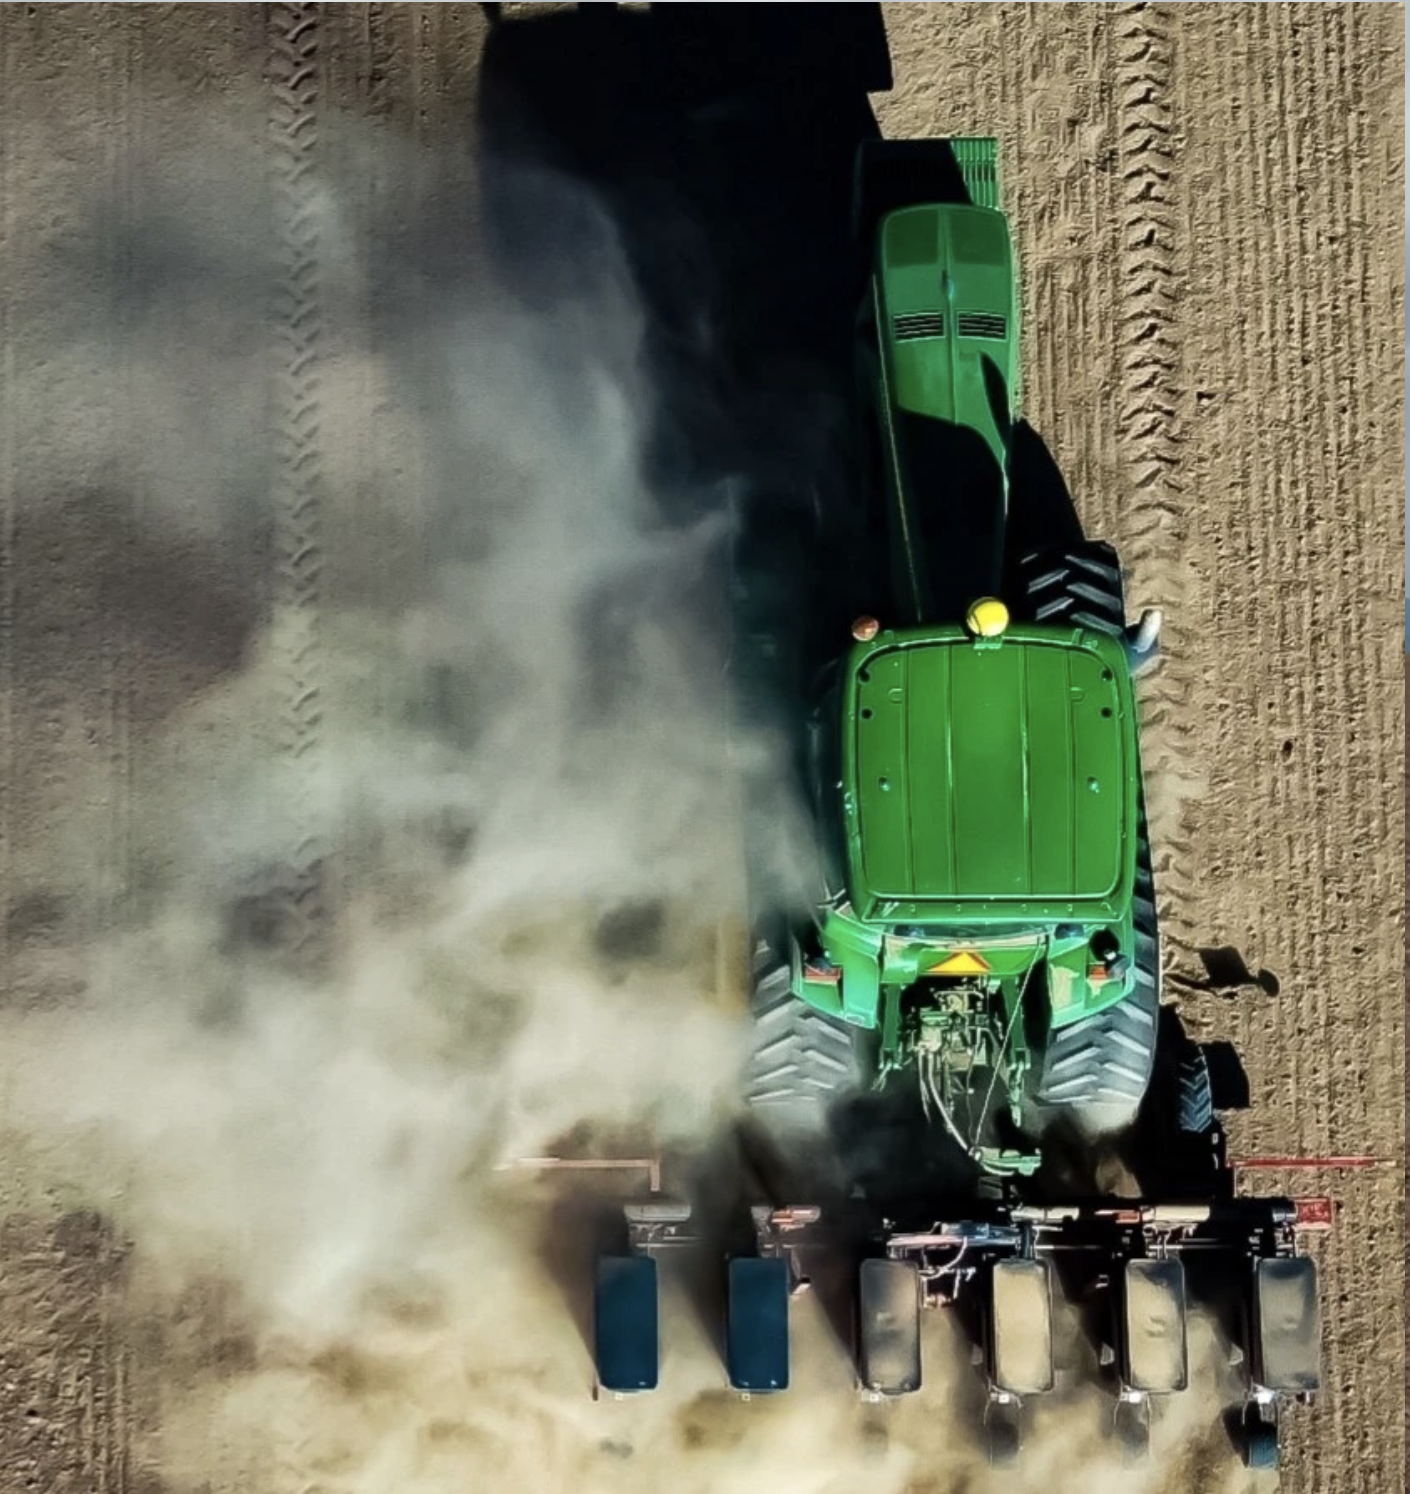
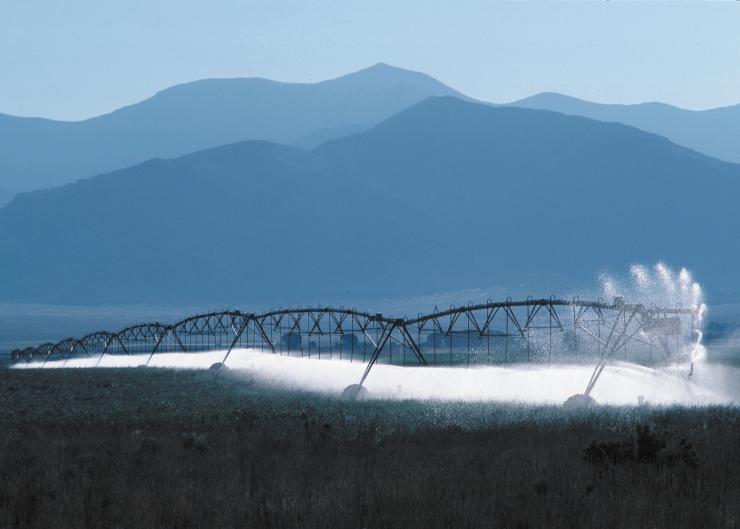

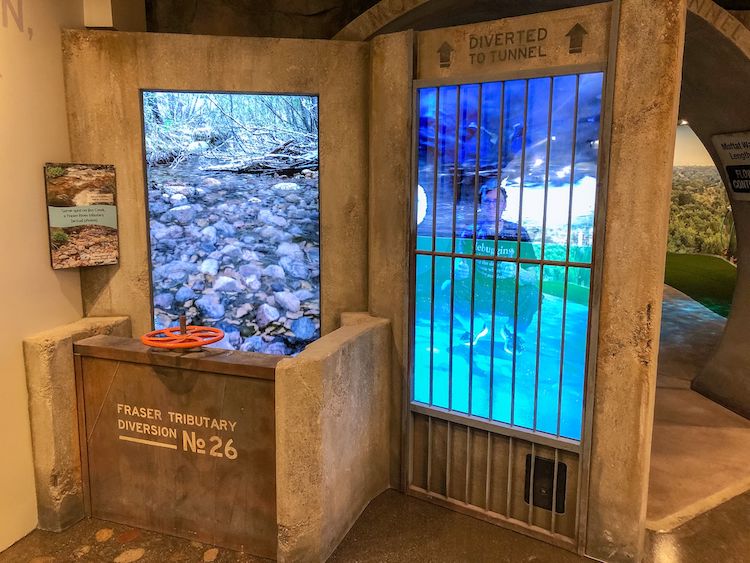


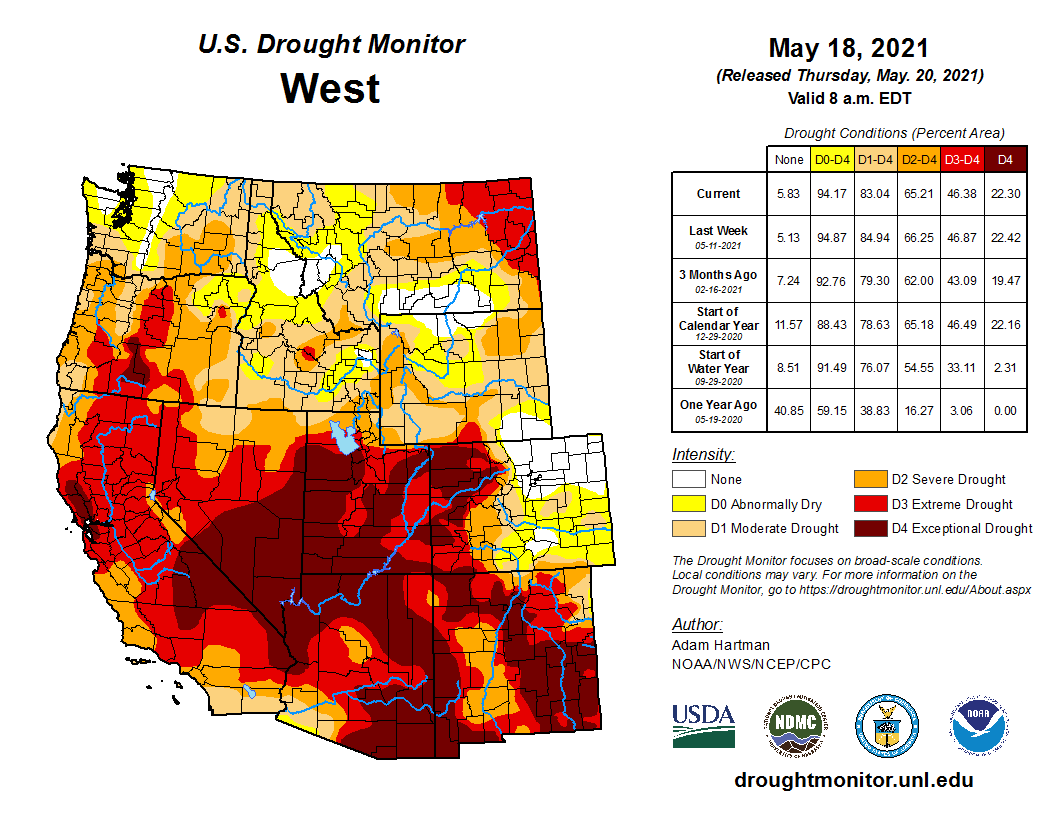


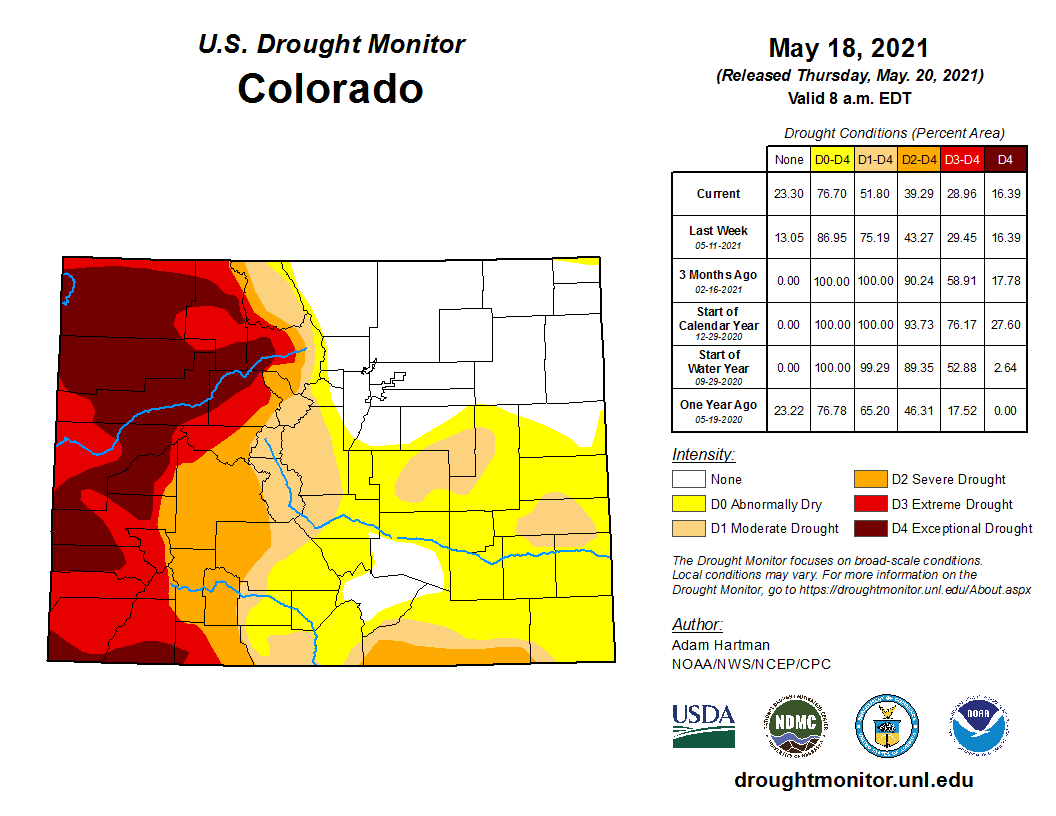
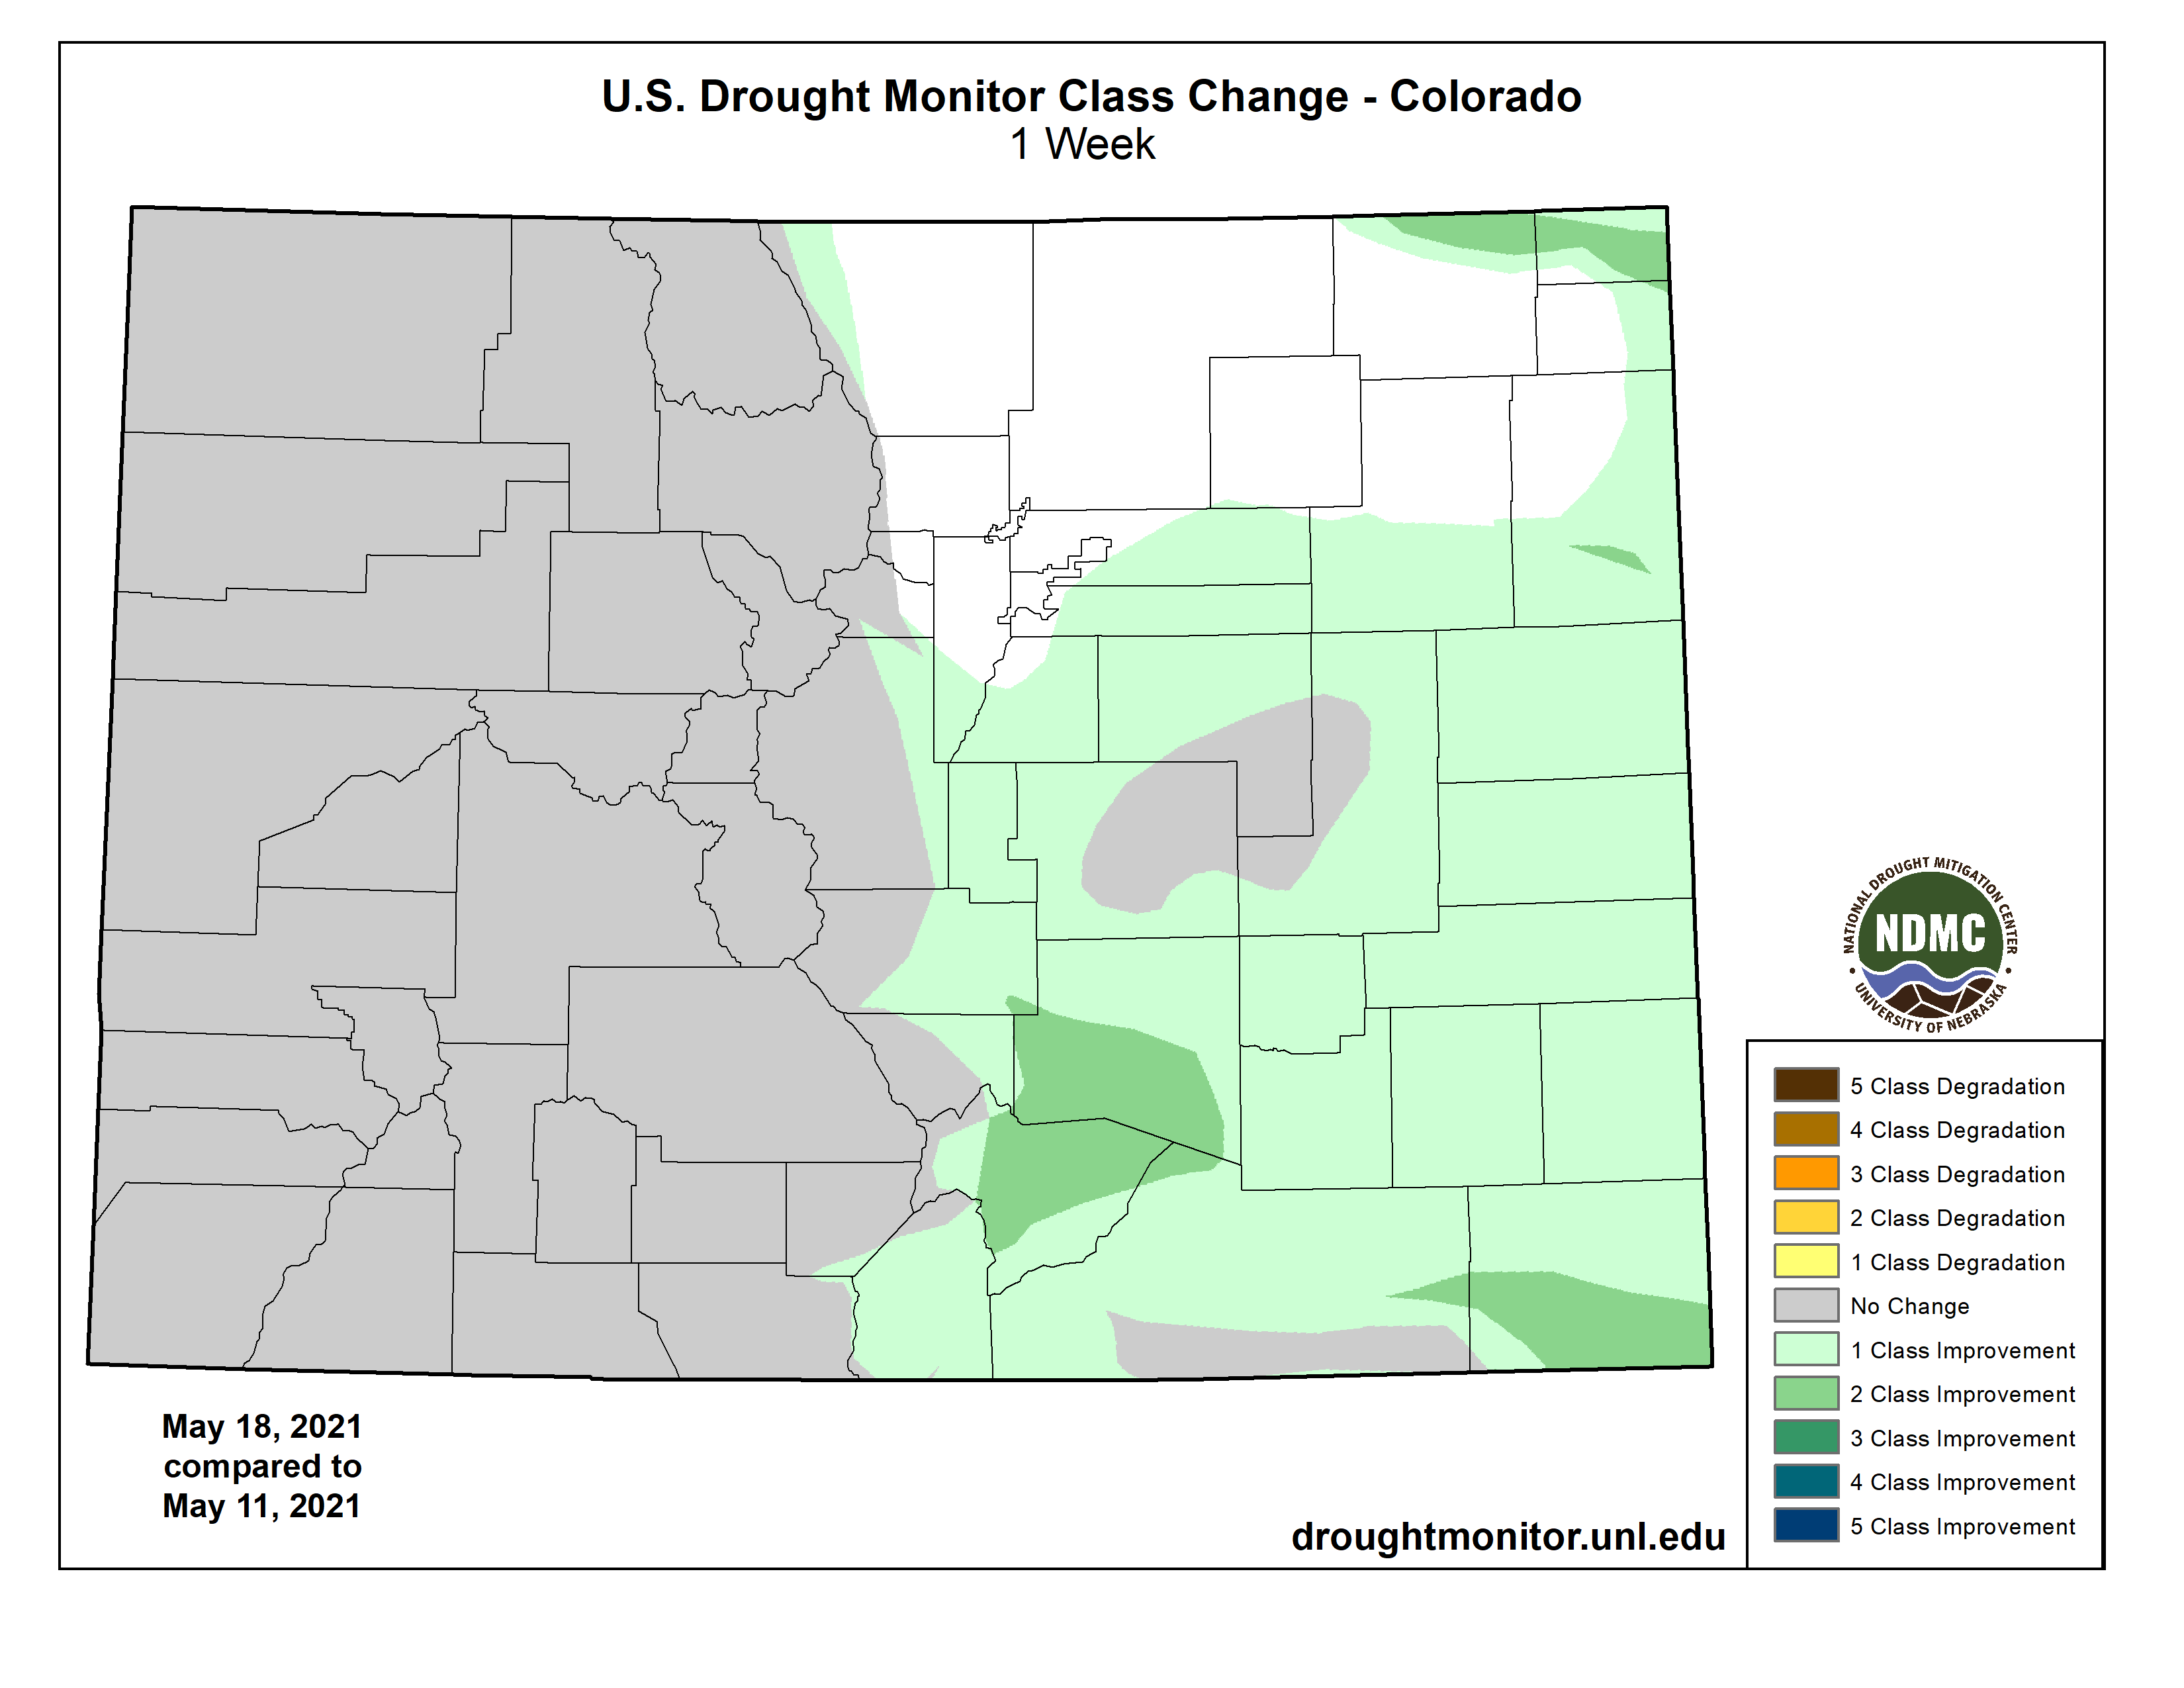
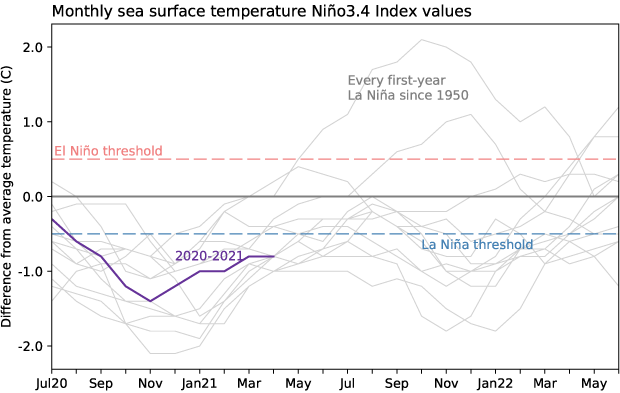
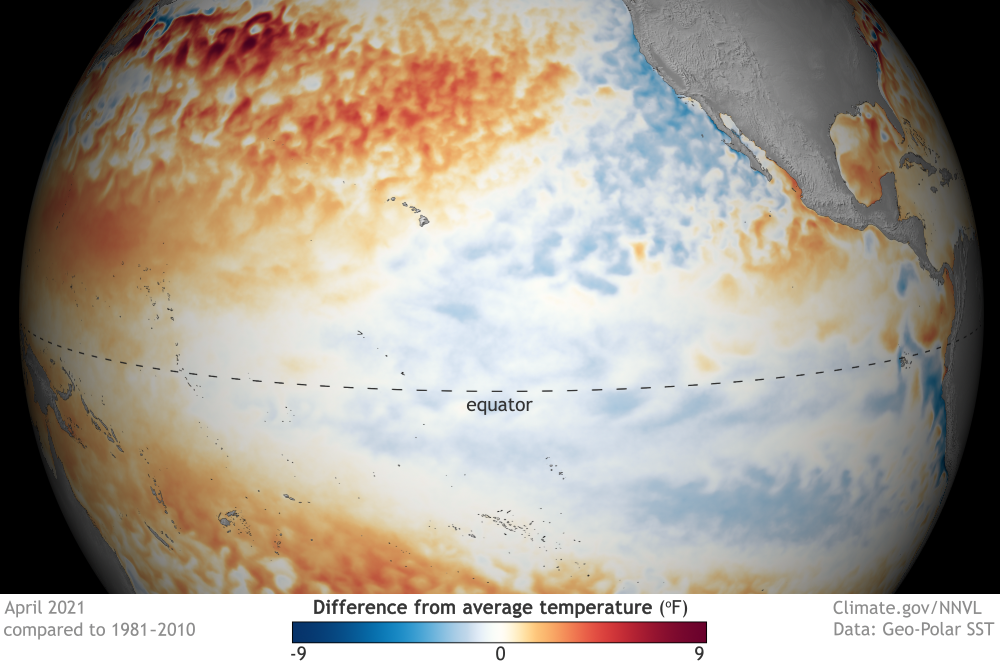

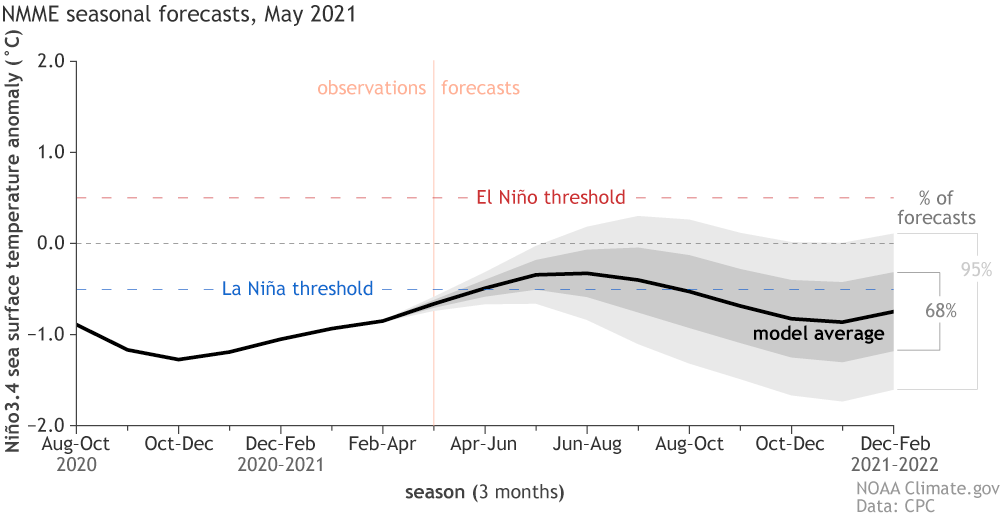

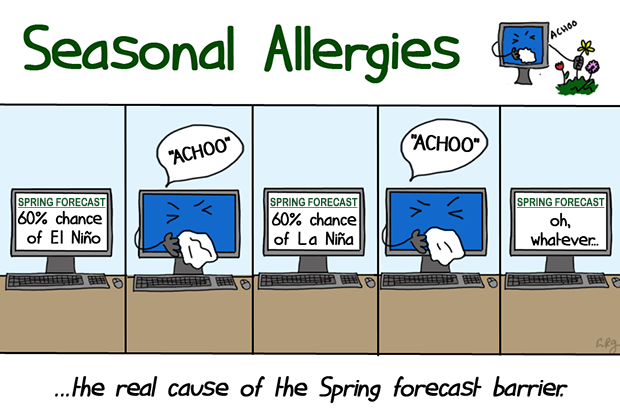
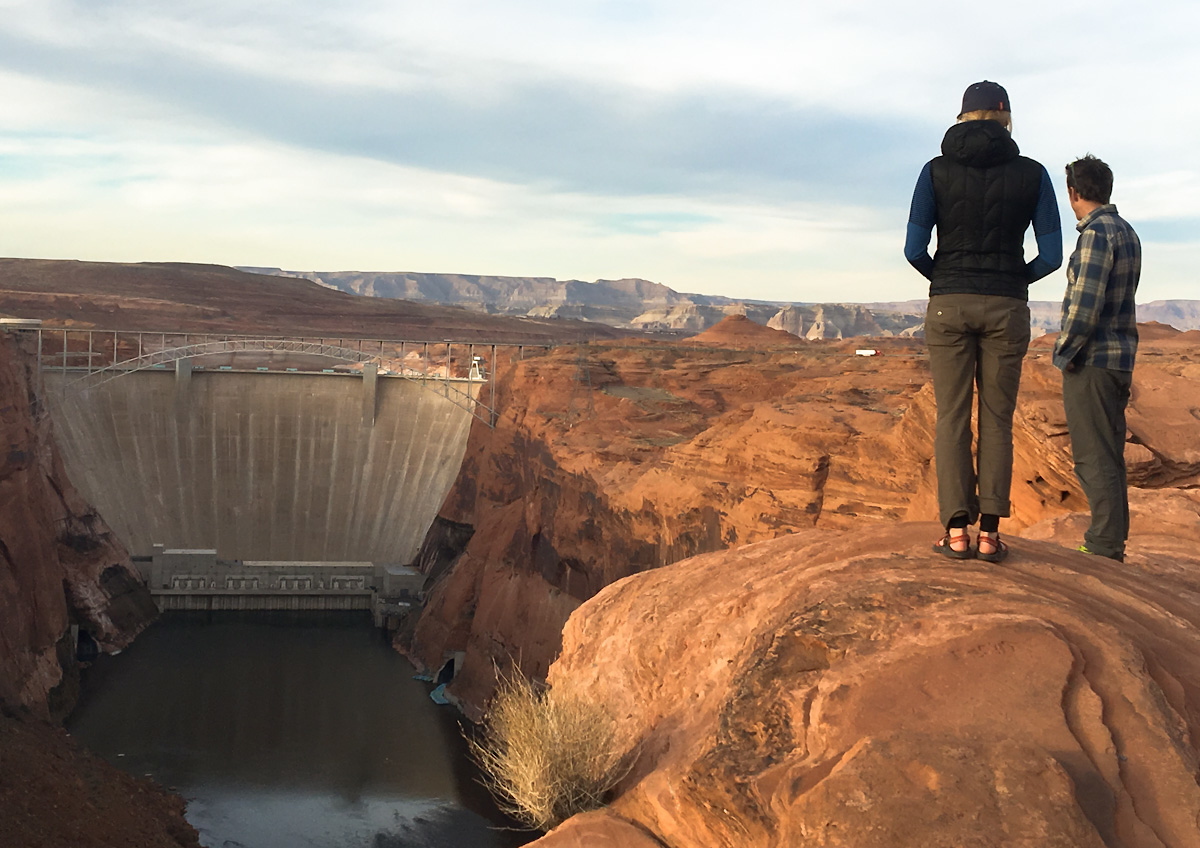


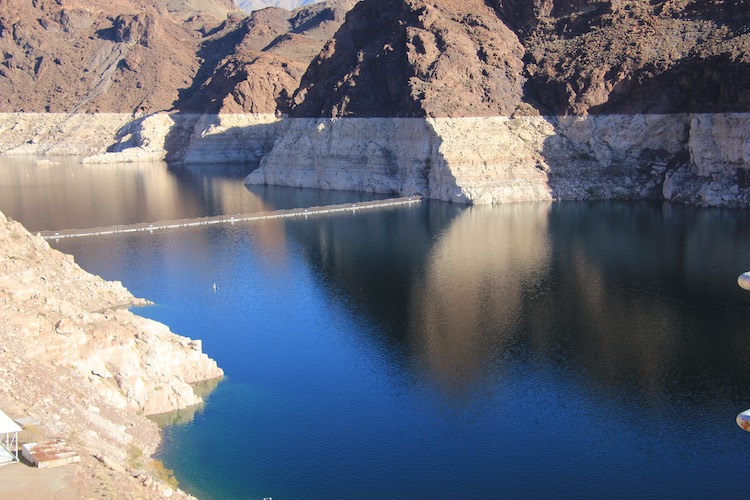

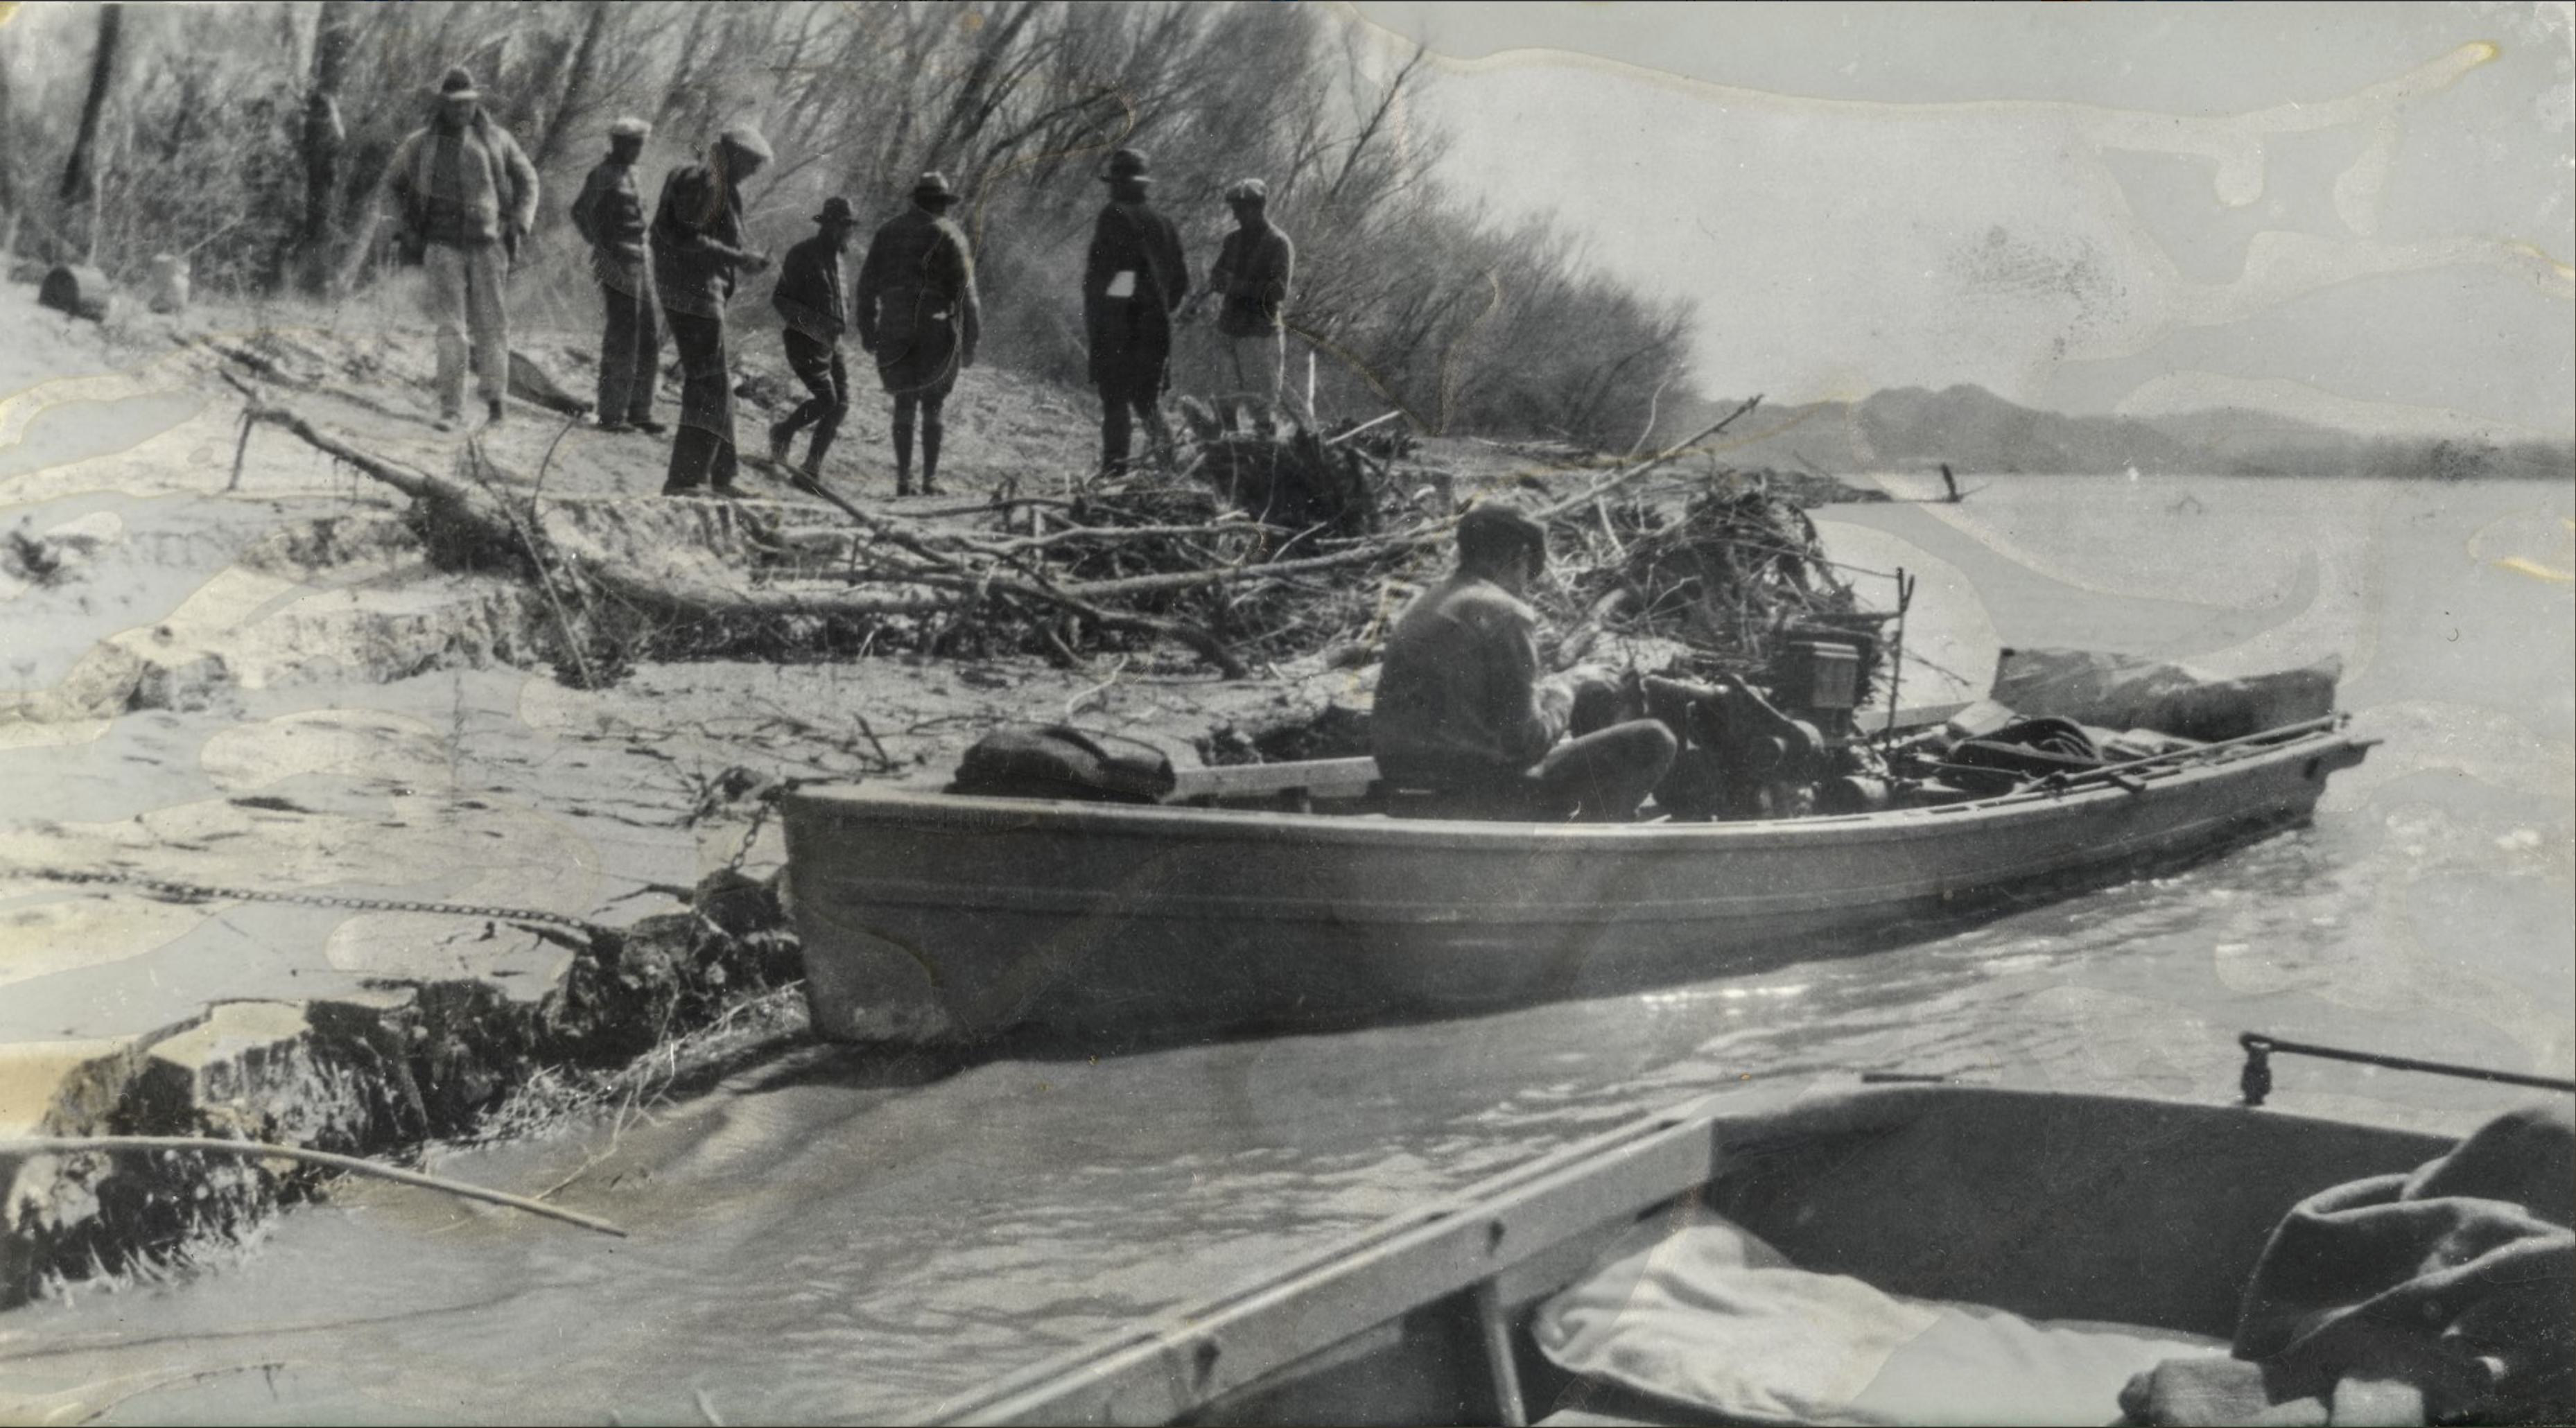
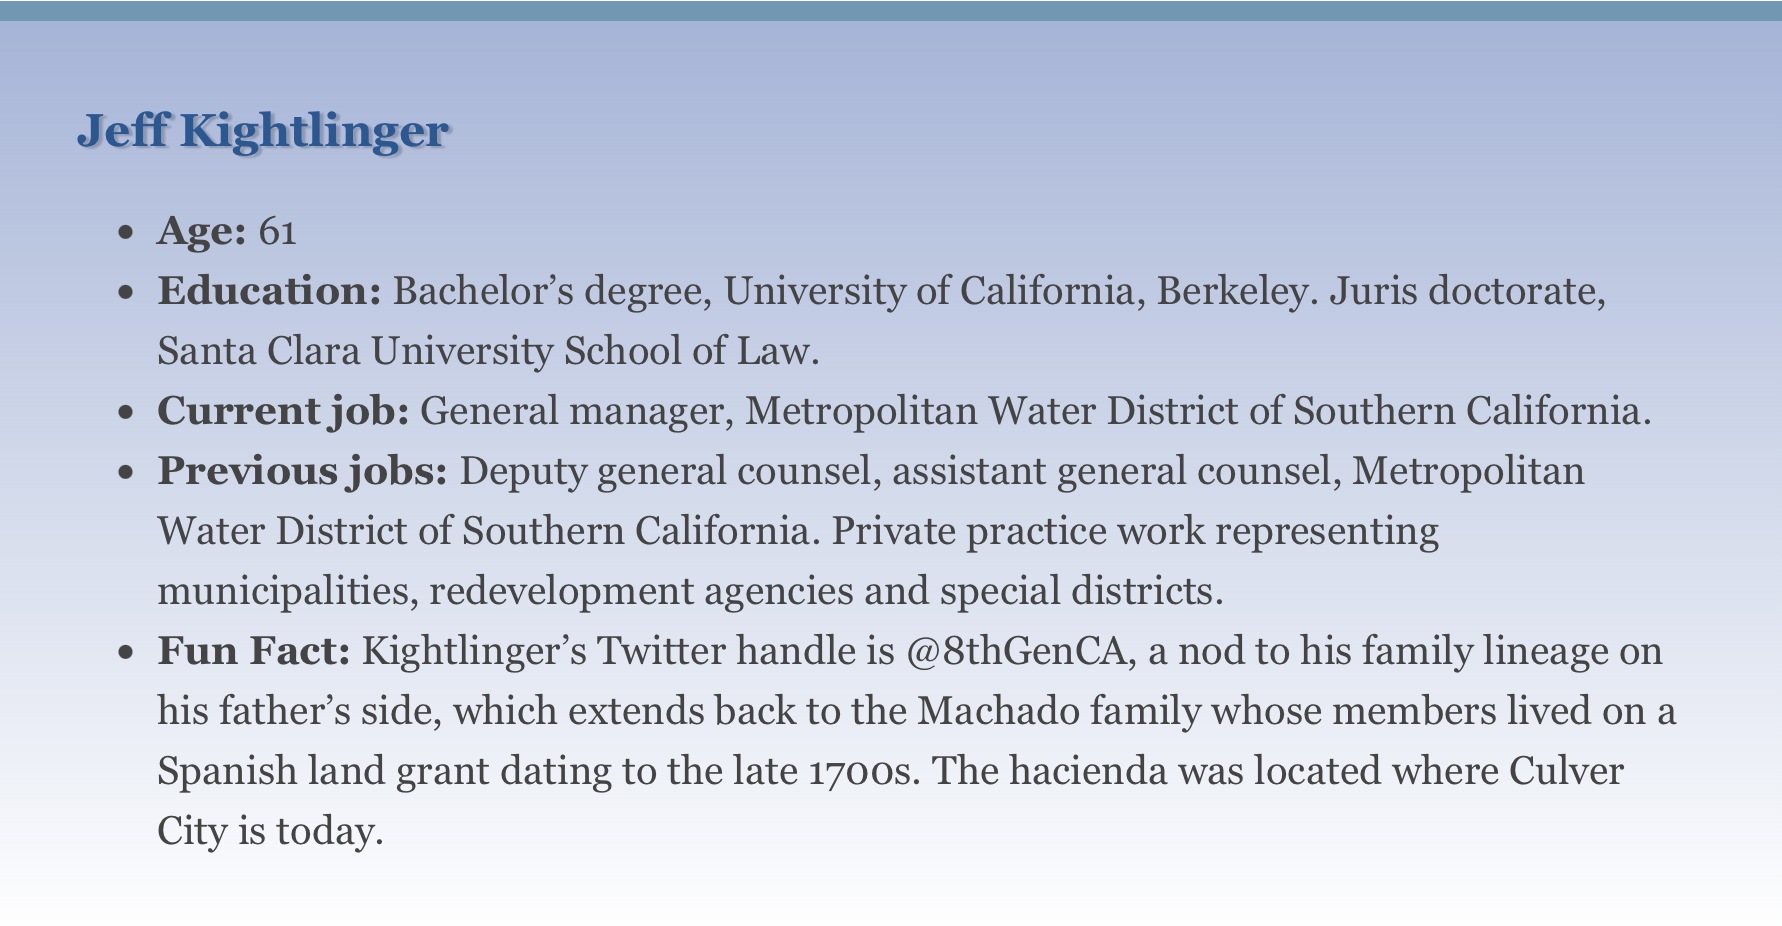

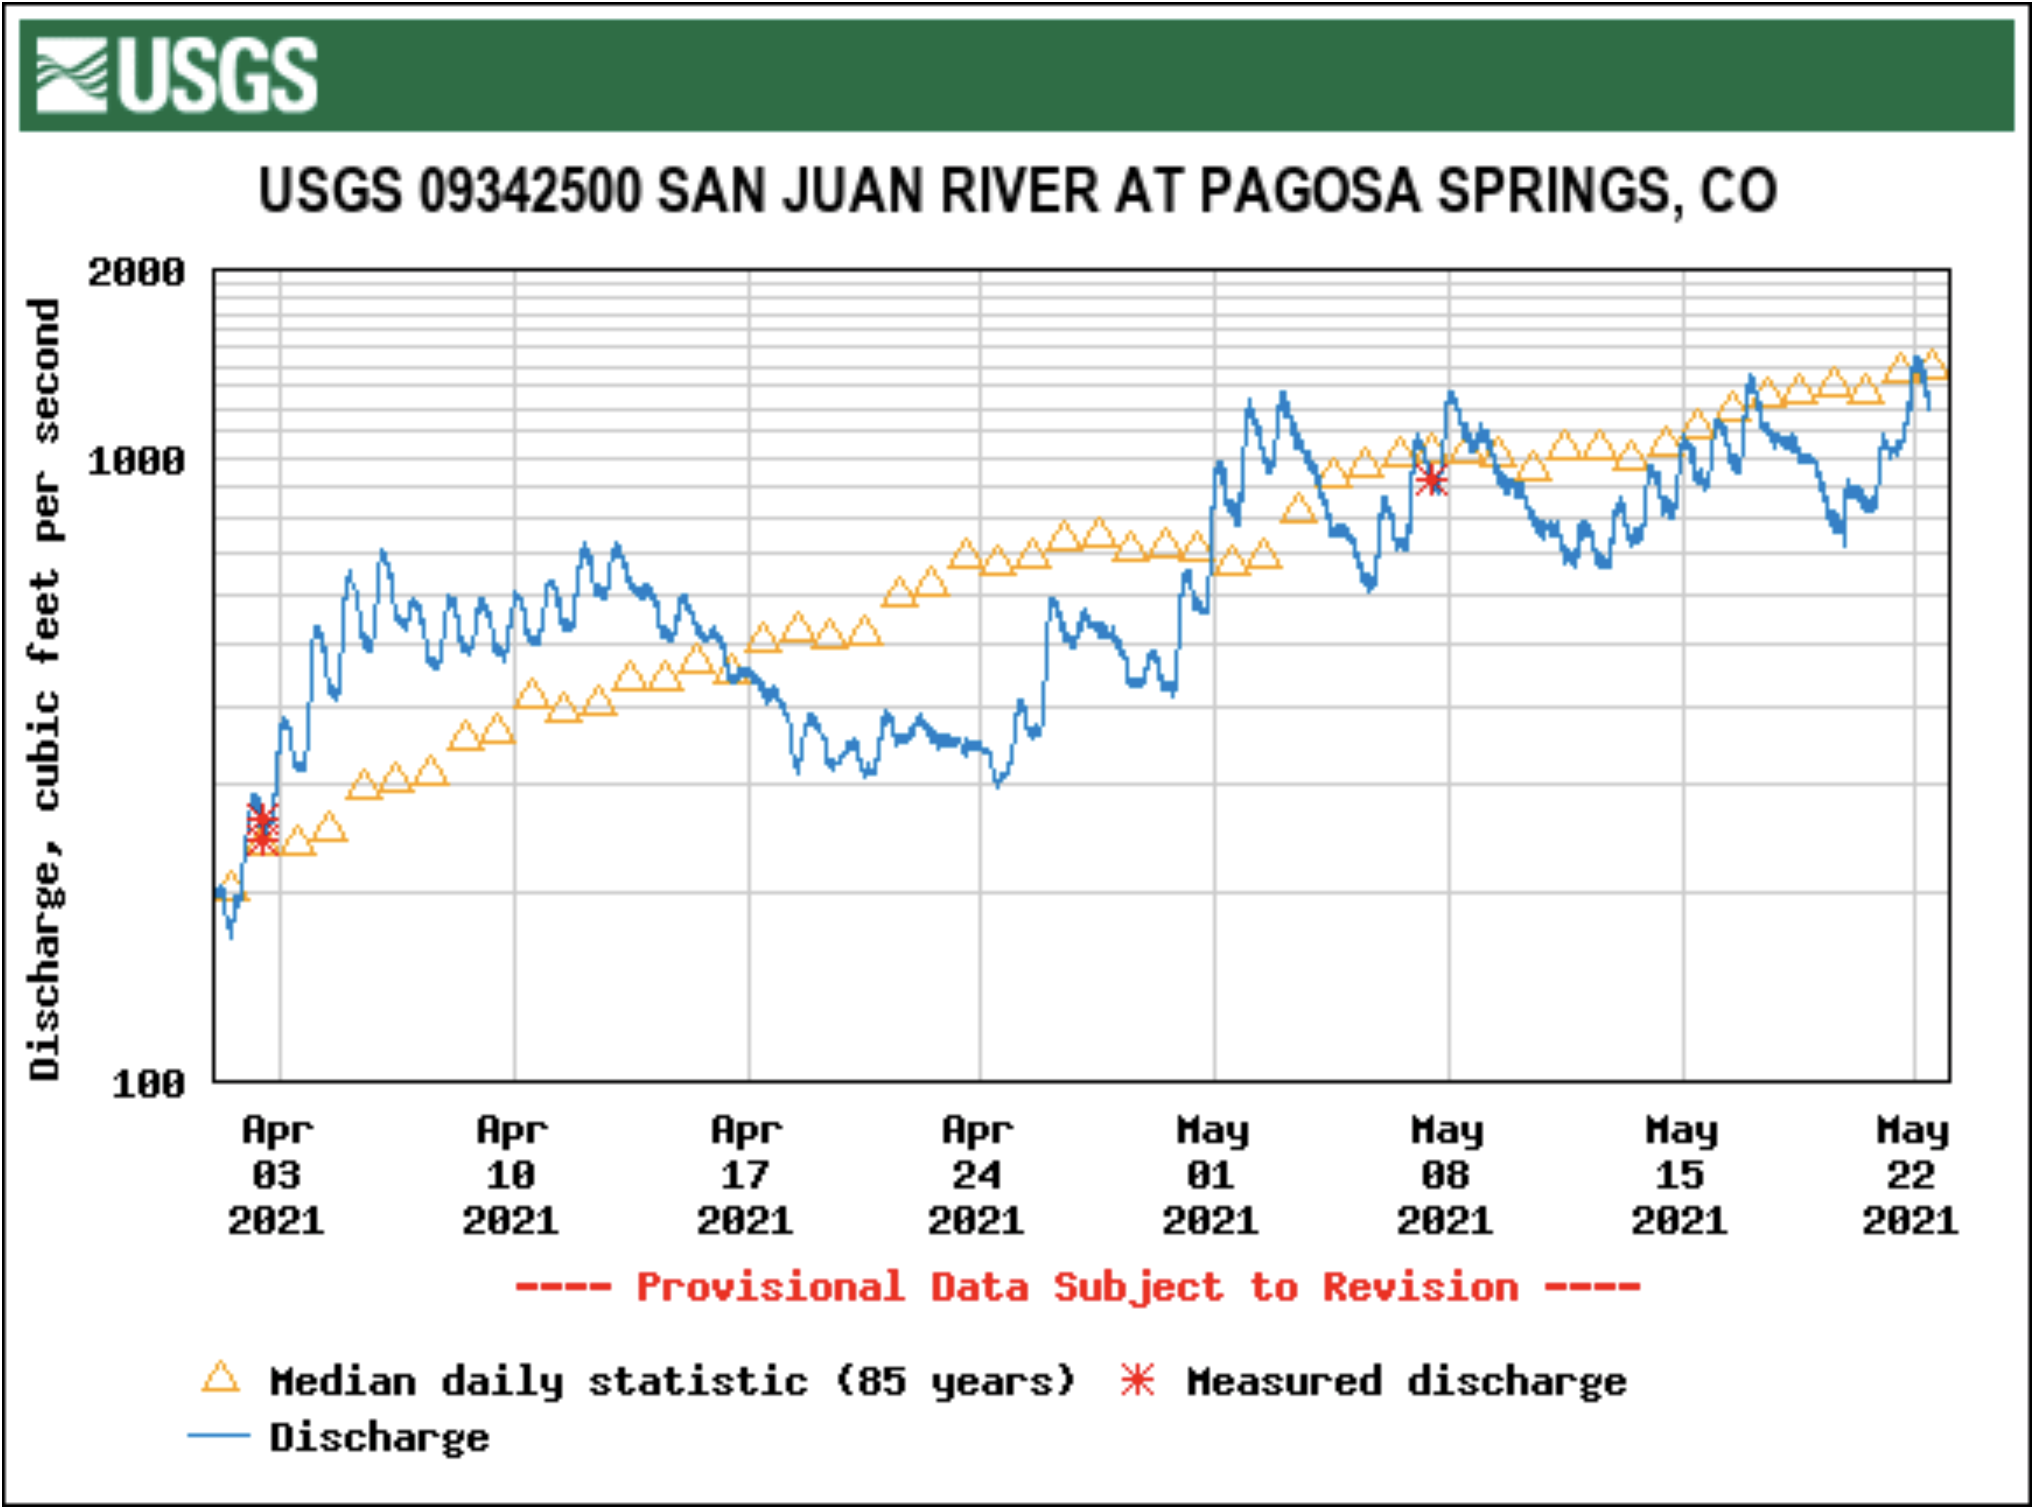
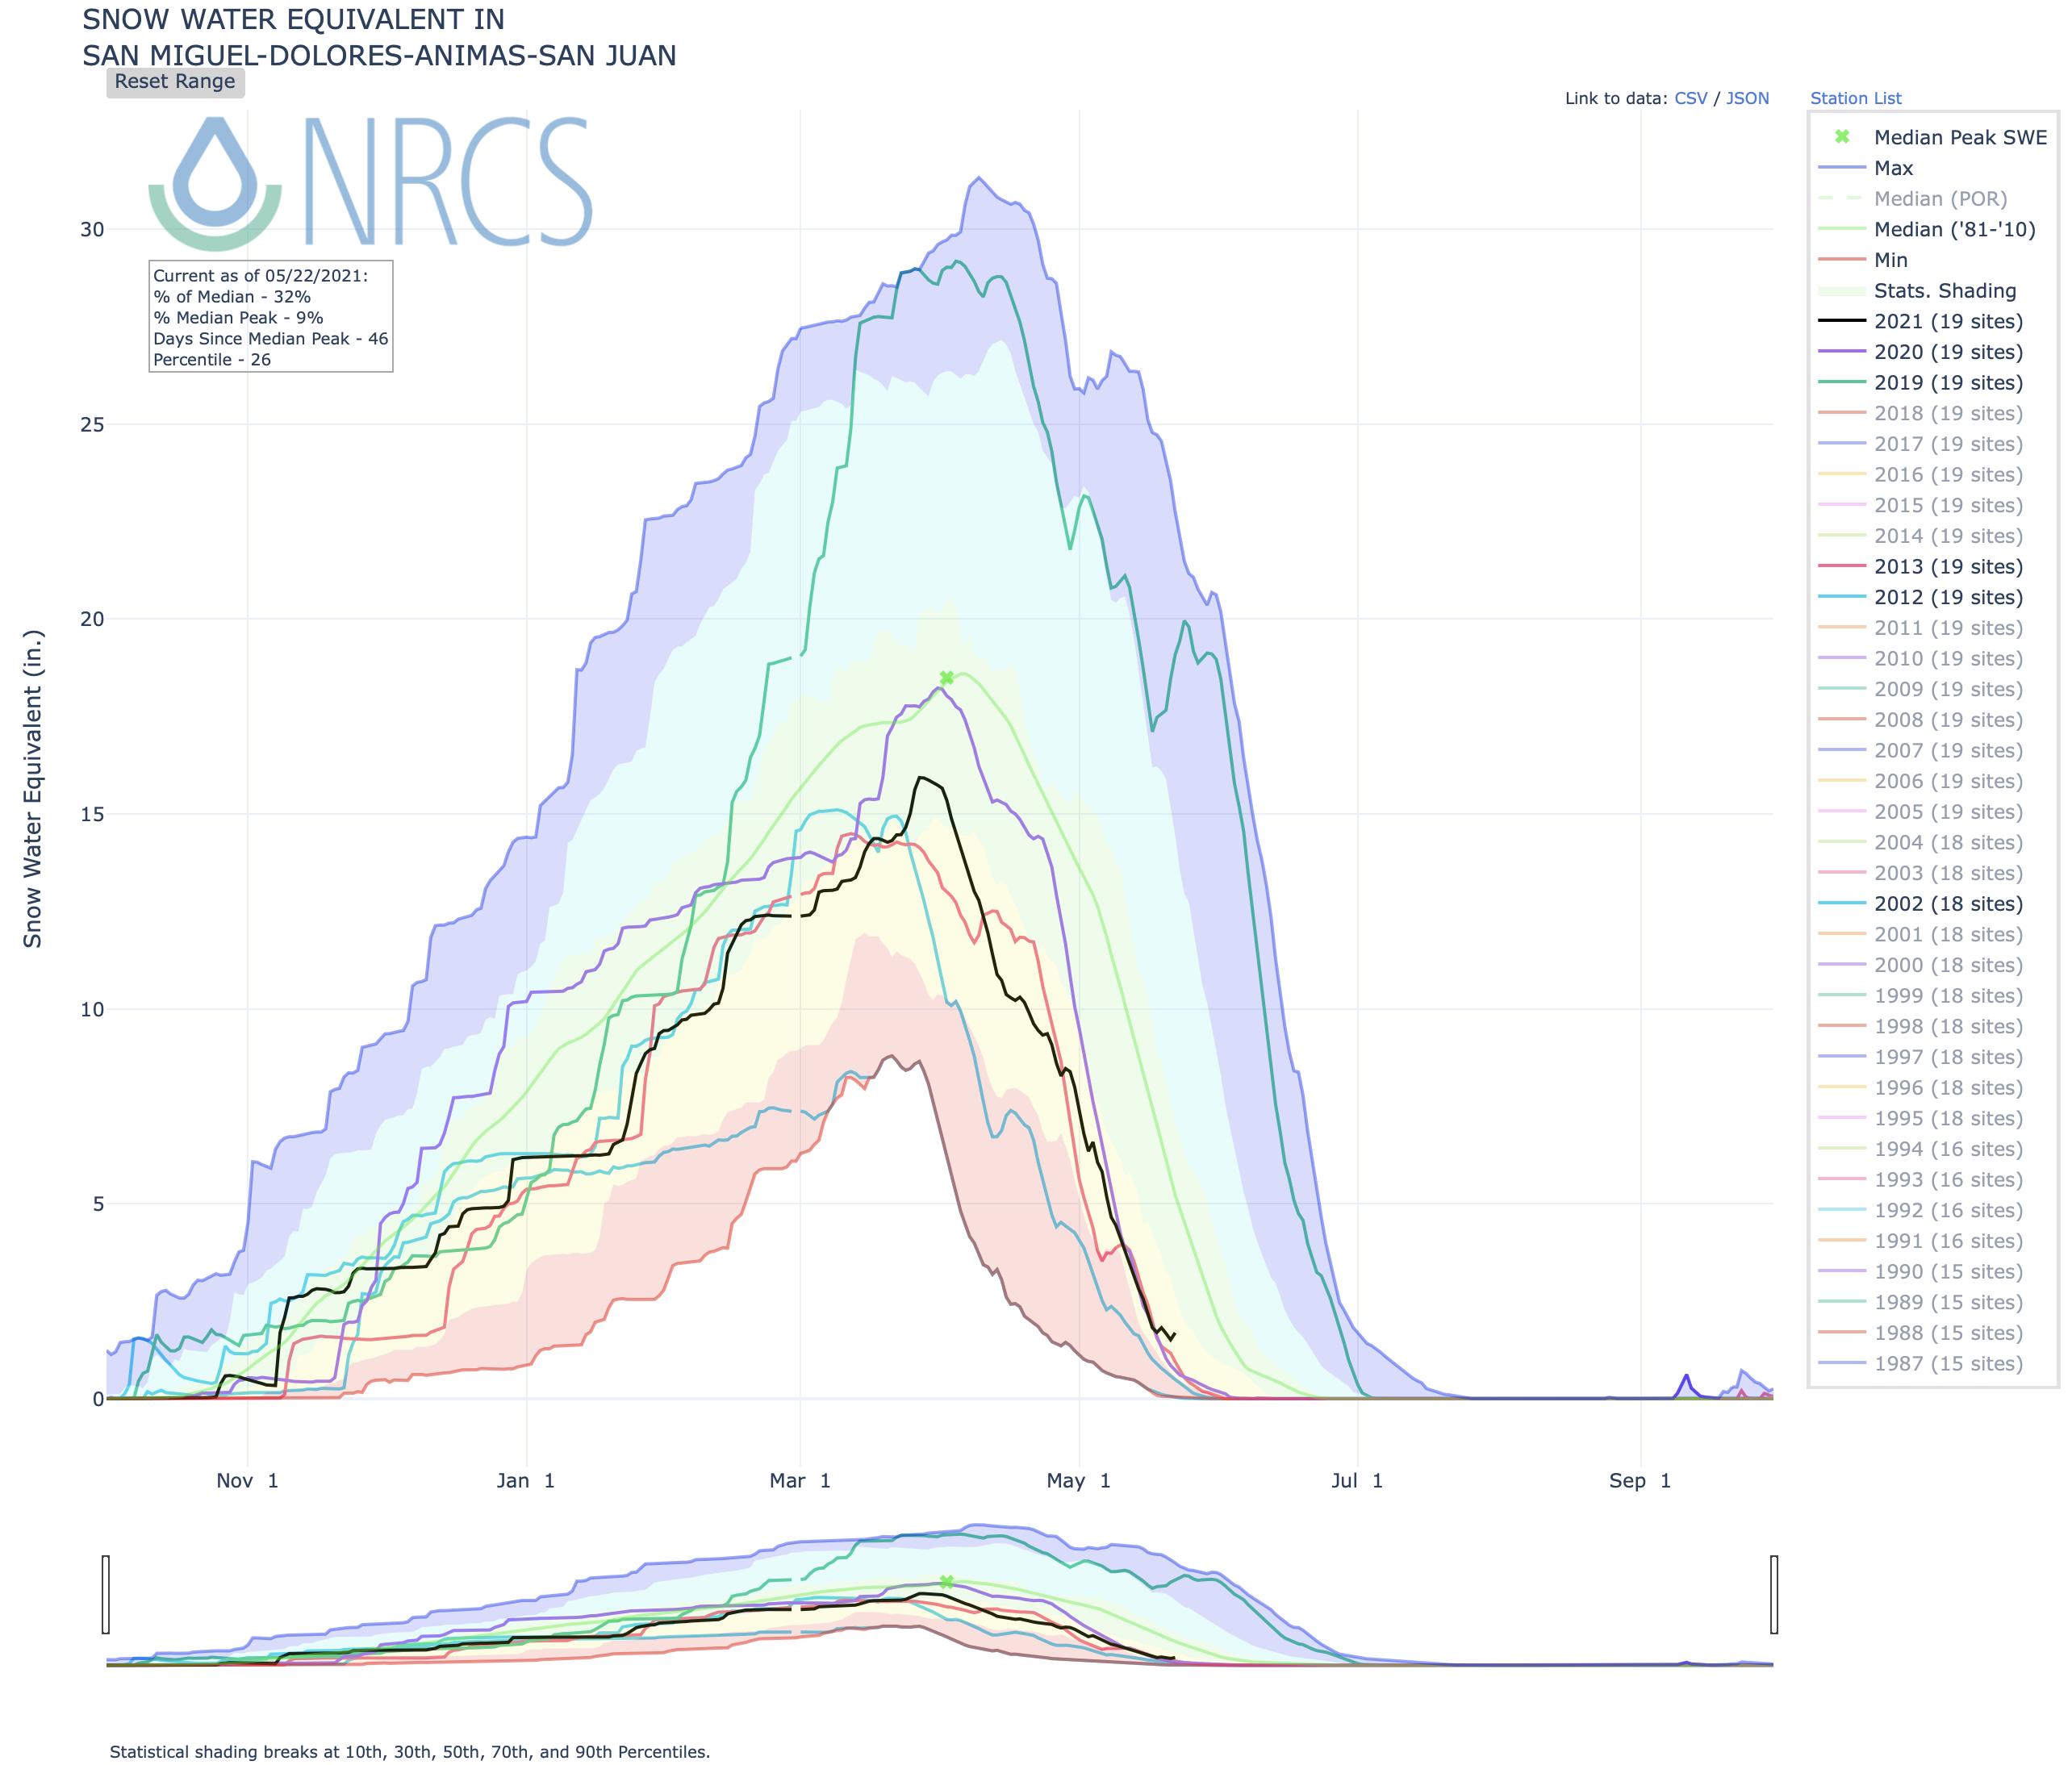
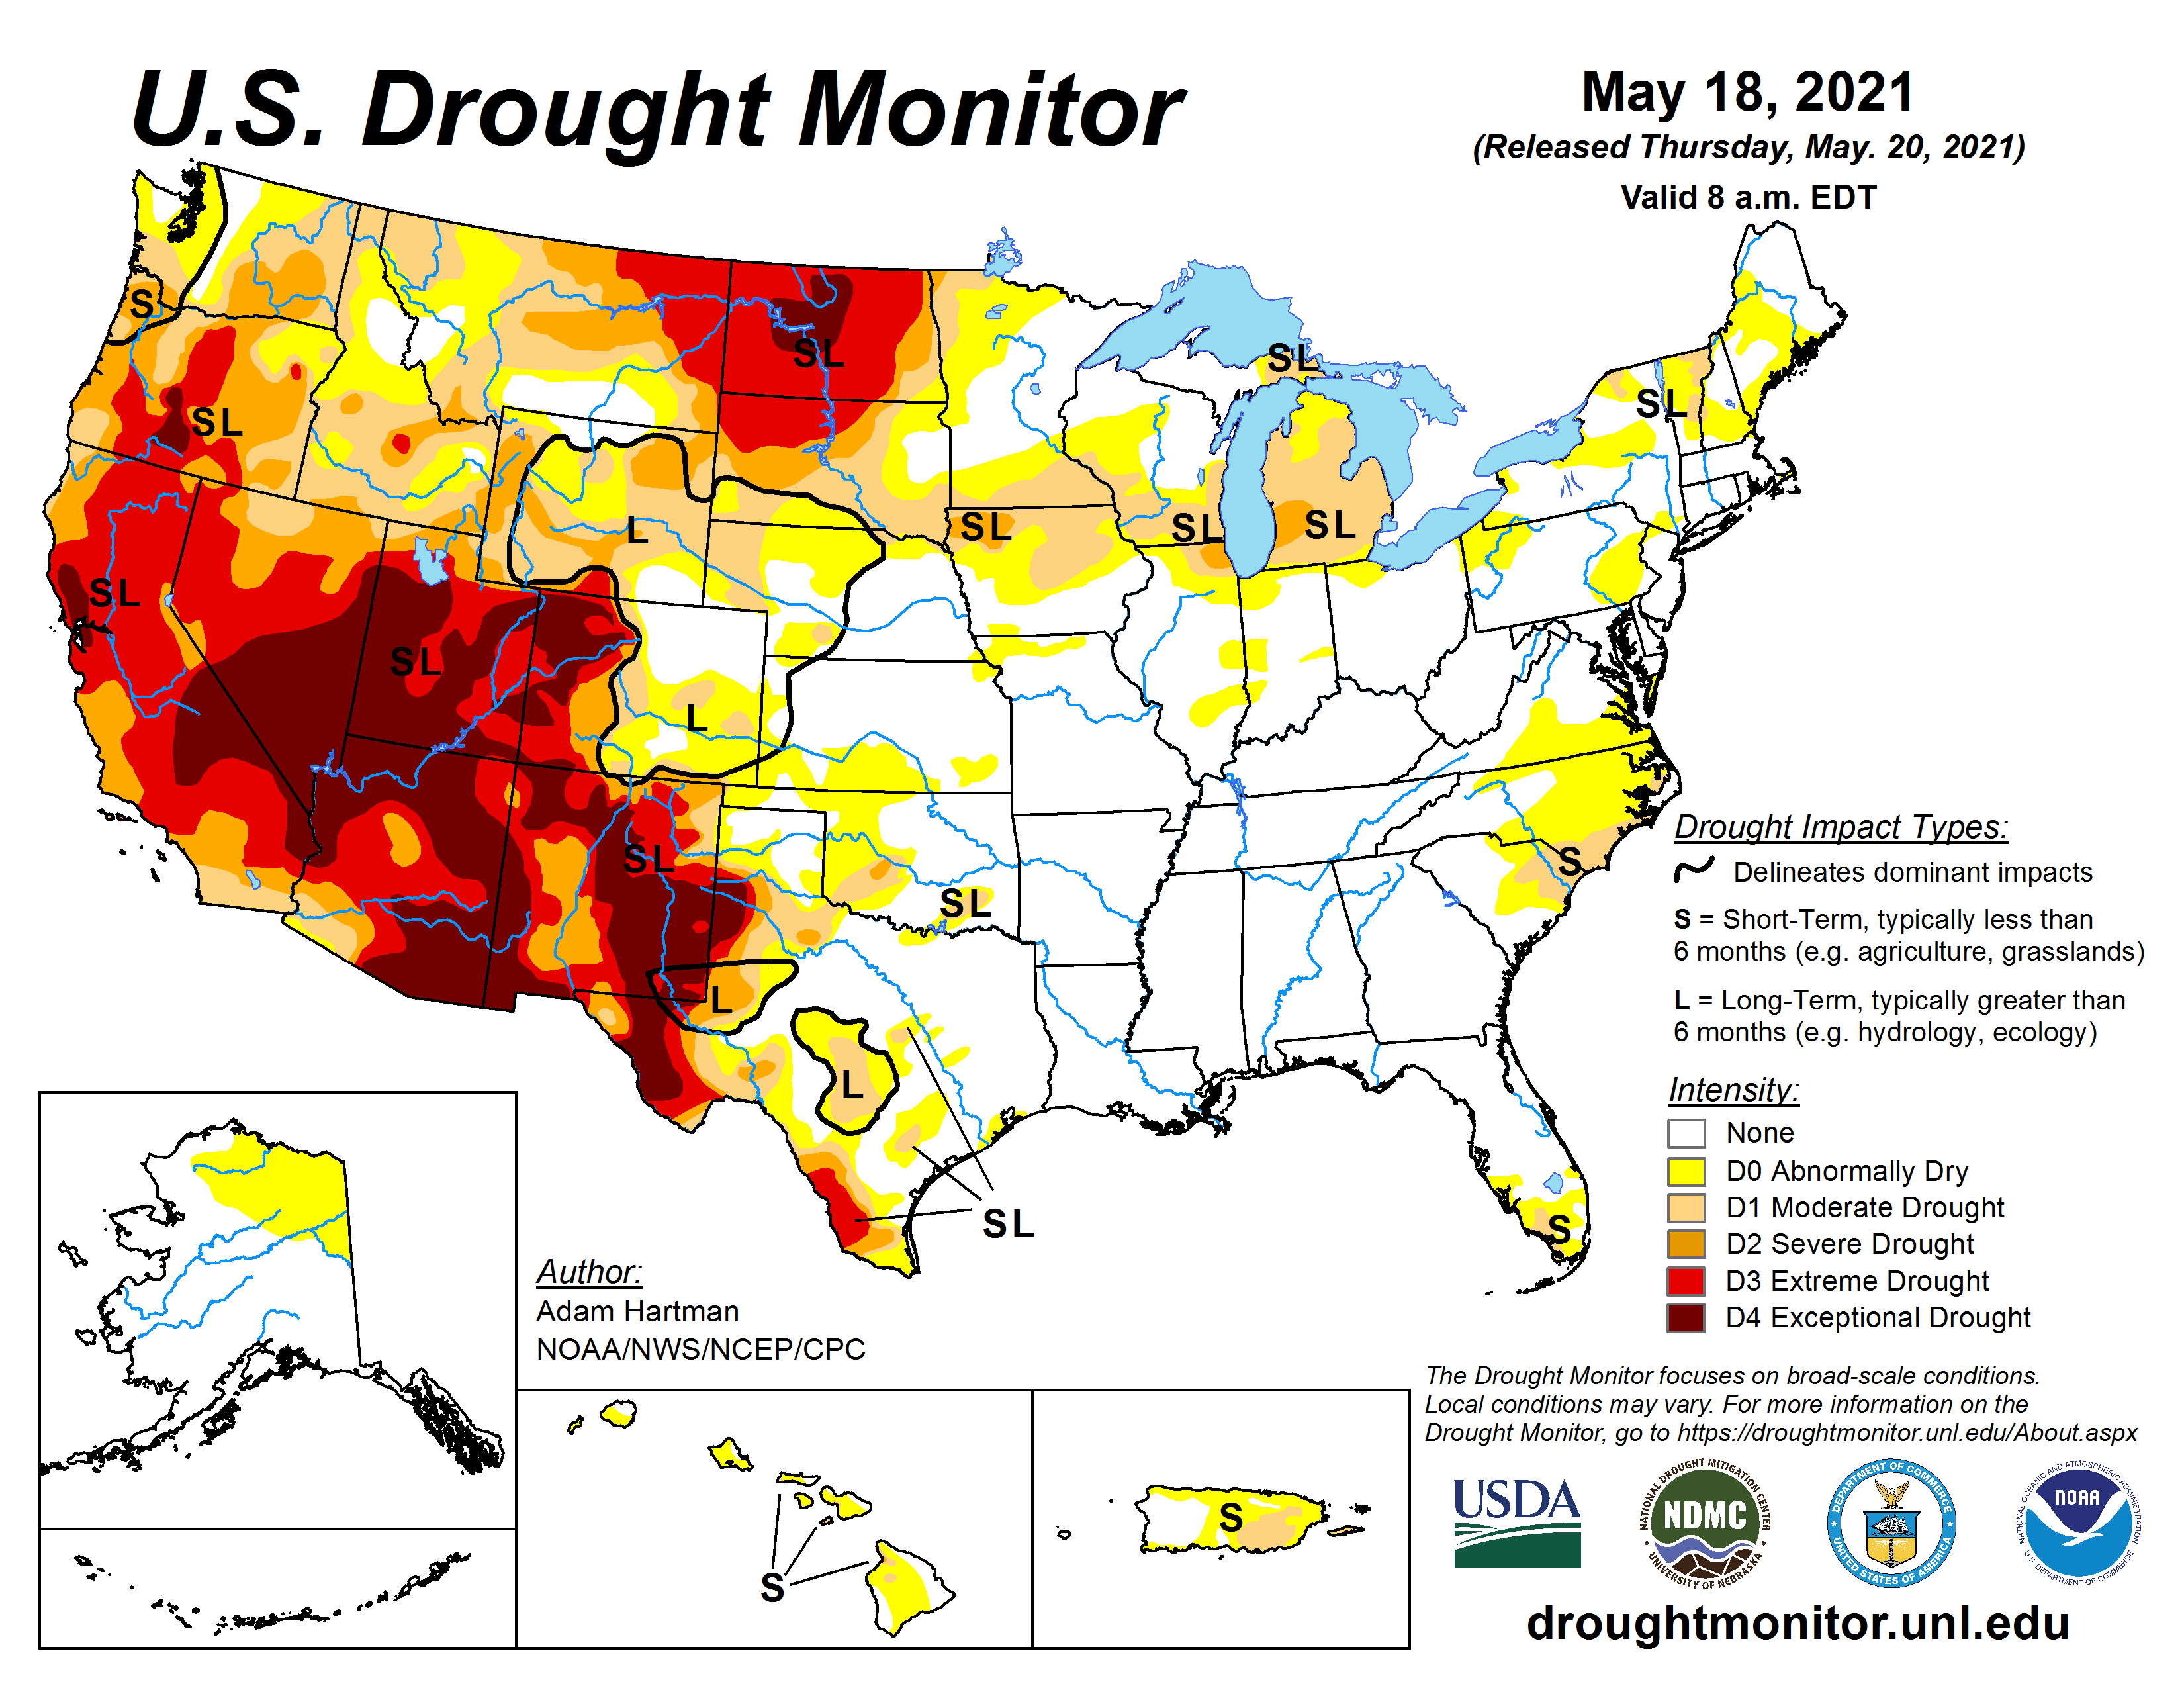
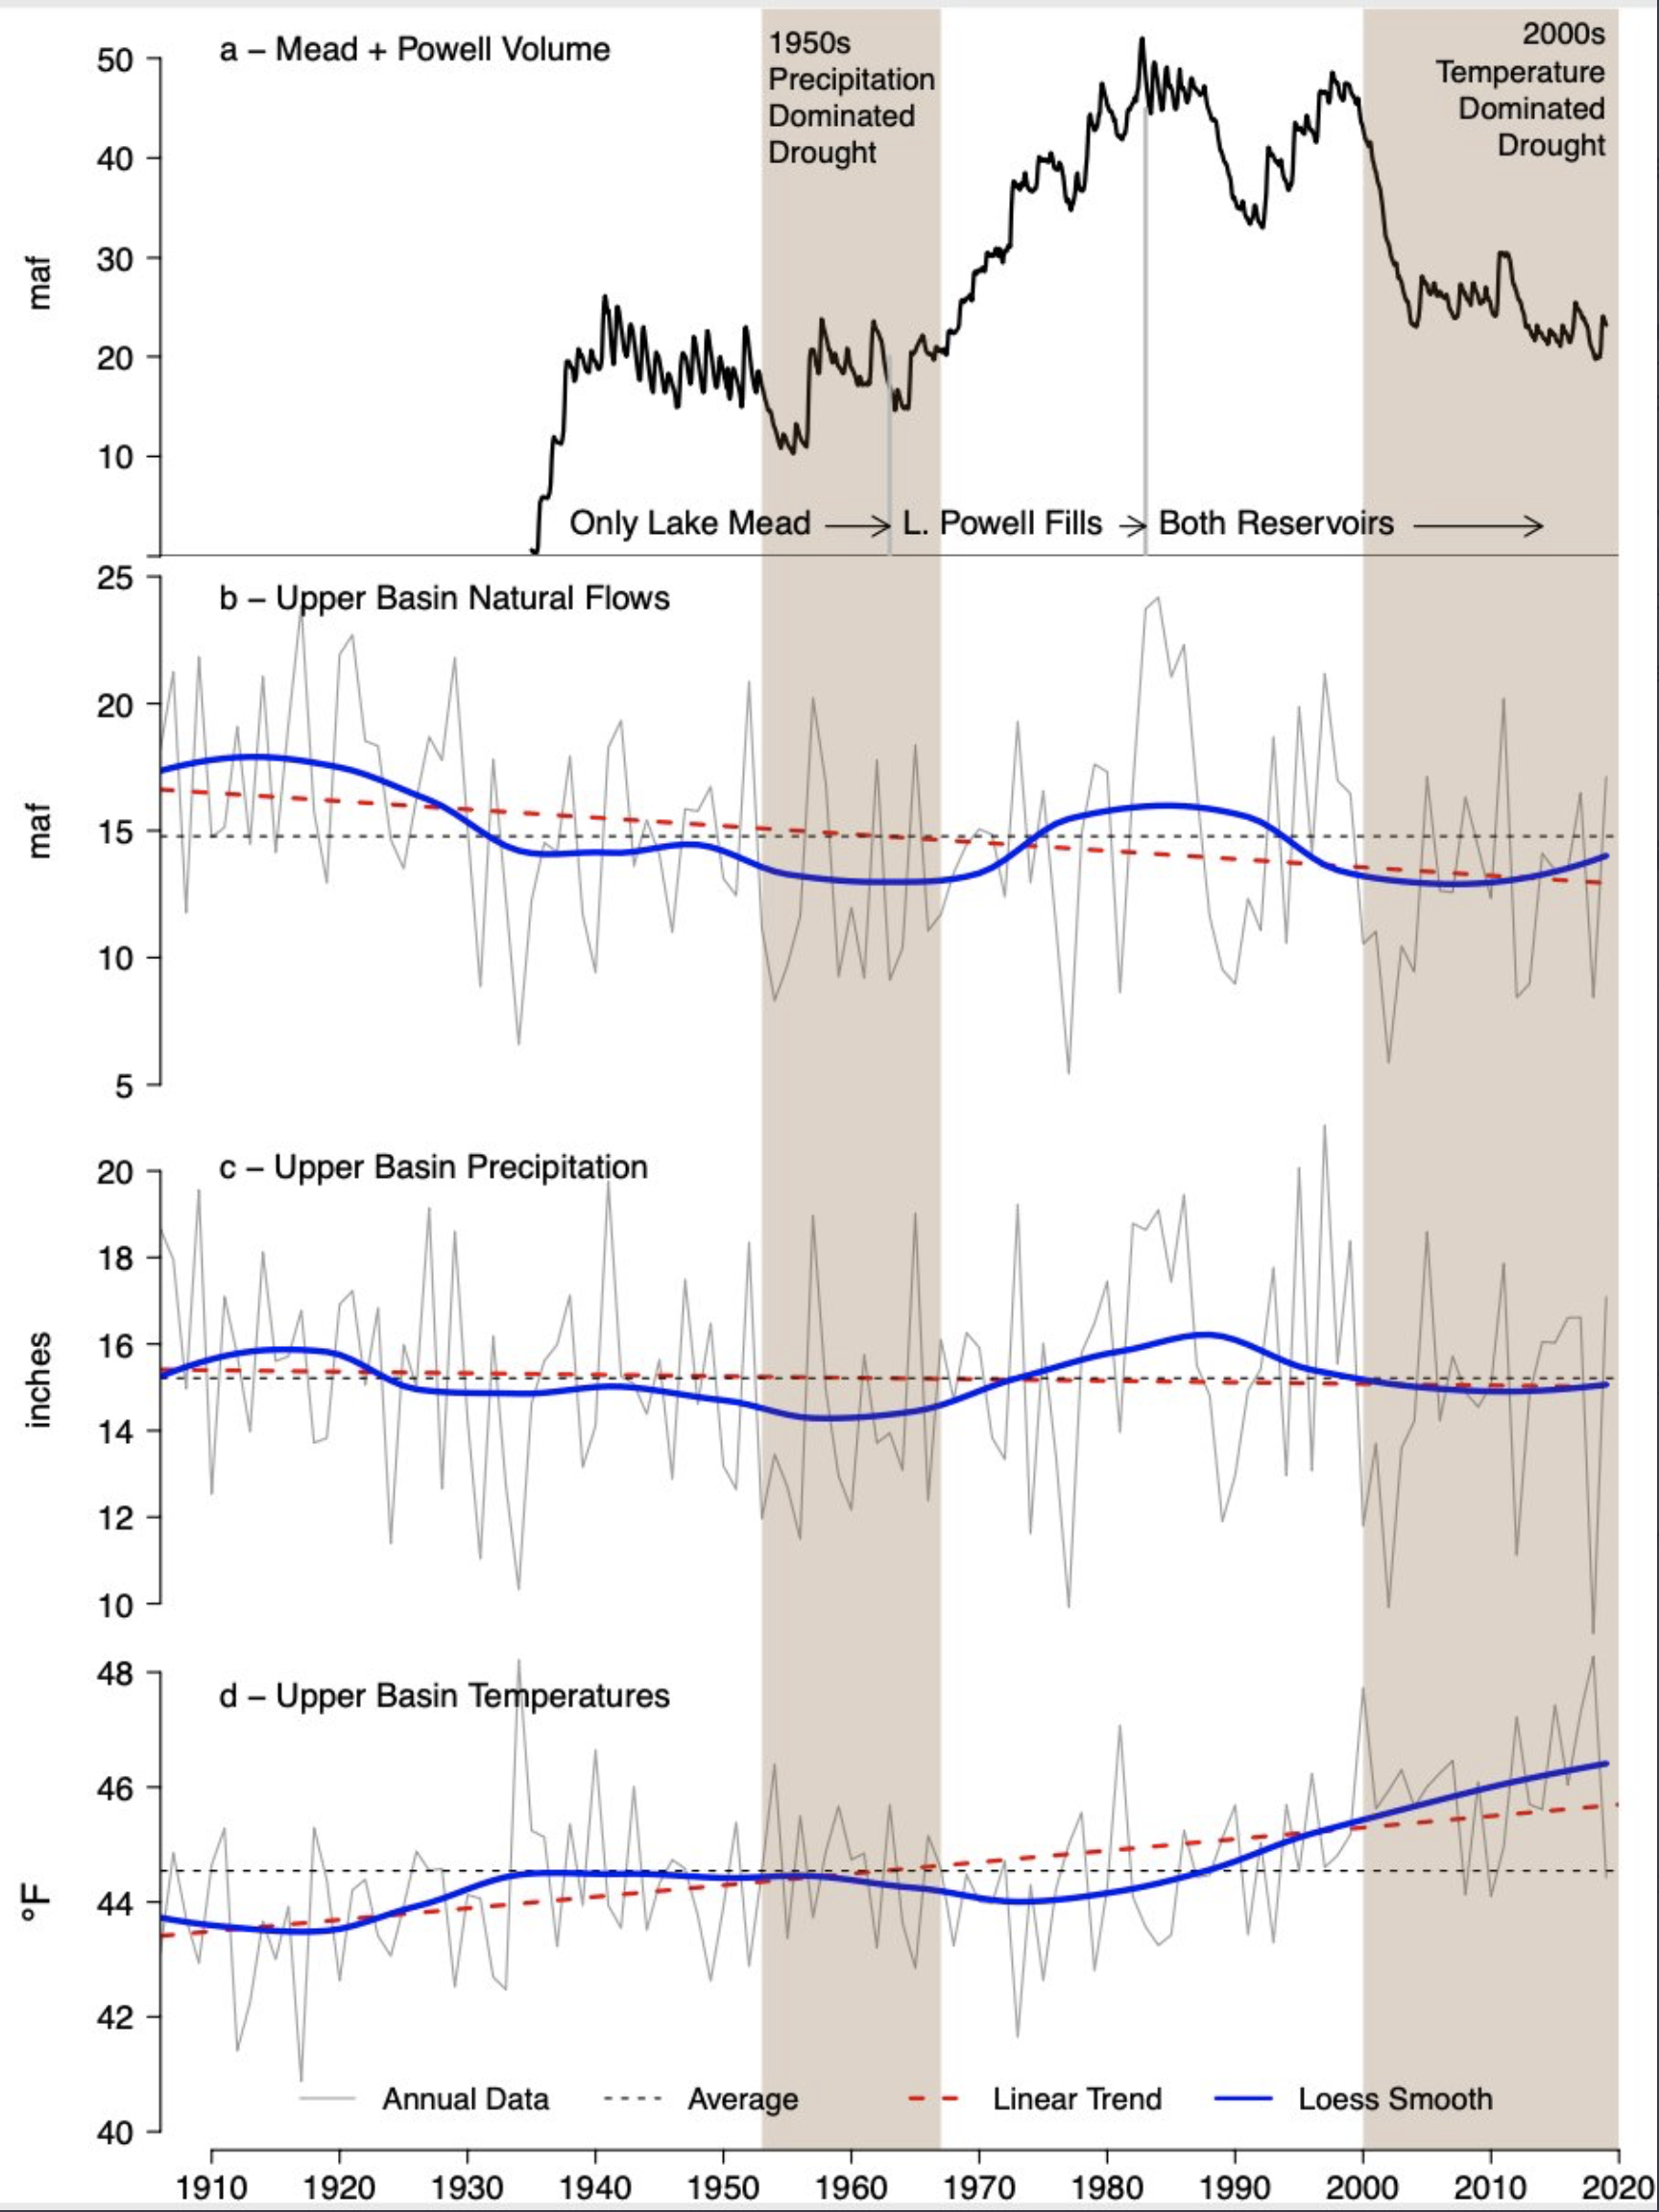
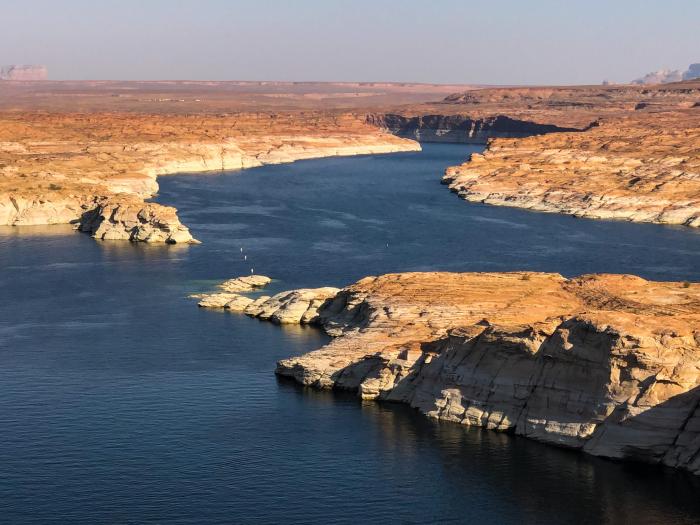

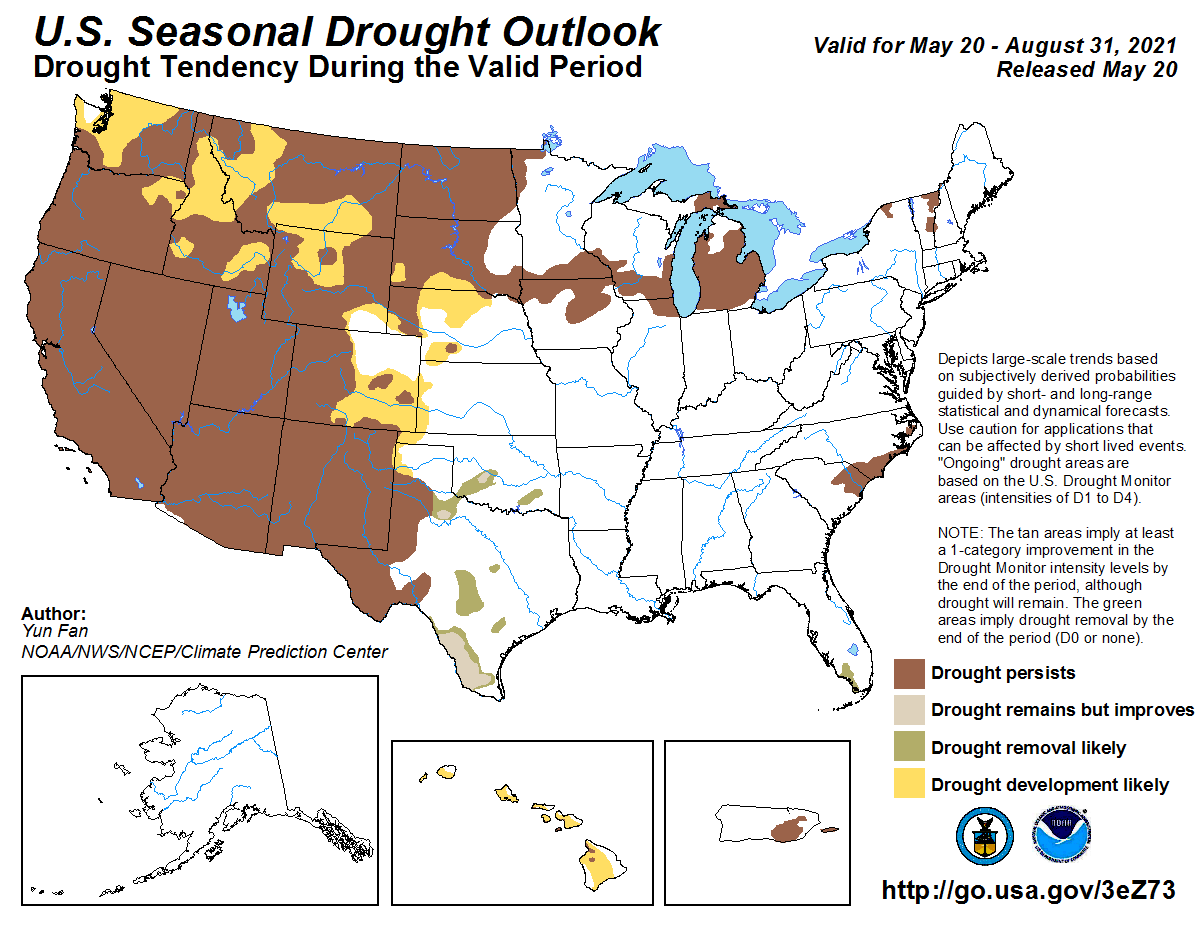


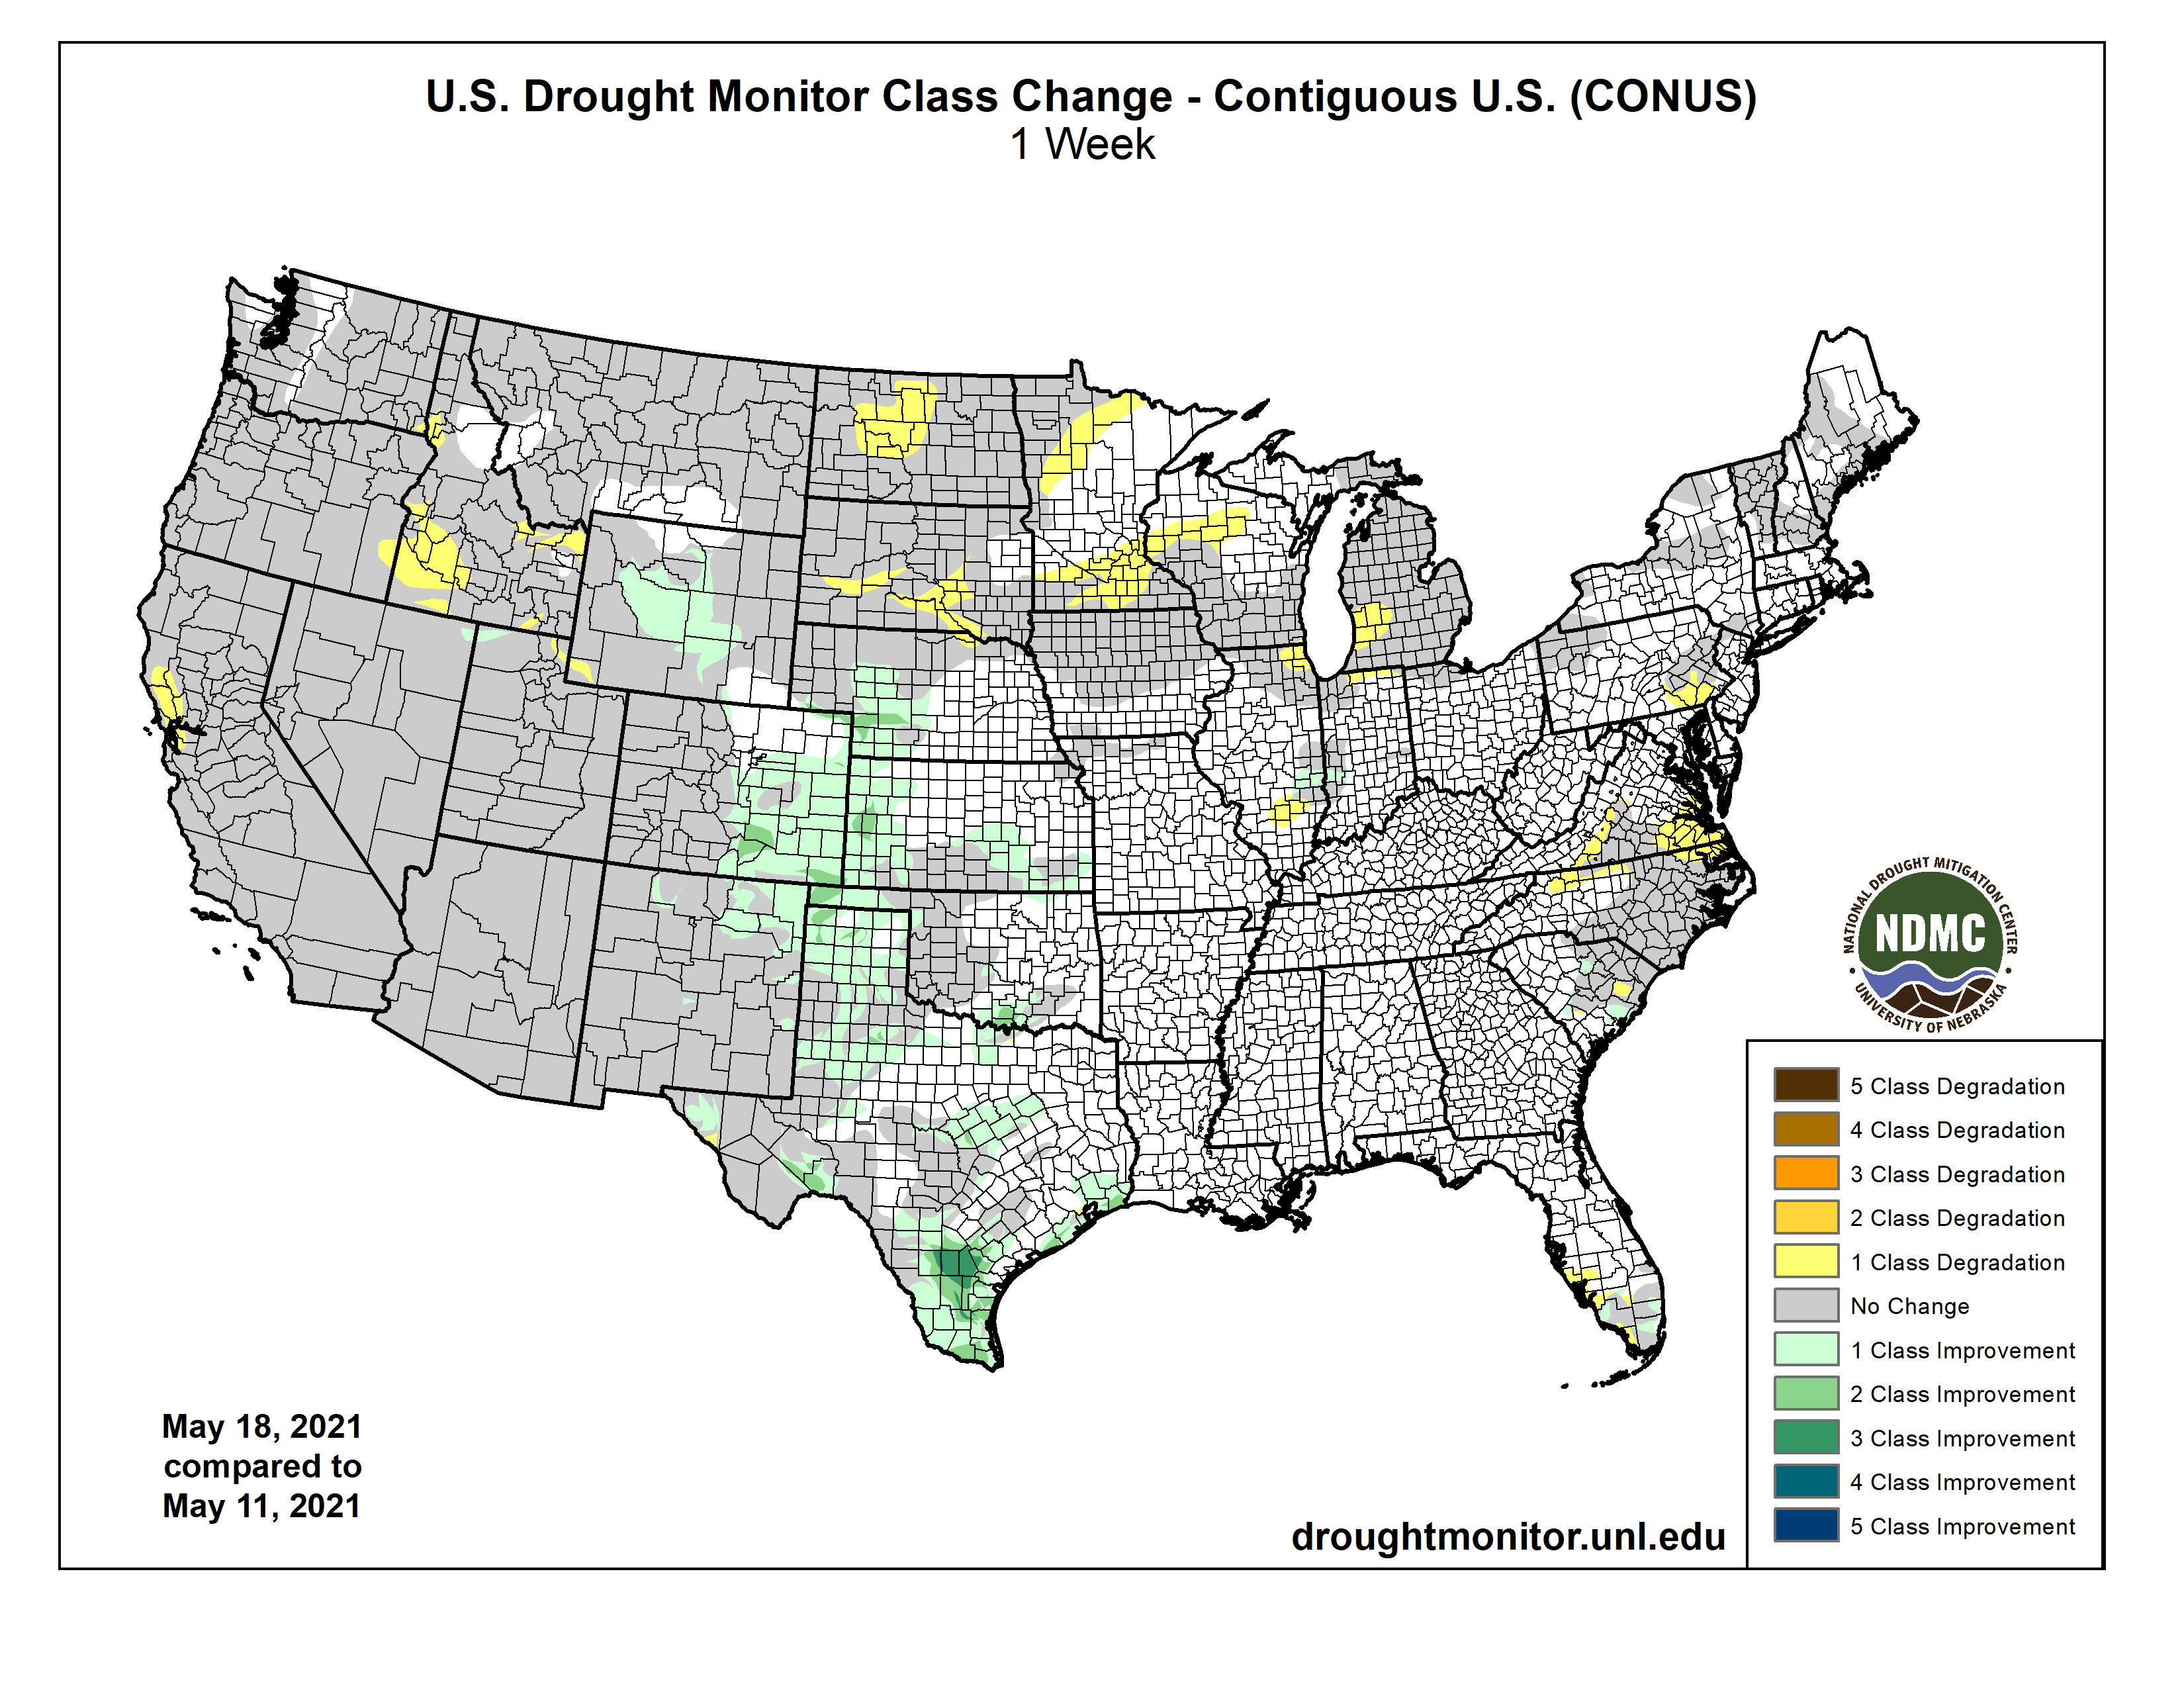
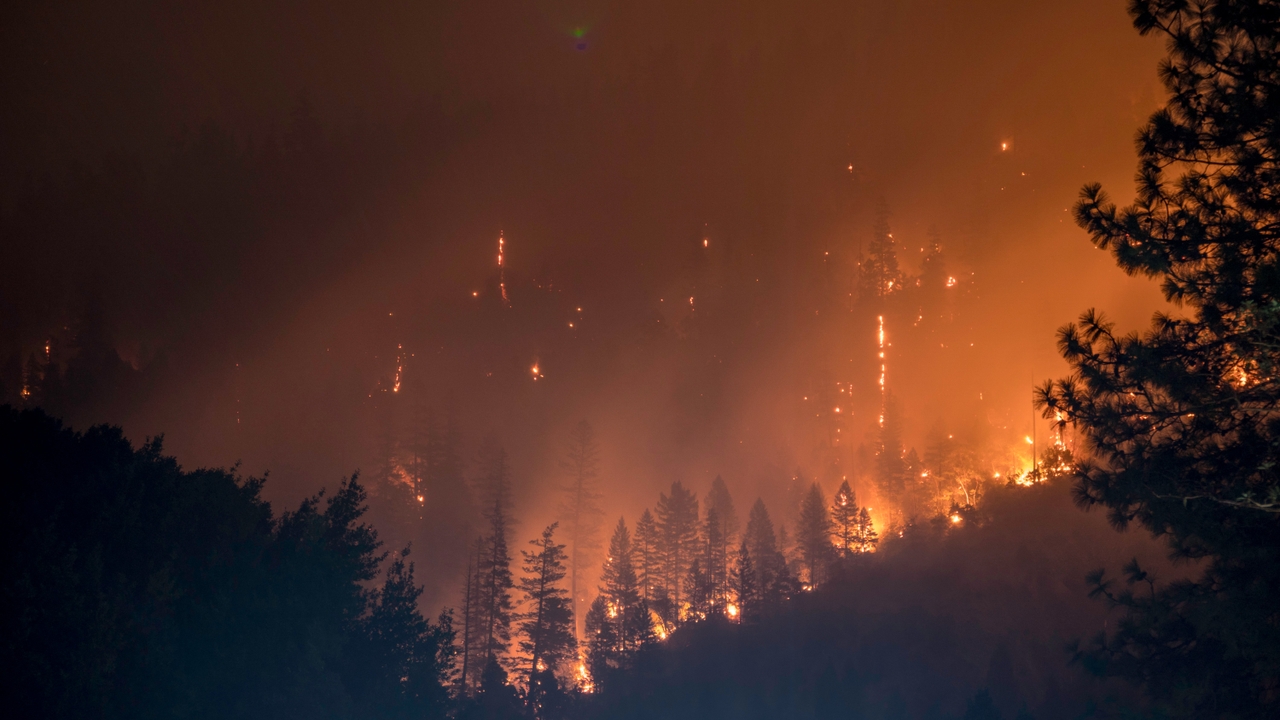
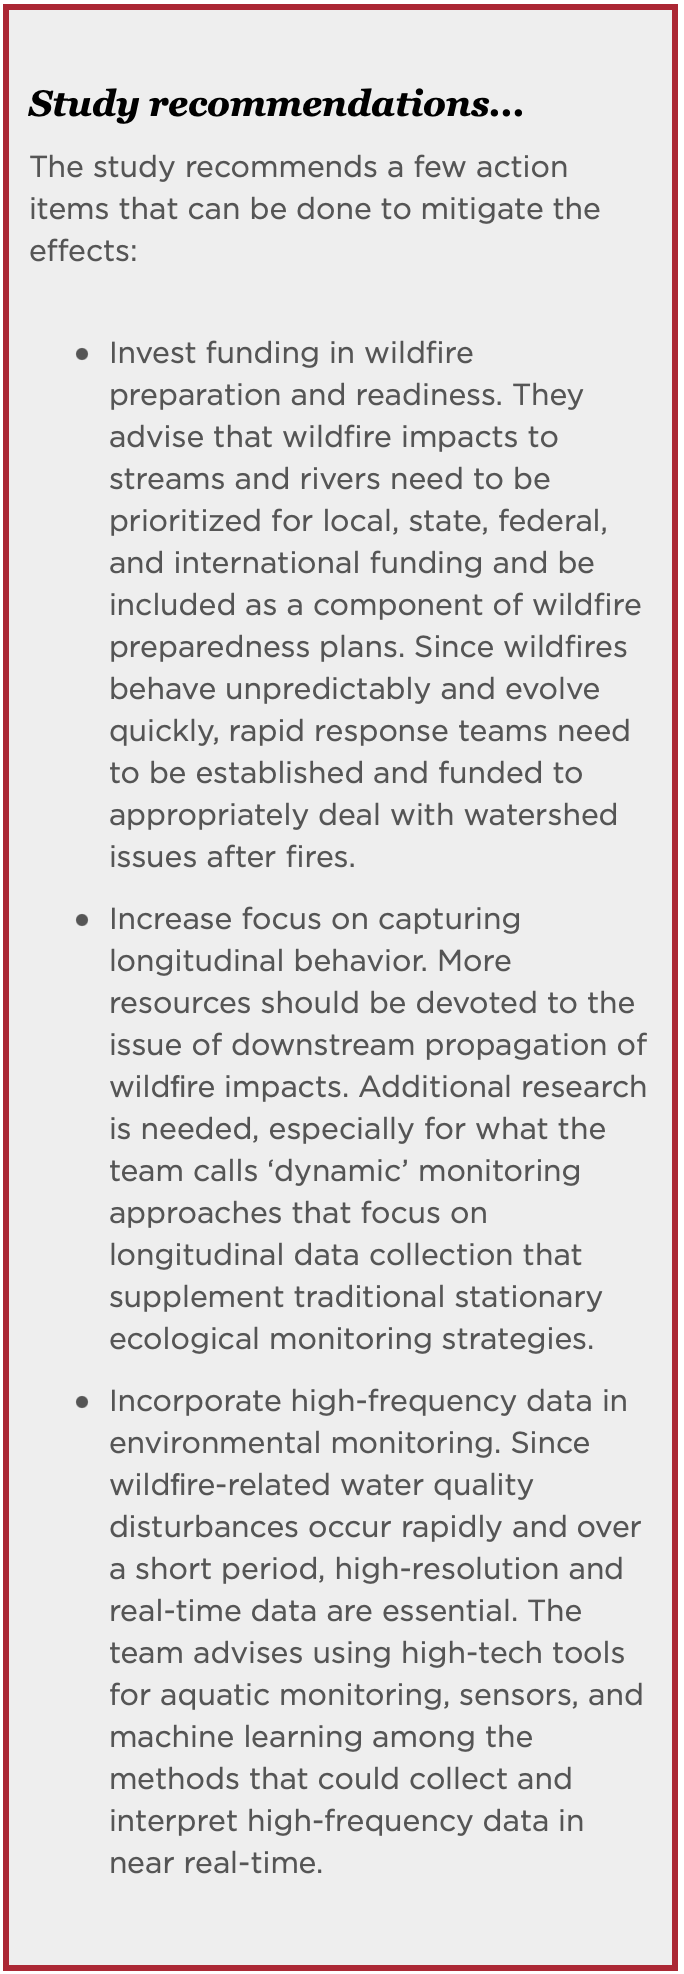
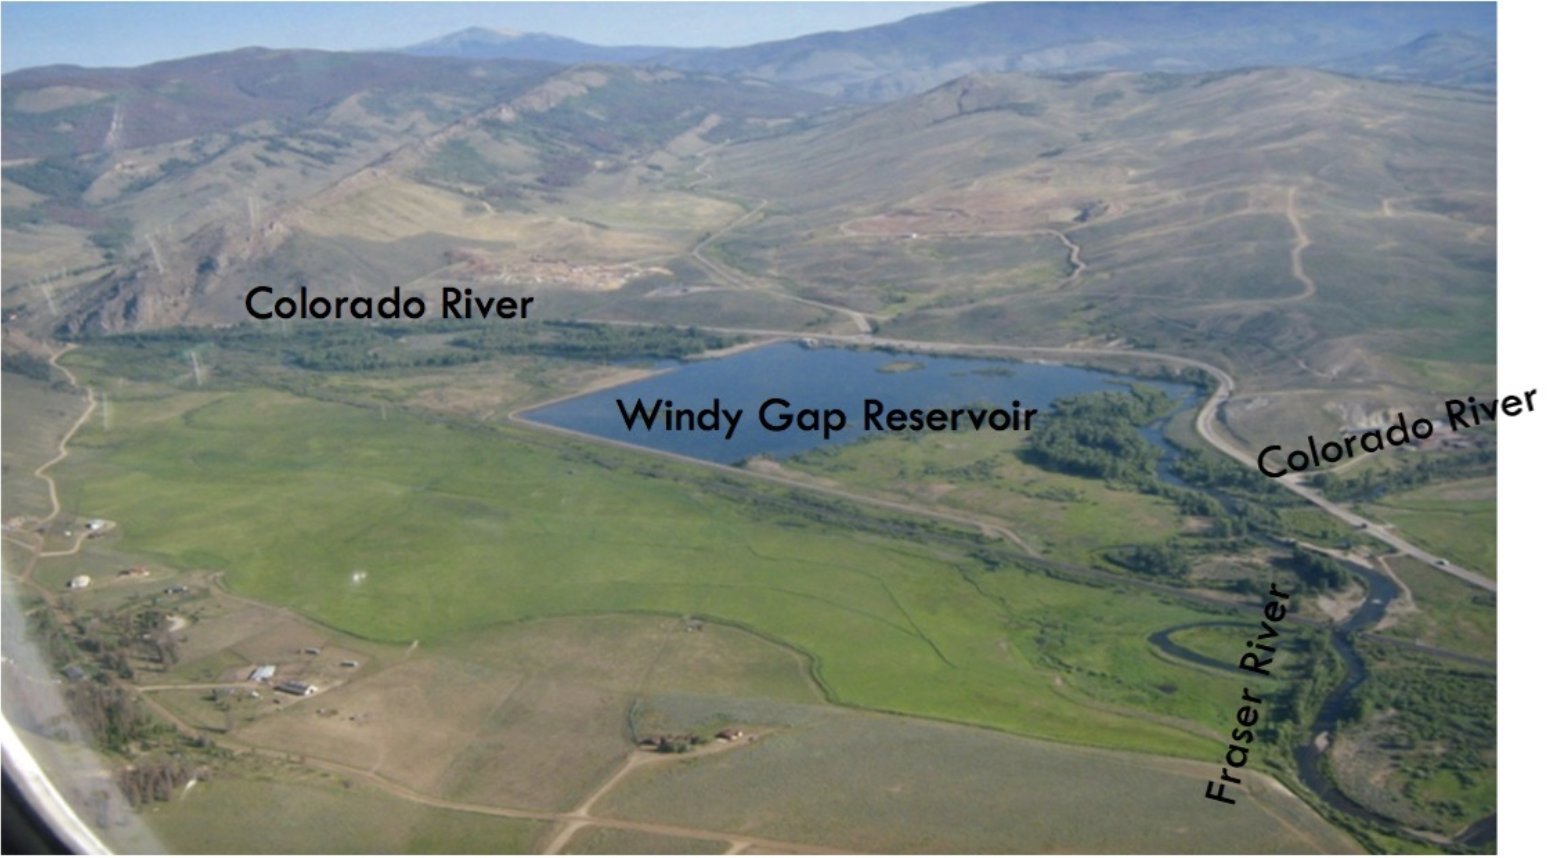

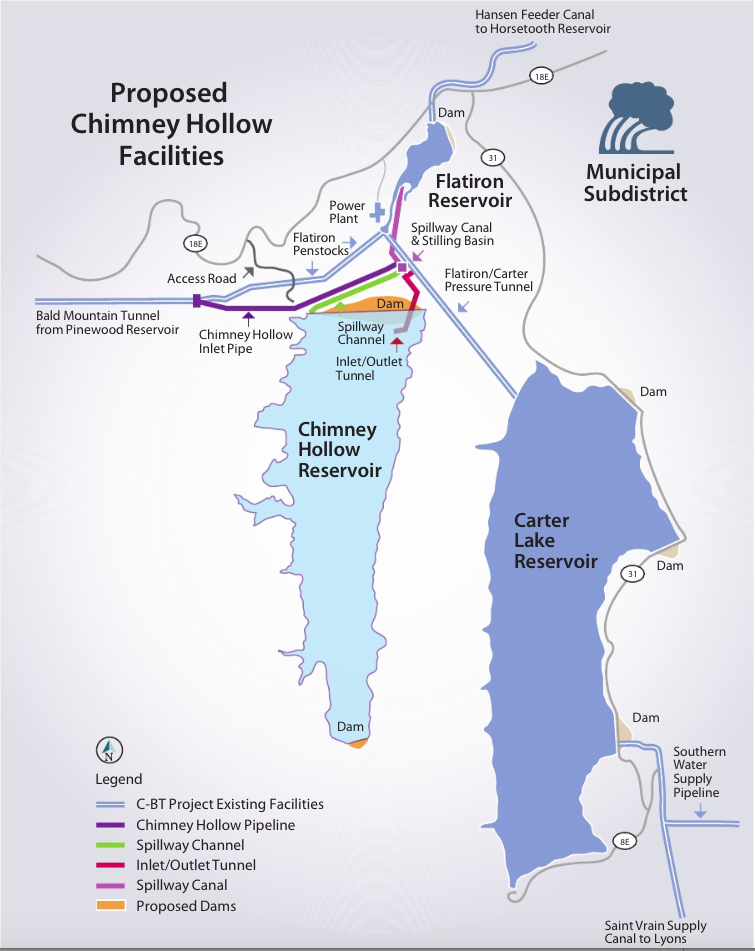

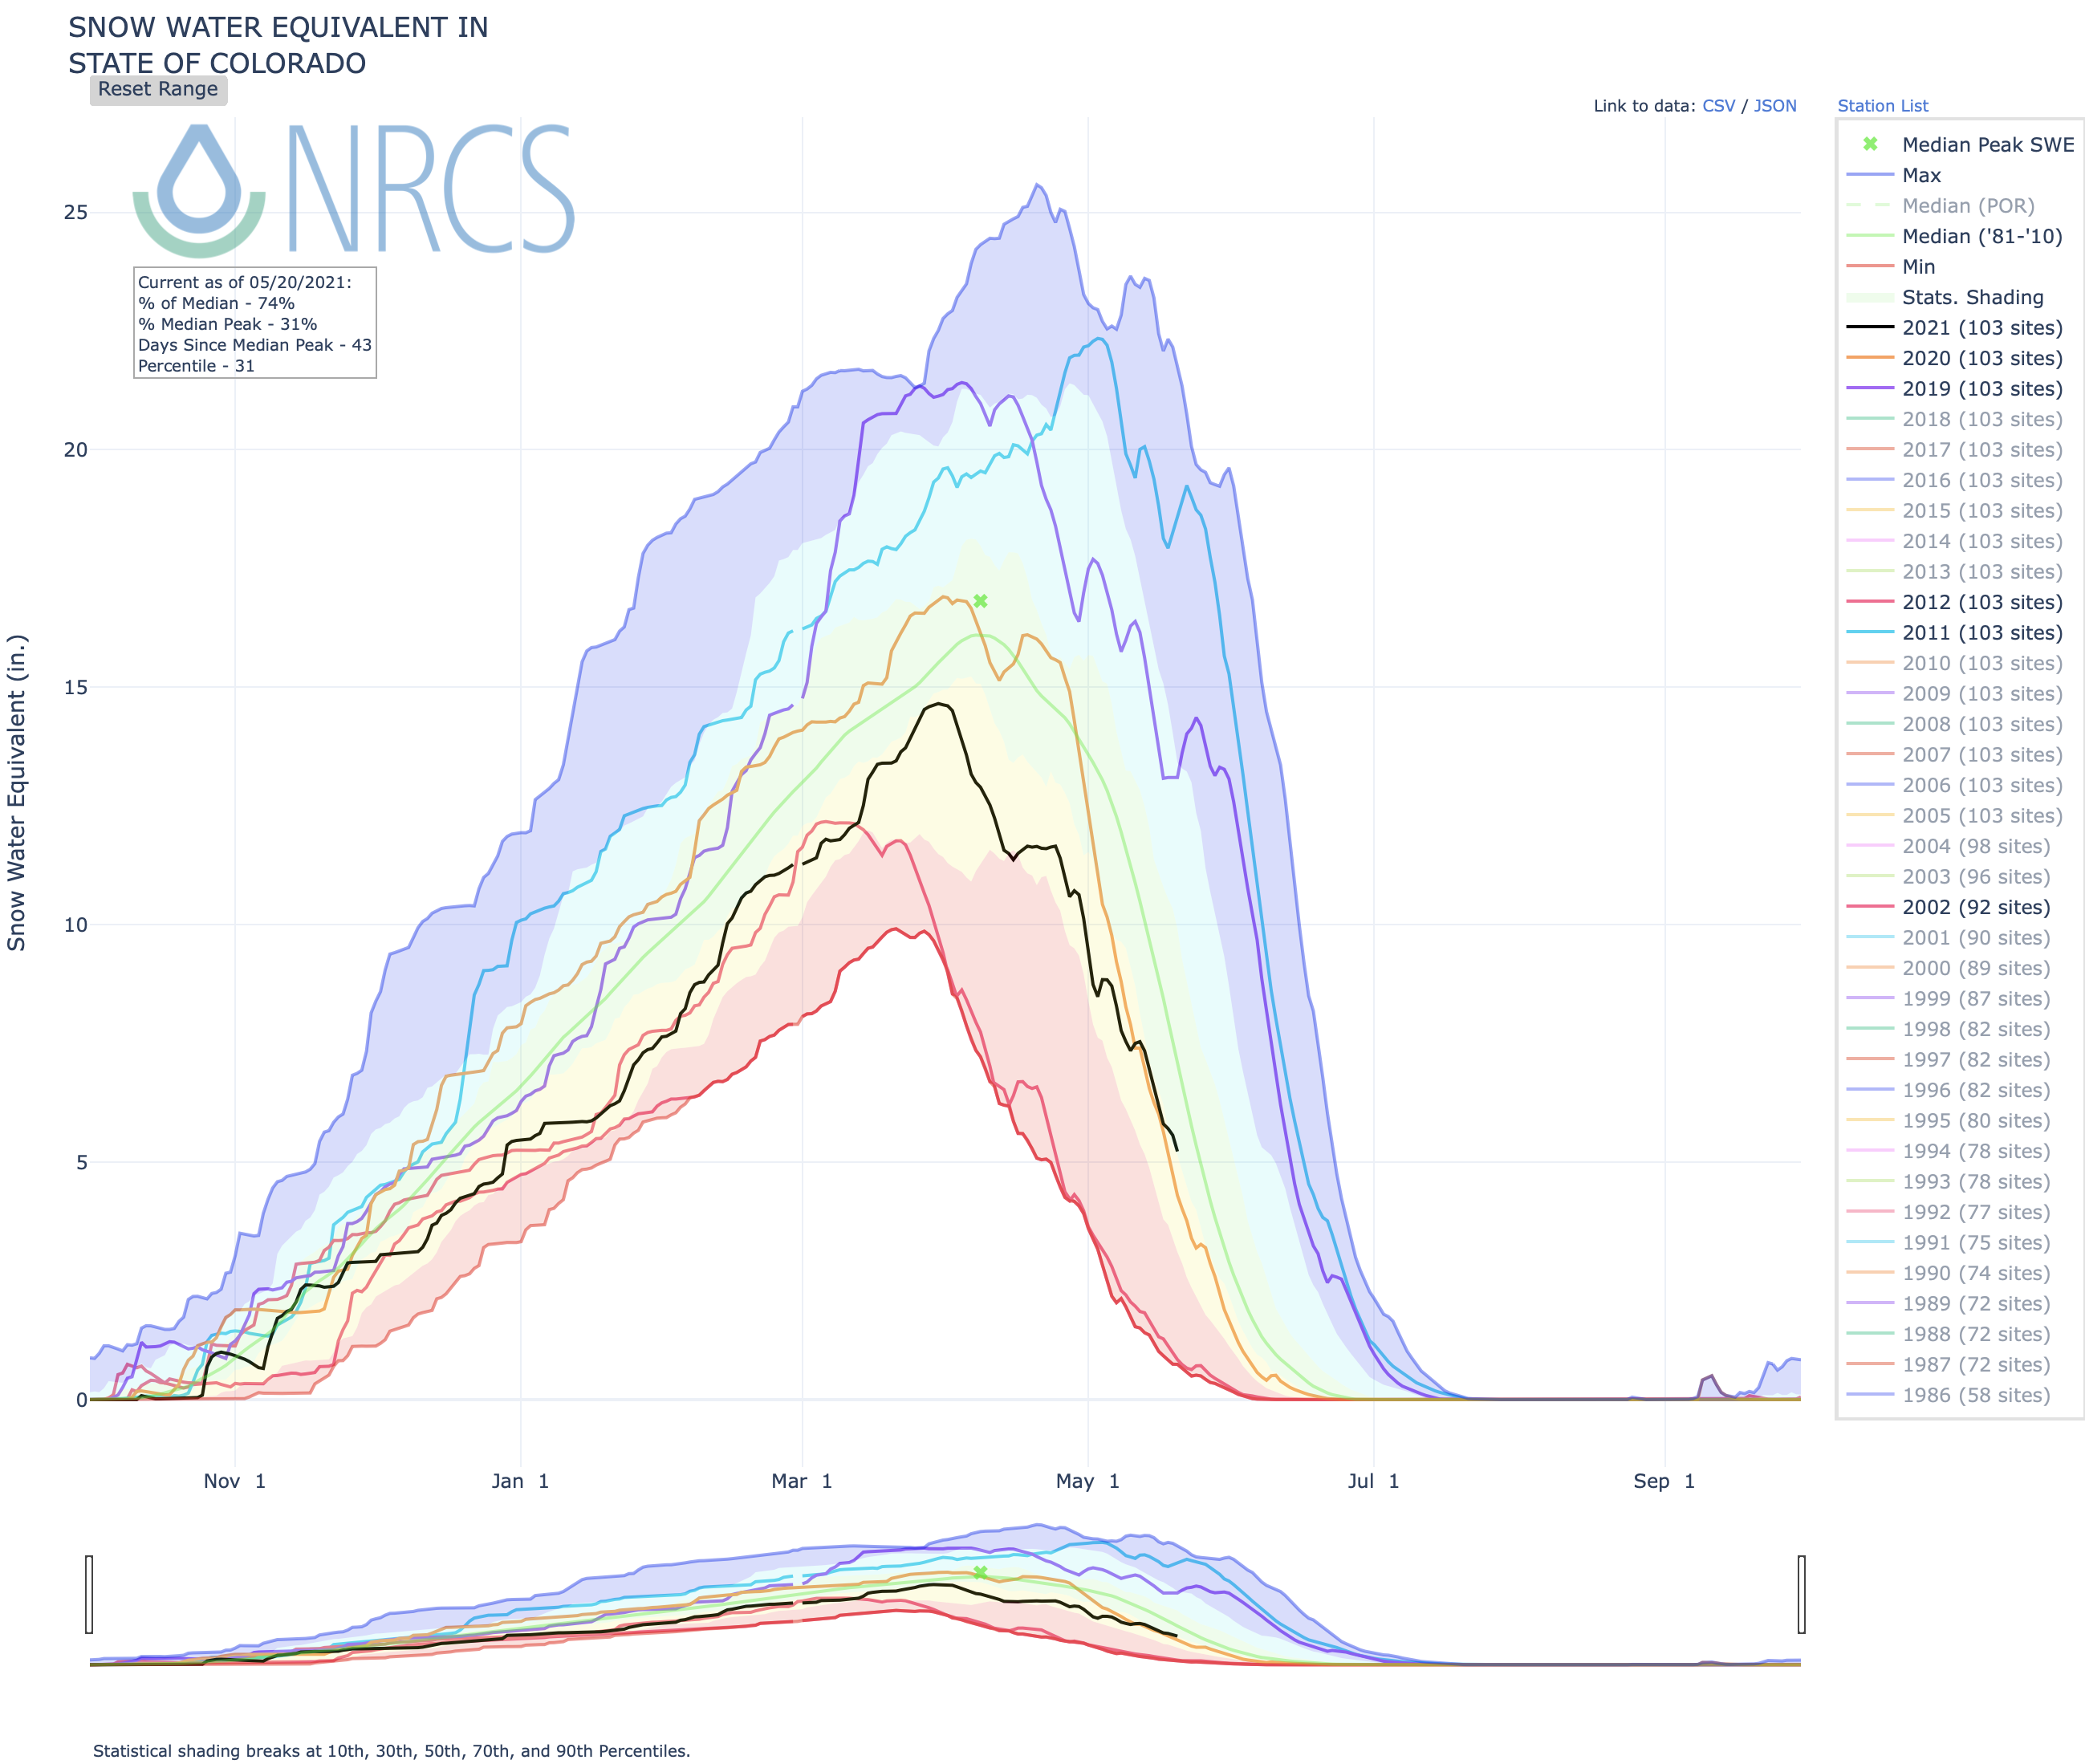


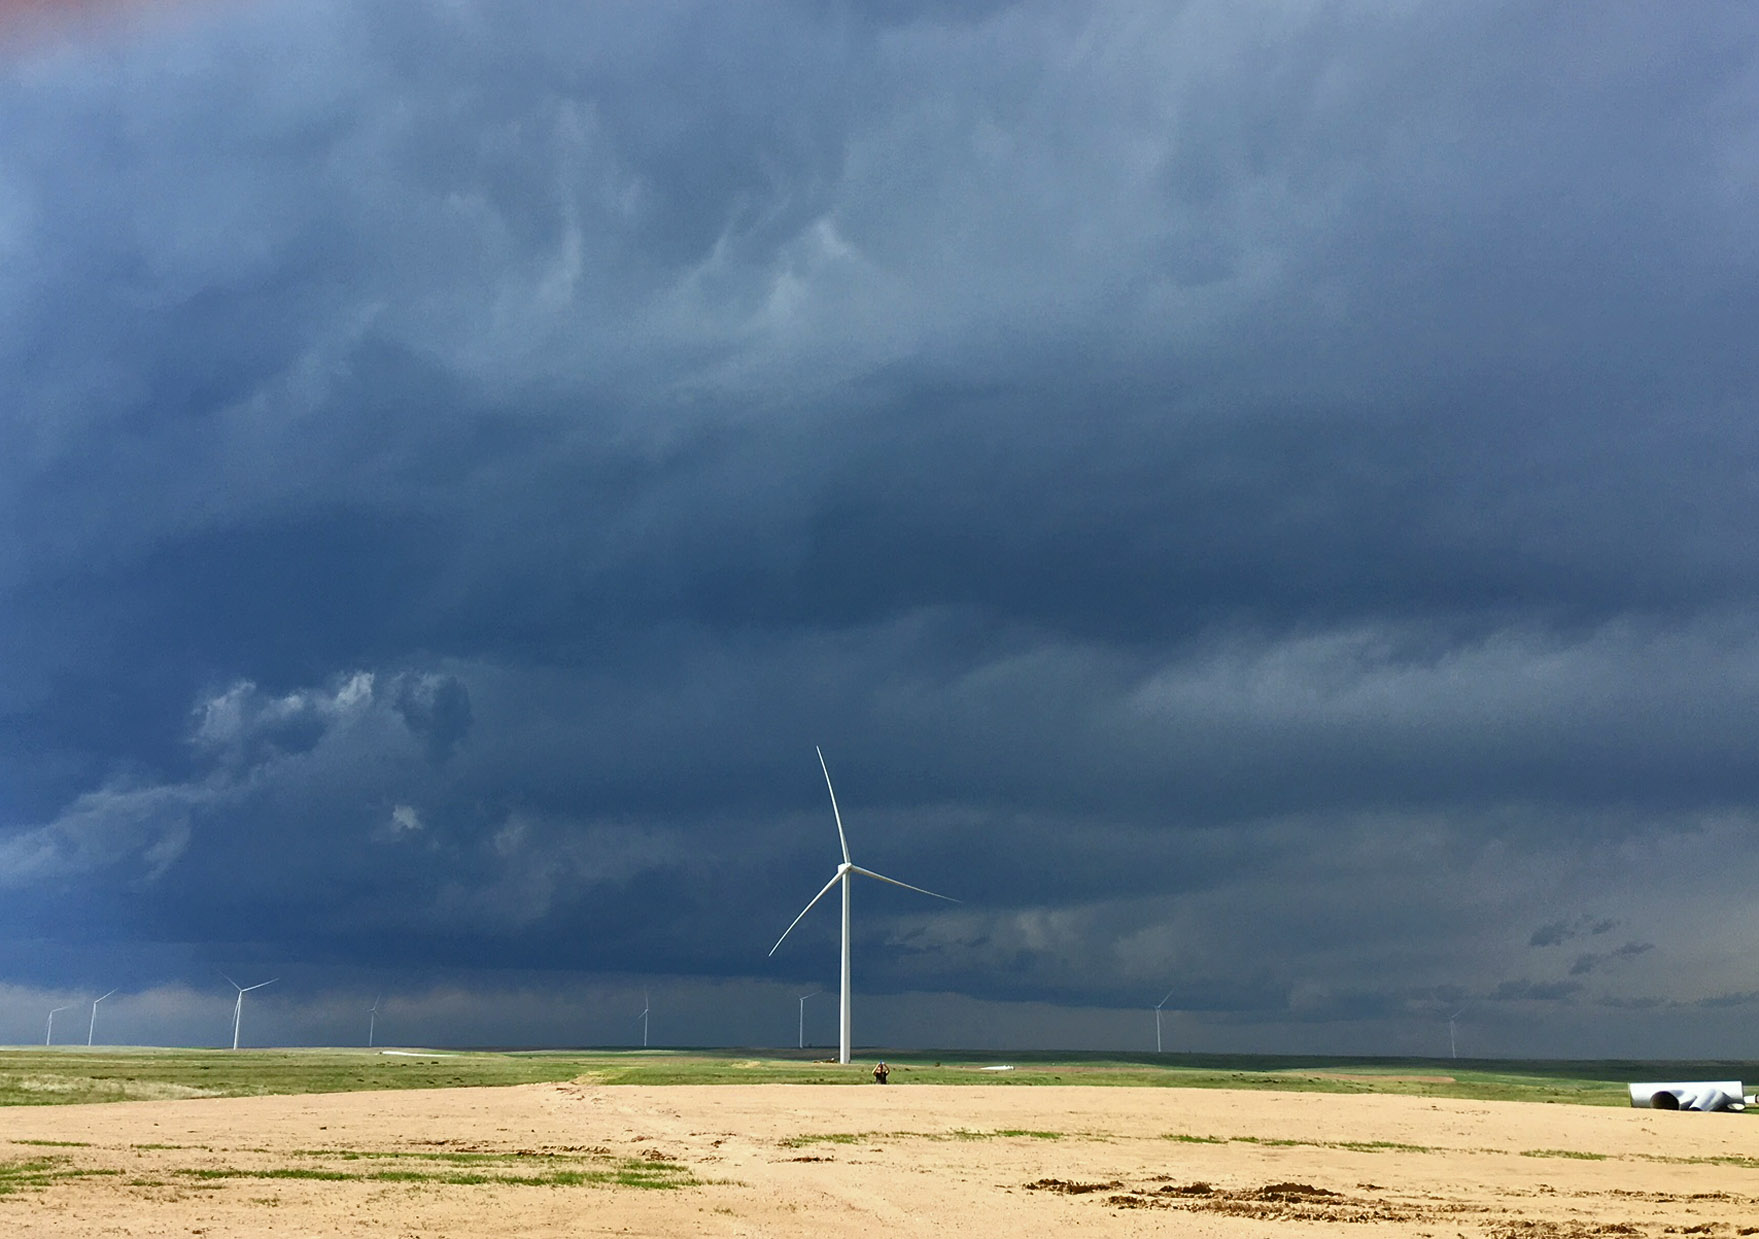
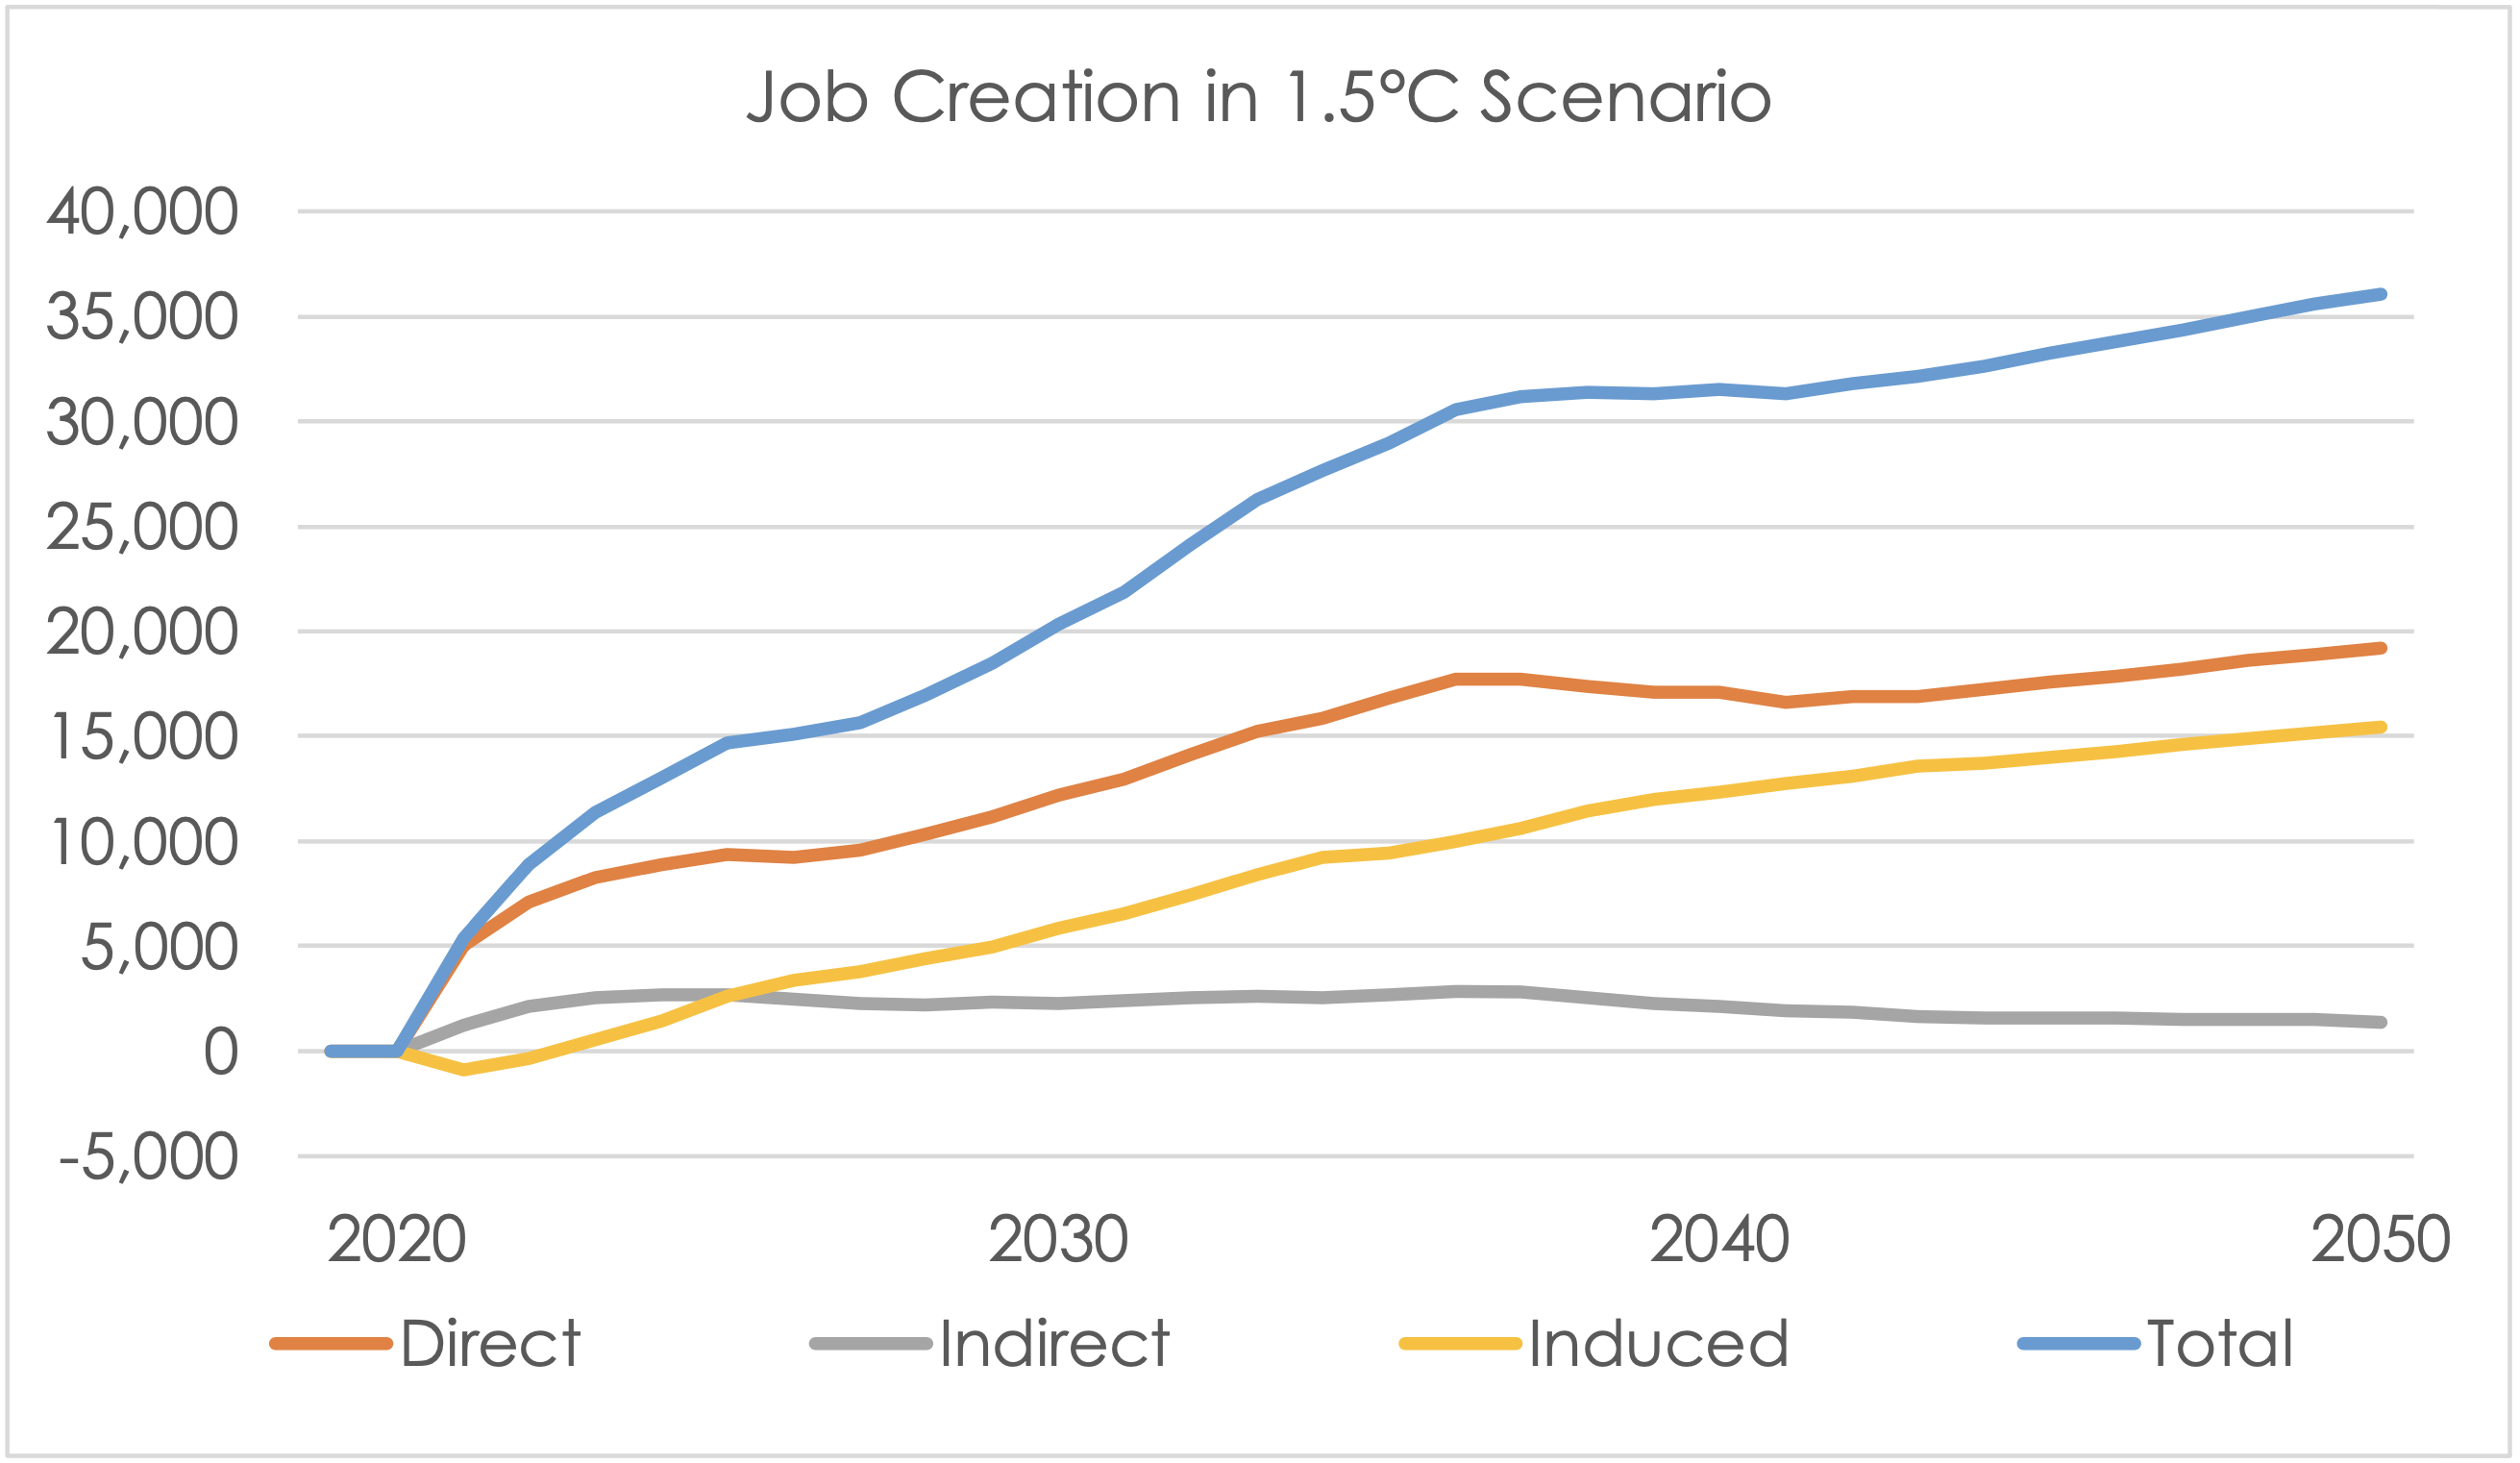

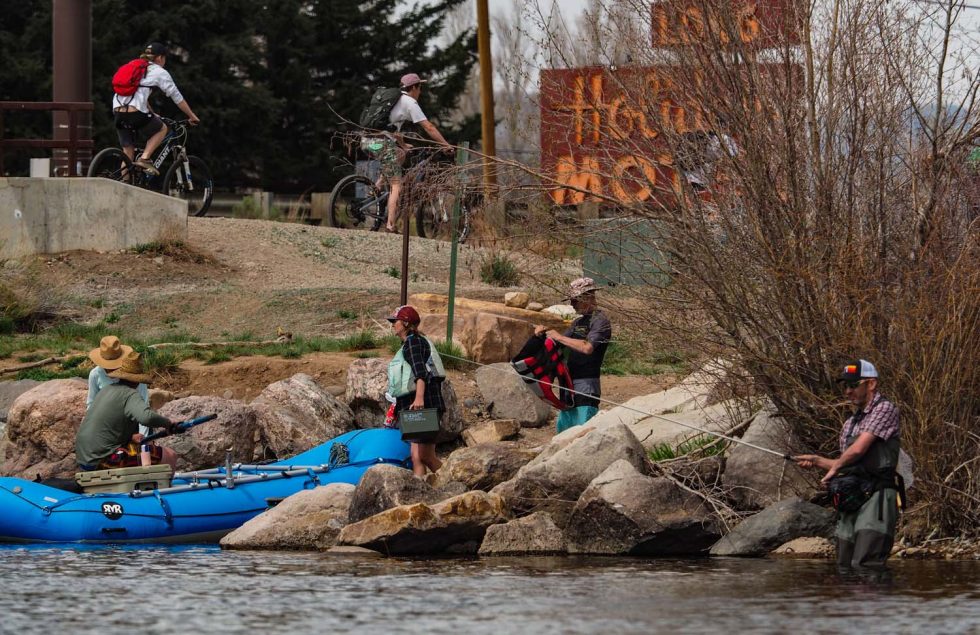
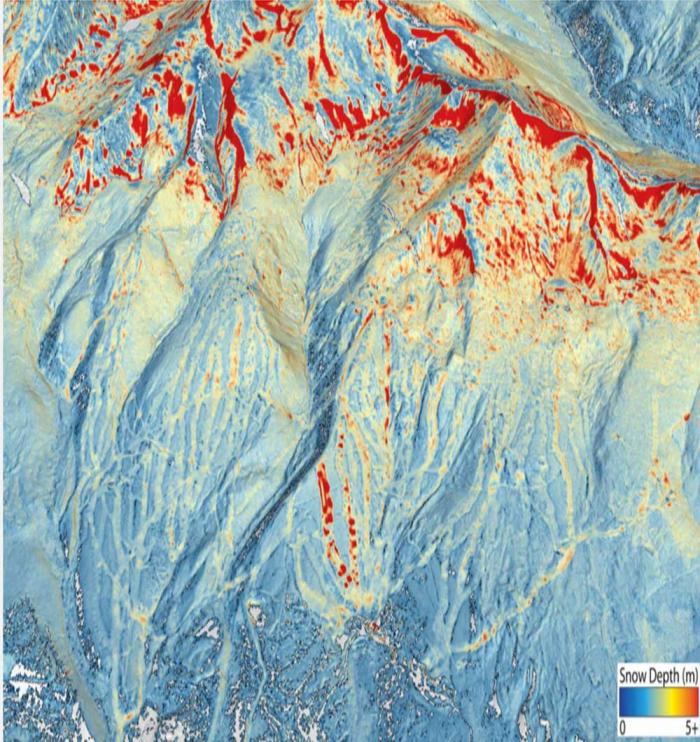
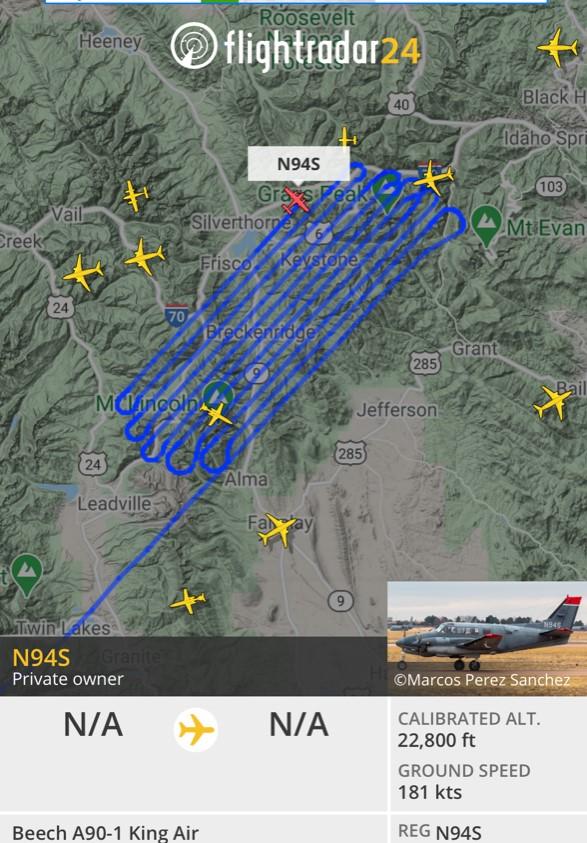
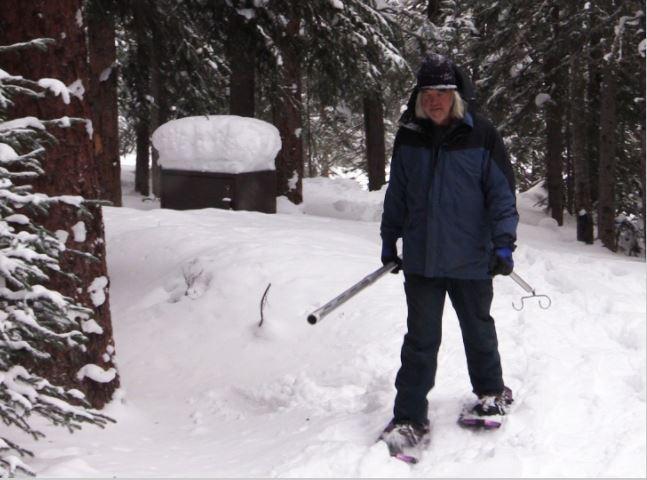
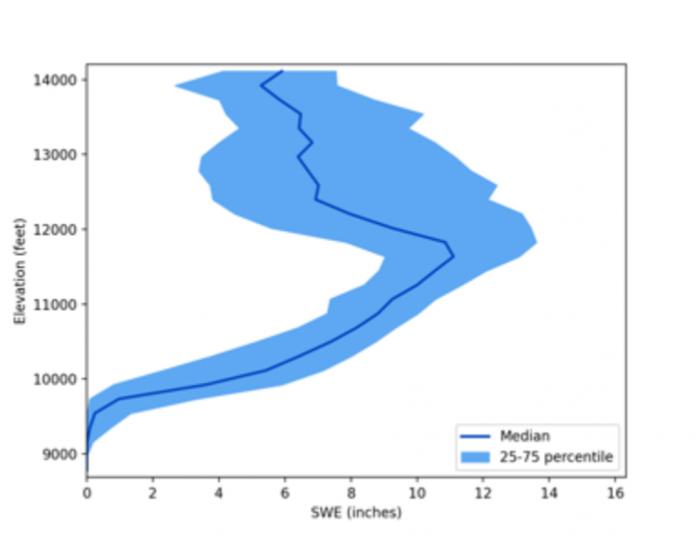


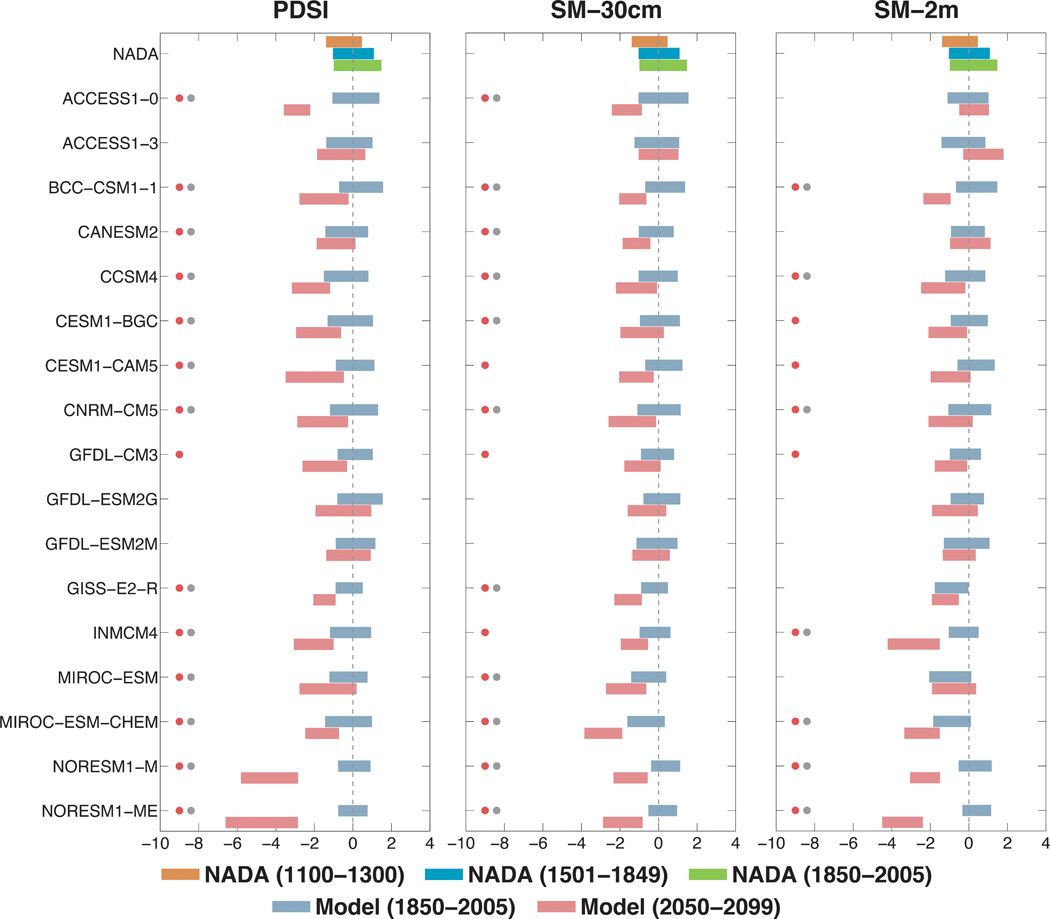
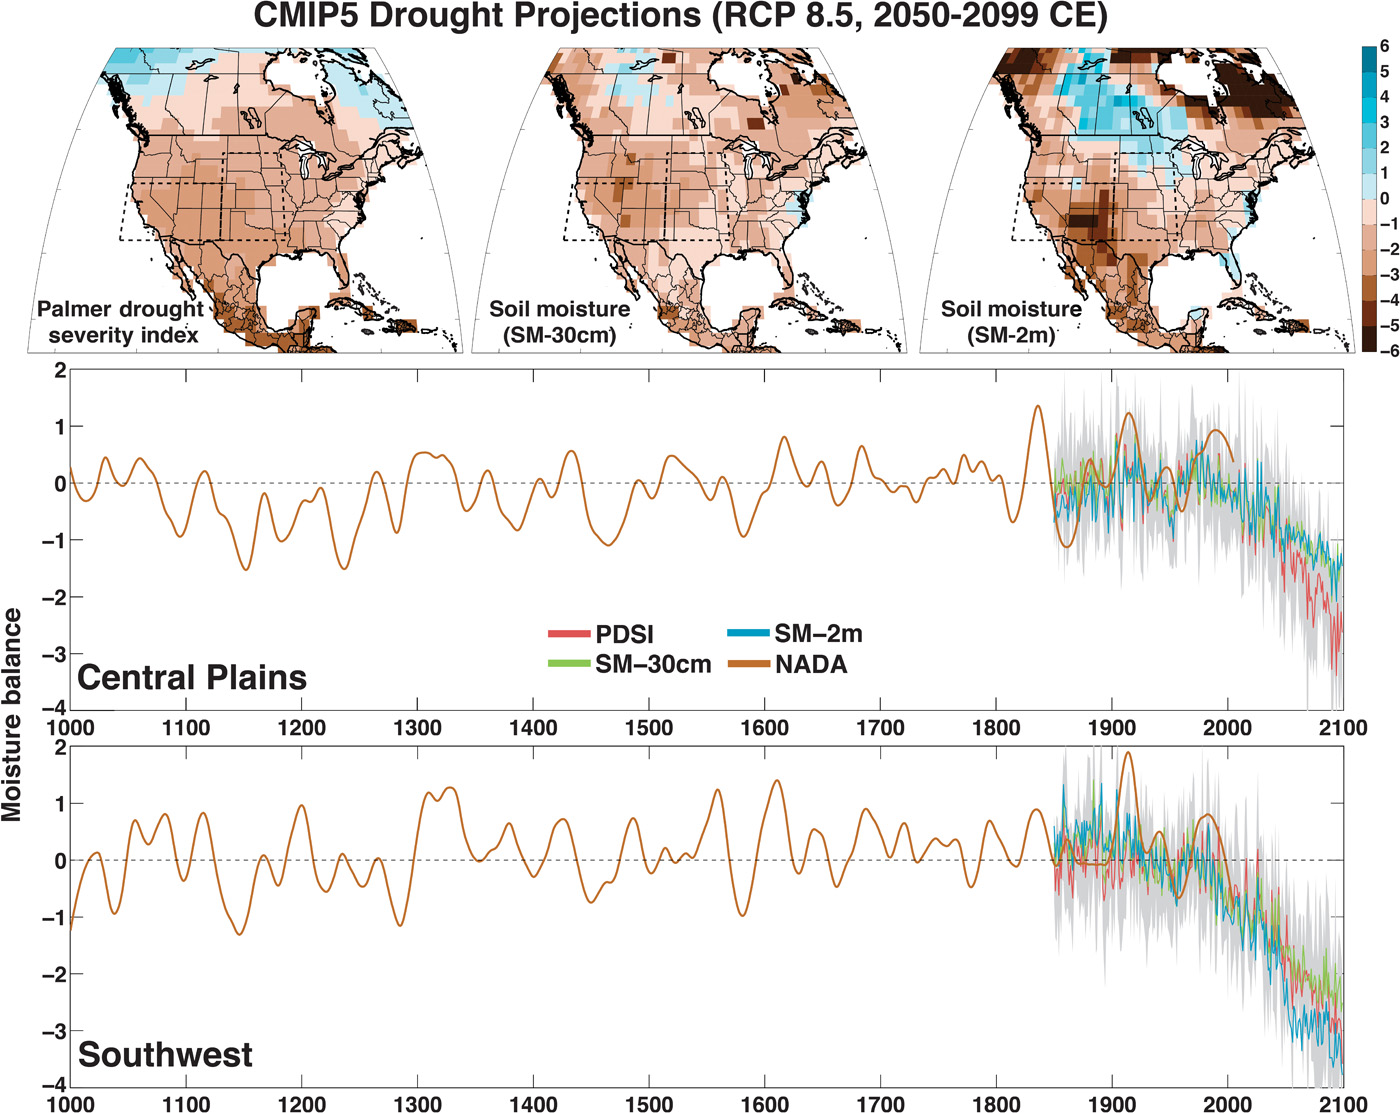


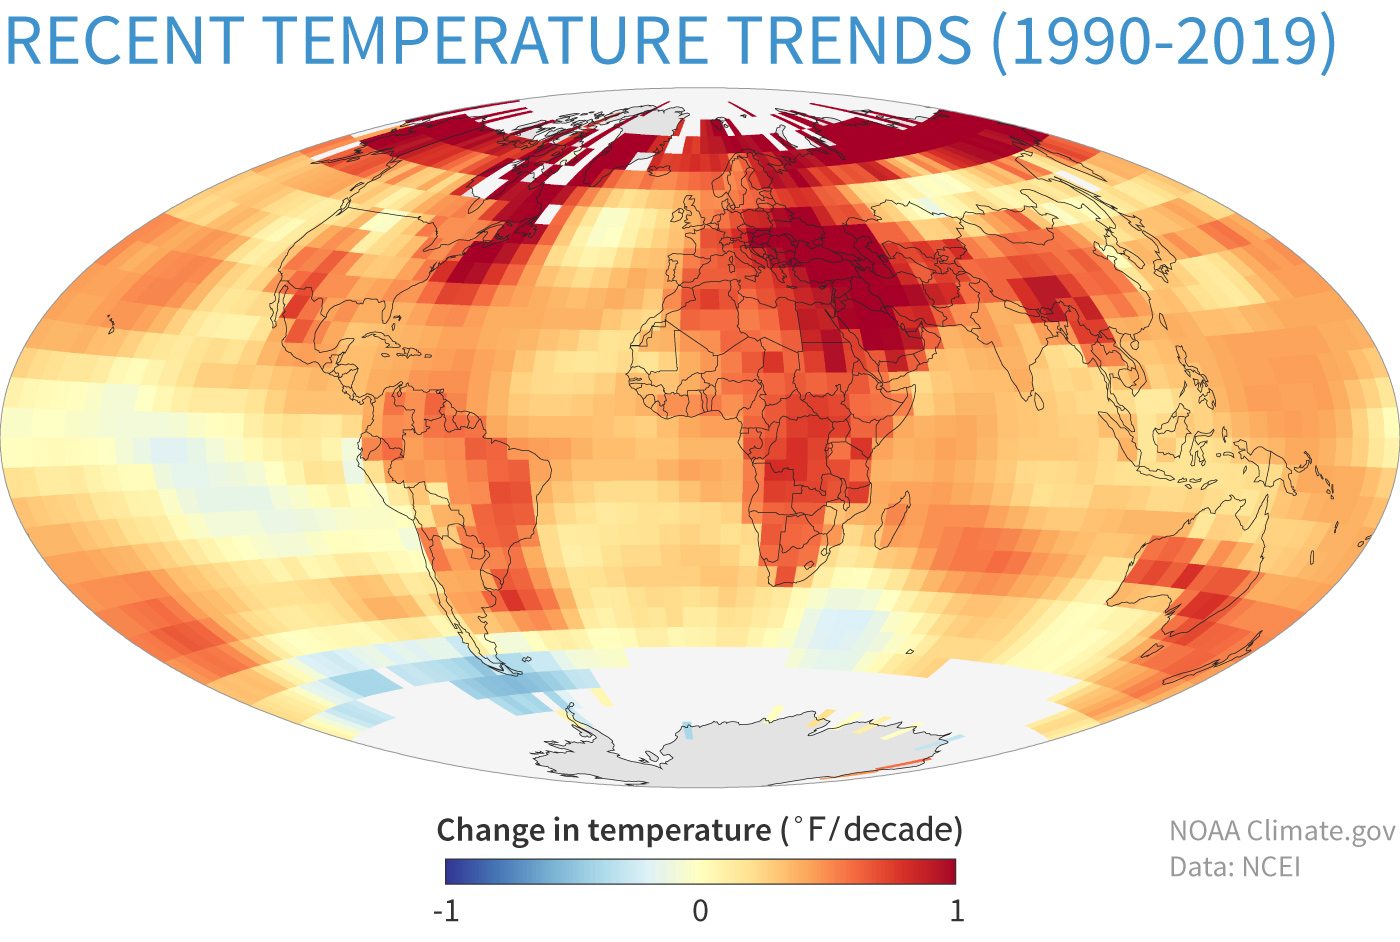
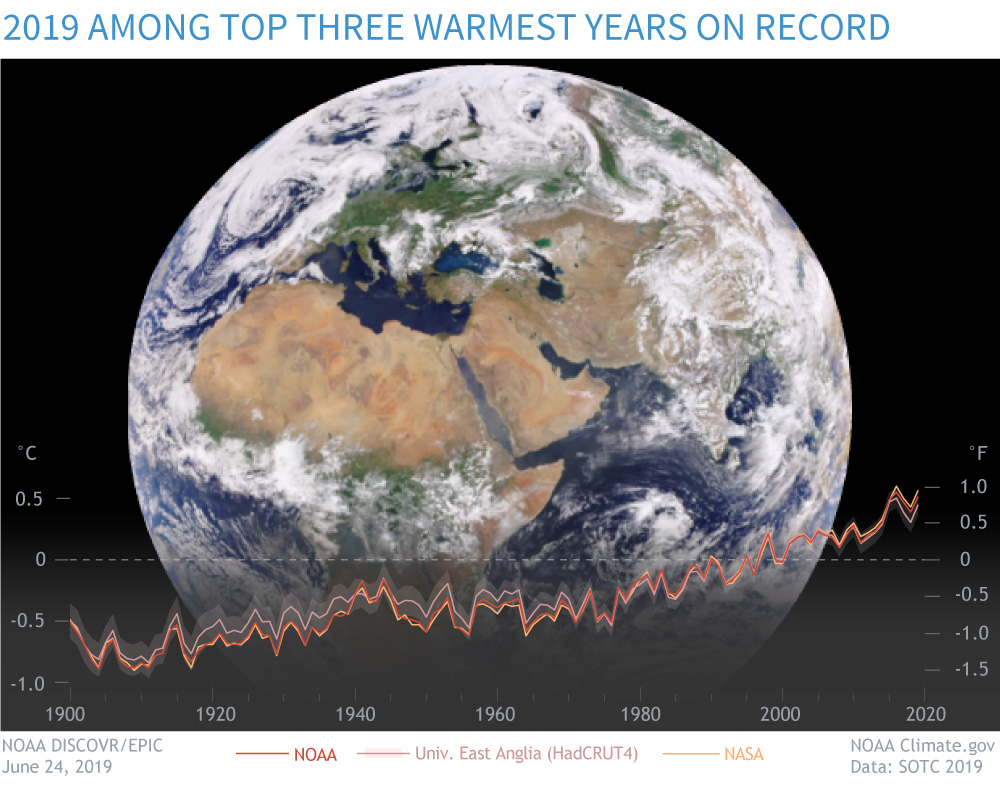
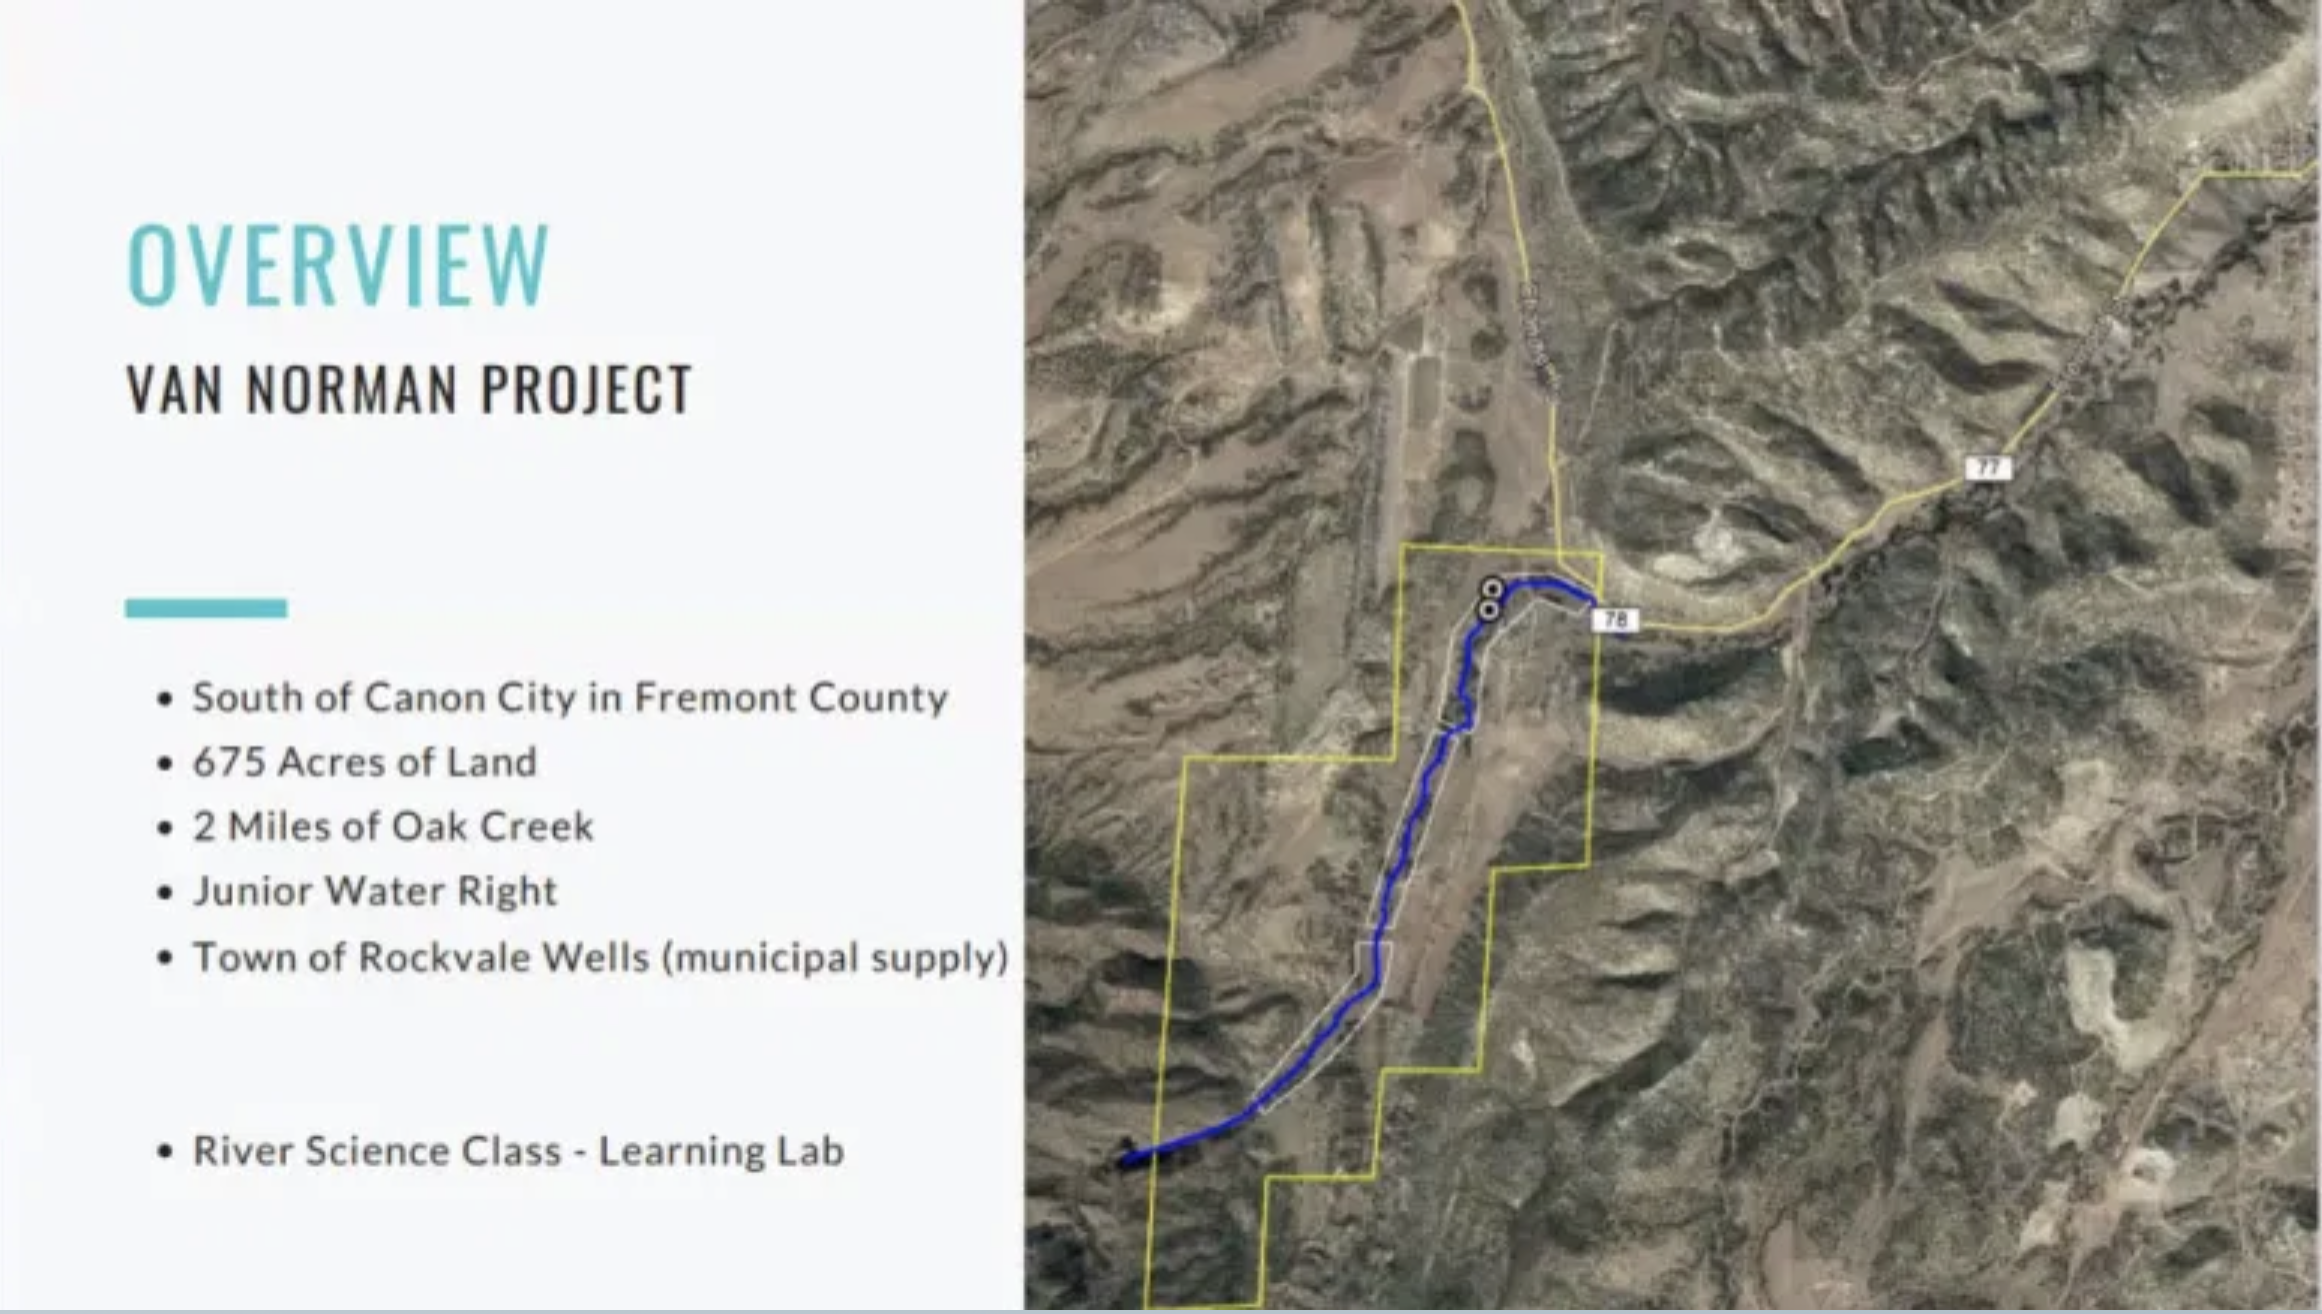
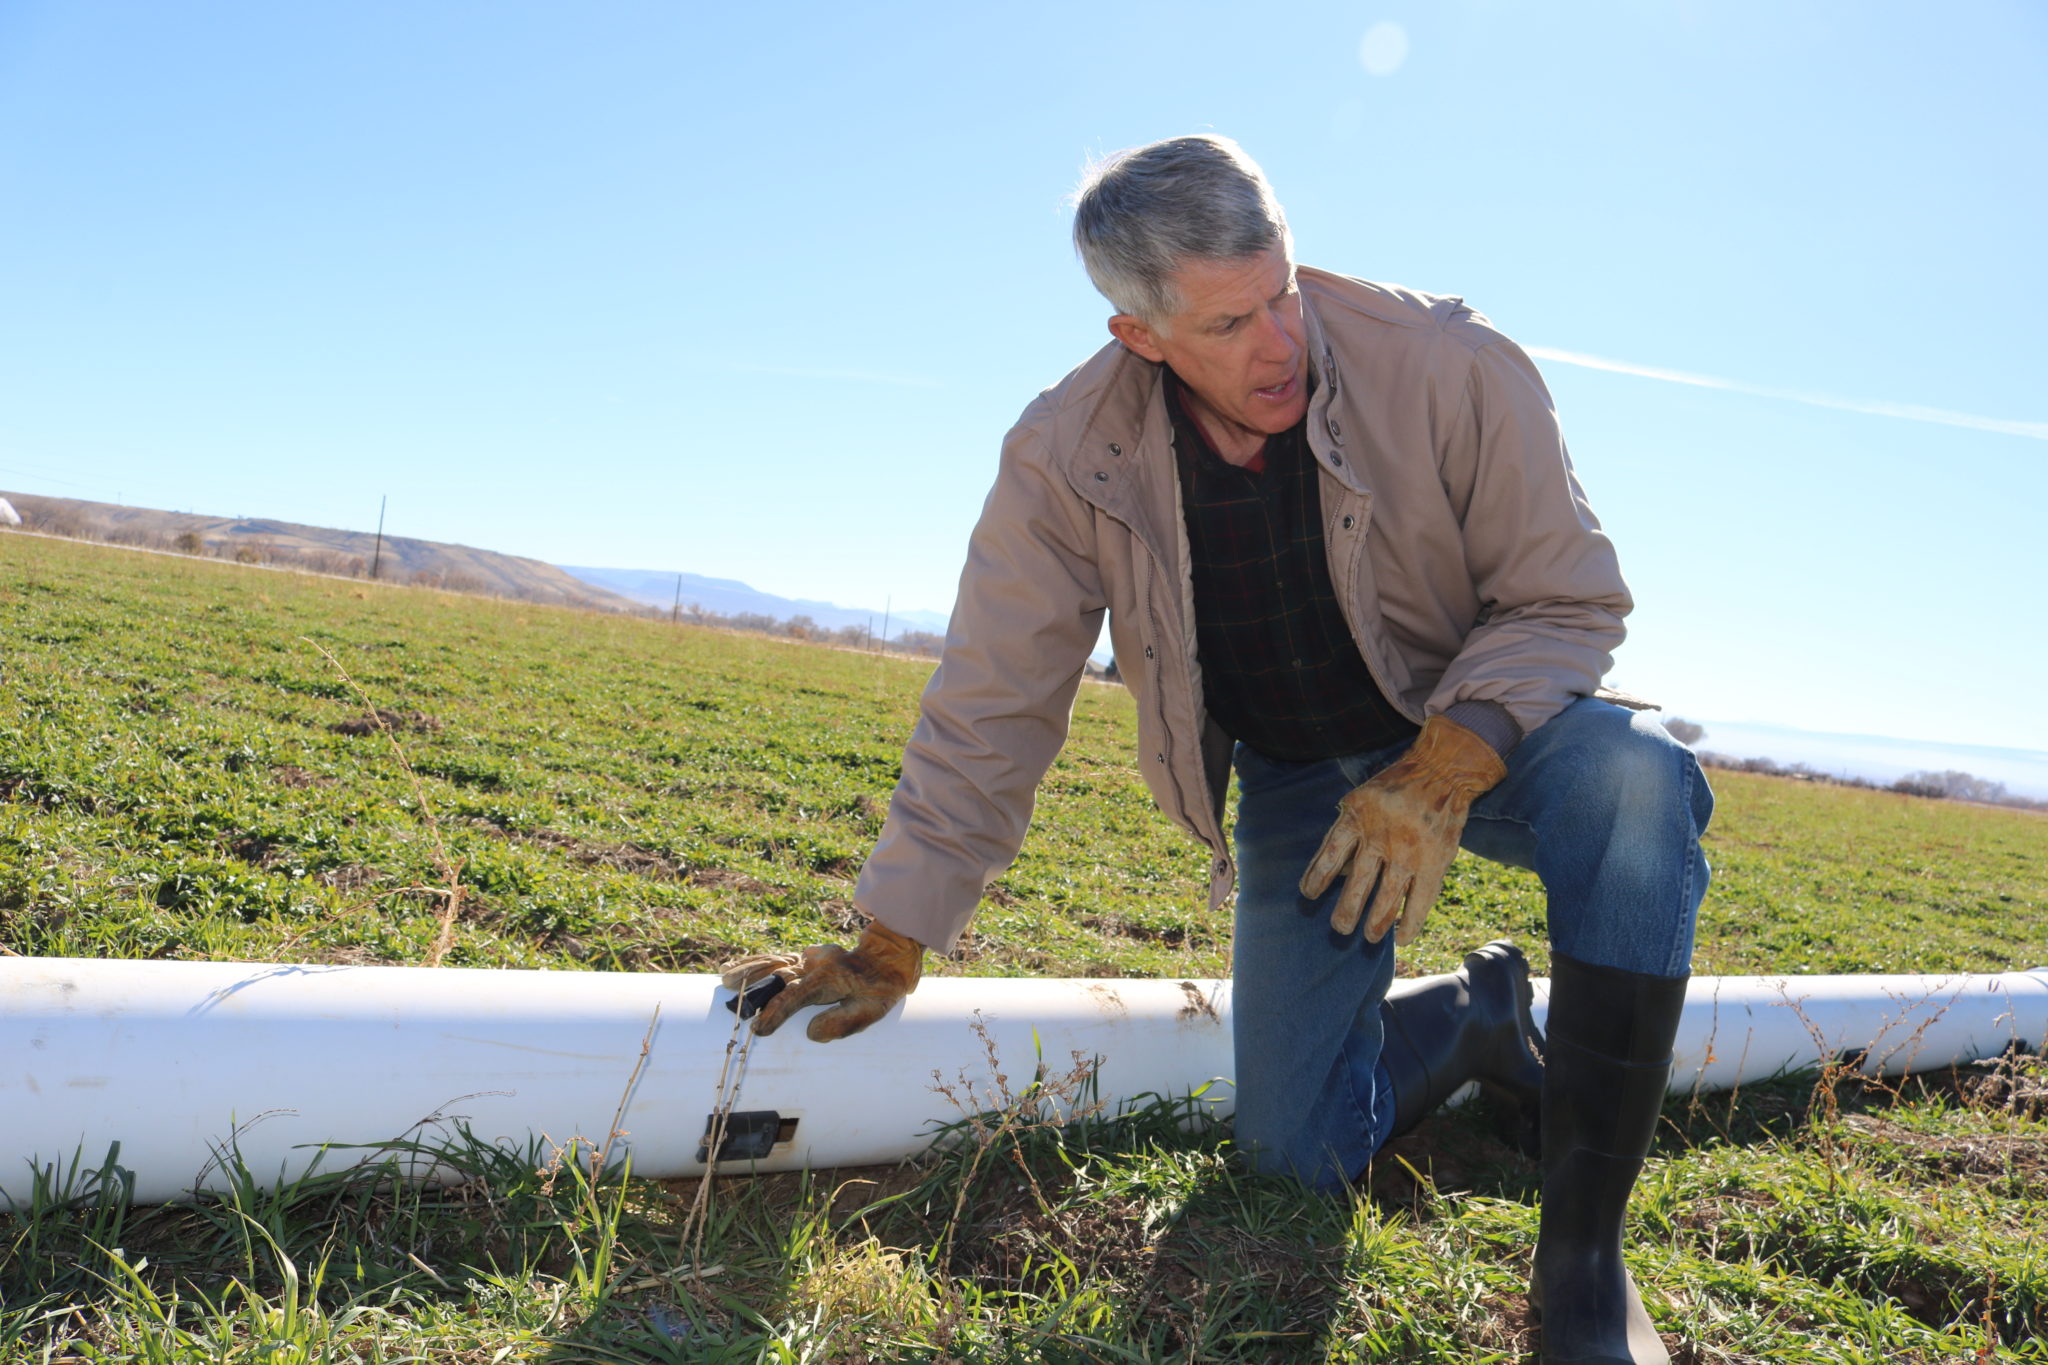

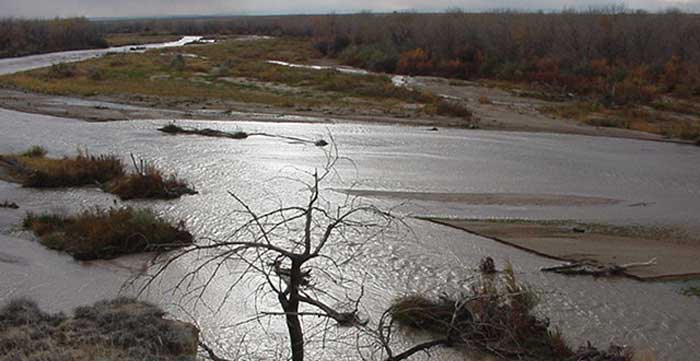

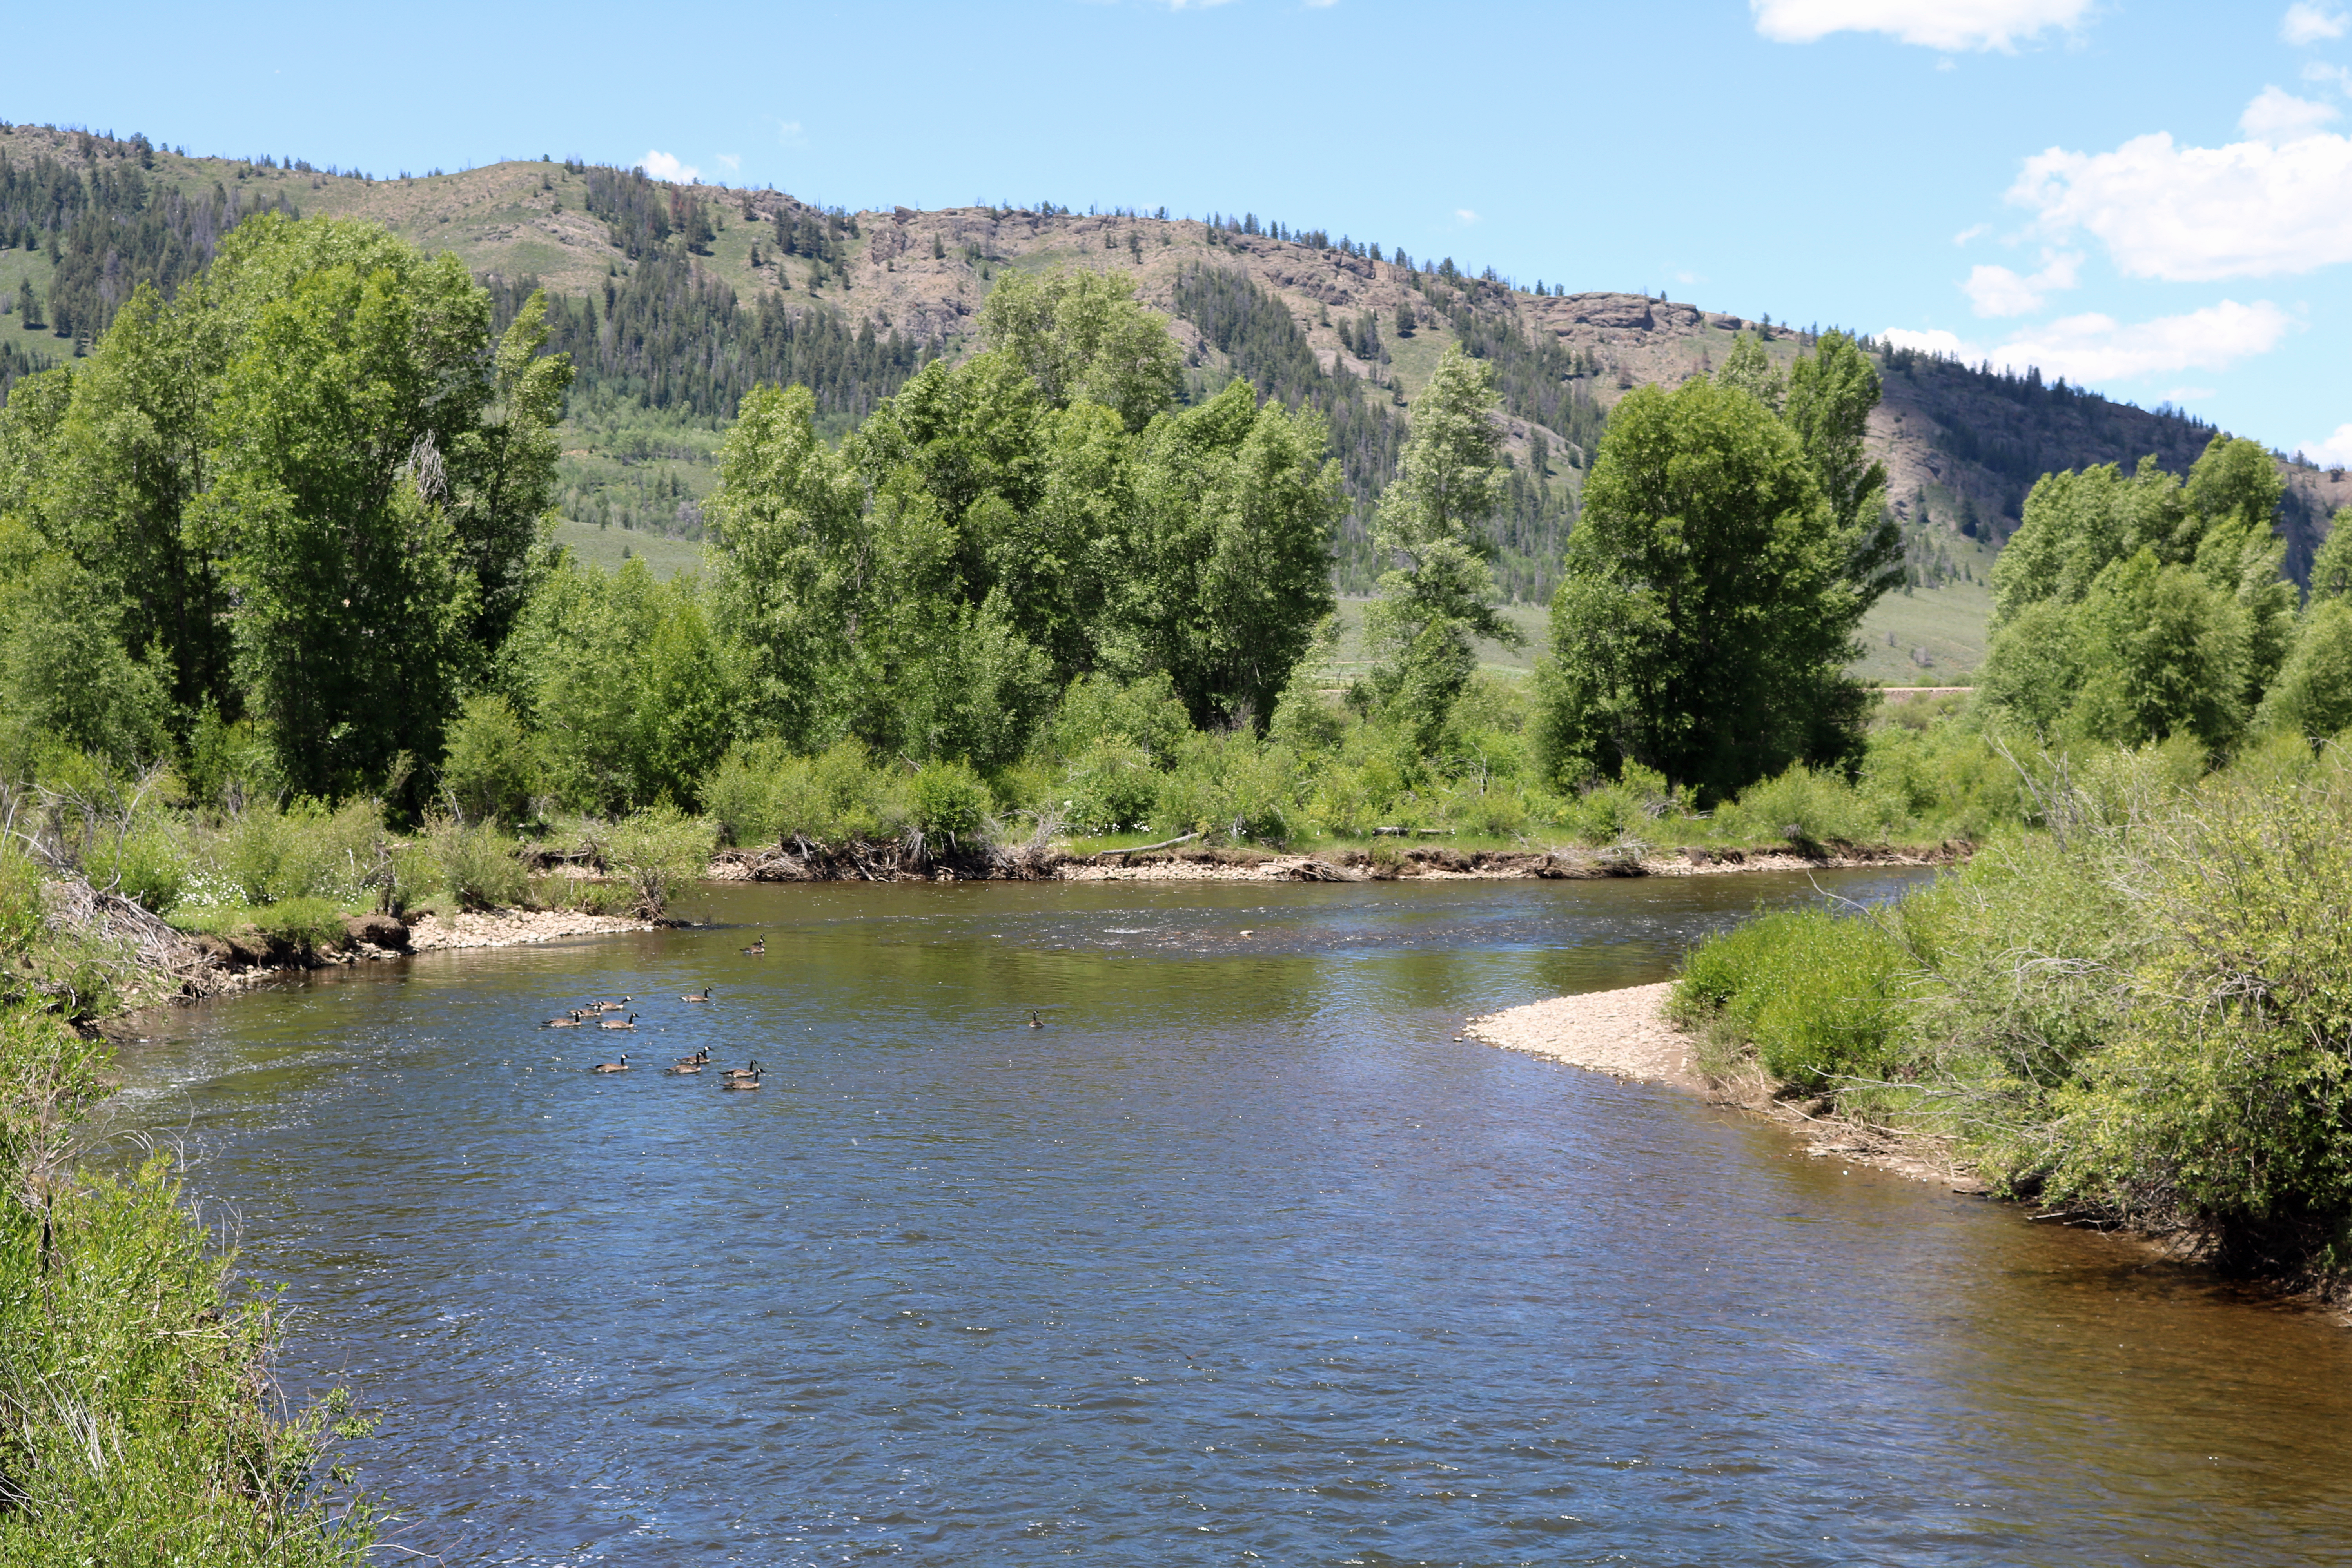
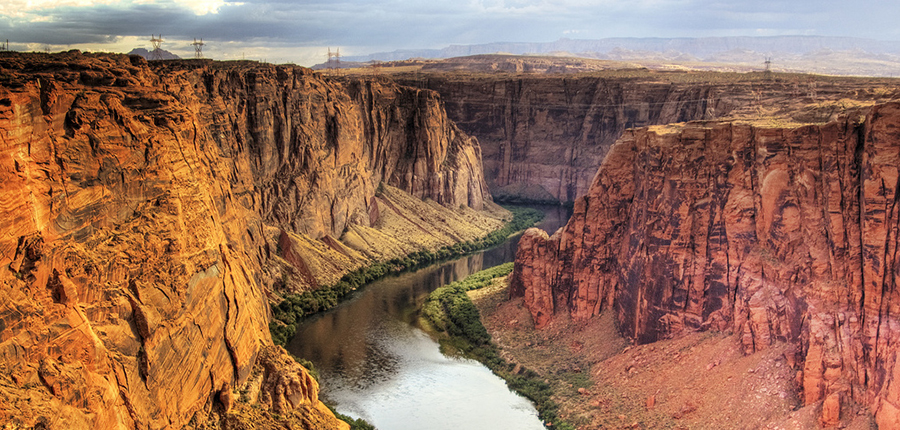

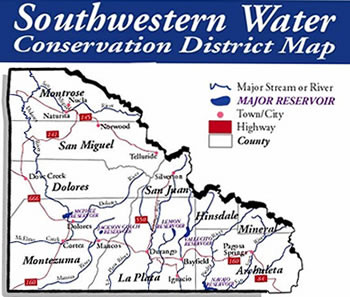


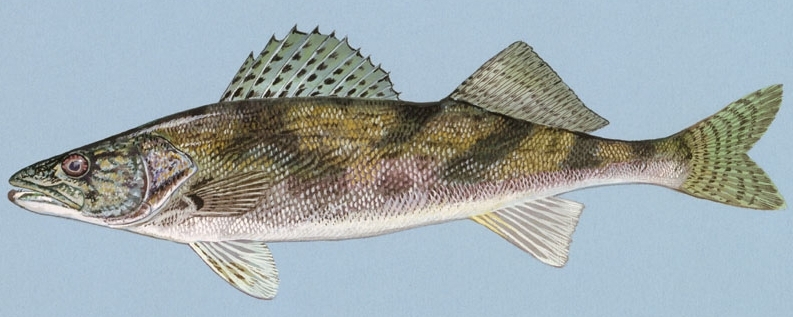


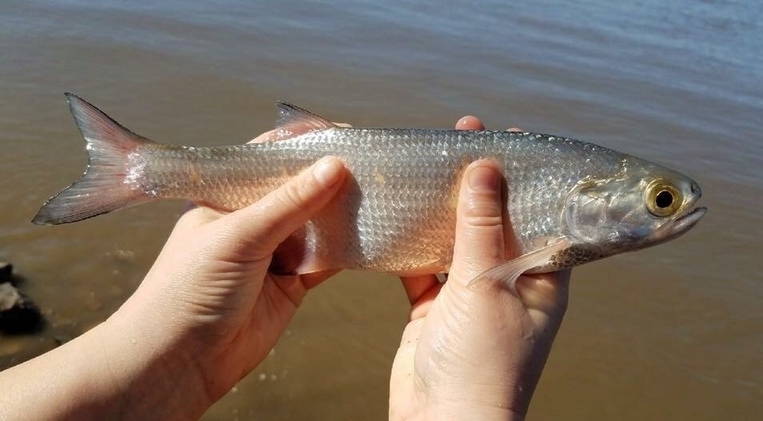
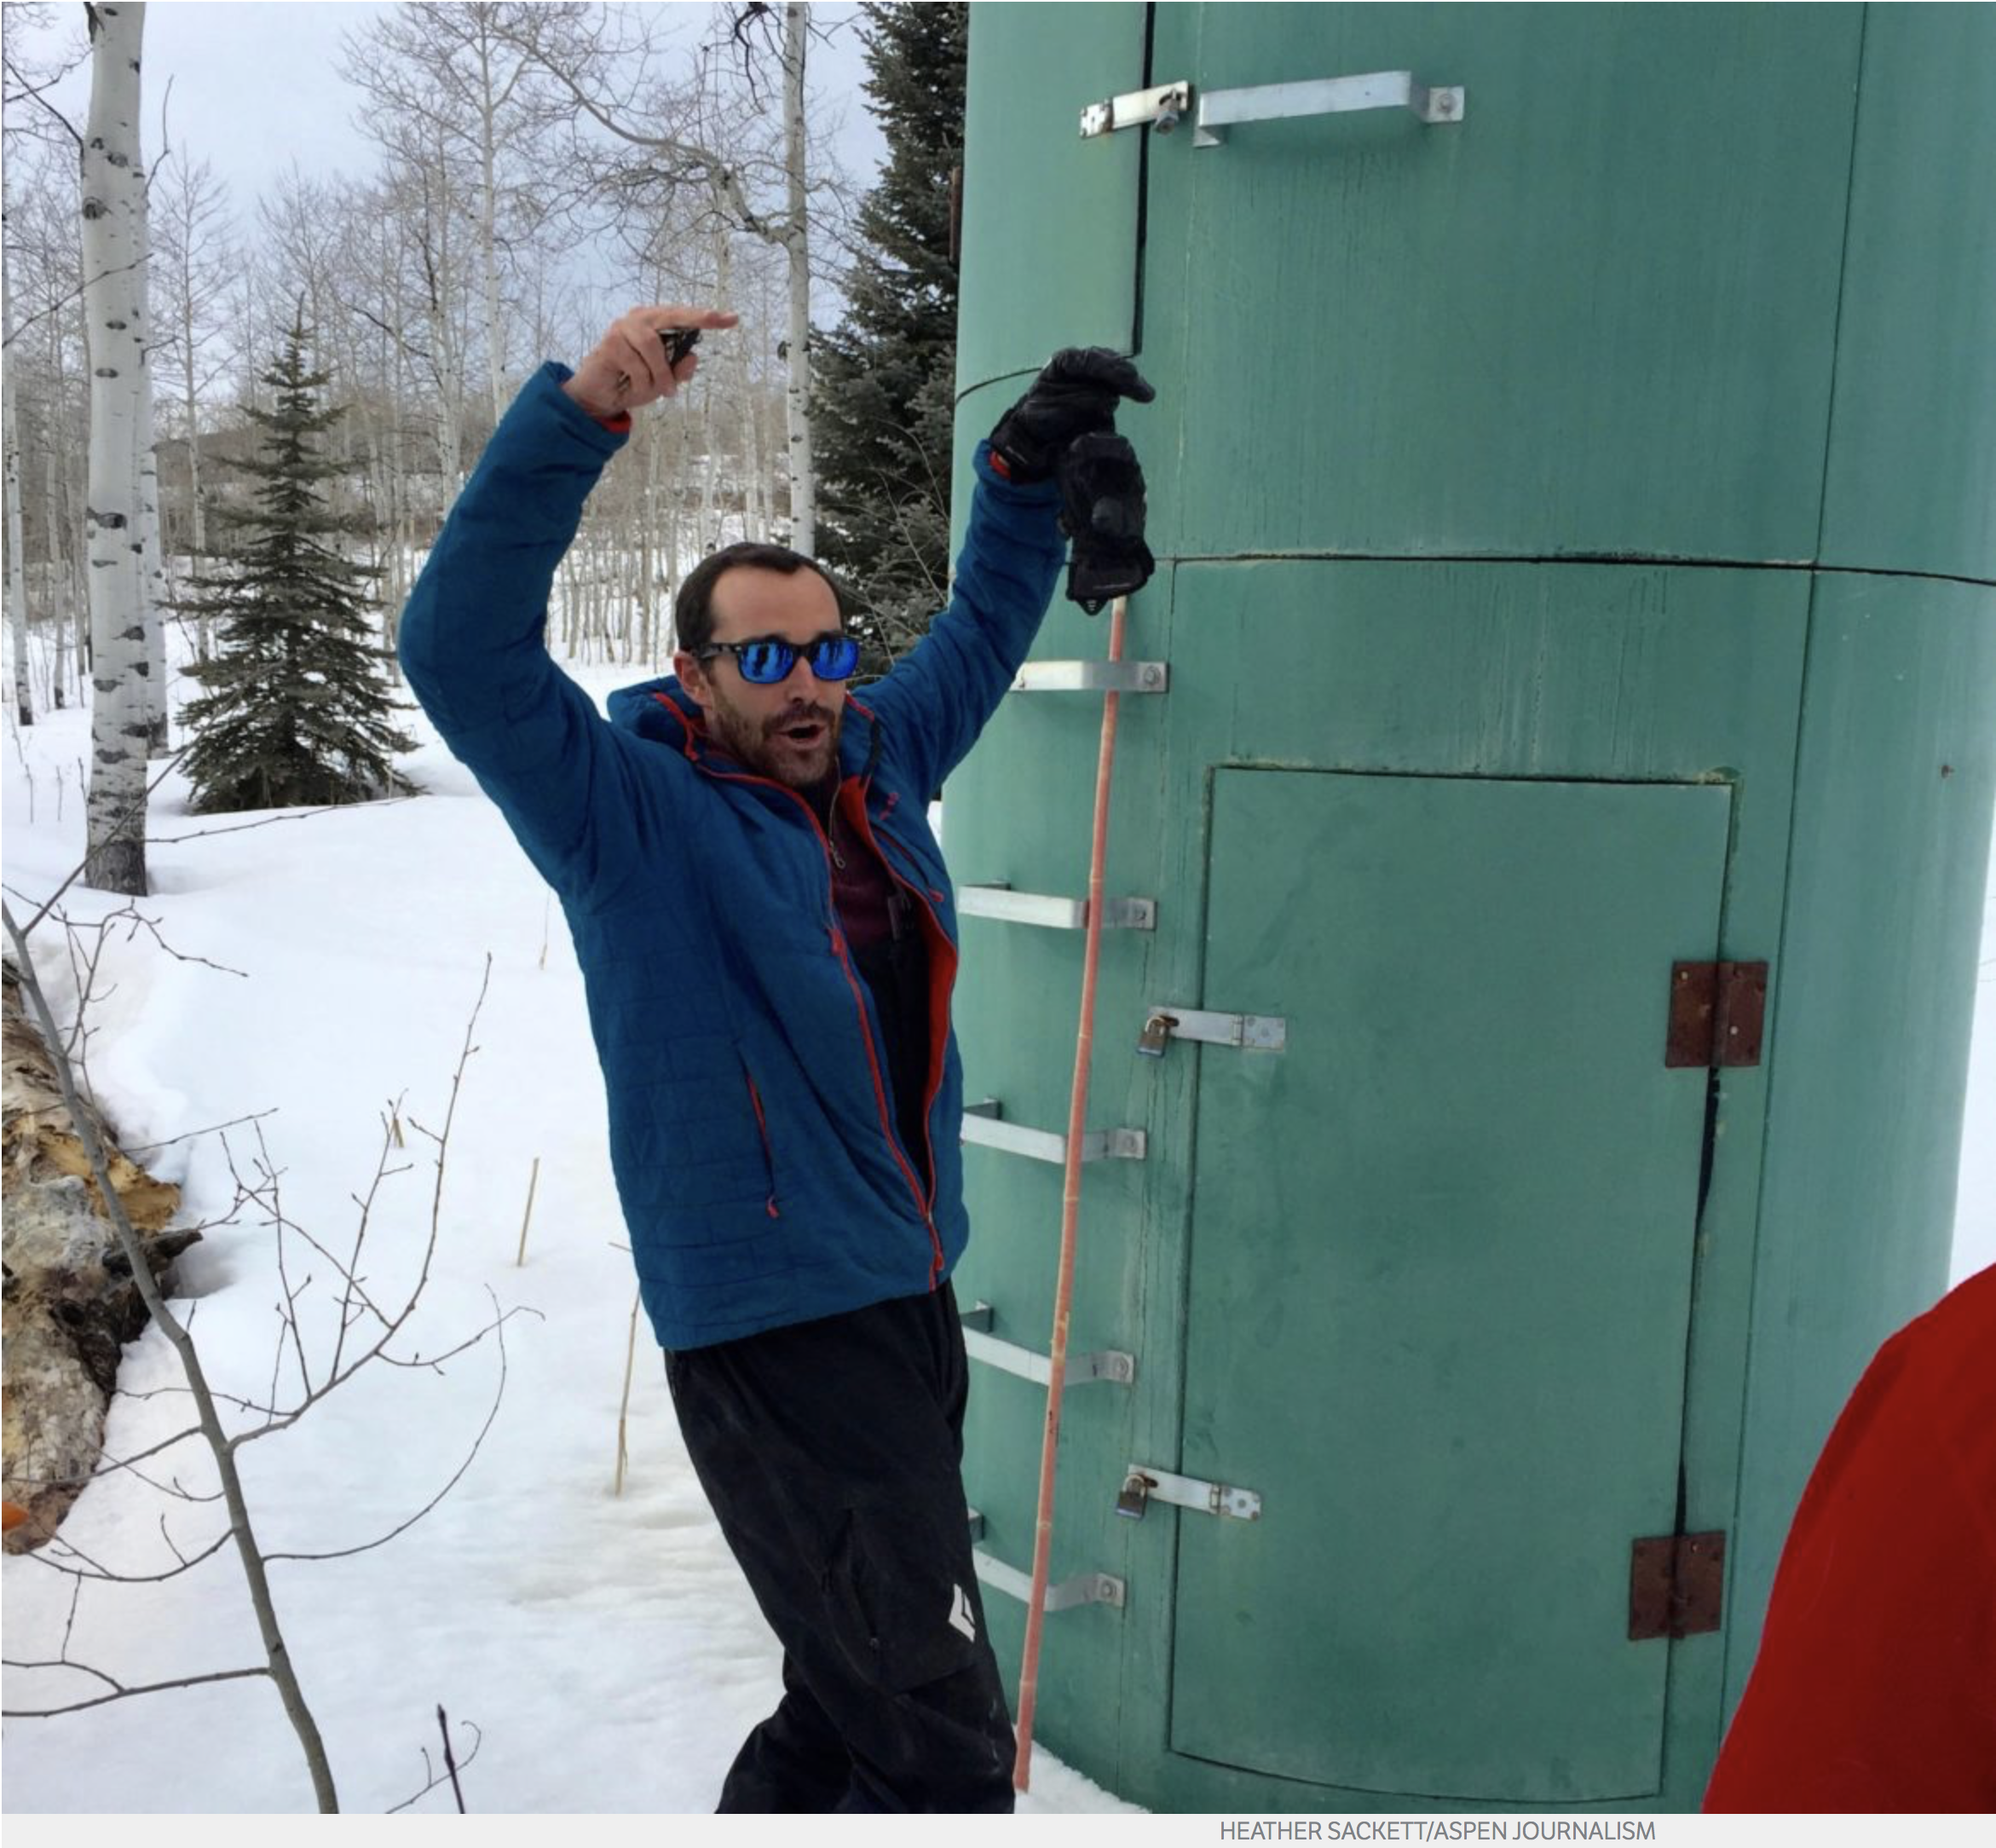
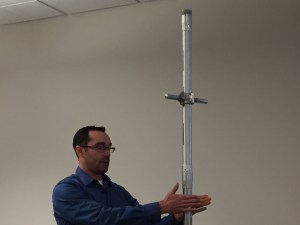
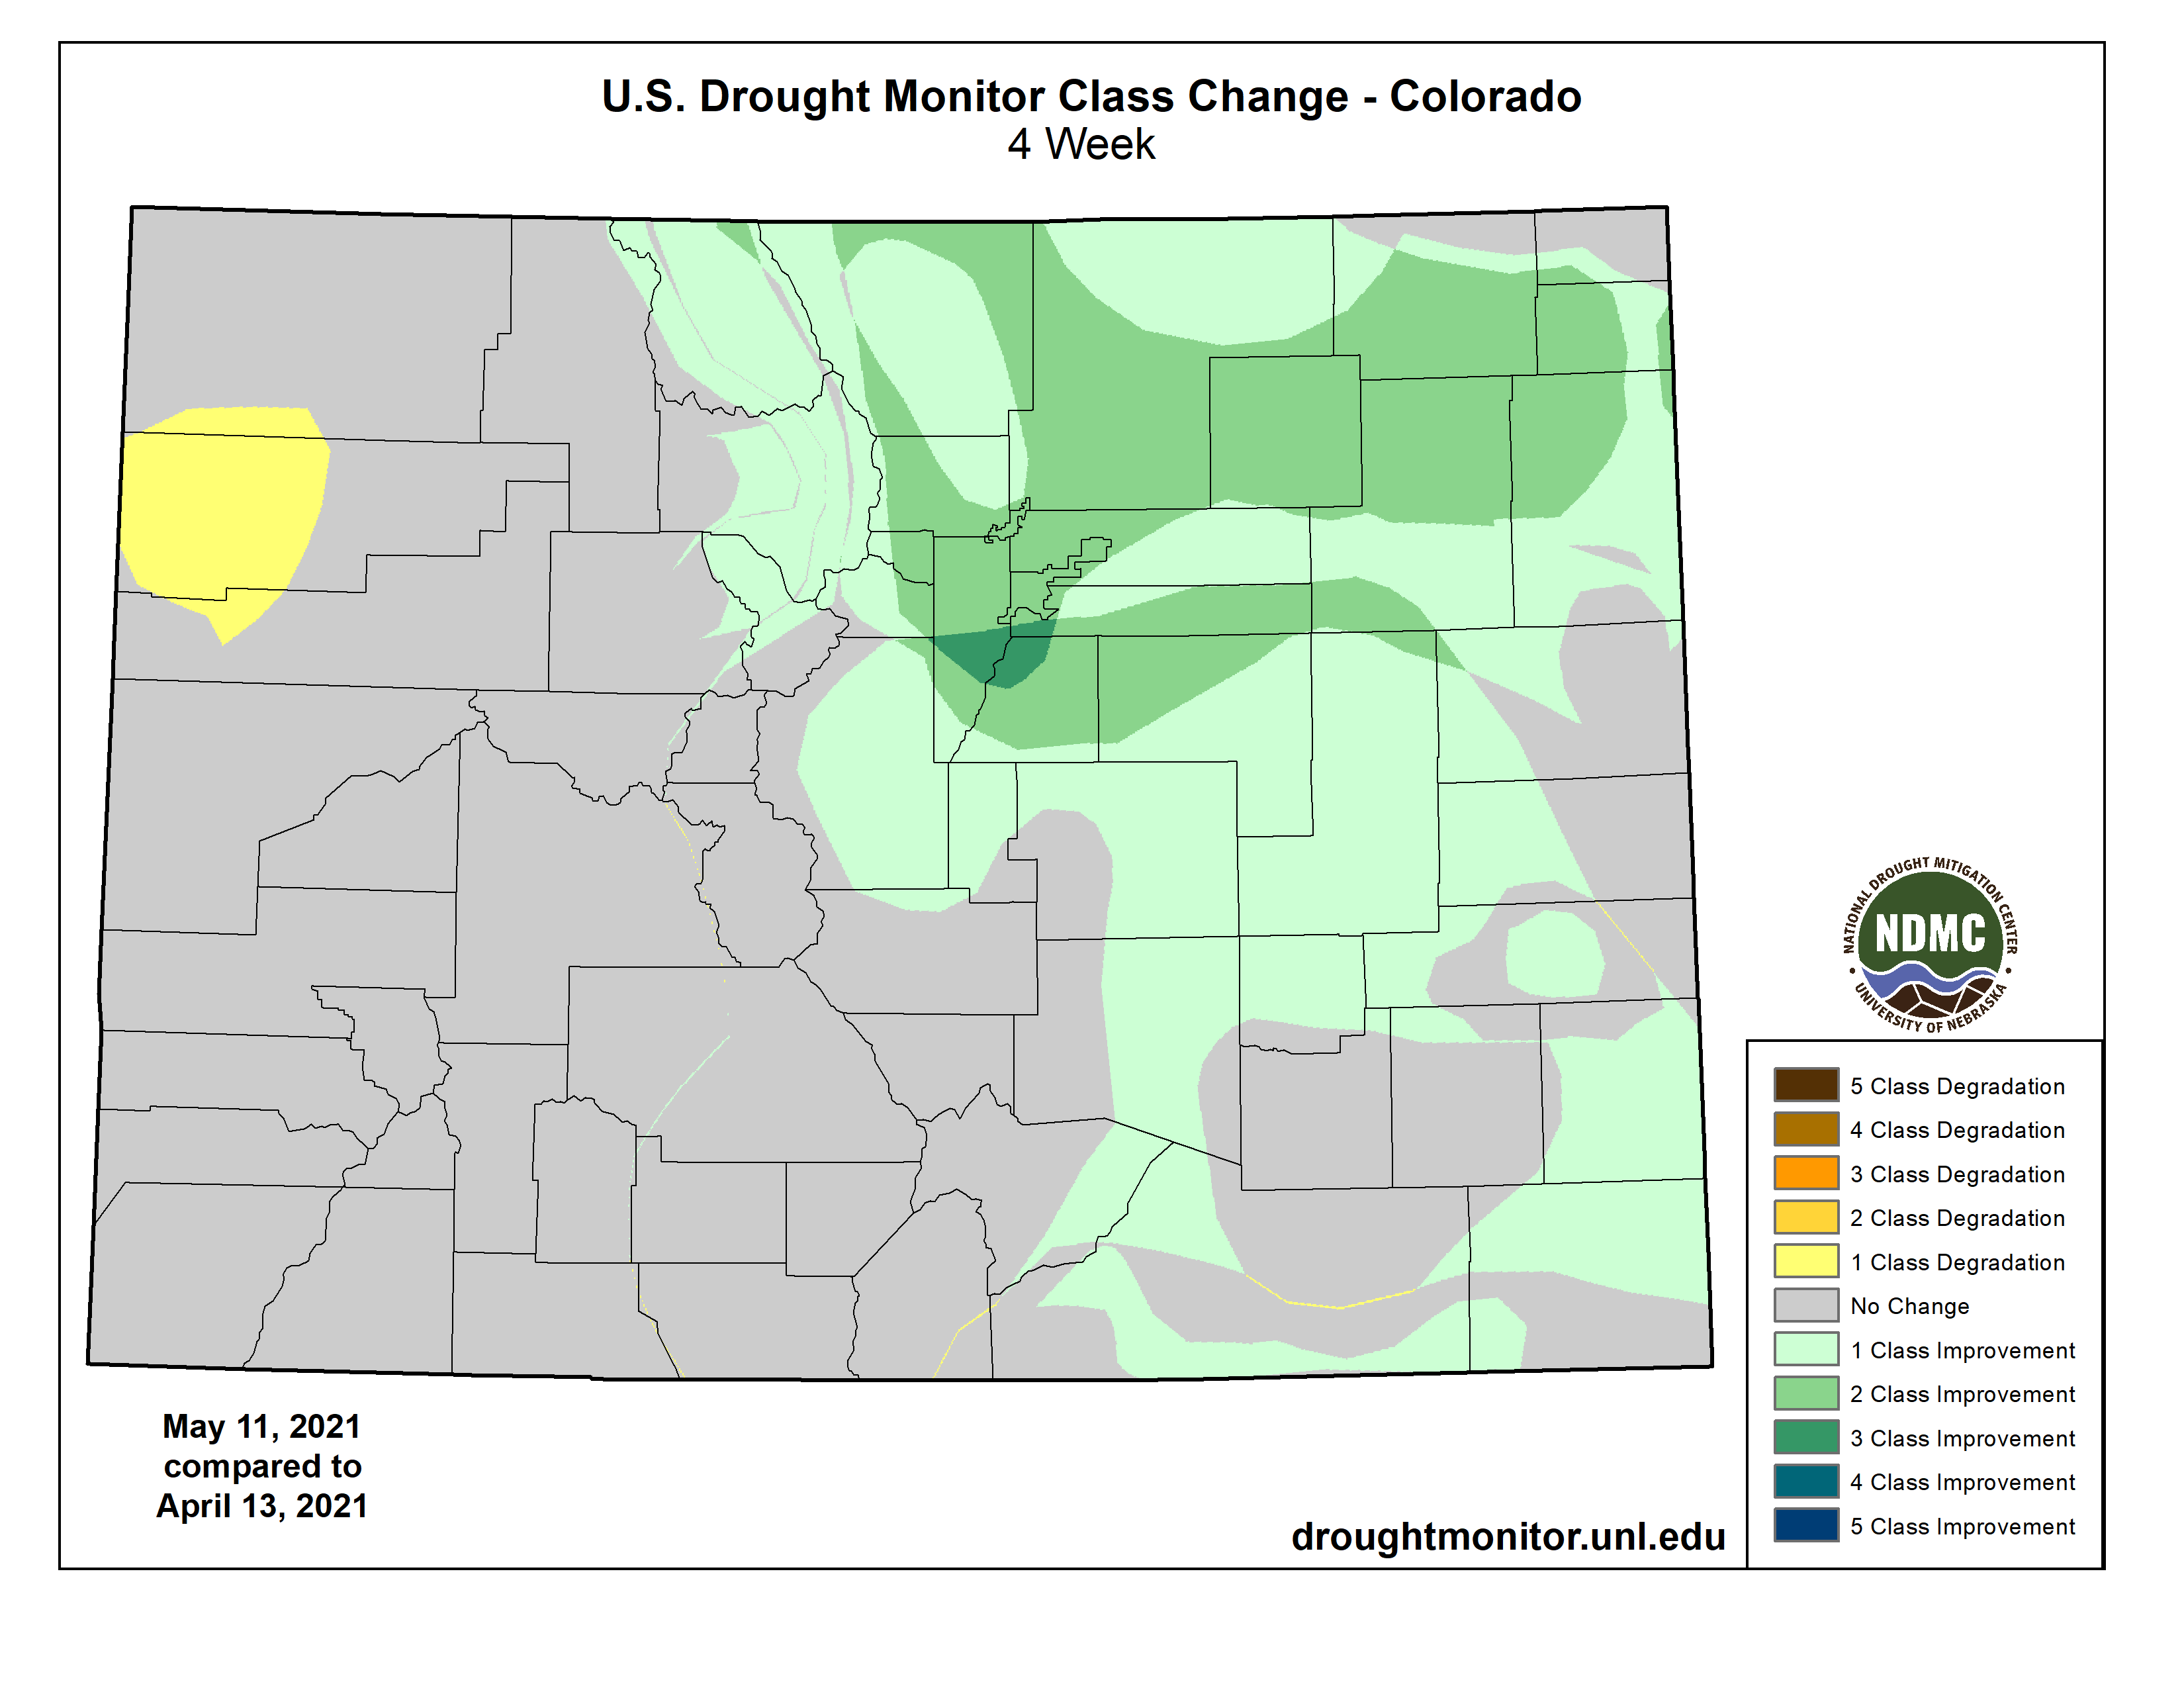
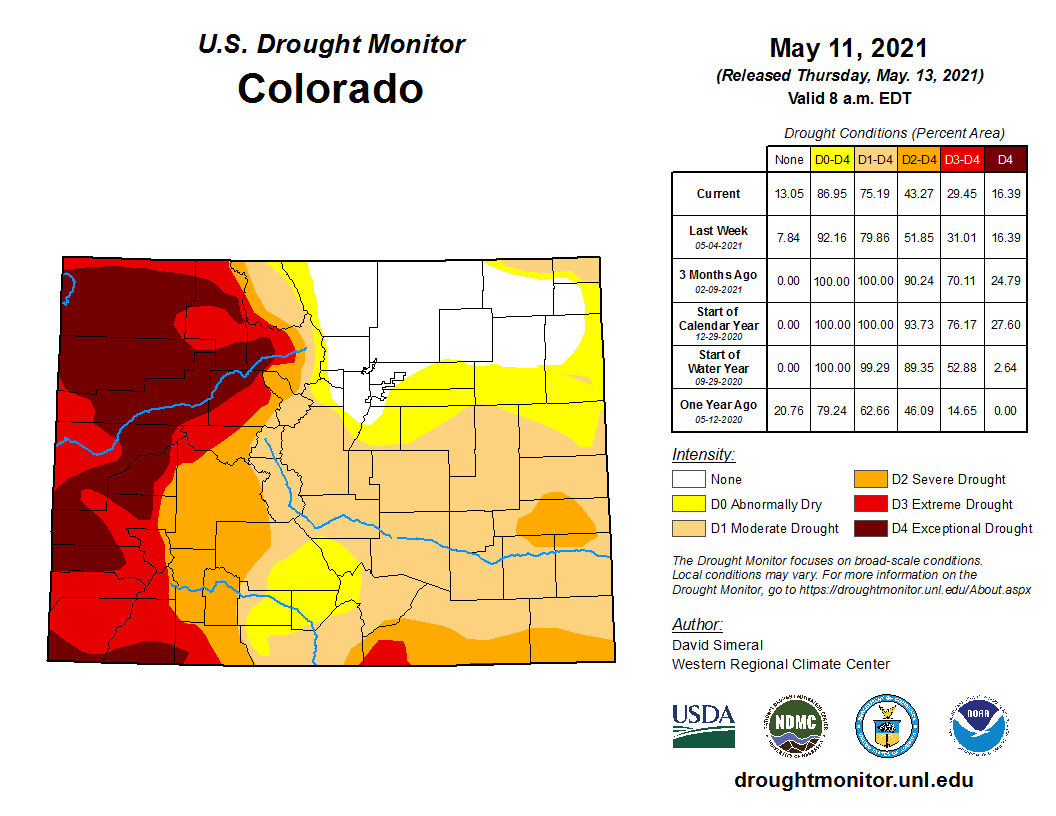

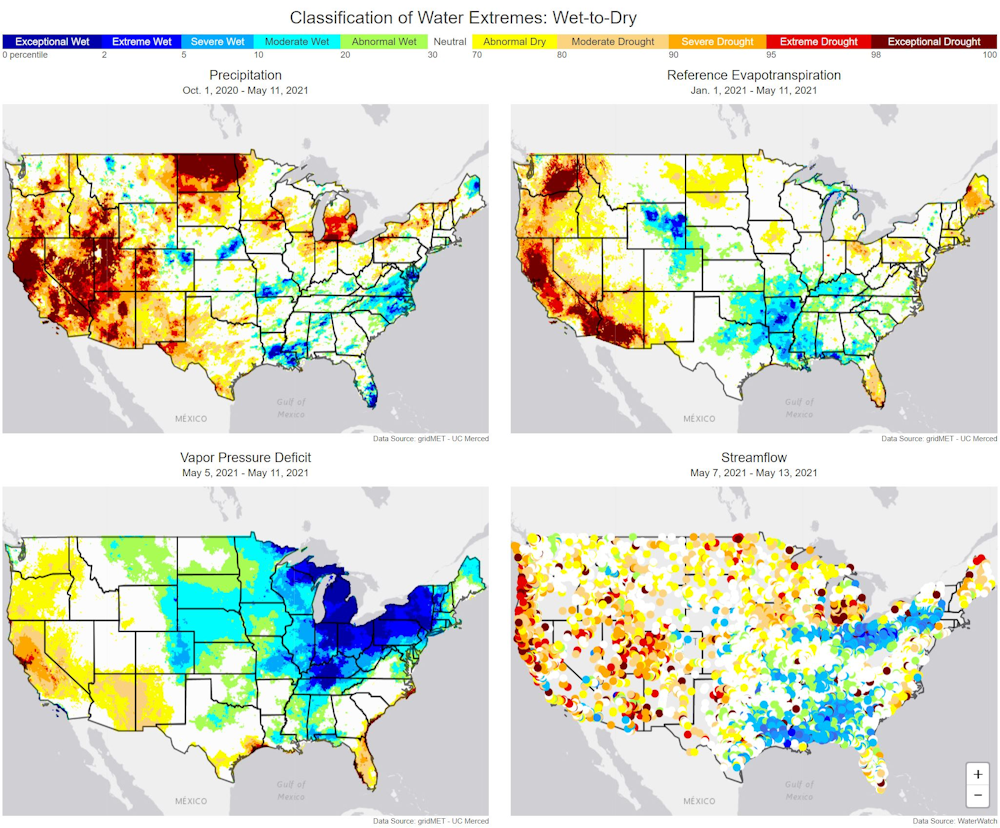
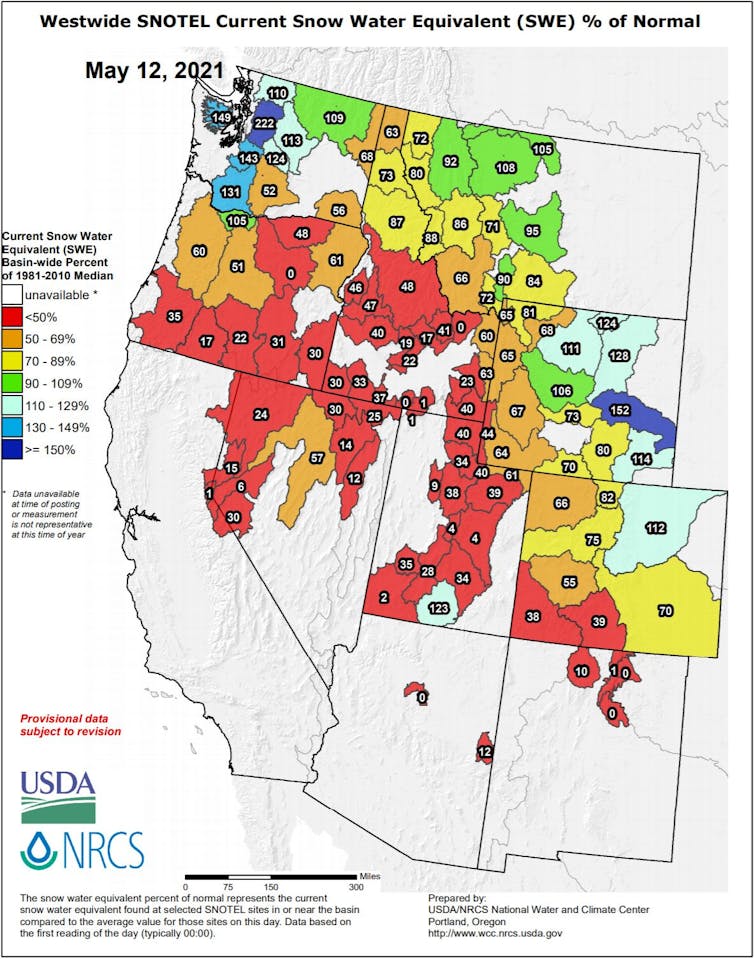
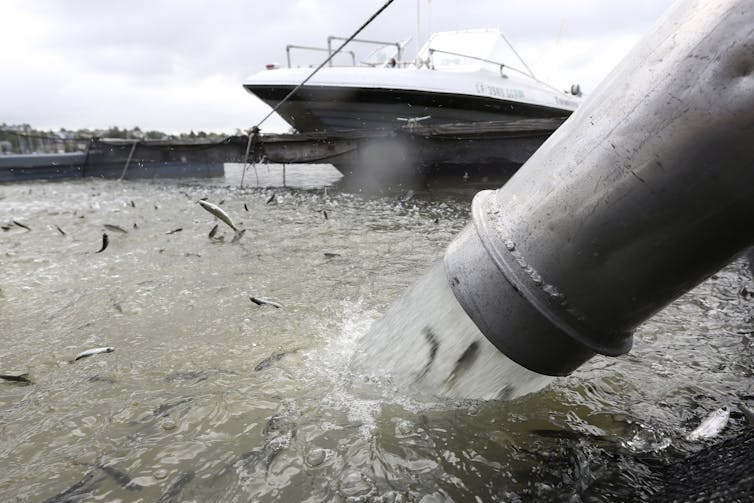


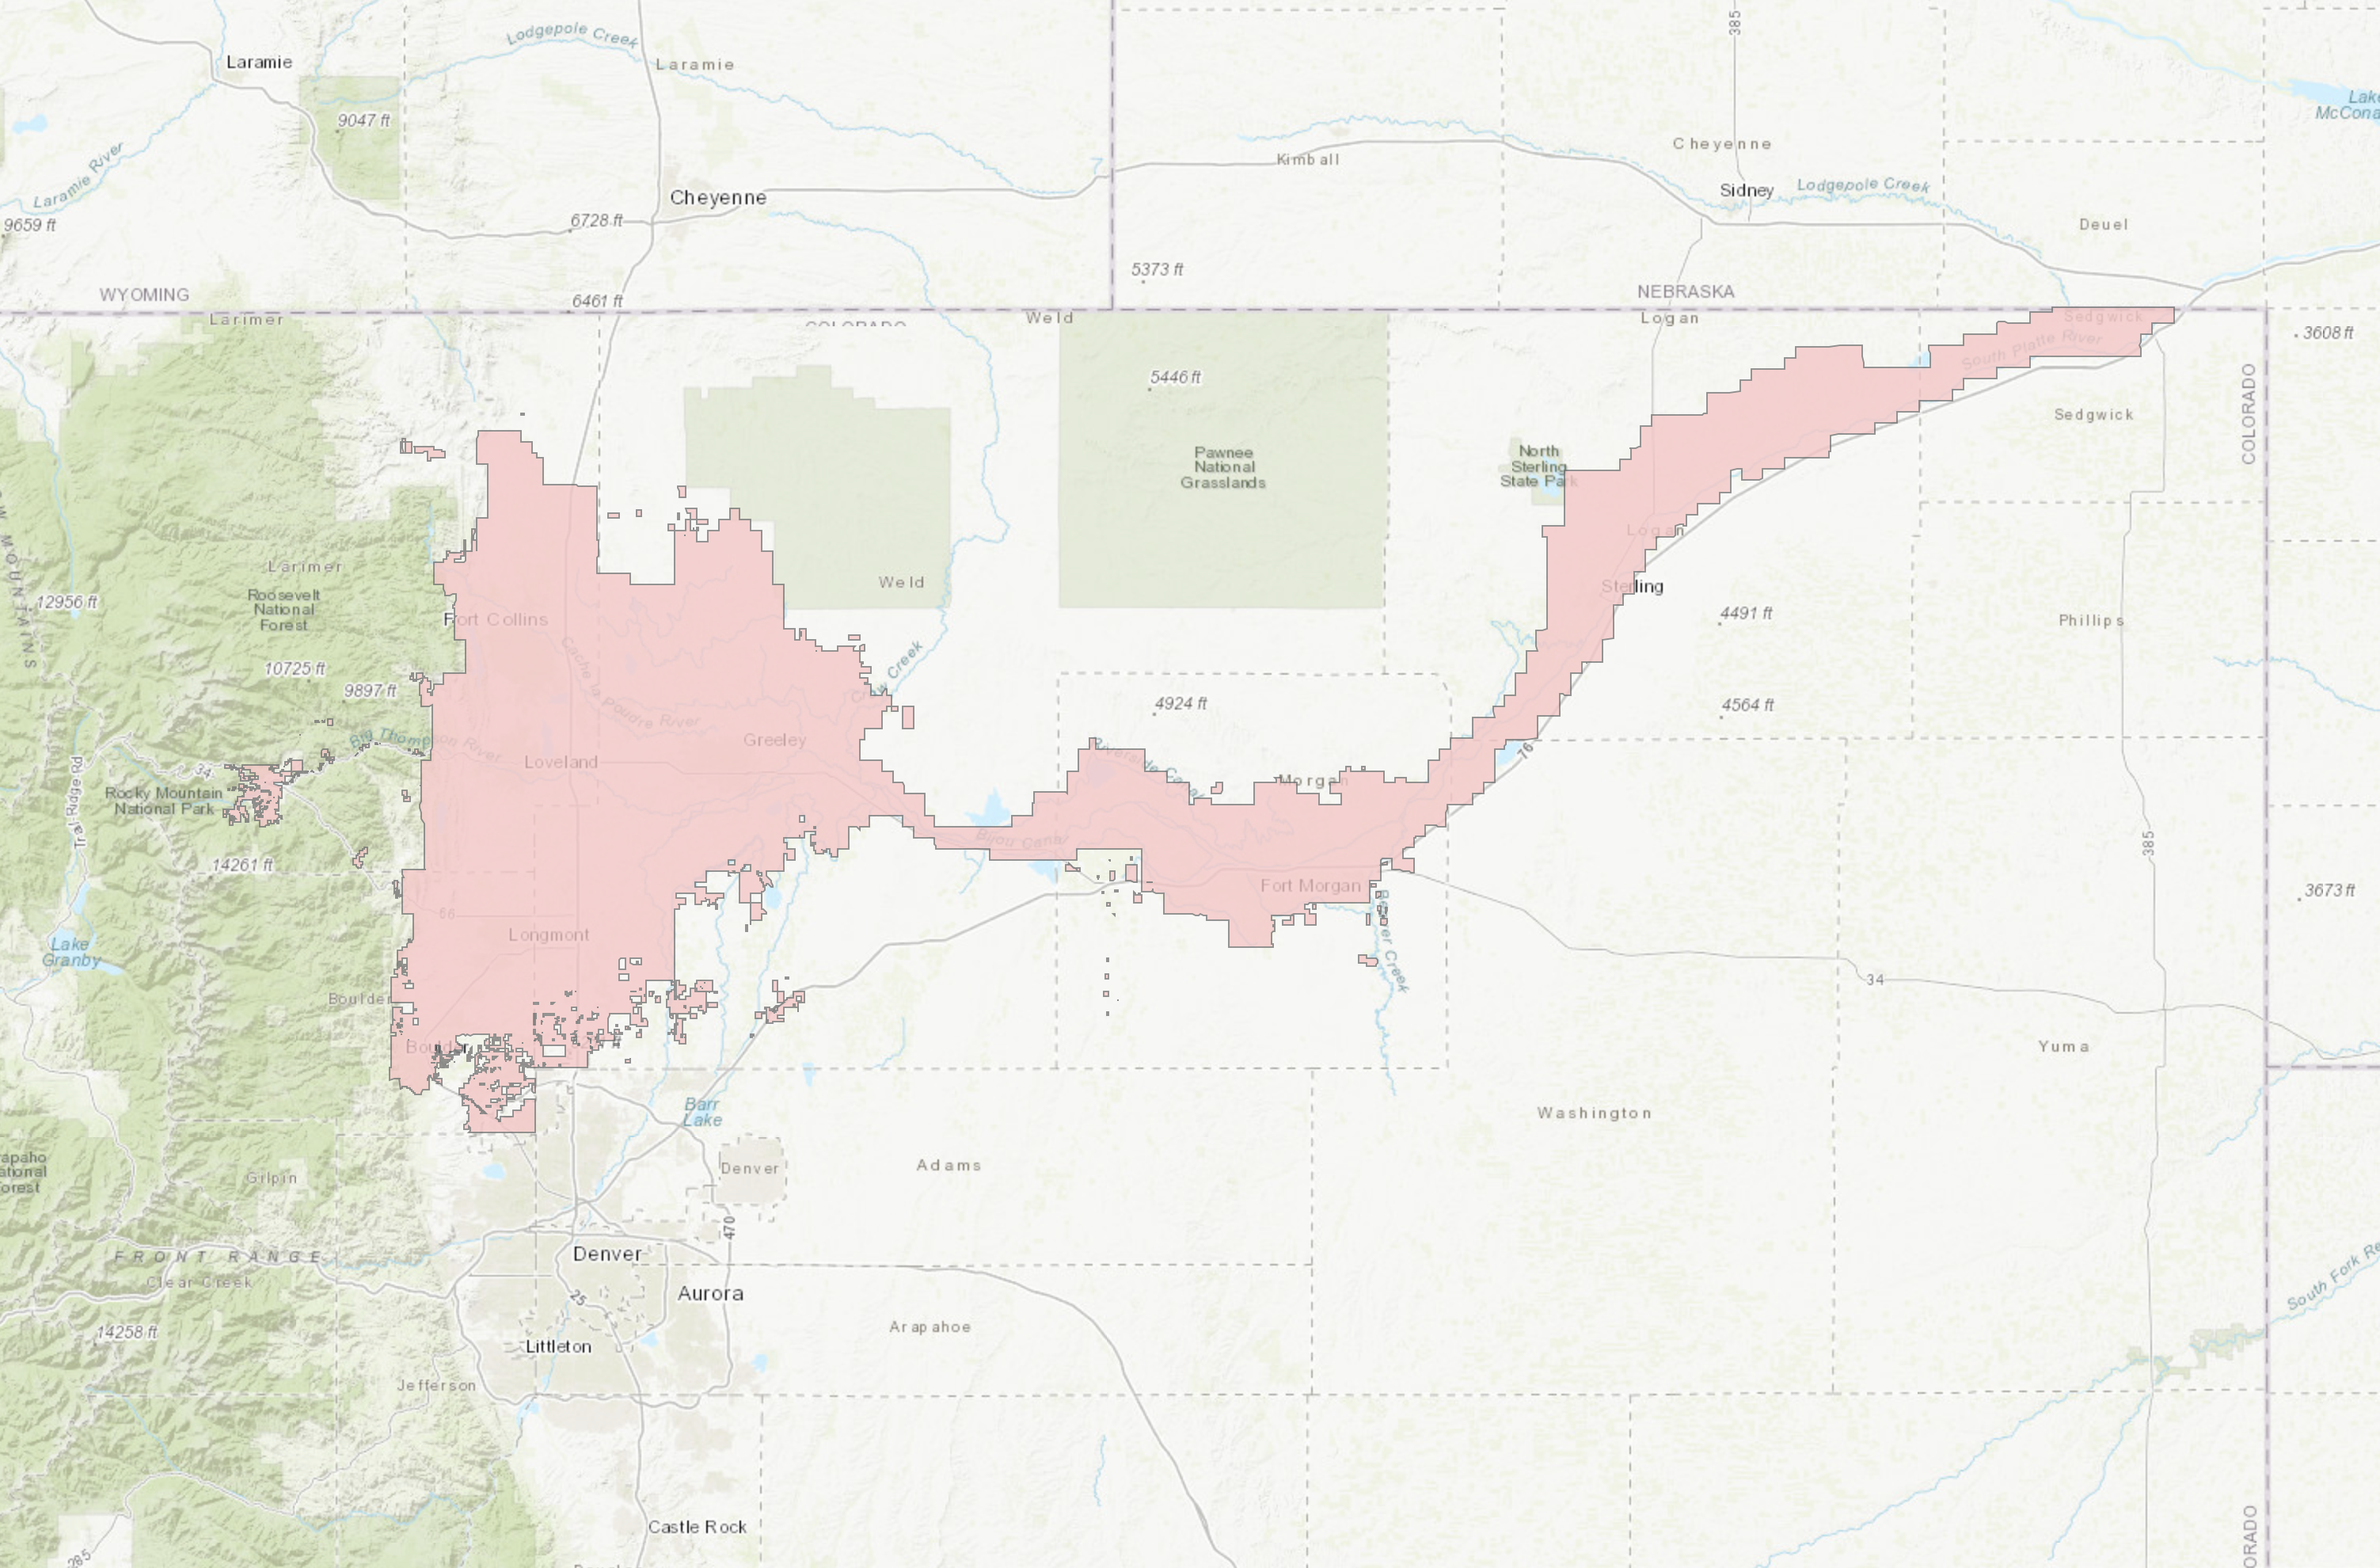


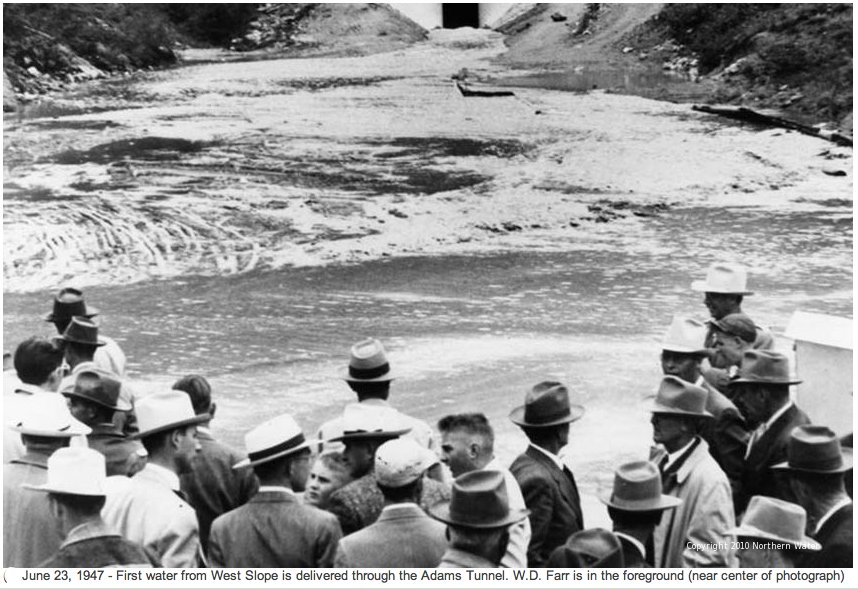

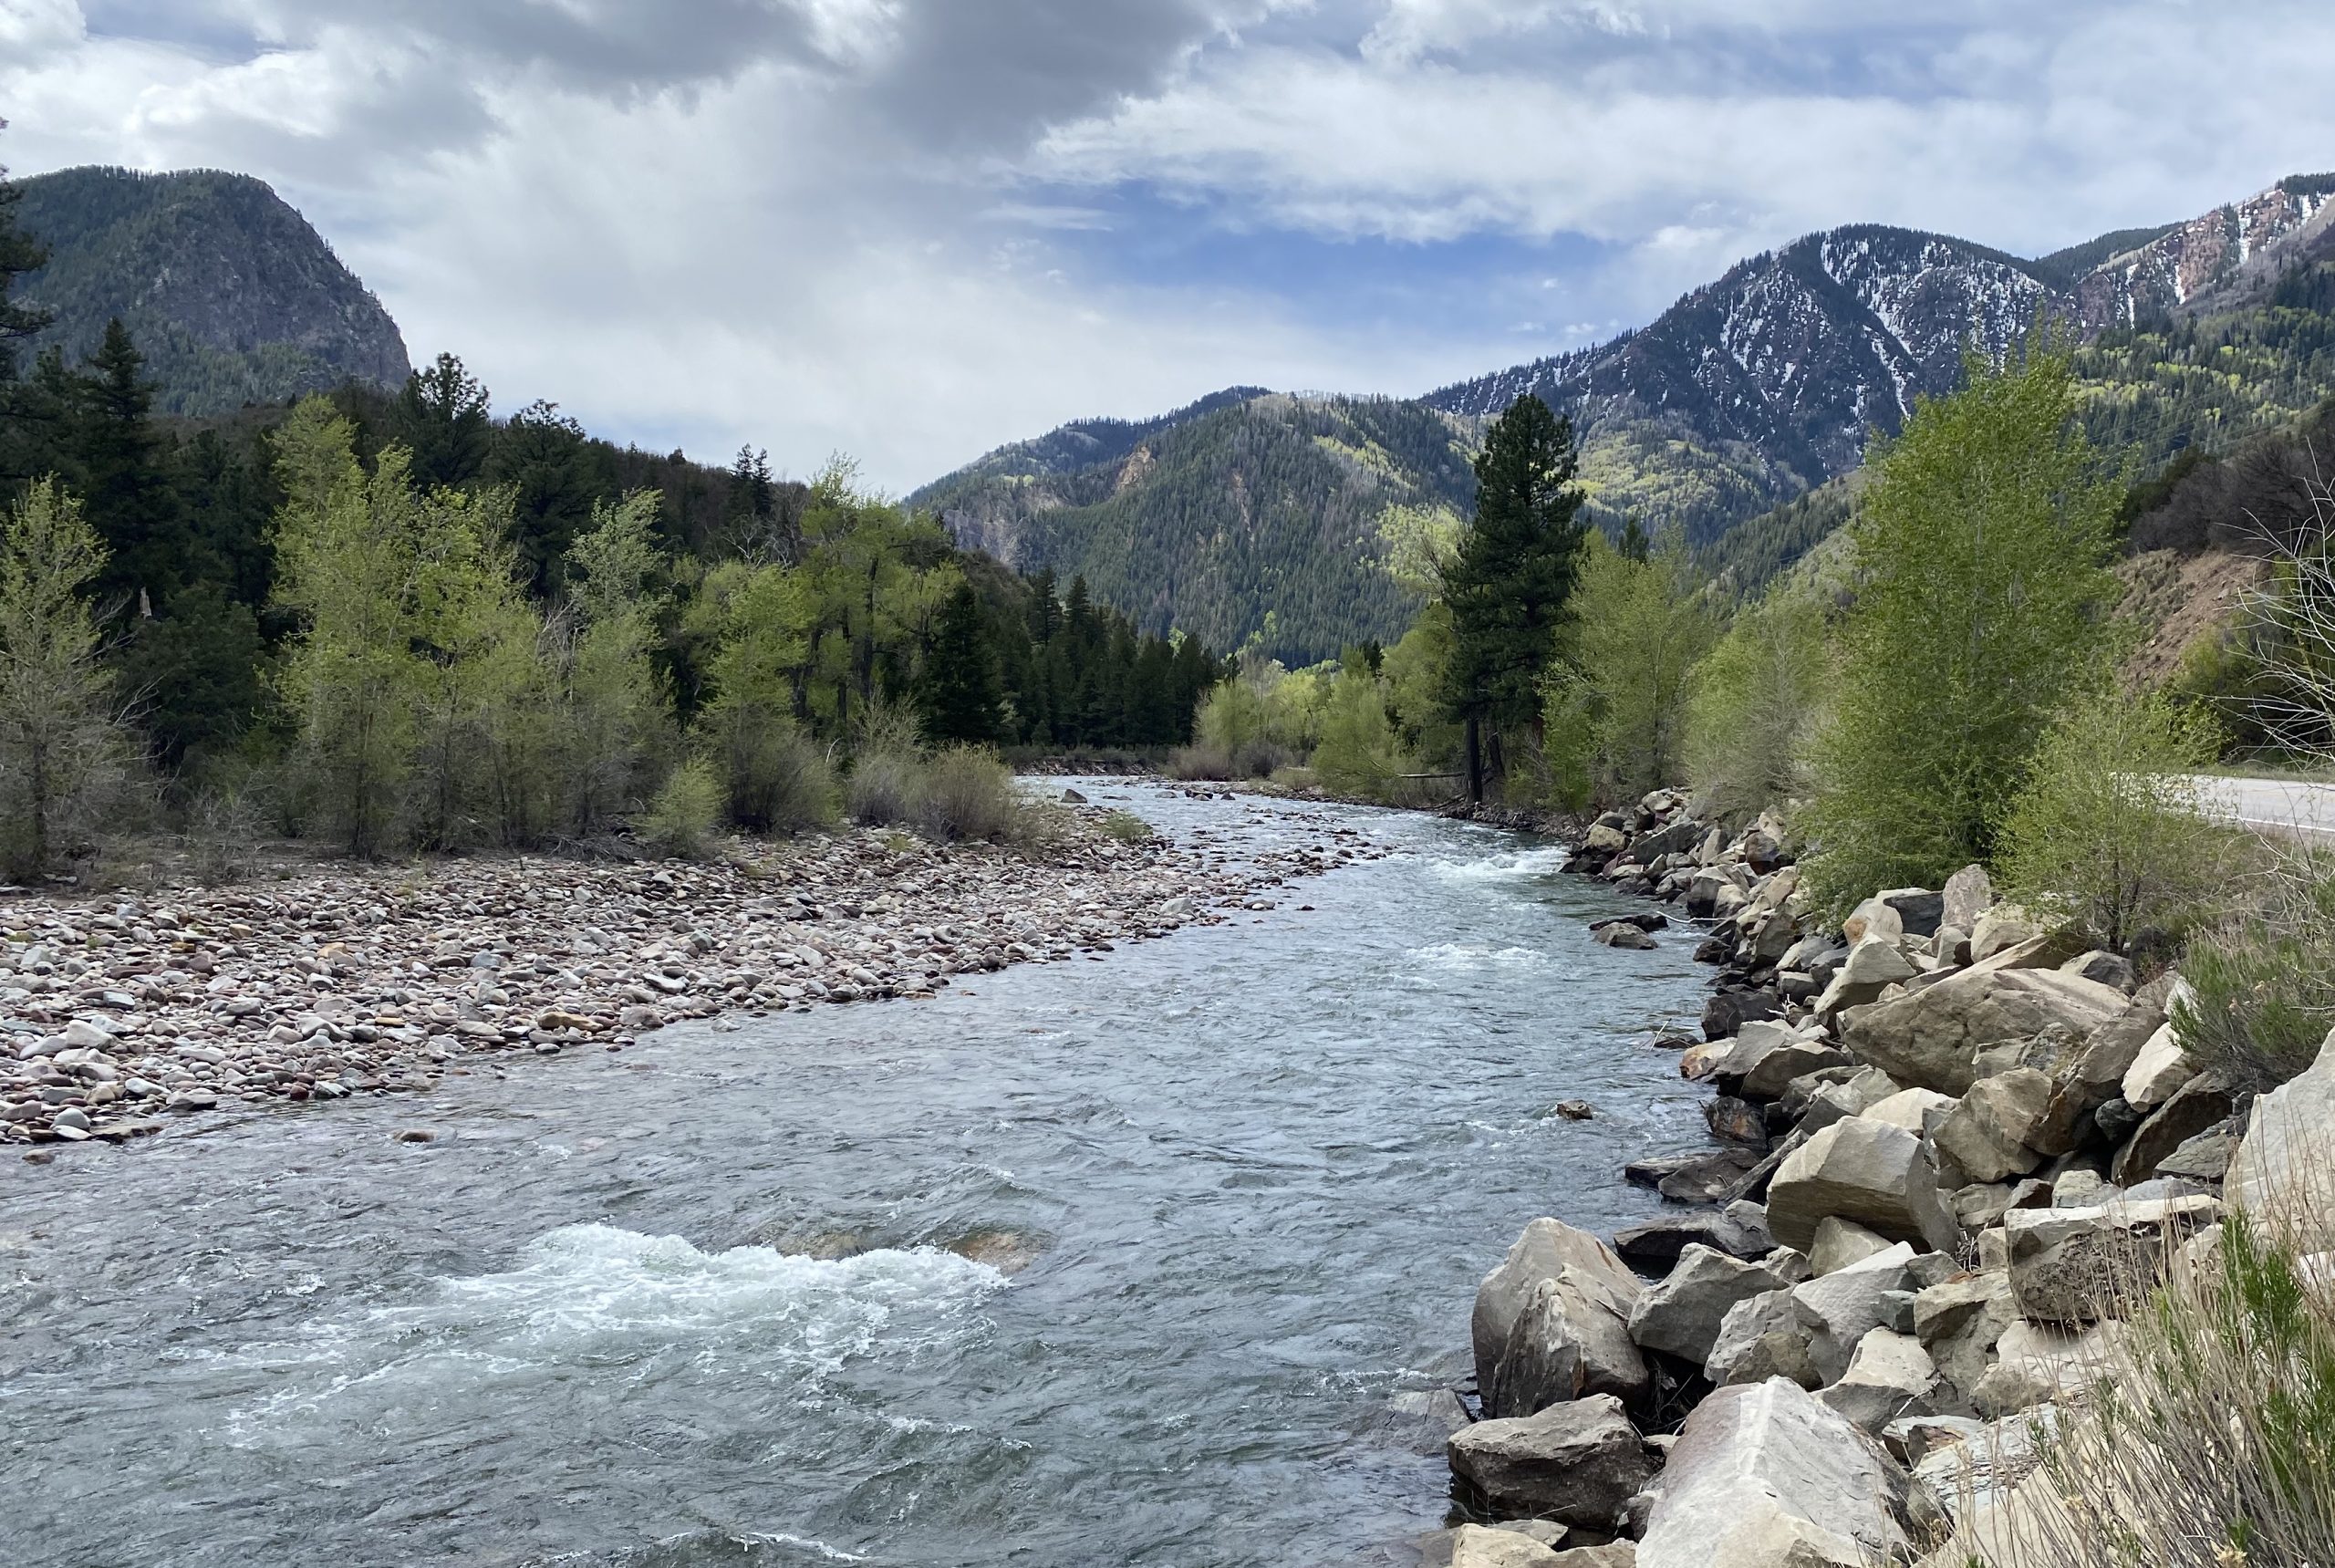

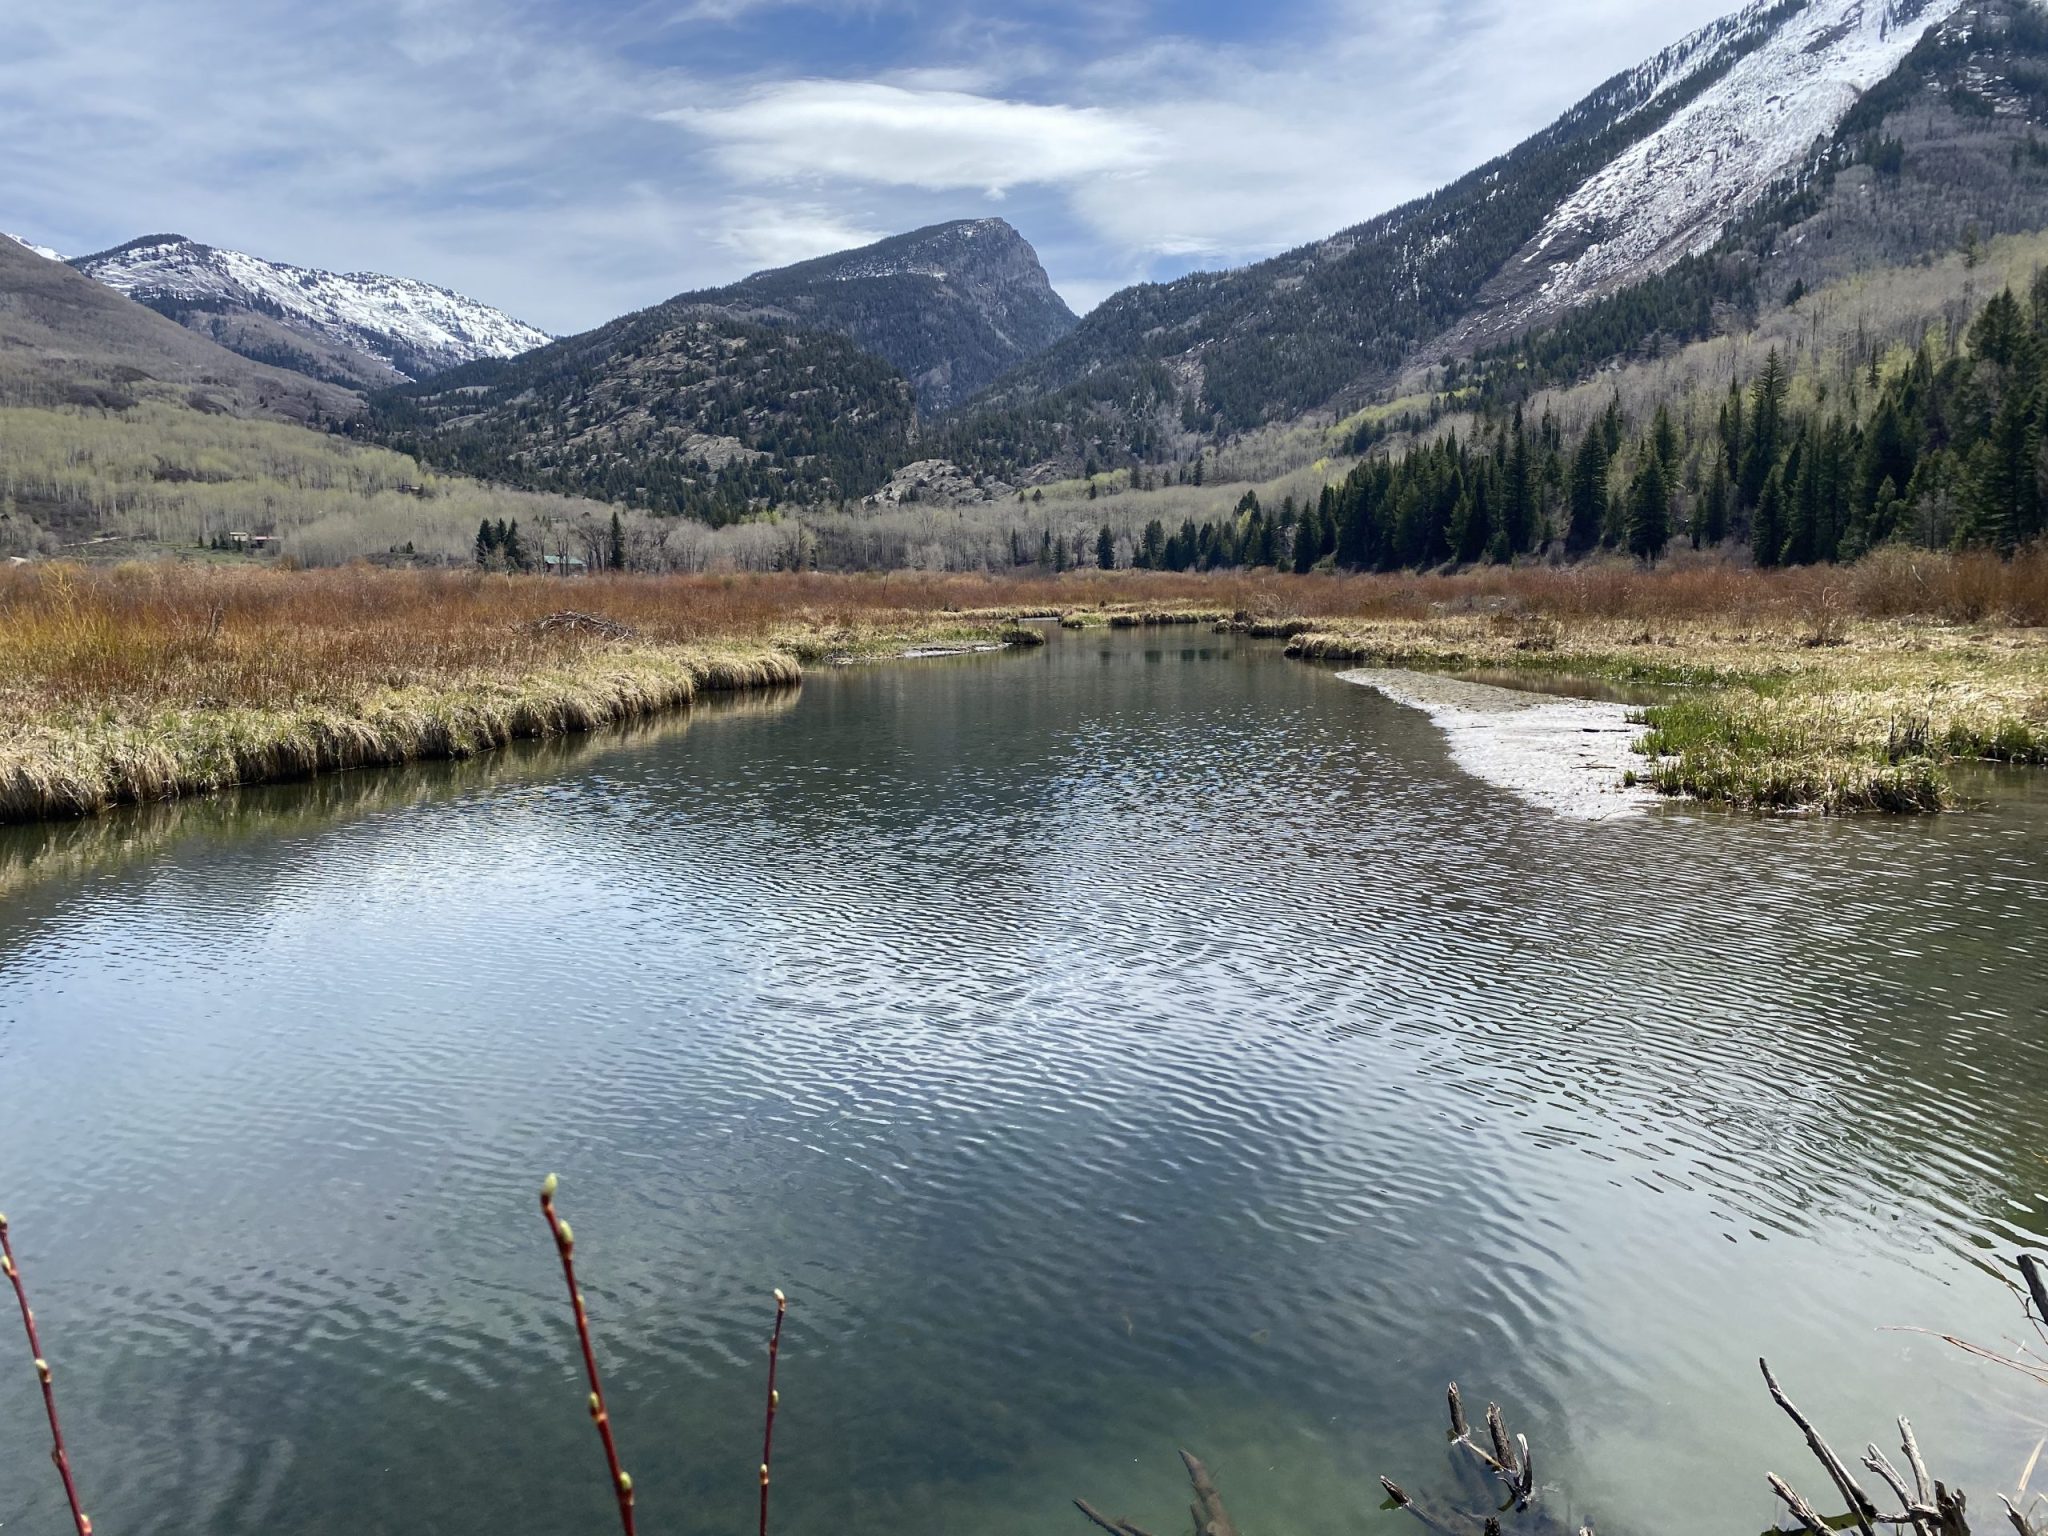
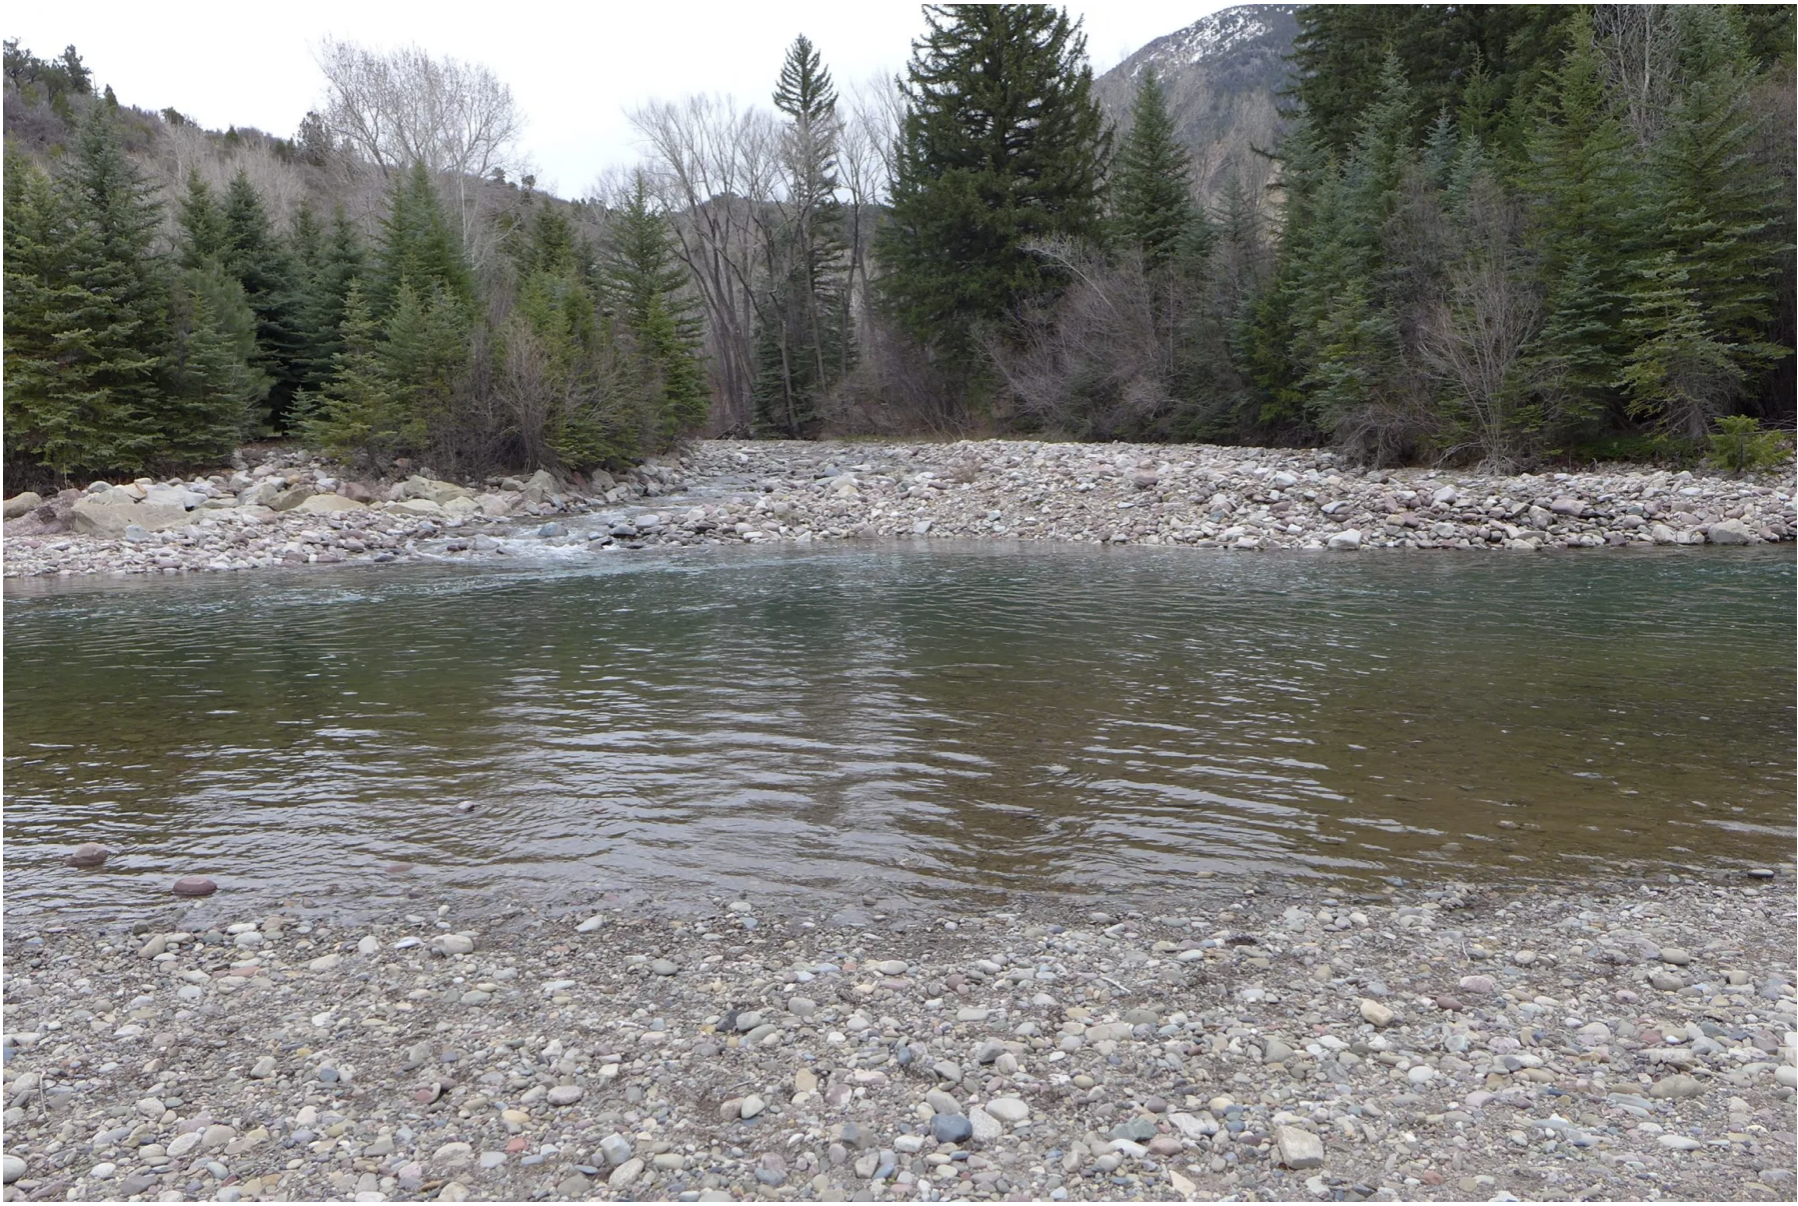
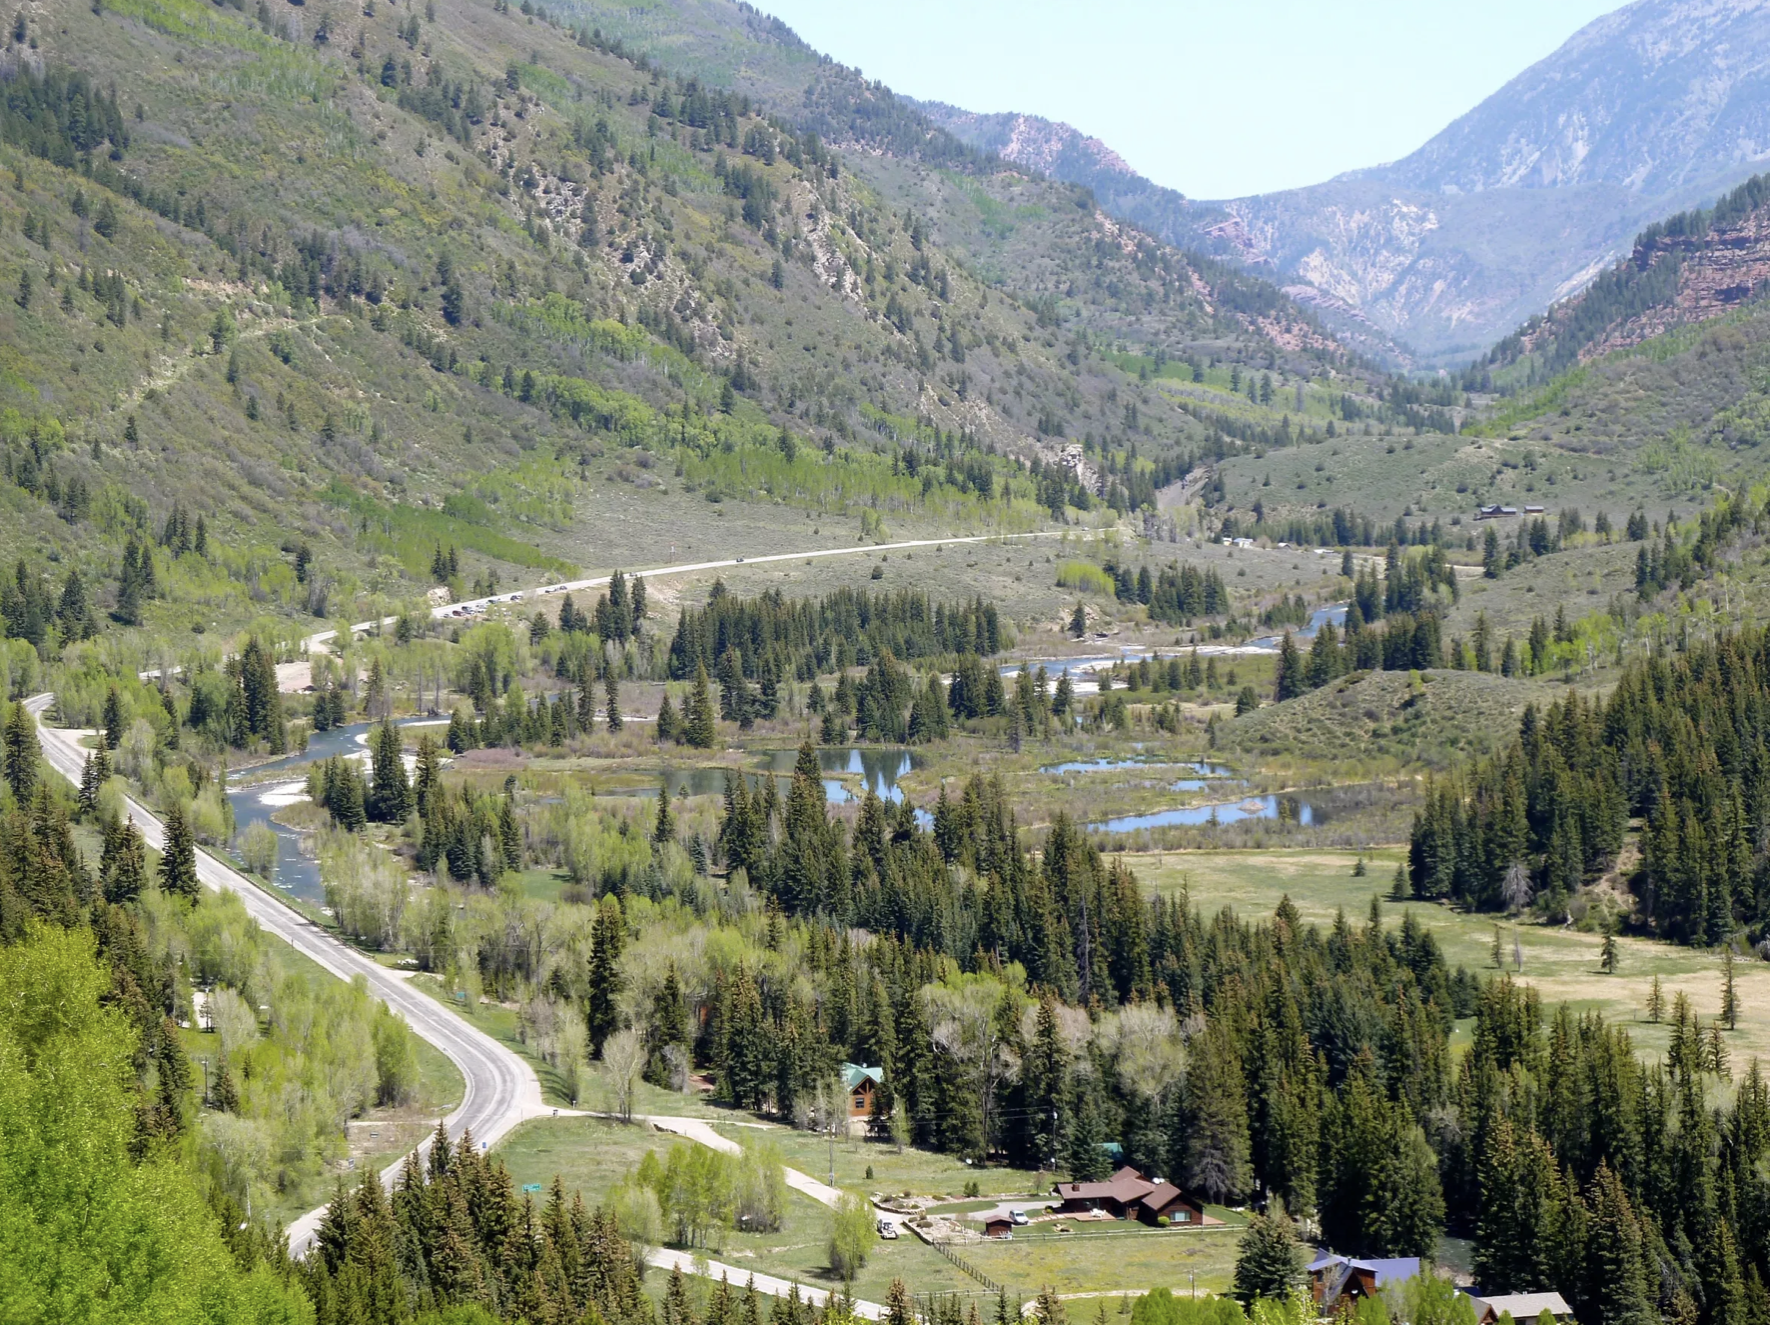

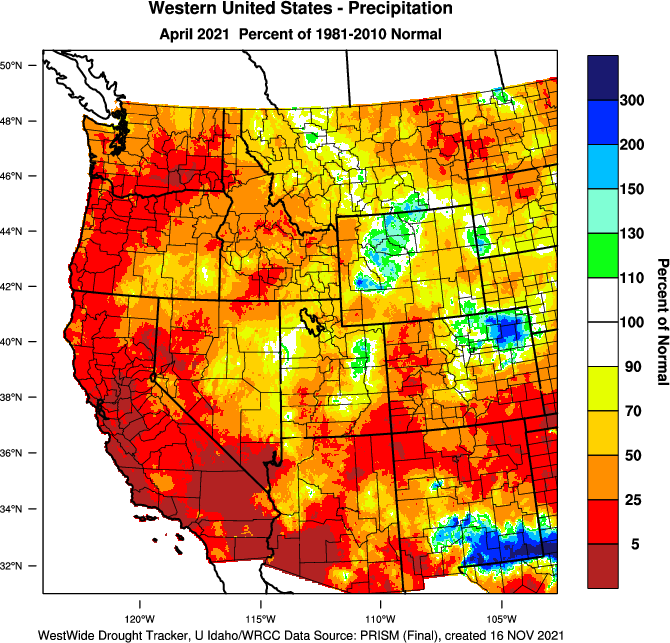