Click on a thumbnail below to view a gallery of drought data from the US Drought Monitor website.
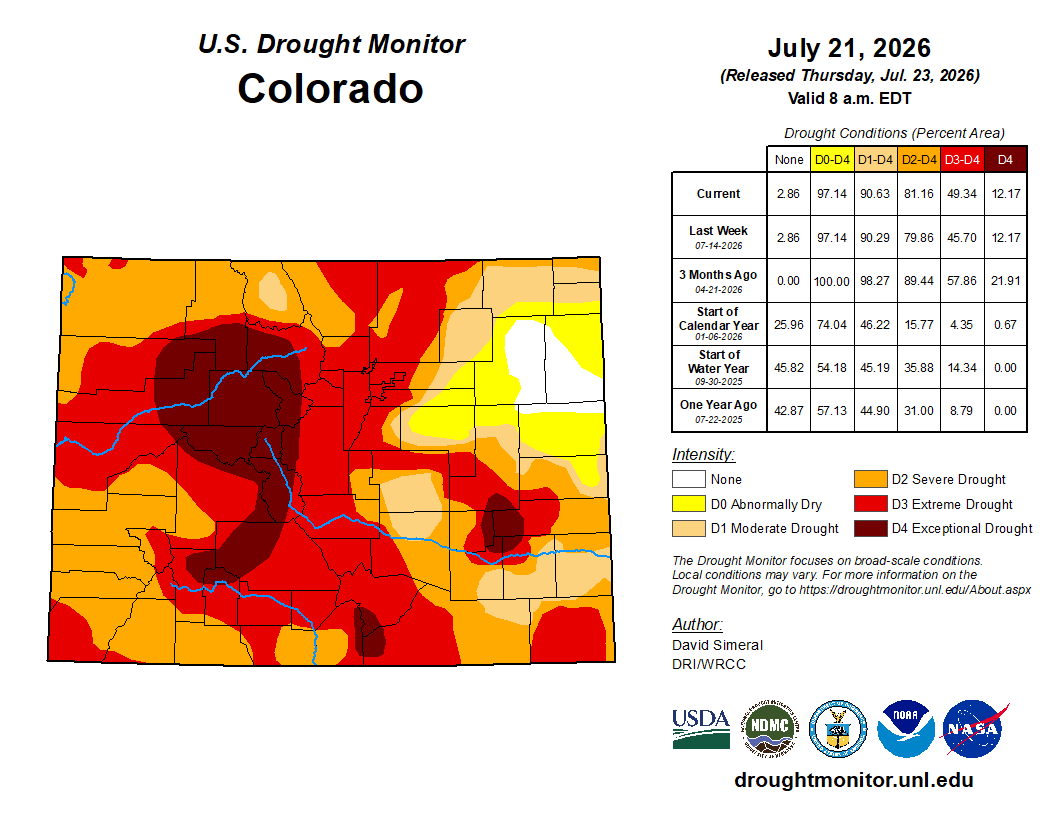
Click the link to go to the US Drought Monitor website. Here’s an excerpt:
This Week’s Drought Summary
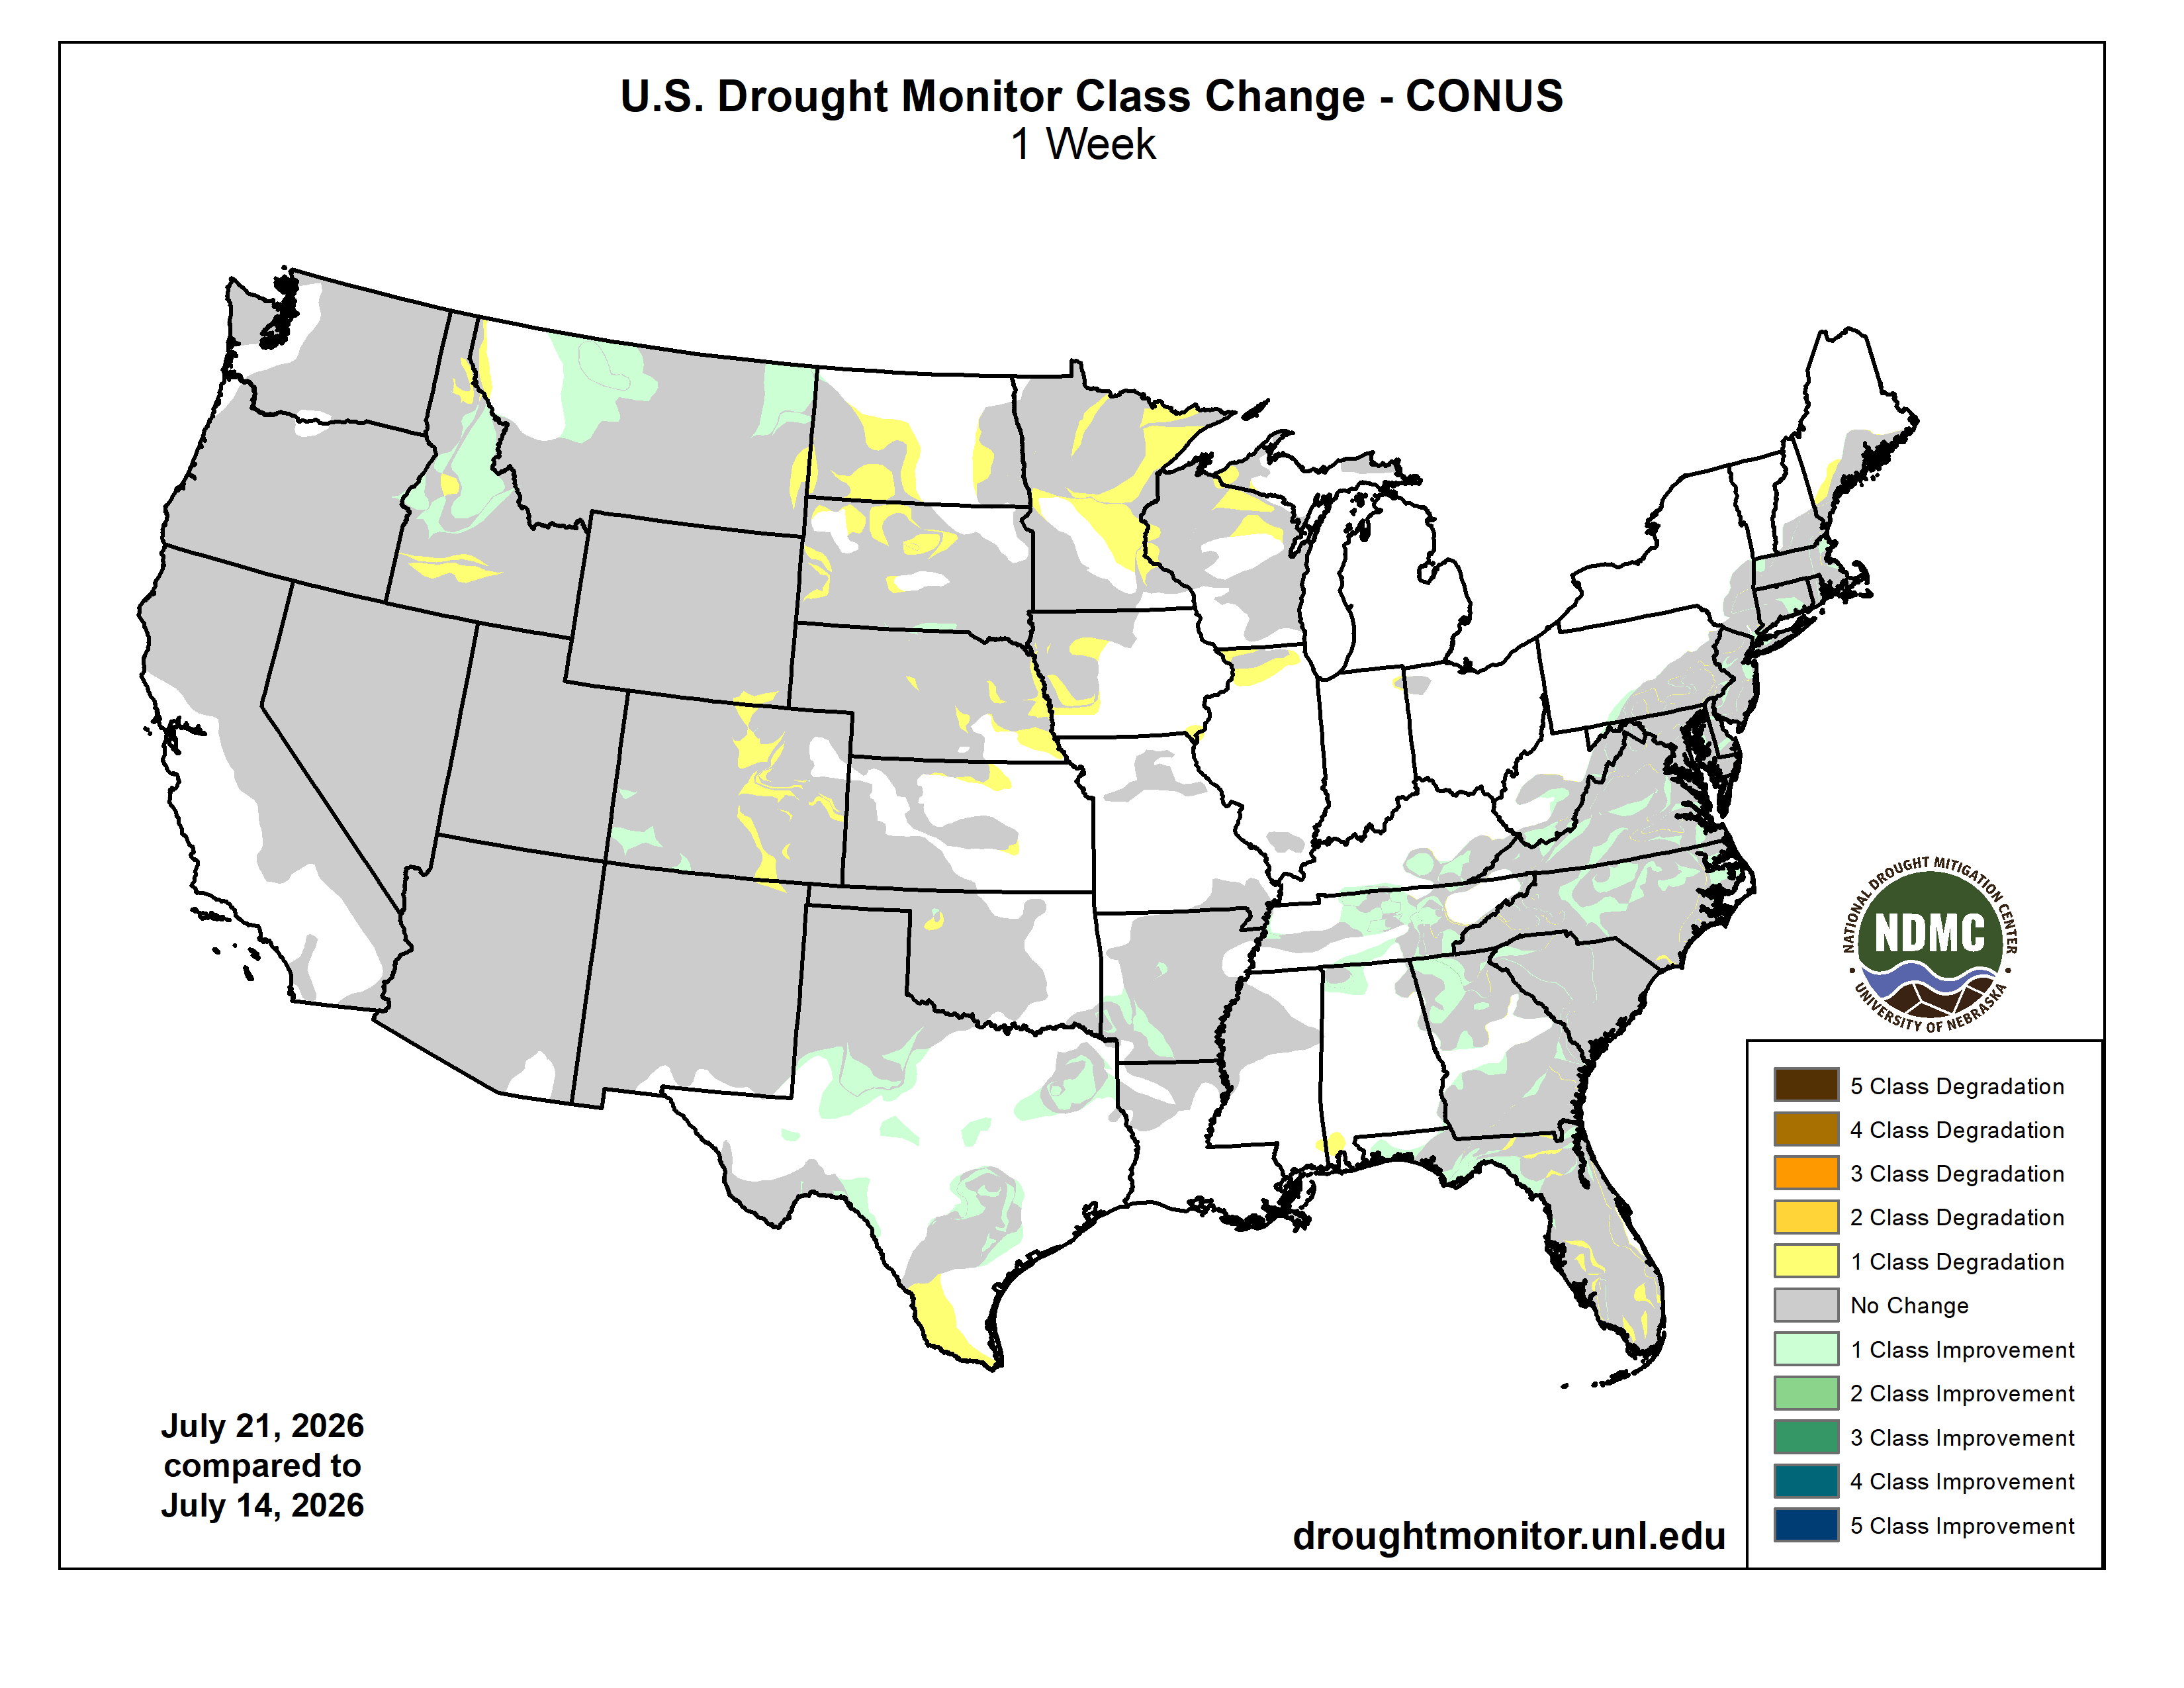
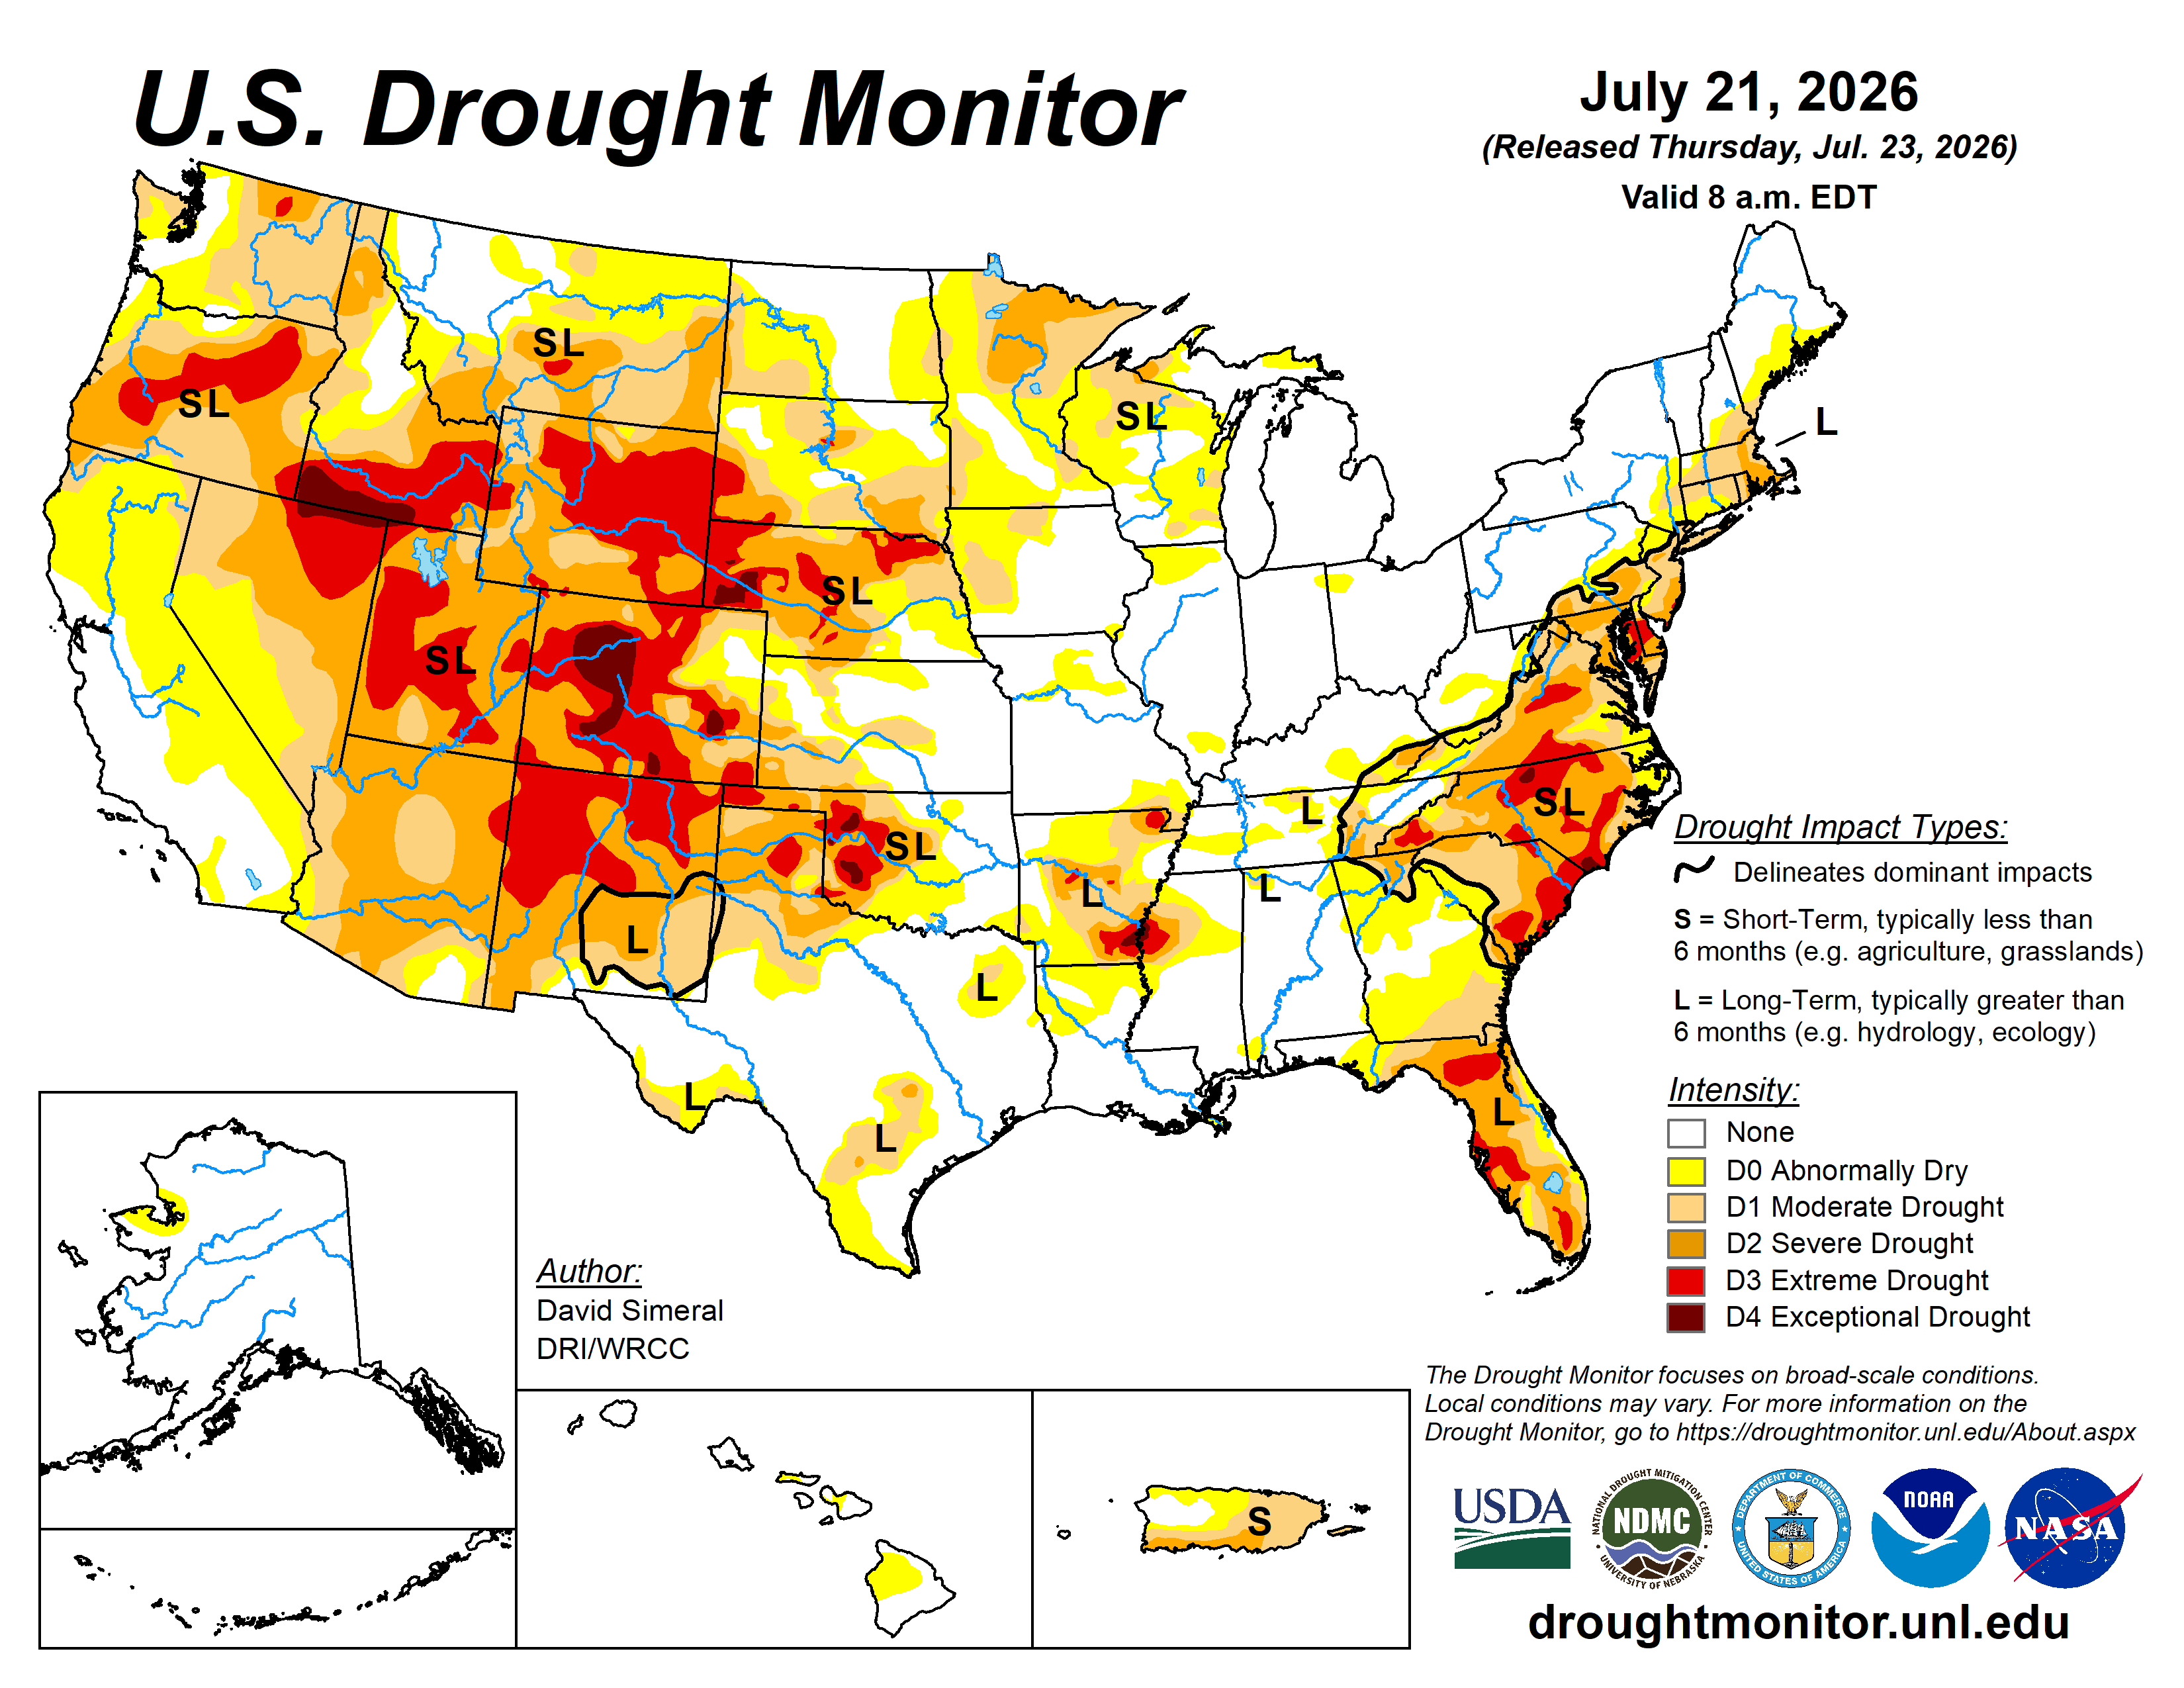
This U.S. Drought Monitor (USDM) week saw degradations across the areas of the Plains, Upper Midwest, and Florida, while rainfall during the past week led to improvements in drought-affected areas of the South, Southeast, Mid-Atlantic, and Northeast. In the West, a mix of improvements and degradations occurred on the map with improvements across areas of Idaho and Montana in response to above-normal rainfall during the past 30-day period. Conversely, areas of eastern Colorado and southeastern Wyoming saw degradation in response to dry conditions and excessive heat and elevated evaporative demand. Likewise, hot and dry conditions prevailed across the central and northern Plains leading to expansion and intensification of drought, with temperatures ranging from 2 to 10+ °F above normal and reports of poor rangeland conditions. In the South, another round of heavy rainfall in the Hill Country of Texas led to continued improvement in the long-term drought situation as well as severe flash flooding, with widespread rainfall accumulations ranging from 5 to 10 inches and isolated areas receiving totals in excess of 15 inches during the past week. In the Southeast and Mid-Atlantic, isolated shower activity led to improvements in drought-affected areas of Florida, Georgia, the Carolinas, and Mid-Atlantic states. Similarly, isolated areas of the Northeast received heavy rainfall accumulations ranging from 2 to 5+ inches, leading to improvements in New Jersey, New York, Connecticut, and Massachusetts.
In terms of reservoir storage in the West, California’s reservoirs continue to be at or above historical averages for the date (July 21), with the state’s two largest reservoirs, Lake Shasta and Lake Oroville, at 110% and 100% of average, respectively. In the Southwest, the U.S. Bureau of Reclamation is reporting (July 19) Lake Powell at 22% full (34% of average for the date; lowest on record for the date in the last 30 years), Lake Mead at 27% full (45% of average for the date; lowest on record for the date in the last 30 years), and the total Colorado River system (July 19) at 33% of capacity (compared to 39% of capacity the same time last year)…
High Plains
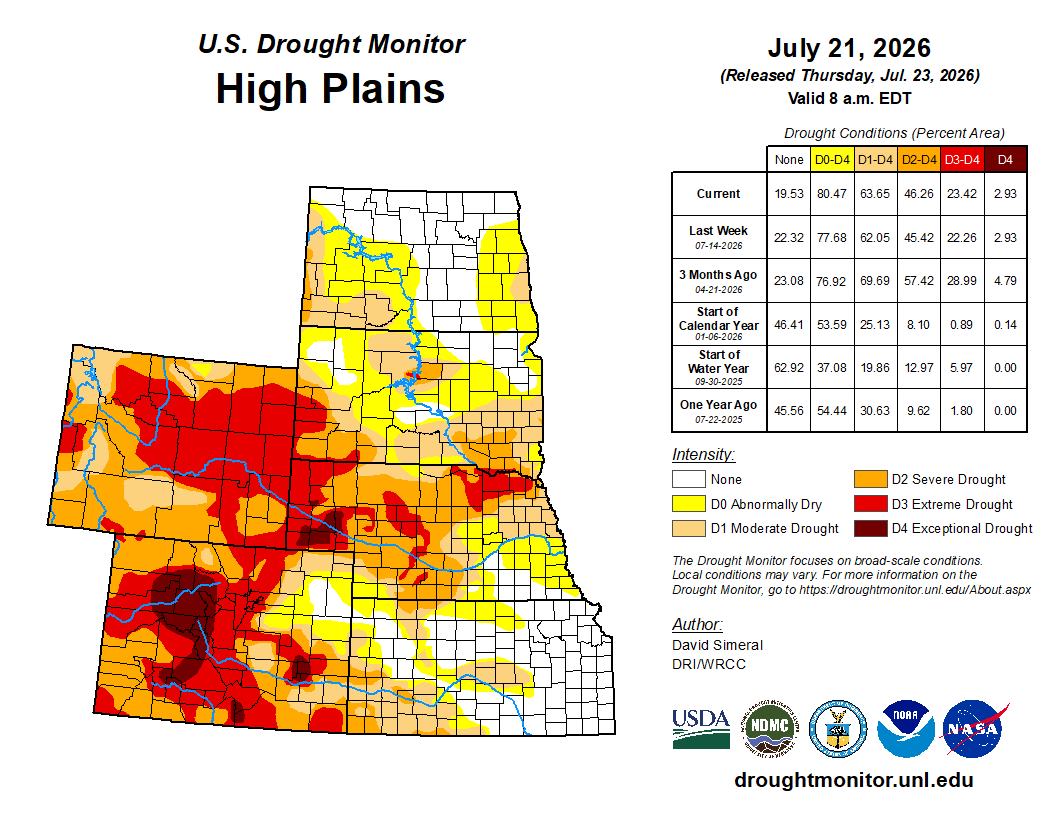
On this week’s map, drought-related conditions deteriorated across the region including in the Dakotas and Nebraska with reports of rapidly deteriorating conditions. The recent anomalously hot temperatures and deteriorating drought-related conditions led to the South Dakota Governor issuing a drought emergency executive order last week. In terms of drought impacts, the National Drought Mitigation Center’s Condition Monitoring Observer Report (CMOR) drought impacts reporting system is showing numerous impact reports across the Dakotas during the past 30 days. For the week, average temperatures were 4 to 10+ °F above normal across the Dakotas and Nebraska. Looking at climatological rankings for the past 30-day period, several locations logged near-record dryness including Omaha, NE (3rd driest on record; -3.16 inches); Grand Island, NE (5th driest; -3.05 inches); and Rapid City NWS Weather Forecast Office, SD (5th driest; -1.48 inches)…
West
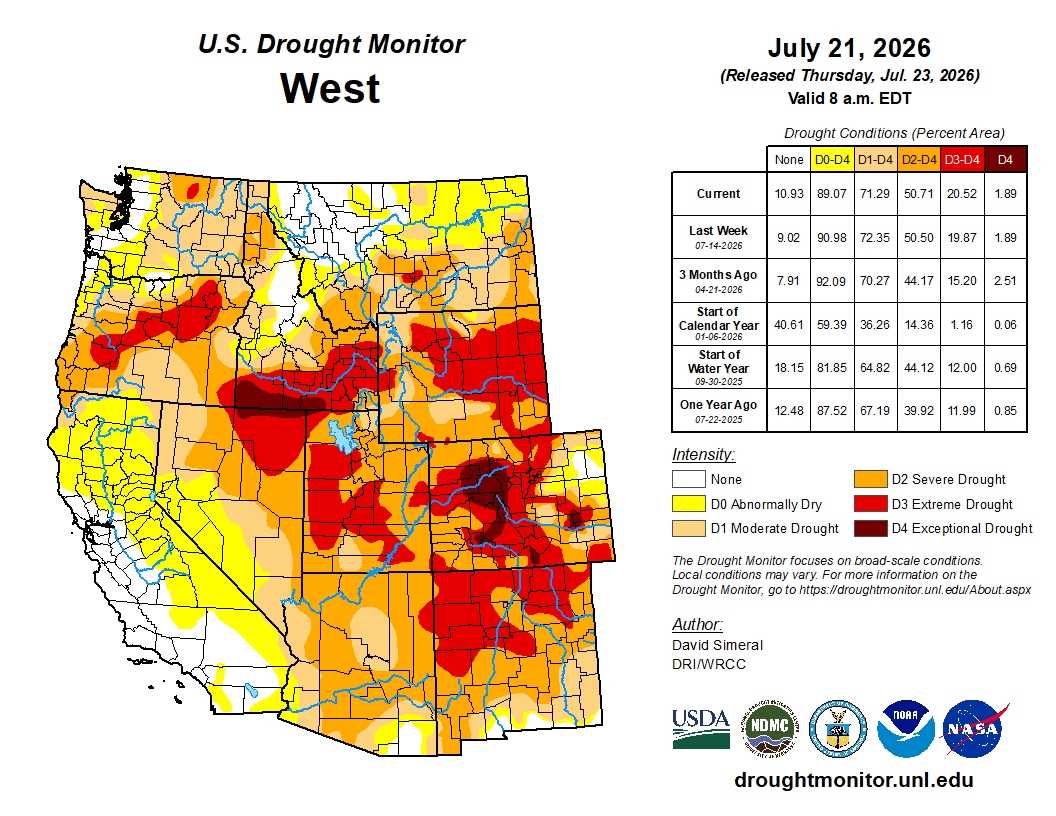
On the map, drought-related conditions continued to deteriorate in areas of eastern Colorado, southeastern Wyoming, and portions of southern Idaho, while improvements were made in central and northern Idaho and Montana where short-term conditions (past 30 days) improved. In the Southwest, monsoonal thunderstorms delivered much-needed moisture to isolated areas of the Four Corners states and eastern Nevada, while dry conditions prevailed across the western Great Basin and Pacific states. In the Colorado River Basin, Lake Powell is 22% full, while Lake Mead is 27% full, according to the U.S. Bureau of Reclamation. Other reservoirs in the region are experiencing low levels including at Elephant Butte Reservoir in New Mexico (2% of capacity) and Blue Mesa Reservoir in southwestern Colorado (32% full). Looking at climatological conditions for the past month, record or near-record precipitation was observed at the following locations: Nogales, AZ (3rd wettest; +2.43 inch departure from normal); Wilcox, AZ (7th wettest; +2.03 inches); and Flagstaff Airport, AZ (10th wettest; +1.76 inches); Great Falls, MT (wettest on record; +2.29 inches); Glasgow Airport, MT (3rd wettest; +2.88 inches); and Challis Airport, ID (wettest on record; +1.8 inches)…
South
On this week’s map, improvements were made in drought-affected areas of Texas, Arkansas, and Tennessee. In terms of precipitation during the past week, moderate to heavy rainfall accumulations (ranging from 5 to 15+ inches) were observed in the Hill Country of Texas bringing much-needed relief to the long-term drought situation and low reservoir levels. However, the torrential rains also led to severe and dangerous flash flooding across areas of the region. Looking at the reservoir situation, Water Data for Texas (July 22) reports statewide reservoirs at 78% full, with eastern reservoirs in good condition while numerous western and southern reservoirs remain below normal. In Tennessee, precipitation during the past 30-day period was above-normal across much of the western part of the state, leading to improvements on the map. Looking at climatological rankings for the past 30-days, record to near-record precipitation was observed in areas of the region, including in Junction, TX (2nd wettest on record; +5.44 inch departure), San Angelo, TX (9th wettest; +2.49 inches), Del Rio, TX (3rd wettest; +5.86 inches) and Shreveport Airport, LA (wettest; +8.36 inches). Average temperatures for the week were above normal across most of the region (1 to 5 °F)…
Looking Ahead
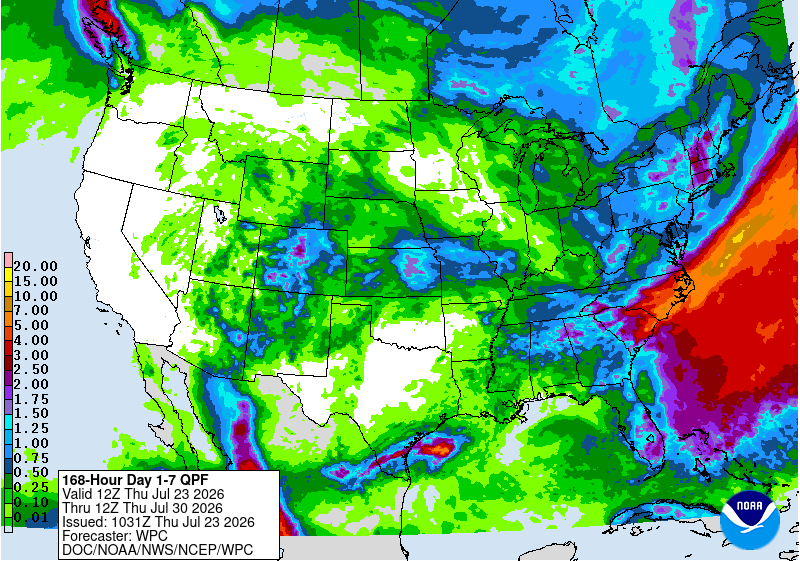
The NWS Weather Prediction Center 7-Day Quantitative Precipitation Forecast calls for the heaviest precipitation accumulations across portions of the Mid-Atlantic states, where precipitation accumulations generally ranging from 2 to 7+ inches are expected, with the highest amounts primarily across the coastal plains of southern Virginia and the Carolinas. Across areas of the interior Southeast, including northern portions of and Georgia as well as eastern Tennessee, precipitation accumulations generally ranging from 1 to 3+ inches are expected. In isolated areas of the Northeast, and central Plains, precipitation accumulations generally ranging from 1 to 2 inches are expected. In Texas, light to moderate accumulations (2 to 4 inches) are expected in areas of the South Texas Plains. In the West, the higher elevations of areas of the central and southern Rockies and portions of the Southwest, including the Mogollon Rim of Arizona, localized precipitation accumulations of 1 to 2+ inches are expected.
The NWS 6–10-Day Temperature Outlook (valid July 27–31, 2026) favors above-normal temperatures across most of the contiguous United States, with the highest probabilities centered across much of California, Great Basin, central and southern Rockies, Plains states, Texas, and western portions of the Midwest. Above-normal temperatures are also favored across much of the South and Southeast regions. Conversely, below-normal temperatures are favored in the Pacific Northwest in western Washington, much of the Northeast, and Alaska, while near-normal temperatures are expected across portions of the Mid-Atlantic.
The NWS 6–10-Day Precipitation Outlook favors above-normal precipitation across areas of the Pacific Northwest (Washington), portions of the Southwest and central Rockies, and along the Eastern Seaboard from Florida to Maine. Below-normal precipitation is favored across eastern portions of the central and southern Plains, Texas, South, and Midwest.