Click the link to read the article on the Big Pivots website (Allen Best):
September 4, 2026
The integration of batteries into Colorado’s energy picture continues, this time in Pueblo. There, Black Hills Energy has announced plans to add 50 megawatts of storage that will enable it to capture excess renewable energy when it is available.
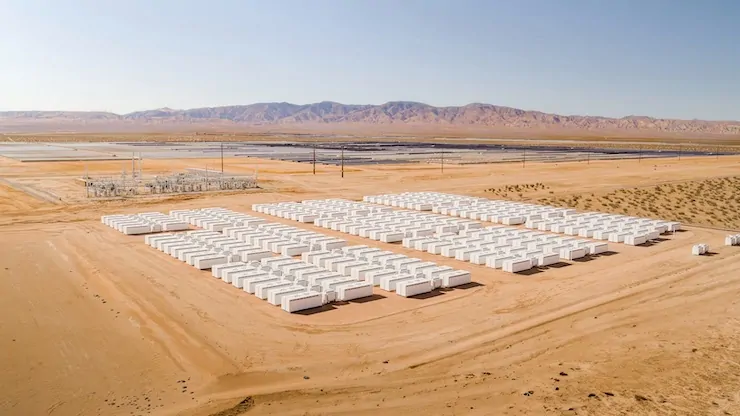
The four-hour Tesla Megapack batteries (pictured above) will be located next to the company’s 420-megawatt natural gas plant near the Pueblo Airport. However, the intent is to use the batteries to store excess electricity generated by the company’s three wind installations in southern Colorado. They have a combined capacity of 149 megawatts.
“We’re very proud that our company’s first large-scale battery storage project will be built right here in Pueblo,” said Campbell Hawkins, vice president of Colorado Utilities at Black Hills Energy.
Black Hills expects to have the battery storage in place by late 2027. The company explains that batteries will enable it to better meet peak demands, such as on hot summer evenings, with renewable energy.
This is part of the company’s work to reduce greenhouse gas emissions 80% by 2030 as compared to 2005, as required by Colorado law.
The batteries in Pueblo can best be understood as part of a near explosion in energy storage in Colorado during the last two to three years. The amount of storage now on line is remarkable given that the very first _ and very small — set of batteries were put into place in 2018 at the United Power headquarters along I-25. And that 4 megawatt-hour of battery storage remained the largest in Colorado until 2022.
American Clean Power will host its Recharge conference in Colorado on Sept. 22-24. The opening session will include a very strong Colorado component on its opening day with both Eric Blank, chair of the Colorado Public Utilities Commission, and Chris Hansen, CEO of La Plata Electric, having half-hour time slots. See more here.
At Pueblo, project partners are Linxon, a global engineering, procurement and construction company, and Cloudbreak Energy, a national developer and independent power producer of distributed resources and utility-scale solar and storage projects.
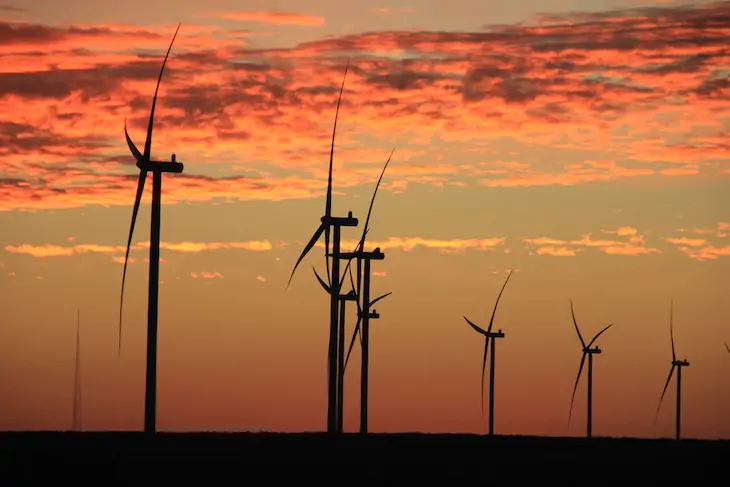
The Crossing Trails Wind Farm between Kit Carson and Seibert, about 150 miles east of Denver, has an installed capacity of 104 megawatts, which goes to Tri-State Generation and Transmission. Photo/Allen Best
Map showing where the January-August 2026 temperature ranks when compared to all January-August periods since 1895. It's as if something has changed. 🤔
Circle of Blue and True Elements Launch Situation: Colorado River from Stockholm World Water Week
Colorado River faces a “collective nightmare.”
New platform delivers a shared view to help inform decisions and collaboration.
Situation: Colorado River is part of Designing Water’s Future, the initiative to create “a new operating system for the world’s fresh water” — aligning across finance, policy, media, and innovation.
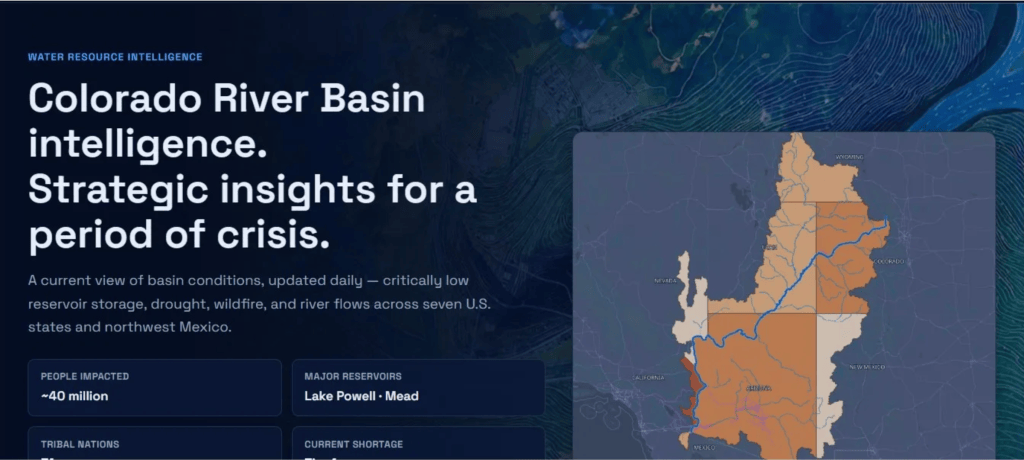
STOCKHOLM (August 27, 2026) — As some 2,000 experts gather for World Water Week to address global water challenges and solutions, Circle of Blue and True Elements today launch a new, live data, information and context platform for the Colorado River basin, which faces unprecedented stress as the river and its reservoirs set record lows that are forcing a dramatic reset of water use across the American West. The river supports approximately $1.4 trillion in annual economic activity and 16 million jobs across seven basin states, 30 Tribal Nations, and northwestern Mexico.
Situation: Colorado River begins with real-time and historical data collected into a strategic, user-friendly dashboard. In the face of increasing stress on the basin, the team, which includes reporters from Circle of Blue, will add on-the-ground context to deliver critical insights for policymakers, negotiators, journalists, businesses, and the public.
The core data is assembled from True Elements’ TrueQi system — an advanced and comprehensive resources platform that includes satellite observations and river gauges as well as drought indicators, wildfire detections, and reservoir measurements.
The platform arrives at an inflection point for the American West as Lake Mead and Lake Powell reach record low levels amid a warming climate. The combined storage of the two reservoirs is now lower than at any point since 1957 — before Glen Canyon Dam existed. Ninety-five percent of the basin remains in drought.
“The basin’s assumptions are being reset in real time, and everyone — federal, state, Tribal, corporate, business, communities — needs a trusted, shared view of what is actually happening,” said J. Carl Ganter, co-founder and managing director of Circle of Blue, the international nonprofit reporting on fresh water and its “nexus” intersections with food, energy, infrastructure, and health.
The TrueQi platform from True Elements collects real-time and historical federal, state, satellite, and sensor data across the Colorado River basin, the broader American West and globally. As it expands, Situation: Colorado River layers Circle of Blue’s journalism, along with reporting from network partners, on top of key data points, with additional context from academic and research collaborators.
“Real-time and cross-sector data is the foundation while the context makes it real and relevant,” said Kim Kobza, CEO of True Elements. “TrueQi already delivers the most granular water intelligence in the field. Pairing it with Circle of Blue’s award-winning reporting turns raw numbers into shared guidance.”
“Situation: Colorado River pulls the data together and makes it accessible to everyone making decisions under the pressure of declining water supplies. We do this with a sense of urgency, humility and collaboration in the face of increasing water crises globally,” Ganter said. It is part of Designing Water’s Future, Circle of Blue’s international initiative to better inform and align action across finance, policy, media, innovation, and the public.
The situation is forcing a reckoning for farmers, developers, cities, and industries, including silicon chip manufacturers and data centers. “We have a colossal failure to act in the face of an inevitable collective nightmare — and all the predictions are coming true faster than we thought,” Felicia Marcus, past chair of the California State Water Resources Control Board, told Circle of Blue.
As the basin’s operating assumptions are tested, Situation: Colorado River asks a core question:
What data points and contexts are necessary to inform the most important decisions across the Colorado River basin, and how can new data and intelligence approaches be applied across the U.S. and globally?
The initiative launches with a call for public and expert input at an historic moment. Submit thoughts, questions, suggestions and corrections to coloradoriver@circleofblue.org. This will shape the initiative’s next iterations of data selection and analysis, editorial focus and priority coverage.
Also available now is Water Savvy 3.0, a free mobile app from True Elements available on the Apple App Store that puts real-time water quality data, alerts and reporting into the hands of the public and students.
The platform is live online today from Stockholm. It is free and designed to be a trusted source for newsrooms, businesses, policymakers, academic researchers, students and the public. A more comprehensive enterprise insights system is available to businesses, agencies, and governments. Circle of Blue original content publishes under a Creative Commons Attribution-NonCommercial-NoDerivatives 4.0 International (CC BY-NC-ND 4.0) license.
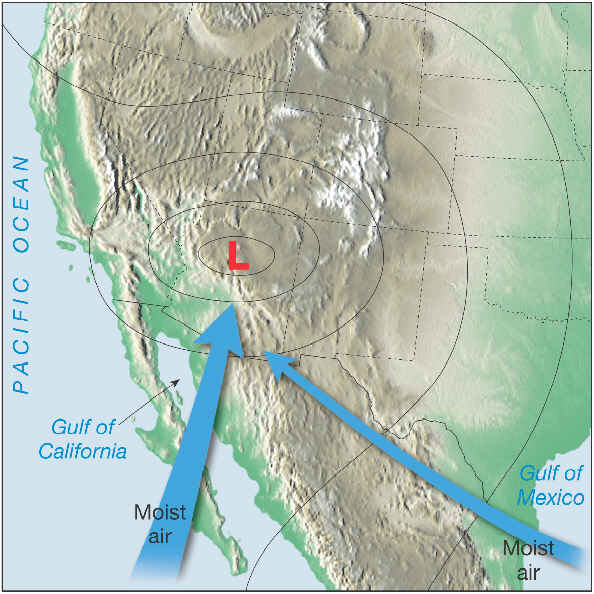
Durango experienced a drier-than-normal August…The month of August accumulated 0.28 inches of precipitation, 0.12 inches of which occurred Monday. Monday was the highest precipitation day of August, Gillian Felton, a National Weather Service meteorologist in the Grand Junction office, said. August traditionally averages closer to 1.3 inches of rain, according to the weather service, and precipitation this August was down about an inch comparatively. A plethora of reasons contributed to the dry spell, said Brooke Scholtens, a meteorologist with the National Weather Service office in Grand Junction.
“For the earlier parts of the summer, we were experiencing those drought-like conditions,” she said. “So that makes things incredibly difficult, especially since the pushes that we did see of the monsoon, most of the time, we had dry air in the way that was kind of preventing moisture from entering the region.”
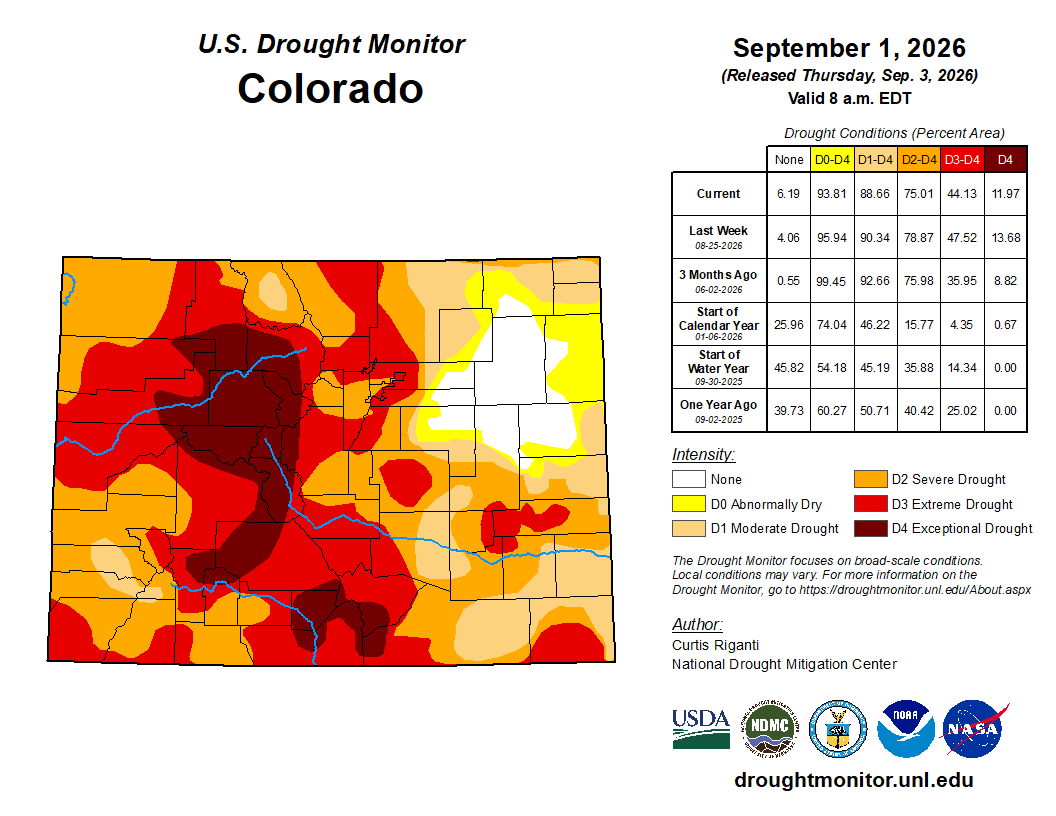
This monsoon has been drier than traditional years, Scholtens said. She added that the weather service measures moisture at Durango-La Plata County Airport, so some areas around Durango may have differing precipitation levels…Monsoons don’t have a specific end date, but it usually wraps up mid- to late-September, Scholtens said…According to the National Integrated Drought Information System, 91.6% of La Plata County is in a severe drought and 8.4% of the county is in an extreme drought. Durango has been in Stage One water restrictions since early April as part of the city of Durango’s Drought Management Plan.
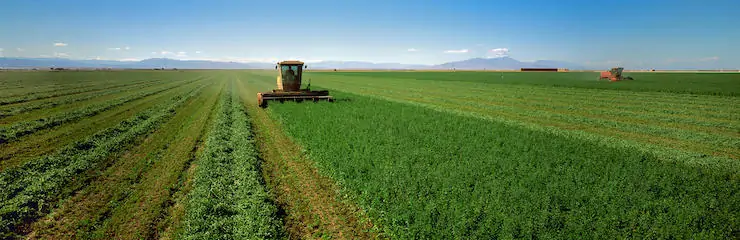
A windrower cuts alfalfa for drying prior to baling in the Imperial Valley of California in June 2007. Photo by Timothy Hearsum/AgStock
Click the link to read the article on the Big Pivots website (Daniel M. Frey):
August 30, 2026
Forty million people depend on the Colorado River. Some of its largest cities are facing real shortages. Yet nearly half of the water put to human use in the basin goes to growing feed crops such as alfalfa, hay and silage for cattle, with a meaningful share exported overseas.
This is not a hydrology problem. It is a political one.
The misuse of water
Growing alfalfa and hay to feed livestock consumes roughly 46% of all the water put to human use in the basin—more than every city and industry combined, and more than any other single use of the river. In the Imperial Valley, a material portion of alfalfa is exported. Foreign agribusinesses, including Saudi Arabia’s Fondomonte and the UAE’s Al Dahra, have leased Southwestern land to grow water-intensive feed and ship it home to countries that have banned the same crop domestically to protect their own water. Arizona’s governor already canceled state land leases with one of these companies over exactly this issue. We are draining a river that 40 million Americans depend on to grow low-value cattle feed.
This is not even a true market outcome. Between 2017 and 2023, the federal Crop Insurance Program paid $5.6 billion to farmers in the seven Colorado River states for drought-related losses, including more than $2 billion to alfalfa and hay growers alone. Separately, the federal government has committed $1.2 billion over three years under the 2023 Lower Basin conservation agreement to pay some of those same farmers to leave water in the river instead — and under “use it or lose it” water law, that money does not necessarily translate into lasting reduced consumption once the payments end. We are subsidizing the least essential, most water-intensive use of the river while barely funding a lasting transition away from it. These policies ignore urgent human needs and support the continued subsidized irrigation of low-value crops.
Because so much of this crop is exported, converting these acres would not meaningfully affect the U.S. or global food supply. Foreign and domestic buyers would simply source feed from places where water is not scarce. What we would lose is a low-value export that is consuming precious water.
Nobody needs Southwestern agriculture to disappear. Israel farms one of the driest landscapes on Earth and still exports produce because it rebuilt its water use around efficiency instead of volume.
Drip irrigation, which Israel pioneered in the 1960s, delivers water at 70% to 90% efficiency, compared with roughly 40% to 60% for the flood irrigation still common in the Colorado River Basin.
Israel recycles 85% to 90% of its municipal wastewater, supplying more than half its total agricultural demand. Israeli farming also shifted deliberately from low-value, high-water fodder crops to higher-value, lower-water produce such as tomatoes, peppers, dates and avocados. None of this is exotic or new.
Why the status quo persists
So why has nothing changed here? Under prior appropriation law, the oldest agricultural water rights, some dating to the 1800s, are legally senior to every city built afterward, including Phoenix, Las Vegas and Los Angeles. That seniority is the leverage in every negotiation.
The Imperial Irrigation District alone holds senior rights to roughly 3.1 million acre-feet a year — nearly a fifth of the river’s average flow, and on its own equal to Arizona’s and Nevada’s entire combined state allocations. That gives a handful of districts a permanent seat at every basin-wide deal because the law guarantees it. When $4 billion in federal conservation funding was distributed through the Inflation Reduction Act, much of it paid agricultural districts to conserve water they were under no legal obligation to relinquish, thanks to their senior water rights.
This is organized and specific, not a vague farm lobby. The Family Farm Alliance, representing irrigated agriculture across 16 Western states, has testified before Congress repeatedly over the past two decades and led a 2025 push for at least $2 billion in near-term drought funding to sustain current agricultural use, not reduce it.
What should change
None of this is an argument against private property or against farmers and ranchers as people. Water rights in the West are real property, built into land value, farm equity and family inheritance. Any transition worth pursuing must compensate people fairly for what the law actually gave them. Conservation is not agriculture’s job alone. Cities owe real cuts too, through tiered pricing, continued investment in water reuse, limits on ornamental turf and honest accounting of growth in already stressed areas.
But fairness among water users does not mean treating every use as equally necessary. Water for people—for drinking, sanitation and food—comes before subsidized hay exports. That ranking is not radical. It is what “beneficial use” was always supposed to mean before the term became a shield for the status quo.
The technical plan is not the missing piece; versions of it have circulated for years. What is missing is the political will to say, plainly and before the next crisis, that human need outranks irrigated hay, even when the institutions built to avoid that choice are loud, organized and well funded. The reservoirs will not wait for a more comfortable moment. Neither should we.
The 40 million people who depend on the Colorado River should demand that political and business leaders protect their most precious, life-sustaining resource.
Daniel Frey is a Boulder resident, non-practicing CPA and Certified Energy Manager (CEM). He researches and writes on energy and sustainability issues.
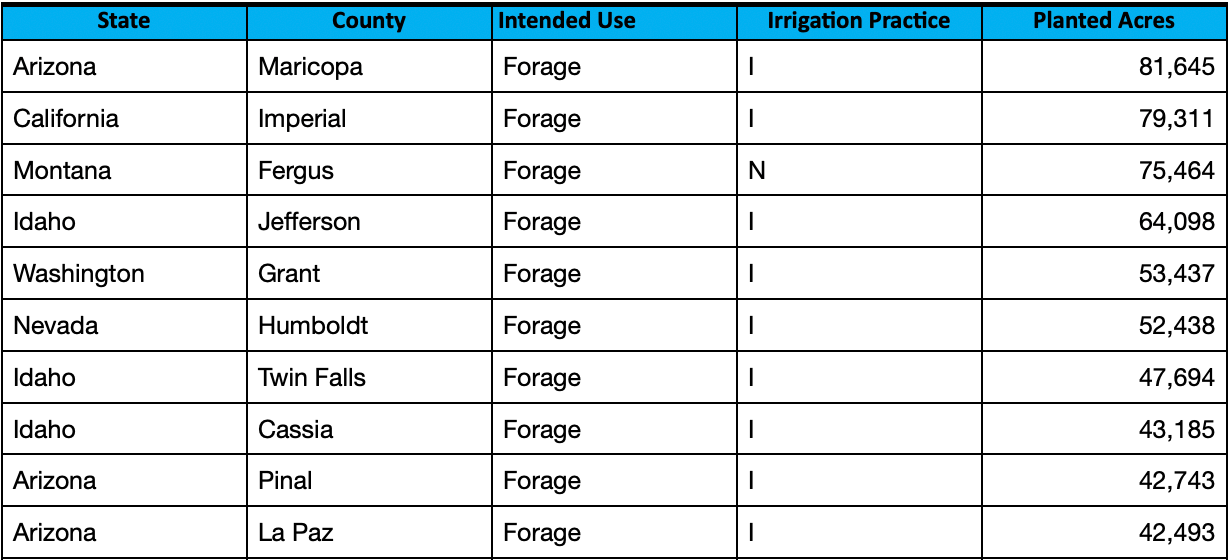
Top ten Western counties for acreage planted in alfalfa. Data Source: USDA NASS.
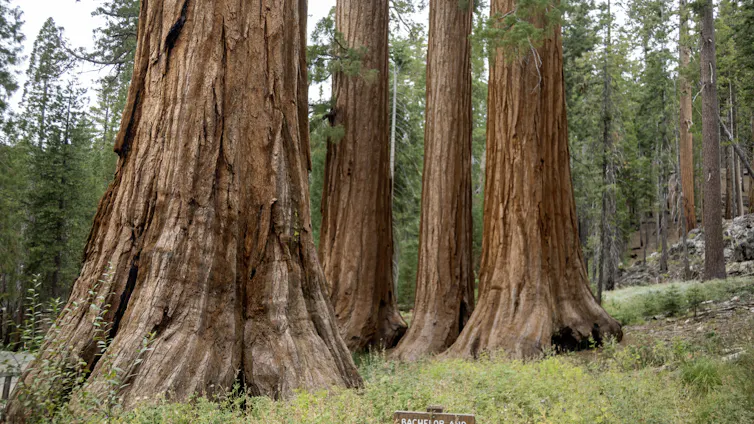
The proposed deal, which a government spokesperson said has not been finalized, would involve a land swap: The government would give the developer a small area of the park’s land on which to build a private access road between a proposed resort and the park itself. In exchange, the developer would buy land of similar value near the park, or elsewhere in California, and transfer that land to federal ownership.
Environmental advocates and park staff have worried for more than a year that the administration’s cuts to the National Park Service’s budget and staffing would lead to further privatization of the national parks’ land and business operations.
The nation has a long history of similar efforts, including a wildly unpopular 1980 attempt by Reagan administration Interior Secretary James Watt to promote development and expand private concessions in the parks. But debate over using public national park land for private profit dates back more than a century before that.
In early 1864, Central American Steamship Transit Company representative Israel Ward Raymond wrote a letter to John Conness, a U.S. senator from California, urging the government to move swiftly to preserve the Yosemite Valley and the Mariposa Grove of giant sequoia trees to prevent them from falling into private hands. Five months later, President Abraham Lincoln signed the Yosemite Grant Act, ceding the valley and the grove to the state of California, “upon the express conditions that the premises shall be held for public use, resort, and recreation.” This was years before Yellowstone became the first federal land designated a national park in 1872.
California said their businesses threatened the state’s ability to develop roads and trails in Yosemite by competing for tourist dollars. A legal battle ensued and was not resolved until an 1872 U.S. Supreme Court ruling found that the men’s land claims had not been fully validated according to the procedures of the time. The California legislature paid both men compensation for their land, and both left the park.
Yet, as my research has found, the role of private interests in the park remained unsolved. Private companies under contract to the National Park Service have long provided needed amenities such as lodging and food within the national parks. But questions over what is acceptable in national parks in the pursuit of profit have shaped Yosemite’s history for generations.
In 1925, I found, the question centered on the right to build the first gas station inside the park, in Yosemite Valley. Two private businesses, the Curry Camping Company and the Yosemite National Park Company, had long competed for tourist dollars within the park. Each wanted to build a gas station to boost profits.
Frustrated over the need to decide, National Park Service Director Horace Albright ordered the rival firms to simplify management of the park’s concessions. The companies merged, and the newly formed Yosemite Park and Curry Company was granted the exclusive rights to run lodges, restaurants and other facilities within the park, including the new gas station.
But as I found in my research, the park service and the concessions company did not always see eye to eye on the purpose of the park. The conflict between profit and preservation is perhaps most clearly illustrated by the construction of a ski area within the park in the early 1930s. The park service initially opposed the development of Badger Pass Ski Area as not conducive to the national park ideal, but the Yosemite Park and Curry Company insisted it was key to boosting winter use of the park.
In 1973, the Music Corporation of America, an entertainment conglomerate, bought the Yosemite Park and Curry Company. The company already had a tourist attraction operating near Hollywood, where visitors could pay to tour movie sets, but had not yet changed its name to Universal Studios or launched major theme parks in Florida and California. Its purchase of the park’s concessions set off a firestorm of controversy over fears of turning Yosemite into a theme park.
That didn’t happen, but annual park visitor numbers climbed from 2.5 million to 3.8 million over the 20 years MCA ran the concessions, which sparked concerns about development and overcrowding in the park. Conservationists argued the park service had allowed the corporate giant to promote and develop the park in ways that threatened the very aspects of the park most people came to enjoy.
With three restaurants, two service stations with a total of 15 gas pumps, two cafeterias, two grocery stores, seven souvenir shops, a delicatessen, a bank, a skating rink, three swimming pools, a golf course, two tennis courts, kennels, a barbershop, a beauty shop, Badger Pass Ski Area and three lodges, the Yosemite Valley was a busy commercial district. Critics argued that such development contradicted the park service’s mandate to leave national parks unimpaired for the enjoyment of future generations.
Falling profits and consolidation within the music industry led MCA to sell its concessions rights in Yosemite in 1993. The Delaware North Companies, a global hospitality corporation, took over and ran the park’s concessions until 2016, when it sold the rights to Aramark.
But in that sale, the question of public resources and private profits arose again. Delaware North demanded $51 million in compensation for Aramark continuing to use the names of several historic properties within the park, such as the Ahwahnee, a hotel, and Curry Village, another group of visitor accommodations. The company claimed those names were a part of its assets under its contract with the park service.
The park service rejected the claim, saying the names, which dated back more than a century, belonged to the American people. But to avoid legal problems during the transition, the agency temporarily renamed several sites, including calling the Ahwahnee the Majestic Yosemite Hotel and changing Curry Village to Half Dome Village. Public outrage erupted, denouncing the claim by Delaware North as commercial overreach that threatened to distort Yosemite’s heritage. In 2019, the park service and Aramark agreed to pay Delaware North a total of $12 million to settle the dispute, and the original names were restored. https://www.youtube.com/embed/LXfnTKLw8Qg?wmode=transparent&start=0 Protesters unfurl an upside-down U.S. flag from the top of El Capitan in Yosemite National Park in February 2025, protesting Trump administration changes to the National Park Service.
Renewed interest in commercial efforts
In June 2025, Yosemite again took center stage in the dispute over the role of federal funding versus private interests at the start of the second Trump administration when a group of climbers unfurled an American flag upside down off El Capitan in protest of the administration’s cuts in personnel and slashing of the park service’s budget.
Members of Congress and former park service officials say the reported effort in 2026 to turn over park land to a private owner would be a major blow to federal efforts to protect parks and conserve land.
Whichever side prevails in the short term, the debate over the role of private interests within national parks like Yosemite will undoubtedly continue.
Map of the San Juan River, a tributary of the Colorado River, in Arizona, Colorado, New Mexico and Utah, USA. Made using USGS National Map data. By Shannon1 – Own work, CC BY-SA 4.0, https://commons.wikimedia.org/w/index.php?curid=47456307
At recent meetings, the San Juan Water Conservancy District (SJWCD) and the Pagosa Water and Sanitation District (PAWSD) boards of directors approved applications for findings of reasonable diligence for several water rights held by the districts…At an Aug. 13 meeting, the PAWSD Board of Directors unanimously approved applications for findings of reasonable diligence for three sets of water rights, including rights for the San Juan River intake, a group of rights associated with the Dry Gulch Reservoir project that the SJWCD leads development on, and a second enlargement on a water right in Dutton Ditch. The Dry Gulch and Dutton Ditch water rights are held by both PAWSD and the SJWCD, while the San Juan right is exclusive to PAWSD. PAWSD board member Bill Hudson pointed out that these water rights are not rights PAWSD is currently using, but are rights that could be developed in the future if the district needs them…At an Aug. 17 meeting, the SJWCD Board of Directors also unanimously approved diligence filings for the Dry Gulch and Dutton Ditch water rights. SJWCD legal counsel Jeffrey Kane explained to the board that he would file the joint application for the Dry Gulch water rights, while PAWSD’s legal counsel would file the application for the Dutton Ditch water rights.
Reductions in Lower Basin water use during the last four years, including forecast use in 2026, are similar to the initial targets for Lower Basin shortages described in the Final Environmental Impact Statement for Post-2026 Operational Guidelines and Strategies for Lake Powell and Lake Mead (FEIS) and the accompanying Record of Decision (ROD). 6 Lower Basin consumptive use in 2023, 2024, and 2025, and forecast for 2026 has been the smallest for the entire 2010-2026 period. These four years of smallest use are between 1.4 and 1.7 million acre feet/year (maf/yr) less than the 7.50 maf/yr amount generally recognized as the Lower Basin’s mainstem allocation.
Reductions in Lower Basin use have been achieved by large reductions implemented by Central Arizona Project (CAP) contractors and subcontractors, the Imperial Irrigation District (IID), and non-CAP water users in Arizona. The reductions in use in the IID have been in summer water use and have not affected consumptive use in winter when garden crops, such ass lettuce, onions, carrots, and broccoli, are grown.
There is no historical analogy for implementing Lower Basin shortages of 3 maf/yr that would reduce annual consumptive water use to 4.5 maf/yr. We identified the lowest use in each month between 2010 and 2026 in each Lower Basin state and summed those monthly values, even when those months did not occur in the same year. The annual total of the summed lowest monthly uses yielded a minimum total Lower Basin use of 5.03 maf/yr. Thus, implementation of 3 maf/yr shortages would require reductions in monthly use greater than the sum of the smallest monthly uses during the past 17 years.
INTRODUCTION
This paper is part of a series, The Colorado River Water Supply Crisis in a Few Graphs, whose goal is to provide readers with summary information about the natural water supply, reservoir storage, and consumptive uses and losses in the Basin so that readers can better understand and consider the current water crisis. The long-term fate of the water supply provided by the Colorado River depends on many complex and interconnected factors: the natural flow of the river, the amount of water stored in the Basin’s reservoirs, the consumptive uses of that water, the losses caused by reservoir evaporation, and the losses associated with water flowing through natural channels (i.e., transmission losses).
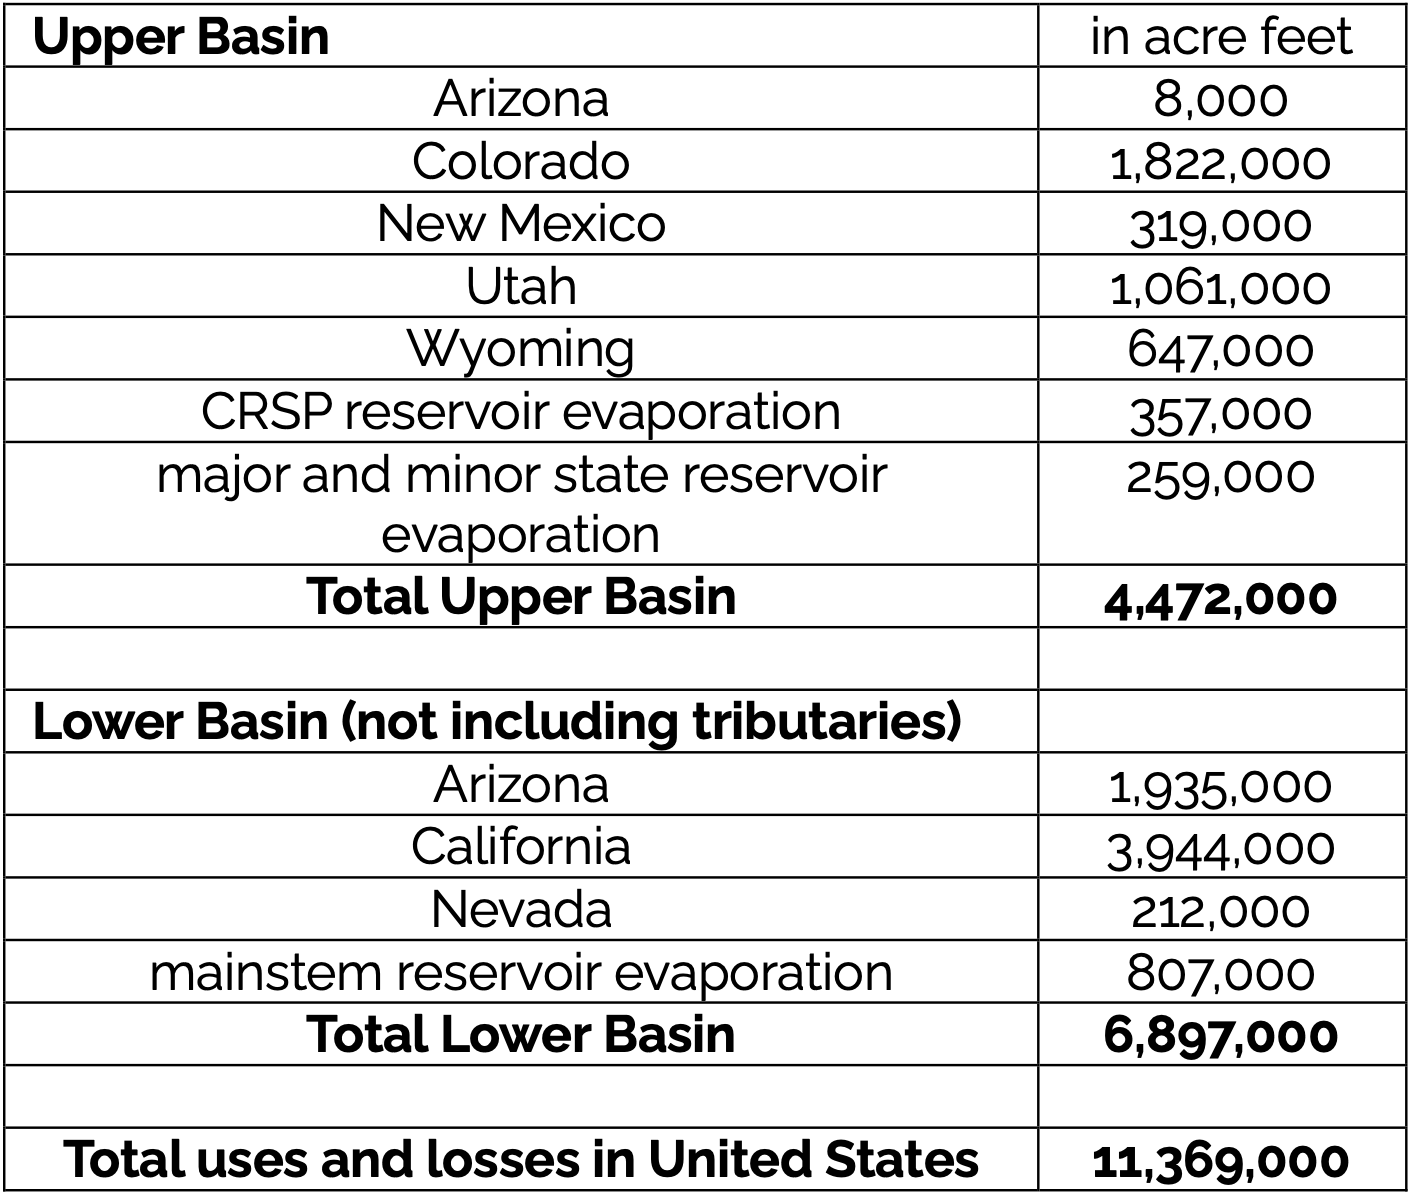
In 2024, approximately 60% of all uses and losses of Colorado River water in the United States occurred in the Lower Basin (Table 1).⁷ In this paper, we summarize water use in the Lower Basin since 2010, primarily focusing on consumption by the Imperial Irrigation District (IID), the largest user in the entire Colorado River Basin, and on the aggregate consumption by Arizona users not served by the Central Arizona Project (CAP). We focus on these agricultural users, because agriculture makes up approximately 60% of consumptive uses in the Lower Basin,⁸ and the agricultural sector will play a significant role in future reductions in water use in the Lower Basin.
Table 1. Consumptive uses and losses in the United States part of the Colorado River Basin in 2024.9
This paper provides historical context in which to consider the magnitude of recent reductions in Lower Basin water use by comparing current water use with typical rates of use since 2010. We also provide historical context for the shortage goals described in the recently released ROD and Operating Guidelines for 2027 and 2028. 10 The ROD lists a potential maximum Lower Basin reduction of 3.0 maf/yr but also includes language that seems to allow for even greater reductions, after consultation, in extraordinary circumstances.
We analyze the Lower Basin water use data summarized by the Bureau of Reclamation in annual decree accounting reports formally titled Colorado River Accounting and Water Use Report: Arizona, California, and Nevada.¹¹ These reports are issued each May and summarize monthly water use by every Lower Basin user. Reclamation also provides monthly provisional data on the current year’s water use, and the agency provides forecasts of annual use for the current year.¹² Similarly extensive and precise data describing Upper Basin use are not readily available.
Lake Mead and Lake Powell are the largest reservoirs in the United States and essentially are one gigantic reservoir separated into two parts by the Grand Canyon.¹³ Inflow to this gigantic reservoir primarily is snowmelt from the Rocky Mountains, and a significant amount of that runoff is put to beneficial use by Upper Basin users before it reaches Lake Powell. A small amount of additional inflow occurs within the Grand Canyon, and there are occasional inflows to Lake Mead from the Virgin River. Southern Nevada Water Authority directly withdraws water from Lake Mead, and other Lower Basin users divert stream flow after it is released from Lake Mead.
RECENT LOWER BASIN WATER USE
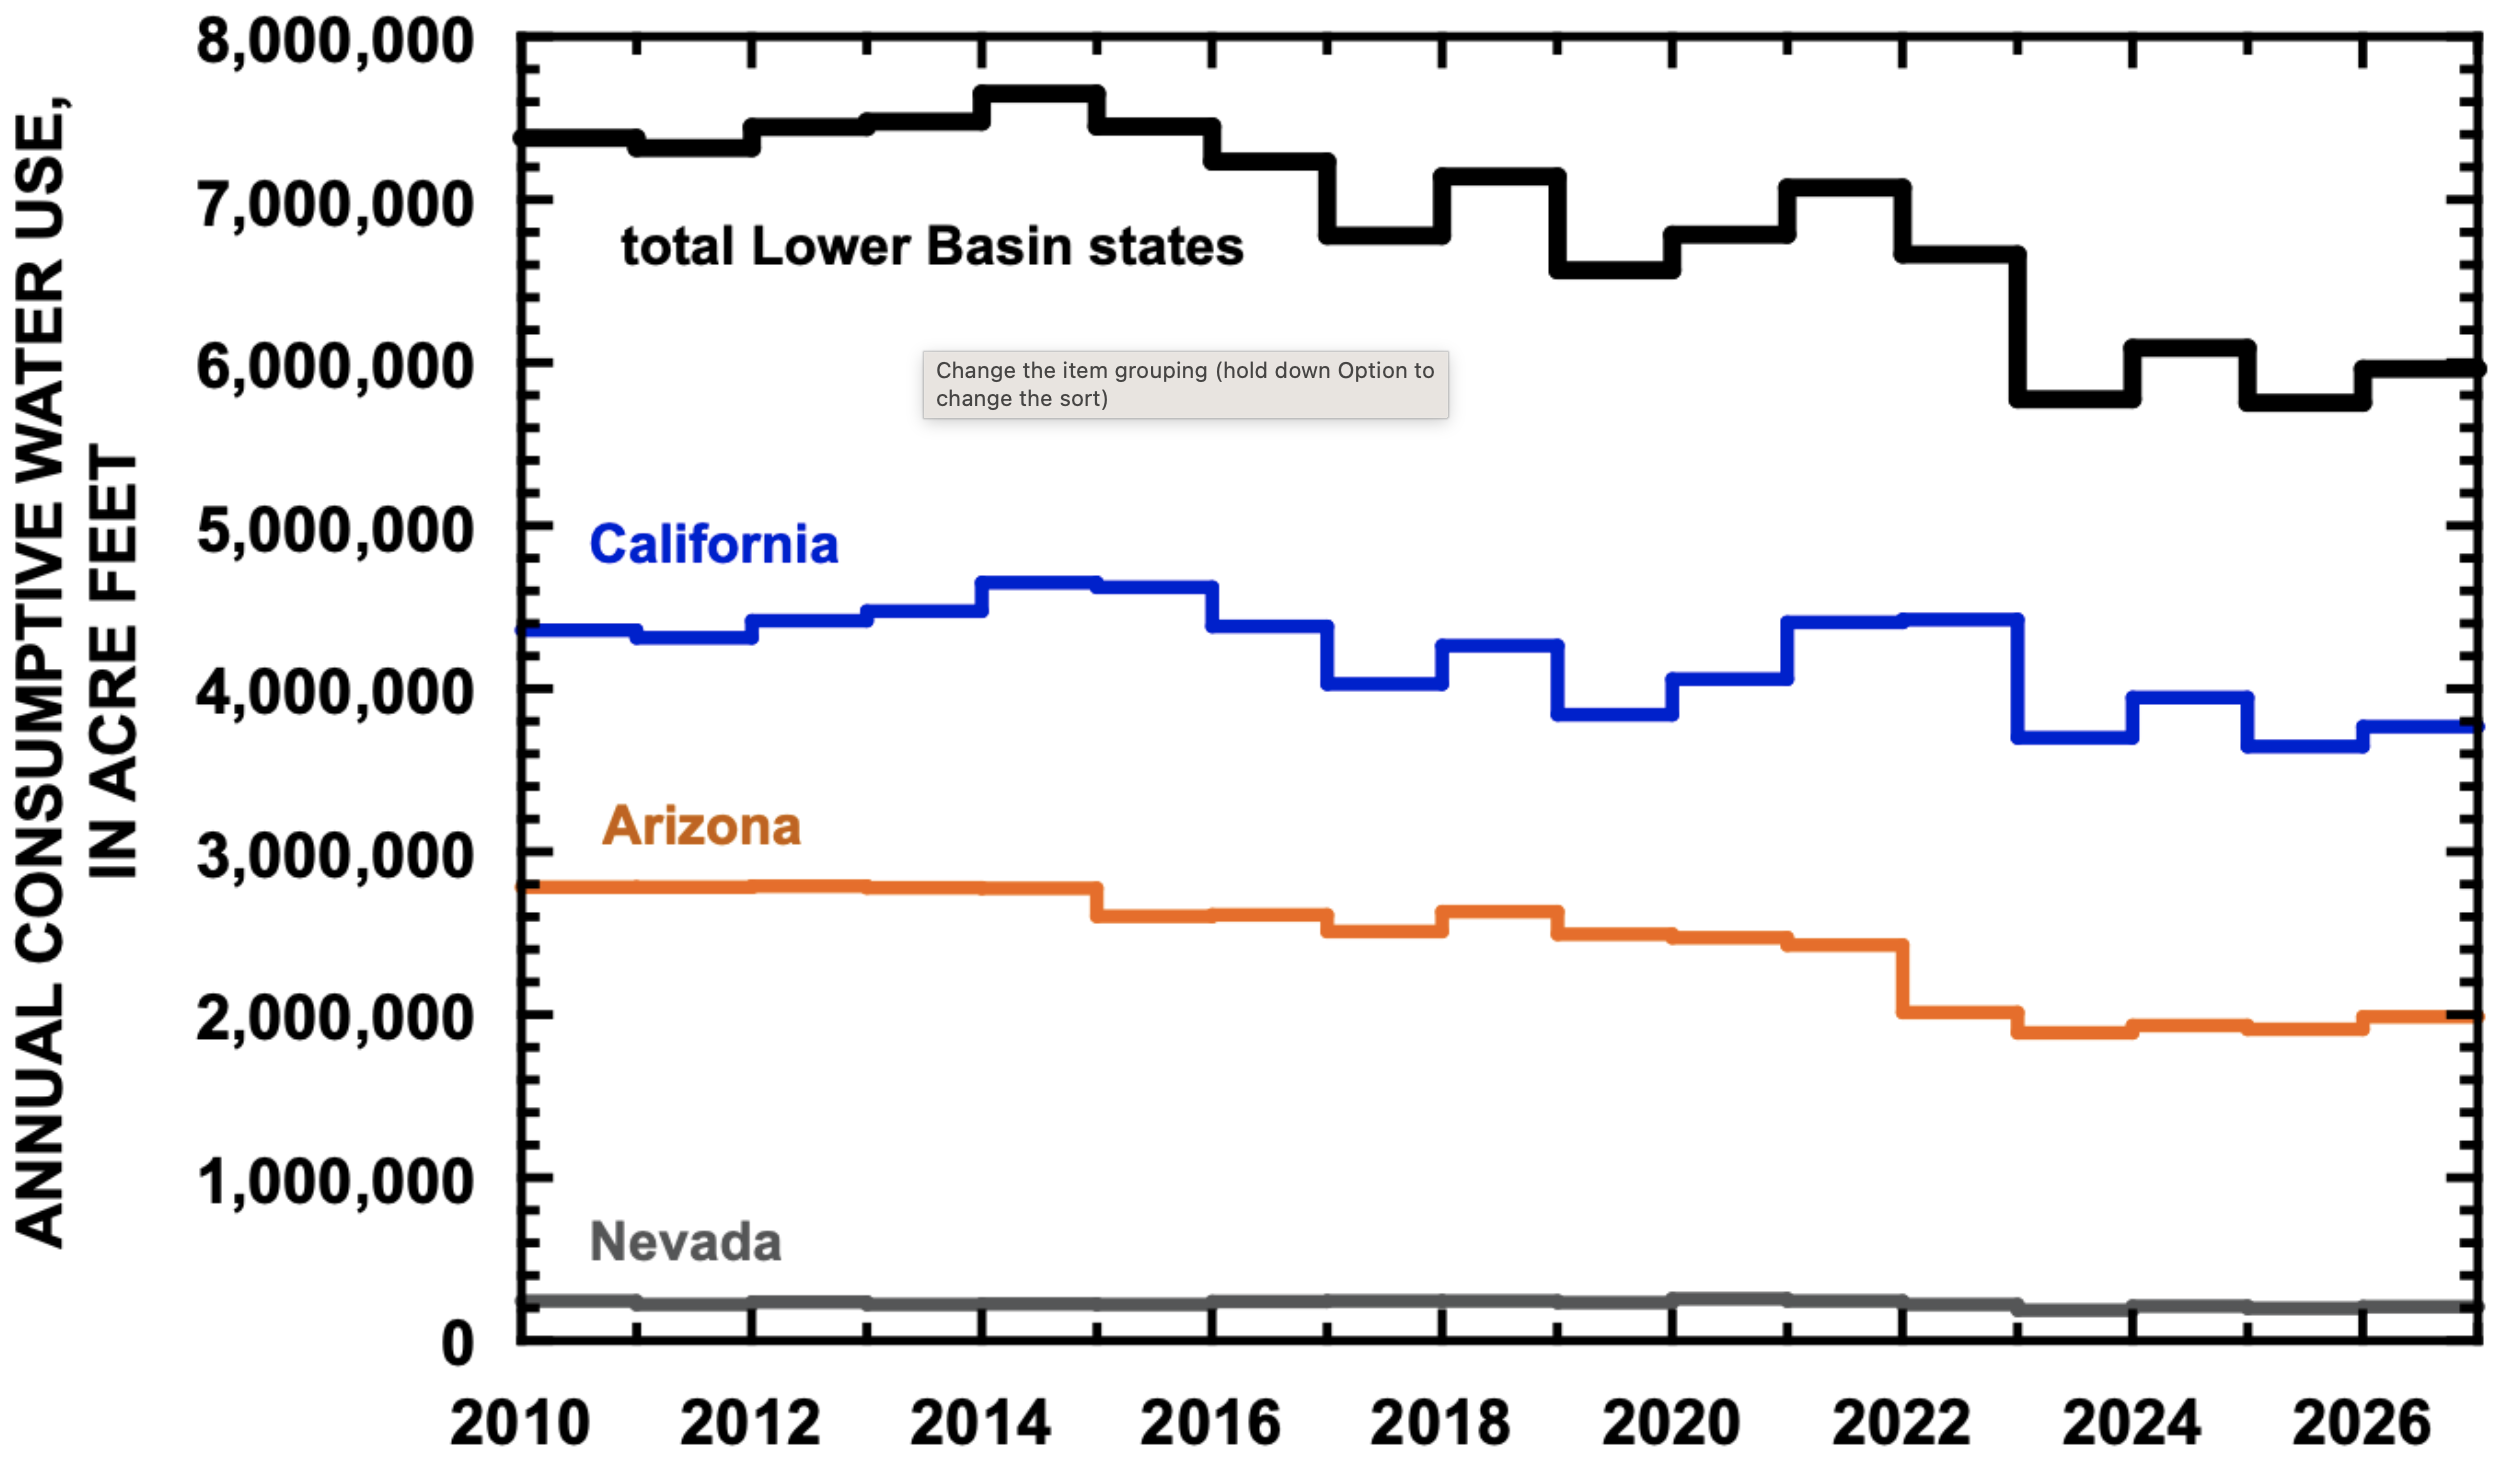
In 2025, total consumptive use in the three Lower Basin states was 5.755 maf, the smallest annual total use since at least 2010 (Fig. 1) and 17% less than the average for 2010-2025.14 This small amount resulted from the lowest annual use in California (3.647 maf) since at least 2010 and the second lowest annual use since 2010 in Arizona (1.911 maf). Lower Basin use in 2026, 5.961 maf, is forecast to be slightly more than in 2025.15
Figure 1. Consumptive use in the Lower Basin since 2010. Estimated use in 2026 based on forecast of September 1, 2026.
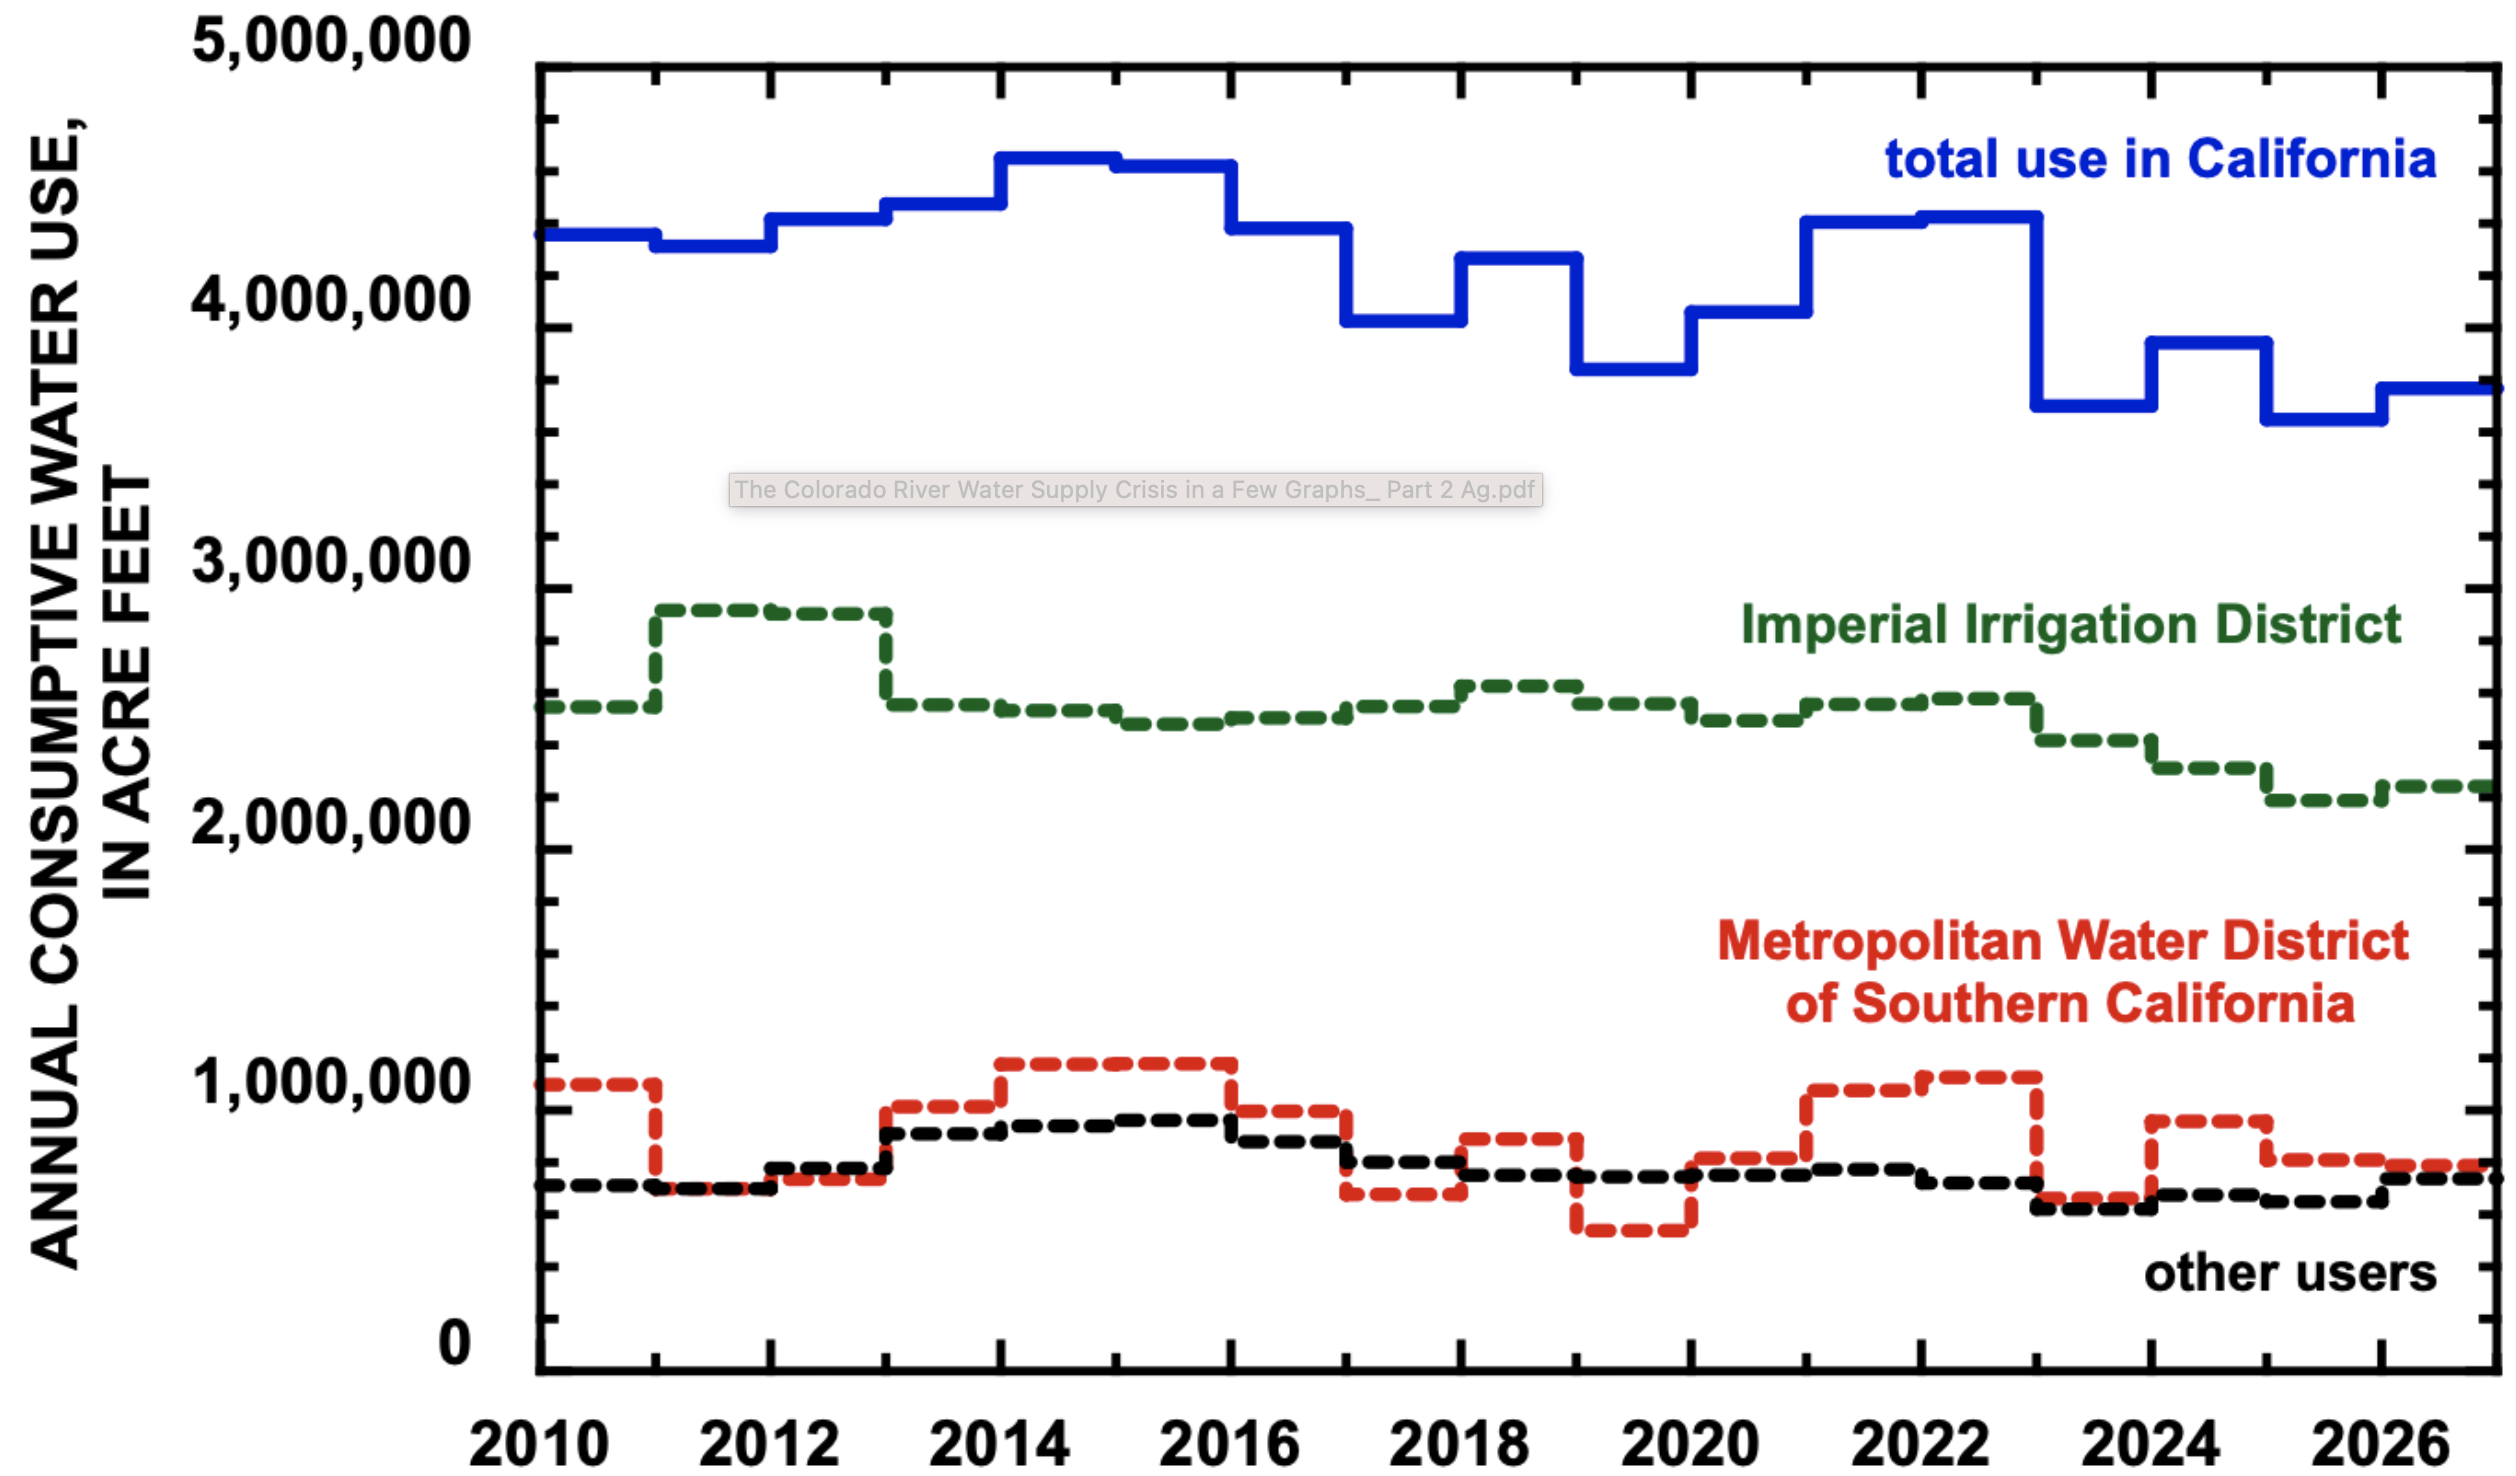
Water use in California since 2023, including forecast use in 2026, has been 13% less than between 2010 and 2022.16 Decreased use in California in those years has been primarily due to reductions in use by IID (Fig. 2). IID’s consumptive use of 2.187 maf in 2025 was the lowest since 2010 and forecast use in 2026 of 2.242 maf is also very low. Average use by IID between 2023 and 2026 will be 12% less than average use between 2010 and 2022.17 Annual consumptive use by the Metropolitan Water District of Southern California (MWD) between 2023 and 2026 will be 13% less than between 2010 and 2022, although the savings are not as great because MWD uses less water than does IID.18
Figure 2. Consumptive use in California since 2010. Estimated use in 2026 based on forecast of September 1, 2026.
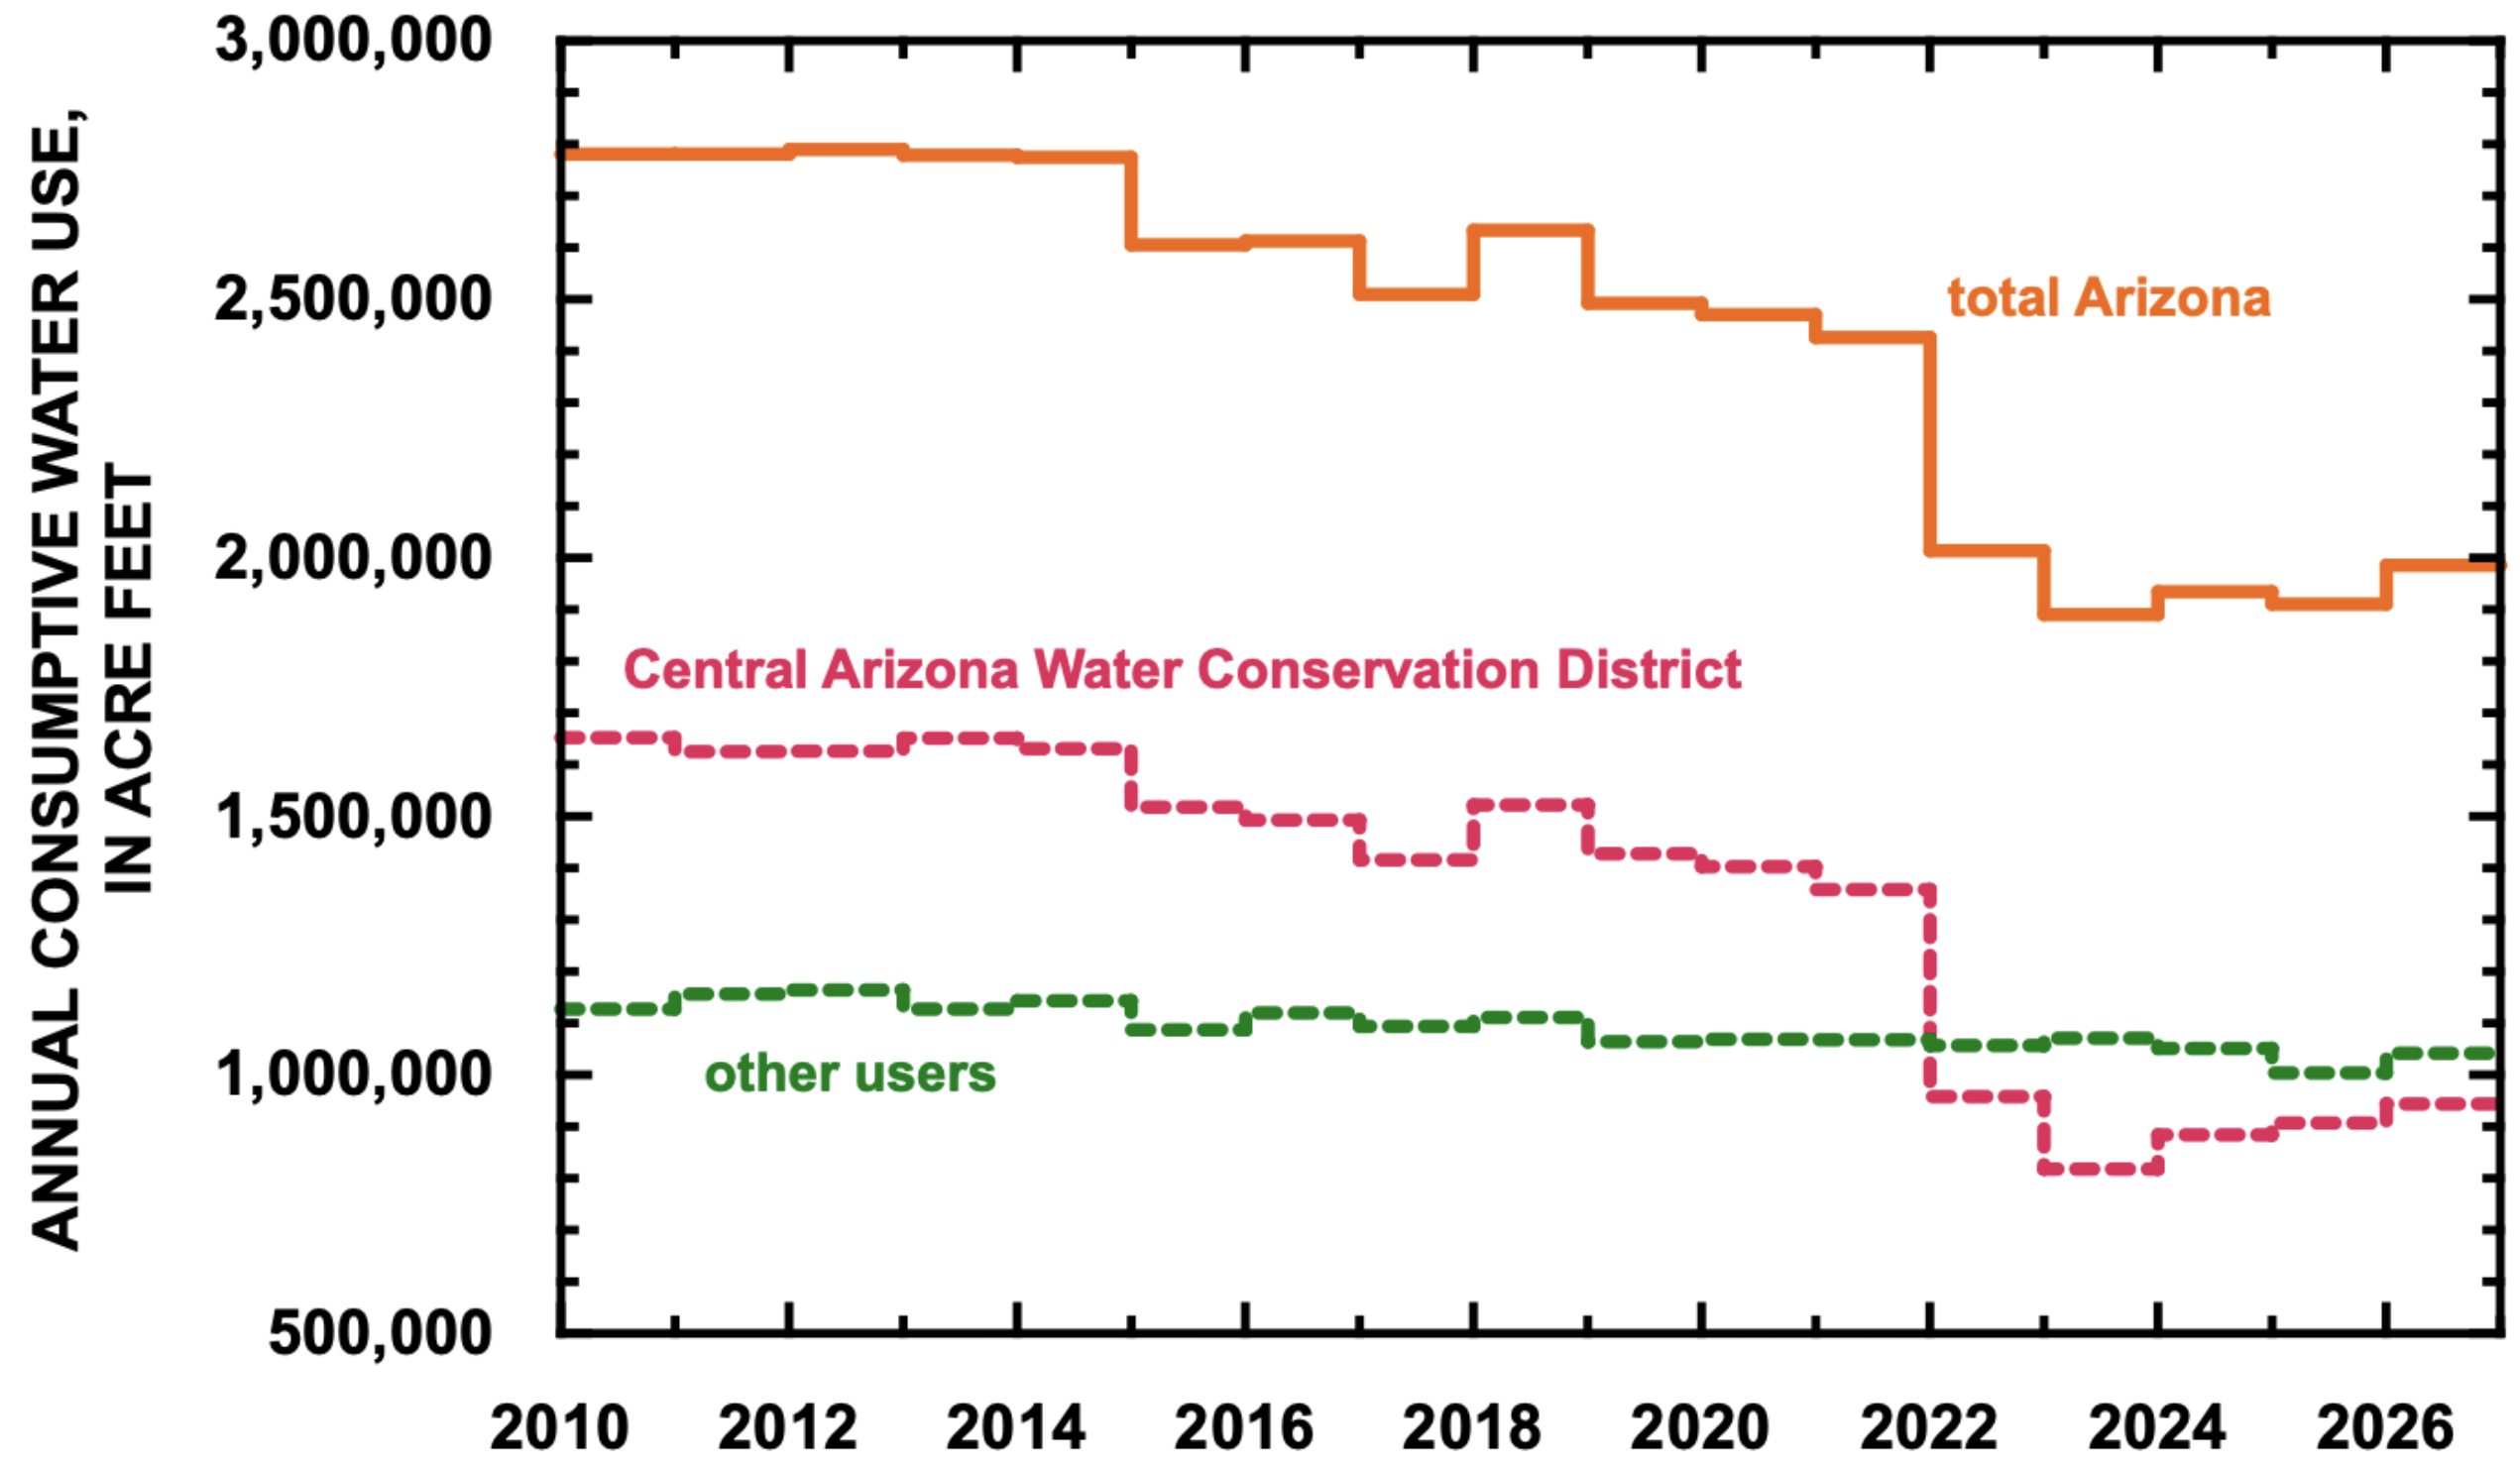
The proportionate reductions in water use in Arizona have been much larger than in California. Average statewide water use between 2023 and 2026 will be 25% less than between 2010 and 2022.19 CAP has reduced its uses by 40% between those two time periods, while non-CAP users have reduced consumption by 6%. The smallest use by Arizona was 1.890 maf in 2023 (Fig. 3). Use in 2025 by non-CAP customers, 1.004 maf, was the lowest since at least 2010. Non-CAP use has exceeded CAP use since 2022.
Figure 3. Consumptive use in Arizona since 2010. Estimated use in 2026 based on forecast of September 1, 2026.
LOWER BASIN AGRICULTURAL WATER USE
Imperial Irrigation District
IID is the largest individual user of mainstem Colorado River water in the Colorado River Basin, exceeding use by any state in the Basin except California itself. Much of California’s ongoing reductions in use are due to decreased use by IID resulting from various compensated agreements. Future reductions by IID have the potential to significantly affect the Basin’s effort to balance consumptive use with declining supply.
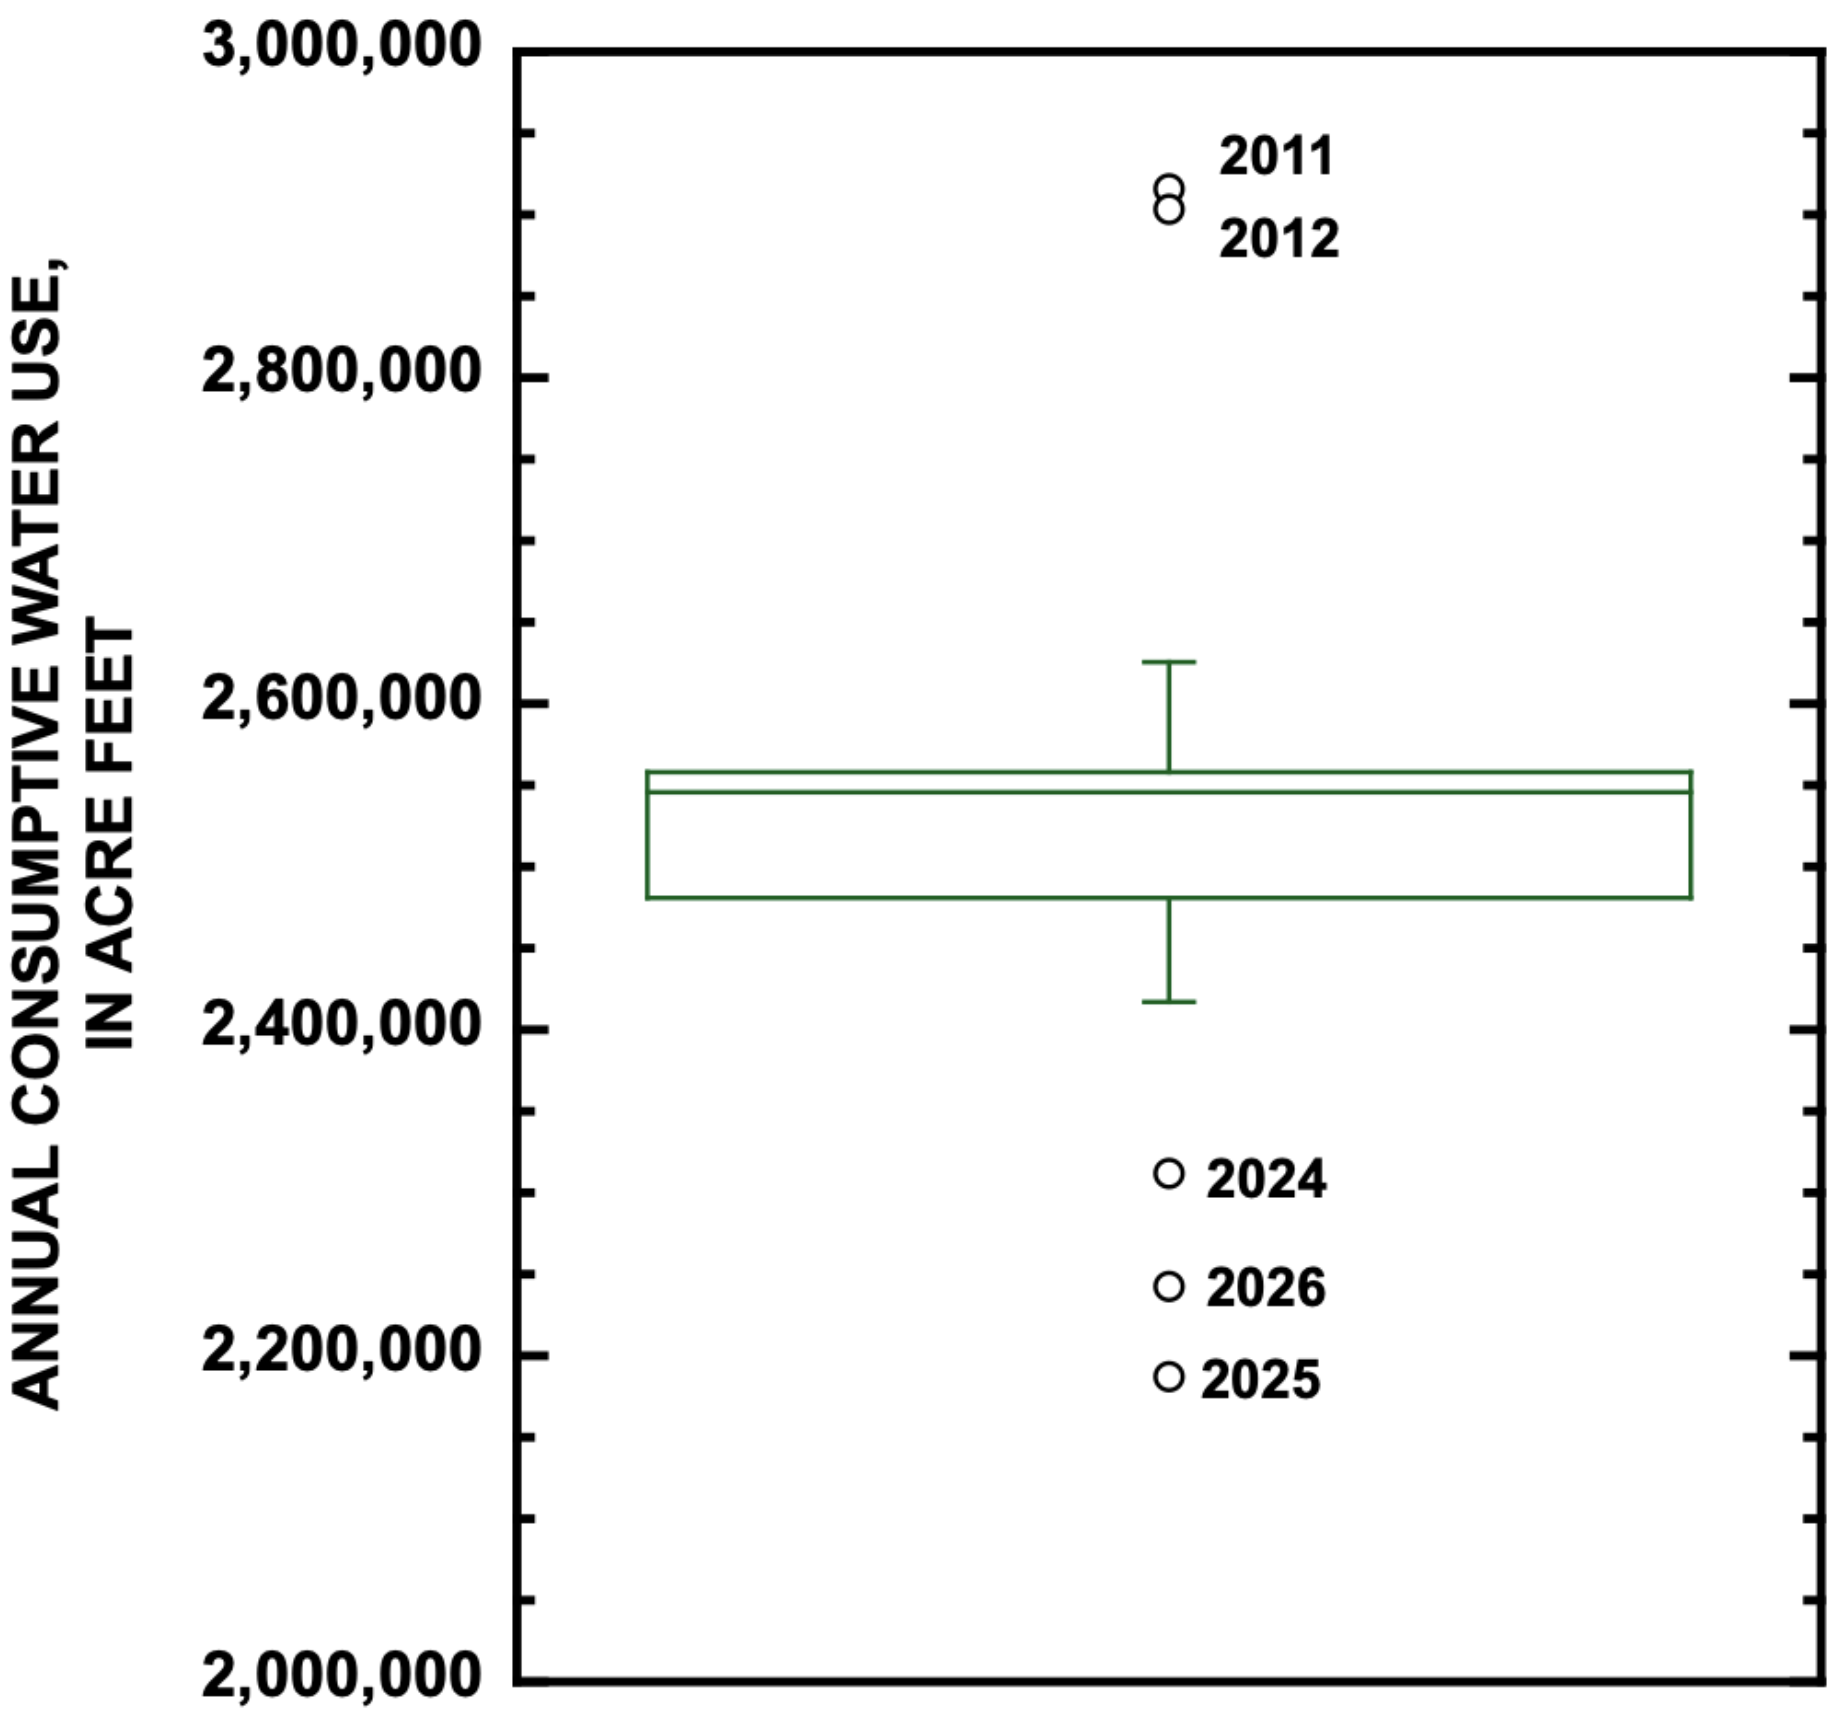
In comparison to typical annual use since 2010, IID’s use in 2024 and 2025, as well as forecast use in 2026, has been notably reduced, as represented in a box-and-whisker plot (Fig. 4).20 The box in Figure 4 encloses 50% of the years since 2010, and the length of this box is called the Inter Quartile Range (IQR), bounded by the 25th and 75th percentile of the 17 years of data, including forecast use in 2026. The line through the middle of the box is the median value for this period. Lines extending up and down from the box (i.e., whiskers) extend from the box to values within an acceptable range. Values that are greater than 1.5 times the IQR above the 75th percentile or below the 25th percentile are beyond the acceptable range and are outliers and individually plotted. Thus, 2024, 2025, and forecast use in 2026 are outliers, indicating that use in those years has been significantly less that typical use during the entire period since 2010.
Figure 4. Box-and-whisker plot showing distribution of annual use by IID since 2010. The box is the Inter Quartile Range, defined by the 25th and 75th percentile of the years of annual use data. The line inside the box is the median. Whiskers extend from the box to an acceptable range, and outliers are circles that are labeled. The three most recent years are outliers of low water use. Estimated use in 2026 based on forecast of September 1, 2026. See text for explanation of a box-and-whisker plot.
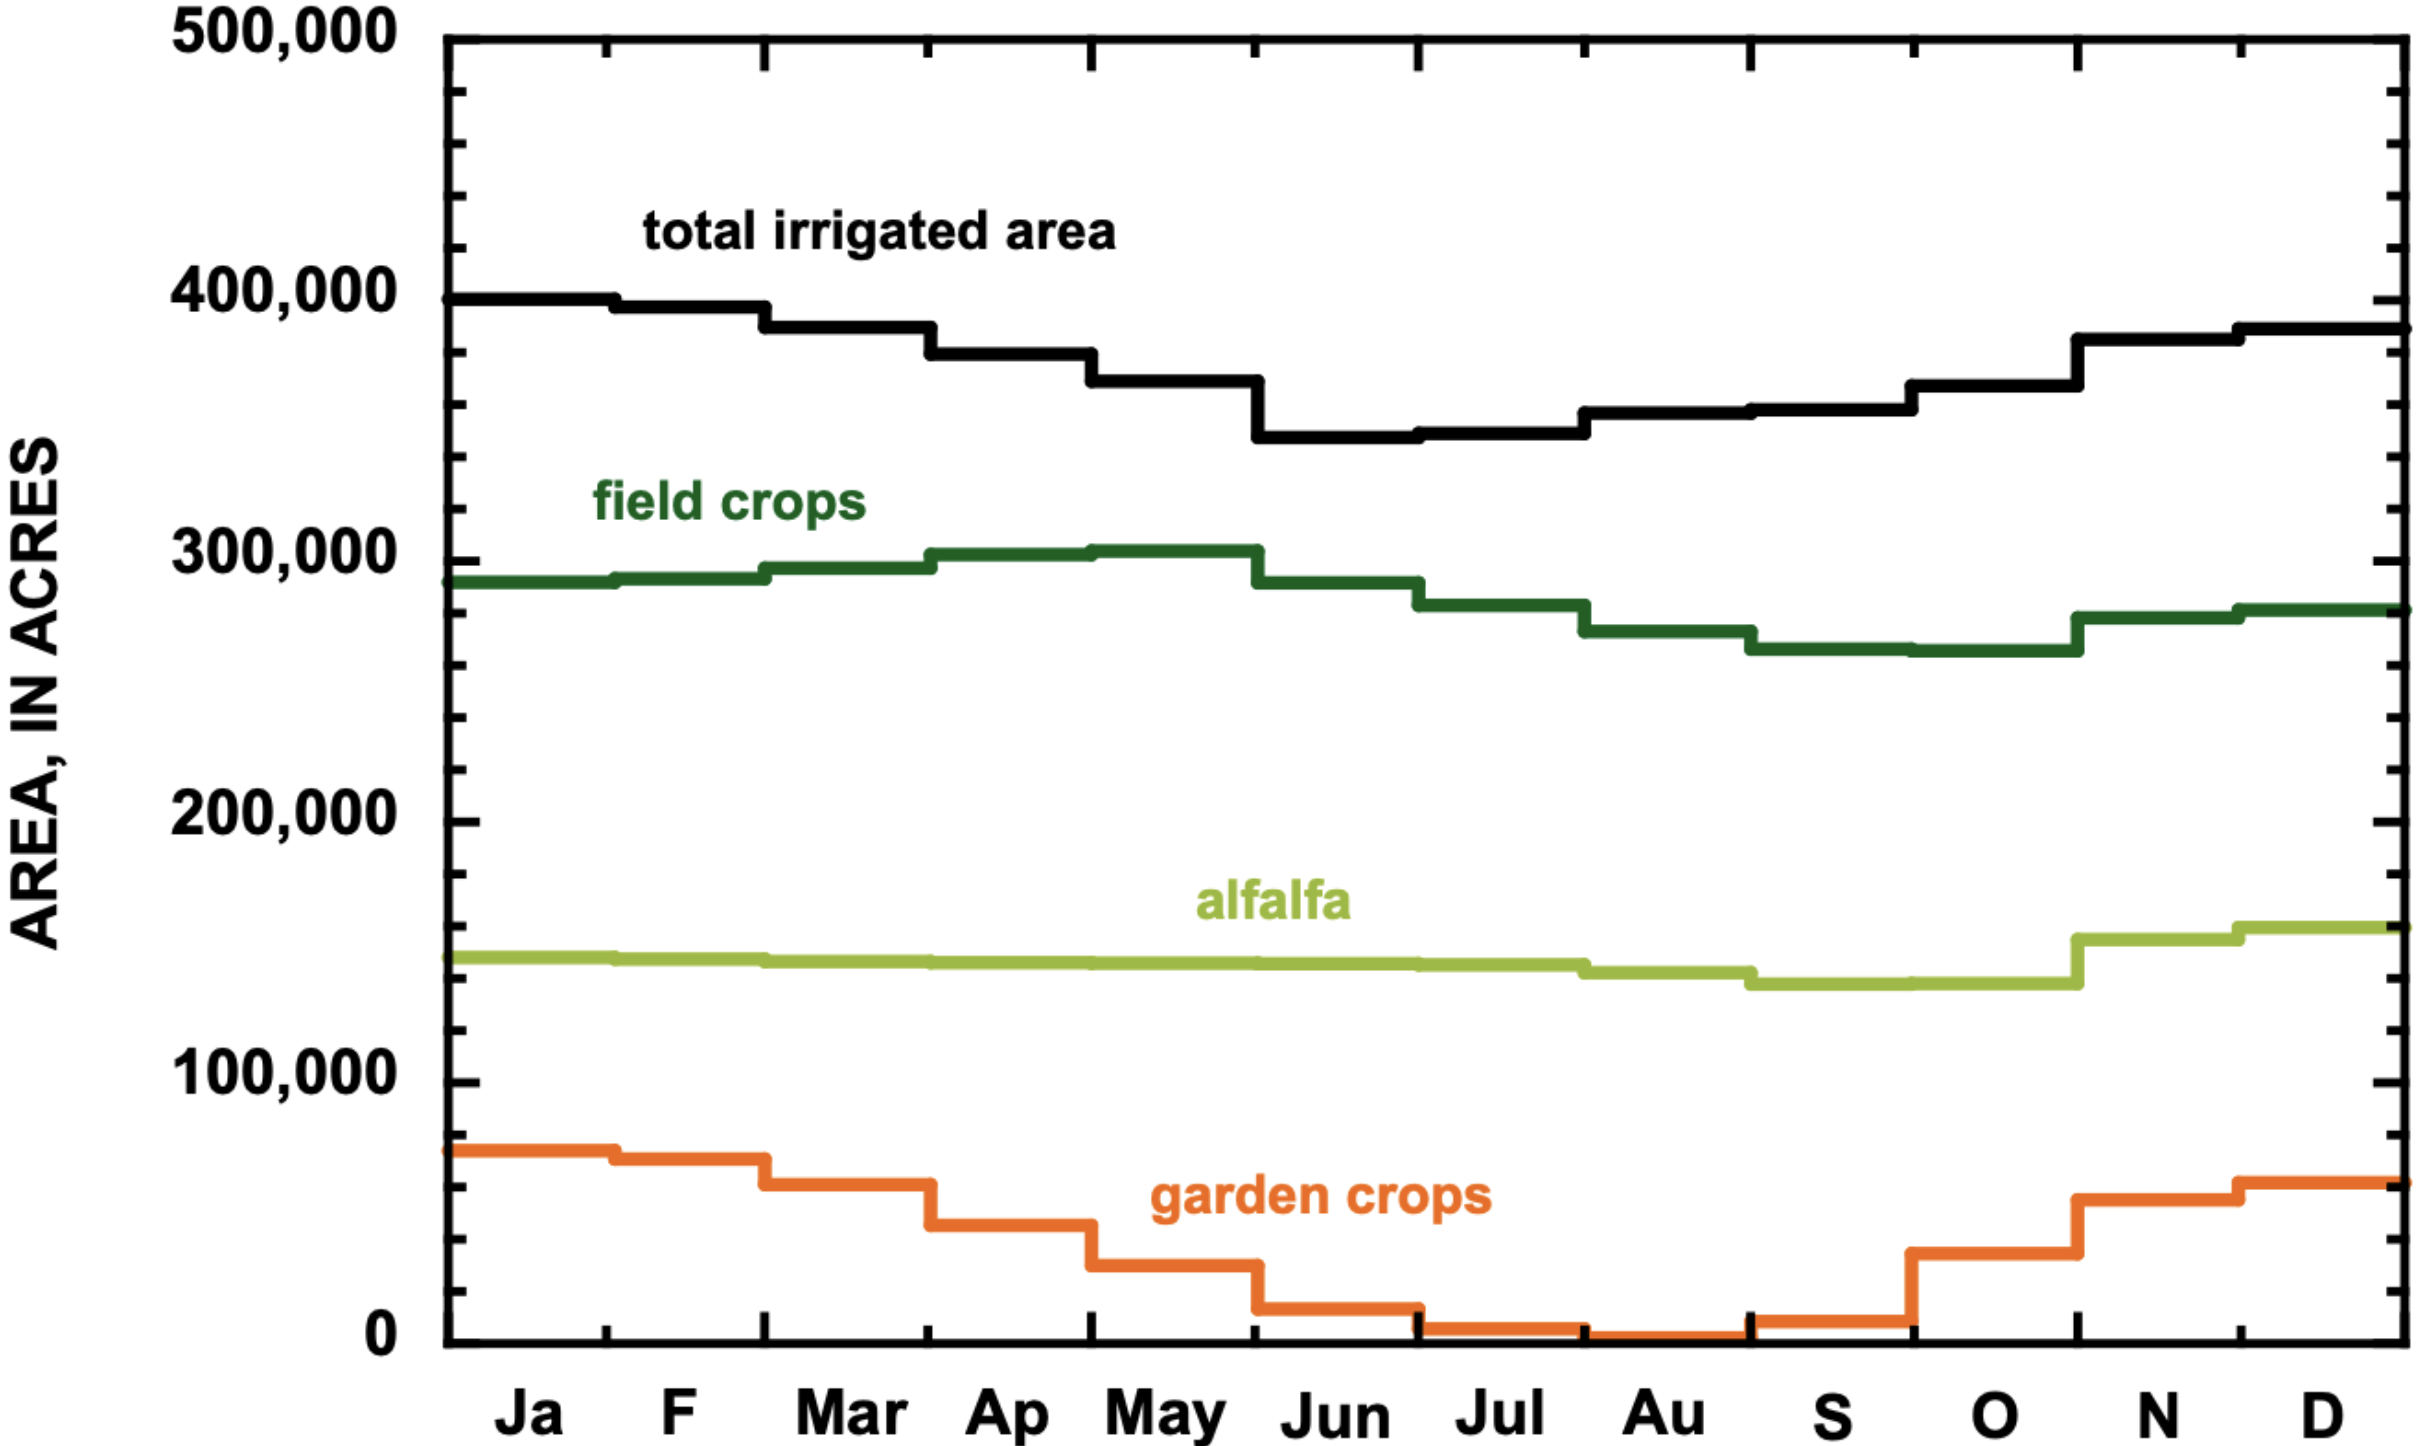
The largest proportion of irrigated land in IID is devoted to field crop production, the largest proportion of which is devoted to alfalfa (Fig. 5).²¹ The area devoted to alfalfa production changes little from year to year and during the year and was approximately 150,000 acres in 2025.²² In 2025, other significant field crops were Bermuda grass and kleingrass, whose average irrigated area was 80,000 and 20,000 acres, respectively. The area devoted to garden crop production changes greatly throughout the year and is largest between November and March. Little land area is devoted to garden crop production in the heat of summer. The most significant garden crops are lettuce, onions, carrots, and broccoli.
Figure 5. Area of IID irrigated for different categories of crops in 2025. Field crops include alfalfa that is also plotted separately.
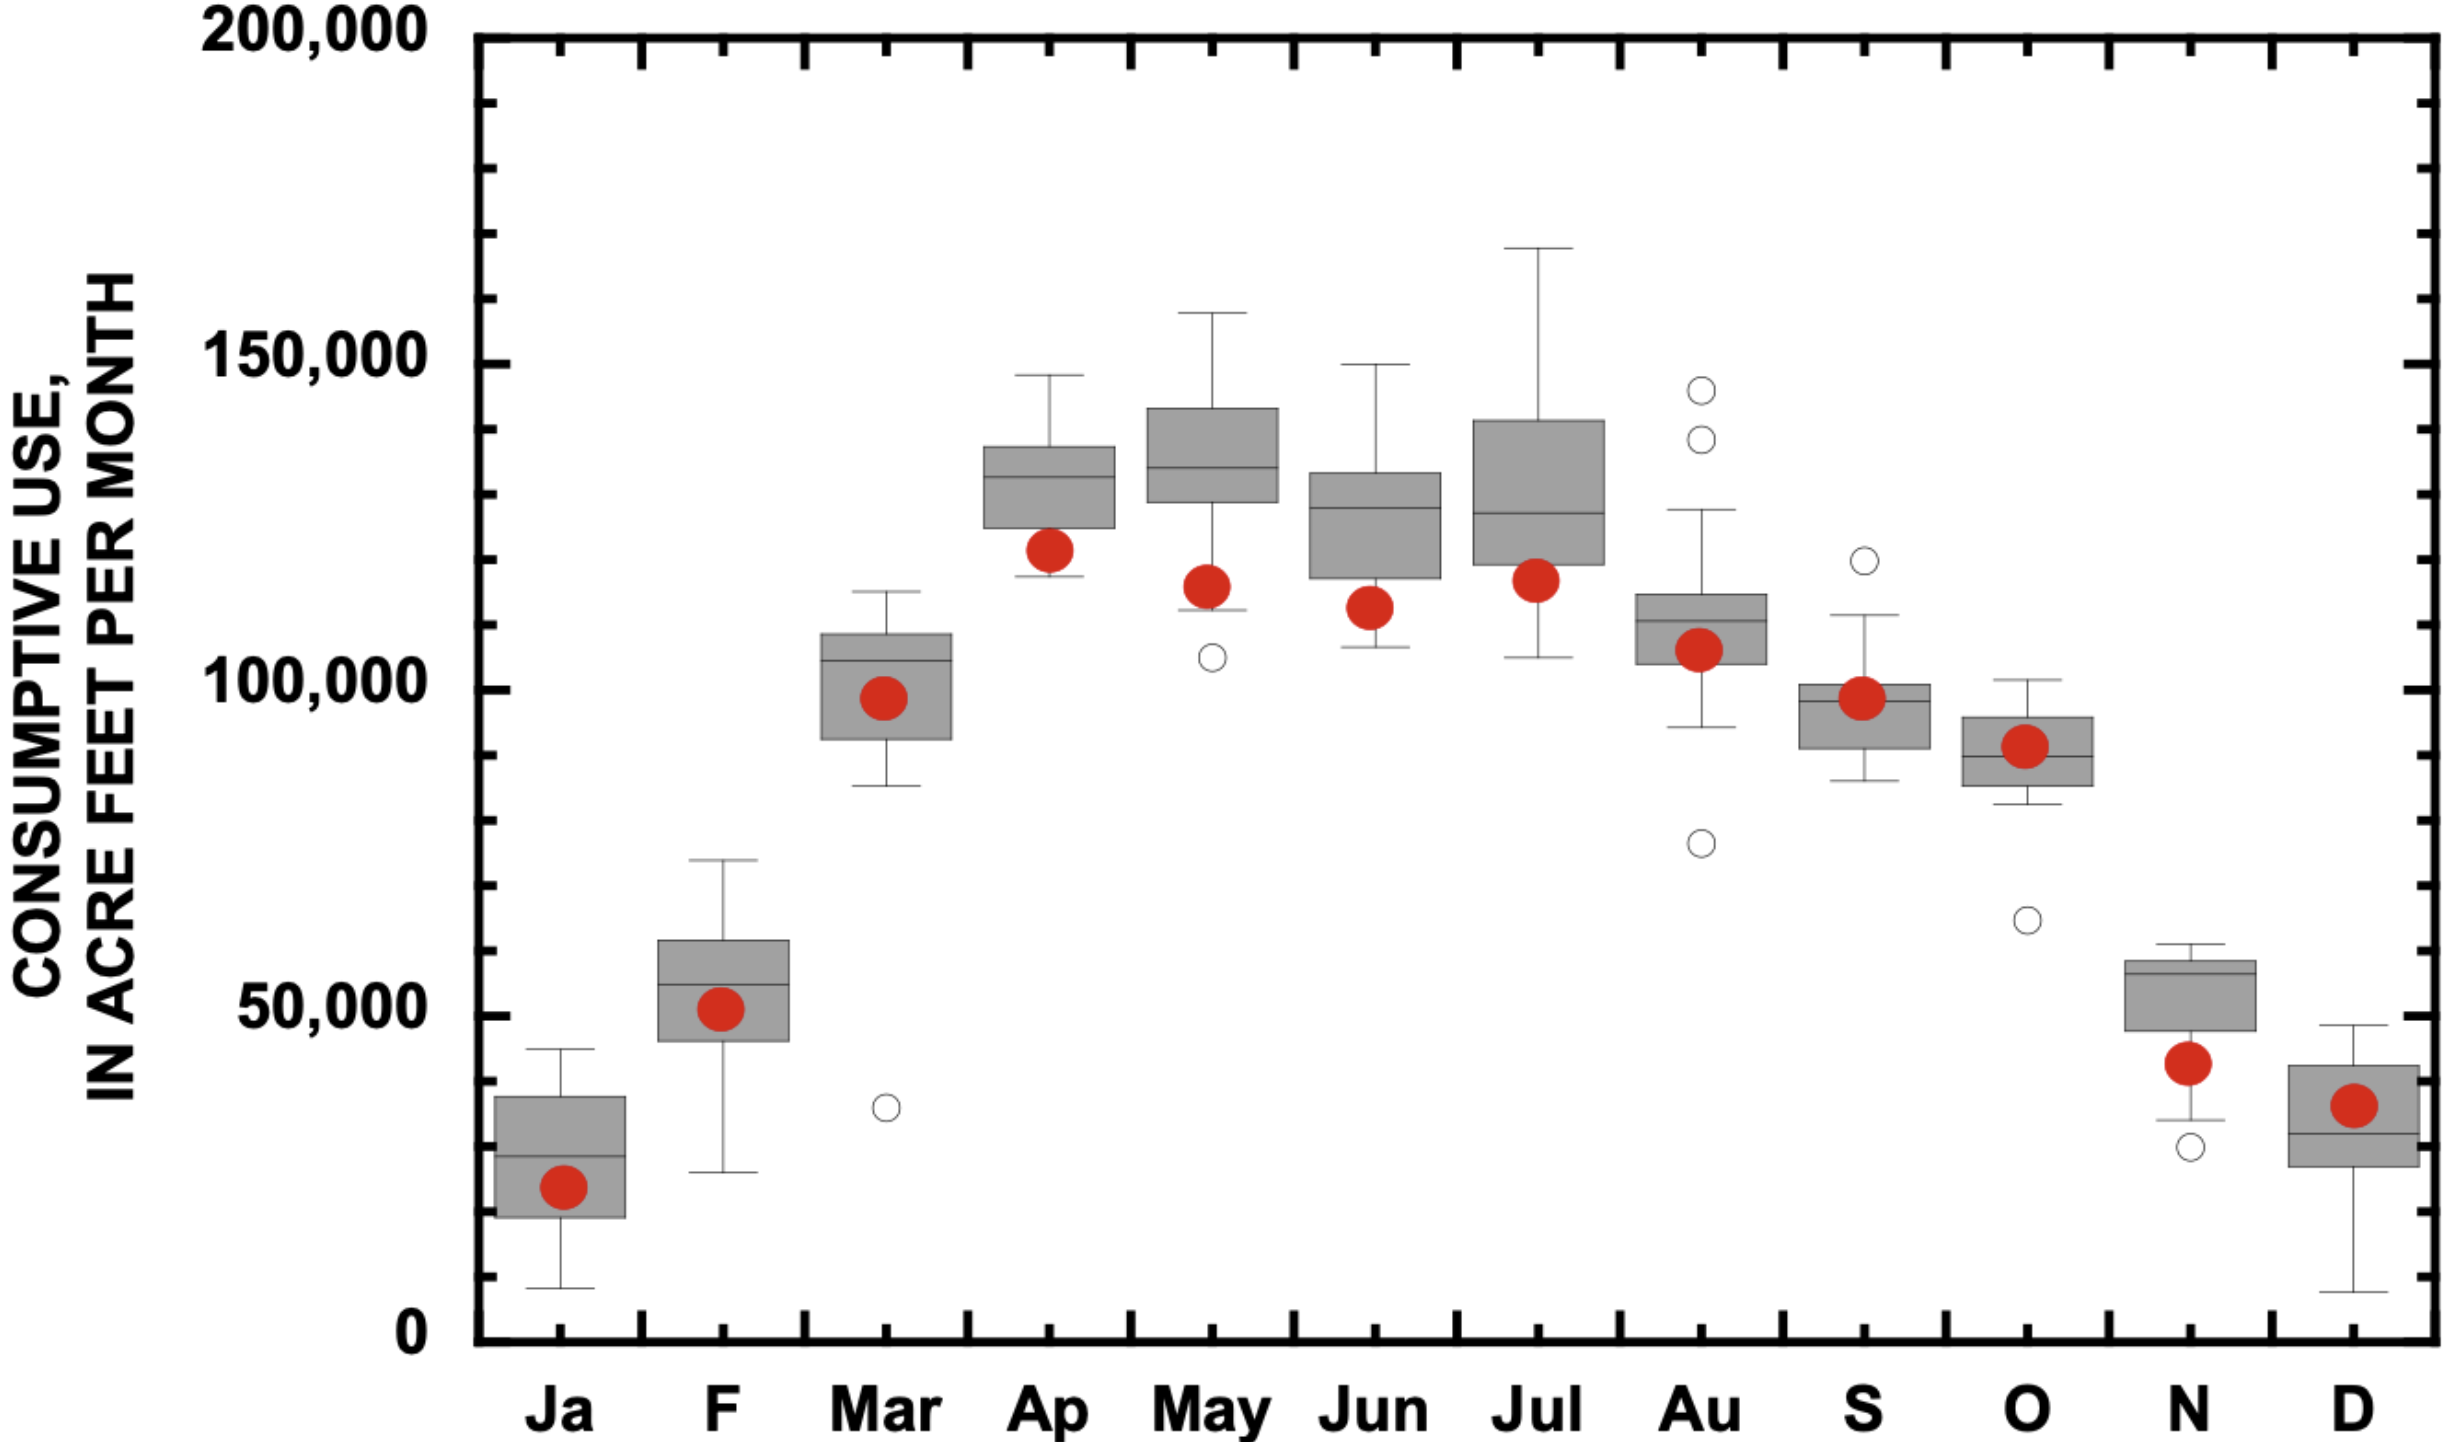
Water use by IID is typically lowest between November and February when garden crops are grown (Fig. 6). Water use increases greatly in March and remains high through October when field crops are the primary focus of production (see Appendix).
Figure 6. Box-and-whisker plots of total monthly consumptive use by the IID between 2010 and 2026. Each box is the Inter Quartile Range, defined by the 25th and 75th percentile of the years of data for that month. These boxes represent the typical monthly use pattern since 2010. Red dots are the average use in each month between 2024 and 2026. See text for additional explanation of a box-and-whisker plot.
Reductions in consumption during the past few years have been accomplished primarily by reduced water use between June and September when alfalfa and grass hay are the primary crops. These reductions are reflected in Figure 5 where red dots are the average monthly water use since 2024. Red dots plot below the grey boxes of the IQR in June, July, August, and September, demonstrating that recent water use in these months has been significantly less than typical since 2010. In contrast, recent water use between December and May has been within or slightly less than the IQR.
Agricultural use of mainstem Colorado River water in Arizona
We estimated agricultural use of mainstem Colorado River water in Arizona by subtracting the total diverted by the CAP from the total use in Arizona. This remainder includes all the agricultural uses along the Colorado River as well as a small amount used by the City of Yuma, other towns along the river, and military bases.²³
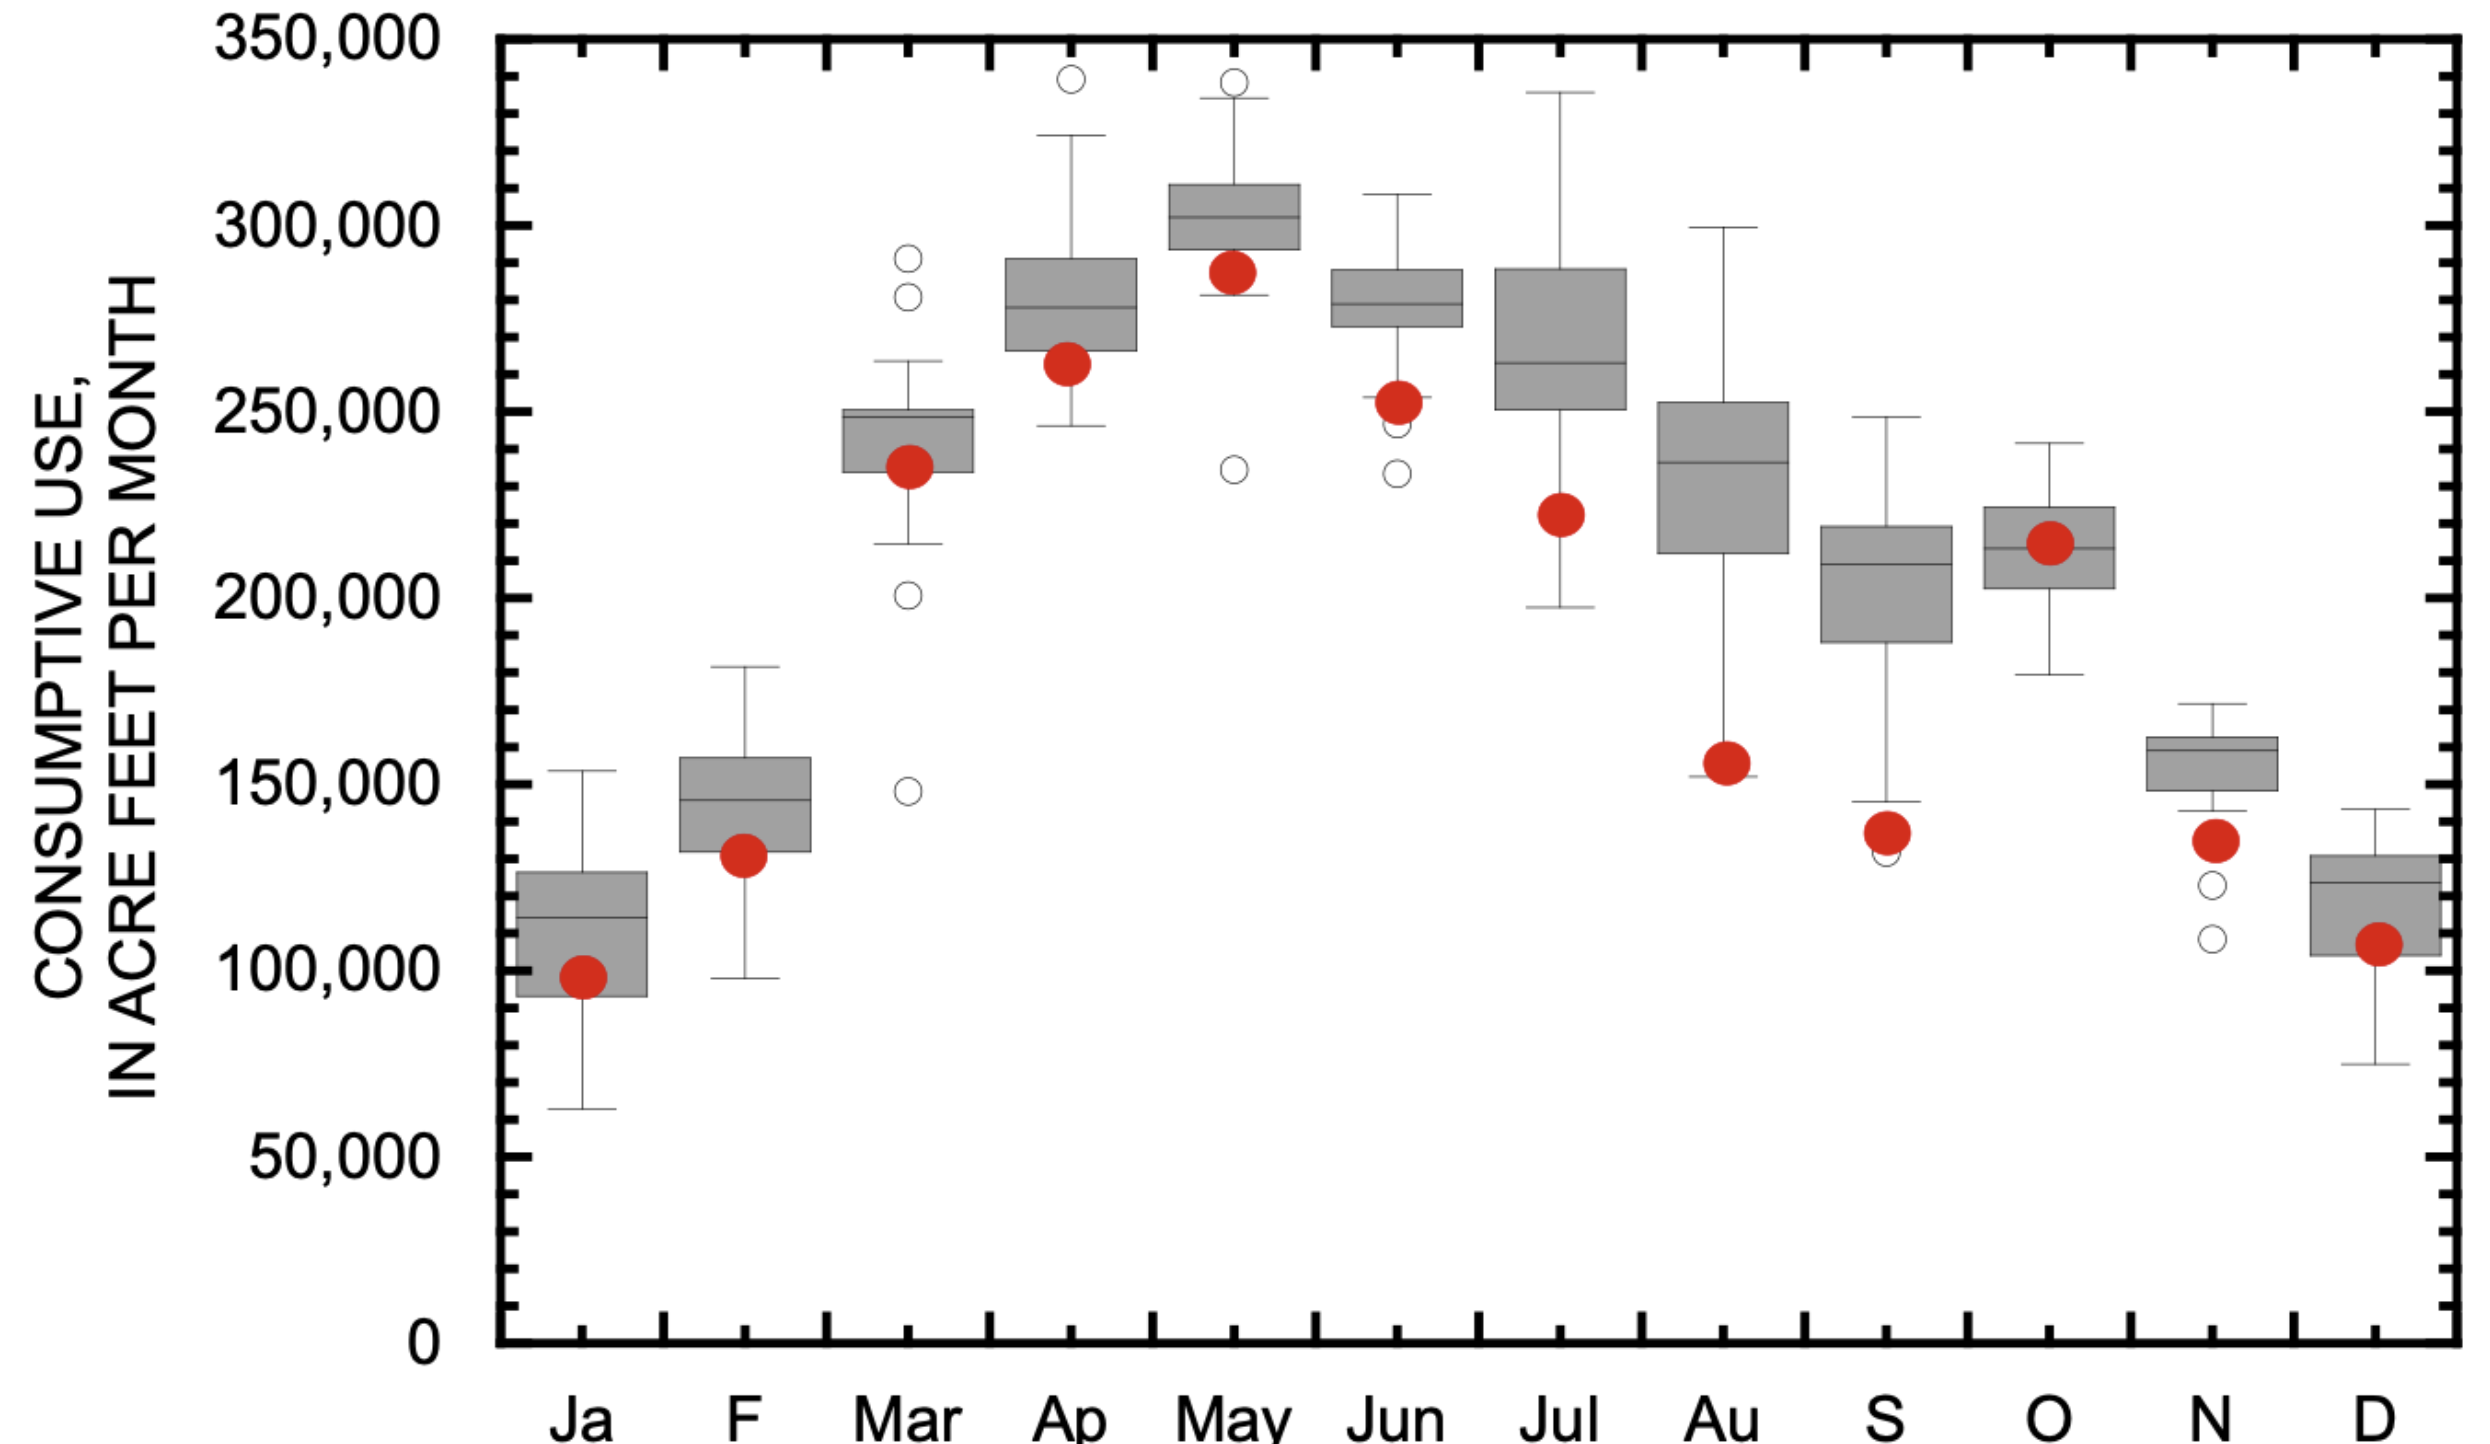
The monthly pattern of water use is similar to the monthly pattern by the IID. The smallest uses are between November and February (Fig. 7). Consumptive use increases in March and is highest between April and August.
Reductions in water use by these Arizona growers have been more modest than by IID. Recent average use has been somewhat less than the typical range between April and July and has been within the typical range in other months, except for November when there was significant precipitation near Yuma in 2025.
Figure 7. Box-and-whisker plots of total monthly consumptive use in Arizona by users of mainstem Colorado River not served by the CAP between 2010 and 2026. Each box is the Inter Quartile Range, defined by the 25th and 75th percentile of the years of data for that month. These boxes represent the typical monthly use pattern since 2010. Red dots are the average use in each month between 2024 and 2026. See text for additional explanation of a box-and-whisker plot.
Management and Policy Implications
Consumptive water use of mainstem water in the Lower Basin has been less than 7.5 maf/yr in every year but one since 2010. Since 2023 including forecast use in 2026, this reduction ranged between 1.4 and 1.7 maf/yr. The Lower Basin states have reduced water use comparable to the initial targets for Lower Basin shortages described in the recently released ROD24 and Operating Guidelines for 2027 and 2028.25 Thus, the good news is that the initial shortage goals of the FEIS have been achieved in recent years.
These savings have been achieved by large reductions in use by the CAP (Fig. 3) and by reduced agricultural water use in summer by IID (Fig. 6) and non-CAP water users in Arizona (Fig. 7). These reductions in agricultural water use have not resulted in changes of the amount of water consumed in winter when garden crops are grown.
The ROD allows for potentially large Lower Basin shortages of up to 3 maf/yr and potentially more in the event that Basin runoff continues to be low and reservoir live storage drops to critical levels. We placed these potential shortages in perspective by summing the smallest monthly use in each Lower Basin state since 2010 even though these months of smallest use did not occur in the same year. In some cases, the smallest water use was not due to significant water conservation but to unusually rainy conditions when demand for supplemental irrigation water was low, such as in November 2025. In other words, there is no historical experience with implementing the annual sum of these smallest monthly uses, because the smallest monthly uses did not occur in the same year.
Nevertheless, summing the lowest monthly use in each state provides perspective to the magnitude of the proposed 3 maf/yr shortages. The summed value of smallest monthly uses yields a potential minimum annual Lower Basin use of 5.03 maf/yr for the three Lower Basin states (Table 2). Although many of the months of smallest use occurred between 2022 and 2026, some were unique months of very low use in the 2010s. There is no historical analogy for imposition of the largest Lower Basin shortages envisioned by the recently released ROD and 2027-28 Operating Guidelines. [ed. emphasis mine]
Table 2. Smallest monthly consumptive use in each Lower Basin state since 2010.
CONCLUSION
The analyses summarized in this paper demonstrate that agricultural water use that supports winter garden crop production has not changed despite recent reductions in annual water use by IID or by non-CAP water users in Arizona. To date, water use by IID and by non-CAP water users in Arizona has been reduced in summer when garden crops are not grown. In times of acute water shortage, it is likely that continued and additional water savings can be achieved by reductions in irrigation of field crops in summer, without causing shortages to garden crop irrigation in the winter.
It is notable, however, that summing the lowest monthly water use in each state since 2010 results in a theoretical reduction from the Lower Basin allocation of 7.5 maf/yr of approximately 2.5 maf/yr, less than the maximum potential Lower Basin shortage envisioned in the recently released ROD. Our calculation of a theoretical shortage is based on summing the smallest use in each month between 2010 and 2026, and these months are not all in the same year. In some cases, the lowest use resulted from unusually large precipitation that reduced irrigation demand, rather than explicit conservation efforts.
The Priority Shortage Allocation Model utilized in the FEIS distributes shortages among the Lower Basin states in a much different manner than the way shortages have been achieved in the past.26 Tabulating the historical minimum monthly uses demonstrates that achieving the 3 maf/yr reductions described in the FEIS and ROD would be very difficult and is without historical precedent. Implementation of such large shortages would likely require new management policies, including compensated fallowing, permanent retirement of irrigated acreage and corresponding water rights, and unprecedented investment in increased irrigation efficiency.
We recognize that our theoretical comparison of minimum monthly uses since 2010 in no way captures the economic dislocation and secondary impacts that might result from implementing such shortages now. A full economic analysis of the impacts of the largest potential Lower Basin reductions described in the FEIS and the ROD is critical for understanding the consequences of significant reductions in water use in the Lower Basin. That type of analysis is beyond our expertise. Nevertheless, we recognize the importance of such an analysis, and we recognize the real-world distress that such large reductions of use might cause.
1 Center for Colorado River Studies, Utah State University, former Chief, Grand Canyon Monitoring and Research Center.
2 Getches-Wilkinson Center, Univ. of Colorado Law School, former US Commissioner, Upper Colorado River Commission, former Assistant Secretary for Water and Science, US Dept. of the Interior.
3 Retired General Manager, Colorado River Water Conservation District.
4 Kyl Center for Water Policy, Arizona State University, former Director, Phoenix Water Services.
5 Staff Attorney, Utton Transboundary Resources Center, University of New Mexico.
7 All annual data in this paper are calendar year. 2024 is the most recent year that consumptive uses and losses data are available for the entire Basin.
8 Richter et al., 2024, New water accounting reveals why the Colorado River no longer reaches the sea. Communications Earth & Environment 5:134. available at https://www.nature.com/articles/s43247-024-01291
⁹ Upper Basin state uses in Table 1 do not include state reservoir evaporation. Total major and minor state reservoir evaporation is listed separately in Table 1. Colorado River Storage Project (CRSP) reservoir evaporation is evaporation from Blue Mesa, Morrow Point, Flaming Gorge, and Lake Powell reservoirs. Source of Upper Basin data: J. Prairie, Upper Colorado Basin Research and Modeling Group Chief, Bureau of Reclamation. Source of Lower Basin state uses: Reclamation. 2025. Water use report: Arizona, California, Nevada, calendar year 2024. Source of mainstem reservoir evaporation (Mead, Mohave, Havasu) data: S. Tighi, Hydrologist, Reclamation, Lower Colorado Region. Evaporation at Senator Wash and diversion dams estimated at 28,000 af.
10 Department of the Interior, August 2026, Operating Guidelines: Colorado River Guidelines for Coordinated Operations of Lake Powell and Lake Mead, Operating Years 2027 and 2028 (2027-28 Operating Guidelines), available at https://www.usbr.gov/ColoradoRiverBasin/post2026/decision-doc/2027-2028OperatingGuidelines_Final.pdf. We note that these Operating Guidelines provide for 1.25 maf/yr of shortage, allocated among the Lower Basin states as previously proposed: 760,000 af/yr in Arizona, 440,000 af/yr in California, and 50,000 af/yr in Nevada, The distribution of shortages greater than 1.25 maf/yr is not specified but would presumably be subject to consultation. See 2027-28 Operating Guidelines at 5.3.A. The ROD allows for the development of different methods of shortage allocation. See ROD at 5.
¹² Lower Colorado River Water Accounting – Actual Water Use and Official Water Use Forecast, both available at https://www.usbr.gov/lc/region/g4000/wtracct.html. Throughout this paper, we refer to the forecast for 2026 that was made on September 1, 2026. The forecast is frequently revised.
¹³ There is no significant water use in the Grand Canyon.
14 Average Lower Basin consumptive use between 2010 and 2025 was 6.880 maf/yr.
16 Average use between 2010 and 2022 was 4.326 maf/yr. Average use between 2023 and (forecasted) 2026 will be 3.764 maf/yr.
17 Average use between 2010 and 2022 was 2.600 maf/yr. Average use between 2023 and (forecasted) 2026 will be 2.290 maf/yr.
18 Average use between 2010 and 2022 was 925,000 af/yr. Average use between 2023 and (forecasted) 2026 will be 804,000 af/yr.
19 Average use between 2010 and 2022 was 2.590 maf/yr. Average use between 2023 and (forecasted) 2026 will be 1.930 maf/yr.
20 IID used 2.187 maf in 2025, 2.312 maf in 2024, and is forecast to use 2.242 maf in 2026. Median use between 2010 and 2026 was 2.546 and use in 50% of the years of that period was between 2.481 and 2.558 maf/yr.
22 Total net area of crops in 2025 was approximately 350,000 acres.
23 Forecast use in 2026 for Bullhead City, Lake Havasu City, Parker, Yuma, U.S. Army Yuma Proving Grounds, and the U.S. Marine Corps Air Station Yuma is 35,000 af.
25 Department of the Interior, August 2026, Operating Guidelines: Colorado River Guidelines for Coordinated Operations of Lake Powell and Lake Mead, Operating Years 2027 and 2028 (2027-28 Operating Guidelines), available at https://www.usbr.gov/ColoradoRiverBasin/post2026/decision-doc/2027-2028OperatingGuidelines_Final.pdf. We note that these Operating Guidelines provide for 1.25 maf of shortage in each year, allocated among the Lower Basin states as previously proposed: 760,000 af in Arizona, 440,000 af in California, and 50,000 af in Nevada. The distribution of shortage greater than 1.25 maf/yr is not specified but would presumably be the subject of consultation. See 2027-28 Operating Guidelines at 5.3.A. The ROD allows for the development of different methods of shortage allocation. See ROD at 5.
26 See FEIS Appendix C, Shortage Allocation Model and Alternative Distribution Model Documentation, at C.4.2. However, the ROD specifies that other methods of shortage allocation may be developed. ROD at 5.
Colorado River “Beginnings”. Photo: Brent Gardner-Smith/Aspen Journalism