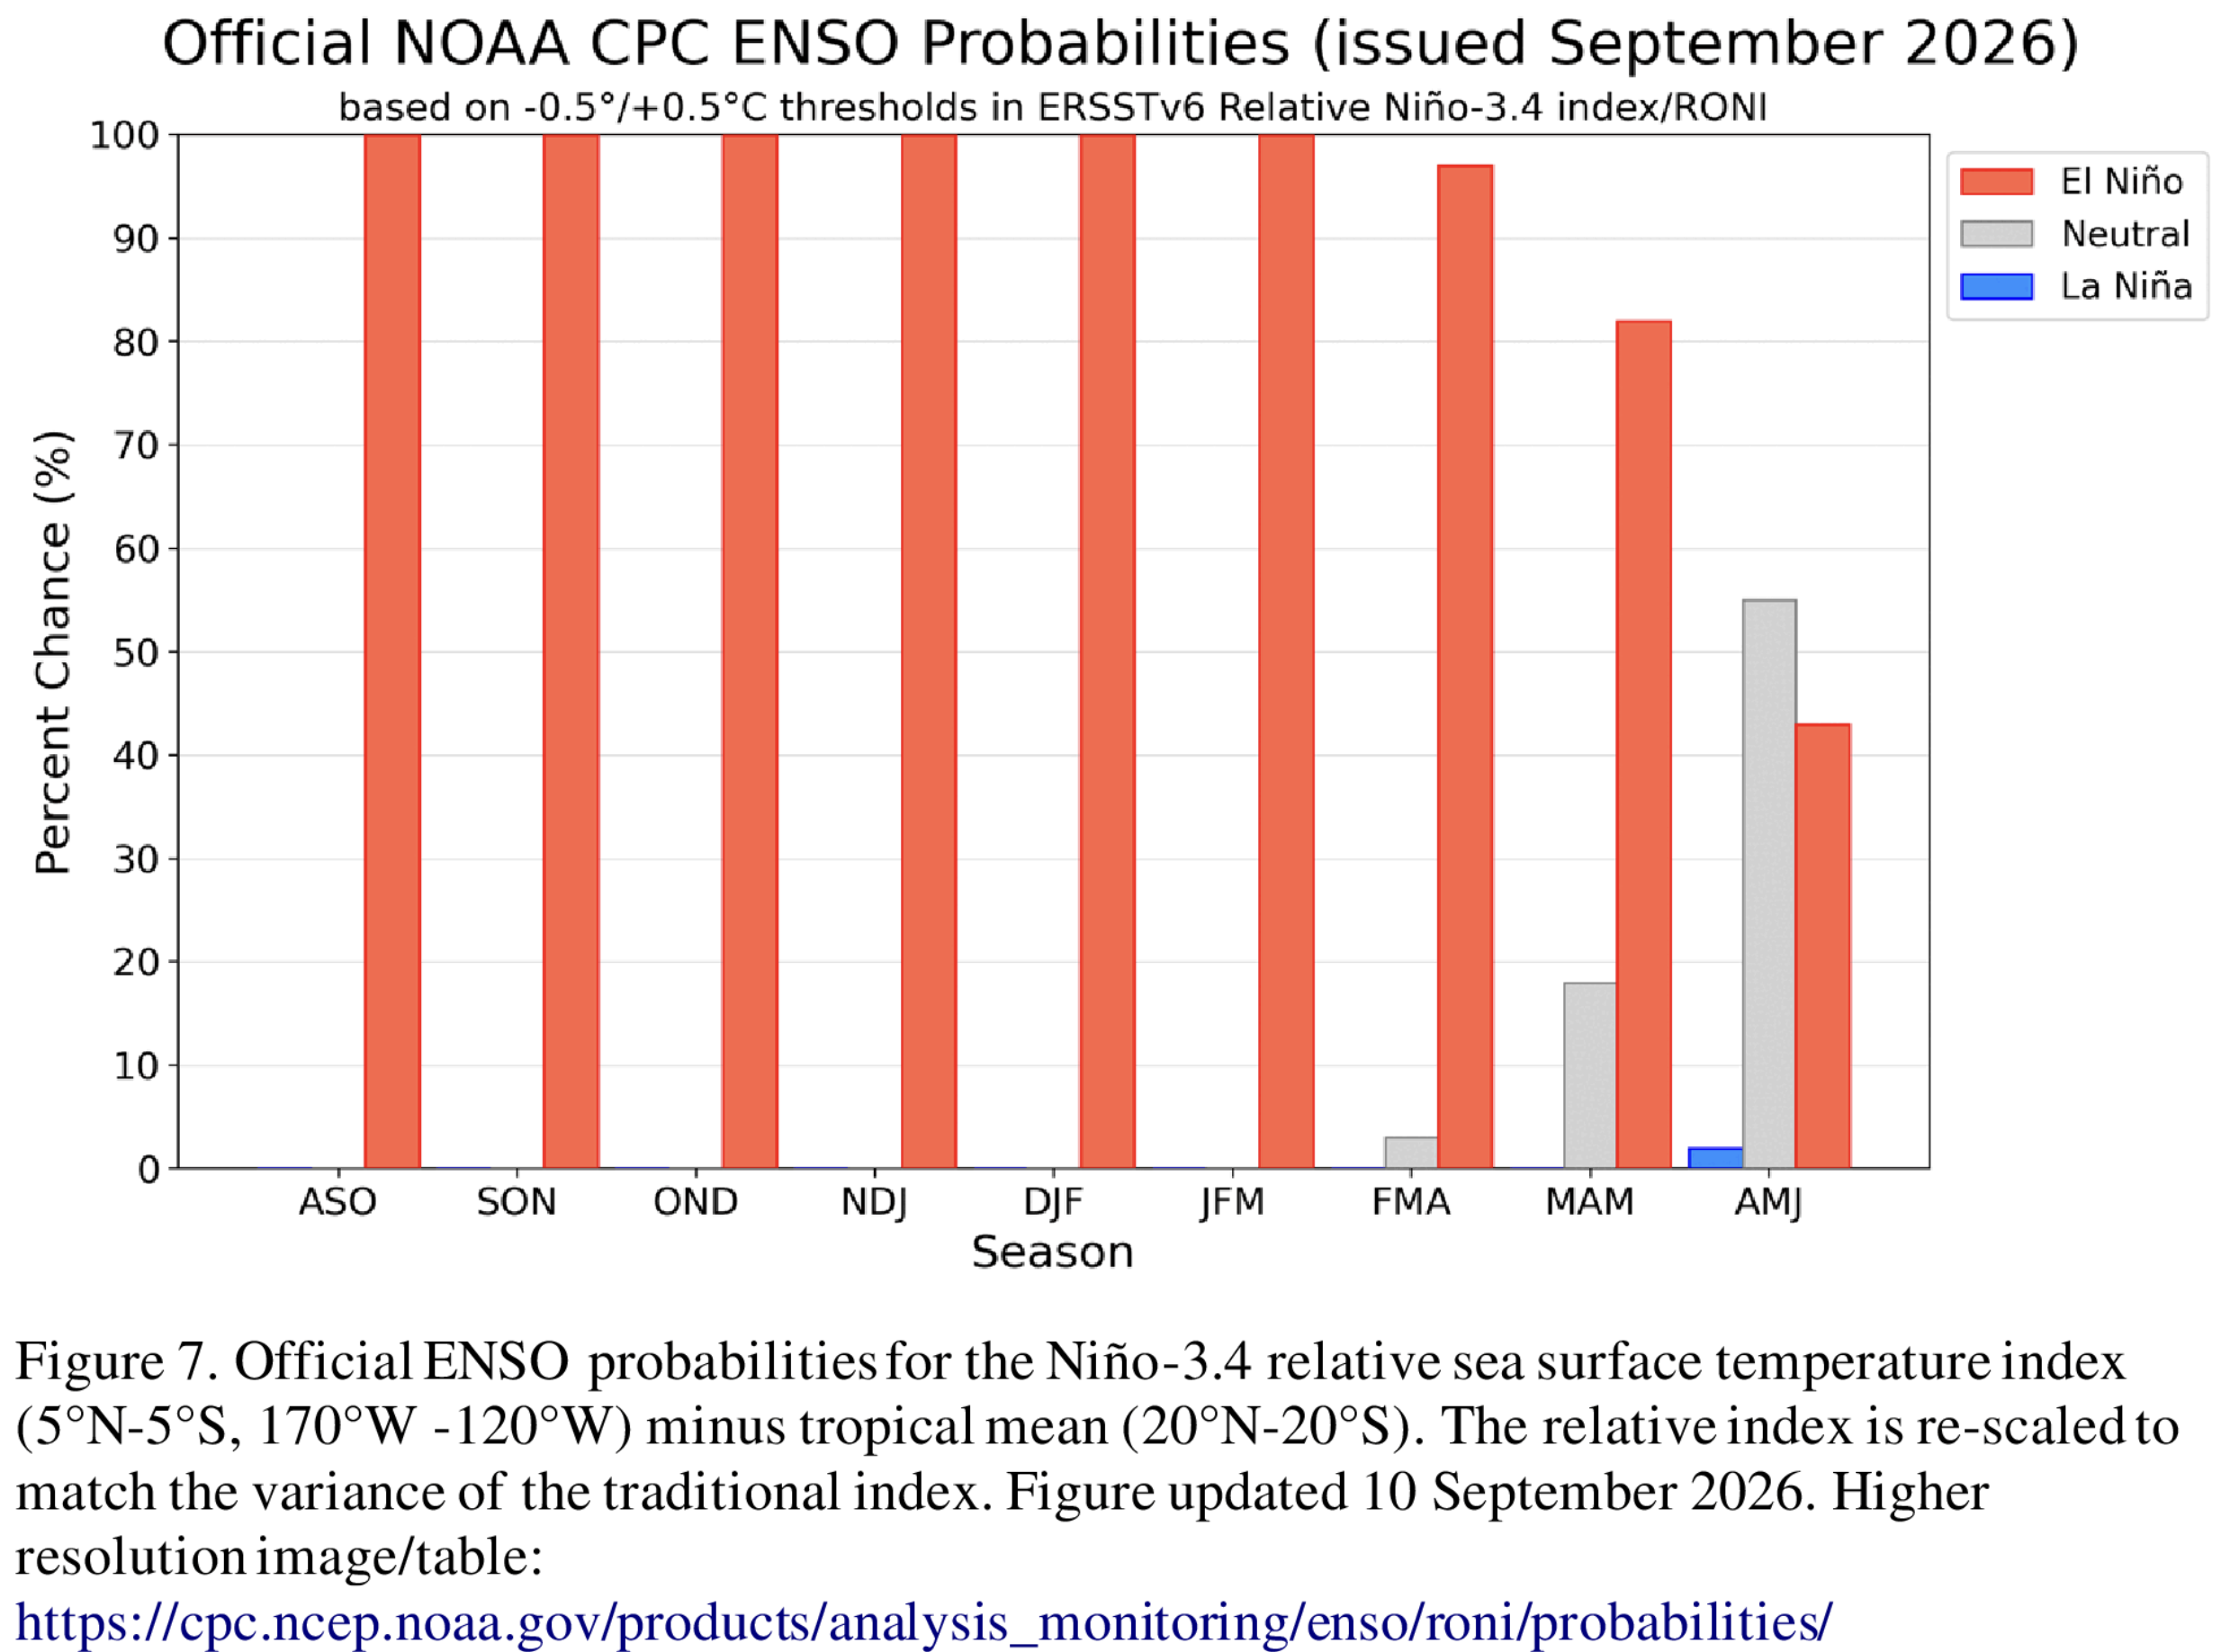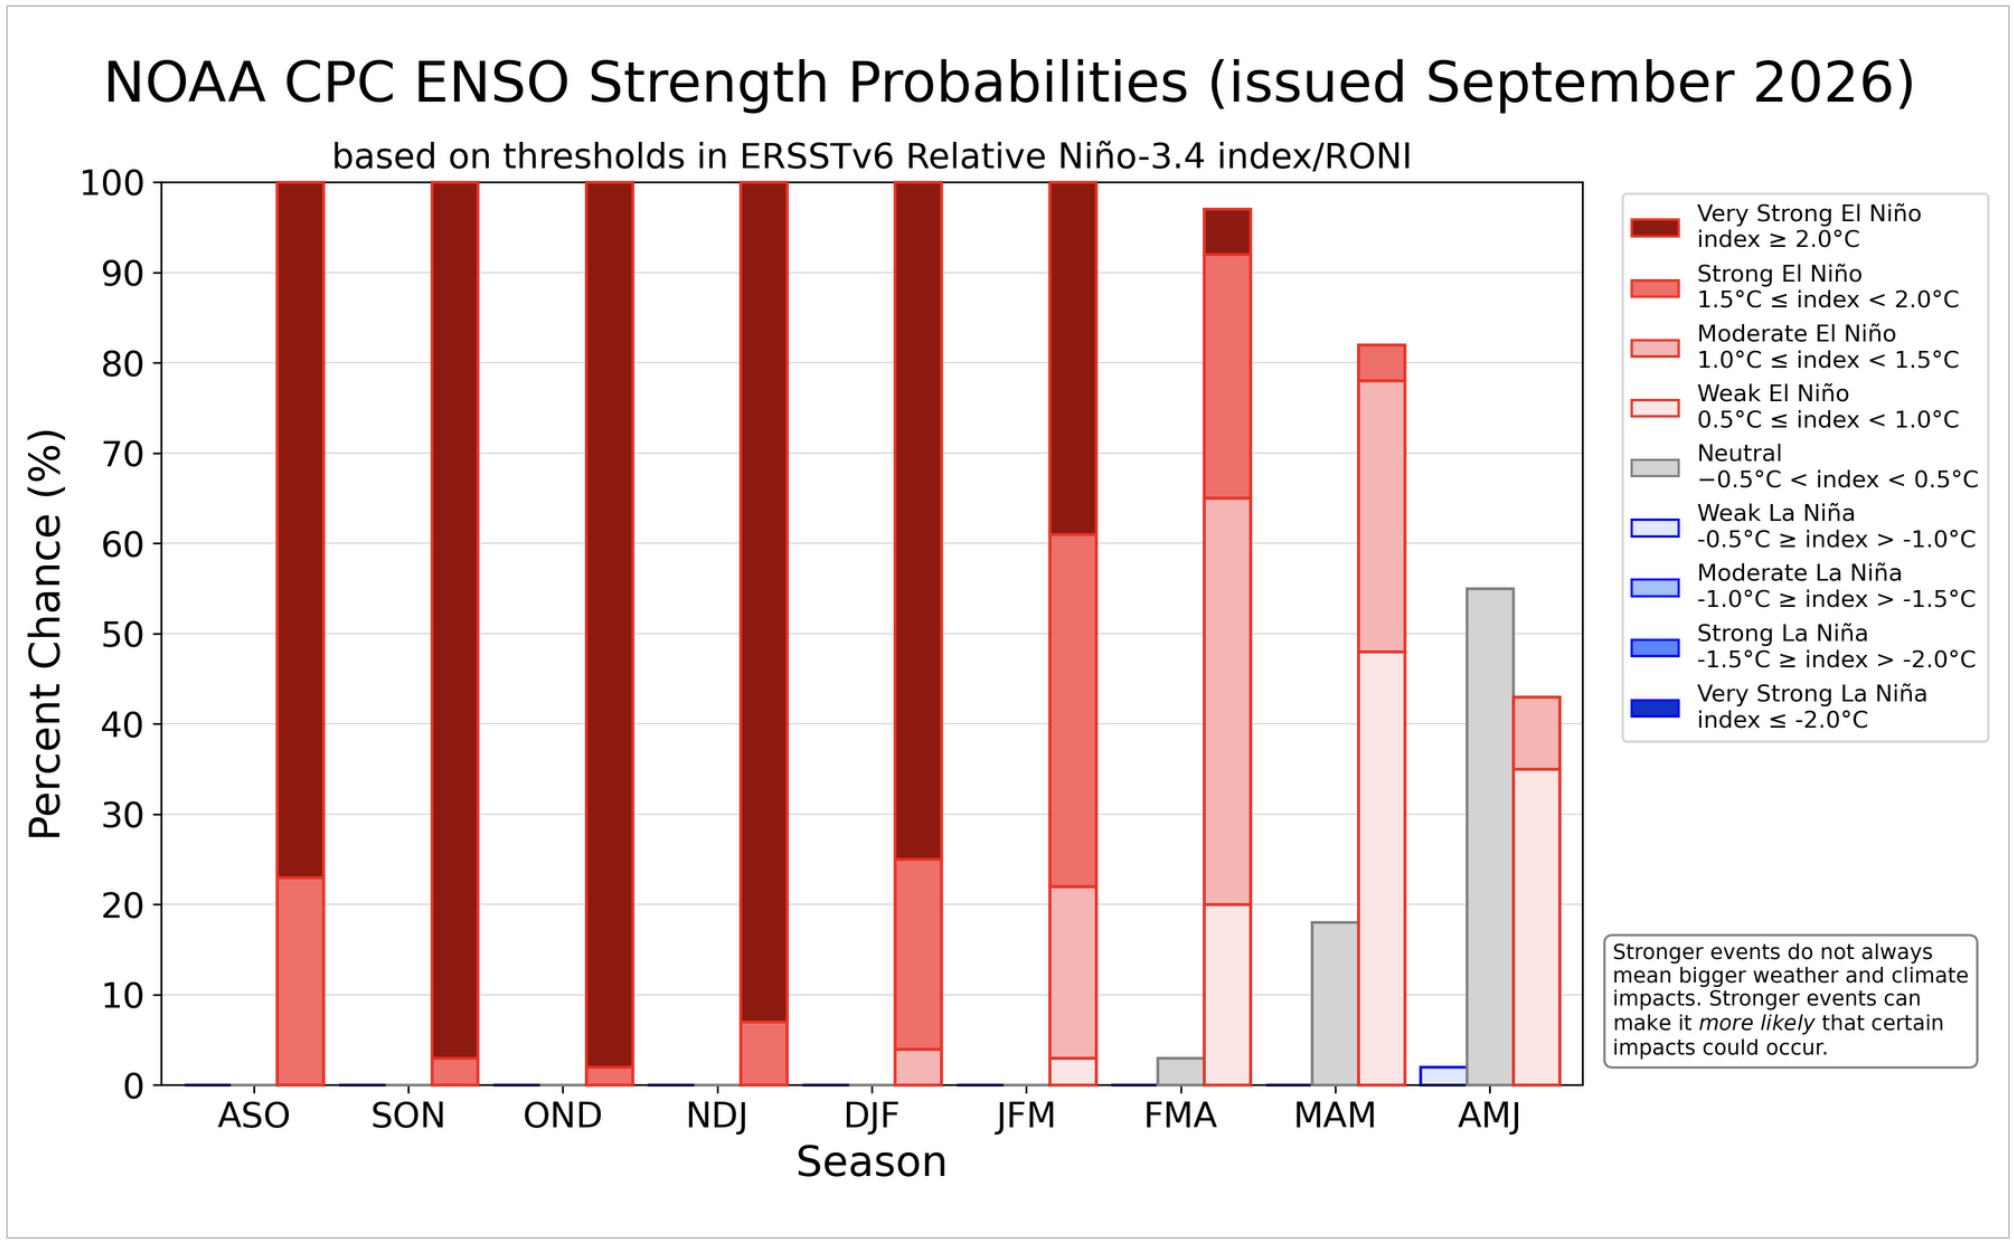

Synopsis: El Niño is strengthening, with a greater than 90% chance of a very strong event during the Northern Hemisphere fall and winter 2026-27.
El Niño strengthened further over the past month, with sea surface temperature anomalies exceeding +3.0°C in the eastern equatorial Pacific. Except for the Niño-4 index, which decreased to +0.1°C in August, values in the other Niño indices increased, reaching +1.8°C in Niño-3.4, +2.5°C in Niño-3, and +3.4°C in Niño-1+2. The equatorial subsurface temperature index (average from 180°-100°W) remained steady during August, reflecting a deeper-than-average thermocline. Subsurface temperatures continued to be significantly above average, with widespread anomalies in excess of +10.0°C at depth. Low-level westerly wind anomalies and upper-level easterly wind anomalies extended from the western to the east-central equatorial Pacific. Enhanced convection and rainfall persisted from the central to the eastern Pacific, while anomalies remained suppressed over Indonesia. The traditional and equatorial Southern Oscillation indices remained negative. Collectively, the coupled ocean-atmosphere system reflected a strengthening El Niño.
The CPC Official ENSO outlook, which synthesizes multiple models from North America and abroad, indicates El Niño will continue to strengthen through the end of the year. During the October-December 2026 season, there is a 75% chance of a historic event that would exceed the strength of previous El Niño events dating back to 1950 (+2.5°C or more for a 3-month RONI value). With an event of this magnitude, the chances of experiencing impacts consistent with El Niño are larger, though not guaranteed (see CPC outlooks for probabilities of seasonal anomalies). In summary, El Niño is strengthening, with a greater than 90% chance of a very strong event during the Northern Hemisphere fall and winter 2026-27.
Click the link to read the article on the NOAA website:
September 10, 2026
August Highlights:
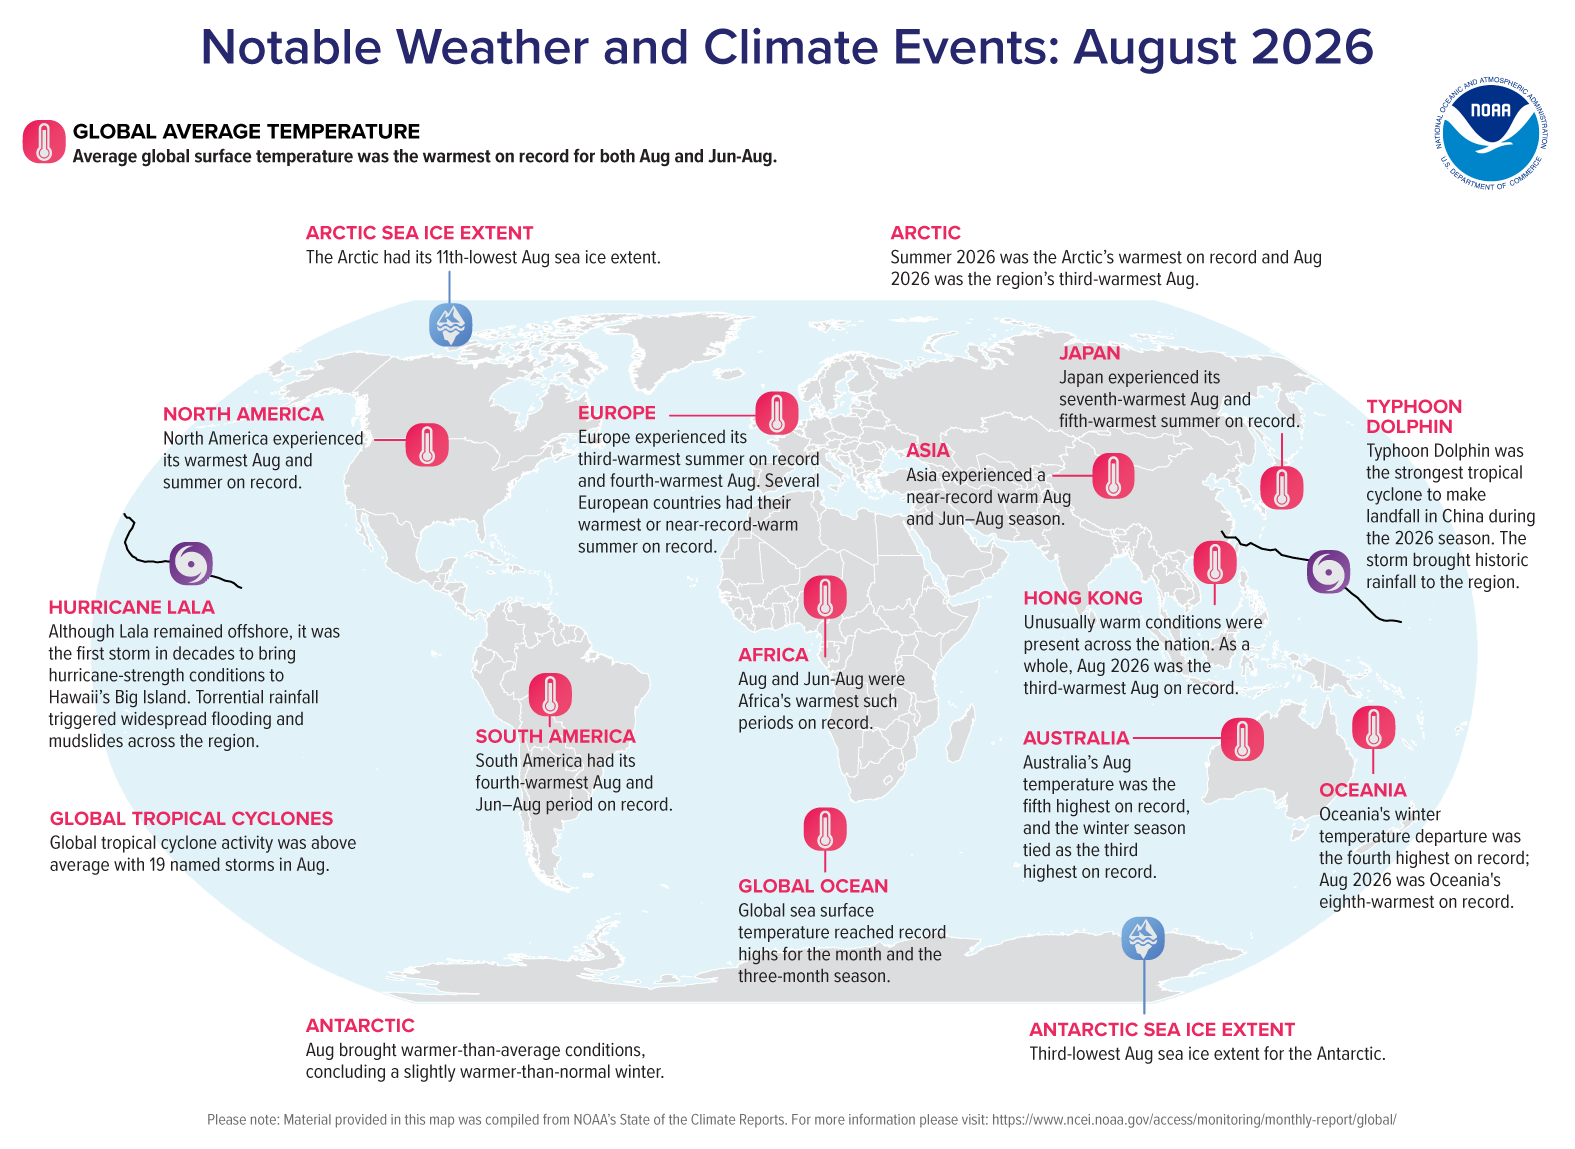
August was the warmest on record for the globe, eclipsing the previous tied records of 2023 and 2024 by 0.14°F (0.08°C). The June–August three-month season was also record-warm.
Global sea surface temperature reached an all-time high in August.
El Niño conditions persisted during the month, driving record-high temperatures across vast areas of the central and eastern tropical Pacific Ocean.
Global land surface temperature was near-record warm for August and June–August.
The Northern Hemisphere experienced its warmest summer, while the Southern Hemisphere had a near-record warm winter.
The Arctic and Antarctic had a below-average sea ice extent.
Global tropical cyclone activity was above average with 19 tropical storms.
Map of global notable weather and climate events in August 2026. Credit: NOAA
Temperature
The global surface temperature in August 2026 was 2.38°F (1.32°C) above the 20th-century average—the warmest August in the 1850–2026 record, eclipsing the previous tied records set in 2023 and 2024 by 0.14°F (0.08°C). It marked the 48th-consecutive August with global temperatures above the 20th-century average (the last below-average August occurred in 1978), and all 10 of the warmest Augusts on record have occurred since 2016. Global ocean temperatures set a new record high, while global land temperatures were near-record warm.
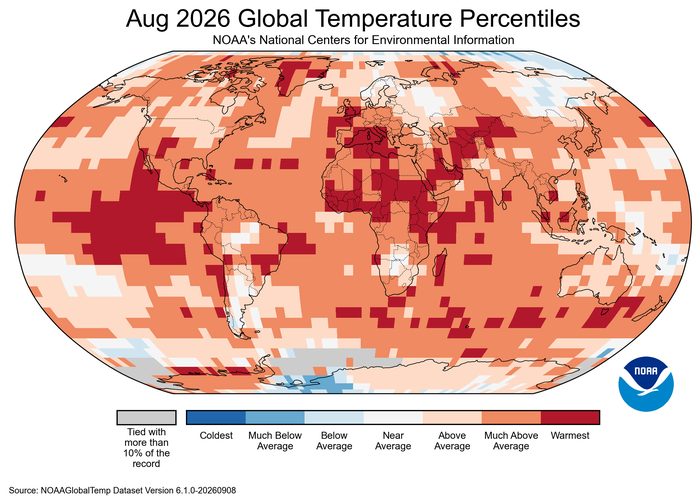
Global Temperature Percentiles for August 2026. Red and orange indicates warmer than average, blue indicates colder than average and gray indicates that it tied with more than 10% of the record. Credit: NOAA
During August 2026, above-average temperatures covered most global land and ocean surfaces. Notable temperature departures of at least +3.6°F (+2.0°C) spanned Europe, Africa, Asia, Antarctica, parts of North and South America, North Pacific Ocean, and a vast area of the central and eastern tropical Pacific Ocean (consistent with ongoing El Niño conditions). Record-high August temperatures were mainly present across Greenland, Africa, and parts of Europe, Asia, North and South America, the Atlantic, Indian, Southern and Canadian Arctic oceans as well as extensive areas of the central and eastern Pacific Ocean.
Below-average temperatures were limited to parts of the Arctic, eastern Russia and Antarctica. However, no land or ocean areas had record-cold August temperatures.
Regionally, most continents experienced a top-10 warmest August on record. North America and Africa both experienced their warmest August on record, while Asia experienced its second-warmest August. The Arctic recorded its third-warmest August, followed by South America and Europe each recording their fourth-warmest. Oceania had its eighth warmest, while Antarctica experienced an above-average August, its rank fell outside its top 10.
Seasonal
Globally, the average surface temperature from June–August 2026 was the highest (+2.18°F / +1.21°C) in NOAA’s 177-year record. The June–August period marks the meteorological summer for the Northern Hemisphere and winter for the Southern Hemisphere. During this three-month period, the Northern Hemisphere experienced its warmest meteorological summer, while the Southern Hemisphere experienced its second-warmest meteorological winter.
Year-to-date
Looking at the year-to-date, the January–August global surface temperature was second highest on record. According to NCEI’s Global Annual Temperature Outlook, it is very likely that 2026 will rank among the five warmest years on record, with the highest probabilities favoring the second-warmest year on record.
Sea Ice
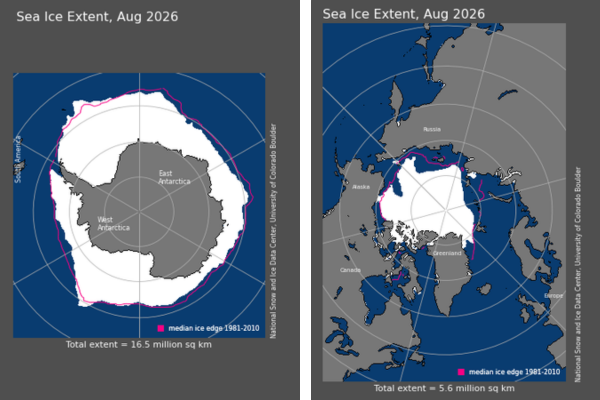
Global sea ice extent was the fourth smallest for August in the 48-year record, covering 8.50 million square miles, which is 870,000 square miles below the 1991–2020 average. The Arctic had its 11th-lowest August extent on record, falling 340,000 square miles below average. Meanwhile, the Antarctic sea extent was 530,000 square miles below average and the third-smallest August extent.
Map of the Antarctic (left) and the Arctic (right) sea ice extent in August 2026. Credit: NOAA
Tropical Cyclones
Global tropical cyclone activity was above average in August, producing 19 tropical storms. Of those, five reached hurricane or typhoon intensity, with four attaining major status (Category 3 or higher). Driven by ongoing El Niño conditions, activity varied by basin. The Atlantic was unusually quiet, producing two weak, short-lived tropical storms: Cristobal and Dolly. In contrast, warmer waters across the central and eastern tropical Pacific Ocean fueled the development of eight named storms across the Eastern North Pacific basin. Of note, Hurricane Lala passed near the Big Island of Hawaii as a Category 1 hurricane. Although Lala remained offshore, it was the first storm in decades to bring hurricane-strength conditions to Hawaii’s Big Island. Torrential rainfall triggered widespread flooding and mudslides across the region.
The West Pacific basin also had an above-average month with nine storms. Notably, Super Typhoon Dolphin brought heavy rain and strong winds to parts of southern Japan and China. The storm brought historic rainfall to parts of China.
No storms formed in the North Indian Ocean nor in the Southern Hemisphere basins, which is typical during this time of year.
Black Canyon of the Gunnison. Photo credit: NPS/Kris Toy
From email from Reclamation (Andrew Limbach):
On Monday, September 14th at 8:00 AM (MDT), the UVWUA will begin ramping down tunnel diversions to 675-700 cfs. In coordination with that effort, Crystal releases will decrease to 875-900 cfs from 1240 cfs, and flows through the Black Canyon will be between 200-225 cfs. Tunnel diversions are anticipated to be at 700 cfs through October 31.
The Crystal outlet works typically experiences increased levels of cavitation between 900 and 1200 cfs. Therefore, Crystal releases may need to be adjusted as needed to find an optimal operating zone. Recreators and boaters in the Black Canyon should expect fluctuations of river flows until the final releases and diversions are set. Another notification will be sent out once the releases are finalized.