
Click the link to read the article on The Land Desk website (Jonathan P. Thompson):
September 25, 2026
⛏️ MINING MONITOR ⛏️
The mining claim game continues to heat up in the areas Trump illegally slashed from Bears Ears National Monument, and the top player is, once again, Kimmerle Mining of Moab. Since the Land Desk last wrote about this mini-land rush, Kimmerle has filed seven additional claims areas that had been within the national monument, and therefore off limits to new mining claims.
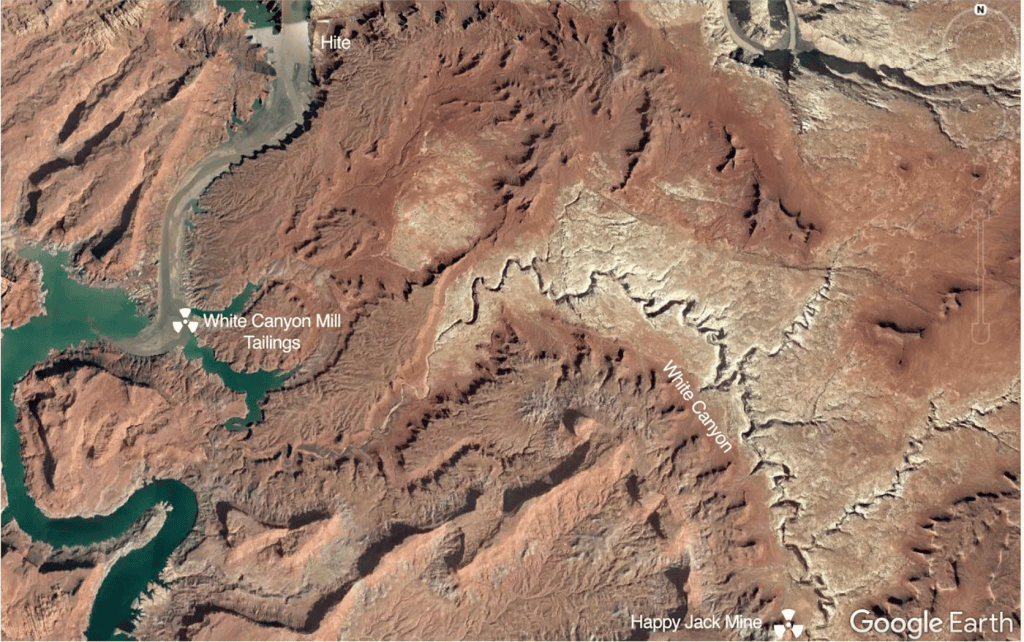
The latest claims are in the White Canyon area. During the post-War uranium frenzy, the federal government, county crews, prospectors, and mining companies webbed this area with roads, poked it full of prospect holes and mine adits, and contaminated waters with radioactive materials. Part of that legacy includes a 26,000-ton pile of uranium tailings entombed within the
waterssilt of Lake Powell.It’s important to keep in mind that the presence of active mining claims does not necessarily mean anyone is going to mine or even explore these pieces of land. And while the claims may be active, which simply means the claimant is up to date on their $200/year location and maintenance fee, they may not be valid. That requires, at least theoretically, proof that the claim contains valuable minerals.
But it does appear as if Kimmerle is targeting viable mining areas, which indicate that the firm either intends to mine the claims, or consolidate enough of them to sell them to a larger company. The newly revealed claims are located in two clusters on either side of Natural Bridges National Monument.
The notices of location have been declared with the San Juan County Recorder, but have not yet shown up on the Bureau of Land Management database. Just before publishing this, I checked the San Juan County records search and found that an entity called Land Survey Advisers — which typically stakes claims for other firms or individuals — filed location notices on more than three dozen claims in San Juan County. At least some of those claims appear to be within the pre-shrinkage BENM boundaries, but the location description on many of them included sections that don’t exist (43, 47) in the public land survey system, and the document download function isn’t working for me, so I have yet to confirm any of this. Still, it’s potentially alarming.
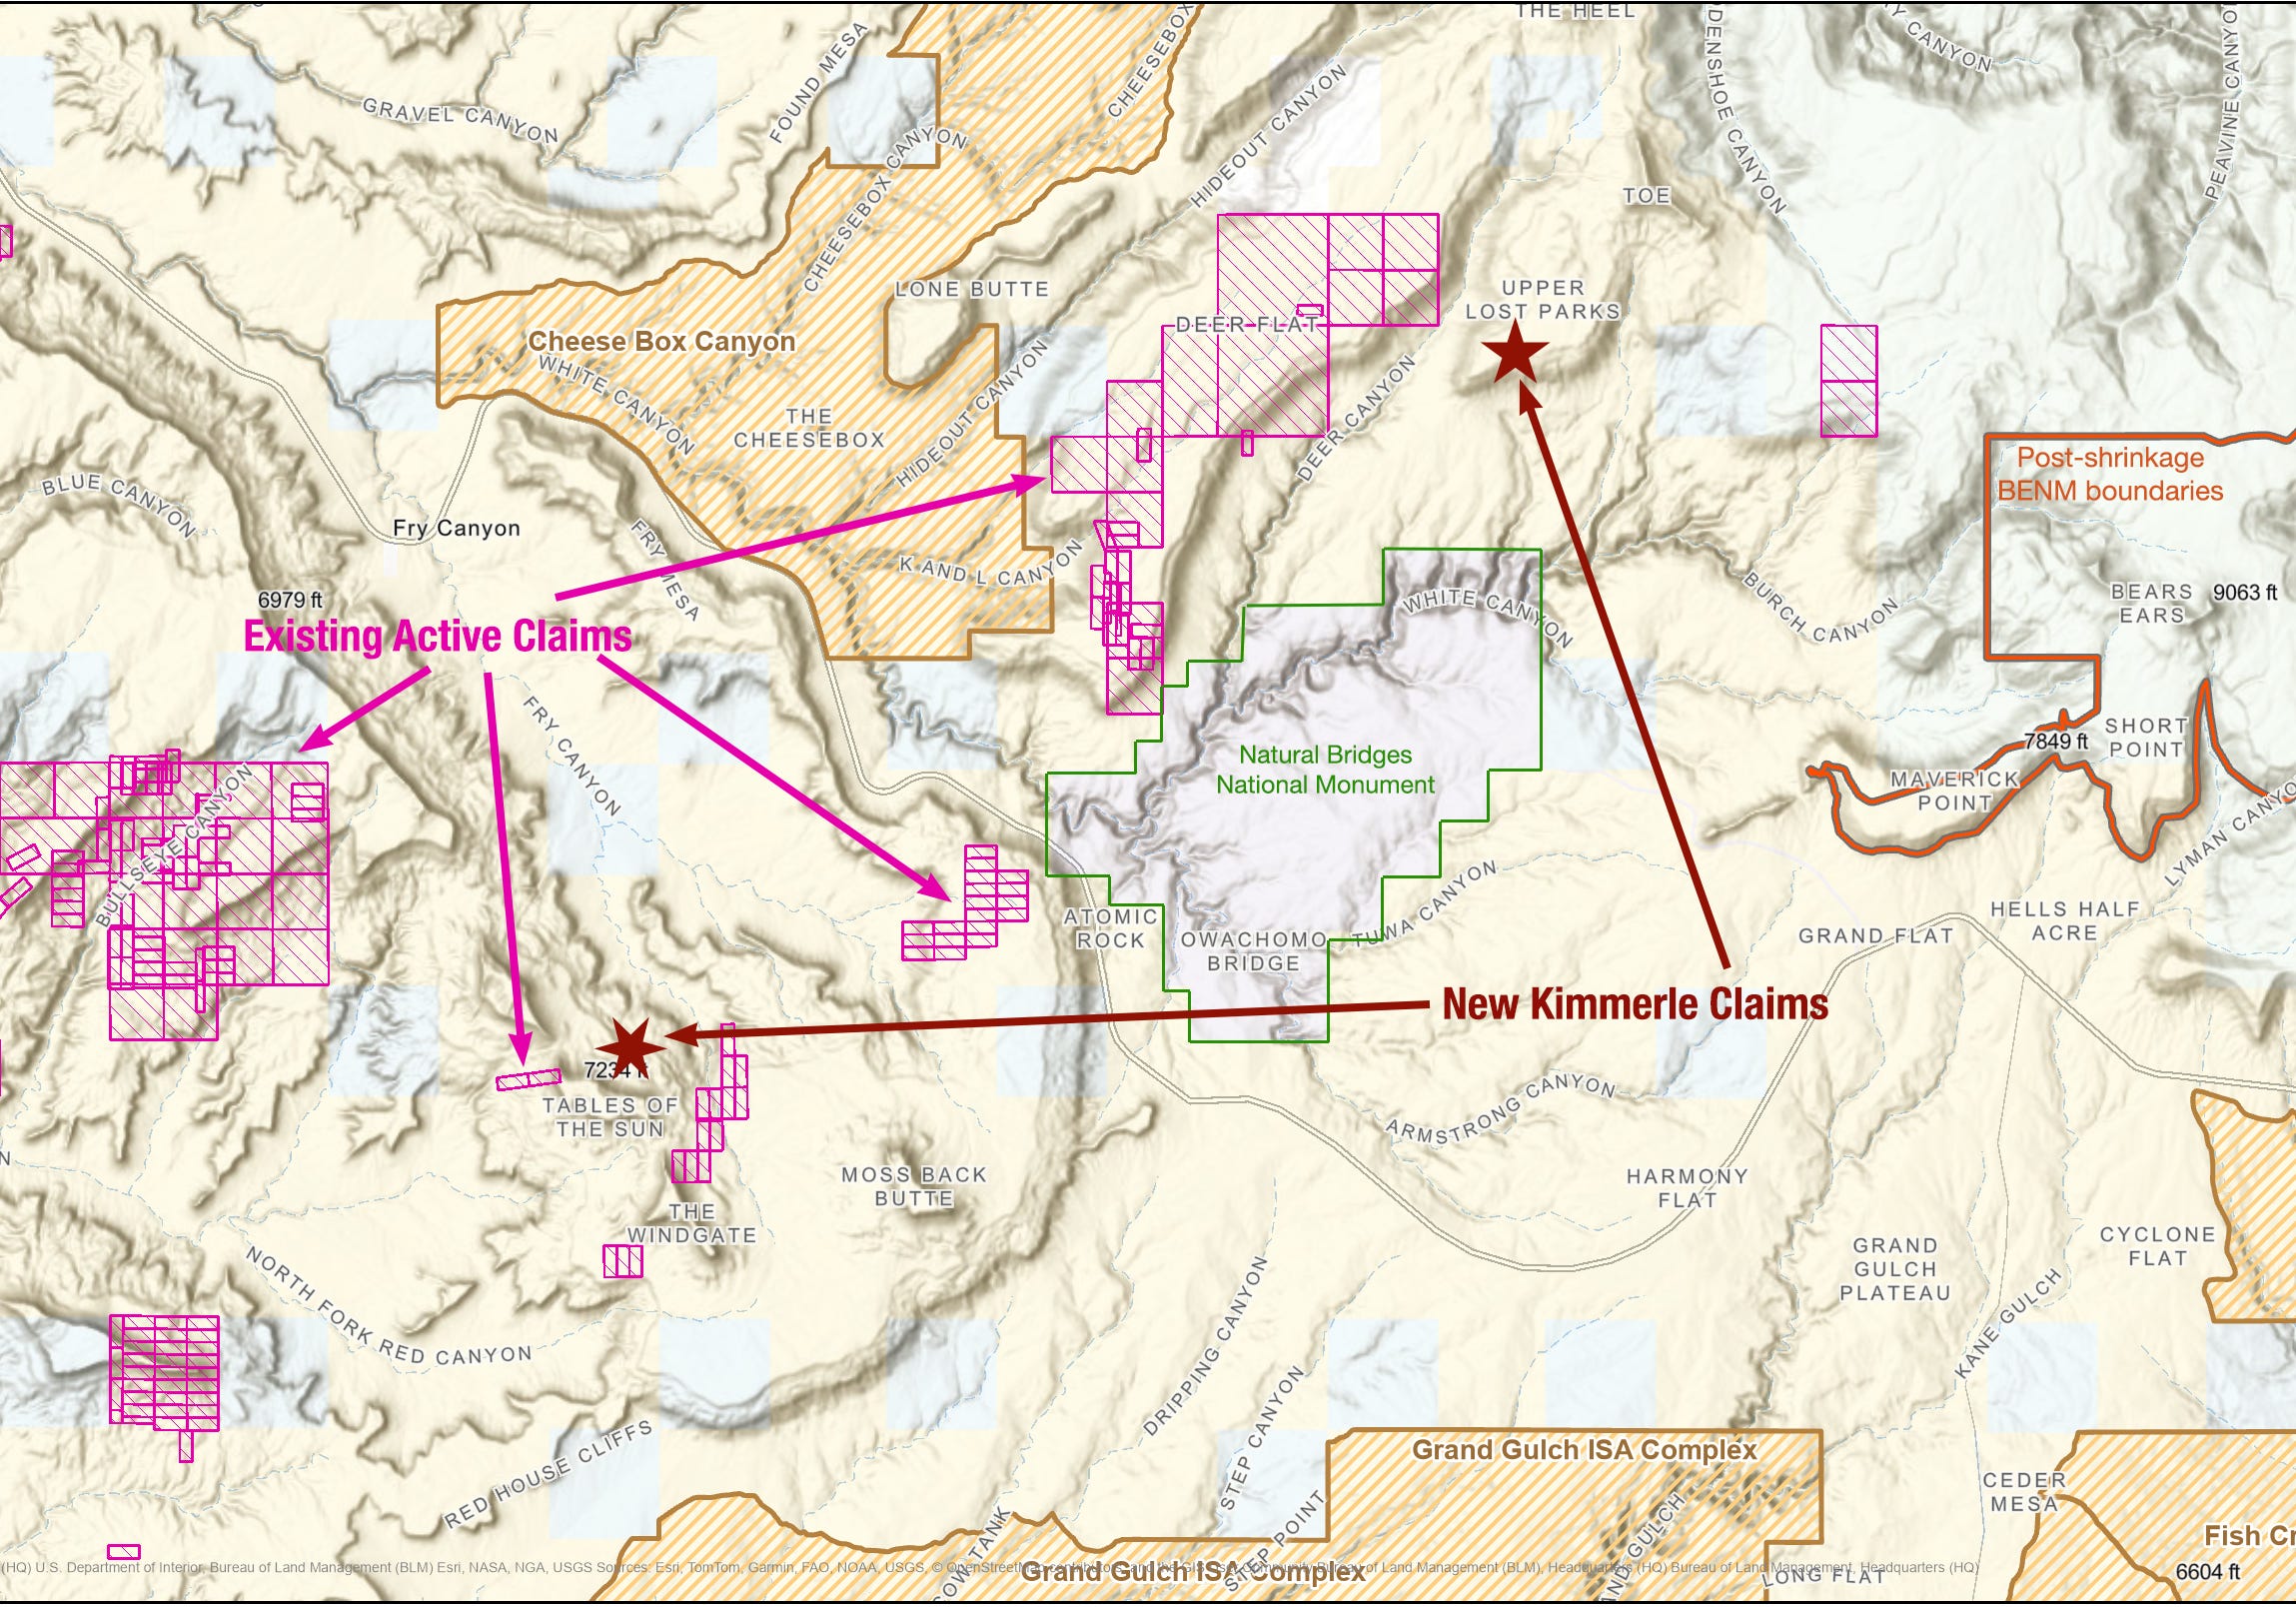
The Kimmerle claims include:
- Six lode claims (each at 20.66 acres) on the north slope of the Tables of the Sun formations in the upper Fry Canyon drainage, just on the boundary line of the original Bears Ears National Monument. While this specific area has seen little mining activity in the past, it is in the same vicinity as the Daneros Mine, which was up for expansion as recently as 2016. And the new claims are adjacent to Kimmerle’s Lucky group of claims.
The nearest historic mining activity was at the Fry # 4 mine1, an underground uranium mine with over 400 meters of workings. In 1977, the operator was Utah Power & Light Co., which was the main mining company of the area at the time.- One lode claim on the east slope of Upper Lost Parks, an appendage of Elk Ridge just north of Natural Bridges National Monument and south of the Woodenshoe formation. It’s across Deer Creek Canyon from Kimmerle’s Geitus and Cedar claims, which the firm staked just before President Barack Obama designated Bears Ears, and right after President Donald Trump shrunk the monument for the first time. It’s also in the vicinity of the Sandy claims that Kimmerle held, but that [those?] were closed in 2015. The area was mined and prospected heavily during the Cold War. The nearest historical mines and prospects were the Big Red, the Sandy, and the Hideout. In 1977, the Big Red — operated by Utah Power & Light — was reported to have a flooded, a caved, and an open adit. While the Hideout sparked a 1950s prospecting boom in the area, none of these were ever large producers. However, a 1965 USGS report did indicate this part of Elk Ridge was favorable for uranium deposits, which is likely one reason the Trump administration stripped it of national monument protections.
The White Canyon area was known to contain rich uranium reserves back in the 1940s and 1950s, but its remoteness and the rugged landscape created challenges for mining companies looking to exploit the resources. One of the biggest hurdles was getting the ore to the Monticello processing plant, which required driving gnarly roads across the crinkled landscape and up and over Elk Ridge.
So in 1949, the Vanadium Corporation of America built a small mill at the confluenceof White Canyon and the Colorado River, primarily to process uranium ore from the nearby Happy Jack Mine, located upstream in the White Canyon drainage (and just within the original Bears Ears National Monument boundaries). For the next four years, the mill went through about 20 tons of ore per day, crushing and grinding it up, then treating it with sulfuric acid, tributyl phosphate, and other nastiness. One ton of ore yielded about five or six pounds of uranium, meaning that each day some 39,900 pounds of tailings were piled up outside the mill on the banks of the river.
In 1953 the mill was closed, and the tailings were left where they sat, uncovered, as was the practice of the day. Ten years later, water began backing up behind the newly built Glen Canyon Dam; federal officials decided to let the reservoir’s waters inundate the tailings. There they remain today, though at current lake levels they are probably buried by and mixed in with the Dominy Formation of silt, rather than covered with water.
During the uranium days of the West, more than a dozen mills — all with processing capacities at least ten times larger than the one at White Canyon — sat on the banks of the Colorado River and its tributaries. Mill locations included: Shiprock, Mexican Hat, Monument Valley, Tuba City, Monticello, Rifle, Grand Junction, Moab, Uravan, Green River, and Naturita. There was even an ore upgrading mill at Fry Canyon, followed by a copper heap leaching operation. Groundwater contamination continues to today, and was partially responsible for the Fry Canyon Lodge’s demise.
At the Durango mill the tailings were piled into a hill-sized mound just a stone’s throw from the Animas River. They weren’t covered or otherwise contained, so when it rained tailings simply washed into the river. Worse, the mill’s liquid waste stream poured directly into the river at a rate of some 340 gallons per minute, or half-a-million gallons per day. It was laced not only with highly toxic chemicals used to leach uranium from the ore and iron-aluminum sludge (a milling byproduct), but also radium-tainted ore solids.
Radium is a highly radioactive “bone-seeker.” That means that when it’s ingested it makes its way to the skeleton, where it decays into other radioactive daughter elements, including radon, and bombards the surrounding tissue with alpha, beta, and gamma radiation. According to the Toxic Substances and Diseases Registry, exposure leads to “anemia, cataracts, fractured teeth, cancer (especially bone cancer), and death.”
It wasn’t any better at any of the other mills. In the early 1950s, researchers from the U.S. Public Health Service sampled Western rivers and found that “the dissolved radium content of river water below uranium mills was increased considerably by waste discharges from the milling operations” and that “radium content of river muds below the uranium mills was 1,000 to 2,000 times natural background concentrations.”
That was just from daily operations. In 1960, one of the evaporation ponds at the Shiprock mill broke, sending at least 250,000 gallons of highly acidic raffinate, containing high levels of radium and thorium, into the river. None of the relevant officials were notified and individual users continued to drink the water, put it on their crops, and give it to their sheep and cattle. It wasn’t until five days later, after hundreds of dead fish had washed up on the river’s shores for 60 miles downstream, that the public was alerted to the disaster.
Of course, what’s dumped into the river at any of these places doesn’t stay there, but makes its way downstream. In the early 1960s, while Glen Canyon Dam was still being constructed, the Public Health Service folks did extensive sediment sampling in the Colorado River Basin, with a special focus on Lake Mead’s growing bed of silt, which had been piling up at a rate of 175 million tons per year after Hoover Dam started impounding water in 1935. The Lake Mead samples had higher-than-background levels of radium-226. The report concludes:

And so, the billions of tons of silt that has accumulated in Lake Mead and Lake Powell serve as archives of sorts. They hold the sedimental records of an era during which people, health, land, and water were all sacrificed in order to obtain the raw material for weapons that are capable of destroying all of humanity. If the new mining claim mini-rush is any indication, some more records may be added to the archive before long.
📸 PARTING SHOT 🎞️
There’s snow in them thar hills!

1 This also appears on some maps and documents as Frey #4. In fact, many of the “Fry”s in the Fry Canyon area show up as “Frey” on older maps (while some still say “Fry.”). Oh my oh my I don’t know why it’s Frey or Fry.