
Click the link to read the report on the University of New Mexico Digital Repository website (Jack Schmidt1, Anne Castle2, Eric Kuhn3, Kathryn Sorensen4, Katherine Tara5):
September 2, 2026
KEY POINTS
- Reductions in Lower Basin water use during the last four years, including forecast use in 2026, are similar to the initial targets for Lower Basin shortages described in the Final Environmental Impact Statement for Post-2026 Operational Guidelines and Strategies for Lake Powell and Lake Mead (FEIS) and the accompanying Record of Decision (ROD). 6 Lower Basin consumptive use in 2023, 2024, and 2025, and forecast for 2026 has been the smallest for the entire 2010-2026 period. These four years of smallest use are between 1.4 and 1.7 million acre feet/year (maf/yr) less than the 7.50 maf/yr amount generally recognized as the Lower Basin’s mainstem allocation.
- Reductions in Lower Basin use have been achieved by large reductions implemented by Central Arizona Project (CAP) contractors and subcontractors, the Imperial Irrigation District (IID), and non-CAP water users in Arizona. The reductions in use in the IID have been in summer water use and have not affected consumptive use in winter when garden crops, such ass lettuce, onions, carrots, and broccoli, are grown.
- There is no historical analogy for implementing Lower Basin shortages of 3 maf/yr that would reduce annual consumptive water use to 4.5 maf/yr. We identified the lowest use in each month between 2010 and 2026 in each Lower Basin state and summed those monthly values, even when those months did not occur in the same year. The annual total of the summed lowest monthly uses yielded a minimum total Lower Basin use of 5.03 maf/yr. Thus, implementation of 3 maf/yr shortages would require reductions in monthly use greater than the sum of the smallest monthly uses during the past 17 years.
INTRODUCTION
This paper is part of a series, The Colorado River Water Supply Crisis in a Few Graphs, whose goal is to provide readers with summary information about the natural water supply, reservoir storage, and consumptive uses and losses in the Basin so that readers can better understand and consider the current water crisis. The long-term fate of the water supply provided by the Colorado River depends on many complex and interconnected factors: the natural flow of the river, the amount of water stored in the Basin’s reservoirs, the consumptive uses of that water, the losses caused by reservoir evaporation, and the losses associated with water flowing through natural channels (i.e., transmission losses).
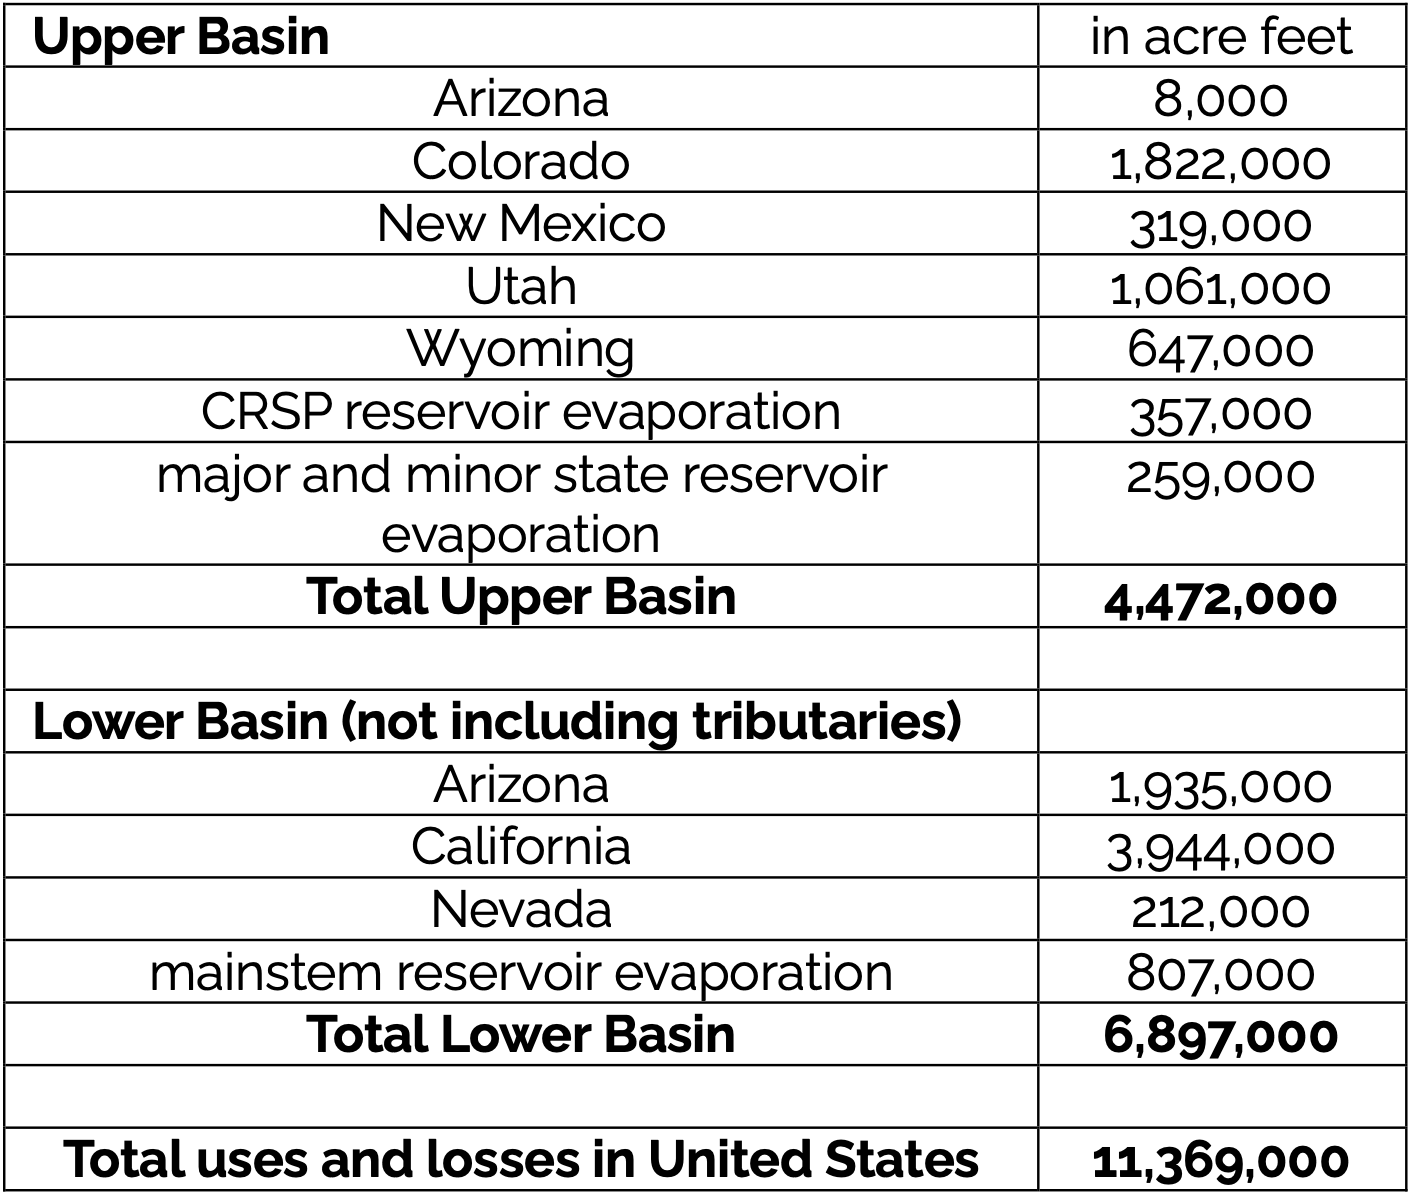
In 2024, approximately 60% of all uses and losses of Colorado River water in the United States occurred in the Lower Basin (Table 1).⁷ In this paper, we summarize water use in the Lower Basin since 2010, primarily focusing on consumption by the Imperial Irrigation District (IID), the largest user in the entire Colorado River Basin, and on the aggregate consumption by Arizona users not served by the Central Arizona Project (CAP). We focus on these agricultural users, because agriculture makes up approximately 60% of consumptive uses in the Lower Basin,⁸ and the agricultural sector will play a significant role in future reductions in water use in the Lower Basin.
This paper provides historical context in which to consider the magnitude of recent reductions in Lower Basin water use by comparing current water use with typical rates of use since 2010. We also provide historical context for the shortage goals described in the recently released ROD and Operating Guidelines for 2027 and 2028. 10 The ROD lists a potential maximum Lower Basin reduction of 3.0 maf/yr but also includes language that seems to allow for even greater reductions, after consultation, in extraordinary circumstances.
We analyze the Lower Basin water use data summarized by the Bureau of Reclamation in annual decree accounting reports formally titled Colorado River Accounting and Water Use Report: Arizona, California, and Nevada.¹¹ These reports are issued each May and summarize monthly water use by every Lower Basin user. Reclamation also provides monthly provisional data on the current year’s water use, and the agency provides forecasts of annual use for the current year.¹² Similarly extensive and precise data describing Upper Basin use are not readily available.
Lake Mead and Lake Powell are the largest reservoirs in the United States and essentially are one gigantic reservoir separated into two parts by the Grand Canyon.¹³ Inflow to this gigantic reservoir primarily is snowmelt from the Rocky Mountains, and a significant amount of that runoff is put to beneficial use by Upper Basin users before it reaches Lake Powell. A small amount of additional inflow occurs within the Grand Canyon, and there are occasional inflows to Lake Mead from the Virgin River. Southern Nevada Water Authority directly withdraws water from Lake Mead, and other Lower Basin users divert stream flow after it is released from Lake Mead.
RECENT LOWER BASIN WATER USE
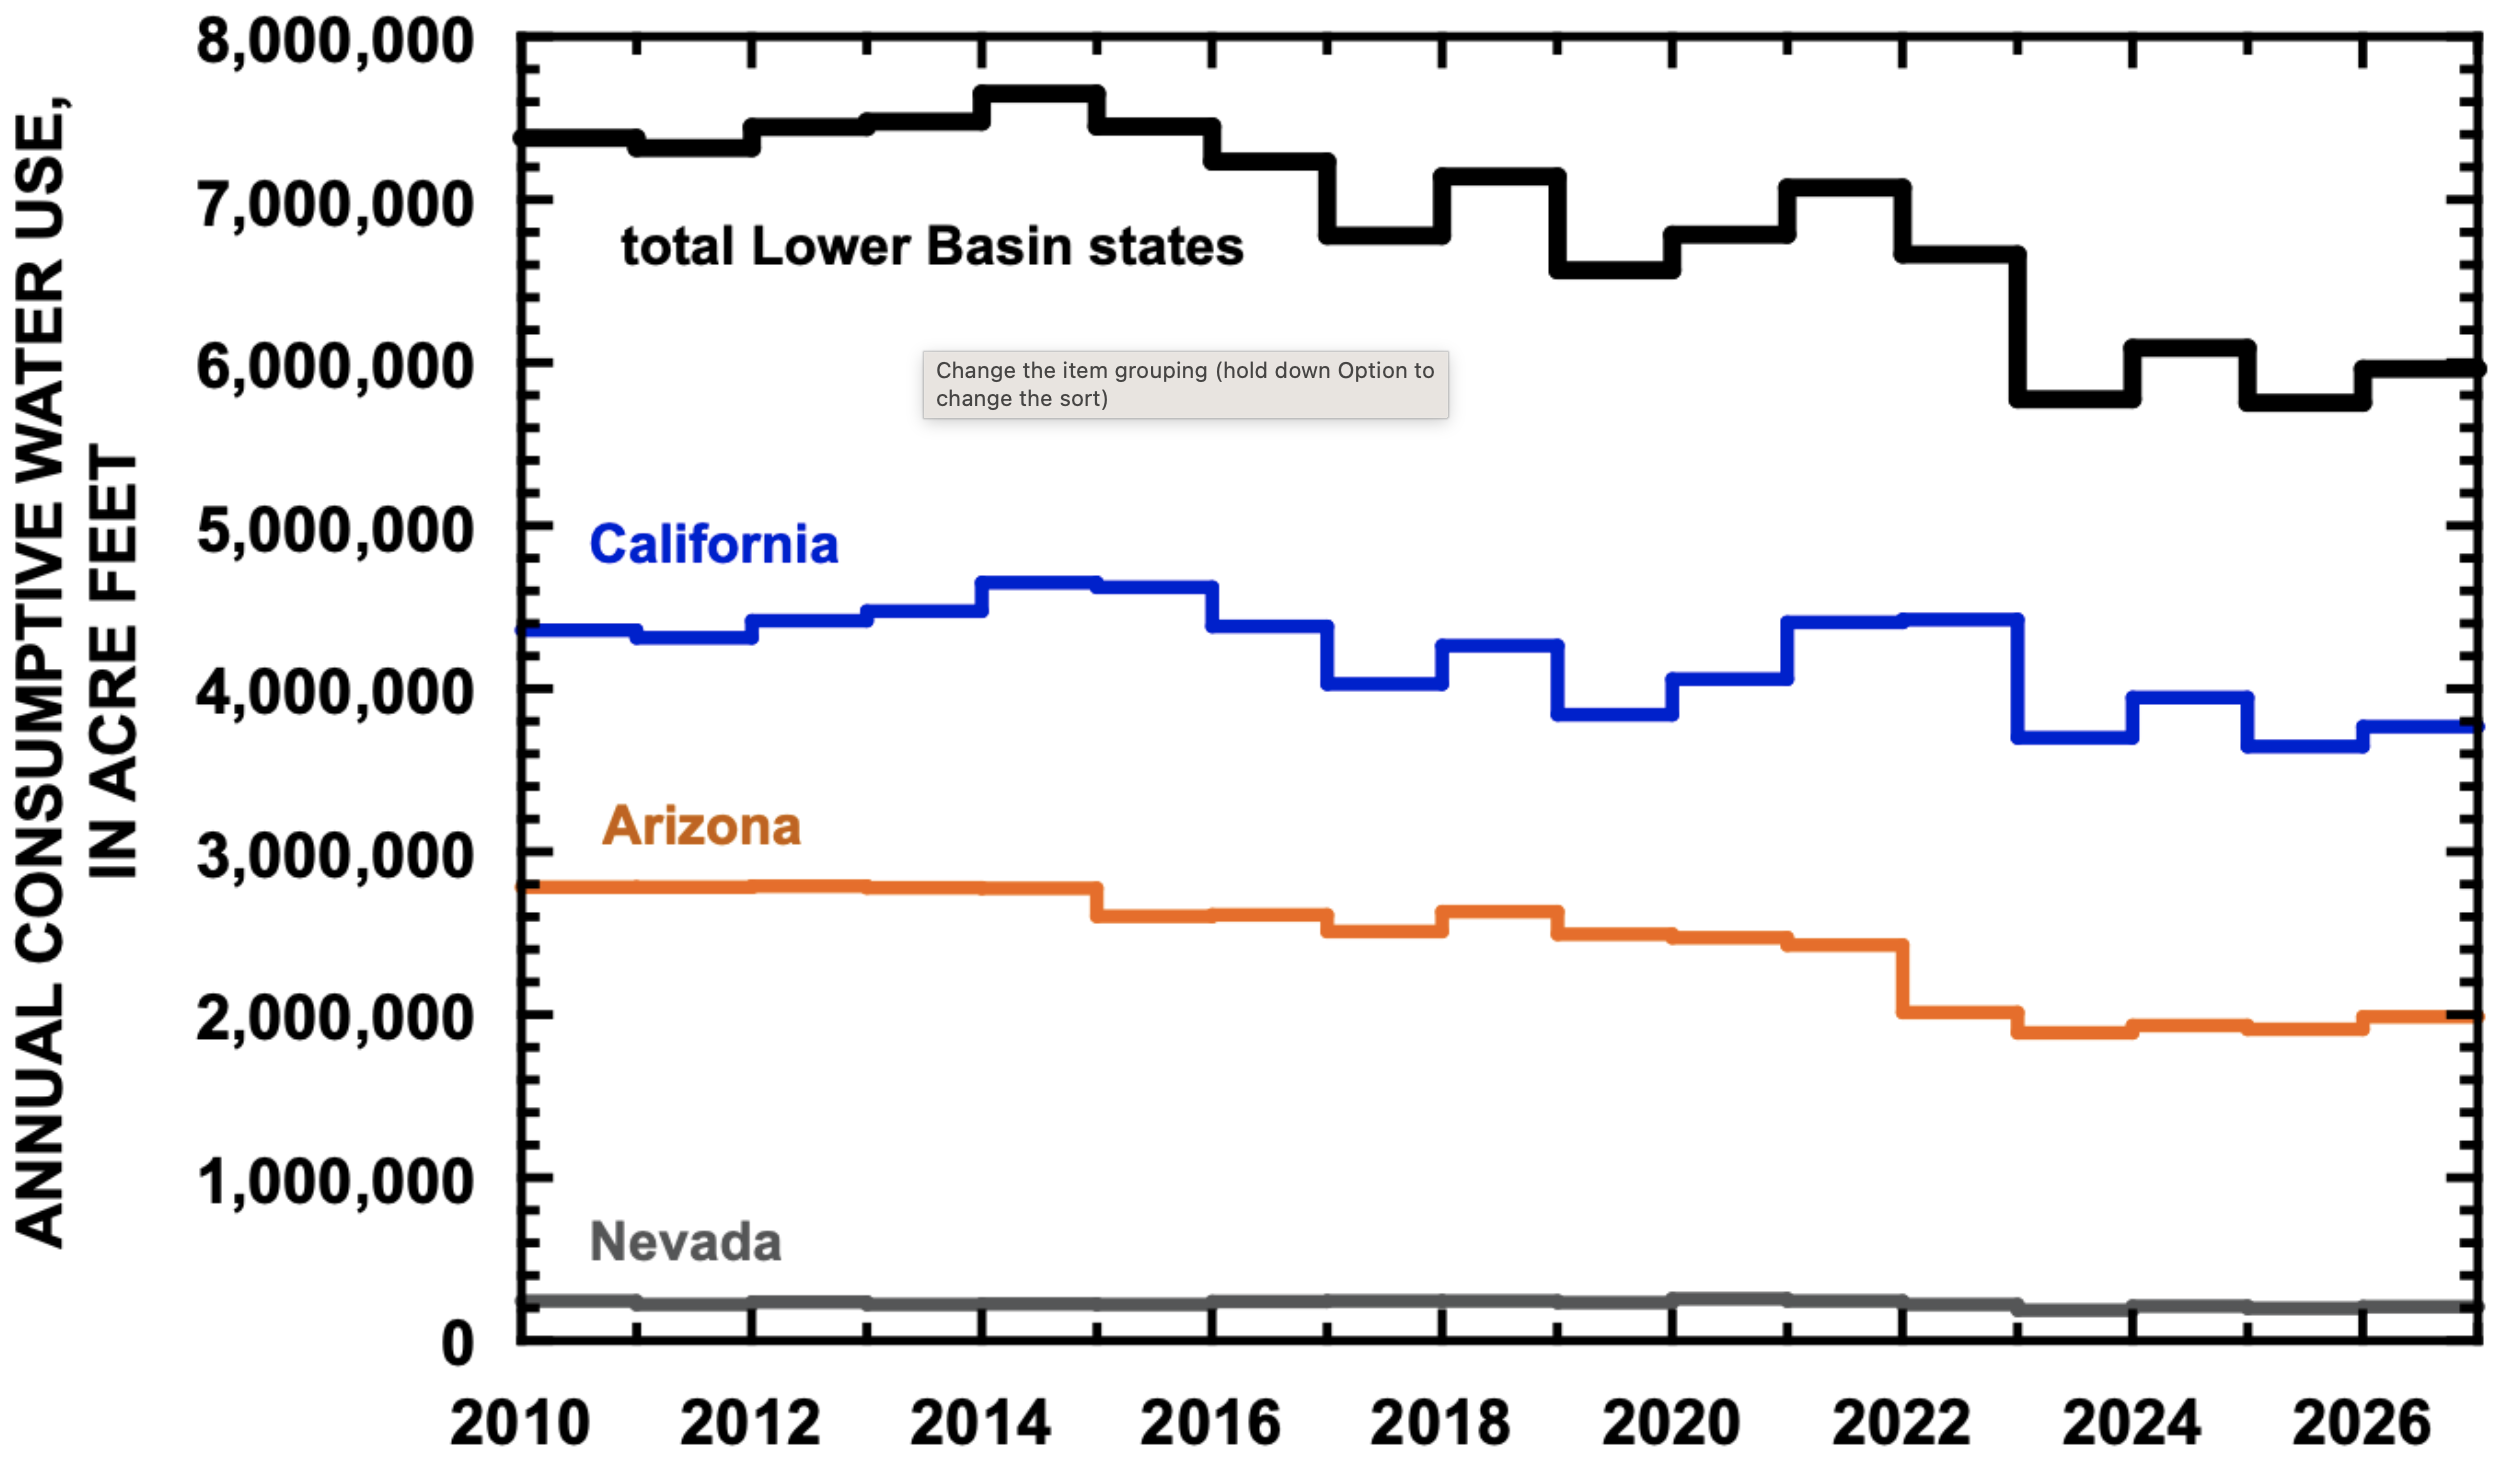
In 2025, total consumptive use in the three Lower Basin states was 5.755 maf, the smallest annual total use since at least 2010 (Fig. 1) and 17% less than the average for 2010-2025.14 This small amount resulted from the lowest annual use in California (3.647 maf) since at least 2010 and the second lowest annual use since 2010 in Arizona (1.911 maf). Lower Basin use in 2026, 5.961 maf, is forecast to be slightly more than in 2025.15
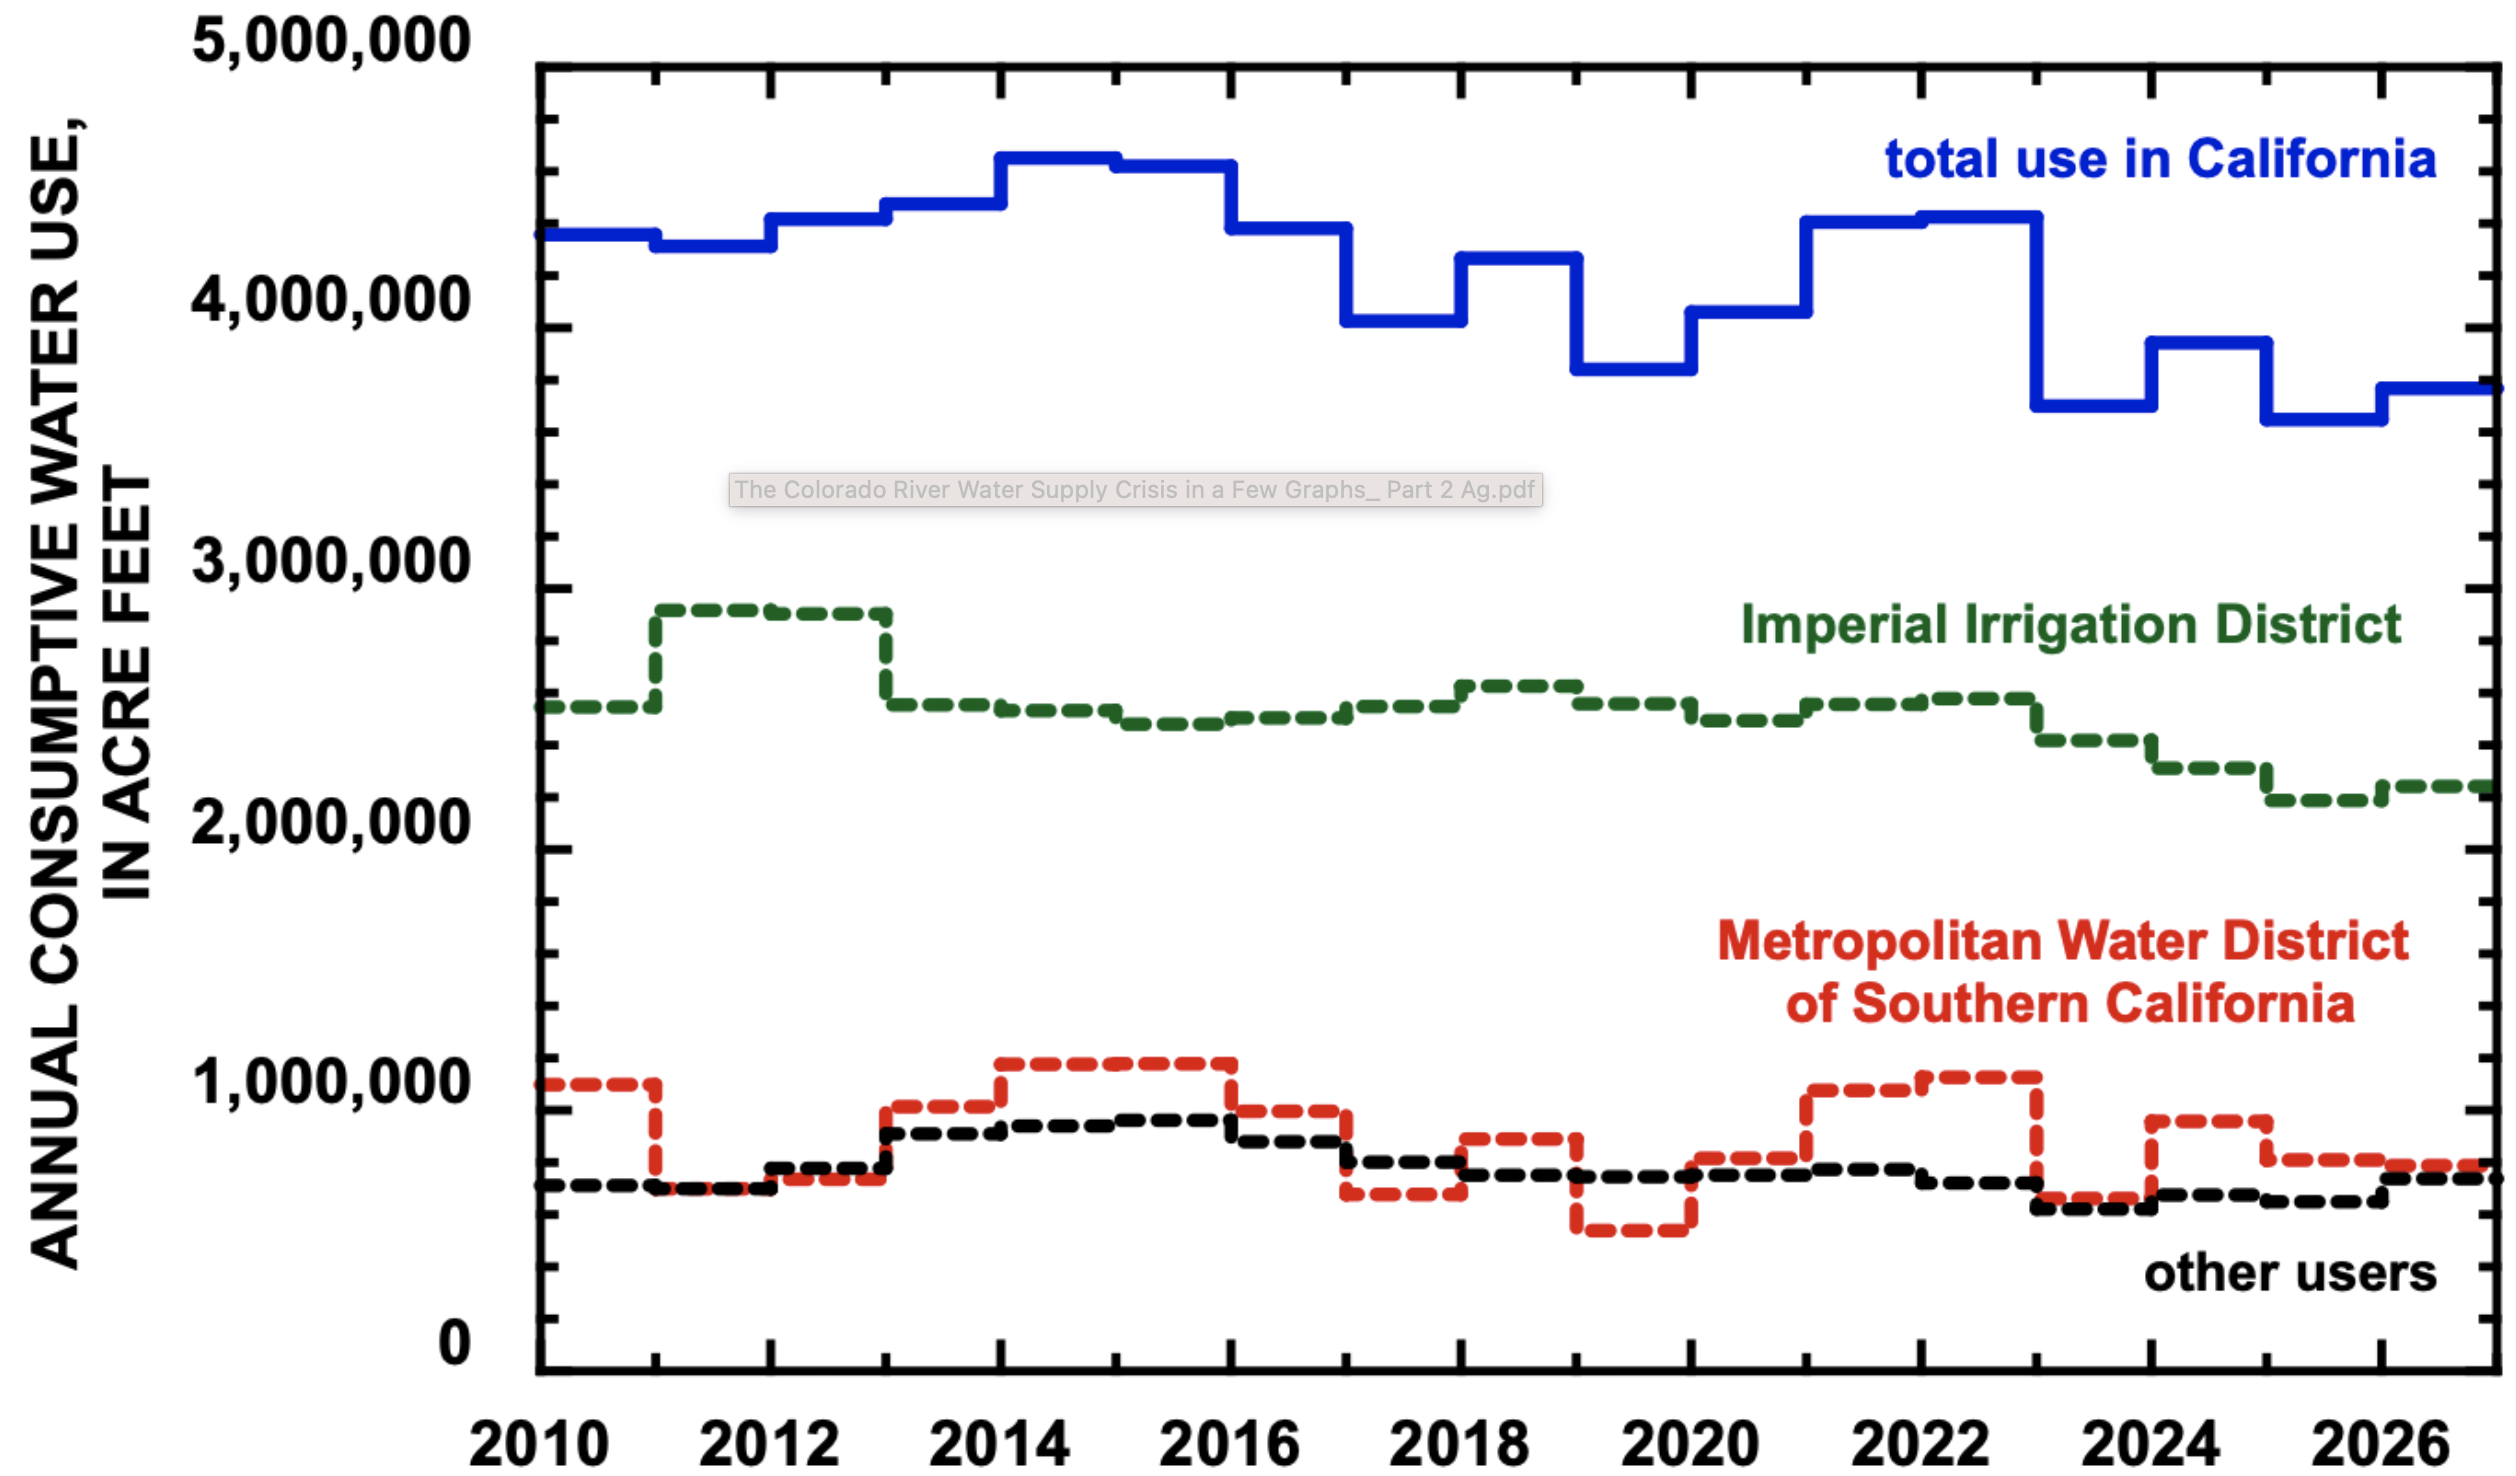
Water use in California since 2023, including forecast use in 2026, has been 13% less than between 2010 and 2022.16 Decreased use in California in those years has been primarily due to reductions in use by IID (Fig. 2). IID’s consumptive use of 2.187 maf in 2025 was the lowest since 2010 and forecast use in 2026 of 2.242 maf is also very low. Average use by IID between 2023 and 2026 will be 12% less than average use between 2010 and 2022.17 Annual consumptive use by the Metropolitan Water District of Southern California (MWD) between 2023 and 2026 will be 13% less than between 2010 and 2022, although the savings are not as great because MWD uses less water than does IID.18
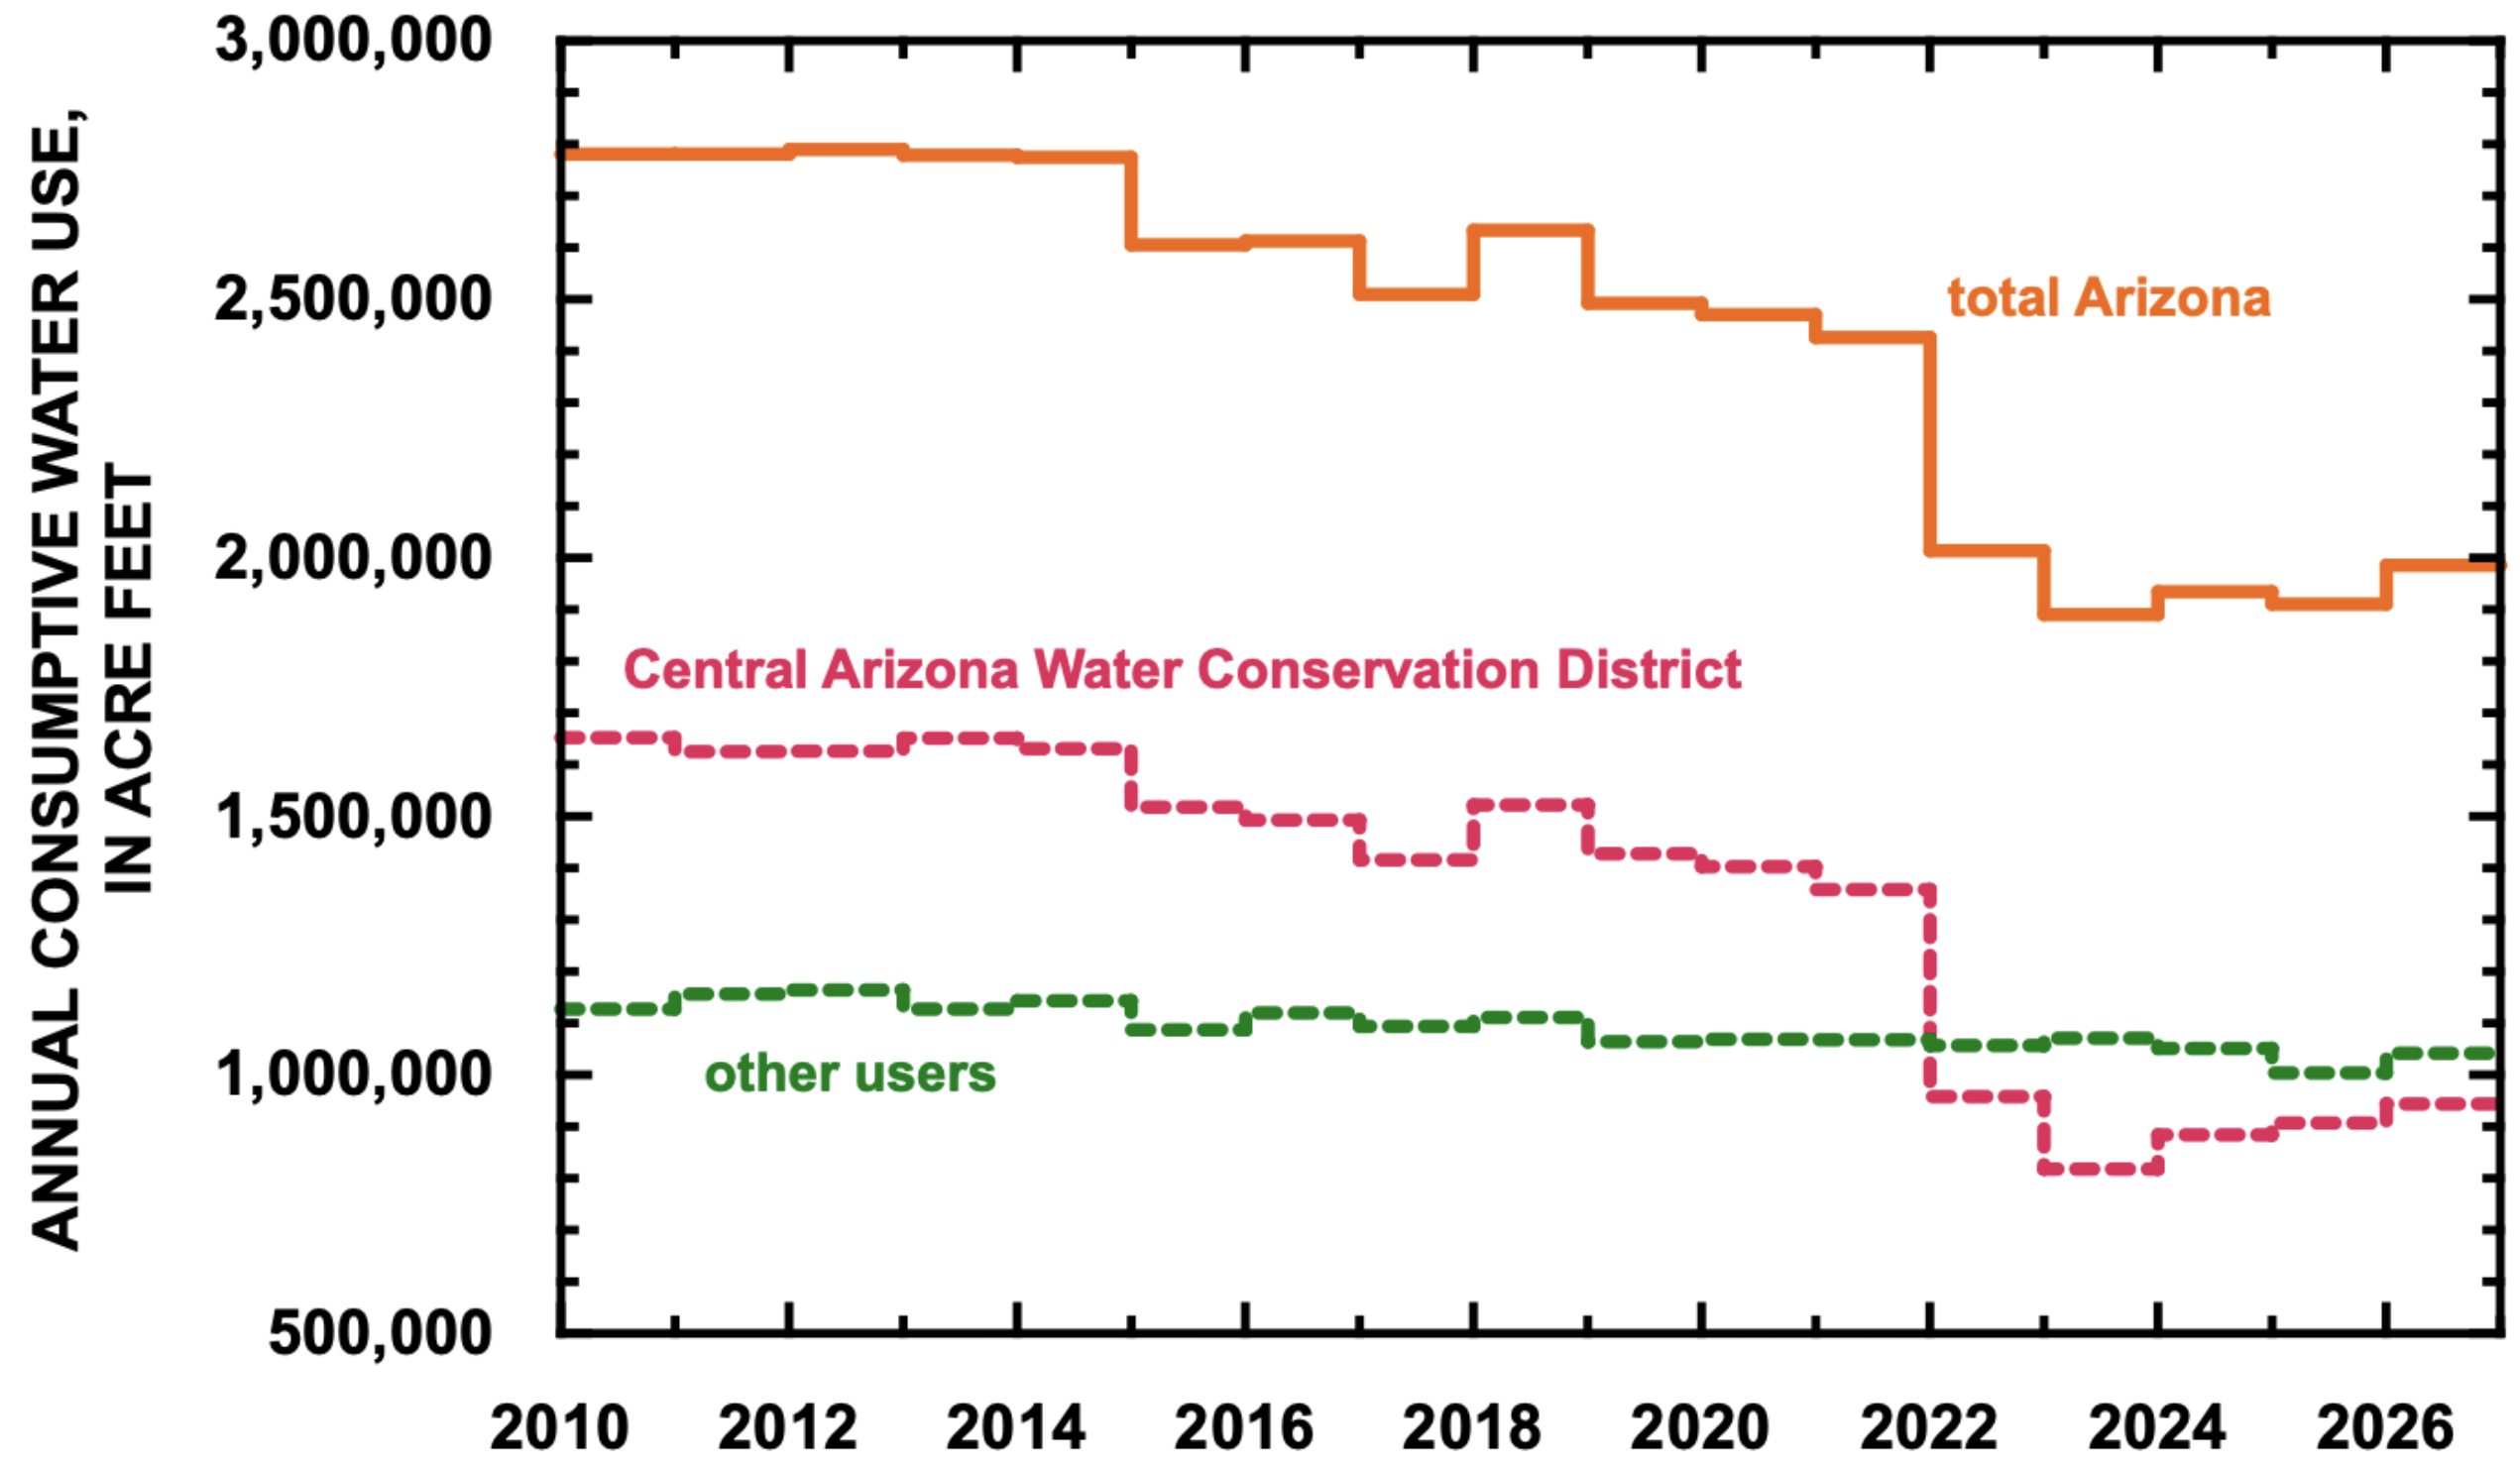
The proportionate reductions in water use in Arizona have been much larger than in California. Average statewide water use between 2023 and 2026 will be 25% less than between 2010 and 2022.19 CAP has reduced its uses by 40% between those two time periods, while non-CAP users have reduced consumption by 6%. The smallest use by Arizona was 1.890 maf in 2023 (Fig. 3). Use in 2025 by non-CAP customers, 1.004 maf, was the lowest since at least 2010. Non-CAP use has exceeded CAP use since 2022.
LOWER BASIN AGRICULTURAL WATER USE
Imperial Irrigation District
IID is the largest individual user of mainstem Colorado River water in the Colorado River Basin, exceeding use by any state in the Basin except California itself. Much of California’s ongoing reductions in use are due to decreased use by IID resulting from various compensated agreements. Future reductions by IID have the potential to significantly affect the Basin’s effort to balance consumptive use with declining supply.
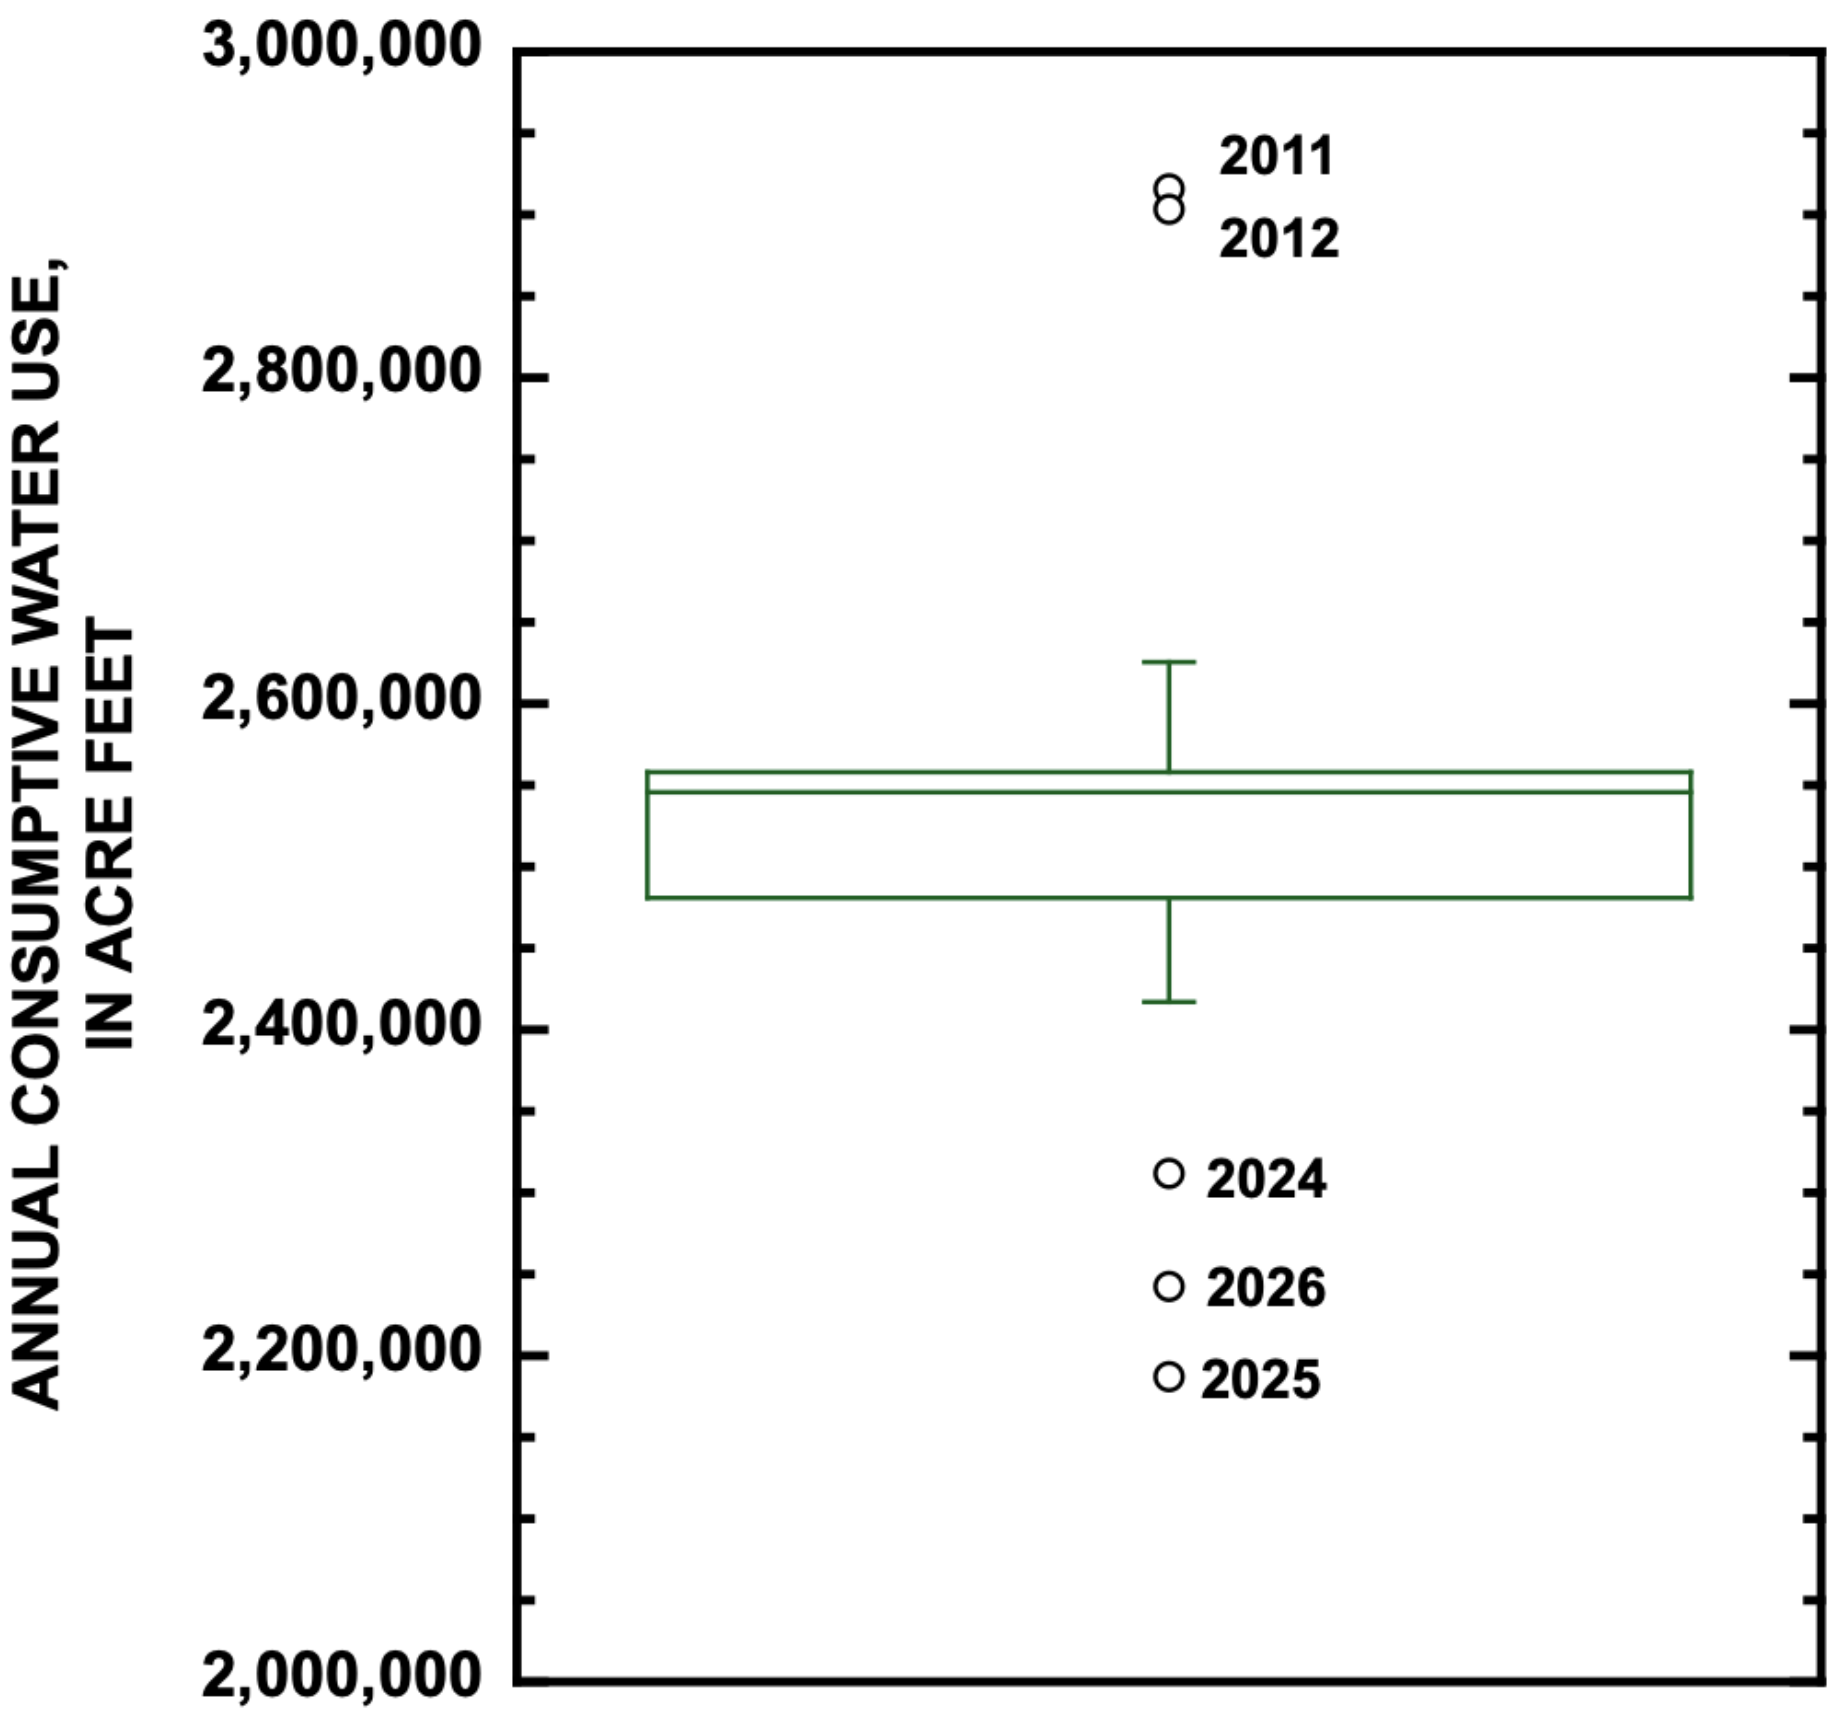
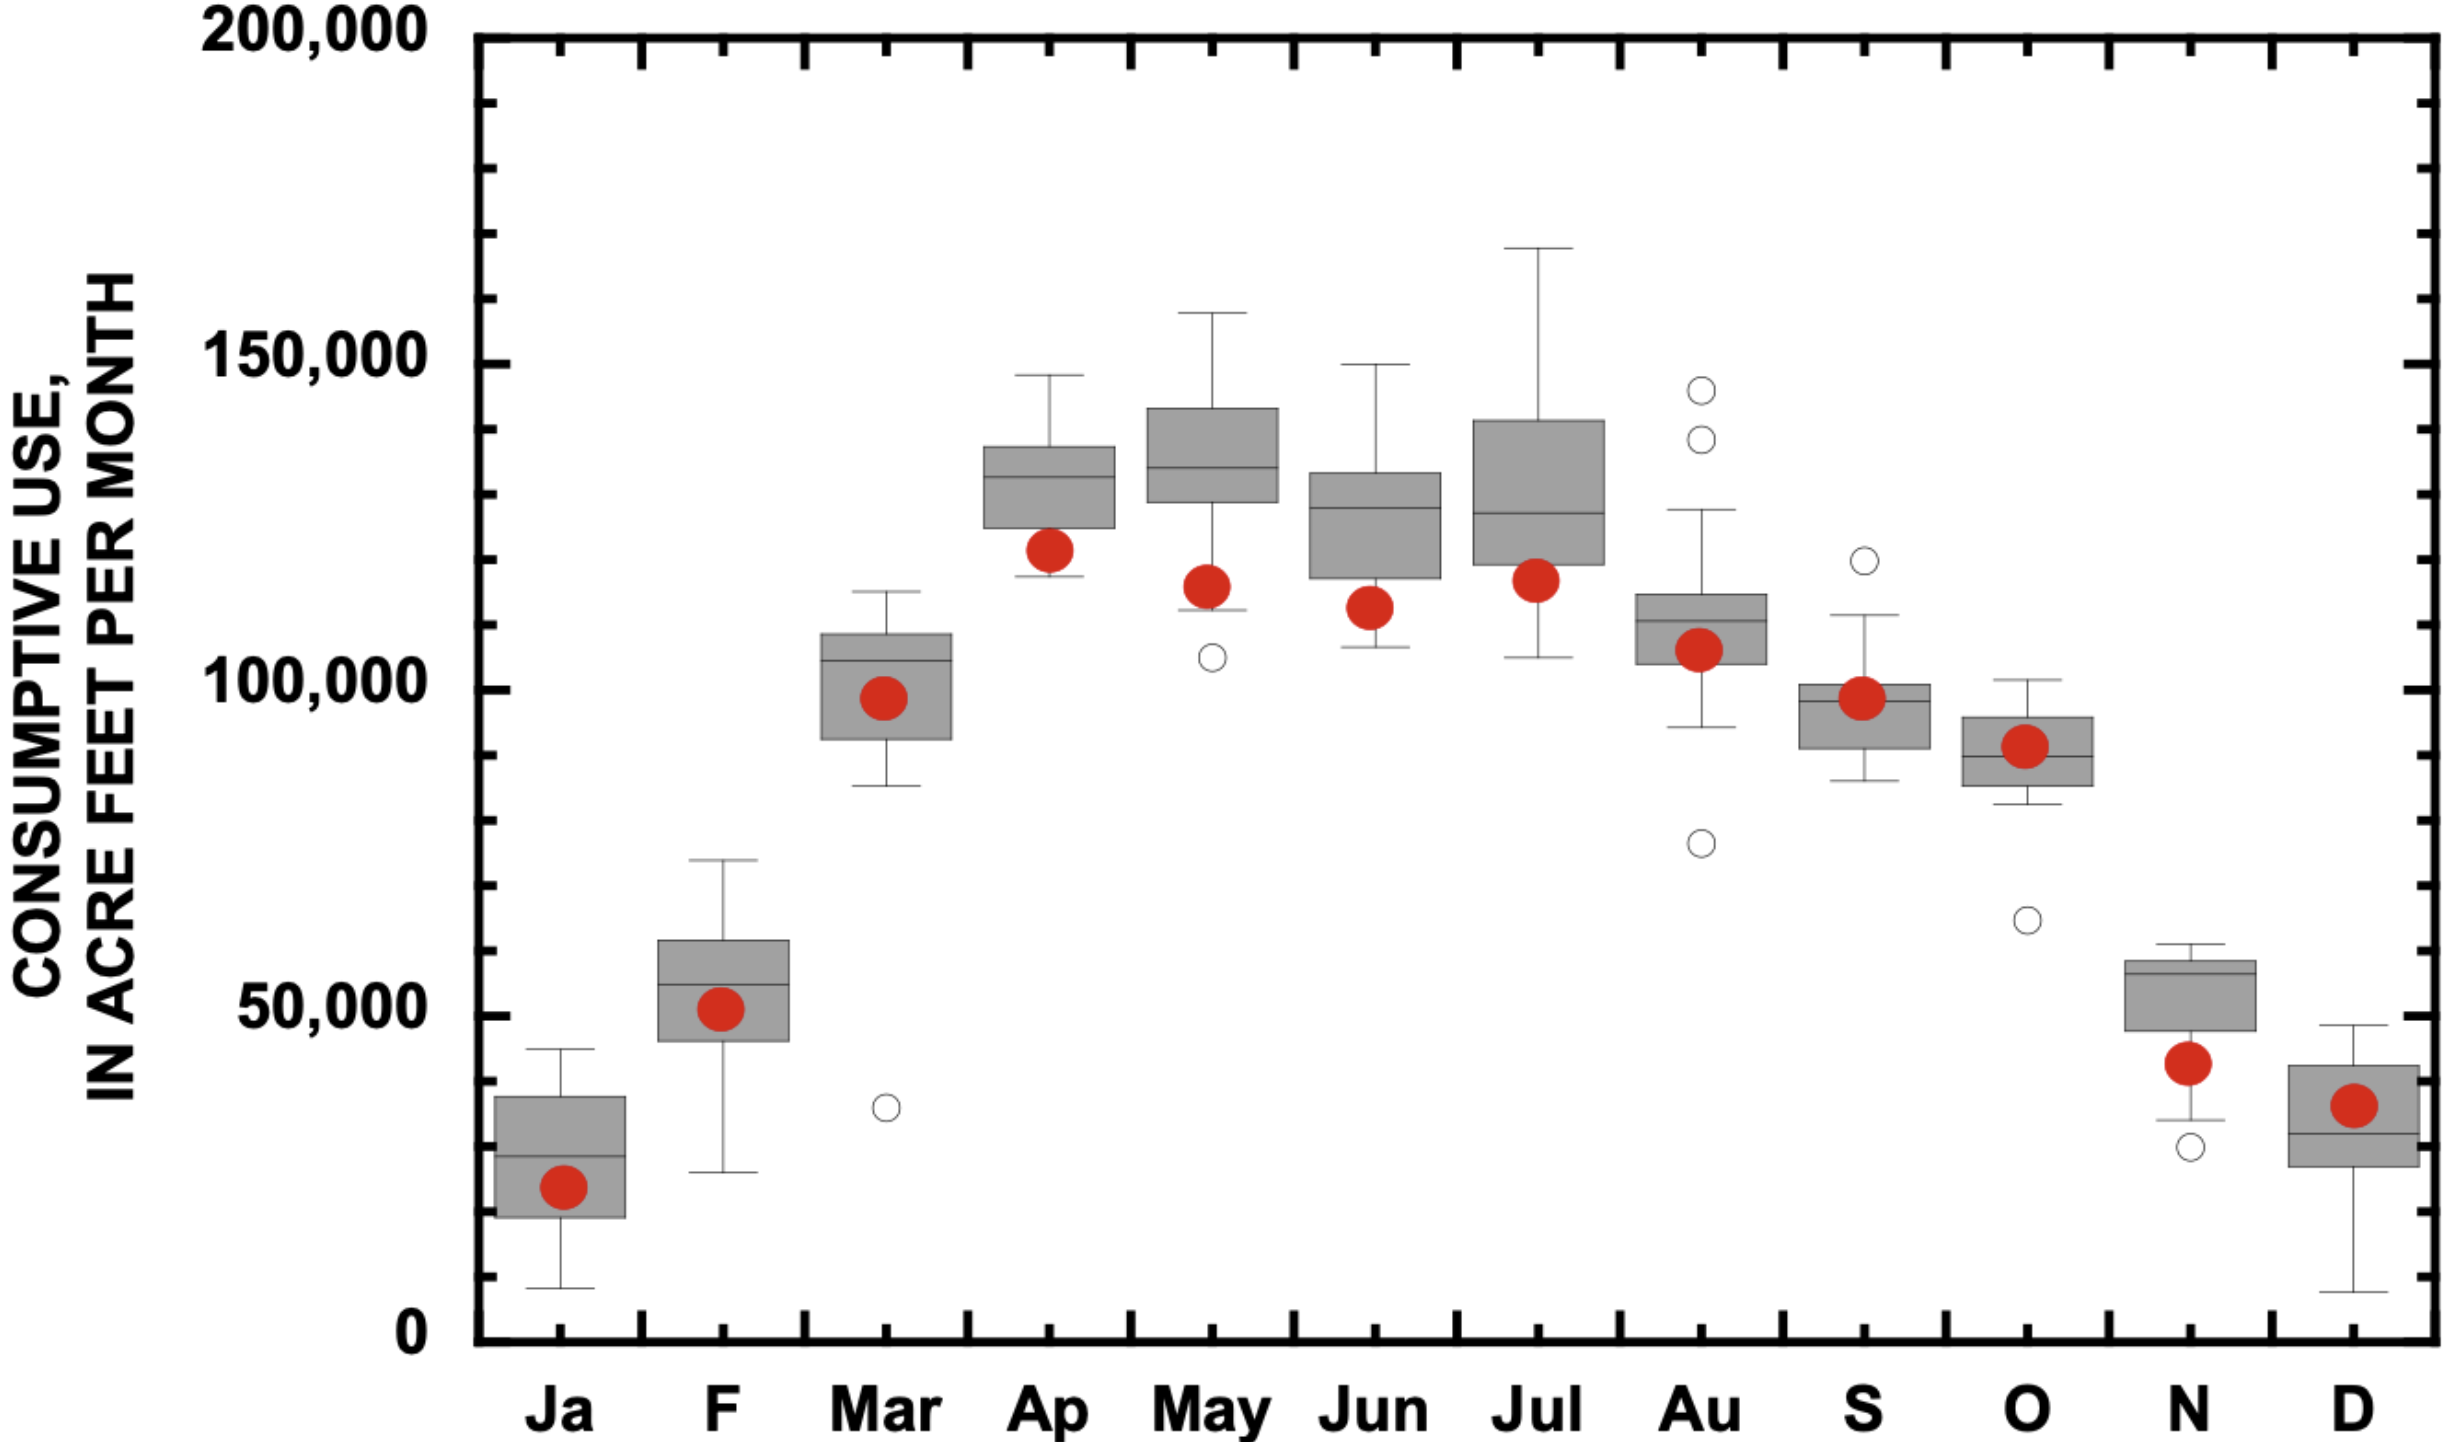
In comparison to typical annual use since 2010, IID’s use in 2024 and 2025, as well as forecast use in 2026, has been notably reduced, as represented in a box-and-whisker plot (Fig. 4).20 The box in Figure 4 encloses 50% of the years since 2010, and the length of this box is called the Inter Quartile Range (IQR), bounded by the 25th and 75th percentile of the 17 years of data, including forecast use in 2026. The line through the middle of the box is the median value for this period. Lines extending up and down from the box (i.e., whiskers) extend from the box to values within an acceptable range. Values that are greater than 1.5 times the IQR above the 75th percentile or below the 25th percentile are beyond the acceptable range and are outliers and individually plotted. Thus, 2024, 2025, and forecast use in 2026 are outliers, indicating that use in those years has been significantly less that typical use during the entire period since 2010.
The largest proportion of irrigated land in IID is devoted to field crop production, the largest proportion of which is devoted to alfalfa (Fig. 5).²¹ The area devoted to alfalfa production changes little from year to year and during the year and was approximately 150,000 acres in 2025.²² In 2025, other significant field crops were Bermuda grass and kleingrass, whose average irrigated area was 80,000 and 20,000 acres, respectively. The area devoted to garden crop production changes greatly throughout the year and is largest between November and March. Little land area is devoted to garden crop production in the heat of summer. The most significant garden crops are lettuce, onions, carrots, and broccoli.
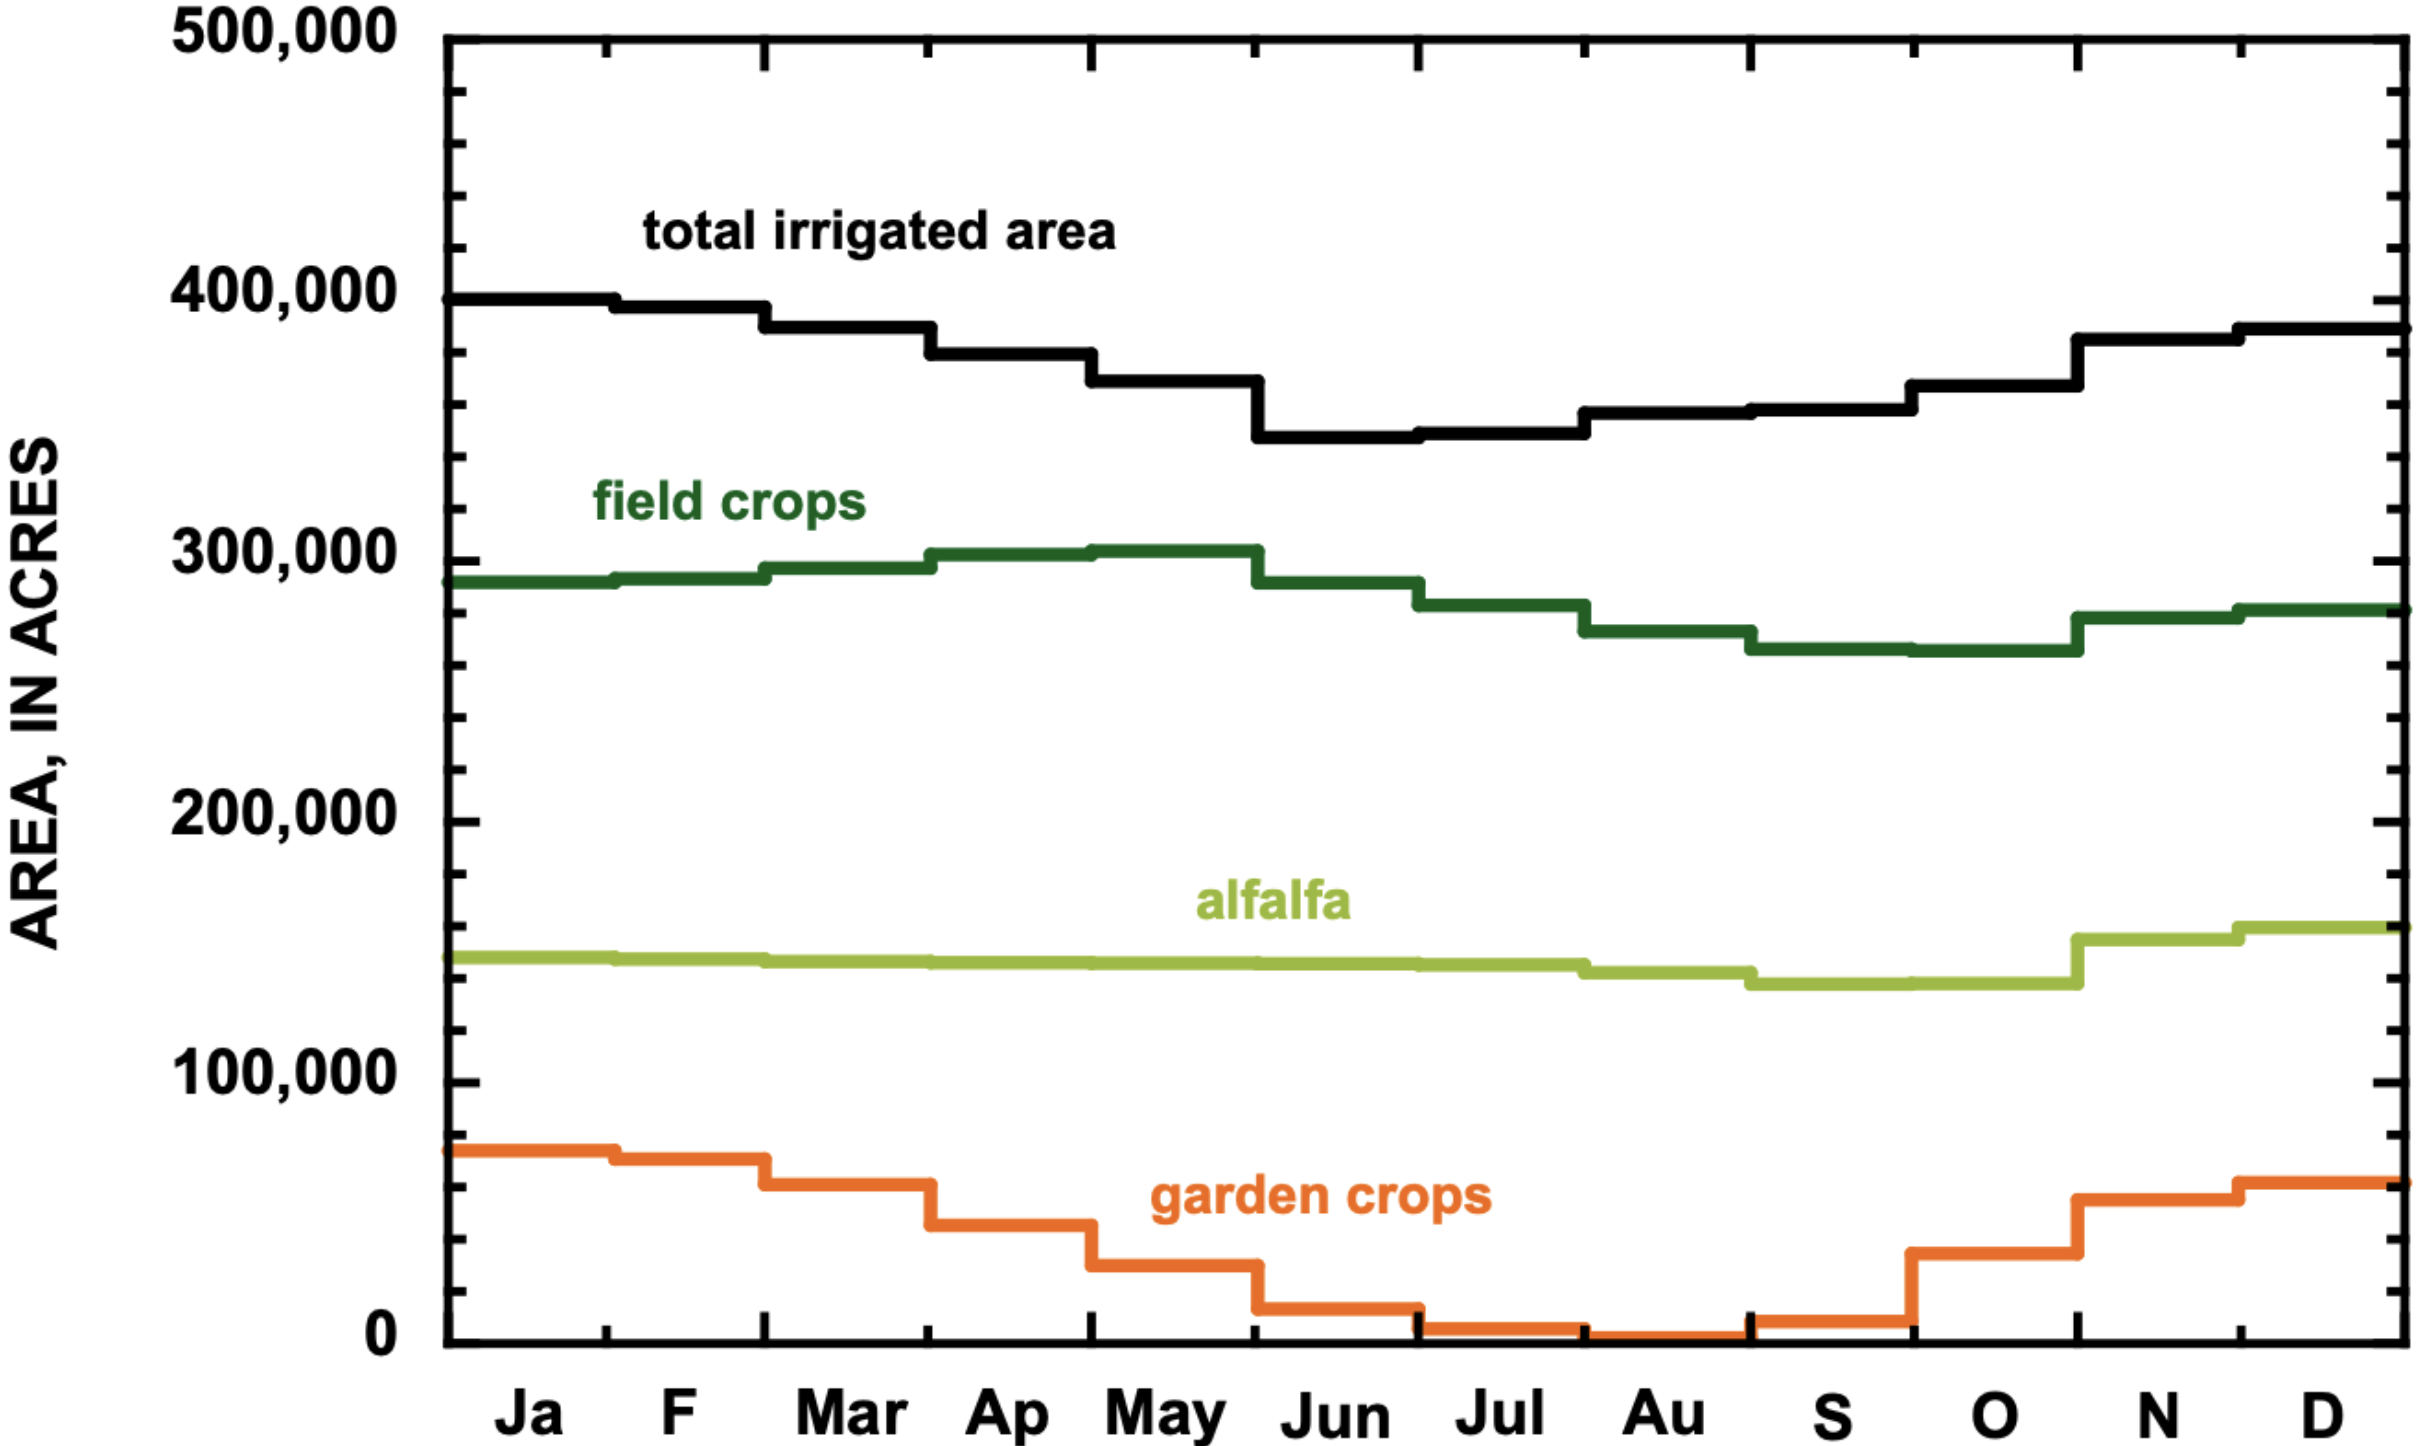
Water use by IID is typically lowest between November and February when garden crops are grown (Fig. 6). Water use increases greatly in March and remains high through October when field crops are the primary focus of production (see Appendix).
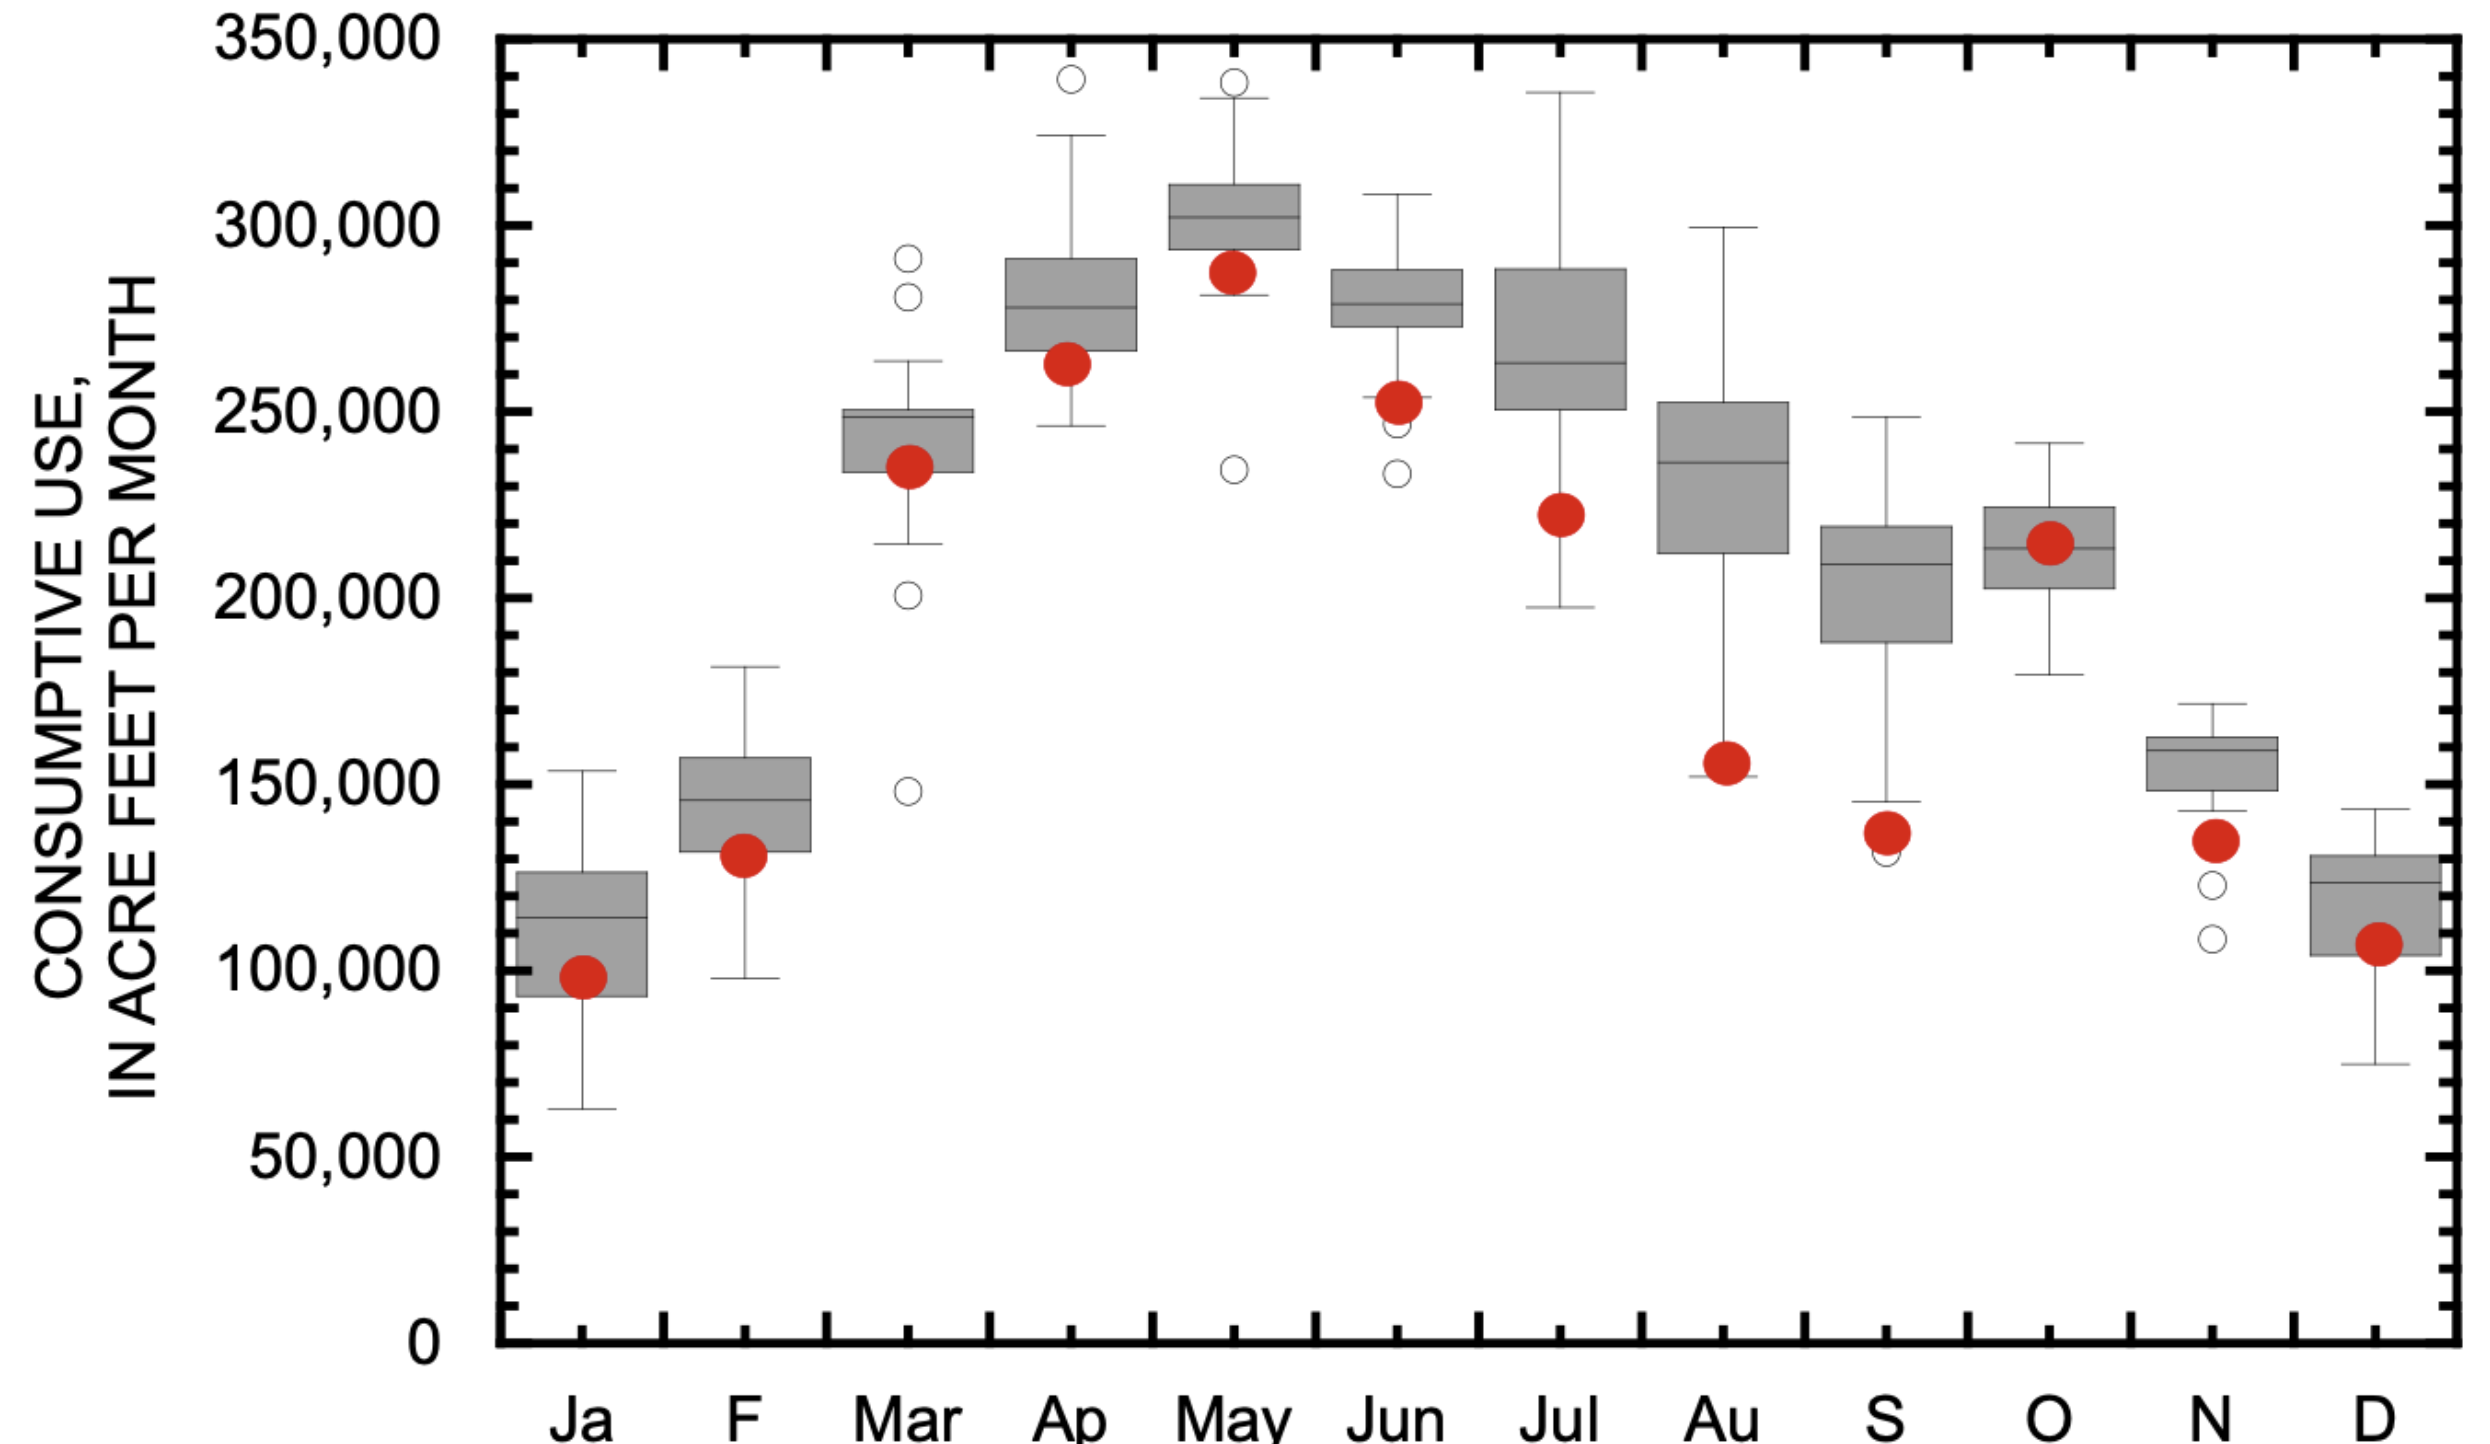
Reductions in consumption during the past few years have been accomplished primarily by reduced water use between June and September when alfalfa and grass hay are the primary crops. These reductions are reflected in Figure 5 where red dots are the average monthly water use since 2024. Red dots plot below the grey boxes of the IQR in June, July, August, and September, demonstrating that recent water use in these months has been significantly less than typical since 2010. In contrast, recent water use between December and May has been within or slightly less than the IQR.
Agricultural use of mainstem Colorado River water in Arizona
We estimated agricultural use of mainstem Colorado River water in Arizona by subtracting the total diverted by the CAP from the total use in Arizona. This remainder includes all the agricultural uses along the Colorado River as well as a small amount used by the City of Yuma, other towns along the river, and military bases.²³
The monthly pattern of water use is similar to the monthly pattern by the IID. The smallest uses are between November and February (Fig. 7). Consumptive use increases in March and is highest between April and August.
Reductions in water use by these Arizona growers have been more modest than by IID. Recent average use has been somewhat less than the typical range between April and July and has been within the typical range in other months, except for November when there was significant precipitation near Yuma in 2025.
Management and Policy Implications
Consumptive water use of mainstem water in the Lower Basin has been less than 7.5 maf/yr in every year but one since 2010. Since 2023 including forecast use in 2026, this reduction ranged between 1.4 and 1.7 maf/yr. The Lower Basin states have reduced water use comparable to the initial targets for Lower Basin shortages described in the recently released ROD24 and Operating Guidelines for 2027 and 2028.25 Thus, the good news is that the initial shortage goals of the FEIS have been achieved in recent years.
These savings have been achieved by large reductions in use by the CAP (Fig. 3) and by reduced agricultural water use in summer by IID (Fig. 6) and non-CAP water users in Arizona (Fig. 7). These reductions in agricultural water use have not resulted in changes of the amount of water consumed in winter when garden crops are grown.
The ROD allows for potentially large Lower Basin shortages of up to 3 maf/yr and potentially more in the event that Basin runoff continues to be low and reservoir live storage drops to critical levels. We placed these potential shortages in perspective by summing the smallest monthly use in each Lower Basin state since 2010 even though these months of smallest use did not occur in the same year. In some cases, the smallest water use was not due to significant water conservation but to unusually rainy conditions when demand for supplemental irrigation water was low, such as in November 2025. In other words, there is no historical experience with implementing the annual sum of these smallest monthly uses, because the smallest monthly uses did not occur in the same year.
Nevertheless, summing the lowest monthly use in each state provides perspective to the magnitude of the proposed 3 maf/yr shortages. The summed value of smallest monthly uses yields a potential minimum annual Lower Basin use of 5.03 maf/yr for the three Lower Basin states (Table 2). Although many of the months of smallest use occurred between 2022 and 2026, some were unique months of very low use in the 2010s. There is no historical analogy for imposition of the largest Lower Basin shortages envisioned by the recently released ROD and 2027-28 Operating Guidelines. [ed. emphasis mine]

CONCLUSION
The analyses summarized in this paper demonstrate that agricultural water use that supports winter garden crop production has not changed despite recent reductions in annual water use by IID or by non-CAP water users in Arizona. To date, water use by IID and by non-CAP water users in Arizona has been reduced in summer when garden crops are not grown. In times of acute water shortage, it is likely that continued and additional water savings can be achieved by reductions in irrigation of field crops in summer, without causing shortages to garden crop irrigation in the winter.
It is notable, however, that summing the lowest monthly water use in each state since 2010 results in a theoretical reduction from the Lower Basin allocation of 7.5 maf/yr of approximately 2.5 maf/yr, less than the maximum potential Lower Basin shortage envisioned in the recently released ROD. Our calculation of a theoretical shortage is based on summing the smallest use in each month between 2010 and 2026, and these months are not all in the same year. In some cases, the lowest use resulted from unusually large precipitation that reduced irrigation demand, rather than explicit conservation efforts.
The Priority Shortage Allocation Model utilized in the FEIS distributes shortages among the Lower Basin states in a much different manner than the way shortages have been achieved in the past.26 Tabulating the historical minimum monthly uses demonstrates that achieving the 3 maf/yr reductions described in the FEIS and ROD would be very difficult and is without historical precedent. Implementation of such large shortages would likely require new management policies, including compensated fallowing, permanent retirement of irrigated acreage and corresponding water rights, and unprecedented investment in increased irrigation efficiency.
We recognize that our theoretical comparison of minimum monthly uses since 2010 in no way captures the economic dislocation and secondary impacts that might result from implementing such shortages now. A full economic analysis of the impacts of the largest potential Lower Basin reductions described in the FEIS and the ROD is critical for understanding the consequences of significant reductions in water use in the Lower Basin. That type of analysis is beyond our expertise. Nevertheless, we recognize the importance of such an analysis, and we recognize the real-world distress that such large reductions of use might cause.
1 Center for Colorado River Studies, Utah State University, former Chief, Grand Canyon Monitoring and Research Center.
2 Getches-Wilkinson Center, Univ. of Colorado Law School, former US Commissioner, Upper Colorado River Commission, former Assistant Secretary for Water and Science, US Dept. of the Interior.
3 Retired General Manager, Colorado River Water Conservation District.
4 Kyl Center for Water Policy, Arizona State University, former Director, Phoenix Water Services.
5 Staff Attorney, Utton Transboundary Resources Center, University of New Mexico.
6 FEIS is available at https://www.usbr.gov/ColoradoRiverBasin/post2026/final-eis/index.html. ROD is available at https://www.usbr.gov/ColoradoRiverBasin/post2026/decision-doc/P26_RecordofDecision_Final.pdf.
7 All annual data in this paper are calendar year. 2024 is the most recent year that consumptive uses and losses data are available for the entire Basin.
8 Richter et al., 2024, New water accounting reveals why the Colorado River no longer reaches the sea. Communications Earth & Environment 5:134. available at https://www.nature.com/articles/s43247-024-01291
⁹ Upper Basin state uses in Table 1 do not include state reservoir evaporation. Total major and minor state reservoir evaporation is listed separately in Table 1. Colorado River Storage Project (CRSP) reservoir evaporation is evaporation from Blue Mesa, Morrow Point, Flaming Gorge, and Lake Powell reservoirs. Source of Upper Basin data: J. Prairie, Upper Colorado Basin Research and Modeling Group Chief, Bureau of Reclamation. Source of Lower Basin state uses: Reclamation. 2025. Water use report: Arizona, California, Nevada, calendar year 2024. Source of mainstem reservoir evaporation (Mead, Mohave, Havasu) data: S. Tighi, Hydrologist, Reclamation, Lower Colorado Region. Evaporation at Senator Wash and diversion dams estimated at 28,000 af.
10 Department of the Interior, August 2026, Operating Guidelines: Colorado River Guidelines for Coordinated Operations of Lake Powell and Lake Mead, Operating Years 2027 and 2028 (2027-28 Operating Guidelines), available at https://www.usbr.gov/ColoradoRiverBasin/post2026/decision-doc/2027-2028OperatingGuidelines_Final.pdf. We note that these Operating Guidelines provide for 1.25 maf/yr of shortage, allocated among the Lower Basin states as previously proposed: 760,000 af/yr in Arizona, 440,000 af/yr in California, and 50,000 af/yr in Nevada, The distribution of shortages greater than 1.25 maf/yr is not specified but would presumably be subject to consultation. See 2027-28 Operating Guidelines at 5.3.A. The ROD allows for the development of different methods of shortage allocation. See ROD at 5.
¹¹ Colorado River Water Accounting and Water Use Report: Arizona, California, and Nevada, available at https://www.usbr.gov/lc/region/g4000/wtracct.html.
¹² Lower Colorado River Water Accounting – Actual Water Use and Official Water Use Forecast, both available at https://www.usbr.gov/lc/region/g4000/wtracct.html. Throughout this paper, we refer to the forecast for 2026 that was made on September 1, 2026. The forecast is frequently revised.
¹³ There is no significant water use in the Grand Canyon.
14 Average Lower Basin consumptive use between 2010 and 2025 was 6.880 maf/yr.
15 Reclamation, Lower Colorado River Basin, available at https://www.usbr.gov/lc/region/g4000/hourly/forecast.pdf.
16 Average use between 2010 and 2022 was 4.326 maf/yr. Average use between 2023 and (forecasted) 2026 will be 3.764 maf/yr.
17 Average use between 2010 and 2022 was 2.600 maf/yr. Average use between 2023 and (forecasted) 2026 will be 2.290 maf/yr.
18 Average use between 2010 and 2022 was 925,000 af/yr. Average use between 2023 and (forecasted) 2026 will be 804,000 af/yr.
19 Average use between 2010 and 2022 was 2.590 maf/yr. Average use between 2023 and (forecasted) 2026 will be 1.930 maf/yr.
20 IID used 2.187 maf in 2025, 2.312 maf in 2024, and is forecast to use 2.242 maf in 2026. Median use between 2010 and 2026 was 2.546 and use in 50% of the years of that period was between 2.481 and 2.558 maf/yr.
21 Imperial Irrigation District, 2025, written communication, Monthly crop acreage summary, 2011-2025.
22 Total net area of crops in 2025 was approximately 350,000 acres.
23 Forecast use in 2026 for Bullhead City, Lake Havasu City, Parker, Yuma, U.S. Army Yuma Proving Grounds, and the U.S. Marine Corps Air Station Yuma is 35,000 af.
24 Department of the Interior, August 2026, Record of Decision, Decision Framework for Colorado River Guidelines: Coordinated Operations of Lake Powell and Lake Mead (2027-2036), available at https://www.usbr.gov/ColoradoRiverBasin/post2026/decision-doc/P26_RecordofDecision_Final.pdf.
25 Department of the Interior, August 2026, Operating Guidelines: Colorado River Guidelines for Coordinated Operations of Lake Powell and Lake Mead, Operating Years 2027 and 2028 (2027-28 Operating Guidelines), available at https://www.usbr.gov/ColoradoRiverBasin/post2026/decision-doc/2027-2028OperatingGuidelines_Final.pdf. We note that these Operating Guidelines provide for 1.25 maf of shortage in each year, allocated among the Lower Basin states as previously proposed: 760,000 af in Arizona, 440,000 af in California, and 50,000 af in Nevada. The distribution of shortage greater than 1.25 maf/yr is not specified but would presumably be the subject of consultation. See 2027-28 Operating Guidelines at 5.3.A. The ROD allows for the development of different methods of shortage allocation. See ROD at 5.
26 See FEIS Appendix C, Shortage Allocation Model and Alternative Distribution Model Documentation, at C.4.2. However, the ROD specifies that other methods of shortage allocation may be developed. ROD at 5.
