Rio Grande, looking south near Cole Park. The Alamosa Riverfront Project is among several that received funding last week under the 2022 Inflation Reduction Act. Credit: The Citizen
Conservationists focused on the Rio Grande Basin signal it as an initial win in a battle for federal dollars to address the impacts of drought and the need for a sustainable water supply.
They’ve seen how the federal government has kicked into gear to address the same issues on the Colorado River Basin, and have wondered why the Rio Grande Basin largely has been ignored.
Until now.
The U.S. Department of Interior and Bureau of Reclamation announced last week in the final days of the Biden Administration a $24.97 million award to support water conservation and habitat restoration efforts in the headwaters of the Rio Grande.
It’s a drop in the bucket compared to the billions that have been awarded to projects on the Colorado River, but it’s a start.
“Today’s announcement provides a critical down payment that will make the headwaters of the Rio Grande better prepared to handle the ongoing impacts of drought, while supporting state and local efforts to sustainably manage water supplies for future generations,” said Alexander Funk, Director of Water Resources, Theodore Roosevelt Conservation Partnership.
The money came through the 2022 Inflation Reduction Act (IRA) and was among the final announcements by the Biden Administration of funding awarded through the federal legislation.
The significance of that is nobody in the agriculture, conservation, and water world knows if the incoming Trump Administration will carry on with the Inflation Reduction Act, or if that particular federal legislation and the $369 billion approved by Congress falls to the wayside.
“We’re shocked we got anything,” said Amber Pacheco of the Rio Grande Water Conservation District and member of the Rio Grande Basin Roundtable. She described a rush at the end to send to the Bureau of Reclamation “shovel-ready” projects that could earn IRA funding.
“It was a ‘quick overnight, send some projects that we can fund,’” said Pacheco.
Rio Grande and Pecos River basins. Map credit: By Kmusser – Own work, Elevation data from SRTM, drainage basin from GTOPO [1], U.S. stream from the National Atlas [2], all other features from Vector Map., CC BY-SA 3.0, https://commons.wikimedia.org/w/index.php?curid=11218868
Out of the award comes funding for a variety of projects in the San Luis Valley as well projects for the middle Rio Grande in New Mexico. Overall, $18 million will go toward Rio Grande Basin projects in Colorado and $7 million for Rio Grande restoration efforts in New Mexico.
The San Luis Valley and Conejos Water Conservancy Districts, the Rio Grande Water Conservation District and the Rio Grande National Forest in southern Colorado are among the eight recipients selected under one cooperative agreement to receive $24.9 million for several drought resiliency activities in the Upper Rio Grande Basin, the Bureau of Reclamation said in announcing the money.
For the Valley, those projects will include the Alamosa Riverfront Restoration project; Rio Grande Reservoir Low Flow Valve; Pine River Weminuche Pass Ditch Turnback Structure; Lower Conejos River Restoration Project; Platoro Reservoir Restoration and Wildfire Risk Mitigation Project – Phase 1; Saguache Creek Multi-benefit Restoration at Upper Crossing Station; and Rio Grande Confluence Restoration Project, among others.
“This announcement shows that when Colorado and New Mexico work together, big things can help that benefit fish and wildlife, support local economies, and tackle some of the region’s most pressing water challenges,” said Funk.
“The Rio Grande is the underpinning that supports the economic and ecological health of the region. This funding allows conservation partners to critically address and relieve the challenges this habitat and community have experienced from long-term drought and sustainability insecurity,” said Tracy Stephens, senior specialist for riparian connectivity at The National Wildlife Federation. “We applaud the Bureau of Reclamation’s investment and recognition of the importance of riparian health and habitat connectivity. This funding is an important step forward in a collective effort to achieve well-connected and functional riparian corridors to protect the wellbeing of people, plants, and wildlife in the Upper Rio Grande.”
Screen shot from the Vimeo film, “Rio Grande Headwaters Restoration Project: Five Ditches,” https://vimeo.com/364411112
● Researchers used NASA satellite data to analyze the growth rates of over 60,000 fires in the contiguous U.S. from 2001-2020
● Results show fast-growing fires caused 88 percent of fire-related damages in the U.S. between 2001-2020 despite representing less than 3 percent of fires on record during that time.
Fast-growing fires were relatively rare in the United States between 2001-2020, yet they were responsible for nearly 90 percent of fire-related damages, according to a new study published in Science and featured in a new episode of PBS Weathered. These wind events with fire in them send embers far ahead of advancing flames, jump over rivers and highways and rapidly ignite homes. These fast fires overwhelm suppression response. The groundbreaking research relied on new remote sensing tools and shows these fires are getting faster in the Western U.S., increasing the risk for millions of people, and highlighting the actions we need to take before fire comes. “We hear a lot about megafires because of their size, but if we want to protect our homes and communities, we really need to appreciate and prepare for how fast fires move,” said Jennifer Balch, fire scientist and the lead author of the study. “Speed matters not only for understanding how fires evolve but also for keeping people safe.” NASA worked with Navteca to create scientifically accurate, time-based animations of several fast fires, including:
The East Troublesome fire, which destroyed hundreds of homes in and around Grand Lake in the Colorado Rockies, raced over 18 miles in a single day and jumped the barren Continental Divide,
The 2020 Labor Day fires in Oregon and Washington, where a statewide 2,000 foot deep river of wind flowed down from the interior of North America, knocking down power lines and fanning existing fires into rapidly growing fires that burned communities across Oregon,
The Marshall Fire, which destroyed more than 1,000 homes in Boulder County, Colorado, in December 2021. The fire burned less than 6,100 acres but grew quickly due to a combination of dry conditions and high winds. Less than an hour after the fire was reported, it had spread to a town 3 miles away, forcing tens of thousands of people to evacuate, and
The Lahaina Fire which burned 2,170 acres, destroyed 2,285 structures (mostly residential) and killed 98 people. The fire was driven by sustained winds of 30 mph with gusts doubling that.
Fast fires grew more than 4,000 acres (more than 6 square miles) in a single day. The analysis revealed a staggering 250 percent increase in the average maximum growth rate of the fastest fires over the last two decades in the Western U.S. U.S. Fire Administrator Dr. Lori Moore-Merrell reflected: “This research helps us focus our attention on what causes the most loss and what we can do to prepare before fire comes to make us savable.” Fast fires accounted for 88 percent of the homes destroyed between 2001 and 2020 despite only representing 2.7 percent of fires in the record. Fires that damaged or destroyed more than 100 structures exhibited peak fire growth rates of more than 21,000 acres (more than 32 square miles) in a single day. The work also highlights a critical risk assessment gap. At the national level, wildfire risk models include parameters for area burned, intensity, severity, and probability of occurrence, but they do not incorporate growth rate or other measures of fire speed. Government agencies and insurance companies that use these models are therefore missing vital information about how fires spread, which homeowners could use to better protect themselves and their communities. “When it comes to safeguarding infrastructure and orchestrating efficient evacuations, our satellites and earth observations are telling us that the speed of a fire’s growth is a dominant factor in home and community loss.” Dr. Falkowski, Director of NASA’s wildland fire program said.
The East Troublesome fire as it tore through the Trail Creek Estates subdivision on Oct. 21, 2020. (Brian White, Grand Fire Protection District)
For the last several years, Utah’s lawmakers and environmental officials have made getting water to the Great Salt Lake a priority, through policies like letting the state lease water rights from farmers, or installing new equipment to measure water flows.
Now, a new report details the progress and impacts some of those policies are having, calling the work done so far “meaningful.”
On Tuesday, the Great Salt Lake Strike Team issued its 2025 data and insights summary, released just in time for lawmakers to review for the upcoming General Legislative Session, which starts next week.
The Great Salt Lake hit a historic low in 2022, bottoming out at 4,188.5 feet. Lawmakers and state officials prioritized the lake that following legislative session — then the winters of 2023 and 2024 brought above-average snowfall, causing the lake levels to rebound slightly. On Wednesday, both the north and south arms hovered around 4,192 feet, still several feet below the “ecologically healthy” level of 4,198 feet.
Formed in 2023, the Great Salt Lake Strike Team is made up of researchers from the University of Utah and Utah State University, working with officials from the Utah departments of Natural Resources, Agriculture and Food, Environmental Quality and more.
The data-heavy 28-page report released this week outlines everything from the economic benefit of the Great Salt Lake, to locations of the dust “hotspots” on the dry lakebed that pose a health risk to the Wasatch Front, to models for future scenarios, and more.
The shores of the Great Salt Lake near Antelope Island are pictured on Tuesday, May 21, 2024. (Photo by Spenser Heaps for Utah News Dispatch)
The report also details some of the progress made in the last year that delivered more water to the lake. Consider this:
More than 288,000 acre-feet of water has been approved to flow to the lake, through users either leasing or donating their water right to the state. That’s enough water to fill both Jordanelle and Rockport reservoirs, although the report notes that’s just what’s been approved, and doesn’t represent the actual amount of water that’s been delivered.
The Legislature is spending $1 million in one-time funds and $1 million in annual funds to install measurement infrastructure so the Utah Division of Water Rights can see exactly how much water is flowing to the lake. An additional $3 million from the U.S. Bureau of Reclamation and U.S. Geological Survey is also going toward measurement equipment.
In addition to funding for water monitoring, state and federal governments have thrown nearly $100 million at the lake for various projects, including $50 million from the U.S. Bureau of Reclamation for conservation; $5.4 million from the state for wetland conservation; $22 million from the state for Great Salt Lake water infrastructure projects; $15 million from the state to the Great Salt Lake Commissioner’s Office to help lease water; and $1.5 million to start a state-funded study exploring ways to deliver more water from Utah Lake to the Great Salt Lake.
Compass Minerals and Morton Salt, which both operate on the lake, donated a total of 255,298 acre-feet of water to the state. Compass Minerals is also relinquishing about 65,000 acres of leased land to the state for conservation purposes.
Lawmakers in 2024 passed a number of bills to help the lake, including tightened regulations and taxes on mineral extraction, allowing agricultural water users to sell leased water and restricting the use of overhead sprinklers for new government construction in the Great Salt Lake Basin.
There have also been some environmental wins. Brine shrimp populations are rebounding, with a 50% increase in egg numbers compared to last year. American white pelicans returned to their nesting sites on the lake. And the state removed 15,600 acres of phragmites, an invasive plant.
The report notes that the state has made “meaningful progress.” And while it clarifies that the report is purely data-focused and doesn’t make policy recommendations, it does lay out “potential policy levers.”
An American avocet is pictured at the Great Salt Lake near Antelope Island on Tuesday, May 21, 2024. (Photo by Spenser Heaps for Utah News Dispatch)
That includes greater incentives for water leasing. The state made several new options available for water right holders, including letting farmers lease water for a portion of the year, water banking (which gives water users more flexibility over leasing agreements) and applications allowing users to quantify water saved through optimization projects.
But according to the report, the state hasn’t yet received any applications for these three programs.
The Utah Legislature also recently subsidized the installation of secondary water meters, so water districts know how much they’re using — those meters are often associated with water savings. The report recommends water districts in the Great Salt Lake Basin donate or lease that saved water for the lake.
“All indications demonstrate that delivering more water to the lake is a far more cost-effective solution than managing the impacts of a lake at a perpetually low level,” said Brian Steed, the co-chair of the strike team and Great Salt Lake Commissioner. “We can invest time and financial resources now or pay much later. Fortunately, we have great data and a balanced and workable plan to succeed.”
Sunset from the western shore of Antelope Island State Park, Great Salt Lake, Utah, United States.. Sunset viewed from White Rock Bay, on the western shore of Antelope Island. Carrington Island is visible in the distance. By Ccmdav – Own work, Public Domain, https://commons.wikimedia.org/w/index.php?curid=2032320
Farm communities on the Eastern Plains, under the gun to deliver water to Kansas and Nebraska, are poised to permanently retire 17,000 acres of land, with the help of $30 million in state and federal funding.
Creating a balance of water that’s taken from aquifers and water that replenishes aquifers is an important aspect of making sure water will be available when it’s needed. Image from “Getting down to facts: A Visual Guide to Water in the Pinal Active Management Area,” courtesy of Ashley Hullinger and the University of Arizona Water Resources Research Center
From Wray, to Yuma to Burlington, growers are being paid to permanently shut off irrigation wells linked to the Republican River to ensure the vital waterway can deliver enough water to neighbors to the east, as required under the Republican River Compact of 1943.
As of this month, ranchers had already retired 10,000 acres under the program, and the rest will be set aside in coming months.
By 2029, the region must retire an additional 8,000 acres, as required under a compact resolution signed in 2016, for a total of 25,000 acres, according to Deb Daniel, general manager of the Republican River Water Conservation District, which is overseeing the initiative. This is occurring in an area on the south fork of the river.
According to Colorado State University it is one of the largest dry-ups of irrigated agricultural lands in the West.
The dry-up has allowed Colorado to meet a critical deadline with Kansas, demonstrating that it was making progress on the goal.
Colorado’s Republican River Basin. Credit: State of Colorado.
“We did it,” said Daniel. But more work remains.
The 2022 funding came under the American Rescue Plan Act, the COVID-relief program that Congress approved giving states hundreds of millions of dollars to buffer the effects of the pandemic.
Through that program, Colorado lawmakers approved $30 million to the Republican and $30 million to the Rio Grande Basin as well for a similar program.
This year, the Republican Basin will receive another $6 million in state funding to continue paying farmers to permanently shut off wells.
“Agriculture is the economic driver for the northeastern counties of Colorado. This is a difficult situation for the producers,” said Jason Ullmann, state engineer with the Colorado Division of Water Resources. “I know this work hasn’t been easy, and more must be done. I applaud the Republican River Water Conservation District for their major efforts to reach this deadline,” he said in a statement.
A new analysis shows a nearly 30% decline in Colorado’s irrigated lands in the last 25 years, driven in part by the state’s legal obligations to deliver water across state boundaries, as in the Republican Basin. Other factors include declining river flows due to climate change and drought, and the dry-up of farmlands by fast-growing cities.
Daniel said water officials hope they can continue to pay farmers to permanently retire land and to do so in a way that doesn’t cripple the regional economy.
“We need time to let these communities adjust, to adapt to having less irrigated agriculture. As these wells go down, our communities are adjusting, but most of the time, unless they have other industries, the communities just go away,” Daniel said.
Beavers have constructed a network of dams and lodges on this Woody Creek property. Pitkin County funded a two-year beaver inventory in the headwaters of the Roaring Fork and its tributaries. Credit: HEATHER SACKETT/Aspen Journalism
Thanks to Pitkin County, local land managers now have more information about beavers and their habitat, which could eventually lead to projects aimed at improving stream conditions.
Over the summers of 2023 and 2024, technicians with the U.S. Forest Service covered roughly 353,000 acres of land throughout the headwaters of the Roaring Fork River and its tributaries, surveying 296 randomly chosen sites on 66 streams for beavers, their dams and lodges or other signs they had once been there like chewed sticks. The surveys, which were funded with $100,000 from Pitkin County Healthy Rivers, found that 17% of the sites were currently occupied by beaver, 34% of the sites had some signs of beaver and 37% of sites had evidence of past beaver occupation.
Clay Ramey, a fisheries biologist with the White River National Forest, presented the findings of the two-year inventory to the Healthy Rivers board at its regular meeting Thursday evening.
“It would seem that while beaver were once common there, the vegetation has shifted from aspen to conifer and therefore that area doesn’t appear to have a lot of potential for beaver in its current state,” the inventory report reads.
Another interesting finding from the inventory is that there is less willow found in areas where cattle graze. But what that means for beavers is unclear.
“The beavers are occupying grazed areas and ungrazed areas basically to the same extent,” Ramey said. “So there was nothing to suggest that beavers are avoiding or being excluded from grazed areas.”
Samantha Alford, right, and Stephanie Lewis, technicians with the U.S. Forest Service, measure the slope and width of Conundrum Creek in summer 2023. A two-year inventory of beavers in the headwaters of the Roaring Fork watershed recorded where beavers currently live and where they lived in the past. Credit: HEATHER SACKETT/Aspen Journalism
The information gleaned from the inventory will now help the Forest Service decide where to do prescribed burns and stream restoration projects in an effort to create more and better beaver habitat. Ramey said the Forest Service is undergoing a National Environmental Protection Act process for projects on Fourmile Creek and Middle Thompson Creek. Both creeks had evidence of extensive use by beavers in the past, but Fourmile in particular is currently under-utilized by the animals, with only 3% of sites currently occupied by beavers. Growing more willows may entice beavers back.
Pitkin County Healthy Rivers, whose mission includes improving water quality and quantity, has been working over the past few years to educate the public about the benefits to the ecosystem of having North America’s largest rodent on the landscape. Funding the Forest Service beaver inventory is part of the organization’s “Bring Back Beavers” campaign.
Prized for their pelts by early trappers and later seen as a nuisance to farmers and ranchers, beavers were killed in large numbers and their populations have still not fully recovered. But there has been a growing recognition in recent years that beavers play a crucial role in the health of ecosystems. By building dams that pool water, the engineers of the forest can transform channelized streams into sprawling, soggy floodplains that recharge groundwater, create habitat for other species, improve water quality, and create areas resistant to wildfires and climate change.
Healthy Rivers Board Chair Kirstin Neff said the ultimate driver of the organization’s commitment to bringing back beavers is an interest in the health of the Roaring Fork watershed.
“Our goal is to get good habitat work done on the ground,” Neff said. “The things we’re concerned about are water availability for wildlife and downstream users and things like wildfire risk.”
Aspen Journalism, which is solely responsible for its editorial content, is supported by a grant from the Pitkin County Healthy Community Fund.
This story is provided by Aspen Journalism, a nonprofit, investigative news organization covering water, environment, social justice and more. Visit aspenjournalism.org.
The January NRCS Rio Grande runoff forecast is lousy: a mid-point forecast of 65 percent of average at Otowi (upstream of Albuquerque) and 37 percent of average at San Marcial (downstream of Albuquerque). Based on the current snowpack, I expected worse. Forecaster Karl Wetlaufer, in the email distributing the numbers, explains:
Wetlaufer also reminds us that there’s a lot of snowpack season ahead of us. The numbers above are the median forecast. The one-in-ten wettest side (10 percent exceedence) is ~115% of average at Otowi, and the one-in-ten dry (90 percent exceedence) is less than 20% of average.
Red Water Pond Road Community leader, Larry King, addresses plans to relocate the Quivera Mine Waste Pile that is located about 1,000 feet from the closest residence. Shayla Blatchford
As a child, herding her grandmother’s sheep, Teracita Keyanna unknowingly wandered onto land contaminated with radioactive waste from three abandoned uranium mine and mill waste sites located near her home on the Navajo Nation.
Keyanna and other Diné citizens have been living with the consequences of uranium mining near the Red Water Pond Road community since the 1960s. But now, uranium waste rock that has sat for decades at a Superfund site will finally be moved to a landfill off tribal land.
“This is a seismic shift in policy for Indigenous communities,” said Eric Jantz, an attorney for the New Mexico Environmental Law Center.
On Jan. 5, in a first-of-its-kind move, the Environmental Protection Agency signed an action memo to transport 1 million cubic yards of low-grade radioactive waste from the Quivira Mining Co. Church Rock Mine to a disposal site at the Red Rock Regional Landfill. The Northwest New Mexico Regional Solid Waste Authority owns and operates the landfill, which is located about 6 miles east of Thoreau, New Mexico.
“I feel like our community has finally had a win,” Keyanna said. She is a member of the Red Water Pond Road Community Association, a grassroots organization made up of Diné families that have been advocating for the waste removal for almost two decades. “It’ll help the community heal.”
Companies extracted an estimated 30 million tons of uranium ore on or near the Navajo Nation from 1944 to 1986, largely to fuel the federal government’s enormous nuclear arsenal. When the mines were abandoned in the 1980s, the toxic waste remained. Today, there are hundreds of abandoned mines in plain sight on the Navajo Nation, contaminating the water, air and soil. Altogether, there are an estimated 15,000 uranium mines across the West — 1,200 of them on the Navajo Nation alone — with the majority located in the Four Corners region.
The impact of all this mining on Diné communities has been devastating. A 2008 study found uranium contamination in 29 water sources across the Navajo Nation, while other studies show that people living near waste sites face a high risk of kidney failure and various cancers.
At Quivira, the cleanup is set to begin in early 2025 and will continue for six to eight years, according to an EPA news release. The permitting process, which will provide opportunity for public comment, will be overseen by the New Mexico authority that manages the proposed waste site and is responsible for its long-term safety monitoring.
Mine Waste Area with Limited Vegetation. Photo credit: EPA
The EPA had considered multiple options for waste remediation. But for years, Red Water Pond Road advocates and other local organizations continually pushed it to simply remove the waste, a course of action that the EPA has never taken before, even though the Navajo Nation has repeatedly called for the federal government to move all uranium waste from Diné tribal land.
Throughout the Navajo Nation, said Jantz, “prior to this decision, EPA’s primary choice in terms of remediation of mine was to bury the piles under some dirt and plant some grass seeds on top, called cap in place.” But studies have shown that this approach is not effective at containing radioactive waste in the long term, he said.
The agency took a similar approach when addressing the other uranium waste in the Church Rock area. In 2013, the EPA and the Nuclear Regulatory Commission, which oversees uranium mine-waste cleanup, dumped 1 million cubic yards of waste from the Northeast Church Rock Mine — a different waste site, roughly 3 miles from the Quivira Mine — on top of existing tailings located half a mile from the Red Water Pond Road communities.
But the EPA plans to handle the Quivira Mine’s waste differently, placing it in geoengineered disposal cells with a groundwater leak protection system after it is moved off-site, an approach that Jantz called “state-of-the-art.”
The Quivira Mine cleanup is part of the 2014 Tronox settlement, which provided $5.15 billion to clean up contaminated sites across the United States. The settlement allocated $1 billion of those funds to clean up 50 uranium mines across the Navajo Nation.
There is a lot more to be done, said Susan Gordon, coordinator for the Multicultural Alliance for a Safe Environment, a grassroots organization led by uranium-impacted communities. Hundreds of abandoned mines pepper the Navajo Nation, and the EPA has not formulated a broader plan to clean up the majority of them. Funding is also an issue, she added.
What the EPA’s decision means for the future of uranium mine waste remediation is unclear. Under other circumstances, Jantz said that the decision would signal a sea change for the EPA’s policy of removing waste from the Navajo Nation. But the incoming Trump administration has not indicated its policy on hazardous waste disposal.
The fires burning in the Los Angeles area are a powerful example of why humans have learned to fear wildfire. Fires can level entire neighborhoods in an instant. They can destroy communities, torch pristine forests and choke even faraway cities with toxic smoke.
Over a century of fire suppression efforts have conditioned Americans to expect wildland firefighters to snuff out fires quickly, even as people build homes deeper into landscapes that regularly burn. But as the LA fires show, and as journalist Nick Mott and I explored in our book “This Is Wildfire: How to Protect Your Home, Yourself, and Your Community in the Age of Heat” and 2021 podcast “Fireline,” this expectation and our society’s relationship with wildfire need to change.
Over time, extensive fire suppression, home construction in high fire-risk areas and climate change have set the stage for the increasingly destructive wildfires we see today.
The legacy of fire suppression
The way the U.S. deals with wildfires today dates back to around 1910, when the Great Burn torched about 3 million acres across Washington, Idaho, Montana and British Columbia. After watching the fire’s swift and unstoppable spread, the fledgling U.S. Forest Service developed a military-style apparatus built to eradicate wildfire.
The U.S. got really good at putting out fires. So good that citizens grew to accept fire suppression as something the government simply does.
Today, state, federal and private firefighters deploy across the country when fires break out, along with tankers, bulldozers, helicopters and planes. The Forest Service touts a record of snuffing out 98% of wildfires before they burn 100 acres (40 hectares).
One consequence in a place like Los Angeles is that when a wildfire enters an urban environment, the public expects it to be put out before it causes much damage. But the nation’s wildland firefighting systems aren’t designed for that.
Wildland firefighting tactics, such as digging lines to stop a fire from spreading and steering fires toward natural fuel breaks, don’t work in dense neighborhoods like Pacific Palisades. Aerial water and retardant drops can’t happen when high winds make it unsafe to fly. At the same time, the region’s municipal firefighting forces and water systems weren’t designed for this sort of fire – a conflagration engulfing entire neighborhoods quickly overwhelms the system.
Long ago, Southern California’s scrub-forest ecosystems would periodically burn, limiting fuel for future fires. But aggressive fire suppression and inattention to urban overgrowth have left excessive, easy-to-ignite vegetation in many areas. It’s unclear, however, whether prescribed burning could have prevented this catastrophe.
This is primarily a people problem. People have built more homes and cities in fire-prone areas and done so with little regard for wildfire resilience. And the greenhouse gases released by decades of burning fossil fuels to run power plants, industries and vehicles have caused global temperatures to rise, compounding the threat.
The wildland-urban interface starts on the edges of cities where homes are built closer to forests and grasslands. Courtesy of Jessy Stevenson
Climate change and wildfires
The relationship between climate and wildfire is fairly simple: Higher temperatures lead to more fire. Higher temperatures increase moisture evaporation, drying out plants and soil and making them more likely to burn. When hot, dry winds are blowing, a spark in an already dry area can quickly blow up into dangerous wildfire.
Given the rise in global temperatures that the world has already experienced, much of the western U.S. is actually in a fire deficit because of the practice of suppressing most fires. That means that, based on historical data, we should expect far more fire than we’re actually seeing.
Fortunately, there are things everyone can do to break this cycle.
Prairie dogs emerge from their burrow in a colony on American Prairie in Montana. Prairie dogs, once one of the most abundant animals on the prairie, now occupy 2% of their historic range.Louise Johns/High Country News
The prairie dog caught in Trap 69 was angry. And who could blame her? After waking up in her burrow on a mid-September morning, she’d waddled innocently outside for a breakfast of mini marshmallows and carrots, only to find herself stuck in a wire cage and carried across the prairie. Then a pair of human hands had gripped her like a burrito while two more hands put a black rubber tracking collar around her neck.
The situation was worse than she realized: Prairie dogs are among the most maligned and persecuted animal species in the Western U.S. So maligned, in fact, that a 2020 survey in northern Montana found that well over half the area’s landowners believed prairie dogs should not live on public land.
To make matters even grimmer, this particular prairie dog had fleas. And those fleas could have been carrying the bacteria that causes plague — the Black Death. “It’s not great,” commented researcher Jesse Boulerice as he adjusted his gentle grip around her midsection.
The rodent responded by biting into Boulerice’s leather glove, hanging on with her two front teeth while researchers swiped a black streak of Clairol’s Nice’n Easy hair dye down her back.
Though black-tailed prairie dogs have a long-standing reputation as pests, their ingenious tunnel systems and industrious prairie pruning make them one of the West’s primary ecosystem engineers. Some researchers call them the “chicken nuggets of the prairie”; if a prairie species eats meat, it almost certainly eats prairie dogs. Without prairie dogs, black-footed ferrets would never survive outside zoos and breeding facilities, and we would have far fewer mountain plovers, burrowing owls, swift foxes, and ferruginous hawks.
Before 1800, an estimated 5 billion prairie dogs lived from Canada to Mexico, covering the West with underground apartment complexes that shifted over the centuries like sand dunes. The Lakota, Dakota and other Indigenous peoples of the prairie shaped and depended on the ecosystems prairie dogs created. Some relied on prairie dogs for nourishment during thin times, or used them as a ceremonial food.
Prairie dogs still survive in many of their historic territories: Black-tailed prairie dogs, known for their especially large, dense colonies, persist in isolated pockets of the prairie east of the Rocky Mountains from Canada to Mexico. White-tailed prairie dogs live in parts of Montana, Wyoming, Utah and Colorado. Gunnison’s prairie dogs eke out an existence in southern Colorado, and Utah prairie dogs live in, well, Utah. Mexican prairie dogs still hang on in small slices of northern Mexico. But many of these populations are too small to serve their ecosystems as they once did.
Within this familiar story of colonization and species decline, however, are more hopeful stories of creativity and adaptation: Researchers are using pedometer-like devices to map prairie dogs’ underground tunnels, remote-controlled badgers to understand prairie dog alarm calls and Kitchen-Aid mixers to craft solutions to deadly disease. After decades of restoration work by tribal wildlife managers, prairie dogs, black-footed ferrets, swift foxes and bison are once again roaming the Fort Belknap Indian Reservation in north-central Montana, one of the few places in the world where all four species coexist. Some private landowners, meanwhile, are finding ways to tolerate the rodents. Together, these researchers, managers and landowners are striving to conserve the West’s remaining prairie dogs and the prairie that depends on them.
Jesse Boulerice, research ecologist with the Smithsonian’s National Zoo and Conservation Biology Institute, inspects a prairie dog his team trapped at American Prairie in Montana. The researchers aim to better understand prairie dog movements. Louise Johns/High Country News
ONCE THE COLLARED prairie dog was returned to her Tru Catch wire cage to await release, Boulerice reached into the next trap in line.
Boulerice is part of a team from the Smithsonian’s National Zoo and Conservation Biology Institute that is collaring and tracking prairie dogs at American Prairie — formerly the American Prairie Reserve — in central Montana. Each collar measures the animal’s acceleration and angle; by triangulating with locations picked up by sensors posted on poles throughout the colony, researchers can determine where and how far the prairie dogs travel both above and below ground. The Clairol dye patterns provide one more way to tell who’s who in a colony of look-alikes.
Though other researchers have studied prairie dogs’ aboveground lives, no one really knows what they do underground. Satellite imagery can be used to track Arctic terns over Alaska or grizzly bears deep in the wilderness, but it can’t penetrate the Earth. Decades ago, researchers laboriously excavated a white-tailed prairie dog burrow in southern Montana, revealing features like “sleeping quarters,” hibernacula, and a “maternity area” — but such work is invasive and yields little data on the animals’ movements.
At American Prairie in September, the Smithsonian team was joined by researchers from Swansea University in Wales who had developed the tracking collars Boulerice used. The collars were originally designed to study penguins underwater, an environment similarly resistant to conventional satellite tracking.
Prairie dogs aren’t the only occupants of prairie dog burrows. The mazes of tunnels and rooms also provide shelter for black-footed ferrets, swift foxes and untold numbers of insects. Burrowing owls shimmy their puffball bodies into the tunnels, where they raise their chicks on the plentiful bugs. Prairie rattlesnakes, tiger salamanders, horned lizards and badgers use them, too.
And as climate extremes become more common aboveground, these burrows may become even more important.
“By creating tunnels, they’re also creating a thermal refuge,” said Hila Shamon, the director of the Smithsonian’s Great Plains Science Program and principal investigator of the colony-mapping project. “The prairie can be so hot in the summer or brutally, brutally cold in the winter. You don’t have any shade or place to hide from the cold … and conditions in the tunnel systems are consistent.”
Prairie dogs spend much of the day and all night in their burrows, living in family coteries composed of one male, three or four females and the year’s young. Their tunnel systems, which can extend across an area larger than a football field, are like bustling apartment complexes where every family has its separate unit. Residents periodically pop out of doors to grab food, gossip about the neighbors and scan for danger.
“In the prairie,” Shamon said, “there’s a whole world that’s happening beneath the ground that we can’t see. But it exists, and it’s very deep, and it’s important.”
Aboveground, the effect of prairie dogs on the landscape is more obvious. “Prairie dogs create an entirely novel habitat type,” said Andy Boyce, a Smithsonian research ecologist. “They graze intensely. They increase the forbs and flowering plants, and they clip woody vegetation. They will eat and nibble on a new woody plant until it tips over and dies.”
The landscape created by prairie dogs may look barren, but the reality is more nuanced. A healthy prairie isn’t an uninterrupted sea of grass; it’s made up of grass and shrubs, wetlands and wildflowers and even large patches of bare dirt that allow prairie dogs — and other species — to spot approaching predators.
Bison like to wallow in the dirt exposed by prairie dogs, and graze on the nutritious grass and plants that resprout after a prairie dog pruning. Mountain plovers and thick-billed longspurs frequently nest on the grazed surface of prairie dog towns. (Both birds have declined along with prairie dogs; the mountain plover has been proposed for protection under the Endangered Species Act.)
Prairie dog colonies may also provide other species with a home-alarm system. “You have 1,000 little pairs of eyeballs constantly searching for predators all around you and then vocalizing loudly when they see them,” Boyce said. To test this hypothesis, Boyce’s Ph.D. student Andrew Dreelin attached a taxidermied badger to a remote-controlled car and drove it near long-billed curlew nests in Montana prairie dog colonies. He then measured how nesting curlews responded to the badger with and without a warning from the prairie dogs.
Results are pending, said Dreelin, but he’s certain that “we’ve only just started to scratch the surface on the multifaceted ways that prairie dogs could shape the lives of birds on the prairie.”
A prairie dog is collared by Smithsonian scientists at American Prairie. Louise Johns/High Country News
IN EARLY OCTOBER, about 500 miles south of American Prairie, Colten Salyer also donned thick leather gloves to protect himself from an angry mammal’s teeth. Then he opened a cat carrier filled with paper shavings and a member of a species once considered extinct.
The black-footed ferret is North America’s only native ferret and one of only three ferret species in the world. And if there’s one thing black-footed ferrets need, it’s prairie dogs. They eat them almost exclusively, and they use their tunnels to live, hunt and reproduce, slipping in and out of burrows as they move like water across the landscape.
Captive-bred ferrets have now been released across the West. But to survive long-term, they need prairie dog colonies. And prairie dogs aren’t popular with their human neighbors.
Because they eat the same grass cows do. And they make holes.
“I was running to rope a yearling once, and I stood up in the saddle and was about to open my hand — and all of a sudden the horse’s front end disappeared,” said Salyer, a ranch manager in Shirley Basin who volunteered to help with the releases. His horse had sunk a hoof into a prairie dog hole, a misstep that sent Salyer tumbling to the ground.
Both Salyer and his horse were fine, and he shrugged after telling the story.But most ranchers have, or have heard, similar stories, many of which end with a valued horse breaking a leg. There’s no way to know how frequently horses injure themselves in burrows, but the stories spread as fast as a prairie fire.
What’s certain is that prairie dogs eat grass. Quite a bit of grass: A single prairie dog can devour up to 2 pounds of green grass and non-woody plants every week, according to Montana State University. For ranchers who use that vegetation to feed their cows, prairie dogs look like competition. Researchers, however, say the effects of prairie dogs on livestock forage are mixed. Black-tailed prairie dogs’ propensity to clip and mow, for instance, results in plants with higher fat and protein and lower fiber. “Across years, enhanced forage quality may help to offset reductions in forage quantity for agricultural producers,” a study published in 2019 by Rangeland Ecology and Management reported.
This uncertainty has led to some bureaucratic contradictions. The Wyoming Department of Agriculture labels prairie dogs as pest species and offers training in properly using pesticides to kill them; at the same time, the Wyoming Game and Fish Department lists the black-tailed prairie dogas a species of greatest conservation need.
Smithsonian ecologist Jesse Boulerice holds one of the tracking collars used to study prairie dogs at American Prairie. Louise Johns/High Country News
A collared prairie dog waits to be released. Louise Johns/High Country News
A collared prairie dog is released through a tube that researchers use to check that the sensors on the collars are working properly. Louise Johns/High Country News
Until the 1990s, said Randy Matchett, a Fish and Wildlife Service biologist in central Montana, prairie dogs were so despised in places like Phillips County, Montana, that the Bureau of Land Management produced maps of their colonies designed for sport shooters. Attitudes haven’t changed much: In 2020, 27 years after an initial survey of attitudes toward black-tailed prairie dogs and black-footed ferrets in Montana, researchers found that feelings about them had barely budged.
Matchett said that when he tells his Montana neighbors that only 2% of prairie dogs remain, a common attitude is: “What the hell’s the holdup getting rid of that last 2%?”
Chamois Andersen, a Defenders of Wildlife senior field representative, has spent decades working with landowners in prairie dog-rich places, and she’s persuaded some to allow researchers to survey their land for black-footed ferrets in exchange for funds for noxious weed removal. She speculates that younger generations of ranchers are more open to prairie dog conservation and to partnerships with public agencies and wildlife groups.
Matchett is less optimistic. Even the U.S. Forest Service and National Park Service, which together manage one of the largest black-footed ferret colonies in the world in South Dakota’s Conata Basin, poison some prairie dogs on federal land to prevent the population from moving onto private property.
Not all prairie dogs are equally reviled. White-tailed prairie dogs like those in Shirley Basin live at lower densities and tend to clip plants farther up the stems, making them less obvious to the casual observer. Landowners, as a result, are often more tolerant of them than their black-tailed cousins, said Andrew Gygli, a small-carnivore biologist for Wyoming Game and Fish.
Bob Heward, whose family started ranching in Shirley Basin more than a century ago, understands that a disliked species can also be useful.
He invites recreational shooters to target prairie dogs on his land, but he won’t use poison to kill the rodents because he knows they provide food for other species. Prairie dogs are a “nuisance,” he said, but they’re also as inevitable as the wind: “We’ve learned to live with them. They’ve been here longer than I have.”
THE MALE SWIFT FOX at the end of the trap line was chunky, at least by swift fox standards: Though he weighed only about 5 pounds, his belly was round beneath his fluffy fur. His black eyes carefully followed Smithsonian researcher Hila Shamon as she loaded him into the backseat of her four-door pickup, covering the trap with a blanket as she prepared to transport him from this ranch north of Laramie, Wyoming, to a new home on the Fort Belknap Indian Reservation in Montana.
Unlike black-footed ferrets, swift foxes can survive without prairie dogs, but when prairie dogs are scarce they suffer from the loss of food, Shamon said, and are deprived of the shelter they find in prairie dog burrows. So they, too, declined as prairie dogs were exterminated and prairie habitat was converted into cropland. By the early 1900s, they had disappeared from Canada, Montana, North Dakota, Nebraska, Kansas and Oklahoma.
But swift foxes still live in parts of the West — and in some places, their populations are being restored. For the last five years, Shamon and her team have trapped swift foxes in Wyoming and Colorado and trucked them to Fort Belknap. This rectangle of grassland, buttes and prairie breaks near the Canadian border is home to the Nakoda (Assiniboine) and A’aninin (Gros Ventre), both Great Plains peoples. Today, it is one of the only places in the world where prairie dogs, swift foxes, black-footed ferrets and bison co-exist.
Montana State Sen. Mike Fox (Gros Ventre), D, who served as Fort Belknap’s director of Fish and Wildlife from 1991 to 2001, oversaw early efforts to restore buffalo, swift foxes and black-footed ferrets to the reservation. The goal was to “create a steady, healthy population of native animals that were driven to extinction because of the different uses of the land,” he said. “Like when they started poisoning the prairie dogs off in the ’30s and ’40s and wiped out the ferrets that were native here, and the same with the swift fox. We want to make as complete an ecosystem as we can, along with the buffalo.”
The tribes worked with the Fish and Wildlife Service to reintroduce black-footed ferrets, and, with researchers at the Smithsonian, World Wildlife Fund and other organizations, to bring back the swift fox. The collaborators spent two years planning the swift fox capture and translocation, Shamon said, considering factors like habitat quality, community attitudes and the overall risk to a re-established population.
Swift foxes had already been reintroduced in parts of Alberta and Saskatchewan and on the Blackfeet and Fort Peck reservations. The reintroduction at Fort Belknap continued the tribes’ restoration efforts and added a possible point of connectivity for other populations.
A Smithsonian researcher inspects a prairie dog her team trapped at American Prairie, a nature reserve in north-central Montana. Louise Johns/High Country News
Tribal members living on and near the Fort Belknap Reservation have largely supported the reintroduction of native prairie species, especially after prairie dog numbers were diminished by an outbreak of disease in the late ’90s, Fox said. Now that the population is recovering and has started to clear larger areas of grass, however, some tribal members who raise cattle have begun expressing frustration to the tribal council.
“Wildlife and cattle will graze prairie dog colonies because of the new growth coming back throughout the year,” said Fox. “It makes it look even worse because it’s attractive to wildlife and domestic cattle, and they do their part. When it starts looking like a moonscape is when we get people noticing the most.”
He tells people that the little grass-eating rodents are necessary, and notes that the “moonscapes” aren’t as widespread as they may seem. But like non-Native ranchers across the West, some tribal members equate abundant prairie dogs with fewer cows. Fox doesn’t believe the council will allow widespread prairie dog poisoning on tribal lands — especially since the reservation now hosts black-footed ferrets — but he does worry that opposition could intensify.
Bronc Speak Thunder (Assiniboine), director of the Fort Belknap Buffalo Program, has also heard people complain about prairie dogs, though he added that “people complain about a lot of stuff.”
The tribes aren’t actively restoring prairie dogs, he said; they’re simply refraining from poisoning and shooting them. He sees that prairie dogs benefit tribal land by creating more habitat for ground-nesting birds and serving as food for swift foxes, coyotes, hawks and eagles. They also encourage the growth of nutritious grass for bison. “Like life, it’s a big circle, and that’s where it fits,” he said. “They’re part of the ecosystem that exists, and if you take something out, it throws everything off.”
Jessica Alexander, wildlife biologist with the Smithsonian, releases a swift fox into the wild on the Fort Belknap Indian Reservation. Louise Johns/High Country News
WHEN I MET Randy Matchett, the Fish and Wildlife Service biologist, he sported a cowboy hat and graying horseshoe mustache and carried a handful of Smurf-blue flea-control pellets, each slightly smaller than a marble. The pellets, which Matchett produced in his workshop at the Charles M. Russell National Wildlife Refuge headquarters in Lewistown, Montana, are his latest attempt to protect prairie dogs from a fatal disease.
The pellets contain Fipronil, an insecticide used in treatments likeFrontline to keep fleas and ticks away from household pets, and are flavored with peanut butter and molasses to increase their chances of ending up in prairie dog bellies. Matchett dyes them blue because research shows prairie dogs are attracted to the color, and because the dye stains their feces, making it easy to estimate how many animals have consumed the pellets. Once ingested, Matchett hopes, his “FipBits” will kill the fleas that land on and bite prairie dogs, including the fleas carrying the bacteria that causes plague.
Yes, that plague. The bacte-ria Yersinia pestis causes bubonic plague, which became known as the Black Death after it killed at least 25 million Europeans during the 14th century.
In 1900, the disease arrived in North America via San Francisco, carried by rats stowed away on ships. During the following decades, the development of antibiotics controlled the disease in humans, but plague continued to spread among rodent species, affecting black-footed ferrets, rabbits and squirrels. First detected in prairie dogs in 1936, it devastated populations already hit hard by the conversion of the prairie to agriculture — and it remains a major threat to prairie dogs.
“Once colonies have plague, they can disappear in two weeks,” said Shamon. “There will be thousands of acres chirping with thousands or tens of thousands of animals and in two weeks, you will go map it, and they’re gone.”
A plague vaccine does exist, and is used to protect highly endangered species like black-footed ferrets. But it’s simply not possible to jab every prairie dog in the West. Matchett, who as a Fish and Wildlife biologist is responsible for conserving endangered species, got involved in plague prevention in the early 1990s, initially dusting prairie dog colonies for fleas. In 2013, he began testing oral vaccines in Montana colonies, working in parallel with researchers in seven other states. The first-generation vaccines were red, peanut-butter flavored cubes with a biomarker that tinted prairie dog whiskers pink. Matchett and his colleagues in Colorado also developed vaccine pellets that they mass-produced using a Lithuanian carp bait-making machine. Matchett helped craft a pellet shooter that could be bolted to the front of a four-wheeler.
With the new vaccines primed to launch, Matchett felt hopeful. The World Wildlife Fund, which helped fund some of the work, felt hopeful, too. But in 2018, after years of trials with thousands of prairie dogs, he and other researchers concluded that even when a colony was given oral vaccinations, the number of prairie dogs that survived a plague outbreak was too small to support a black-footed ferret population.
So Matchett pivoted. If he couldn’t inoculate prairie dogs against plague, maybe he could kill the fleas that carried the bacteria. What if he could persuade prairie dogs to eat Fipronil?
He made a new set of pellets with the same bait machine, this time using his wife’s grandmother’s Kitchen-Aid mixer to blend various types of flour, vital wheat gluten, peanut butter, molasses and other food-grade ingredients with a soupçon of flea killer. Early results have been promising: While adult fleas aren’t affected until they bite a prairie dog that’s ingested a pellet, not every flea needs to be killed; studies have shown that in general, fleas don’t trigger plague outbreaks until they reach a critical mass. And flea larvae appear to die when they crawl into or consume treated prairie dog poop, suggesting that the pellets could tamp down flea reproduction as well as kill the adult insects.
FipBits aren’t the only way to reduce the toll plague takes on prairie dogs, but Matchett believes they’re the most likely to work. In his office, perched on stacks of files, are the remnants of another of his many assaults on the problem: dozens of vials of alcohol, each containing bits of prairie dog ears. In 2007 and 2008, Matchett and his colleagues collected the snippets from prairie dogs that had survived plague outbreaks, hoping genetic analysis would explain their fortitude. The material has yet to be analyzed owing to a “combination of lack of funding, interest, time and capability,” Matchett said, but he hopes new funding will allow him and his collaborators to return to the project.
Despite the setbacks, Matchett believes researchers can find a way to control plague in prairie dogs. Human intolerance, as he sees it, is a more stubborn problem. Places like Fort Belknap and the Conata Basin of South Dakota — where prairie dogs are, at least for now, allowed to flourish — remain few and far between.
At his shop in Lewistown, Montana, U.S. Fish and Wildlife Service biologist Randy Matchett holds the flea-control pellets he hopes will help reduce the toll plague takes on prairie dogs. Louise Johns/High Country News
Matchett tests the pellet shooter he helped create (left to right). Louise Johns/High Country News
DRIVE SOUTH from Fort Belknap down Highway 191, head east on a straight gravel road, and you’ll find one more place where prairie dogs are left in peace.
American Prairie began in 2001 as an effort to protect and restore Montana’s grasslands. The nonprofit now manages more than 527,000 acres of private land and federal and state leases. Its ultimate goal is to connect 3.2 million acres of prairie, providing habitat for an array of species from bison to mountain plovers to black-footed ferrets. To the casual observer, American Prairie’s lands may already look like intact prairie, though ecologists like Daniel Kinka can’t help noticing the nonnative crested wheatgrass and the hundreds of miles of fencing.
“This is kind of like the Field of Dreams model: If you build it, they will come,” said Kinka, American Prairie’s director of rewilding. “A better habitat houses more wildlife, and the wildlife that are here are perfectly capable of restoring themselves.”
American Prairie prohibits the poisoning and shooting of prairie dogs on its land, and it regularly hosts research projects such as the Smithsonian’s burrow mapping — which may help explain how plague spreads within colonies — and Matchett’s tests of plague-mitigation tools. Prairie dogs, said Kinka, are the “unsung heroes of a prairie ecosystem,” important to all the other species American Prairie is trying to foster. And as researchers have found, the woody plants that prairie dogs chew down to clear their line of sight tend to be replaced by nutritious grasses and wildflowers, suggesting that even cattle may benefit from their presence.
The possibility that prairie dogs could be good for cattle, or at least not as bad as generally believed, is met with skepticism by American Prairie’s neighbors, many of whom see the nonprofit as a threat to ranching. Signs posted along highways in Phillips County, Montana, read “Save the American Cowboy. Stop American Prairie Reserve.” For now, Kinka isn’t trying to convince anyone to like or even appreciate prairie dogs, aiming instead for tolerance.
The black-tailed prairie dog complex studied by the Smithsonian team at American Prairie is a noisy place, filled with the barks and trills of hundreds of creatures. As I stood beside researcher Jesse Boulerice, listening, it was easy to imagine that the rodents were doing just fine. But they’re not. Will they ever be allowed to exist in numbers like this throughout their historic range?
Boulerice surveyed the surface of the colony, which was covered with dried plant nubs and bare mounds of dirt, and said he wasn’t sure.
Then he released a collared prairie dog who wagged her chubby butt in the air as she scurried into a nearby hole. She promptly popped back up, chirping out a message we’ll never understand. Perhaps she was warning her colony-mates to watch out for those marshmallows and carrots; they hide a nasty trap.
Or maybe she was scolding us — telling us exactly what she thought of our species before she disappeared into her burrow, leaving us to decide the future of hers.
Prairie dogs emerge from their burrows at American Prairie.
Louise Johns/High Country News
View of Shoshone Hydroelectric Plant construction in Glenwood Canyon (Garfield County) Colorado; shows the Colorado River, the dam, sheds, a footbridge, and the workmen’s camp. Creator: McClure, Louis Charles, 1867-1957. Credit: Denver Public Library Digital Collections
January 17, 2025—The Bureau of Reclamation announced this week nearly $177 million in funding for water projects in the Upper Rio Grande and Upper Colorado River basins in Colorado. These funds—awarded from Bucket 2 Environmental Drought Mitigation (B2E) and Inflation Reduction Act programs—will help Colorado better address the impacts to our water supplies and aquatic ecosystems from a hotter, drier future. The Colorado Water Conservation Board (CWCB) shares the excitement of all the organizations receiving funding—the awards are a testament to their hard work. The CWCB is proud to have supported several of the awardees with matching funds and technical assistance while developing their applications.
“We are thrilled to see this funding go towards these critical projects in Colorado. We are particularly proud to have played a role in assisting these projects in securing funding through CWCB’s grant programs including our Federal Technical Assistance Grant Program, Projects Bill Grants Program and Wildfire Ready Watershed Grants Program,” said Lauren Ris, CWCB Director. “By building upon the capacity of our local partners, we provide resources and guidance to navigate complex federal funding processes.”
The funded projects span a diverse range of initiatives that deliver impactful outcomes for Colorado communities. CWCB funding supported applications for:
Upper Rio Grande Basin Drought Resiliency Activities: CWCB provided a $195,000 Local Capacity Grant to the Rio Grande Headwaters Restoration Foundation, which helped secure a $24.9 million IRA award through the Bureau of Reclamation’s “Other Basins” Program. These projects are essential to addressing the long-term drought and water security in the basin.
Addressing Drought Mitigation in Southwest Colorado: CWCB provided a $156,706 Local Capacity Grant to the San Juan Resource Conservation and Development Council (in partnership with Southwestern Water Conservation District) which helped secure up to $25.6 million in B2E funding to enhance drought resilience and habitat restoration efforts in southwest Colorado.
Orchard Mesa Irrigation District Conveyance Upgrades for 15-Mile Reach Flow Enhancement: CWCB provided a $73,250 Local Capacity Grant to Farmers Conservation Alliance (in partnership with Orchard Mesa Irrigation District) which helped secure up to $10.5 million in B2E funding to modernize irrigation systems and improve water efficiency.
Shoshone Water Rights Preservation Project: CWCB provided a $20 million Projects Bill Grant to the Colorado River Water Conservation District which helped secure up to $40 million in B2E funding to acquire the Shoshone water right.
Drought Resiliency on Western Colorado Conserved Lands: CWCB provided a $434,130 Local Capacity Grant to the Colorado River Water Conservation District (in partnership with Shavano Conservation District) which helped secure up to $4.6 million in B2E funding to address drought challenges in western Colorado.
Forest Resiliency in the Headwaters of the Colorado: CWCB provided a $93,850 Wildfire Ready Watersheds Grant to Grand County which supported the development of the “Grand County Wildfire Ready Action Plan,” which helped secure up to $32.6 million in multistate B2E funding for wildfire mitigation efforts.
CWCB is committed to continuing to be a partner of communities statewide so that they are best positioned to secure federal funding and implement lasting solutions for Colorado water challenges. The 2024 Federal Technical Assistance Grant cycle is completed, and more information about 2025 applications will be announced this Spring.
WASHINGTON — The Bureau of Reclamation today announced initial selections under the Upper Colorado River Basin Environmental Program for a $388.3 million investment from President Biden’s Investing in America agenda to improve wildlife and aquatic habitats, ecological stability and resilience against drought. The funding supports 42 projects in Colorado, New Mexico, Utah, Wyoming, as well as Tribal initiatives that will provide environmental benefits or the restoration of ecosystem and natural habitats. To view a full list of projects, visit Reclamation’s website. Individualized criteria for some projects are included in the descriptions at the link.
Additionally, Reclamation announced approximately $100 Million funding opportunity for the companion program in the Lower Basin, which seeks to fund projects that provide environmental benefits in Arizona, Nevada, and California.
“These historic environmental investments will restore and improve natural resources supporting the long-term sustainability of the Colorado River Basin, which includes nine National Parks across the seven states and is an essential habitat for more than a dozen endangered species,” Commissioner Camille Calimlim Touton said. “As we continue to develop the drought resiliency of the basin through investments in water conservation and efficiency projects, we can’t forget that a sustainable basin can only exist if there is a healthy environment.”
This is the first round of projects funded from the Upper Basin Environmental Drought Mitigation Program through the Inflation Reduction Act. More announcements are expected in the coming months, including projects from the most recent Upper Basin environmental announcement, which closed Jan. 10, 2025. Reclamation will begin negotiations with successful applicants to ensure funding conditions are met before funding is obligated. Funding for the Shoshone Water Rights Preservation Project will not be obligated until the Colorado water court enters a final decree; in addition, the agreement will contain provisions requiring Reclamation’s written consent for any water right changes. The conditions precedent set by the State of Colorado for their funding of the Shoshone Water Rights Preservation Project must also be met prior to the obligation of federal funds. Funding for the Pine River Environment Drought Mitigation Project is subject to negotiation concerning operation, maintenance and replacement costs and other appropriate considerations.
Reclamation’s new funding opportunity for proposed ecosystem restoration or improvements projects in the Lower Colorado River Basin is also funded by the Inflation Reduction Act, and will consider projects that provide environmental benefits, or ecosystem and habitat restoration projects that address issues directly caused by drought in the Lower Colorado Basin Region under Phase 3 of the Lower Colorado River Basin System Conservation and Efficiency Program. Reclamation expects to announce projects by spring 2025 and award approximately $100 million for planning, design, construction, and/or implementation of projects. Project and applicant eligibility information is available on the Bureau of Reclamation website.
The Biden-Harris administration has led a comprehensive effort to make Western communities more resilient to climate change and address the ongoing megadrought across the region by harnessing the full resources of President Biden’s historic Investing in America agenda. As climate change has accelerated over the past two decades, the Colorado River Basin experienced the driest period in over one thousand years. Together, the Inflation Reduction Act and Bipartisan Infrastructure Law provide the largest investment in climate resilience in our nation’s history, including $15.4 billion for Western water across federal agencies to enhance the West’s resilience to drought and deliver unprecedented resources to protect the Colorado River System for all whose lives and livelihoods depend on it. This includes $5.35 billion for over 577 projects in the Colorado River Basin states.
Projects in Colorado
Shoshone Water Rights Preservation Project: Up to approximately $40m
Funding is provided to permanently protect the Shoshone Water Rights in the Upper Colorado River Basin to ensure a reliable water supply for ecosystem, agricultural, municipal, and recreational uses. Key components include maintaining the historical flow regime, eliminating risks of abandonment due to plant decommissioning, and facilitating instream flow use by the Colorado Water Conservation Board. Funds will not be obligated or expended until a final Colorado water court decree is entered confirming water rights and the agreement will contain provisions requiring written consent of Reclamation on any water right changes. The conditions precedent set by the State of Colorado for their funding of the Shoshone Water Rights Preservation Project must also be met prior to the obligation of federal funds.
Addressing Drought Mitigation in Southwest Colorado: Up to approximately $25.6m
Funding is provided for restoring ecosystems and improving river and connection of waterways in southwestern Colorado. It involves a collaborative effort to enhance biodiversity and water resources while supporting local communities and endangered species.
Grand Mesa and Upper Gunnison Watershed Resiliency and Aquatic Connectivity Project: Up to approximately $24.3m
Funding is provided to implement watershed restoration actions to combat drought effects in western Colorado. Through a variety of strategies, it enhances water quality, habitat resilience, and connectivity for aquatic species.
Orchard Mesa Irrigation District Conveyance Upgrades for 15-Mile Reach Flow Enhancement: Up to approximately $10.5m
Funding is provided to convert open canals into pressurized pipelines, improving water delivery efficiency and reducing environmental stressors. This upgrade supports the recovery of endangered fish species by enhancing streamflow in the critical 15-mile reach of the Colorado River.
Enhancing Aquatic Habitat in Colorado River Headwaters: Up to approximately $7m
Funding is provided to restore stream habitats along the Fraser, Blue and Colorado rivers in Grand County, enhancing aquatic ecosystems through channel shaping and bank stabilization through collaboration with key conservation partners.
Yampa River/Walton Creek Confluence Restoration Project: Up to approximately $5m
Funding is provided to restore river and wetland ecosystems in Steamboat Springs through restoration of river and floodplain habitat and the rehabilitation of riparian and wetland area thereby enhancing ecological health and promoting biodiversity. It addresses drought impacts by improving water quality, habitat complexity, and community resilience.
Drought Resiliency on Western Colorado Conserved Lands: Up to approximately $4.6m
Funding is provided to implement various ecological restoration strategies, including the restoration of wetlands, reconnection of floodplains, the installation of erosion control structures to reduce sediment transport and enhance water quality, while promoting habitat restoration for at-risk species like the yellow-billed cuckoo and Gunnison sage-grouse.
Upper Colorado Basin Aquatic Organism Passage Program: Up to approximately $4.2m
Funding is provided to restore stream habitat in Grand County, promoting biodiversity and resilience against drought conditions while enhancing habitat connectivity and improving fish passage for native species, particularly Colorado River cutthroat trout.
Conversion of Wastewater Lagoons into Wetlands: Up to approximately $3m
Funding is provided to transform outdated sewer lagoons into wetlands, enhancing biodiversity and providing habitat for migratory waterfowl and endangered fish species in the town of [Palisade]. Once completed, the wetlands will improve water quality and increase native plant diversity, recharging groundwater and supporting up to 75% of commercially harvested fish.
Fruita Reservoir Dam Removal: Up to approximately $2.8m
Funding is provided to remove a dam on Pinon Mesa, restoring wetlands and enhancing biodiversity and wildlife habitat while ensuring ecological resilience through water pooling, pipeline removal and comprehensive habitat restoration efforts.
Monitoring and Quantifying the Effectiveness of Beaver Dam Analogs on Drought Influenced Streams in the Upper Colorado River Basin: Up to approximately $1.9m
Funding is provided to restore degraded headwater meadows by implementing structures that mimic the natural functions of beaver dams. These interventions enhance ecosystem resilience, improve water retention, and support native species.
Uncompahgre Tailwater Rehabilitation Project: Up to $1.8m
Funding is provided to address habitat degradation, enhancing ecological health and recreational opportunities through rehabilitation of river habitat, restoration aging structures, and implementation of bank stabilization techniques.
Eagle River Habitat Improvement, Gypsum Ponds State Wildlife Area: Up to approximately $1.5m
Funding is provided to enhance Eagle River in Eagle County, improving fish habitat and increasing resilience to low flows and drought while supporting local ecosystems and enhancing water quality.
Orchard Mesa and Grand Valley Metering Efficiency Project: Up to approximately $1.5m
Funding is provided to enhance water management in the Grand Valley through the installation of advanced metering technology and SCADA systems. This project addresses drought conditions by improving water use efficiency and supporting local aquatic ecosystems.
Habitat Restoration in the Gunnison Basin: Up to approximately $750k
Funding is provided to restore stream habitats in the Gunnison Basin, implementing low-tech restoration structures to enhance ecosystem resilience and support habitat for the endangered Gunnison Sage-Grouse.
Cyanobacteria Monitoring and Treatment for Drought-driven Blooms in a High Elevation, Upper Colorado Reservoir to save Ecosystem Function: Up to approximately $518k
Funding is provided to restore aquatic health at Williams Fork reservoir by deploying real-time water quality monitoring tools and implementing targeted hydrogen peroxide treatments to combat algal blooms. It enhances water quality management to protect ecosystems and support community recreational activities.
Click the link to read the article on the NOAA website (Amy Butler and Laura Ciasto):
January 16, 2025
We’re briefly popping in because another surge of very cold air looks to drop down from the Arctic over a large region of the central US this weekend and into early next week. We know that the question will be asked: is the cold related to the polar vortex this time? So here we are to provide some answers.
There are two points we want to emphasize:
1. The polar vortex strength, as measured by the speed of the winds around the 60N latitude circle and 10 hPa pressure level, remains stronger than average, and is currently forecast by most models to return to near-record strong wind speeds into early February.
Observed and forecasted (NOAA GEFSv12) wind speed in the polar vortex compared to the natural range of variability (faint blue shading). Since mid-November, the winds at 60 degrees North (the mean location of the polar vortex) have been stronger than normal. According to the GEFSv12 forecast issued on January 15 2025, those winds are forecast to remain stronger than normal for at least the next few weeks (bold red line). NOAA Climate.gov image, adapted from original by Laura Ciasto.
Normally, if the polar vortex is communicating with the surface, which it finally has been in the last couple of days, a strong polar vortex would be associated with persistent warmth over much of Europe, Asia, and the eastern US. (A strong polar vortex is usually associated with a northward shifted jet stream that keeps the coldest air corralled over the pole.) Europe and Asia are indeed anticipating warmer than average conditions next week, but not the US. So something else is going on over the US that is overwhelming the “strong polar vortex” signal.
2. We discussed how we didn’t think the shape or stretching of the polar vortex contributed to the last cold air outbreak, because in the lower stratosphere the vortex was shifted towards Asia and not stretched over North America. However, in this case, the vortex is actually forecast to stretch throughout its entire depth (10-30 miles above the surface) over Canada and the Hudson Bay. So unlike last week, this time the stretched out polar vortex may be associated with the forecasted southward shift of the jet stream, which allows the troposphere’s cold Arctic air to spill into the continental US.
The forecasted structure of the tropospheric jet stream (yellow) and several levels of the stratospheric polar vortex from the lower stratosphere to the upper stratosphere in the NOAA GFS model for 17 January 2025 (initialized on 16 January 2025). The contours show how the stretched polar vortex corresponds to the southward shift of the jet stream over North America. NOAA Climate.gov image, adapted from original by Laura Ciasto.
However, we want to reemphasize that “associated with” still does not mean one thing caused another, and in this case, it’s still difficult to understand what is causing what. Additionally, a strong ridge of high pressure has been building up simultaneously near Alaska, which can also help force the jet stream to dive down south over the continental US and bring cold Arctic air with it, independent of the polar vortex.
Downstream of a “ridge” over Alaska, the jet stream (the winds at the 250-millibar pressure level) is forecasted to make a deep dip (known as a “trough” to meteorologists) into the United States over the weekend of January 18, 2025, according to NOAA’s Global Forecast System. NOAA Climate.gov animation based on a screen recording from the Earth Null School website.
To sum up: Unlike last time (Jan 5-7), the stretching of the polar vortex is extending through the entire column and is “in-sync” with the extension of the jet. But we don’t know the directionality (what caused what), and other tropospheric factors like the strong Alaskan ridging are definitely big players. And while things are more in-line this time, cold air outbreaks don’t only happen because of the polar vortex.
Click the link to read the article on the Big Pivots website (Allen Best):
January 11, 2025
It was another warm year in Colorado, part of a theme. Russ Schumacher, the state climatologist, reports 2024 was the 4th warmest on record, 3 degrees warmer than the 20th century average when temperatures across the state were averaged for the year.
Eight of the 10 warmest years in Colorado’s recorded history have been since 2012.
From his base in Akron, 115 miles northeast of Denver, Joel Schneekloth observed temperatures that fit in with this trend.
“We really had warm days but even warmer nights,” reported Schneekloth, who is a regional water specialist with the Colorado Water Institute. “But we didn’t have a string of 100 degree days like we had in 2012 and 2002. We had 100 just once or twice this year.”
To be clear, it can still get cold in Colorado. This is not quite up to Lake Wobegon standards, where all the children are above average. But all the action has been on the high side of the thermometer — or on the lack of cold.. That was particularly true in December.
The Colorado Climate Center reported 120 new all-time high temperatures along with 25 tied records. Nights, as Schneekloth noted, were also warm. There were 129 records for the high minimum temperature.
On the flip side, it had two all-time cold temperatures.
Notable was the warmth of December. “It was very warm across Colorado, or perhaps more accurately, there was a distinct lack of cold,” Schumacher wrote.
“It really was the lack of any real cold in December that led to the record-breaking temperatures for the month,” he told Big Pivots.
“Highs in the low 70s aren’t especially remarkable in December, but many stations set records for the warmest low temperature for December. For example, at Sedgwick, the lowest temperature in December was 11F – the previous warmest low temperature for December was 9F. This is true at numerous stations in northeastern Colorado. Fort Collins only got down to 15 in December. The previous record was 12 Akron only got to 10; the previous record was 8.”
At many stations, the second or third warmest low for December was just the previous year (2023), a December with a similar lack of cold.
Precipitation, on the other hand, was above average statewide but not abnormally so, 35th wettest in records across the past 130 years. The story of rain and snow, however, was not uniform. The southern San Luis Valley had its wettest calendar year on record. Lands north of Fort Collins and Greeley, along the Wyoming border, much drier than average.
These hay bales stand ready to be collected on a ranch outside of Carbondale in July 2024. A program that pays irrigators in the Upper Colorado River Basin to cut back is facing uncertainty in 2025 because of Congressional delays. Credit: Heather Sackett/Aspen Journalism
A federally funded water conservation program in the Upper Colorado River Basin is facing uncertainty for 2025 after the bill to authorize funding for it stalled in Congress late last year.
On Friday, Upper Colorado River Commission Executive Director Chuck Cullom said the commission planned to communicate to participants in the 2024 System Conservation Pilot Program that the UCRC is not accepting applications at this time for a 2025 program. Officials will let people know later this month if and when the application process will open for 2025.
According to a post on the UCRC’s website, which has since been removed, applications were potentially going to be available Jan. 9, with a now-cancelled informational webinar scheduled for Jan. 10.
Officials are holding out hope that the program can still get federal authorization in time for water users — mostly farmers and ranchers — in Colorado, New Mexico, Utah and Wyoming to conserve water during the upcoming growing season.
“The commission recognizes that SCPP has been an important and useful tool for the Upper Basin to understand the opportunities and issues that conservation programs represent,” Cullom said. “We are hopeful we will have that tool available in 2025 and again in 2026.”
The System Conservation Pilot Program, which pays water users who volunteer to cut back, was restarted in 2023 as part of the Upper Basin’s 5-Point Plan, designed to protect critical infrastructure from plummeting reservoir levels. Over two years, the program spent about $45 million to save about 101,000 acre-feet of water. Funding for SCPP comes from $125 million allocated through the Inflation Reduction Act.
The U.S. Bureau of Reclamation’s authorization to spend this money expired in December and now must be renewed if the program is to continue.
Anthony Rivera-Rodriguez, a press secretary with the office of U.S. Sen. John Hickenlooper, D-Colo., said lawmakers plan to introduce a new bill for funding authorization in the next couple of weeks. He said funding for Western drought programs has not been controversial and has received bipartisan support. The authorization didn’t pass in December, he said, because lawmakers simply ran out of time before the end of the session. The Colorado Sun reported last month that the Senate passed the Colorado River Basin System Conservation Extension Act, but the House of Representatives “left it on the chopping block as lawmakers raced to pass legislation to avoid a government shutdown.”
“We are trying to get this authorized as soon as we possibly can,” Rivera-Rodriguez said.
SCPP has been dogged by controversy since it was rebooted in 2023. The program originally took place from 2015 to 2018.
SCPP has been criticized for a lack of transparency in the 2023 program, not measuring and tracking how much of the conserved water eventually makes it to Lake Powell, and for its potential negative impacts, in general, to the agricultural communities of the Western Slope and, in particular, to an irrigation company in the Grand Valley. In response to the second criticism, officials are working on how Upper Basin states could “get credit” for conserved water through a memorandum of understanding with the U.S. Bureau of Reclamation.
Delta County farmer Paul Kehmeier kneels by gated pipes in his family’s alfalfa field. Kehmeier participated in the 2024 System Conservation Pilot Program and said he would again in 2025 if funding is reauthorized by Congress. Credit: Natalie Keltner-McNeil/Aspen Journalism
Whether reauthorization will come quickly enough for Upper Basin agricultural producers to participate in the upcoming irrigation season remains to be seen. Short notice and a hasty rollout of SCPP for the 2023 growing season meant low participation numbers for that year, with just 66 water-saving projects and about 38,000 acre-feet conserved across the four Upper Basin states. The number of projects in 2024 jumped to 109, with about 64,000 acre-feet conserved.
A last-minute reprieve for the program wouldn’t be a problem for one Delta County rancher who participated in SCPP in 2024. Paul Kehmeier enrolled 58 acres of his ranch in the program last year and said he plans to participate again if the program is extended.
“There are two reasons that I’m planning to participate,” Kehmeier said. “One is that the money is very good, and second is that I don’t think we in the Upper Basin can stick our heads in the sand on all this big river stuff. … My irrigation season starts April 1, so anytime up until the last day of March, if I had a chance to participate, I would jump at the chance.”
The reauthorization of System Conservation comes at a pivotal moment for water users on the Colorado River. Negotiations between the Upper Basin states and the Lower Basin states (California, Arizona, Nevada) on how shortages will be shared after 2026 have ground to a halt. Lower Basin water managers say all seven states that use the Colorado River must share cuts under the driest conditions, while Upper Basin officials maintain they already take cuts in dry years because they are squeezed by climate change and can’t rely on the massive storage buckets of Lake Powell and Lake Mead for their water supply. Upper Basin leaders also maintain that they shouldn’t have to share additional cuts because their states have never used the entire 7.5 million-acre-foot apportionment given to them by the Colorado River Compact, while the Lower Basin regularly uses its full allotment.
But there has been a recognition in recent months by some Upper Basin officials that their states will have to participate in some kind of future conservation program — SCPP or otherwise — on a river whose flows have declined over the past two decades due to drought and climate change.
“As we get more familiar with this, maybe that can be ramped up to 100,000, 200,000 (acre-feet), I don’t know,” Esteban Lopez, the UCRC commissioner from New Mexico, told attendees at the December Colorado River Water Users Association Conference in Las Vegas. “Maybe we can get there, maybe we can’t. But the point is: We will conserve and we will commit to conserve what we can conserve when there’s water available and put it in an account in Lake Powell.”
Lafayette, CO — Today, House Assistant Minority Leader Joe Neguse, Co-Chair of the Colorado River Caucus, announced $2.4 million from the Bipartisan Infrastructure Law for two projects in Colorado’s 2nd District aimed at restoring and improving the ecological conditions of local waterways and aquatic habitat near the communities of Granby and Boulder. These investments were allocated by the Bureau of Reclamation’s WaterSMART Environmental Water Resources Projects program.
“Local communities are instrumental in protecting and restoring Colorado’s rivers and streams. This important funding will support locally driven projects that enhance watershed health and resiliency, restore ecological conditions, and embody the spirit of ecological stewardship,” said Assistant Leader Neguse.
“Colorado is focused on protecting our vital water sources so that there is plenty of clean water for our communities and environment. I applaud Rep. Neguse’s leadership in Congress to pass federal legislation that is delivering for Colorado, and thank our State agencies and Coloradans carrying out these important projects,” said Governor Jared Polis.
Projects in Colorado’s 2nd Congressional District include the Upper Colorado River Ecosystem Enhancement Project, managed by the Grand County Learning By Doing Cooperative Effort (LBD), and the Boulder Creek Headwaters Resiliency Project, led by the Boulder Watershed Collective. Additional information on both can be found HERE and below:
$1,425,859 for the Upper Colorado River Ecosystem Enhancement Project, to restore two stream reaches on the Fraser River and Willow Creek near the community of Granby.
$954,204 for the Boulder Creek Headwaters Resiliency Project, to restore and improve the ecological condition of 181 acres of degraded aquatic and riparian habitat, and 2.8 miles of wet meadow streams throughout the Boulder Creek Watershed near Boulder.
“This is just another great example of the successful collaboration taking place in Grand County across a wide range of stakeholders that is resulting in very tangible improvements in the ecological health of the Colorado River headwaters,” according to a statement from the Grand County Learning By Doing Management Committee.
“The projects selected are working through a collaborative process to achieve nature-based solutions for the health of our watersheds and river ecosystems to increase drought resiliency,” said Reclamation Commissioner Camille Calimlim Touton. “This historic investment from the Bipartisan Infrastructure Law gives Reclamation the opportunity to continue to collaborate with our stakeholders to leverage funds for these multi-benefit projects.”
“Denver Water is proud to support ongoing stream improvement projects like those to be funded in this latest round of federal funding. Congratulations to Grand County Learning by Doing on this award. We look forward to working with our partners on the upcoming restoration work to Willow Creek and the Fraser River to benefit the Colorado River Basin,” said Rick Marsicek, Chief of Water Resource Strategy at Denver Water.
As co-founder and Co-Chair of the Congressional Colorado River Caucus, Neguse has brought together a bipartisan mix of lawmakers each representing a state along the Colorado River Basin. The group is working to build consensus on critical issues plaguing the river and support the work of the Colorado River Basin states on how best to address the worsening levels of drought in the Colorado River Basin.
Snowpack levels across the Upper Colorado River Basin are close to average for this time of year, but forecasters say that might not translate to a comfortable year for the Colorado River…Moser reported that snow levels above Lake Powell, which straddles Utah’s shared state line with Arizona, are 94% of average as of Jan. 1. (“Average,” in forecasting, refers to the average precipitation between 1991 and 2020.) But forecasters currently predict that runoff into the reservoir between April and July will only be 81% of the thirty-year average. That’s a drop from the December forecast, which projected inflows of 92% of average…
Utah’s soil moisture is also below average and worse than it was this time last year. That could impact how much water reaches the Colorado River and Lake Powell, since dry soil absorbs melting snow, leaving less water to run off mountains and into reservoirs this spring. In terms of actual water, 81% of normal runoff into Lake Powell between April and July is 5.15 million acre-feet; the median runoff over the last thirty years has been 6.13 million acre-feet.
The Shoshone hydro plant in Glenwood Canyon. The River District has made a deal with Xcel Energy to buy the water rights associated with the plant to keep water flowing on the Western Slope. Credit: Heather Sackett/Aspen Journalism
The century-old water rights of the Shoshone Power Plant are essential to maintaining the flow and vitality of Colorado’s namesake river. The Colorado River District, alongside a diverse coalition of supporters, is working tirelessly to safeguard this critical resource, ensuring its benefits endure for ecosystems, communities, and future generations across Colorado’s Western Slope. Learn more at keepshoshoneflowing.org Learn more about the Colorado River District at ColoradoRiverDistrict.org
On January 9 and 10, a low pressure system tracked along the Gulf Coast and resulted in widespread precipitation (1 to 2.5 inches, liquid equivalent) from eastern Texas and the Lower Mississippi Valley east to the Florida Panhandle. On the northern extent of this storm, snow blanketed areas from Oklahoma and Arkansas to north Georgia. This precipitation during the second week of January supported drought improvement. However, drought expanded and intensified for the Florida Peninsula, eastern North Carolina, west-central Texas, and the Southwest. During the first two weeks of January, multiple Arctic surface highs shifted south from Canada and temperatures (January 1-13) averaged 4 to 8 degrees F below normal for much of the Great Plains, Middle to Lower Mississippi Valley, and Southeast. A very dry start to the wet season continued to affect southern California with worsening drought conditions, periodic Santa Ana winds, and large wildfires. Enhanced trade winds, typical during a La Niña winter, resulted in improving drought for the windward side of the Hawaiian Islands…
The Central High Plains continued to have worsening drought conditions and moderate drought (D1) was expanded across portions of southwestern Nebraska using 60-day SPI, soil moisture below the 10th percentile, and the NDMC short-term blend. Although light precipitation (less than 0.5 inch, liquid equivalent) fell across parts of south-central to southeastern Kansas, this precipitation was too low to justify any improvements. Elsewhere, across the Central to Northern Great Plains, no changes were made as early to mid-January is a dry time of year. D1 was expanded across southwestern Colorado due to low snow water equivalent and 60-day SPI…
Colorado Drought Monitor one week change map ending January 14, 2025.
Severe drought (D2) was expanded to include all of southern California due to the very dry start to the water year to date (WYTD) from October 1, 2024 to January 13, 2025. The D2 coverage coincides with where WYTD precipitation has averaged less than 5 percent of normal. [ed. emphasis mine] A number of locations, including San Diego, are having their driest start to the water year. The D2 covers Los Angeles and Ventura counties which are being affected by periodic Santa Ana winds drying out vegetation and large wildfires. Following the two wet winters, the large reservoirs throughout California are at or above-normal. Based on 90-day SPI, declining soil moisture, and low snow water equivalent, a 1-category degradation was warranted for parts of Arizona and southwestern Utah. A mix of improvements and degradations were made to Idaho and the depiction is generally consistent with the 2024-2025 WYTD precipitation and snowpack. Eastern Washington and much of Oregon are drought-free, but low snowpack supports moderate drought (D1) along the northern Cascades of Washington. A 1-category improvement was justified for a portion of central Montana, based on 90-day SPEI along with snow water equivalent (SWE) above the 75th percentile. As of January 14, SWE was above-normal (period of record: 1991-2020) across the southern Cascades along with eastern Oregon and southwestern Idaho. SWE varies for the Sierra Nevada Mountains, those numbers are beginning to decrease after a drier-than-normal start to January. SWE remained well below-normal across the Four Corners Region…
More than 1 to 1.5 inches of precipitation (liquid equivalent) supported improvements for portions of eastern Texas, Arkansas, Louisiana, and Mississippi. The small areas of severe drought (D2) were discontinued in northeastern Mississippi due to: 28-day average streamflows near the 20th percentile, soil moisture recovery, and a consensus of SPIs in D1 at worst. In addition, there is no support for maintaining D2 in the NDMC short- and long-term blends. Precipitation during the first two weeks of January resulted in a slight reduction in extreme drought (D3) across south-central Tennessee. For central Texas which received generous precipitation for this time of year, low 28-day streamflows (below the 20th percentile in D1 and 10th percentile in D2) precluded a larger area for a 1-category improvement. D2 to D3 drought was expanded across the Edwards Plateau of Texas due to 28-day average streamflows below the 10th and 5th percentile, respectively…
Looking Ahead
Another Arctic air outbreak is forecast for the central and eastern U.S. during mid-January as surface high pressure shifts south from Canada. By January 20, subzero minimum temperatures are expected as far south as the Central Great Plains, Middle Mississippi Valley, and Ohio Valley. During January 16-20, little to no precipitation is forecast from the West Coast to the Mississippi Valley with light to moderate precipitation amounts (0.5 to 1 inch) limited to the Southeast. These amounts, however, have been sufficient for rainfall to almost keep up with demand, and the near-normal amounts the past 2 weeks have kept the area out of D0 conditions for the time being, but the situation needs to be closely monitored for signs of increasing dryness impacts. Daily rainfall reports are not available for Mili since the start of January 2025, but 45.59” fell during October-December 2024, above the normal of 36.55” and well above the amount needed to keep up with demand, which is sufficient to keep D0 conditions at bay regardless the rainfall during the past 2 weeks.
The Climate Prediction Center’s 6-10 day outlook (valid January 21-25, 2025) favors below-normal temperatures to persist for much of the contiguous U.S. with the largest below-normal temperature probabilities (exceeding 80 percent) extending from the Mid-Atlantic and Ohio Valley south to the Gulf Coast. Elevated above-normal precipitation probabilities are forecast for the northern Great Plains, Gulf Coast, and portions of the Southeast. Below-normal precipitation is favored for the West, Central Great Plains, Midwest, and New England.
US Drought Monitor one week change map ending January 14, 2025.
Alamosa never gets 16 inches of total precipitation in a year. Never. Ever. Except that it did in 2024.
Turns out, 2024 was among the wettest on record across the San Luis Valley going back to 1895, with all six counties registering historic levels of precipitation. Here are the precipitation totals by county, according to data from the NOAA National Centers for Environmental Information:
Alamosa County, 16.75 inches
Conejos County, 24.29 inches
Costilla County, 22.53 inches
Mineral County, 32.60 inches
Rio Grande County, 19.66 inches
Saguache County, 21.86 inches
The headscratching is how so much moisture was realized in a year when the unconfined aquifer of the Upper Rio Grande Basin dropped to near its lowest level, which became problematic for irrigators who are under orders by the state of Colorado to reduce their groundwater pumping to help recover the ailing aquifer.
“Two things,” said Cleave Simpson, general manager of the Rio Grande Water Conservation District and local hay grower. “We didn’t have continuous steady snowpack in the winter months that put us in a good position, and then the volume of snow we got was on top of drier conditions last fall where moisture, instead of showing up in a stream, ends up in the ground in soil conditions.
“So to that end, this year at my farm in October, I get an inch and a half of rain, in October. That never, ever happens. So the hope is then, that nice soil moisture that we got in October will set us up for success.”
Craig Cotten, division engineer for the Colorado Division of Water Resources, said the wet 2024 was a boon to local farmers and their efforts to recover the Valley’s aquifers. What it didn’t do was increase the amount of water stored in reservoirs.
“The reservoirs in the Rio Grande Basin in Colorado typically store water in winter when the senior priority ditches are shut off. The reservoirs can also store during the irrigation season, but only if there is a significant amount of water in the rivers to serve not only the irrigation ditches but the reservoirs as well,” said Cotten.
“This typically requires very high river flows, which did not occur in 2024 even with the rain events that were the primary reason for the high precipitation total in 2024. The significant rains in the Rio Grande Basin did increase the river flows, but not enough to get the reservoirs into priority. The increase in reservoir storage in 2024 was about typical of what occurs in an average year.”
Without the high levels of precipitation in 2024, the critical unconfined aquifer was in danger of falling to a level of storage nobody was expecting to see after years of irrigators working to reduce their groundwater pumping.
Colorado precipitation for the 12 months ending January 15, 2024. Credit: High Plains Regional Climate Center.
“The large amount of precipitation in the Rio Grande Basin during the summer of 2024 helped the unconfined aquifer in multiple ways,” said Cotten. “This precipitation increased the streamflow in the Rio Grande throughout the summer, allowing the ditches and canals to divert more water than they otherwise would have.
“This increased diversion in turn allowed delivery of a higher amount of water into recharge pits and the aquifer. The precipitation also helped to meet the irrigation needs of the crops, allowing the farmers to not pump their wells as much as they would otherwise.”
The hope among local farmers is that the wet fall months of 2024, when October and November delivered more than 11 inches of snow, will translate into an above-average spring runoff and give a boost to surface water coming into the Valley in 2025.
Rio Grande and Pecos River basins. Map credit: By Kmusser – Own work, Elevation data from SRTM, drainage basin from GTOPO [1], U.S. stream from the National Atlas [2], all other features from Vector Map., CC BY-SA 3.0, https://commons.wikimedia.org/w/index.php?curid=11218868
Figure 1: The sample size and spatial distribution of the MRoS data across ecoregions within CONUS. The gray shaded area represents the high-resolution (250 m) global mountains version 3 derived from terrain characteristics (Karagulle et al., 2017; referred to as K3 mountains). The level-3 code for each ecoregion is also shown and they are: 1-Coast Range, 2-Puget Lowlands, 3-Willamette Valley, 4-Cascades, 5-Sierra Nevada, 8-Southern California Mountains, 9-Eastern Cascade Slopes and Foothills, 12-Snake River Plain, 13-Central Basin and Range, 14-Mojave Basin and Range, 15-Northern Rockies, 16-Idaho Batholith, 17-Middle Rockies, 18-Wyoming Basin, 20-Colorado Plateaus, 21-Southern Rockies, 25-High Plains, 26-Southwestern Tablelands, 43-Northwestern Great Plains, 58-Northeastern Highlands, 59-Northeastern Coastal Zone, 60-Northern Allegheny Plateau, 78- Klamath Mountains, and 83-Eastern Great Lakes Lowlands.
Reanalysis products support our understanding of how the precipitation phase influences hydrology across scales. However, a lack of validation data hinders the evaluation of a reanalysis-estimated precipitation phase. In this study, we used a novel dataset from the Mountain Rain or Snow (MRoS) citizen science project to compare 39,680 MRoS observations from January 2020 to July 2023 across the conterminous United States (CONUS) to assess three precipitation phase products. These products included the Global Precipitation Measurement (GPM) mission Integrated Multi-satellitE Retrievals for GPM (IMERG), the Modern-Era Retrospective Analysis for Research and Applications (MERRA-2), and the North American Land Data Assimilation System (NLDAS-2). The overall critical success indices for detecting rainfall (snowfall) for IMERG, MERRA-2, and NLDAS-2 were 0.51 (0.79), 0.49 (0.77), and 0.54 (0.53), respectively. These indices show that IMERG and MERRA-2 reasonably classify snowfall, whereas NLDAS-2 overestimates rainfall. All products performed poorly in detecting subfreezing rainfall and snowfall above 2°C. Therefore, crowdsourced data provides a unique validation source to improve the capabilities of reanalysis products.
Key Points
The Mountain Rain or Snow citizen science project collected a novel dataset of 39,680 observations of precipitation phases across the US
The precipitation reanalysis products performed poorly in detecting subfreezing rainfall and snowfall above 2°C
The crowdsourced data provides a unique validation source to improve the capabilities of reanalysis products
Plain Language Summary
Distinguishing between rain and snow is challenging. This study used a unique crowdsourced dataset from the Mountain Rain or Snow (MRoS) project to allow researchers to better assess the accuracy of reanalysis products used to differentiate rain from snow. We compared the citizen science data with results from three reanalysis products. We found that these reanalysis products all performed poorly in detecting rainfall at subfreezing rainfall or snowfall at warmer air temperatures. Crowdsourced data could help enhance methods used to determine precipitation phases and improve real-time weather forecasts.
For the first time, researchers have used more detailed criteria—like water depth and temperature—to get a more accurate idea of how many floating solar panels some U.S. reservoirs could hold. Even in their most conservative estimates, the country’s reservoirs offer huge potential for future development and could host projects with capacities of up to 77,000 megawatts. Floating solar array via the Colorado Times Recorder.
Click the link to read the release on the NREL website:
For the study, Evan Rosenlieb and Marie Rivers, geospatial scientists at the U.S. Department of Energy National Renewable Energy Laboratory (NREL), as well as Aaron Levine, a senior legal and regulatory analyst at NREL, quantified for the first time exactly how much energy could be generated from floating solar panel projects installed on federally owned or regulated reservoirs. (Developers can find specific details for each reservoir on the website AquaPV.)
And the potential is surprisingly large: Reservoirs could host enough floating solar panels to generate up to 1,476 terawatt hours, or enough energy to power approximately 100 million homes a year.
“That’s a technical potential,” Rosenlieb said, meaning the maximum amount of energy that could be generated if each reservoir held as many floating solar panels as possible. “We know we’re not going to be able to develop all of this. But even if you could develop 10% of what we identified, that would go a long way.”
Levine and Rosenlieb have yet to consider how human and wildlife activities might impact floating solar energy development on specific reservoirs. But they plan to address this limitation in future work.
This study provides far more accurate data on floating solar power’s potential in the United States. And that accuracy could help developers more easily plan projects on U.S. reservoirs and help researchers better assess how these technologies fit into the country’s broader energy goals.
Floating solar panels, also known as floating PV, come with many benefits: Not only do these buoyed power plants generate electricity, but they do so without competing for limited land. They also shade and cool bodies of water, which helps prevent evaporation and conserves valuable water supplies.
“But we haven’t seen any large-scale installations, like at a large reservoir,” Levine said. “In the United States, we don’t have a single project over 10 megawatts.”
Previous studies have tried to quantify how much energy the country could generate from floating solar panels. But Levine and Rosenlieb are the first to consider which water sources have the right conditions to support these kinds of power plants.
In some reservoirs, for example, shipping traffic causes wakes that could damage the mooring lines or impact the float infrastructure. Others get too cold, are too shallow, or have sloping bottoms that are too steep to secure solar panels in place.
And yet, some hydropower reservoirs could be ideal locations for floating solar power plants. A hybrid energy system that relies on both solar energy and hydropower could provide more reliable and resilient energy to the power grid. If, for example, a drought depletes a hydropower facility’s reservoir, solar panels could generate energy while the facility pauses to allow the water to replenish.
And, to build new pumped storage hydropower projects—which pump water from one reservoir to another at a higher elevation to store and generate energy as needed—some developers create entirely new bodies of water. These new reservoirs are disconnected from naturally flowing rivers, and no human or animal depends on them for recreation, habitat, or food (at least not yet).
In the future, the researchers plan to review which locations are close to transmission lines or electricity demand, how much development might cost at specific sites, whether a site should be avoided to protect the local environment, and how developers can navigate state and federal regulations. The team would also like to evaluate even more potential locations, including other, smaller reservoirs, estuaries, and even ocean sites.
The research was funded by the Solar Energy Technologies Office and the Water Power Technologies Office in DOE’s Office of Energy Efficiency and Renewable Energy (EERE).
Access the study to learn more about the immense potential for floating solar plants in the United States, or visit AquaPV to dig into the data on specific reservoirs.
NREL is the U.S. Department of Energy’s primary national laboratory for renewable energy and energy efficiency research and development. NREL is operated for DOE by the Alliance for Sustainable Energy LLC.
A Reclamation map, released January 10, 2025, of the upper basin showed snowpack levels — more specifically, snow water equivalent (SWE) levels — at 93% of normal for this time of year.
Click the link to read the article on the 8NewsNow.com website (Greg Haas). Here’s an excerpt:
January 10, 2025
An early season forecast indicates Lake Powell will get only about 81% of its normal water flow because of dry conditions around much of the Upper Colorado River Basin. Officials emphasized that forecasts this early can be inaccurate, and they represent the “most probable” conditions identified by the Colorado Basin River Forecast Center (CBRFC), part of the National Weather Service. The forecast was based on data collected up until Jan. 1. Lake Powell, the nation’s second-largest reservoir, is currently 37% full, according to the U.S. Bureau of Reclamation…
The Lake Powell forecast is a summary of the hydrologic conditions throughout the entire Upper Colorado River Basin,” Cody Moser, a hydrologist with CBRFC said. “Lake Powell forecasting 5,150 KAF — or thousand-acre-feet — which is 81% of the 1991 through 2020 normal.” Graphics showed the normal flow at 6,300 KAF.
The CBRFC briefing on Friday estimated the flow into Lake Powell would be below normal levels, despite good conditions in two regions that are crucial to the Colorado River’s water supply — the Colorado Headwaters and the Gunnison region.
Click the link to read the article on The Denver Post website (Noelle Phillips). Here’s an excerpt:
January 13, 2025
Five new compounds soon will be listed as priority toxic air contaminants in Colorado and, over the next two years, the state’s Department of Public Health and Environment and Air Quality Control Commission will determine out how to regulate them. The state’s Air Pollution Control Division will recommend five compounds to be regulated to the commission during its two meetings that begin Thursday. The creation of the list of toxic air contaminants is the result of a years-long effort from environmentalists and public health advocates who want the state to do more to protect people from the pollution that can cause cancers, such as leukemia and lymphoma, and lung diseases, such as asthma, and can harm women’s reproductive health. For years, environmentalists have complained that air pollution permits issued by the federal and state governments allow companies to pollute with little attention given to how much of those contaminants are dangerous to human health…
Acrolein, which is created when fossil fuels are burned by wood-burning, industrial boilers and reciprocating engines, and it is also used to make a polymer for paints, coatings and adhesives. Acute, short-term inhalation can cause eye and respiratory tract irritation. It is not considered a cancer risk.
Benzene, a carcinogen released when fossil fuels are burned, including in car exhaust and oil and gas extraction and production. It also is created by cement manufacturing, waste disposal and wood burning. Acute exposure may cause drowsiness, dizziness and headaches, as well as eye, skin and respiratory tract irritation, and unconsciousness at high levels. Chronic inhalation has caused cancer, various blood disorders and affects women’s reproductive organs, the Environmental Protection Agency has reported.
Ethylene oxide, which is used to make other products such as antifreeze, textiles, adhesives, plastics and detergents. It’s used to sterilize medical equipment, including at Terumo BTC in Lakewood to sanitize medical equipment. It causes cancers in humans, including lymphoma, myeloma, leukemia and breast cancer.
Hydrogen sulfide, highly toxic gas that smells like rotten eggs. It is released by wastewater treatment facilities, meat processing facilities, petroleum refining, manufacturing of asphalt and roofing material and places where large quantities of manure are stored. It can cause people to pass out due to high exposure. Low exposure can cause headaches, memory loss, balance problems and fatigue. It is not considered a carcinogen but data is limited on how it affects children’s health or women’s reproductive health, according to the EPA.
Hexavalent chromium is a by-product of industrial processes such as metal fabricating and by burning coal for electricity. It can leak into water systems and into the air. It can cause cancer and impact the respiratory system, kidneys, liver, skin and eyes, the EPA’s website says.
Rising seas are forcing Indigenous communities to move. Higher temperatures are causing drought and loss of traditional foods. Michael Charles, a Navajo professor at Cornell University, is trying to quantify the impact of climate change on Indigenous life in North America. Our Living Lands producer Daniel Spaulding spoke to Charles about his work. Charles’ research includes a number of environmental issues impacting Indigenous communities, including air pollution, mining, and migration. To do this, Charles is focusing on Indigenous knowledge of traditional foods, land, and climate patterns.
“We’ll continue to see those knowledge systems evolving, but we’re also going to see continued disconnect on how well we can use our past knowledge systems,” Charles said. “So it’s going to be an interesting path forward to see how we adapt and evolve.”
Click the link to read the release on the Reclamation website:
January 13, 2025
DENVER — The Bureau of Reclamation selected Peggy Mott, P.E., as the chief of dam safety. Mott will oversee Reclamation’s Dam Safety Program and is responsible for Reclamation’s high hazard potential dams. If these dams were to fail or were improperly operated could result in loss of life or significant economic loss. This oversight ensures Reclamation’s dams do not present an unreasonable risk to people, property or the environment.
Key for the success for Reclamation’s Dam Safety Program is leveraging relationships throughout Reclamation and with stakeholders. One close relationship the Dam Safety Office maintains is with the Asset Management Division, another office within the Dam Safety and Infrastructure Directorate.
“The Dam Safety and Infrastructure Directorate provides reliable stewardship and oversight of Reclamation’s diverse infrastructure portfolio. We effectively manage risk and maximize the value of Reclamation’s assets for our stakeholders and American public,” said Dam Safety and Infrastructure Director Miguel Rocha. “Peggy’s experience across multiple domains will be valuable as she takes on this important role leading the program and working with our local, regional, and national partners.”
Mott joined Reclamation 2019 in the Dam Safety Office as a program manager and supervisory civil engineer. Prior to joining Reclamation, Mott was a regional dam safety officer with the U.S. Fish and Wildlife Service. Prior to joining federal government, she worked with dams and dam safety with the Colorado Department of Natural Resources. She also served as the State Buildings Delegate for the capital construction and controlled maintenance program for the Colorado Department of Human Services. Mott began her career as a systems engineer for Lockheed-Martin.
Mott earned a Bachelor of Science in Engineering Physics from the Colorado School of Mines and a Master of Science in Civil Engineering from the University of Colorado. She is a licensed professional engineer in the state of Colorado.
US Flag at Hoover Dam as the Olympic Torch passed over the dam in 1996
Click the link to read the article on the WyoFile.com website (Angus M. Thuermer Jr.):
January 14, 2025
It took the U.S. Supreme Court 12 words and one period to dismiss more than 300 pages of legal arguments in which Utah, Wyoming and other Western states sought to establish control and ownership of millions of acres of federally managed public land.
Utah, Wyoming’s lone U.S. Rep. Harriet Hageman, state legislators, Gov. Mark Gordon and many others sought an emergency hearing to argue that the federal government illegally owns property that rightfully belongs to Western states. Wyoming and other parties filed briefs of their own supporting the Beehive State’s assertion that federal ownership was detrimental to those commonwealths.
The filings appear to be unappreciated by the justices.
“The motion for leave to file a bill of complaint is denied,” the court said in an order filed Monday.
Utah’s petition generated another 424 pages of legal entreaties by its supporters and critics, a count that includes rebuttals by the United States and the Ute Tribe.
Utah claimed the federal government could not own and control “unappropriated lands,” which are those not specifically designated for use by an enumerated federal power. Utah targeted 18.5 million acres of Bureau of Land Management property belonging to all Americans.
Beehivers first said they wanted the court to “dispose” of the BLM property, then clarified that the state just wanted the court to say it is unconstitutional for the government to hold “unappropriated” acreage.
Hageman claimed that federal ownership is an occupation equivalent to a casus belli, a situation that justifies war or conflict between nations. “[T]he standard is whether the federal government’s actions would amount to an invasion and conquest of that land if—assuming a counterfactual—Utah were a separate sovereign nation,” Hageman’s filing states.
Twenty-six Wyoming lawmakers also saddled up for Utah, urging the court to take up the case and saying their support does not mean they will not seek other federal property for the Equality State. The perturbed posse said its claims could extend to “all former federal territorial lands … now held by the United States … [including] parks, monuments, wilderness, etc.”
Six of the sympathetic signatories — Sens. Tim French (R-Powell), Larry Hicks (R-Baggs), Bob Ide (R-Casper), John Kolb (R-Rock Springs), Dan Laursen (R-Powell) and Cheri Steinmetz (R- Lingle) — voted for a draft bill that would allocate $75 million for the Legislature, independent of the executive branch or other state entities, to litigate against the federal government. Senate File 41 “Federal acts-legal actions authorized” will be considered when the Legislature convenes today.
Gordon was more reserved in Wyoming’s official state plea, alleging “harms that federal ownership … uniquely imposes on western States on a daily basis” as a reason for the Supreme Court to immediately take up the case.
This link should open in any smartphone, tablet, or computer browser, and does not require a Microsoft account. You will be able to view and hear the presentation as it is presented.
A copy of the presentation and meeting summary will be distributed to this email list and posted to our website following the meeting. If you are unable to connect to the video meeting, feel free to contact me (information below) following the meeting for any comments or questions.
The meeting agenda will include a review of operations and hydrology since August, current soil and snowpack conditions, a discussion of hydrologic forecasts and planned operations for remainder of this water year, updates on maintenance activities, drought operations, and the Recovery Program on the San Juan River. If you have any suggestions for the agenda or have questions about the meeting, please call Susan Behery at 970-385-6560, or email sbehery@usbr.gov. Visit the Navajo Dam website at https://www.usbr.gov/uc/water/crsp/cs/nvd.html for operational updates.
Crystal Dam, part of the Colorado River Storage Project, Aspinall Unit. Credit Reclamation.
From email from Reclamtion (Erik Knight):
This meeting will be held at the Western Colorado Area Office in Grand Junction, CO. There will also be an option for virtual attendance via Microsoft Teams. A link to the Teams meeting is below.
The meeting agenda will include updates on current snowpack, forecasts for spring runoff conditions and spring peak operations, the weather outlook, and planned operations for the remainder of the year.
Handouts of the presentations will be emailed prior to the meeting.
Despite below average precipitation and warm temperatures during December, snow water equivalent (SWE) is near-normal for about half the region. Below average SWE conditions exist in northern Wyoming, southwestern Colorado and southern Utah, especially in the Escalante and Virgin River Basins where SWE is less than 45% of average. The first seasonal streamflow forecasts suggest near-average runoff in Colorado (90-100%), below average runoff in Utah (80-90%) and much below average runoff in Wyoming (50-80%). Drought conditions were relatively stable during December and cover 39% of the region. Previous forecasts of emerging La Niña conditions did not prove correct; Pacific Ocean temperatures remain near-average (ENSO-neutral) and are expected to remain so through spring. NOAA seasonal forecasts suggest the possibility of above average precipitation in northern Colorado, northern Utah and Wyoming during January and in Wyoming for January-March.
December precipitation in Colorado, Utah and Wyoming was below to much below average except for portions of northern Utah and western Wyoming that saw slightly above average precipitation. Large areas of southern Utah, southern Colorado and central to southeastern Wyoming received less than 50% of December precipitation. In eastern Colorado, many locations received record-low December precipitation. Central Colorado, central Utah and western Wyoming received slightly below average December precipitation.
Regional temperatures were at least 3 degrees above average across all locations. Large areas of Colorado and Utah experienced temperatures that were 6-9 degrees above average. In Wyoming, nearly all locations were 6-9 degrees above average during December and central Wyoming average temperatures were 9-12 degrees above average. Record hot December temperatures were recorded in northern Wyoming.
Snow water equivalent was near-normal (median) for about half of the region on January 1, including most of the Upper Colorado River and Great Basins. Below normal January 1st SWE conditions prevailed in southern Utah, southwestern Colorado and northern Wyoming. The majority of river basins in Colorado and Utah saw a significant decrease in SWE conditions relative to median during December. On a statewide basis, January 1st SWE conditions in Colorado and Utah were near normal (95%) and below normal in Wyoming (83%). Southern Utah is currently experiencing the worst snow drought conditions with the Virgin River Basin at 39% normal and the Escalante River Basin at 43% normal. Six snotel sites in southwestern Utah had no snow on January 1st which set or tied the lowest SWE totals on record. An additional 3 snotel sites in Wyoming had their lowest January 1st SWE conditions on record and an additional 4 sites in Wyoming had the second lowest January 1st SWE value.
The first seasonal streamflow forecasts of the 2025 water year suggest near-average runoff in Colorado river basins and below average runoff in all other regional river basins. In Colorado, seasonal streamflow forecasts suggest between 90-100% of average runoff for all river basins. Runoff in most Utah river basins is forecasted at 80-90% of average except for the Upper Bear (94%), Lower Bear (77%), Escalante (60%) and Virgin (50%). In Wyoming, the seasonal streamflow forecast for the Upper Green, North Platte, Snake and Yellowstone is 70-80% while streamflow forecasts for the Bighorn, Cheyenne, Powder and Tongue River Basins range from 50-60% of average. Except for Blue Mesa Reservoir, below average inflow is forecasted for all other major Upper Colorado River Reservoirs including Lake Powell (81%), Flaming Gorge (69%), McPhee (76%) and Navajo (78%).
Regional drought coverage continued a decreasing trend in December and now covers 39% of the region, compared to 42% of the region in early December. Wyoming remains the epicenter of regional drought with 88% of the state experiencing drought conditions and 26% of the state in extreme drought. The area of extreme drought in the Snake River basin expanded in December. In Colorado, abnormal dry (D0) conditions emerged in the San Juan Mountains and D1 drought conditions were removed near the headwaters of the Arkansas and Colorado Rivers. Drought conditions in Utah were relatively unchanged during December.
West Drought Monitor map January 7, 2025.
Despite previous forecasts indicating the formation of La Niña conditions in the Pacific Ocean, December Pacific Ocean sea-surface temperatures were consistent with ENSO-neutral conditions and there is a 60-80% probability of ENSO-neutral conditions persisting through spring 2025. NOAA monthly forecasts for January suggest an increased probability of above average precipitation for Wyoming, northern Colorado and northern Utah. There is an increased probability of below average precipitation for southern Utah and southwestern Colorado. NOAA forecasts also suggest an increased probability for above average temperatures for the entire region during January. On the three-month timescale, there is an increased probability of above average precipitation for Wyoming and below average precipitation for southern Utah and southern Colorado. The NOAA seasonal forecast for January-March indicates an increased probability of below average temperatures in Wyoming and above average temperatures for southern Utah and southern Colorado.
The New Experimental Winter Forecast is a tool that projects December-March precipitation in the western United States using Pacific and Atlantic Ocean temperatures. The most current forecast uses October – November ocean temperatures and indicates slightly above average winter precipitation for much of the region. The regional pattern of precipitation reflects average Pacific Ocean and warm Atlantic Ocean temperatures. Slightly above average winter precipitation is forecasted for most of the region with the highest precipitation relative to average in southern Utah and the lowest in central Wyoming and eastern Colorado.
December Climate Almanac. Much above average to record hot December temperatures in Wyoming are reflected in the temperature extremes. The highest daily maximum, the minimum maximum and minimum temperatures in the region were observed in Wyoming where temperatures are typically colder than Colorado and Utah.
There are high hopes that artificial intelligence (AI) can help tackle some of the world’s biggest environmental emergencies. Among other things, the technology is already being used to map the destructive dredging of sand and chart emissions of methane, a potent greenhouse gas.
But when it comes to the environment, there is a negative side to the explosion of AI and its associated infrastructure, according to a growing body of research. The proliferating data centres that house AI servers produce electronic waste. They are large consumers of water, which is becoming scarce in many places. They rely on critical minerals and rare elements, which are often mined unsustainably. And they use massive amounts of electricity, spurring the emission of planet-warming greenhouse gases.
“There is still much we don’t know about the environmental impact of AI but some of the data we do have is concerning,” said Golestan (Sally) Radwan, the Chief Digital Officer of the United Nations Environment Programme (UNEP). “We need to make sure the net effect of AI on the planet is positive before we deploy the technology at scale.”
This week, UNEP released an issue note that explores AI’s environmental footprint and considers how the technology can be rolled out sustainably. It follows a major UNEP report, Navigating New Horizons, which also examined AI’s promise and perils. Here’s what those publications found.
First of all, what is AI?
AI is a catch-all term for a group of technologies that can process information and, at least superficially, mimic human thinking. Rudimentary forms of AI have been around since the 1950s. But the technology has evolved at a breakneck pace in recent years, in part because of advances in computing power and the explosion of data, which is crucial for training AI models.
Why are people excited about the potential of AI when it comes to the environment?
The big benefit of AI is that it can detect patterns in data, such as anomalies and similarities, and use historic knowledge to accurately predict future outcomes. That could make AI invaluable for monitoring the environment, and helping governments, businesses and individuals make more planet-friendly choices. It can also enhance efficiencies. UNEP, for example, uses AI to detect when oil and gas installations vent methane, a greenhouse gas that drives climate change.
Most large-scale AI deployments are housed in data centres, including those operated by cloud service providers. These data centres can take a heavy toll on the planet. The electronics they house rely on a staggering amount of grist: making a 2 kg computer requires 800 kg of raw materials. As well, the microchips that power AI need rare earth elements, which are often mined in environmentally destructive ways, noted Navigating New Horizons.
The second problem is that data centres produce electronic waste, which often contains hazardous substances, like mercury and lead.
Third, data centres use water during construction and, once operational, to cool electrical components. Globally, AI-related infrastructure may soon consume six times more water than Denmark, a country of 6 million, according to one estimate. That is a problem when a quarter of humanity already lacks access to clean water and sanitation.
Finally, to power their complex electronics, data centres that host AI technology need a lot of energy, which in most places still comes from the burning of fossil fuels, producing planet-warming greenhouse gases. A request made through ChatGPT, an AI-based virtual assistant, consumes 10 times the electricity of a Google Search, reported the International Energy Agency. While global data is sparse, the agency estimates that in the tech hub of Ireland, the rise of AI could see data centres account for nearly 35 per cent of the country’s energy use by 2026.
Driven in part by the explosion of AI, the number of data centres has surged to 8 million from 500,000 in 2012, and experts expect the technology’s demands on the planet to keep growing.
Some have said that when it comes to the environment, AI is a wildcard. Why is that?
We have a decent handle on what the environmental impacts of data centres could be. But it’s impossible to predict how AI-based applications themselves will affect the planet. Some experts worry they may have unintended consequences. For example, the development of AI-powered self-driving cars could cause more people to drive instead of cycling or taking public transit, pushing up greenhouse gas emissions. Then there are what experts call higher-order effects. AI, for example, could be used to generate misinformation about climate change, downplaying the threat in the eyes of the public.
Is anybody doing anything about the environmental impacts of AI?
More than 190 countries have adopted a series of non-binding recommendations on the ethical use of AI, which covers the environment. As well, both the European Union and the United States of America have introduced legislation to temper the environmental impact of AI. But policies like those are few and far between, says Radwan.
“Governments are racing to develop national AI strategies but rarely do they take the environment and sustainability into account. The lack of environmental guardrails is no less dangerous than the lack of other AI-related safeguards.”
How can the world rein in the environmental fallout from AI?
In the new issue note, UNEP recommends five main things. Firstly, countries can establish standardized procedures for measuring the environmental impact of AI; right now, there’s a dearth of reliable information on the subject. Secondly, with support from UNEP, governments can develop regulations that require companies to disclose the direct environmental consequences of AI-based products and services. Thirdly, tech companies can make AI algorithms more efficient, reducing their demand for energy, while recycling water and reusing components where feasible. Fourthly, countries can encourage companies to green their data centres, including by using renewable energy and offsetting their carbon emissions. Finally, countries can weave their AI-related policies into their broader environmental regulations.
UNEP is focused on helping the world better navigate the environmental challenges of tomorrow. To do that, we have ramped up our work on strategic foresight, scanning the horizon for emerging threats to the planet. This process culminated in the development of Navigating New Horizons – A Global Foresight Report on Planetary Health and Human Wellbeing, which was published earlier this year. Produced in collaboration with the International Science Council, it examined eight global shifts accelerating the triple planetary crisis of climate change, nature and biodiversity loss, and pollution and waste.
Click the link to read the article on the Pagosa Springs Sun website (Garrett Fevinger). Here’s an excerpt:
January 9, 2025
As of Jan. 8, the statewide snowpack pack stood at 95 percent of the 30-year median, according to data from the Natural Resources Conservation Service (NRCS) — an improvement from weeks earlier when those levels tracked significant lower.
The San Miguel, Dolores, Animas, and San Juan basins measured to be at 84 percent of its 30-year median snowpack as Individual local levels were slightly lower, with the Upper San Juan area at 73 percent of its median snowpack, the Piedra area at 79 percent, and the Conejos area at 60 percent of its median. As of Jan. 8, 45 inches of snow were measured atop the Wolf Creek summit, which sits at 68 percent of its median snowpack, according to the NRCS.
River flows
The San Juan River was flowing at a rate of 42.9 cubic feet per second (cfs) through Pagosa Springs as of 9 a.m. Wednesday, according to the U.S. Geological Survey. Based on 89 years of water records, the median flow for the same date is 54 cfs, with a record high flow of 112 cfs in 1987. The lowest recorded flow for the date is 28 cfs in 1990.
Much of the irrigation infrastructure and technology on the Southern Ute Reservation in Colorado is antiquated. The channel on the right looks much as it did in the 1950s photo on the left. Source: Tribal Water Study Basic projects, like expanding a water treatment plant or installing a new drinking water pipeline, can advance at a glacial pace, as tribes must deal with a variety of different federal agencies to get them approved. Even when funding is available, it can be difficult to launch projects as tribes often lack the resources to navigate the various regulations, fees and environmental reviews. Credit: Water Education Foundation
The federal government awarded $4.25 million to the Colorado-based Southern Ute Indian Tribe this week to defend tribal water resources from climate-related challenges. The Bureau of Indian Affairs Tribal Community Resilience branch distributed grants to 124 projects nationwide, with funding pooled from the Bipartisan Infrastructure Law, the Inflation Reduction Act and the 2024 federal budget…
Across the state, warming fueled by climate change is ratcheting up average temperatures, which can lead to drought conditions. Southcentral and southwestern Colorado – where the Southern Ute Indian Reservation is located – have seen the largest temperature increases statewide, according to Colorado State University’s 2024 State of the Climate report. Spring rain in southwest Colorado has also decreased by over 20 percent compared to 1951-2000, according to the report.
The federal funding will support two projects to restore the ecology of waterways on the reservation and fortify irrigation systems.
A $250,000 grant will support the tribe’s environmental programs department to assess, and eventually restore, the Pine River watershed, which is facing impacts from drought and sediment pollution. The funding will allow the tribe to undertake a detailed assessment and devise a treatment plan for several waterways. Another $4 million grant to the tribe’s water resources division will shore up an irrigation system that delivers water to around 4,000 acres. The funding will allow the tribe to replace old infrastructure and construct new weirs — or low barriers built across waterways — on seven sites on the Pine River canal. The goal is to help the tribe maintain consistent water levels for irrigation, even as a lack of rain and increased evaporation dip into water supplies.
Animas River. Photo credit: The Southern Ute Indian Tribe
Annual precipitation for the contiguous U.S. was 31.58 inches, 1.66 inches above average, ranking in the wettest third of the historical record (1895–2024).
The Atlantic basin saw 18 named tropical cyclones and five landfalling hurricanes during 2024—an above-average season. Hurricane Helene was the seventh-most-costly Atlantic hurricane on record.
The tornado count for 2024 was second highest on record behind 2004 (1,817 tornadoes) with at least 1,735 confirmed tornadoes. When looking at EF-2+ tornadoes, 2024 was the most active year since the historic 2011 season.
Hurricane Helene’s extensive damage topped the list of 27 separate billion-dollar weather and climate disaster events identified during 2024—the second-highest annual disaster count in the 45-year record.
Drought coverage across the contiguous U.S. ranged from a minimum extent of 12 percent on June 11—the smallest contiguous U.S. footprint since early 2020—to a maximum coverage of 54 percent on October 29.
Other Highlights:
Temperature
For the year, temperatures were much-above average across nearly the entire contiguous U.S., with record warm temperatures across parts of the Southwest, Deep South and from the Upper Midwest to the central Appalachians and into the Northeast. Seventeen states (Texas, Oklahoma, Minnesota, Wisconsin, Michigan, Indiana, Ohio, Kentucky, Tennessee, West Virginia, Virginia, Pennsylvania, Maryland, New York, Vermont, New Hampshire and Maine) ranked warmest on record while all but two remaining states across the Lower 48 ranked as one of the warmest five years on record. The U.S. Climate Reference Network (USCRN) also indicated that 2024 was the warmest year on record (2005–24).
The Alaska January–December temperature was 28.9°F, 2.9°F above the long-term average, ranking in the warmest third of the 100-year record for the state. Much of the state had temperatures that were above average for the 12-month period with pockets of near average conditions in the southern and eastern mainland as well as the Panhandle.dle.
Precipitation
Precipitation was above average across portions of the West, central Rockies, Deep South, Upper Midwest, Great Lakes, Southeast and Northeast. Precipitation was below average across much of the Northern Rockies and Plains, parts of the Southwest and portions of the Ohio Valley and Mid-Atlantic region. Louisiana ranked 10th wettest for this 12-month period.
January–December 2024 ranked near the middle of the 100-year record for Alaska, with below-average precipitation observed across parts of the Aleutians, Northwest Gulf, Cook Inlet, Northeast Gulf and much of the Panhandle region. Average- to above-average precipitation occurred throughout much of the rest of the state.
Billion-Dollar Weather and Climate Disasters
The Billion-Dollar Weather and Climate Disasters update is a quantification of the weather and climate disasters that in 2024 led to more than $1 billion in collective damages for each event. During 2024, the U.S. experienced 27 weather and climate disasters each incurring losses that exceeded $1 billion. 2024 ranked second highest for the number of billion-dollar disasters in a calendar year. These disasters included: 17 severe storms, five tropical cyclones, two winter storms, one flooding event, one drought/heat wave and one wildfire event.
The U.S. cost for these disasters in 2024 was $182.7 billion and was fourth highest on record. The total annual cost may rise by several billion as additional costs from identified events are reported over time. There were at least 568 fatalities associated with these events—the eighth-highest number of fatalities on record. The costliest events in 2024 were:
Hurricane Helene was the costliest event in 2024. It made landfall as a Category 4 storm in the Big Bend region of Florida on September 26, caused catastrophic flash flooding and power outages impacting millions of people from Florida to North Carolina and resulted in at least 219 fatalities. Helene was the deadliest Atlantic hurricane since Maria (2017) and the deadliest to strike the U.S. mainland since Katrina (2005). The current estimated total cost of this disaster was $78.7 billion.
Category 3 Hurricane Milton made landfall near Tampa, Florida on October 9, caused widespread power outages and flooding and spawned tornadoes across the state. The current estimated total cost of this disaster was $34.3 billion.
Over the last 10 years (2015–24), 190 separate billion-dollar disasters have killed at least 6,300 people and cost approximately $1.4 trillion in damage.
This is also a record 14th consecutive year where the U.S. experienced 10 or more billion-dollar disasters and the fifth consecutive year (2020–24) where 18 or more billion-dollar disasters impacted the U.S.
Since records began in 1980, the U.S. has sustained 403 separate weather and climate disasters where overall damages/costs reached or exceeded $1 billion (based on the CPI adjustment to 2024) per event. The total cost of these 403 events exceeds $2.915 trillion.
Tropical Cyclones
Record- to near-record sea surface temperatures in the Atlantic basin helped fuel the active season that formed 18 named tropical systems during 2024. Eleven of these storms were hurricanes (tied with 1995 for fifth highest on record), including five that intensified to major hurricanes (tied with 1995, 1999, 2008 and 2010 for sixth highest), two of which were Category 5 storms. Five of these 11 hurricanes made landfall in the U.S. (tied with 1893, 2004 and 2005 for fourth highest) and include: Hurricanes Beryl, Debby, Francine, Helene and Milton. Hurricane Helene was the seventh-most-costly Atlantic hurricane on record.
Tornadoes
As the Storm Prediction Center continues to confirm the tornadoes that occurred during 2024, the current count is 1,735, which is the second-highest number of confirmed tornadoes on record (2004 had 1,817) and 142 percent of the 30-year (1991–2020) average of 1,225. Four EF-4 tornadoes were confirmed during 2024 and occurred in: Elkhorn, Nebraska (April 26), Marietta, Oklahoma (April 27), Barnsdall, Oklahoma (May 6) and Greenfield, Iowa (May 21).
Wildfires
The number of wildfires in 2024 was approximately 90 percent of the 20-year (2001–20) average with more than 61,000 wildfires reported over the year. The total number of acres burned from these wildfires—8.8 million acres—was 26 percent above the 20-year average of nearly seven million acres. The Park Fire, the fourth-largest wildfire in California history, burned nearly 430,000 acres and destroyed over 600 structures.
Alaska saw a below average wildfire year, with approximately 667,000 acres burned during the 2024 fire season—about two-thirds of the state’s seasonal average.
Drought
The year began with approximately 33 percent of the contiguous U.S in drought. Drought coverage shrank as the year progressed and reached the minimum extent for the year at 12 percent on June 11—the smallest contiguous U.S. drought footprint since early 2020. As the summer progressed, hot and dry conditions led to the expansion of drought across the Southeast and Mid-Atlantic as well as across the Plains. By October 29, the extent of drought peaked for the year with more than half of the contiguous U.S. (54 percent) in drought, covering significant portions of the Northwest, Southwest, northern and central Rockies, Plains, Great Lakes, the western and central Gulf Coast states as well as the central Appalachians, Mid-Atlantic and portions of the Northeast.
Snowfall
The 2023–24 snow season was above average across the southern Cascades, Sierra Nevada, Bitterroots, central and southern Rockies as well as portions of the Adirondack, Green and White mountains in the Northeast. Seasonal snowfall was at least three or more feet below average across parts of the northern Cascades, northern Rockies, the northern Plains as well as much of the Great Lakes and Northeast.
The 2024–25 snowfall season to-date from October 1–December 31, 2024 saw above-average snowfall for locations along the West Coast impacted by early-season atmospheric river events. This includes much of the Cascades, northern Sierra Nevada range, Bitterroots as well as the highest elevations of the central Rockies and adjacent Plains along with locations downwind of the Great Lakes. Snowfall deficits prevailed across the southern Sierra Nevada range and from the northern Rockies to the Upper Midwest and across portions of New England.
Climate Extremes Index
The U.S. Climate Extremes Index (USCEI) for 2024 was more than double the average value, ranking highest in the 115-year record. Extremes in warm maximum and minimum temperatures were both highest on record and the primary contributors to this elevated USCEI value for the nation as well as the regions. In addition, all nine climate regions’ USCEI values ranked in the top-10 percent of extremes. Annual extremes across the Southeast and South regions were highest and second highest on record, respectively, and can also be attributed to extremes in one-day precipitation. Near-record extremes across the Upper Midwest were also due to elevated extremes in one-day precipitation and ranked third highest. Across the Northeast, wet Palmer Drought Severity Index (PDSI) values and the number of days with precipitation were elevated and across the Northwest, extremes in one-day precipitation and days with precipitation contributed to the much-above average USCEI values for 2024. The USCEI is an index that tracks extremes (falling in the upper or lower 10 percent of the record) in temperature, precipitation, drought and landfalling tropical cyclones across the contiguous U.S.
Cold Mountain Rancher Bill Fales turns the headgate of the Lowline Ditch. Fales is participating in a non-diversion agreement with the Colorado Water Trust to keep more water in the Crystal River. CREDIT: HEATHER SACKETT/ASPEN JOURNALISM
Irrigation is a major source of water waste in Snowmass, a critical issue as the town draws entirely from local streams. Once diverted, much of the water never follows its natural course to the Colorado River, according to Water Resource Manager Darrell Smith, who presented to the Environmental Advisory Board earlier this week.
“Water is a scarce resource on the Western Slope and in the Colorado Basin as a whole,” Smith told The Aspen Times on Thursday. “So it’s part of doing our part to not use the water we have available to excess.”
Many second homeowners expect their lawn is green, and plants are watered by the time they arrive for the summer months, Smith said. The top 10% of Snowmass irrigators triple the average rate of water use…The Roaring Fork Valley watershed provides 10% of the total water volume to the Colorado River Basin, according to the Roaring Fork Conservancy. But the river no longer reaches the Pacific Ocean. It dries up in Northwestern Mexico due to human water usage, according to USGS. The Colorado River is predicted to drop 29% by 2050 in the Upper Colorado River Basin due to a hotter and drier climate, according to a 2021 USGS study...When temperatures increase, plants need more water, and people irrigate more, drawing more from the watershed, according to him…
As it stands, 35% of annual water usage in single family Snowmass residences comes from irrigation, primarily between June and September, he said. The top 10% of irrigators use 2,100 gallons per day — three times the 700 gallons used by the average Snowmass irrigator. While 95% of indoor water use returns to streams, only 20% of irrigated water returns, according to Smith.
This past year, 2024, was the warmest ever measured for the global ocean, following a record-breaking 2023. In fact, every decade since 1984, when satellite recordkeeping of ocean temperatures started, has been warmer than the previous one.
A warmer ocean means increased evaporation, which in turn results in heavier rains in some areas and droughts in others. It can power hurricanes and downpours. It can also harm the health of coastal marine areas and sea life – coral reefs suffered their most extensive bleaching event on record in 2024, with damage in many parts of the world.
Warming ocean water also affects temperatures on land by changing weather patterns. The EU’s Copernicus Climate Change Service announced on Jan. 10 that data showed 2024 had also broken the record for the warmest year globally, with global temperatures about 2.9 degrees Fahrenheit (1.6 Celsius) above pre-industrial times. That would mark the first full calendar year with average warming above 1.5 C, a level countries had agreed to try to avoid passing long-term.
Many regions of the world were much warmer than the 1991-2020 average in 2024, including large areas of ocean. C3S / ECMWF, CC BY
Climate change, by and large, takes the blame. Greenhouse gases released into the atmosphere trap heat, and about 90% of the excess heat caused by emissions from burning fossil fuels and other human activities is absorbed by the ocean.
But while it’s clear that the ocean has been warming for quite some time, its temperatures over the past two years have been far above the previous decades. That leaves two mysteries for scientists.
It’s not just El Niño
The cyclic climate pattern of the El Niño Southern Oscillation can explain part of the warmth over the past two years.
During El Niño periods, warm waters that usually accumulate in the western equatorial Pacific Ocean move eastward toward the coastlines of Peru and Chile, leaving the Earth slightly warmer overall. The latest El Niño began in 2023 and caused global average temperatures to rise well into early 2024.
Sea surface temperatures have been running well above average when compared with all years on record, starting in 1981. The orange line is 2024, dark grey is 2023, and red is 2025. The middle dashed line is the 1982-2011 average. ClimateReanalyzer.org/NOAA OISST v2.1, CC BY
But the oceans have been even warmer than scientists expected. For example, global temperatures in 2023-2024 followed a similar growth and decline pattern across the seasons as the previous El Niño event, in 2015-2016, but they were about 0.36 degrees Fahrenheit (0.2 Celsius) higher at all times in 2023-2024.
Scientists are puzzled and left with two problems to solve. They must figure out whether something else contributed to the unexpected warming and whether the past two years have been a sign of a sudden acceleration in global warming.
The role of aerosols
An intriguing idea, tested using climate models, is that a swift reduction in aerosols over the past decade may be one of the culprits.
Aerosols are solid and liquid particles emitted by human and natural sources into the atmosphere. Some of them have been shown to partially counteract the impact of greenhouse gases by reflecting solar radiation back into space. However, they also are responsible for poor air quality and air pollution.
Many of these particles with cooling properties are generated in the process of burning fossil fuels. For example, sulfur aerosols are emitted by ship engines and power plants. In 2020, the shipping industry implemented a nearly 80% cut in sulfur emissions, and many companies shifted to low-sulfur fuels. But the larger impact has come from power plants reducing their emissions, including a big shift in this direction in China. So, while technologies have cut these harmful emissions, that means a brake slowing the pace of warming is weakened.
Is this a warming surge?
The second puzzle is whether the planet is seeing a warming surge or not.
Temperatures are clearly rising, but the past two years have not been warm enough to support the notion that we may be seeing an acceleration in the rate of global warming.
Analysis of four temperature datasets covering the 1850-2023 period has shown that the rate of warming has not shown a significant change since around the 1970s. The same authors, however, noted that only a rate increase of at least 55% – about half a degree Celsius and nearly a full degree Fahrenheit over one year – would make the warming acceleration detectable in a statistical sense.
Chart: The Conversation/CC-BY-NDSource: NOAAGet the dataEmbed Download imageCreated with Datawrapper
From a statistical standpoint, then, scientists cannot exclude the possibility that the 2023-2024 record ocean warming resulted simply from the “usual” warming trend that humans have set the planet on for the past 50 years. A very strong El Niño contributed some natural variability.
From a practical standpoint, however, the extraordinary impacts the planet has witnessed – including extreme weather, heat waves, wildfires, coral bleaching and ecosystem destruction – point to a need to swiftly reduce carbon dioxide emissions to limit ocean warming, regardless of whether this is a continuation of an ongoing trend or an acceleration.
Exposed shoreline of the Great Salt Lake in Utah (USA). The lake’s level has dropped 14 feet (4.2 meters) over the past three decades, creating an enormous public health threat from windblown dust, placing global seafood production at risk, and disrupting a continental migratory flyway. Photo by Brian Richter
Click the link to read the article on the Sustainable Waters website (Brian Richter):
January 8, 2025
In recent years I’ve had the great fortune to be able to work with some amazing teams of researchers to explore the causes of water scarcity across many geographies, including the Colorado River, the Rio Grande, the Western US, and around the globe. Importantly, we’ve gone beyond just documenting the problems or threats caused by water shortages and have offered effective, proven solutions for sustainably rebalancing over-drafted water budgets. Our studies have looked at ways of conserving water in irrigated agriculture through crop shifting and other on-farm strategies as well as ways to conserve water in cities and industries.
Our just-published study of the Great Salt Lake in Utah (USA) was one of the most fascinating and enjoyable projects I’ve been involved with. I learned a great deal from our research!
I came to appreciate the hydrologic hyper-sensitivity of endorheic (lacking outflow) lakes. The Great Salt Lake is the largest saline lake in North America and the eighth largest in the world. Other big ones include the Aral Sea in Kazakhstan and Uzbekistan and Lake Urmia in Iran. All of these lakes teeter on a delicate balance between river inflows and evaporative losses from the lakes. The Great Salt Lake began to slip into long-term deficit way back in the mid-1800s when Mormon settlers from the eastern US began to capture the inflowing water from tributary rivers to expand their irrigated farms. The ensuing slow shrinkage of the lake was briefly interrupted by huge snowfalls in the 1980s and 1990s, but climate warming began to accelerate the lake’s demise since 2000. The lake dropped 14 feet (4.2 meters) and lost two-thirds of its volume during the past three decades.
The primary cause of the lake’s decline is the diversion of nearly two-thirds of the inflowing water for use in cities, industries, and irrigated farming. Farms are by far the biggest anthropogenic water consumer, accounting for 71% of water consumption, and 80% of this farm water goes to irrigated cattle-feed crops (alfalfa and grass hay). Credit: Brian Richter
Credit: Brian Richter/Sustainable Waters
The outsized contribution of irrigated cattle-feed crops to water shortages is repeated in most other river basins in the western US, and in many other water-scarce regions of our planet. As I’ve said in previous blogs, farmers and ranchers grow these crops for a simple business reason: our beef and dairy demands create a price for these crops that is quite attractive to farmers. In the past two decades, dairy consumption in the US has risen by 12%, driven mostly by increased demand for yogurt (+220%) and cheese (+28%).
In our paper, we took a close look at a variety of ways to rebalance the Great Salt Lake’s water budget by reducing production of these cattle-feed crops, along with urban and industrial water conservation. We concluded that saving the Great Salt Lake will require an overall reduction of consumptive water use by 35%; a reduction of 15% is needed to stabilize the lake to keep it from declining further, and another 20% will be needed to replenish the lake to an ecologically safe level.
Saving the Great Salt Lake will come with an eye-popping price tag: it will take at least $100 million per year for a decade to get the lake back to a safe level. However, when you put that cost in perspective, it translates to about $29 per Utah resident per year, or far less than 1% of the state’s annual budgets.
The challenges of water scarcity are growing rapidly with climate warming in many regions of the globe. Given that nearly 90% of all “blue” water (from rivers, lakes, aquifers) consumed in the world goes to irrigated agriculture, resolving water scarcity and keeping pace with climate change is going to necessarily require not just unprecedented levels of urban water conservation but also a massive transformation of what we grow on farms, and how we grow it. Because these agricultural changes commonly elicit fierce political resistance and high costs, political leaders are loathe to touch it. However, illustrative success stories are emerging around the world, demonstrating that with proper consideration of farmer needs, values, and cultures, and with financial compensation and technical support to ease difficult transitions, we can meet these challenges.
It begins by acknowledging the nature and size of the challenge, and demanding bold leadership from our decision makers. We can only run from water shortages and climate change for so long before truly disastrous consequences befall us.
Sunset from the western shore of Antelope Island State Park, Great Salt Lake, Utah, United States.. Sunset viewed from White Rock Bay, on the western shore of Antelope Island. Carrington Island is visible in the distance. By Ccmdav – Own work, Public Domain, https://commons.wikimedia.org/w/index.php?curid=2032320
Attendees of the Colorado River Water Users Association watch negotiators Estevan López of New Mexico and Becky Mitchell of Colorado speak on a panel Thursday, December 5, 2024, at the Paris Hotel and Casino. The Upper and Lower basin states are at an impasse about how cuts will be shared and reservoirs operated after 2026. CREDIT: LUKE RUNYON/THE WATER DESK
Click the link to read the article on the InkStain.net website (Jack Schmidt and Eric Kuhn):
January 9, 2024
The press coverage of the December 2024 Colorado River Water Users Association (CRWUA) meeting mostly focused on the ongoing stalemate between representatives of the Upper and Lower Division States over their competing proposals for how the Colorado River Systems’ big reservoirs will be operated after the 2007 Interim Guidelines terminate in 2026. The headlines included words such as “turbulent”, “bitter”, “bluster”, and “spar”. Indeed, there was tension in the air, and the potential for interstate litigation was a topic of much discussion both on the formal agenda and in the hallways where, traditionally, progress is often made between competing interests.
While the press focus on the tension and divisiveness was unavoidable, I believe that there were good reasons for some guarded optimism.
For the ongoing effort to renegotiate the post-2026 operating guidelines, a consortium of seven environmental NGOs has also made a detailed proposal. Their proposal is referred to as the “Cooperative Conservation” proposal. One of the four action alternatives that Reclamation will analyze, Alternative #3, is patterned after the NGO submittal. At CRWUA, John Berggren of Western Resource Advocates, who along with Jennifer Pitt and others prepared the proposal, made a presentation on the proposal. Like the other submitted proposals, the cooperative conservation alternative proposes sophisticated operational rules for Lakes Mead and Powell based on combined system storage and actual hydrology. Where the Cooperative Conservation proposal breaks new ground is the concept of a Conservation Reserve Pool, and this idea could lead the basin toward a practical on-the-ground solution. Indeed, the Gila River Indian Community introduced at CRWUA a similar concept in the form of a Federal Protection Pool made up of stored water in both Lake Powell and Lake Mead. These proposals, taken separately, together, or in some combined and moderated form, might serve as a catalyst for compromise.
As proposed, both the Conservation Reserve Pool and the Federal Protection Pool would be filled with water conserved by reductions in consumptive use and perhaps augmentation from programs in both basins and this water could be stored anywhere in the system. This water would be “operationally neutral” and thus invisible to the underlying system management operating rules. From an accounting perspective, this Pool would “float” above other water in the reservoirs. Floating Pools operate separately from and above the prior appropriation system of water allocation on the Lower River and are invisible to the rules that dictate annual releases from Glen Canyon Dam. Thus, these proposals impart important operational flexibility. In many ways, Floating Pools split the baby—they incentivize innovative conservation measures that allow participants to find value they would not have been able to realize under the prior appropriation system—yet they insulate the prior appropriation system and thus are more protective of higher-priority water users than operationally non-neutral ICS. It’s a stretch to say there is something here for everyone, but there may be enough to kick-start otherwise stalled conversations.
In their proposal, the Lower Division States have offered to take up to 1.5 maf/year of mainstem shortages. Where the two basins remain deadlocked is what happens in those years when shortages exceed the amount the Lower Division States are willing to accept. The Lower Division States have proposed that the two basins share the additional required shortages up to a maximum shortage of 3.9 maf/year. The Upper Division States have said, “No, because we already suffer large hydrologic shortages in dry years, and we have not used our full compact entitlement; the Lower Division should cover all of the shortages.” In their presentation, however, the Upper Division Commissioners (UCRC members) left the door open for continuing discussions between the two divisions. In his remarks, New Mexico Commissioner Estevan Lopez stated that under what he referred to as “parallel activities”, the Upper Division States might be willing to discuss conserving “100,000, maybe 200,000 acre-feet per year.”
Water in Floating Pools could be used for a variety of purposes including environmental management, fostering binational programs, and supplementing scheduled water deliveries. During his CRWUA presentation, John Berggren mentioned an obvious use for this pool. Water stored in the Pool by conserved consumptive use programs in the Upper Division States could be used as an Upper Division contribution during years when mainstem shortages to the Lower Division States exceed a negotiated amount. Of course, the Lower Basin is unlikely to accept Upper Basin creation of Floating Pools made up of water for which there is no current consumptive use. This water is already “system water” and is now being used by existing Lower Basin water agency. Thus, it would be necessary to develop a program to account for and certify savings in the Upper Basin. Further, the thorny problem of shepherding (legally protecting the conserved water so that it ends up in system storage) needs to be overcome. For a perspective on this issue, see Heather Sacket. Undeveloped Tribal water is a controversial sticking-point in this regard, with strong feelings and strong arguments on all sides.
If the Upper Division States were to conserve 200,000 acre-feet per year for five years and deposit that saved water in a conservation reserve “Floating Pool”, something like 900,000 acre-feet could be available for shortage sharing (after accounting for reservoir evaporation). (We use 900,000 af as an example only, how much water the Upper Division States would have to contribute and maintain in a Floating Pool would have to be negotiated between the two divisions.) In their presentation, the Lower Division principals pointed out that had their proposal been in place beginning in 2007, there has yet to be a year when shortage sharing would have been required. Note, this conclusion is very sensitive to “initial conditions.” In 2007, total storage in Lake Mead and Lake Powell was about 8 maf more than it is today. If the 21st century hydrology continues, shortages greater than 1.5 maf/year are likely to occur.
Carefully crafted with appropriate guardrails, Floating Pool concepts can be a catalyst for compromise between the two divisions that give both parties something they need.
How do Floating Pool alternatives fit with the Schmidt, Kuhn, Fleck management approach? Based on our conversations with the authors of the cooperative conservation proposal, we believe the two approaches agree — that our management proposal fits on top of and complements their proposal quite well. In my presentation at CRWUA, I emphasized that, like future hydrology, there is great uncertainty in the future needs of the river’s ecosystem and society’s values. It’s almost a certainty that in the future, prescribed annual releases from Glen Canyon Dam will cause an unacceptable and unanticipated outcome to some river or reservoir resource. When that happens, our flexible management approach and accounting system keeps the basins “whole.”
Is using the concept of Floating Pools as a catalyst to break the stalemate between the two basins without warts? – of course not. There are important considerations regarding the use of undeveloped water—Tribal or otherwise, and the devil is in the details when it comes to developing appropriate guardrails for annual and total accumulation in such a Pool, the number and type of participants, annual debits, and other important qualifications. Even conserving 100,000 acre-feet per year in the Upper Division States, with acceptable verification, could be a stretch, especially if there is less federal money in the future, as there almost certainly will be. Finally, it might put off addressing fundamental problems with the law of the river until the new post-2026 operating rules again expire. When they do, the 1922 Compact and 1944 Treaty with Mexico will still be in place, and these agreements collectively allocate 17.5 maf/year of consumptive use on a river that is only producing 13-13.5 maf/year of water at the international boundary (and runoff continues to decline). What the Floating Pool concept might accomplish is to significantly reduce the temptation and threat of unpredictable interstate litigation, keep the basin’s stakeholders talking to each other, and give us time to move toward more foundational change in how the river is managed.
Map of the Colorado River drainage basin, created using USGS data. By Shannon1 Creative Commons Attribution-Share Alike 4.0
Click the link to read the article on the Land Desk website (Jonathan P. Thompson):
January 7, 2025
🥵 Aridification Watch 🐫
Detail from an 1852 map of the Great Salt Lake by J.W. Gunnison and Charles Preuss.
About 18,000 years ago, Lake Bonneville spread across about 20,000 square miles of what is now northwestern Utah. It was some 1,000 feet deep in places during its maximum extent, was fed by snowmelt and runoff from the mountains, and discharged into the Snake River in Idaho. Over the millennia, climate change shrunk the lake, leaving behind the Great Salt Lake and vast salt flats — shimmering plains of light and ghosts of that ancient water body.
In 1847, upon seeing the remnants of Lake Bonneville, Brigham Young declared it the “right place” for the nascent Church of Jesus Christ of Latter Day Saints to set up its base. Perhaps that was simply because he and his followers were tired of traveling, or maybe he sensed the more-than-passing resemblance to the Dead Sea in the Judeo-Christian holy lands. In any event, the new settlers eventually introduced large-scale agriculture, a rapidly growing population, and industry to the valley — all of which consumed water that would otherwise run into the lake — and eventually the Great Salt Lake began shrinking yet again. In 2022 it reached a record low level, covering just 860 square miles, compared to 2,500 back in the late 1980s.
The Great Salt Lake in 1987 and in 2021. The water dropped so low that Antelope Island ceased being an island. Source: Google Earth.
One culprit is the climate change-exacerbated mega-drought that has dragged on for over two decades. The other is the same infliction that plagues nearly every other Western water body: overconsumption. And a new, detailed accounting of consumption on the lake’s feeder streams finds that the biggest consumer is agriculture, and the crops responsible for guzzling the most water are cattle feed crops such as alfalfa and grass hay.
Though it’s not surprising, it’s always a bit of a downer to be reminded that my Chunky Monkey, green-chile cheeseburger, and yogurt habits are contributing to the depletion of not just the Colorado River, but also the Great Salt Lake.
Source: “Reducing Irrigation of Livestock Feed is Essential to Saving Great Salt Lake” by Brian Richter, et al.
And rescuing it, the authors say, will “require a massive transformation of agricultural production in the basin, particularly in cattle-feed production. Failure to implement the agricultural adjustments needed to arrest the decades-long decline of the lake will lead to serious and escalating threats to regional-scale public health, a continental-scale migratory flyway, and global-scale shocks in seafood production.”
The new study’s findings include:
“The lake’s shrinkage is attributable to anthropogenic consumption of 62% of river water that would have otherwise reached and replenished the lake.”
The Great Salt Lake reached its highest level in more than a century in 1987, following a series of extremely wet winters, but has been dropping by about four inches per year on average since then. From 1989 to 2022, the lake lost 10.2 million acre-feet and the surface level dropped 14 feet.
Lake shrinkage is bad for human health because it mobilizes dust containing toxic heavy metals such as arsenic, copper, lead, zinc, cadmium, mercury and other metals, many of them from mining runoff.
Great Salt Lake is the world’s largest supplier of brine shrimp eggs, a key food source for the aquaculture industry. As the lake shrinks, salinity increases, stressing the brine shrimp and lower production.
The lake is a crucial nexus within Pacific Flyway, and the birds eat brine shrimp and brine flies. Wilson’s Phalaropes and Eared Grebes are threatened by the decline of GSL, and they could be listed under the Endangered Species Act, which could impact industry around the lake.
Aggregate water consumption from both anthropogenic and environmental (riparian evapotranspiration and lake evaporation) sources exceeded lake inputs from river inflows and direct precipitation by 309,664 acre-feet per year on average from 1989-2022.
Irrigated farms now cover 791 square miles within the basin, with 70% of the acreage dedicated to growing cattle feed crops. There’s also public land grazing leases, which cover more than half of the 21,000-square-mile Great Salt Lake basin and provide additional forage for about 10% of all cattle in the basin.
The 2022 U.S. Agricultural Census counted nearly 1 million cattle within the basin; about 70% were beef and 30% dairy.
Alfalfa farms within GSL basin produce an average of 3.7 tons per acre, for a total of 951,889 tons per year, or a little over half of all the alfalfa grown in Utah.
Alfalfa water use per year is estimated at 617,034 acre-feet and other hay use 291,695 acre-feet, for a grand total of more than 900,000 acre-feet (or about 57% of all anthropogenic uses in the basin).
About 38% of the cattle feed grown in the basin stays in the basin, with about 25% exported to the Snake River basin in Idaho, and 13% going to California, the nation’s leading milk producer. An estimated 17% is exported internationally, primarily to China and the Middle East.
Cattle feed crops in the basin produced an estimated $162 million in cash receipts in 2021, or about .07% of Utah’s GDP. But alfalfa prices jumped about 85% between 2000 and 2021, mainly driven by rising demand from dairy as Americans eat more yogurt and cheese. That makes alfalfa a more lucrative crop for its growers, and ceasing production would have an outsized local impact.
Currently the lake is suffering from an annual water deficit of about 310,000 acre-feet. But researchers believe the strains of climate change will keep driving the deficit higher, and point to the need to bring the lake back up from its diminished levels. Some are pushing for up to 1 million acre-feet in consumption cuts per year, but Richter and company are suggesting a more politically palatable 650,000 acre-feet per year. Still, that’s a boatload of water.
So how to get there? Once again the obvious solution — stop growing alfalfa — is also the most contentious, and far more complicated than it appears. The economic impact would be devastating locally, and would also change the communities’ cultures. Farmers tend to hold the most senior water rights, meaning they legally can continue to use that whatever however they please. And paying farmers to fallow that much land would not only be prohibitively expensive, but also would create other problems, such as dust and noxious weed proliferation.
The authors present a range of less drastic, but still ambitious — and painful — options, including:
They found they could reduce crop water consumption by 91,500 acre-feet per year by replacing alfalfa with winter wheat. Split-season irrigation, or reducing the number of cuttings from three to one, could save another 477,130 acre-feet (but would reduce alfalfa and hay production by 61%).
Combining split-season irrigation and partial fallowing could achieve the 650,000 acre-feet target, but it would cost $76 million per year for foregone alfalfa production plus $21 million for reduced grass hay production.
If the municipal and industrial and mineral extraction sectors cut consumption by 20%, it could reduce the deficit by about 110,000 acre-feet, leaving agriculture to pick up the remaining 550,000 acre-feet through the above strategies.
Temporary leasing of agricultural water rights would cost as much as $423 million annually, but would give farmers more flexibility over what they do with the land (and it would only be temporary).
“Ultimately the debate about whether to save the GSL will be about cultural issues, not economics or food security,” the authors conclude. “The potential solutions outlined here implicate lifestyle changes for as many as 20,000 farmers and ranchers in the basin. In this respect the GSL serves as a microcosm of the socio-cultural changes facing many river basin communities in the increasingly water-scarce wester U.S. and around the globe.”
Think like a watershed: Interdisciplinary thinkers look to tackle dust-on-snow
Click the link to read the release on the NRCS website:
January snowpack conditions reveal contrasting trends across Colorado, with early season storms boosting accumulation in the southern basins before tapering off, while northern basins were favored through December and received a notable boost from early January storms.
Denver, CO – January 10th, 2025 – Statewide snow water equivalent (SWE) is 108 percent of the 1991-2020 median as of January 7th. For context, SWE at this time last year was 76 percent of median, reflecting very different early season conditions. A notable storm during the first week of January 2025 delivered higher amounts of snowfall to northern basins. SNOTEL site Tower recorded impressive gains, with a SWE increase of 6.3 inches. Statewide, streamflow forecasts at the 50 percent exceedance probability are 99 percent of median. Water year to date precipitation as of January 1st is above normal at 104 percent of median and jumped to 108 percent of median on January 7th.
Early season storms brought snowfall to southern basins, leading to above average accumulation by mid-November. The combined San Miguel-Dolores-Animas-San Juan (SMDASJ) reached 171 percent of median by mid-November before tapering to 87 percent of median following several dry weeks. Despite recent dry weeks, late season monsoonal precipitation improved soil moisture levels, enhancing the basin’s overall runoff efficiency. At the start of the 2025 water year, soil moisture levels in southern basins ranged from 90 percent to 130 percent of median. The Upper Rio Grande also had a strong early season start and peaked at 203 percent of median snowpack in November and is now at 82 percent of median. The Arkansas basin is currently at 103 percent of median, maintaining above normal snowpack levels through December.
Between October and early November, statewide precipitation reached 110 percent of median, with southern basins benefitting most from consistent storms. During this period, basins like the SMDASJ and Upper Rio Grande were well above normal at 186 and 168 percent of median, respectively. In contrast, the South Platte and Laramie-North Platte basins received 55 and 65 percent of October median precipitation, respectively. November precipitation continued a varied trend highlighting a boost in eastern basins such as the South Platte at 167 percent of median and the Arkansas at 209 percent of median. Although December conditions remained dry for most basins, with statewide 30-day precipitation at 74 percent of median on January 1st, northern regions received relatively higher precipitation. For this 30-day period on January 1st the South Platte is at 100 percent of median, the Laramie-North Platte at 103 percent and the Yampa-White-Little Snake at 95 percent of median.
Streamflow forecasts range from 82 percent in the Laramie-North Platte to 107 percent in the Arkansas basin at the 50 percent exceedance probability. While many forecasts remain near or slightly below median, the range of exceedance probabilities illustrates varying levels of uncertainty across basins. “January forecasts also have the widest range of exceedance probabilities, given that there is still much snow accumulation season to come, so as always we encourage you to consider the full suite of exceedance probabilities in addition to the 50%,” noted Karl Wetlaufer, NRCS forecast hydrologist, emphasizing the importance of monitoring future conditions. Another good reminder to consider the full suite of exceedance forecasts rather than focusing solely on median values when interpreting potential outcomes.
As of January 2025, reservoir storage across Colorado stands at 93 percent of median statewide, a slight decline from the same time last year but not drastically lower. Reservoir levels reflect carryover from last season, with many basins showing relatively stable conditions. The Arkansas and Upper Rio Grande basins, report 114 and 124 percent of median storage, respectively, highlighting increased storage compared to the previous year. Conversely, the Gunnison and SMDASJ basins report below median storage. “Reservoir levels at this time of year are more of a baseline rather than a predictor, as they depend on upcoming snowmelt contributions during spring runoff,” notes Nagam Gill, NRCS hydrologist.
* San Miguel-Dolores-Animas-San Juan River basin * *For more detailed information about January mountain snowpack refer to the January 1st Colorado Water Supply Outlook Report. For the most up to date information about Colorado snowpack and water supply related information, refer to the Colorado Snow Survey website.
Visitors trek the Sand to Snow National Monument in Southern California, a popular area for camping, hiking, hunting and other activities. Bob Wick, BLM/Flickr
The Department of the Interior was created in 1849 as the United States was rapidly expanding and acquiring territory. It became known as “the department of everything else” for its enormous portfolio of missions, which ranged from western expansion to oversight of the District of Columbia jail.
Interior handles natural resources and domestic affairs – primarily managing 480 million acres (200 million hectares) of federal lands and developing the assets that they hold. Many of these lands are officially open for multiple uses, including energy development, mining, logging, livestock grazing and recreation. Those activities have numerous constituencies, whose interests can clash.
The Interior secretary oversees many types of activities on and beneath lands that represent about 21% of the total surface area of the United States. U.S. Department of the Interior
The Interior secretary’s main job is to promote thoughtful planning that balances resource development and conservation. One strategic role has been expanding energy production, including oil, natural gas, wind and solar power, on federal lands.
Under Republican administrations, the focus often swings toward resource development. Democratic administrations often put greater emphasis on conservation and nonextractive land uses, such as recreation. The secretary’s actions can play a big role in setting direction for the agency.
Interior has about 70,000 employees whose missions fall largely into three buckets: managing public lands and wildlife; meeting U.S. trust responsibilities to Native American communities; and regulating energy, water and mining resources on federal lands and in federal waters offshore.
Many of Interior’s offices have changed dramatically over time in response to evolving environmental and cultural values. For example, the Bureau of Land Management was widely known for years as the “Bureau of Livestock and Mining” because its decisions closely reflected the interests of those industries.
However, today the bureau also manages land for conservation – including a 35 million-acre (14 million-hectare) system of National Conservation Lands. In 2024, the agency adopted a public lands rule that explicitly recognizes the importance of protecting clean water, managing for land health and restoring degraded lands.
Filling up the West
When Congress created the Interior Department, the young United States was in the process of nearly doubling its size after the U.S.-Mexican War. Gold had just been discovered in California, triggering a huge migration west. The scramble to occupy these lands and convert them into stable revenue sources drove Interior’s early activities.
But not all lands met settlers’ needs, especially in dry zones. As a result, much of the arid West remained under federal control. Given this legacy, it is not surprising that most senior officials at Interior have come from western states.
U.S. national parks, monuments, wildlife refuges and other Interior lands have become economic engines for many western towns, attracting private ranches, hotels, restaurants and businesses. In this way, federal lands return tremendous wealth to adjacent communities, particularly with the growth of the outdoor recreation industry.
Nonetheless, many western states resent federal control over broad swaths of territory within their borders and periodically make claims to these lands. Since states don’t have the financial resources to manage roads or fight fires on such large expanses, it is likely that they would sell off large portions of these lands, privatizing them.
Over the past half-century, there has been ongoing debate about whether the royalties and fees the agency charges for federal land use return fair value to taxpayers, or if the agency has been “captured” by extractive industries such as mining, ranching, logging, and oil and gas production. The secretary can send important signals about which way an administration tilts.
Indian Affairs and trust responsibilities
Another central Interior role is managing U.S. government relations with American Indian and Alaska native tribes. The department’s Bureau of Indian Affairs, created in 1824, works with 574 federally recognized tribes with more than 2 million enrolled members.
Interior manages 55 million acres of land and 57 million acres of subsurface mineral rights in trust for the tribes. This essentially means that Interior agencies earn revenue and disperse funds to tribal members, in part to make up for depriving Native Americans of their rightfully held resources over 150 years of displacement.
Even after federal policy became more supportive of Tribal governance and self-determination in the 1970s, Interior did a poor job of fulfilling its key trust responsibilities. In 2009 the agency settled a US$3.4 billion class-action lawsuit, acknowledging that for decades the federal government had mismanaged tribal resources and failed to pay revenues to Indian landowners for resources produced from their lands.
Starting in 2021, under Secretary Deb Haaland – the first Native American to lead the Interior Department – the agency launched an initiative to document and interpret the experiences of survivors and the intergenerational effects of this policy on Native Americans whose ancestors were sent to the schools. https://www.youtube.com/embed/Ui9jCp1yuws?wmode=transparent&start=0 In a 2022 report, the U.S. government acknowledged for the first time its role in carrying out forced assimilation of Native American children at government-run boarding schools.
This land is your land
Interior’s reach is vast, but the resources that it controls and the investments it makes in keeping large landscapes connected provide tremendous services. Debate about the merits of public versus private management of these lands is likely to continue.
Growing interest in outdoor recreation and the rise of remote work are putting new pressure on public lands. Finding solutions will require many different land users, as well as state governments and gateway towns, to collaborate. The Interior secretary can play an important role in helping strike those balances.
This story is part of a series of profiles of Cabinet and high-level administration positions.
Although Telluride is in the depths of winter, states are still negotiating a new agreement for the Colorado River basin. About 85% of the Colorado River begins as snow in Colorado and Wyoming’s mountains. The 1,450-mile river provides water to about 40 million people in the U.S. and Mexico and is key to the $5 billion annual agriculture economy. Across the state, snowpack is at 97% of the median. Locally, in the San Miguel-Dolores-Animas-San Juan River Basin, snow water equivalent is at 75% of median.
Map of the Colorado River drainage basin, created using USGS data. By Shannon1 Creative Commons Attribution-Share Alike 4.0
Colorado’s Western Slope river basins are essential to the health of the whole basin as well the economy and natural environment. Regional water managers often compete for water demands for agriculture, environmental flows and downstream deliveries to Lake Powell and Lake Mead, which store much of the region’s water. The current operational guidelines for the Colorado River will expire at the end of 2026. Drought in the Western Slope can significantly impact both local water use and deliveries to Lake Powell, and drought is likely to become more prevalent with climate change…A recent study, published in Nov. 2024, analyzed local drought vulnerability in Western Slope and the consequences for the region, going into the Colorado River basin. “Streamflow declines driven by an optimistic climate change scenario can transition the system to a drier regime and increase drought impacts,” the study’s authors write. The study developed a model to create streamflow scenarios and the potential impacts of drought in the region. The model showed elevated drought risks to downstream water users, agriculture and the environment…
The San Miguel Watershed Coalition recently released a new planning document for the whole watershed, including floodplain reconnection and beaver-based restoration projects. Much of this work involves federal land managers because more than 50% of the watershed is federally owned…Other important research includes how to better predict how snowpack is transformed into snowmelt and runoff into watersheds, collaborating with Airborne Snow Observatories (ASO), which provides basin-wide measurements of snow water equivalent and forecasts of snowmelt runoff.
The view from an Airborne Snow Observatory plane as it flies over a mountainous region to capture data on the snowpack. Photo credit: Airborne Snow Observatories Inc.
Nearly all major global climate datasets agree that, in 2024, human-caused global warming for the first time pushed Earth’s average surface temperature to more than 1.5 degrees Celsius above the pre-industrial average for a full calendar year, a level that countries around the world had agreed to do all they could to avoid.
And when last year is averaged with 2023, both years together also exceed that level of warming, which was noted as a red line marking dangerous climate change by 196 countries in the 2015 Paris Agreement. A 2018 special report by the Intergovernmental Panel on Climate Change showed that warming beyond that limit threatens to irreversibly change major parts of the physical and biological systems that sustain life on Earth, including forests, coral reefs and rainforests, as well as oceans and their major currents.
The temperature figures were seen as so significant that the new annual climate data for 2024 was presented Thursday night as part of the first-ever internationally coordinated release by several institutions that track global temperatures, in part to mark the “exceptional conditions experienced in 2024,” according to a report published today by Copernicus, the European Union’s climate change service.
On Friday, the National Oceanic and Atmospheric Administration, NASA and the World Meteorological Organization will follow up with similar reports, all of which will emphasize not only the record global temperatures, but also the record amount of water vapor in the atmosphere that contributed to severe and record flooding in some parts of the world last year, and also helped supercharge tropical cyclones and hurricanes.
Rather than being fatigued by the barrage of news about heat records and other climate extremes, people should see the information as an opportunity to be thankful that we are not flying blind into dangerous climate change, said Carlo Buontempo, director of the Copernicus Climate Change Service.
Thanks to international science, “We do know something about what’s happening,” he said. “We can make some predictions about what’s coming in the future. So rather than being overwhelmed … we should also take this as an opportunity to do something about it, to react to and to inform our decisions in the best possible way with facts and evidence.”
Even with those facts, he added, “We are facing a very new climate and new challenges that our society is not prepared for. … This is a monumental challenge for society.”
According to the Copernicus data, 2024 didn’t just edge past the previous record-warm year, 2023, but surged more than a tenth of 1 degree Celsius all the way to 1.6 degrees Celsius (2.8F) above the pre-industrial level. That was one of the biggest year-on-year jumps on record, said Samantha Burgess, co-director of Copernicus.
She said some of the other global datasets may actually still show the 2024 warming relative to the pre-industrial 1850-1900 average at just below 1.5 degrees Celsius (2.7F), but that the global synthesis of six major datasets by the World Meteorological Organization will also come out to more than 1.5.
Still, she said, that doesn’t mean the limit set by the Paris Agreement has been broken, because it refers to a long-term average over 10 to 30 years.
If the 1.6 degrees Celsius of warming over the pre-industrial average doesn’t seem like a huge deal to some people, she said human bodies provide a good analogy.
“The temperature of the human body is around 37 [degrees Celsius],” she said. “If we have a fever at 39 degrees, it doesn’t sound like much, but the body responds in very negative ways, and we feel terrible. We’re feverish, and the body is doing everything possible to fight that infection.
“The reality is that at a global average change of 1.5 degrees, the frequency and the intensity of extreme events gets more likely,” she said. “Extreme events like wildfires, heat waves, severe storms, droughts, are likely to get more frequent, and they’re likely to be more intense. This is why, when you’ve got this small number but over a very large global average, it’s incredibly important.”
The Copernicus scientists said that the world’s oceans, in particular, were one of the biggest factors driving Earth’s overall annual temperature to a new record. That ocean warmth also had direct impacts like a global wave of coral bleaching and reef die-offs, as well as mass die-offs of marine mammals and seabirds.
On land, the persistently high global fever of the last few years led to deadly heat waves, with more than 47,000 heat-related deaths in Europe alone during 2023. Final figures for the number of such deaths in 2024 are yet to be calculated.
The new data on record warmth comes at a time when some governments and companies are already rolling back previous climate action pledges. The internationally coordinated release of global climate data could also be seen as an acknowledgment that global warming isn’t going to slow down and wait for humanity to solve other vexing social, political and economic problems.
Asked if those rollbacks in the face of record heat are worrying to him as a climate scientist, Buontempo said that, “From a physical point of view, the mechanism is well explained. What drives this warming temperature is, to a very large extent, increasing greenhouse gases.”
If the goal is to stabilize the global temperature, then governments need to move toward reducing emissions to zero “in the most rapid possible way,” he said.
What will the future of the warming stripes be?2024 could be the start of a stabilisation of global temperatures, or it might appear to be a cool year.Which one of these stories becomes reality depends on our choices today, and every day until then.We are likely to regret not acting sooner.
Click the link to read the article on the NOAA website (Emily Becker):
January 9, 2025
La Niña conditions emerged in the tropical Pacific in December. There’s a 59% chance La Niña will persist through February–April, followed by a 60% chance of neutral conditions in March–May. Read on for the recent observations that led us to declare the (long-awaited) onset of La Niña and lots of details for current and potential upcoming conditions.
Just the facts, ma’am
A quick briefing, if you’re just joining us—La Niña is one phase of the El Niño/Southern Oscillation (ENSO), a pattern of sea surface temperature and atmospheric changes in the tropical Pacific Ocean. La Niña’s signature is cooler-than-average surface water in the east-central Equatorial Pacific, while its counterpart, El Niño, features warmer-than-average surface water. The atmospheric circulation over the tropical Pacific, called the Walker circulation, exhibits characteristic changes during La Niña and El Niño, so we call ENSO a “coupled” ocean-atmosphere system. ENSO is a seasonal phenomenon, meaning it lasts for several months in a row. The atmospheric changes of ENSO are communicated all around the world, changing temperature and rain/snow patterns in known ways.
Time to get down to brass tacks
Ok! We’ve been expecting La Niña to show up since last spring. While she’s dragged her heels, all the pieces came together this past month.
The tropical Pacific sea surface temperature loitered in ENSO-neutral since April 2024, with our primary ENSO monitoring index, the Niño-3.4 index, within 0.5 °C of the long-term average. In December, however, the Niño-3.4 index was -0.6 °C, according to the ERSSTv5, our most reliable long-term sea surface temperature dataset.
2-year history of sea surface temperatures in the Niño-3.4 region of the tropical Pacific for all La Nina events since 1950 (gray lines) and the recent (2024-25) event (purple line). After staying in neutral for most of 2024, the Niño-3.4 index passed the La Niña threshold in December 2024. Graph by Emily Becker based on monthly Niño-3.4 index data from CPC using ERSSTv5.
With the Niño-3.4 Index exceeding the La Niña threshold of -0.5 °C, we can move on to the second box on our flowchart—do we think the Niño-3.4 index is going to stay in La Niña territory for the next several seasons? (“Seasons” here means any 3-month-average period.) The consensus among our computer climate models is yes. Also, there is a substantial amount of cooler-than-average water under the surface of the tropical Pacific, which will provide a source for the surface over the next few months.
So, we’re on to the third box, which has actually been checked for a while now (more on that later). The atmosphere has been looking La Niña-ish for months, with stronger-than-average trade winds, more clouds and rain over Indonesia, and drier conditions over the central Pacific—all hallmarks of an amped-up Walker circulation. In December, the Equatorial Southern Oscillation Index (EQSOI), which measures the difference in surface pressure between the western and eastern Pacific, was 1.5 (positive values indicate a stronger Walker circulation). In fact, this is the 5th-strongest December EQSOI in the historical record. Drumroll… La Niña conditions have developed.
This animation shows weekly sea surface temperatures in the Pacific Ocean compared to average from October 14 2024–January 5 2025. Orange and red areas were warmer than average; blue areas were cooler than average. The sea surface temperature in the key ENSO-monitoring region of the tropical Pacific (outlined with black box) was slightly below average for many weeks, but the cooler-than-average region has strengthened lately. NOAA Climate.gov animation, based on Coral Reef Watch Data and maps from NOAA View. View the full-size version in its own browser window.
Break it down for me
There are a lot of different tidbits I want to tell you about this month, so let’s go Q&A-style.
How long will La Niña last?
There’s a reason our flowchart says “the next several seasons” instead of providing a specific number: we can make predictions, but it’s impossible to know ahead of time exactly how long La Niña conditions will last. To be categorized as a La Niña event in our historical record, the three-month-average Niño-3.4 Index (the Oceanic Niño Index) needs to stay at least 0.5 °C below average for at least five consecutive, overlapping seasons. Current odds are 60% that the March–May Oceanic Niño Index will be neutral, which would make this event last fewer than five. That’s not to say it’s impossible for this La Niña to last longer, of course—nature is always full of surprises! There is a ~40% chance for La Niña to persist into March-May 2025.
How strong will La Niña be?
It’s very likely this La Niña will be weak, with the Niño-3.4 index unlikely to reach -1.0 °C for a season. This is based on computer model guidance and how late in the year La Niña conditions emerged. ENSO events peak in the northern Hemisphere winter, and there’s just not a lot of time for La Niña to strengthen.
Can La Niña still affect our winter climate?
Sure can, although a weak La Niña tends to have a weaker influence over temperature and precipitation patterns.
Why was La Niña so slow to develop?
The short answer to this is “we don’t yet know.” The emergence of La Niña-like atmospheric conditions before substantial tropical Pacific Ocean surface cooling was unusual, though. The global oceans have been running much, much warmer than average for more than a year, which might have had a hand in La Niña’s delay. When we calculate the Niño-3.4 index but account for the temperature of the tropical oceans (the “Relative Niño-3.4 index”) we get an index that’s been in La Niña territory for months. Only this past year or so has the difference between the traditional and relative Niño-3.4 indexes been so large, and we’re still researching this new measurement and all the implications for ENSO development and impacts in a warmer world.
Has La Niña had any impact on temperature and rain patterns yet?
La Niña affects global climate primarily through atmospheric changes, and since the tropical atmosphere has been looking like La Niña for a while, this is a reasonable question! The global climate is incredibly complicated, and even a big factor like ENSO is only one player. Other climate patterns, climate change trends, and random variability can have a strong influence on overall seasonal patterns. That said, it’s interesting that the October–December 2024 temperature and rain/snow patterns over the U.S. resemble the expected patterns from previous La Niña events. See the October–December La Nina temperature and rain/snow maps, and here’s the general page if you would like to poke around.
Map showing the difference from average precipitation during October–December 2024. Green areas received more rain and snow than the 1991–2020 average, while brown areas received less. The pattern here resembles what we would expect in October–December during La Niña. Map by climate.gov from CPC data.
Temperature has a strong influence from climate trends, and the October–December 2024 temperature pattern over the U.S. is clearly dominated by more warmth.
Map showing the difference from average temperature during October–December 2024. Orange areas were warmer than the 1991–2020 average. The pattern here resembles what we would expect in October–December from combined climate trends and La Nina. Map by climate.gov from CPC data.
You’re running out of column inches. Any last tidbits?
Thanks for asking! Speaking of La Niña impacts, you might recall there’s a link between La Niña and active Atlantic hurricane seasons. In brief, La Niña reduces vertical wind shear—the difference between near-surface winds and upper-level winds—and makes it easier for hurricanes to grow. Interestingly, the August–October 2024 wind shear in the Atlantic Main Development Region (an area of the Atlantic where hurricanes tend to develop) was the weakest since 1950 (h/t NOAA’s Matt Rosencrans). We can’t say how much of it was related to La Niña, but given the relative Niño-3.4 index has been in La Niña territory for a while now, it’s an interesting situation that bears more research.
The bottom line
As this unusual La Niña progresses, we’ll be here to keep you updated on all things ENSO!
Here are the typical outcomes from both El Niño and La Niña for the US. Note each El Niño and La Niña can present differently, these are just the average impacts. Graphic credit: NWS Salt Lake City office
On January 4 and 5, a low pressure system developed across the Central Great Plains and then tracked eastward to the Mid-Atlantic. Along its track, widespread precipitation (1 to 2 inches, liquid equivalent) was observed throughout eastern Kansas, Missouri, the Ohio and Tennessee Valleys, Central Appalachians, and Mid-Atlantic. Total snowfall amounts were near or more than a foot in portions of these areas. This winter storm also resulted in freezing rain for the Ohio Valley and parts of Virginia and West Virginia. Drought improvements were generally made to portions of the central and eastern U.S. where precipitation amounts exceeded 1 or 1.5 inches, liquid equivalent. Drought coverage and intensity continued its decline for the Upper Ohio Valley and New England. After the winter storm exited the East Coast, an arctic air outbreak overspread the eastern two-thirds of the lower 48 states. A favorable start to the wet season coupled with above-normal snowpack supported a decrease in drought coverage across the Pacific Northwest. Conversely, drought worsened for southern California and the Southwest. Alaska and Puerto Rico remained drought-free, while short-term drought intensified across Hawaii…
Based on 30 to 60-day SPI along with a lack of early season snowpack, a 1-category degradation was made to southwestern Colorado. Farther to the north across northwestern Colorado, improving snowpack resulted in a minor reduction in abnormal dryness (D0). Southwestern Nebraska has received little to no precipitation during the past 7 weeks, prompting an expansion of D0. In addition, above-normal temperatures during the late fall and into the early winter exacerbated increasing short-term dryness. Heavy precipitation (more than 1 inch, liquid equivalent) for this time of year resulted in a 1-category improvement to northeastern Kansas. No changes were made to the Dakotas and early January is one of the driest times of the year…
Colorado Drought Monitor one week change map ending January 7, 2025.
A dry start to the winter and using 90-day SPI and soil moisture, moderate drought (D1) was expanded across southern California. The NDMC short-term blend, 90-day SPI, and many 28-day average streamflows below the 10th percentile supported the addition of severe drought (D2) to portions of southern California. The Santa Ana winds during early January are likely to exacerbate the worsening drought conditions. Consistent with the NDMC short-term blend along with 30 to 120-day SPI, D2 was expanded for portions of southeastern Arizona and southwestern New Mexico. Based on water year to date (WYTD: October 1, 2024 to January 6, 2025) precipitation averaging above normal and snow water equivalent (SWE) above the 80th percentile, a 1-category improvement was made to southwestern Idaho, eastern to central Oregon, eastern Washington and a small part of northwestern Montana. This 1-category improvement is also supported by NDMC drought blends and SPIs at various time scales. As of January 7, SWE was above-normal (period of record: 1991-2020) across the southern Cascades along with eastern Oregon and southwestern Idaho. SWE was highly variable for the Sierra Nevada Mountains and below-normal across the Four Corners Region…
Based on 30 to 120-day SPI, 28-day streamflow, and soil moisture, a 1-category degradation was made to portions of the Edwards Plateau of Texas. SPIs at various time scales and soil moisture supported a 1-category degradation as well for parts of the Rio Grande Valley. Heavy rainfall during late December supported additional improvements across southeastern Texas. Recent rainfall (1 to 2 inches) prompted a 1-category improvement to parts of Mississippi and Tennessee. Despite the recent rainfall, 28-day average streamflow and 90-day SPI support a continuation of D1-D3 intensity for the Tennessee Valley. Although precipitation was lighter this past week, the lack of any support among the indicators for D0 and D1 led to improvements to much of Arkansas…
Looking Ahead
A low pressure system is forecast to develop along the western Gulf Coast by January 10 with a rapid eastward track offshore of the Mid-Atlantic one day later. A large area of 1 to 2.5 inches of rainfall is expected for eastern Texas and the Lower Mississippi Valley, while accumulating snow occurs from the southern Plains east to the Tennessee Valley and Southern Appalachians. High elevation snow is forecast to shift east from the Cascades to the northern Rockies on January 10 and 11. Farther south across California, dry weather is likely to persist through mid-January. On January 13, another Arctic high is forecast to shift south from Canada to the Great Plains.
The Climate Prediction Center’s 6-10 day outlook (valid January 14-18, 2025) favors below-normal temperatures for a majority of the lower 48 states. The largest below-normal temperature probabilities (exceeding 80 percent) are forecast for the Southeast. An increased chance of above-normal temperatures is limited to the Dakotas and Minnesota. Below-normal precipitation is most likely across the Pacific Northwest, Great Basin, and much of California. Elevated above-normal precipitation probabilities are forecast for the Southwest, Texas, and High Plains, while below-normal precipitation is slightly favored along the East Coast.
US Drought Monitor one week change map ending January 7, 2025.
Just for grins here’s a slideshow of early January US Drought Monitor maps for the past few years.
After years of demanding the cleanup of uranium waste at the Kerr-McGee Quivira Mines on the Navajo Nation community advocates got the news this week that the Environmental Protection Agency will remove waste rock from three areas of the site and move it to a new off-site repository. The removal of over 1 million cubic yards of radioactive waste from the sites about 20 miles northeast of Gallup will begin in early 2025, the EPA said. The waste will be taken to a new off-site repository at Red Rocks Landfill east of Thoreau, N.M. The process, including permitting, construction, operation and closure of the repository, is expected to take 6-8 years.
“I feel as though our community finally has something of a win,” said Teracita Keyanna, a member of the executive committee for Red Water Pond Road Community Association. “Removing the mine waste from our community will protect our health and finally put us back on a positive track to Hózhǫ.”
Commercial exploration, development, and mining of uranium at Quivira Mines began in the late 1960s by the Kerr-McGee Corporation and later its subsidiary. The mine sites are the former Church Rock 1 (CR-1) mining area; the former Church Rock 1 East (CR-1E) mining area; and the Kerr-McGee Ponds area. The mines were in operation from 1974 to the mid-1980s and had produced about 1.2 million tons of ore, making them among the 10 highest producing mines on the Navajo Nation…From World War II until 1971, the U.S. government was the sole purchaser of uranium ore, driving extensive mining operations primarily in the southwestern United States. These efforts employed many Native Americans and others in mines and mills. Between 1944 and 1986, nearly 30 million tons of uranium ore were extracted from Navajo lands under leases with the Navajo Nation. With over 500 abandoned uranium mines — many say the total could be in the thousands — clean up of mines has always been a battle.
Reclamation Commissioner Camille Calimlim Touton greets several members of the Southeastern
District Board, from left, Bill Long, Kevin Karney, Howard “Bub” Miller, Andy Colosimo and Justin
DiSanti. Photo credit: Southeastern Colorado Water Conservancy District
January 8, 2025
Camille Calimlim Touton, Commissioner of the U.S. Bureau of Reclamation, traveled to Pueblo on Wednesday, January 8, to announce an additional $250 million for construction of the Arkansas Valley Conduit.
“We are proud to see the work underway because of President Biden’s Investing in America agenda,” Commissioner Touton said. “But there’s much more work to be done and we are again investing in this important project to bring safe drinking water to an estimated 50,000 people in 39 rural communities along the Arkansas River.”
The $250 million is funded through the Bipartisan Infrastructure Law and is part of a $514 package of water infrastructure investments throughout the western United States under the BIL.
The additional funding brings the total federal investment in the AVC to almost $590 million since 2020, along with state funding guarantees of $90 million in loans and $30 million in grants.
“After 25 years, I still almost can’t believe it’s happening, but I drive by and can see it with my own eyes,” Southeastern Water Conservancy District President Bill Long told Commissioner Touton. “There are so many people who have worked so hard who would be so proud to see it being built. This money will get us to the area that has seen the most problems.”
The Southeastern District is the sponsor for the AVC, which is part of the 1962 Fryingpan-Arkansas Project Act. The 130-mile pipeline to Lamar will bring water to 50,000 people being served by 39 water systems when complete.
Several Southeastern Board members attended Wednesday’s announcement.
“You and your team are the ones who have gotten this off the ground,” said Kevin Karney, a La Junta rancher, and at-large Board member.
“People said it would never get built, but now we’re getting it done,” said Howard “Bub” Miller, who represents Otero County on the Board.
The AVC will help 18 water systems that face enforcement action for naturally occurring radionuclides in their groundwater supplies, as well as communities struggling to meet drinking water and wastewater discharge standards.
Construction of the AVC began in 2023, and three major construction contracts have been awarded.
“This money really gets us further down the valley. It is very much appreciated,” Long said.
Hickenlooper, Bennet Welcome Additional $250 Million for Ark Valley Conduit
Funding awarded from the senators’ Bipartisan Infrastructure Law
In total, Hickenlooper and Bennet have helped secure $500 million in funding for the project
WASHINGTON – Today, Colorado U.S. Senators John Hickenlooper and Michael Bennet welcomed the Bureau of Reclamation (BOR)’s announcement of $250 million in new funding from the Bipartisan Infrastructure Law for continued construction of the Arkansas Valley Conduit (AVC).
“We passed the Bipartisan Infrastructure Law to finally deliver on promises to rural communities,” said Hickenlooper. “In Colorado that means finishing the long-awaited Ark Valley Conduit and bringing clean, reliable drinking water to 50,000 people.”
“For decades, I’ve worked to secure investments and pass legislation to ensure the federal government keeps its word and finishes the Arkansas Valley Conduit,” said Bennet. “This major Bipartisan Infrastructure Law investment will be critical to get this project across the finish line to provide safe, clean water to tens of thousands of Coloradans along the Arkansas River.”
John F. Kennedy at Commemoration of Fryingpan Arkansas Project in Pueblo, circa 1962.
The AVC is a planned 130-mile water-delivery system from the Pueblo Reservoir to communities throughout the Arkansas River Valley in Southeast Colorado. This funding will continue ongoing construction. The AVC is the final phase of the Fryingpan-Arkansas Project, which Congress authorized in 1962.
Hickenlooper and Bennet have consistently and successfully advocated for increased funding for the AVC. Last year, Hickenlooper and Bennet wrote to President Biden to urge him to prioritize funding for the AVC in his fiscal year 2025 budget. The senators also called on Senate Appropriations leaders to provide more funding for the project. In January 2023, Hickenlooper and Bennet urged BOR to allocate additional resources through annual appropriations and Bipartisan Infrastructure Law funding.
As a result of their efforts, the senators have helped deliver $500 million from the Bipartisan Infrastructure Law for the AVC, including $90 million in 2024, $100 million in 2023, and $60 million in 2022. They also secured an additional $10.1 million in fiscal year 2024 and $10.1 million in fiscal year 2023 through the annual government funding bills.
More information on the funding is available HERE.
Arkansas Valley Conduit map via the Southeastern Colorado Water Conservancy District (Chris Woodka) June 2021.
Graphic credit: The Colorado River water crisis its origin and future Jock Schmidt, Eric Kuhn, Charles Yackulic.
January 7, 2025
Belated season’s greetings, dear readers! The season being the long dark days as our turning planet slowly tilts our part of the planet again toward the star we circle – moving us into a new year-cycle that will probably again be ‘one of the ten warmest years in recorded climate history’ – if not ‘the warmest’ again.
But we are officially no longer going to be concerned about that, right? The voters have spoken, with the usual one-percent victory taken by the winner to be a landslide mandate. And what the voters decided, by that one-percent margin, is that we, as a nation, the Untied States of America, shall officially cease to believe that we are changing the climate; we’ve given ourselves license to linger in the denial and anger stages – denial that it is happening, and anger at anyone who wants to blame us for that which we can now officially refuse to believe is happening.
And we will not just lie back leisurely, relaxing in our denial, doing nothing about what we believe is not happening. No, we are going to try to break all previous production records of those fossil fuels that we can now officially refuse to believe are changing the climate – yes, even coal too, to shovel into the industrial juggernaut, which will grow as all those factories that moved overseas will sheepishly return home, once the tariffs are working their magic in bending the rest of the world to our will…. We are promised this will be the official national Reality According To Trump (RATT).
Meanwhile, however, back along the Colorado River, it is a little harder to make the RATT logic compute. The sequence of successively warmer years has had an undeniable, measurable, negative impact on our usable water supply: something like a 5-7 percent loss of surface water for every degree of rise in the annual average temperatures. It’s not necessarily that there’s less water; it’s just that more of the water is shifting into the uncontrollable vapor state rather than the manageable liquid state we earthlings need. The bottom line is a measurably diminishing supply, over the past several decades, of the surface water on which 35 million city dwellers and the irrigators of five million acres of desert land depend to some degree.
Udall/Overpeck 4-panel Figure Colorado River temperature/precipitation/natural flows with trend. Lake Mead and Lake Powell storage. Updated through Water Year 2024. Credit: Brad Udall
Where are we right now with the management planning process for the river? In mid-November 2024, the Bureau of Reclamation issued five mix-and-match alternatives for managing the Colorado River in the future – meaning the decade or so beyond the 2026 expiration of the 2007 Interim Guidelines (and the 2019 Interim Interim Guidelines, and the 2023 Interim Interim Interim Guidelines).
These alternatives are the Bureau’s effort to break the stalemate in the stalled negotiations between the four states of the Upper Colorado River Basin and the three states of the Lower Colorado River Basin. Large cuts in use will be necessary to keep the storage and distribution systems operational, and each Basin wants the other Basin to take a larger share of those cuts proscribed by ‘the river we have, not the river we dream for,’ as Colorado’s chief negotiator Becky Mitchell put it. (See the graphic at the beginning.)
The Bureau’s five alternatives, for which they plan to do the required Environmental Impact analysis this year, all focus primarily on managing the two main reservoirs, Mead and Powell, although other reservoirs in the system may by used to bolster storage in the two big ones. The five alternatives run a gamut from the NEPA mandatory ‘No Action’ alternative (continue business as usual), through two varying levels of federal management if the states are unable to reach a working agreement, to an alternative based primarily on a plan submitted by conservation groups, to a final alternative that is mostly pieced together from the conflicting plans proposed by the two basins, assuming the two basins can find the necessary compromises to make the two plans into one plan that might work.
Native America in the Colorado River Basin. Credit: USBR
All alternatives except the one by conservationists (#4) include notice that ‘there would be explicit accounting of unused/undeveloped quantified Tribal water.’ This means that the settled or decreed water rights of the First Peoples would finally be acknowledged in the river accounting, noting where and by whom their undeveloped water was being used – the first step, as one tribal member observed, in eventually either getting the water back for their own use, or getting paid by others for the continued use of their water. The First People are getting closer to being at the table. (It is worth noting that the Gila River Indian Community, south of Phoenix, is the first user organization to sign a post-2026 contract with the Bureau to leave some of its water in Mead Reservoir, water that will be conserved through projects to be funded with infrastructure money, if that survives the RATT.)
That is the broad overview; if you wish for more specifics, you can find more detailed descriptions of all five alternatives here, but there is probably no real need for us citizens to get down in the weeds of detail just yet, since we are just passive participants at that level anyway.
Instead, I want to encourage us to think on the larger level of considering alternatives not part of the Bureau’s five choices. Why not? There is, after all, a large minority of us who do not drink the small majority’s RATT kool-aid. For those of you who fit that description, my season’s greeting to you are two quotations I encountered recently that kind of rang my bell:
The first is a poet calling for poets to ‘give us imagination of peace, to oust the intense, familiar imagination of disaster.’ ‘Peace’ is given the negative-space definition of ‘not only the absence of war’: something more, or other, than mere truce. The ‘familiar imagination of disaster,’ on the other hand, is a major element of the RATT: a nation overrun by immigrant murderers, inflation out of control, an economy gone to hell, cities awash in crime, et cetera – that’s the virulent and violent imaginings that became the principal election strategy of the Repugnicans (as distinguished from the real but very timid Republicans). They call it ‘flooding the zone with shit,’ so much imagining of fictitious disaster that one wave of lies cannot be seriously addressed and challenged before the next wave rolls over us. This was a successful campaign strategy, with the naive cooperation of the national media serving as their trumpet: when the fact meets the RATT, print the RATT – reserving the last couple paragraphs for quotes citing the facts that contradict the RATT, thus it’s fair and balanced!
But when we come to our river – how are the poets to ‘imagine the peace’? And the call for poets does not necessarily preclude the hydrologists, politicians, water managers and others who manage ‘the river we have.’ Just to say, for example, as Becky Mitchell said, ‘We need to plan for the river we have, not the river we dream for,’ moves the discourse into the poet’s realm of analogy and metaphor, not denying but augmenting the scientist’s world of evidential causation and consequence, en route to testable hypotheses.
The second quote, however, by the author of 1984 – the book describing the fully devolved RATT worldview that we are flirting with now – cautions us that ‘the imagination, like certain wild animals, will not breed in captivity.’ Is that same as saying the realm of the imagination lies in ‘thinking outside the box’? Like we keep saying we need to be doing?
Well, moving forward with that assumption – Orwell seems to be suggesting that the imagination can’t kick into gear if we are, consciously or unconsciously, holding it ‘in captivity’ inside some box of dominant conventional weltanschauung – ‘world view’ in translation, ideology, or just ‘our way of doing things.’ But the word is so much more heavily evocative in German of the mass and weight of the box, the height of the sidewalls that discouraging climbing up to look over and beyond…. Orwell was aware of the flywheel power of the boxes a society builds around itself – and the extent to which that power depends on the unquestioning, often only semi-conscious, acceptance of those who dwell within the box as ‘the way it is and that’s it.’ Even if ‘the way it is’ is not that great.
That would suggest that unleashing our imagination to such tasks as the ‘imagination of peace,’ even just regional peace along a modest and shrinking desert river, has to begin by becoming aware of the box that we need to be trying to think outside of.
What I think we have in the Colorado River region are at least two nested boxes. Whenever we hear someone intone, ‘The foundation of the Law of the River is the Colorado River Compact,’ or, ‘The Colorado River Compact cannot be (tinkered with, changed to fit reality, or discarded as irrelevant),’ we can assume that their imagination is held captive in the Colorado River Compact Box. When Becky Mitchell says, ‘We have to plan for the river we have, not the river we dream for,’ she has at least hiked herself up onto the edge of the Compact Box – a Compact that was written for a mythic river half-again larger than the river we have now. She might even be looking beyond the Compact for resolution (although she can probably not say that out loud yet).
Prior appropriation example via Oregon.gov
If we hike ourselves up onto the edge of Compact Box, we will find ourselves looking at a larger and more intimidating box: the Prior Appropriation Box. This, not the Compact, is clearly the ‘foundation’ of all law regarding the use of the river: first come, first served, and seniority rules. All seven of the Colorado River states had embraced the Appropriation Doctrine as the foundation of their water law by the early 20th century. (New Mexico and Arizona did not become states until 1912.)
But those of us captive in the Compact Box tend to forget that the Compact Commission came together in 1922 to try to override the appropriation doctrine at the interstate level, among the seven states. California was growing so fast, with Arizona not far behind, that the high desert and mountain states above the river’s canyon region – growing much more slowly due to the erratic ebb and flow of the mining industry – feared there would be no unappropriated water left when they hit their stride. And none of the states really wanted a seven-state horserace of helter-skelter ‘defensive appropriation’ to avoid being left high and dry.
The water managers in the states also knew that the only way to ‘civilize’ the Colorado River was to control and store the annual spring flood of mountain snowmelt, for release as needed throughout the rest of the year. And because it was an interstate river, and because the cost of big mainstream structures was beyond their means, they knew the federal government, through its Bureau of Reclamation, would have to take a lead role in that regional development. But what they did not want was for the feds to take over all the development and operation of ‘their’ river’s water.
Members of the Colorado River Commission, in Santa Fe in 1922, after signing the Colorado River Compact. From left, W. S. Norviel (Arizona), Delph E. Carpenter (Colorado), Herbert Hoover (Secretary of Commerce and Chairman of Commission), R. E. Caldwell (Utah), Clarence C. Stetson (Executive Secretary of Commission), Stephen B. Davis, Jr. (New Mexico), Frank C. Emerson (Wyoming), W. F. McClure (California), and James G. Scrugham (Nevada)
CREDIT: COLORADO STATE UNIVERSITY WATER RESOURCES ARCHIVE via Aspen Journalism
So the Compact Commission assembled in January of 1922 to develop an interstate compact that would ‘provide for the equitable division and apportionment of the use of the waters of the Colorado River System’ – a seven-way division of the waters to give each state the right to use, in its own good time, the water needed to develop its land and resources. When a state was ready to use it, their share of the river’s water would be there for them, protected from prior appropriation by other faster-growing states.
That was the vision anyway: the ‘Compact Box’ nested in the ‘Prior Appropriation Box’ was to be an interstate refuge from the prior appropriation doctrine. ‘First come, first served’ could by the law within the states – but only up to the quantity allotted for each state.
They failed to realize that vision, however, after several days of trying – mostly for reasons of vagueness about, first, the flow of the river itself, and second, their own over-optimistic estimates of their own futures. Only the persuasive power of the federal representative on the Commission, Herbert Hoover – an engineer by training who really wanted to see the big mainstream structures built – kept them on task until they patched together, ten months later, the two-basin division for the use of the river’s water.
That substitute division was immediately rejected by the State of Arizona, and is now clearly failing at its original intent to transcend the appropriation doctrine between states: California is applying the prior appropriation doctrine against the other states in the Lower River Basin (as Arizona knew they would eventually). And the Lower Basin is threatening ‘Compact calls’ against the Upper Basin states if they do not get their 75 million acre-feet over any ten-year period as defined in Article III(d) of the Compact, as though the division into two basins had given them a big ‘prior appropriation.’
The ‘Compact Box’ is basically just a ‘shadow box,’ a failed effort to do what was really a pretty good idea – an imagination of peace among the states. The question now is: would it be possible to revive that idea of an ‘equitable division’ among the seven states – as something that is already somewhat accomplished? That’s a thread we’ll pluck at next post.
Map of the Colorado River drainage basin, created using USGS data. By Shannon1 Creative Commons Attribution-Share Alike 4.0

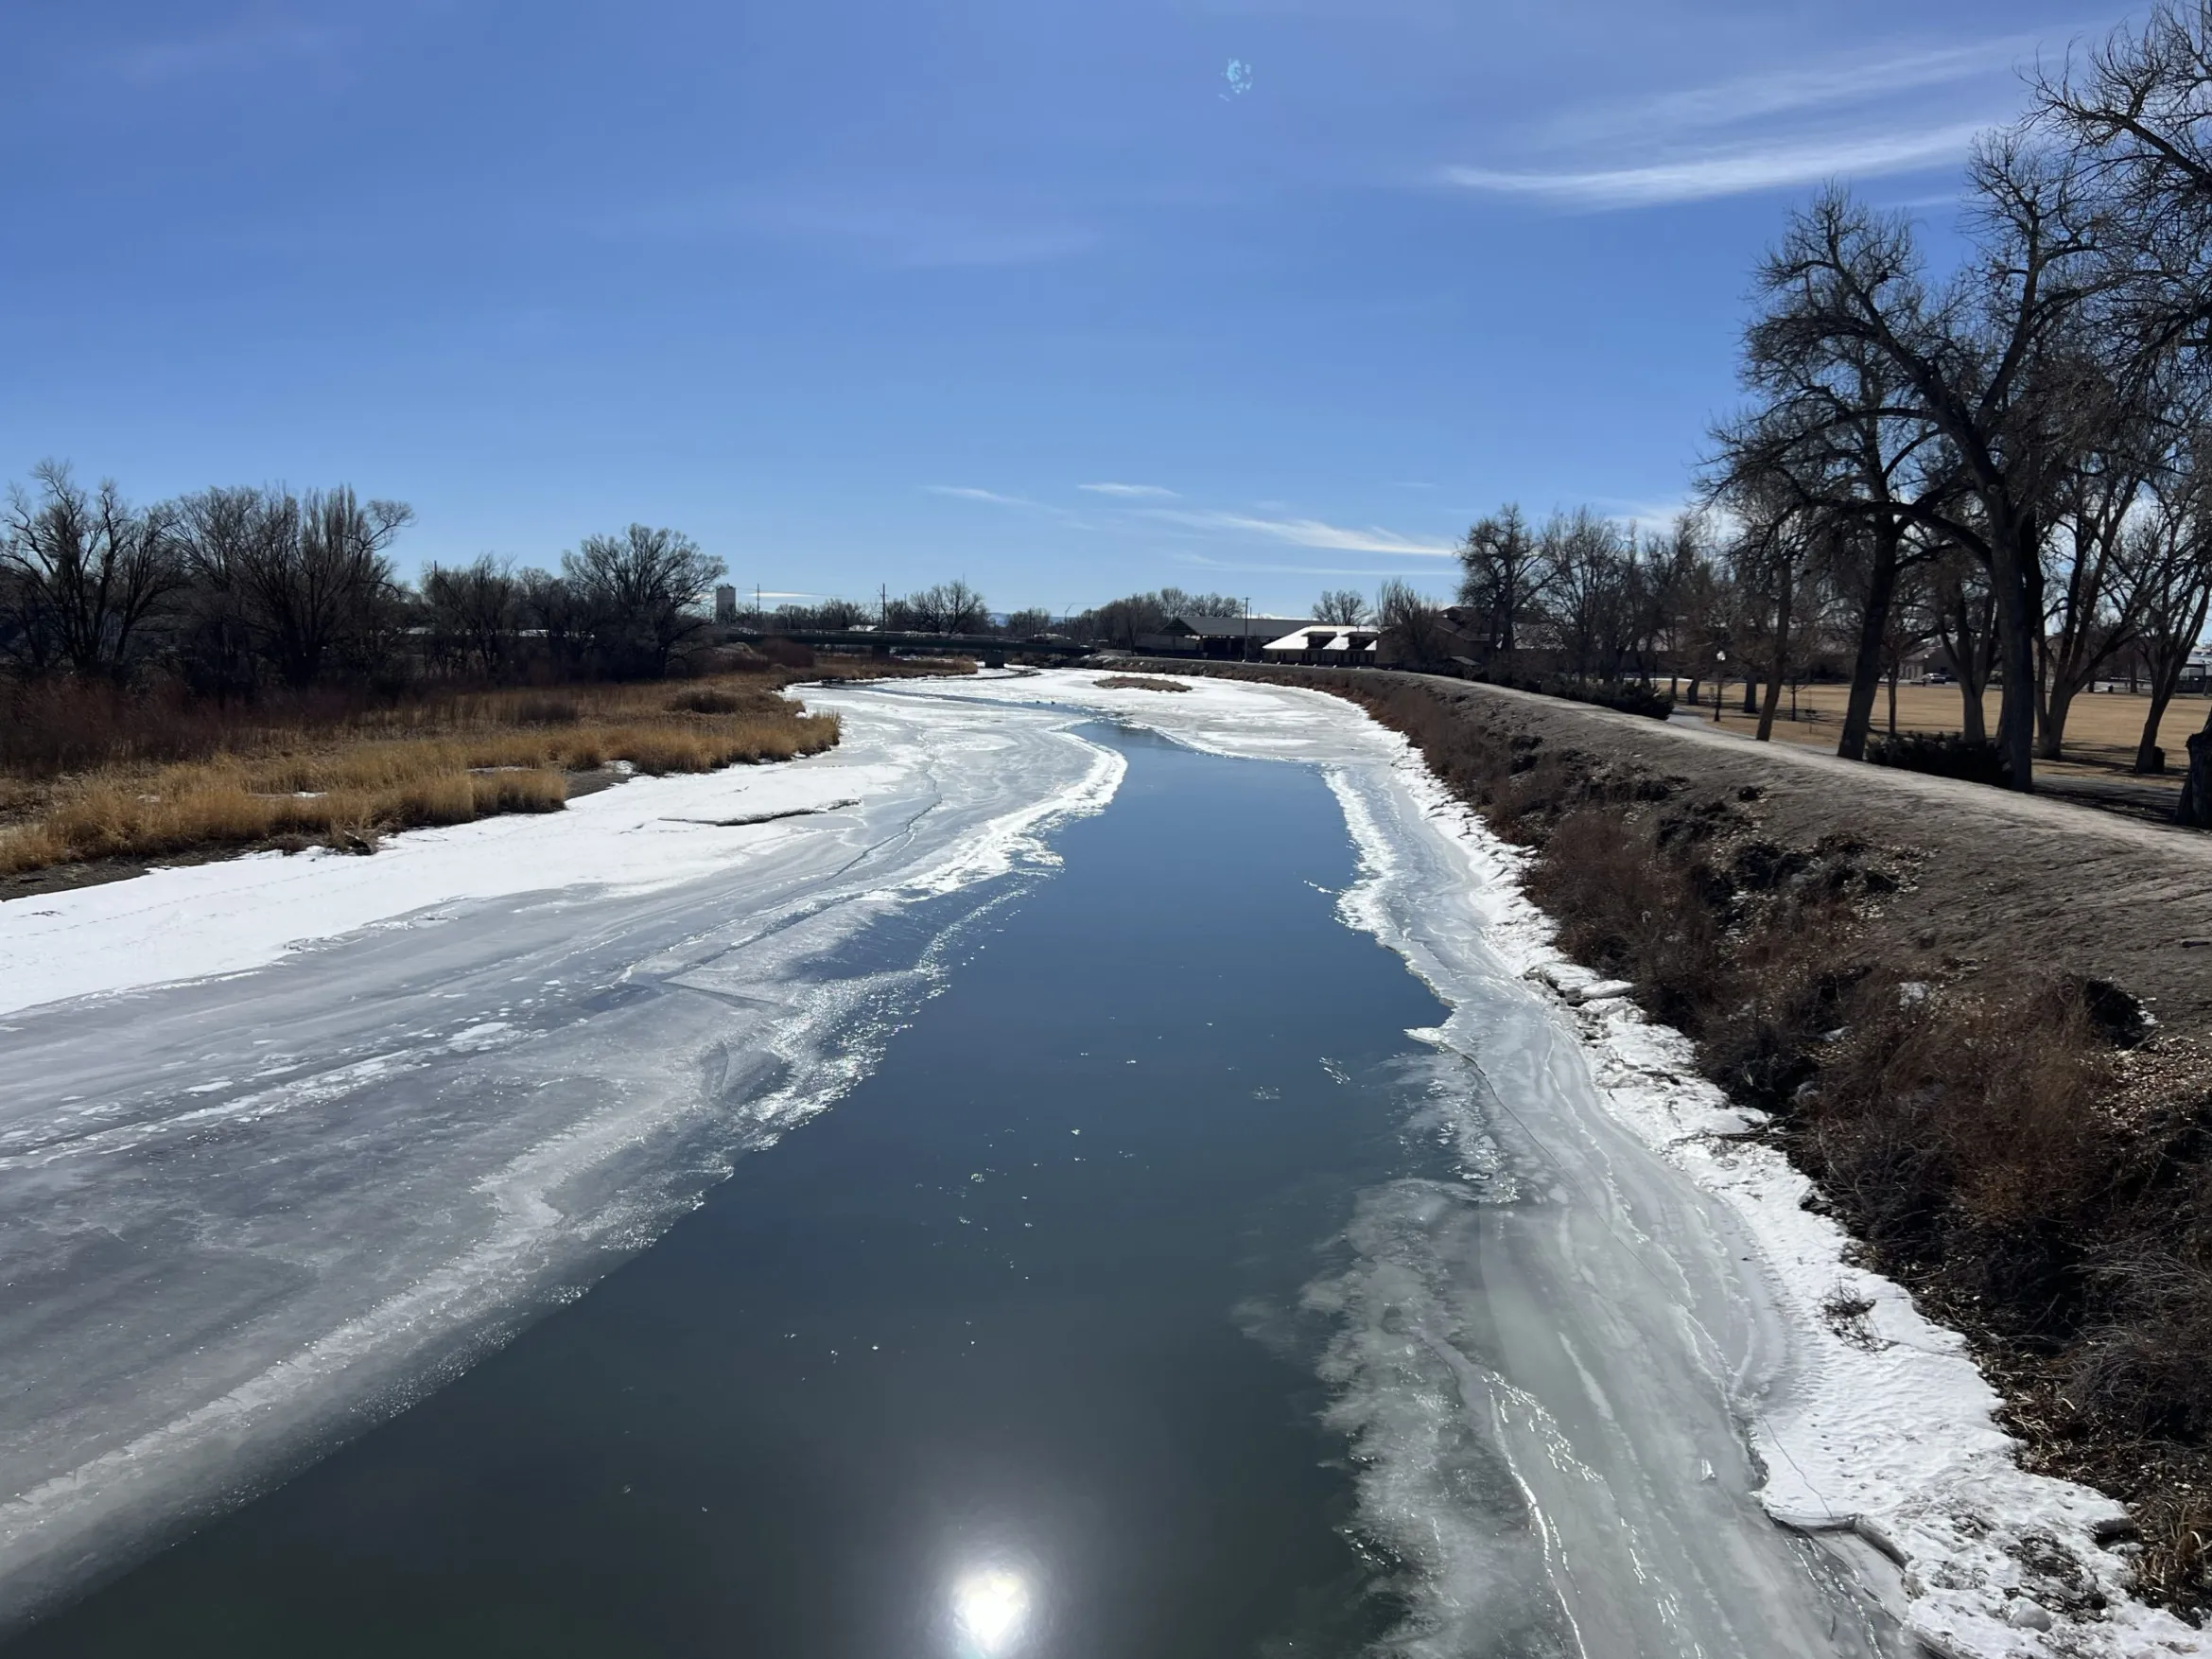

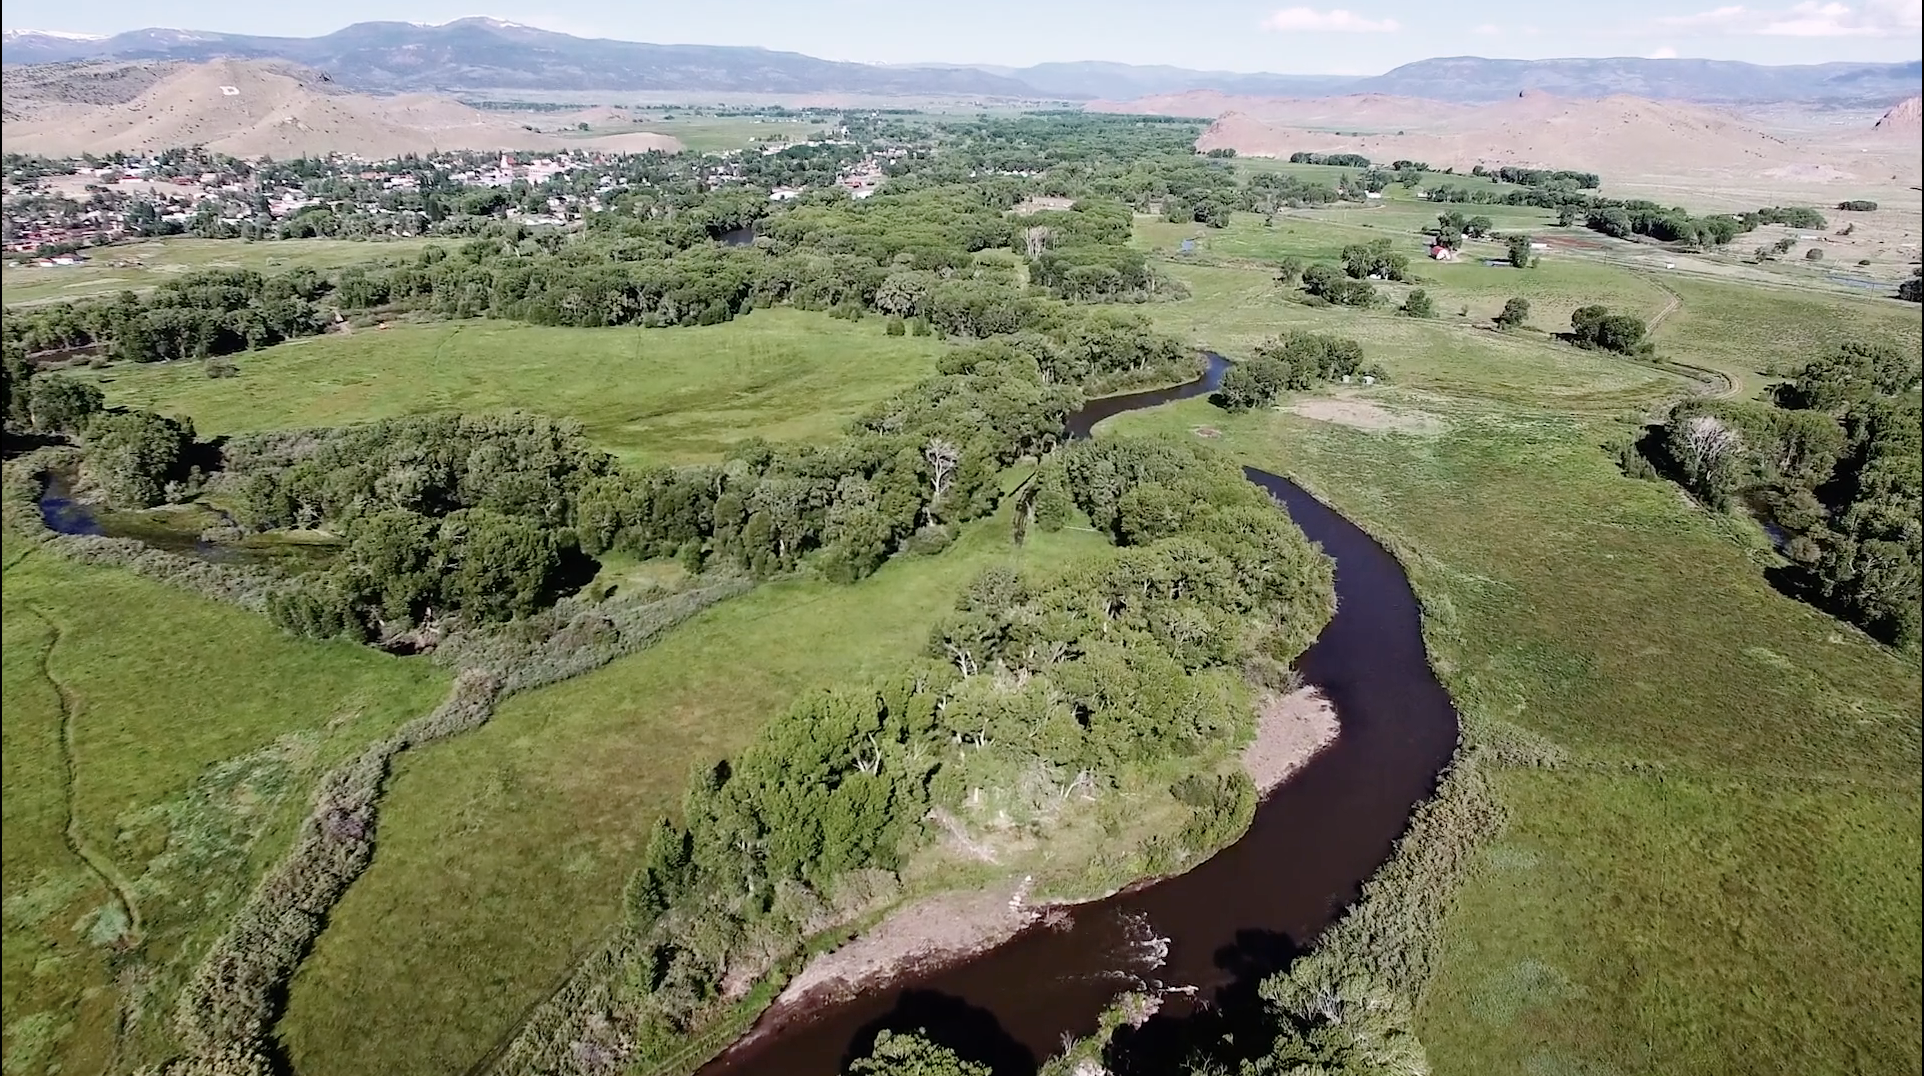
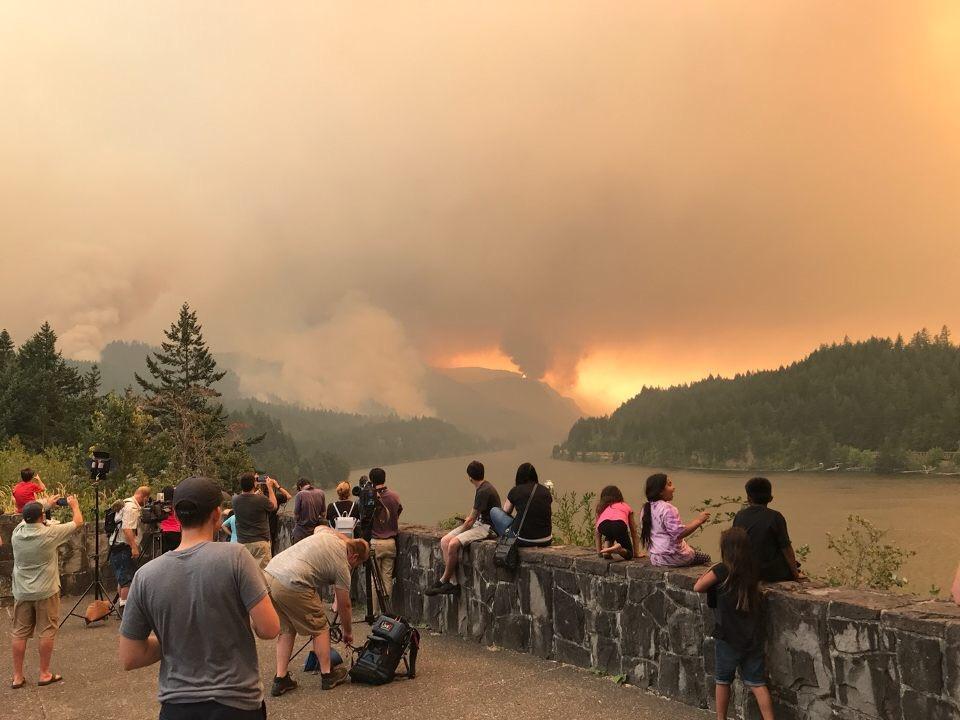


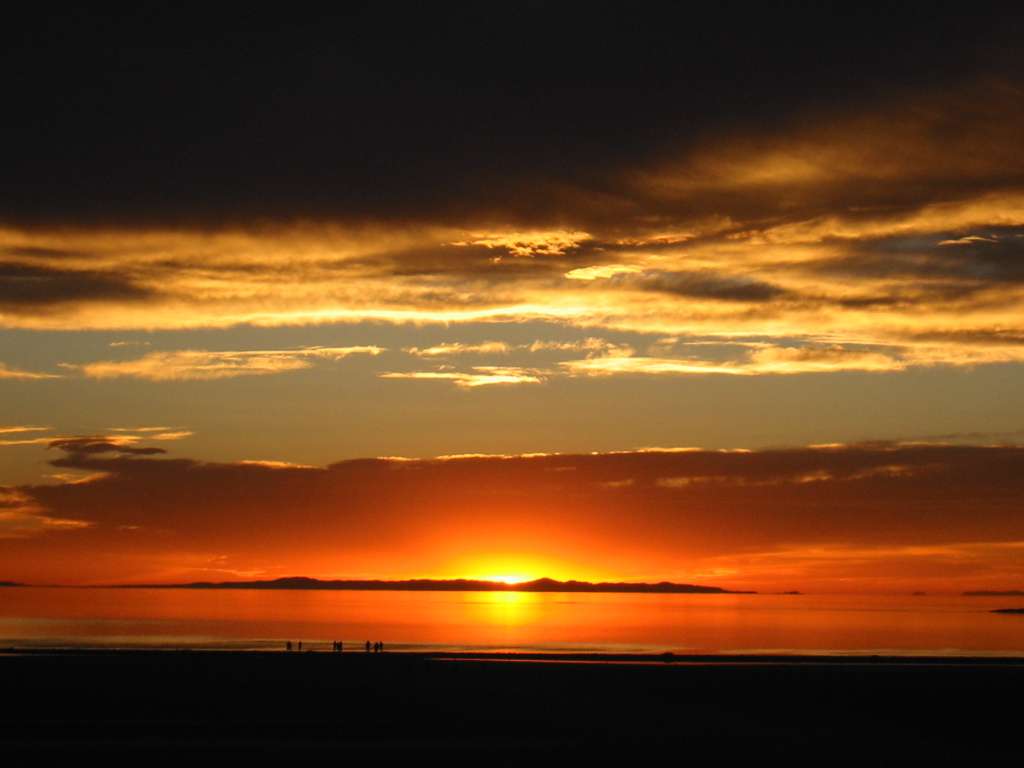


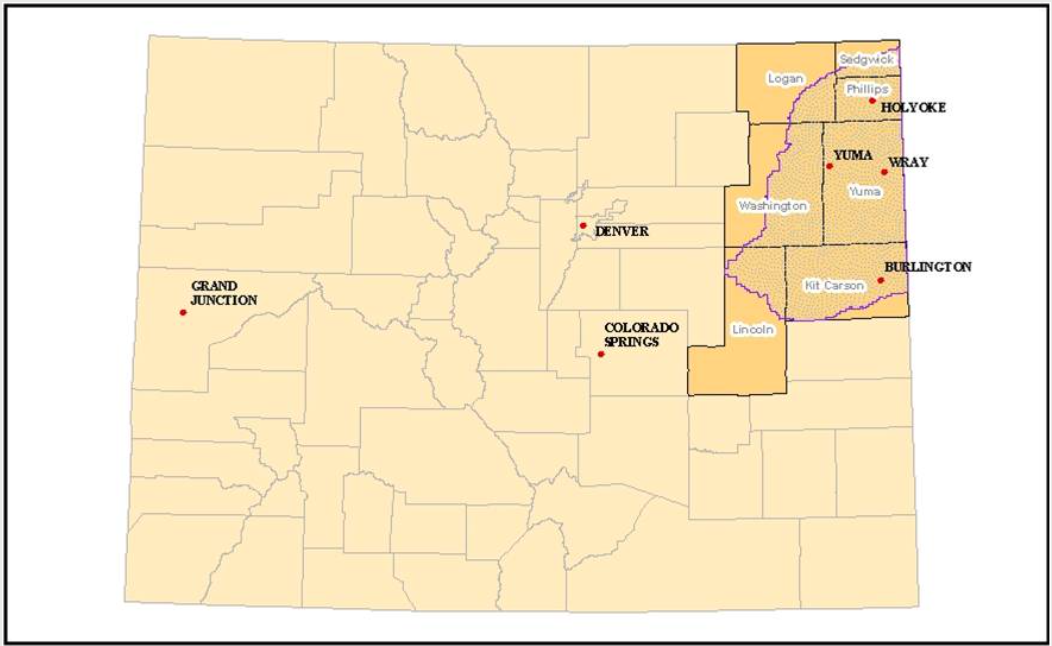
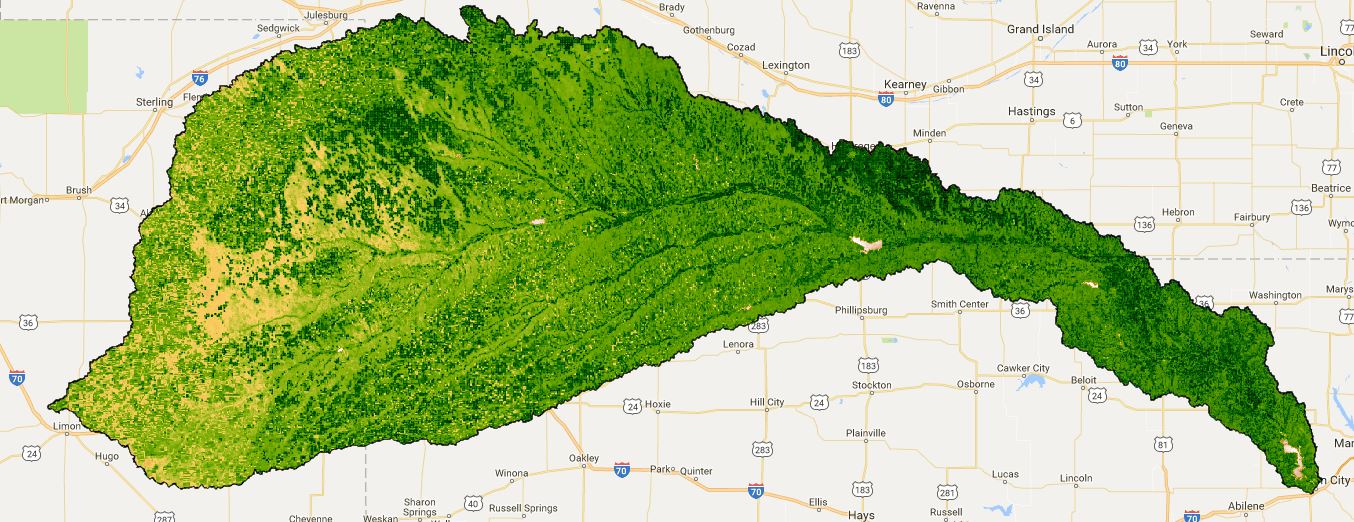


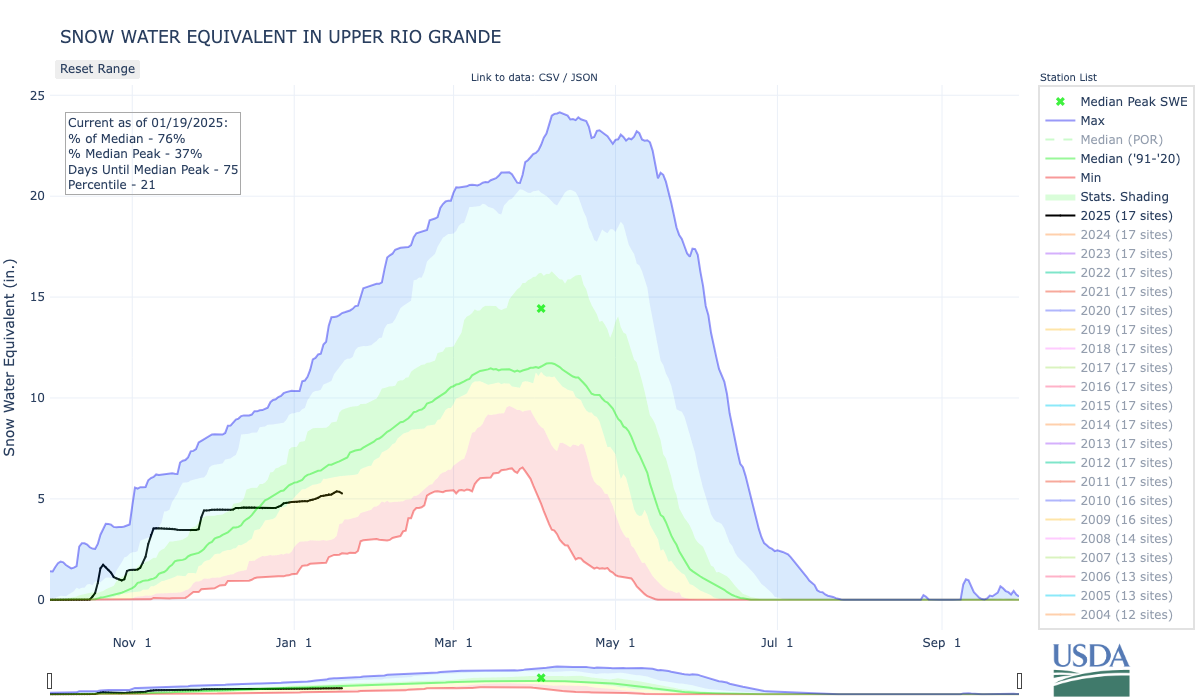

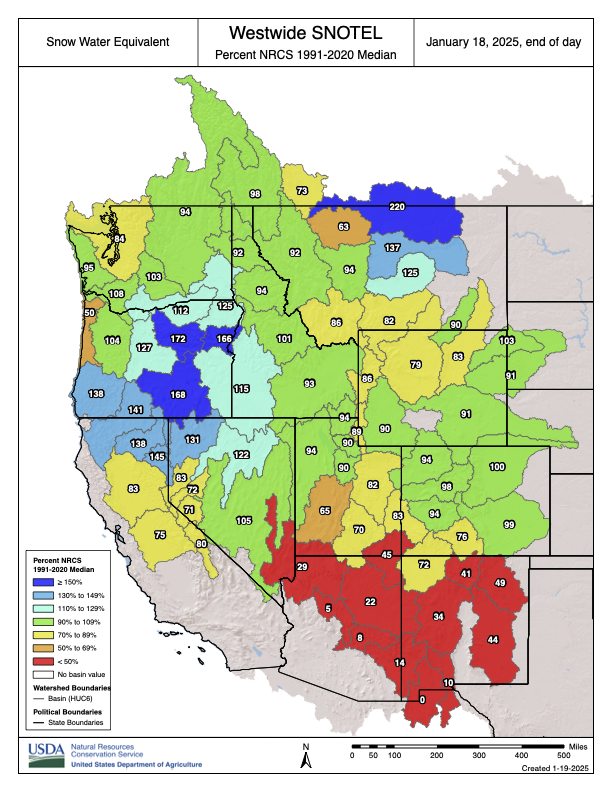


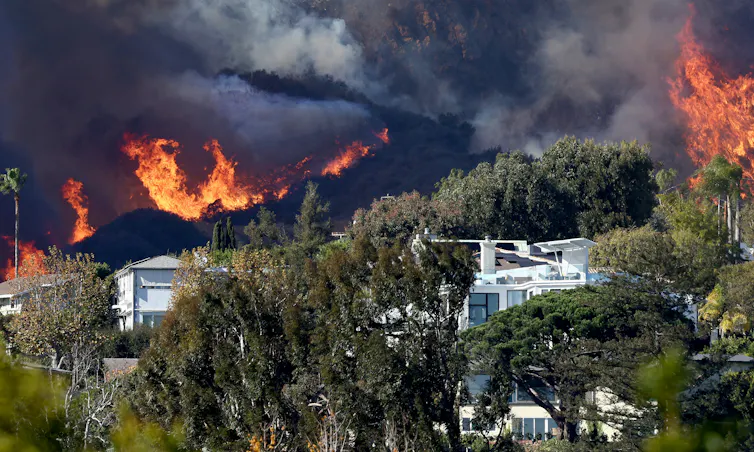
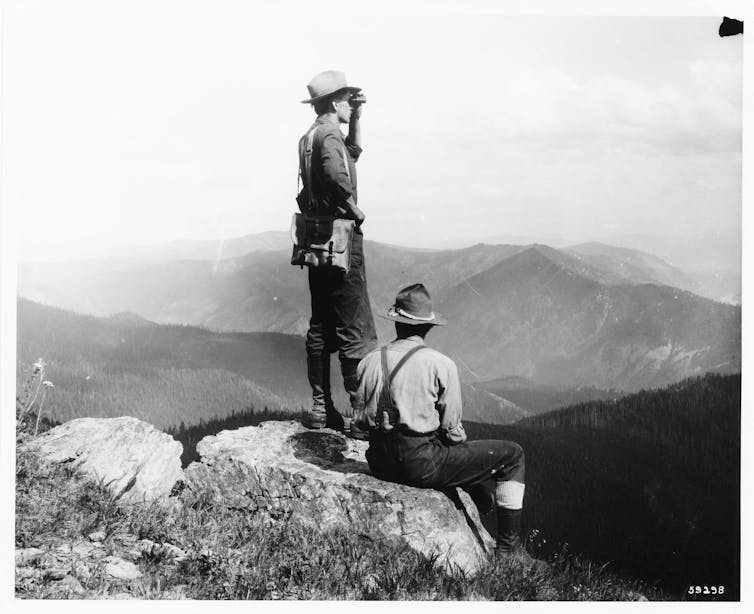
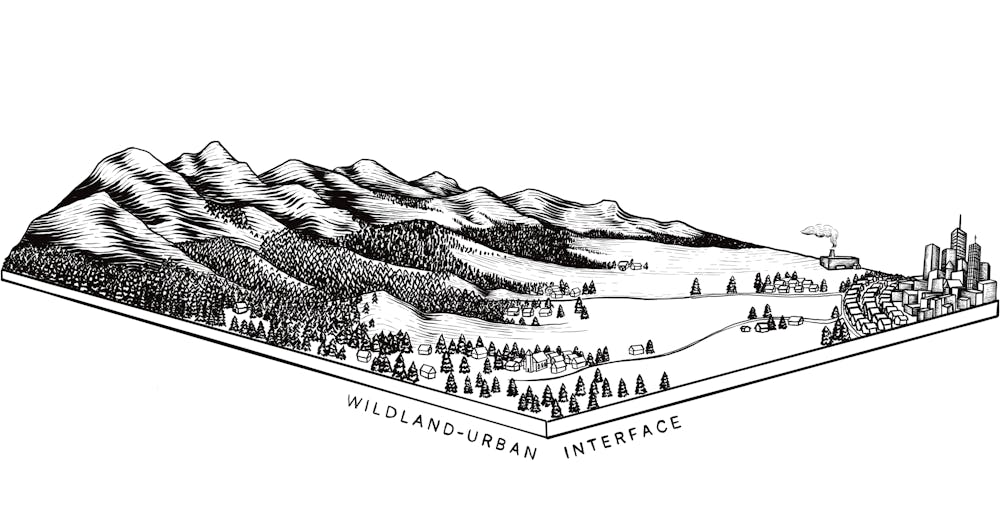
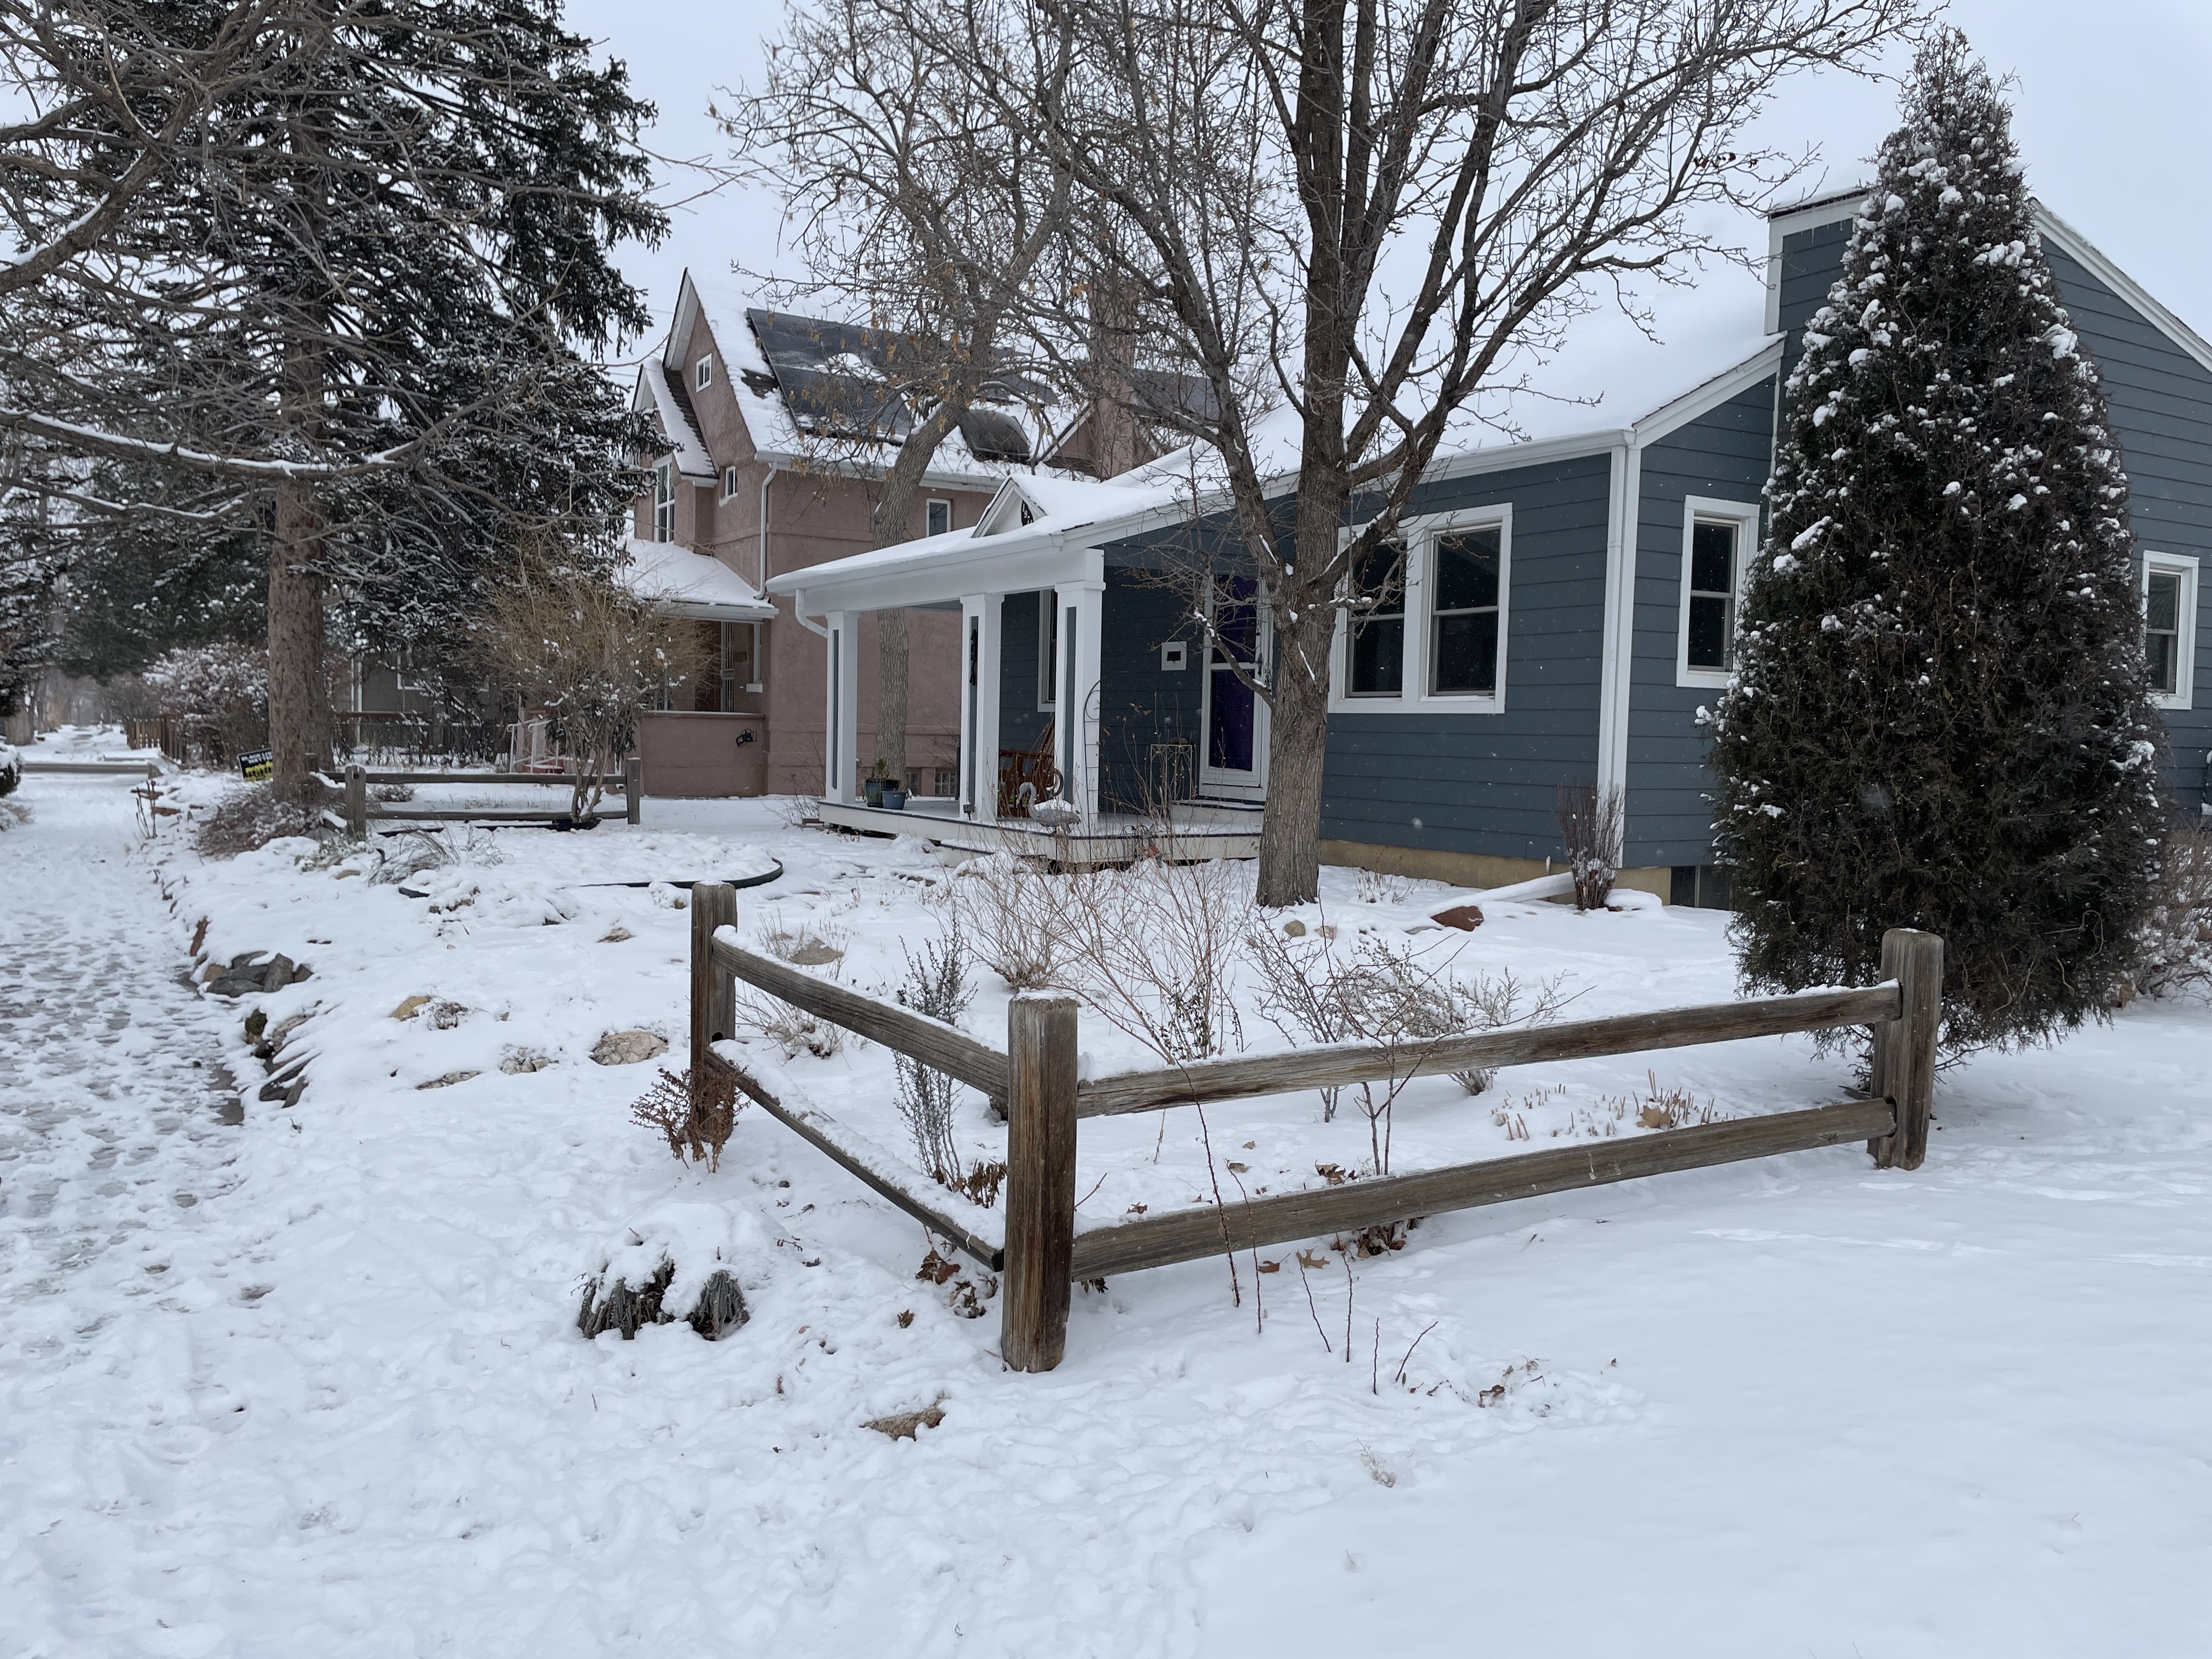


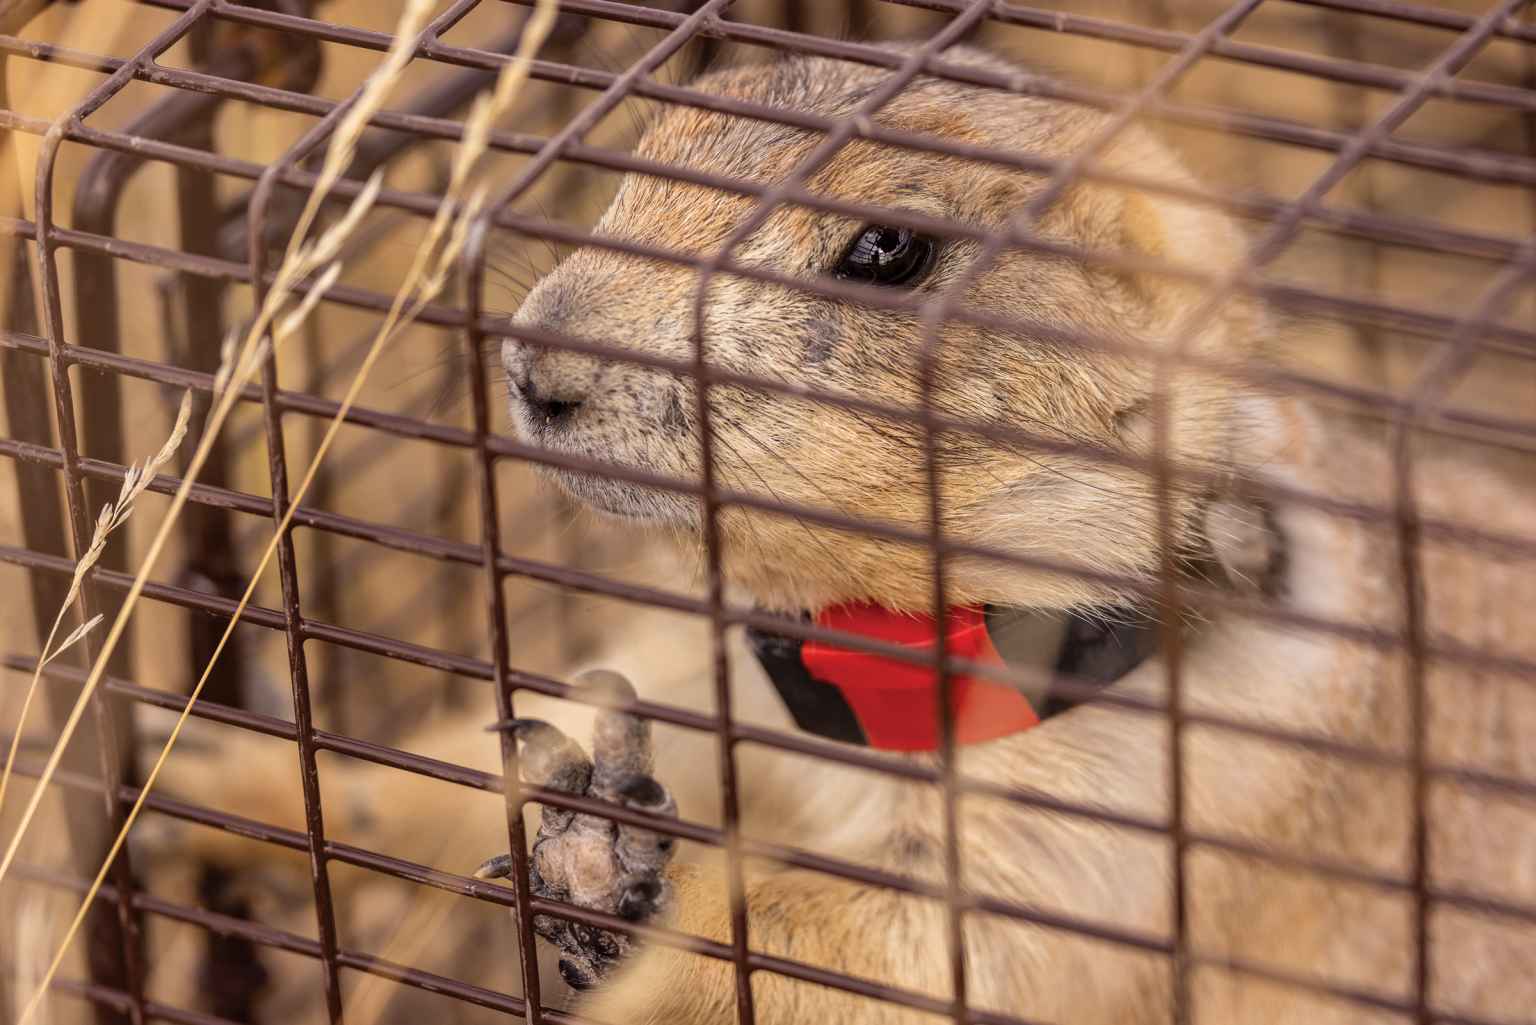
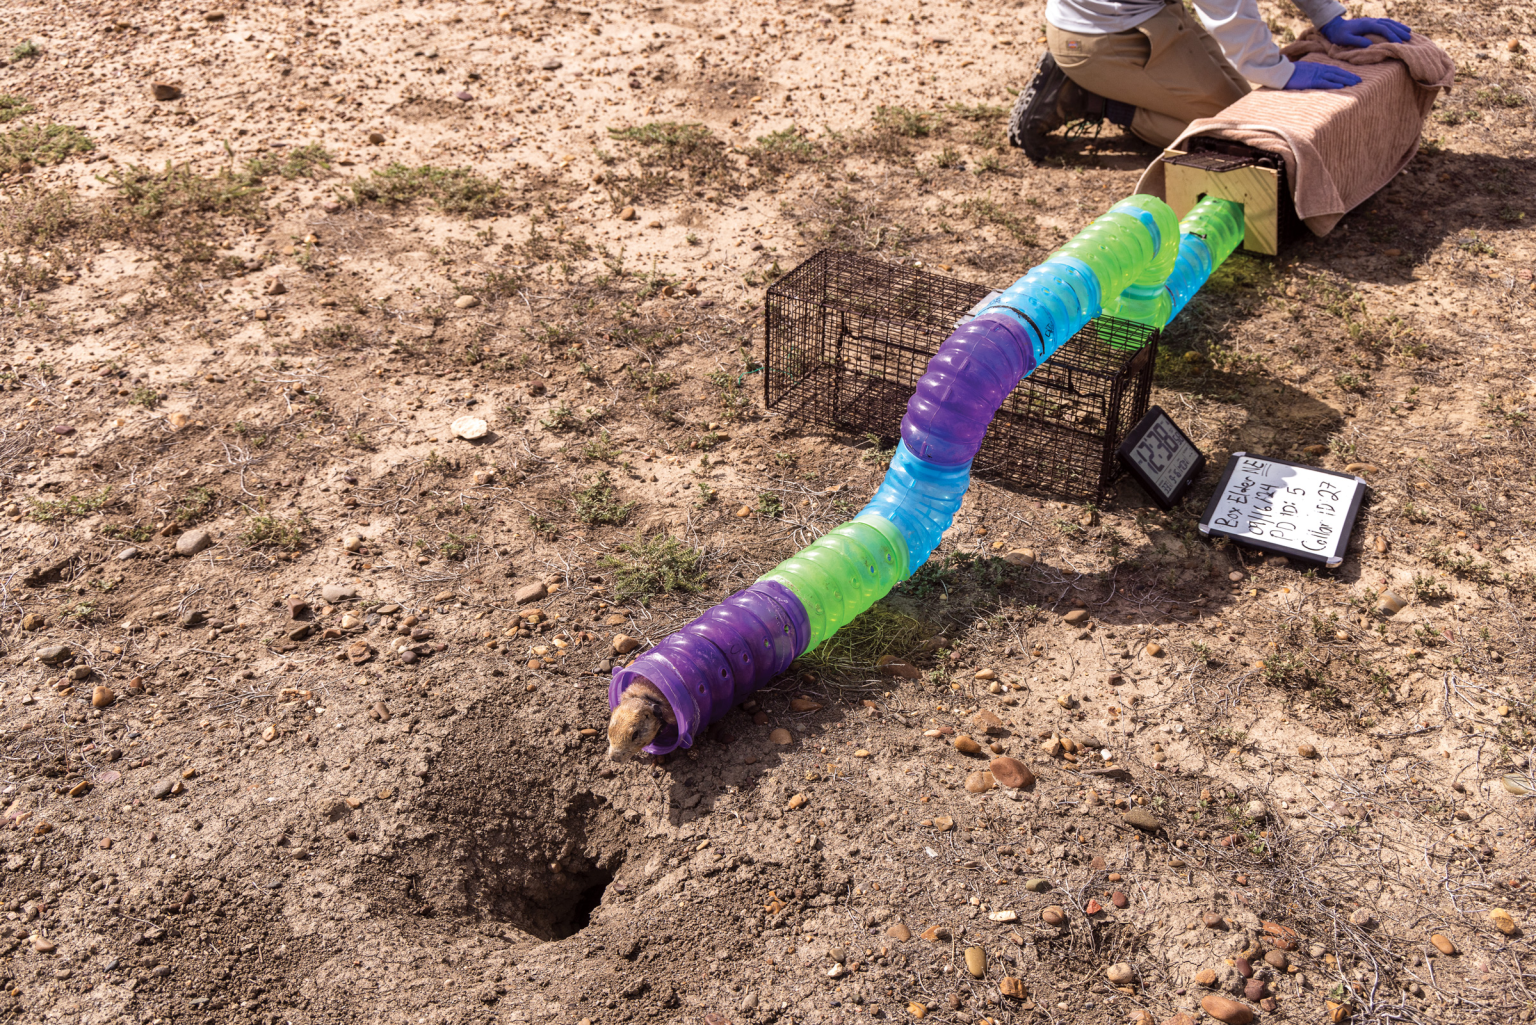
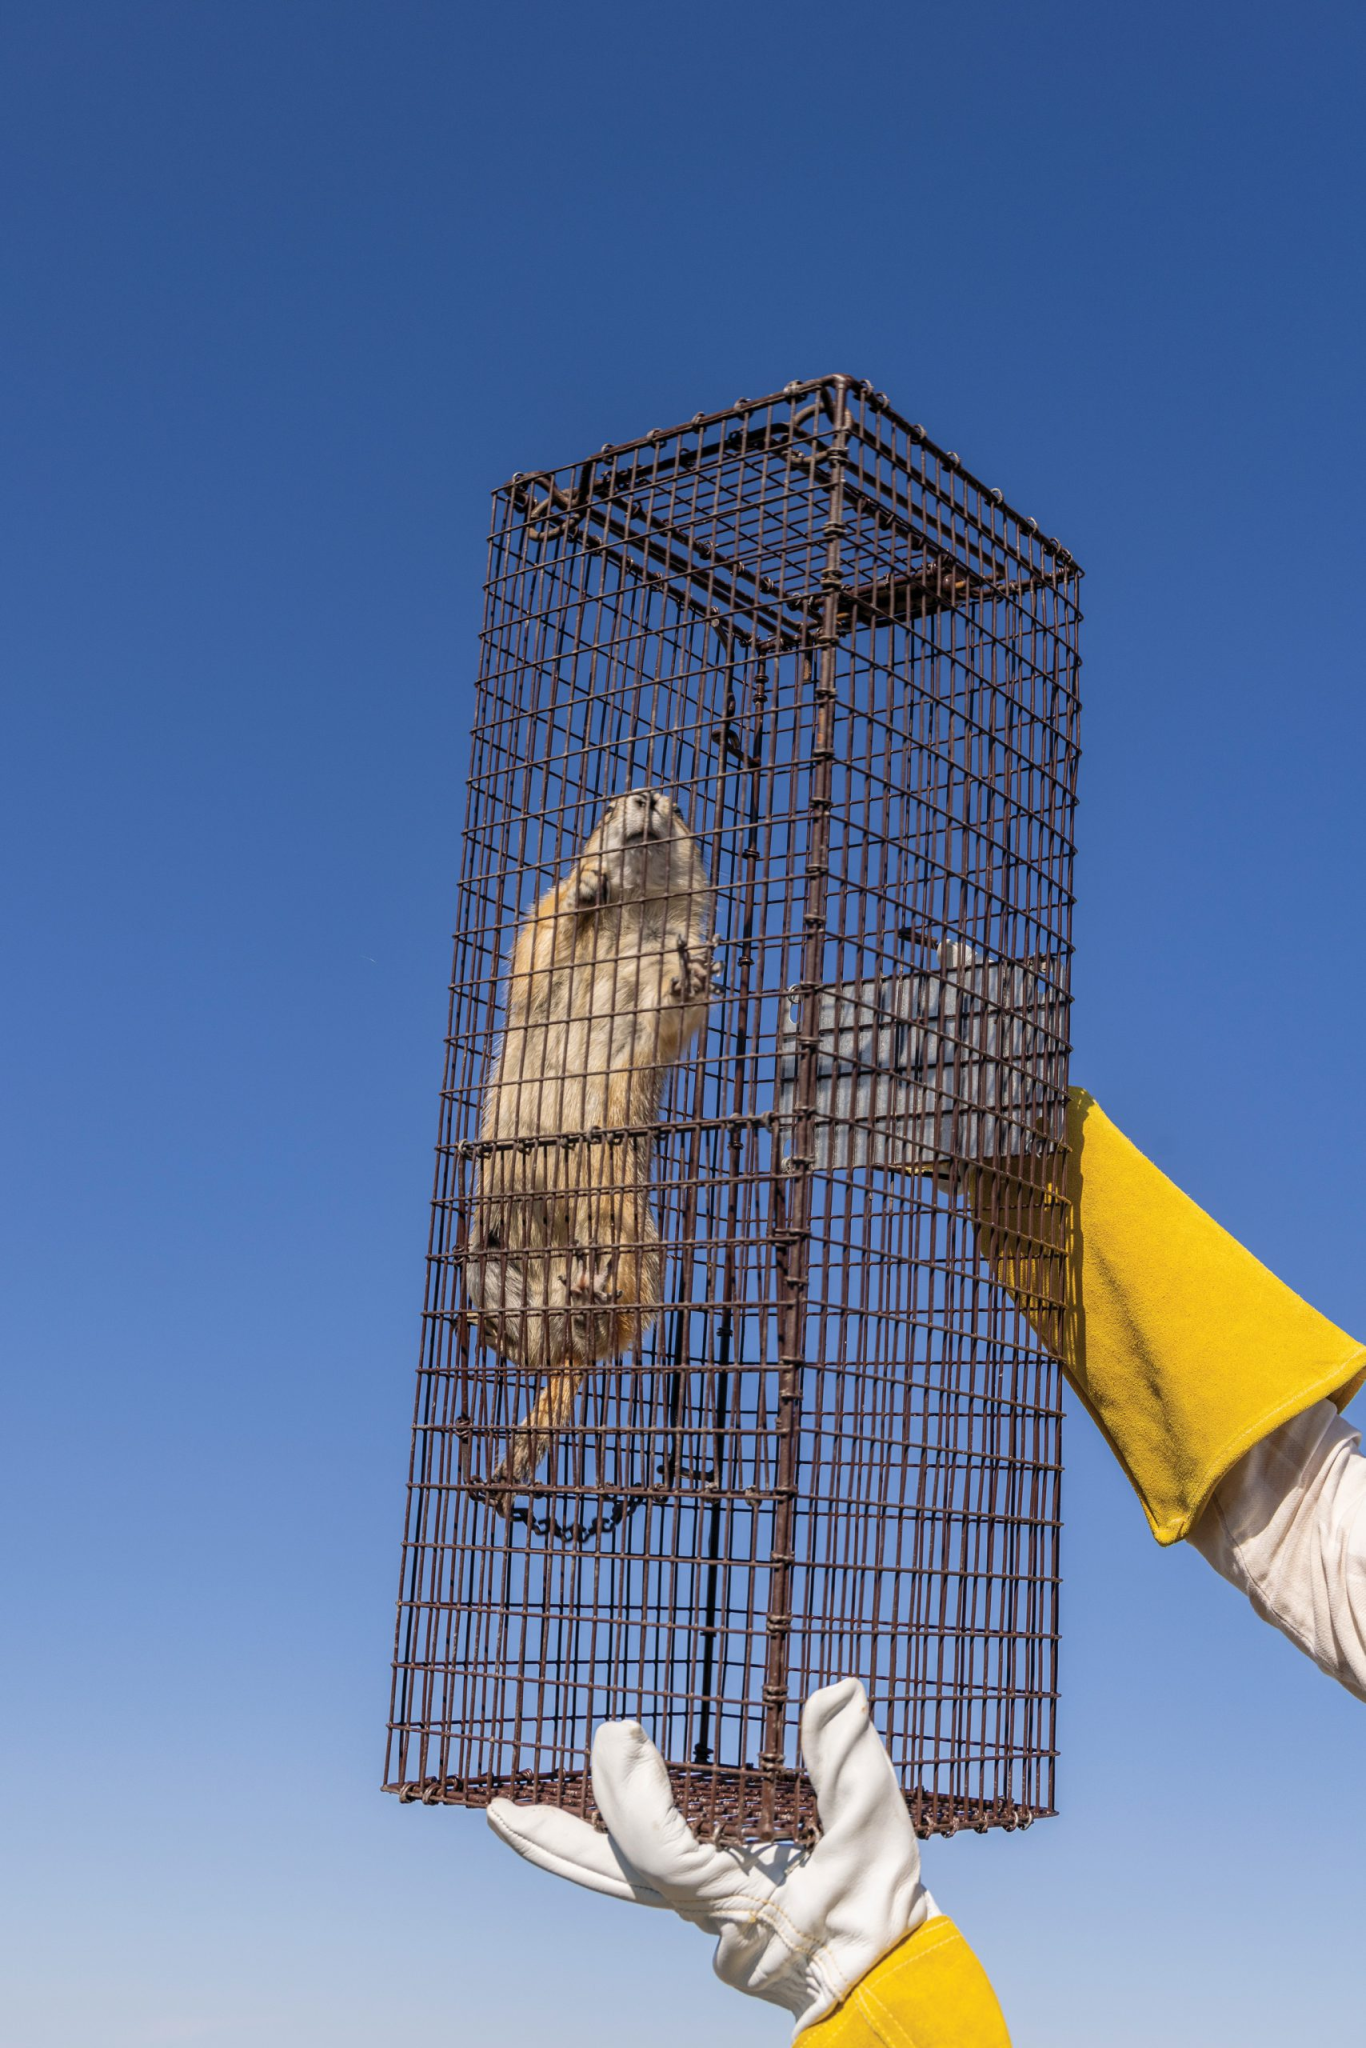
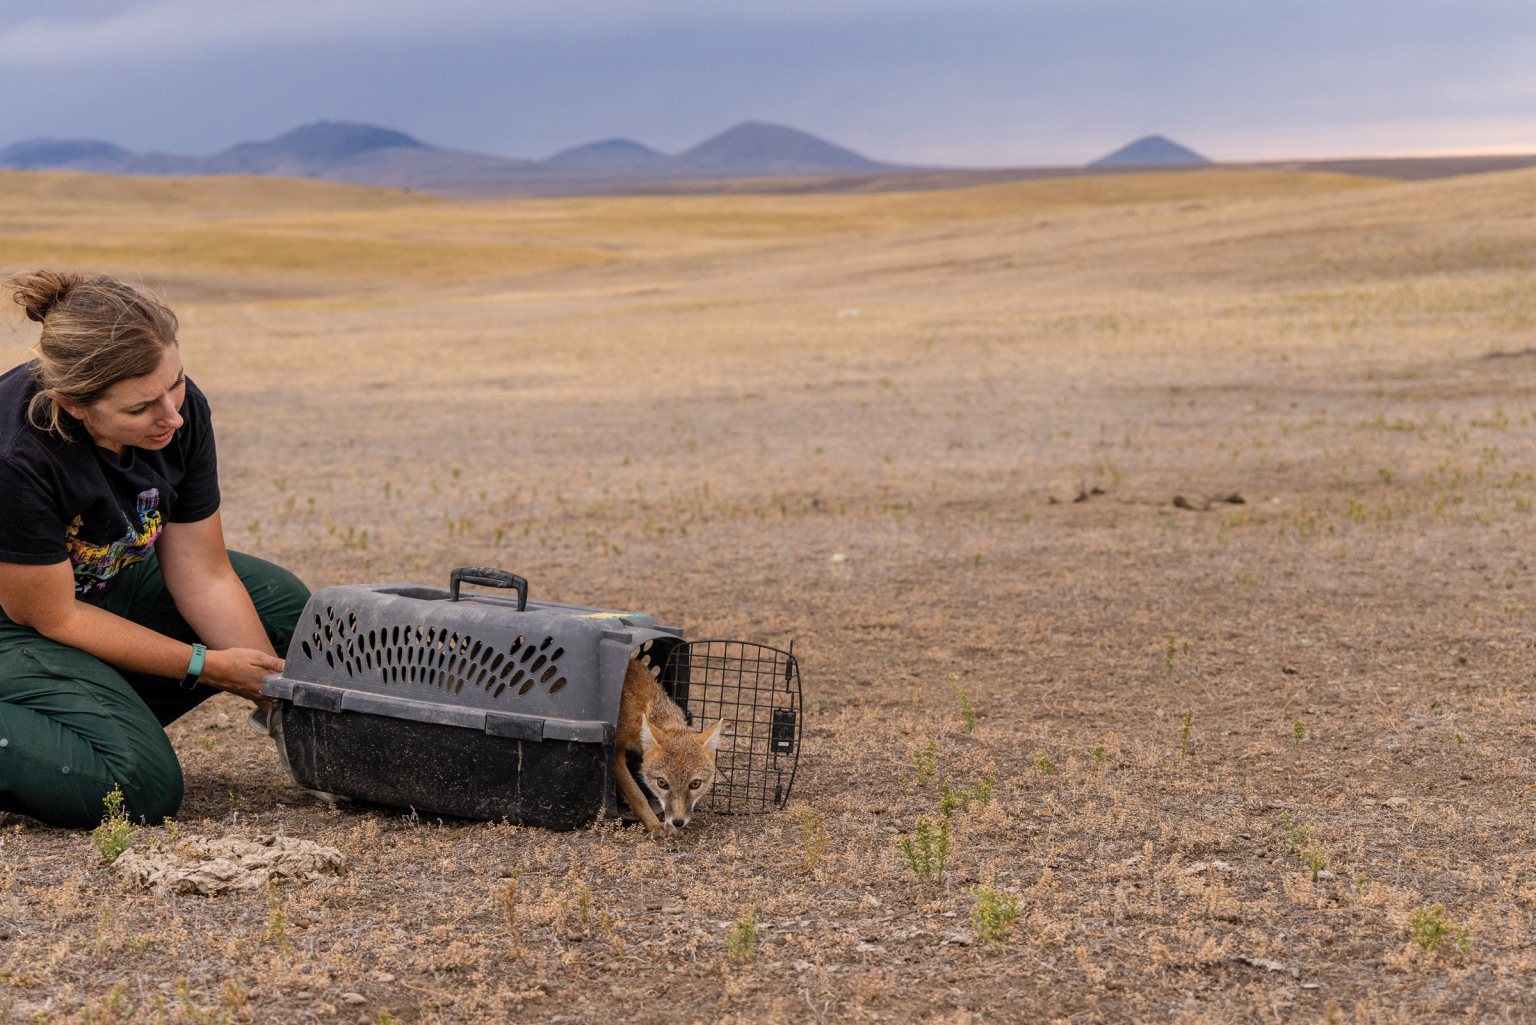


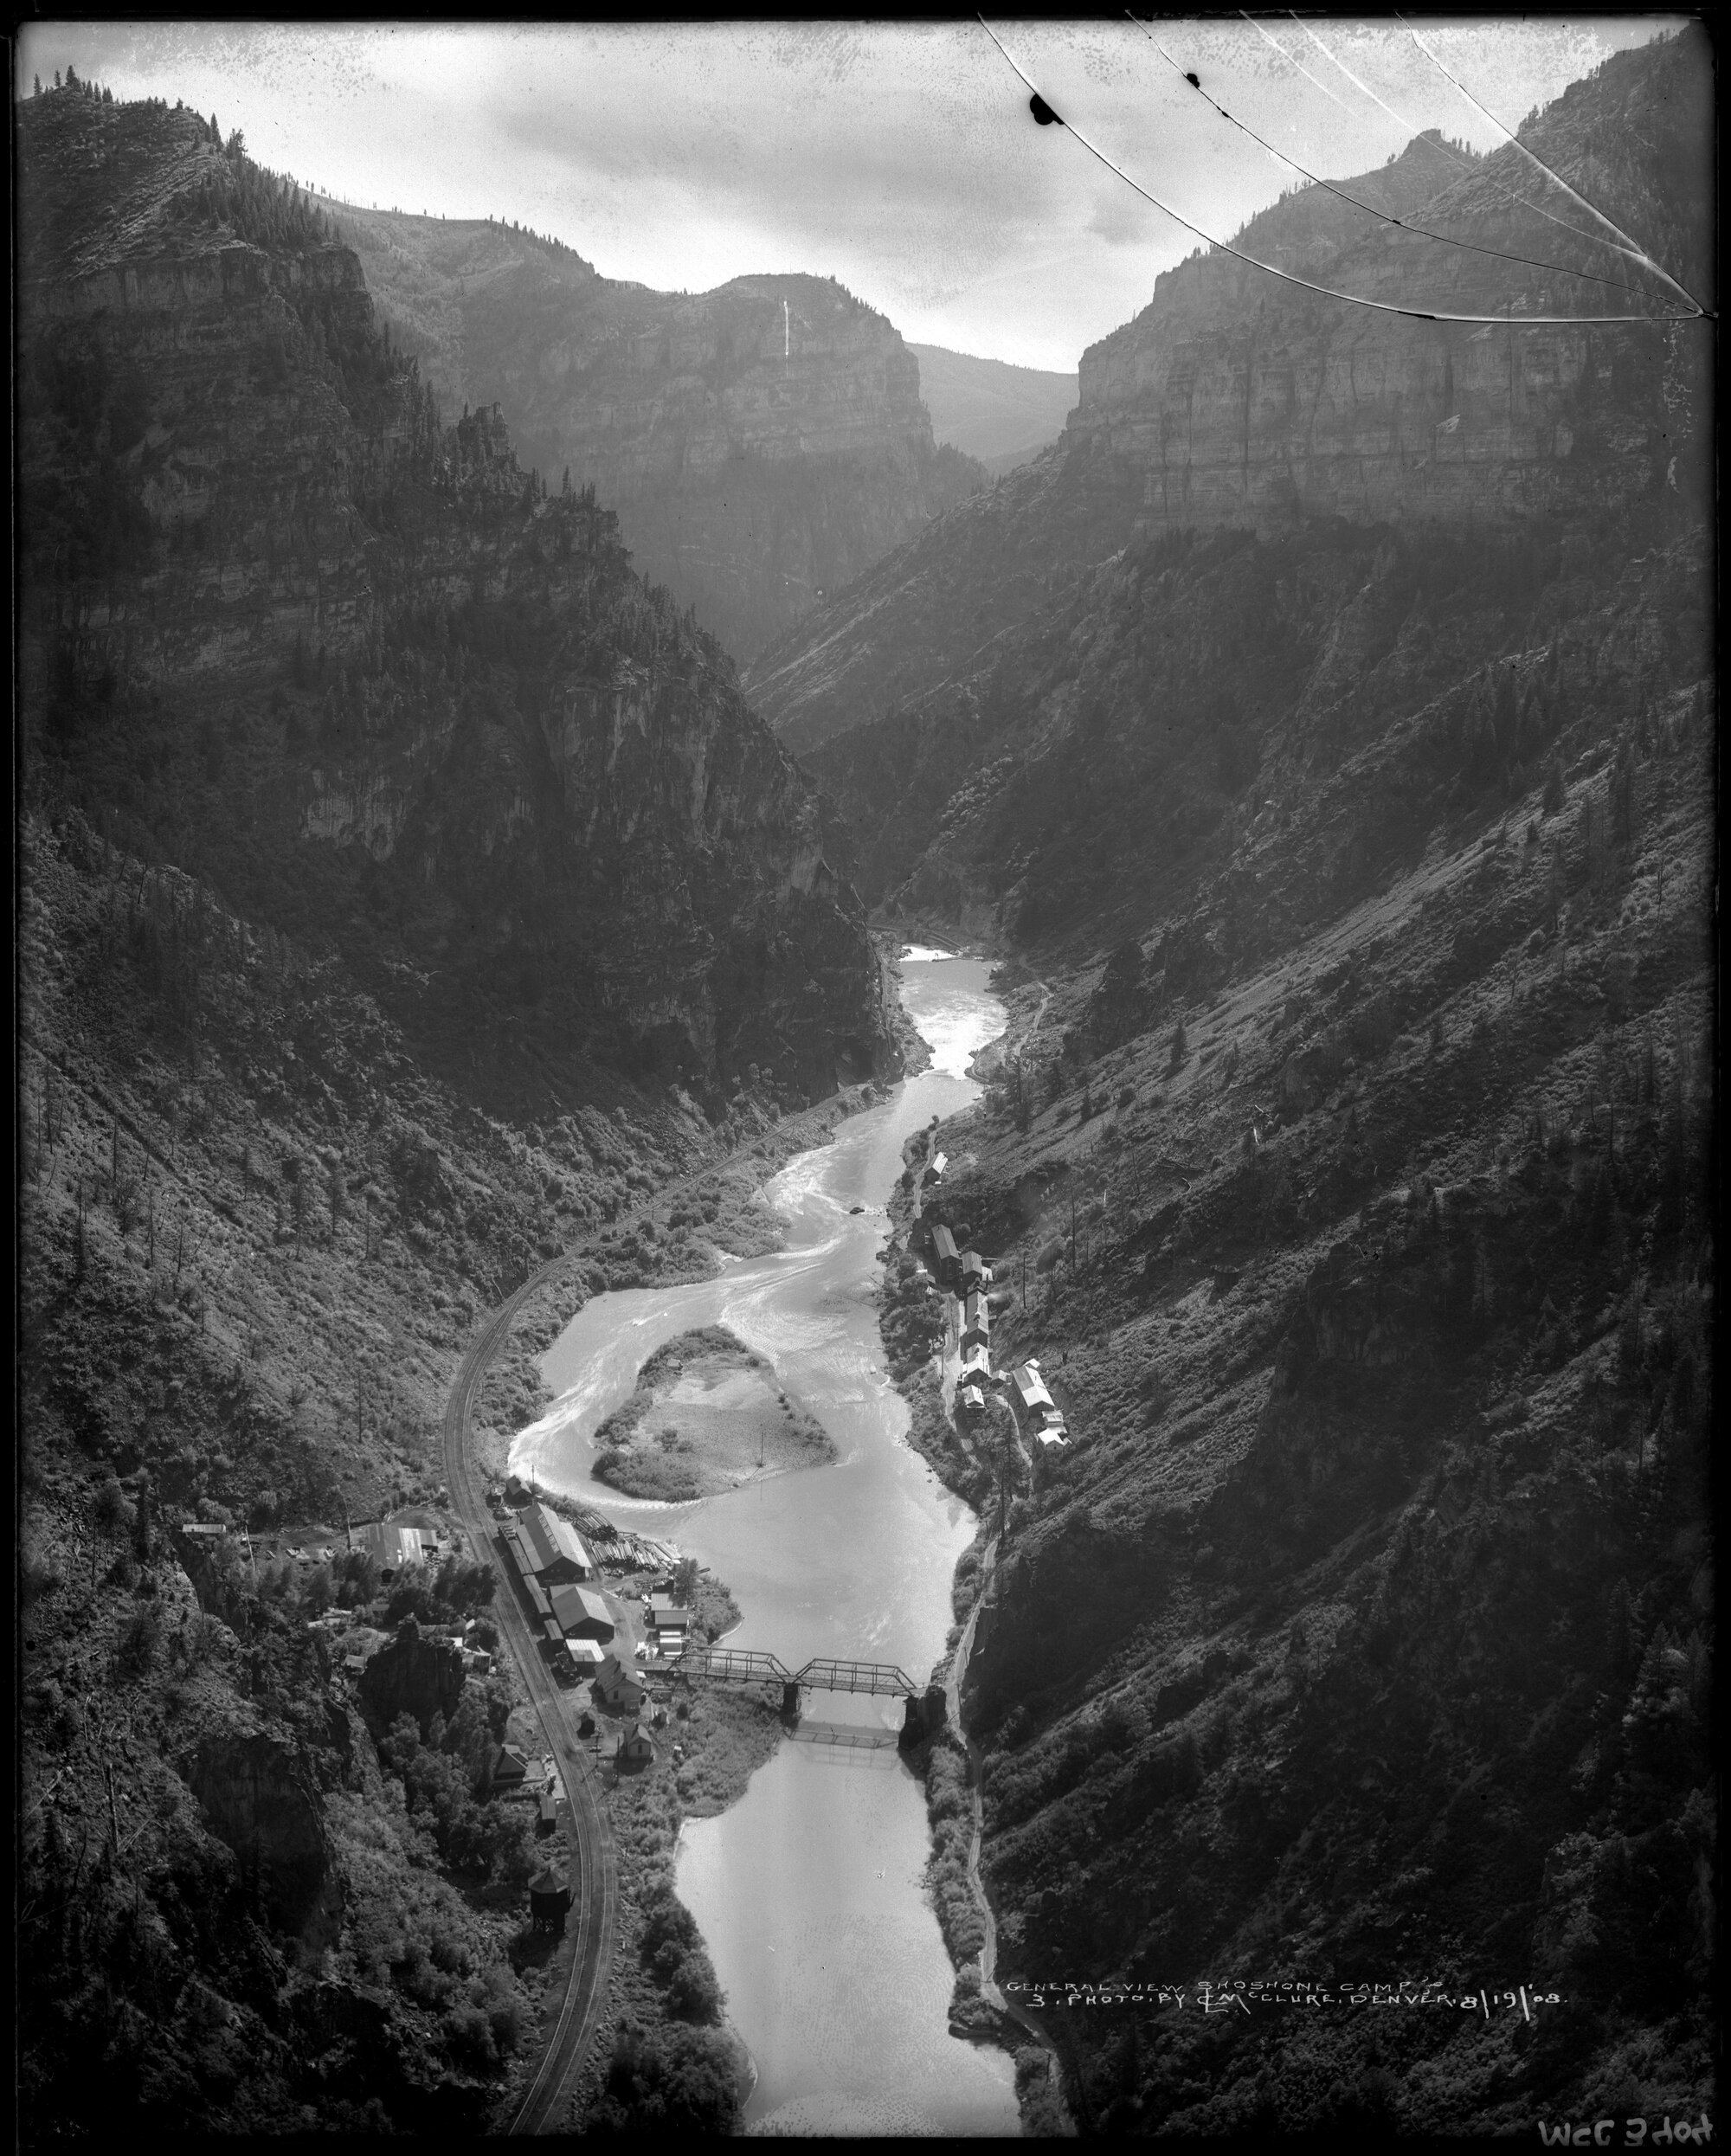
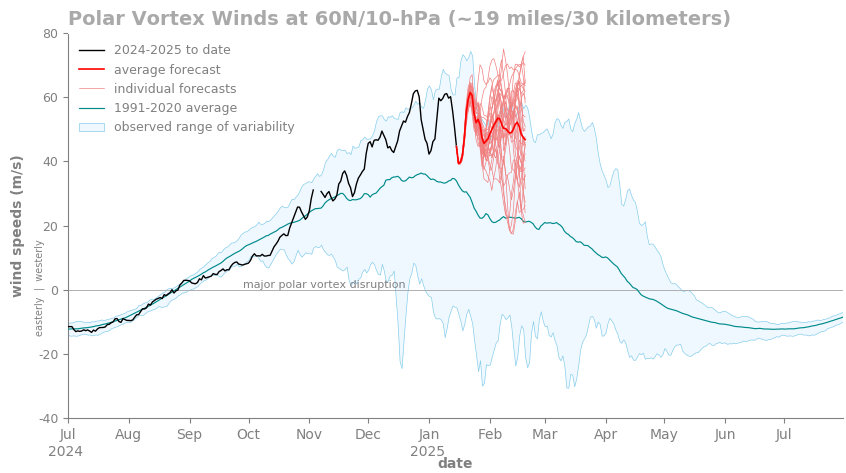
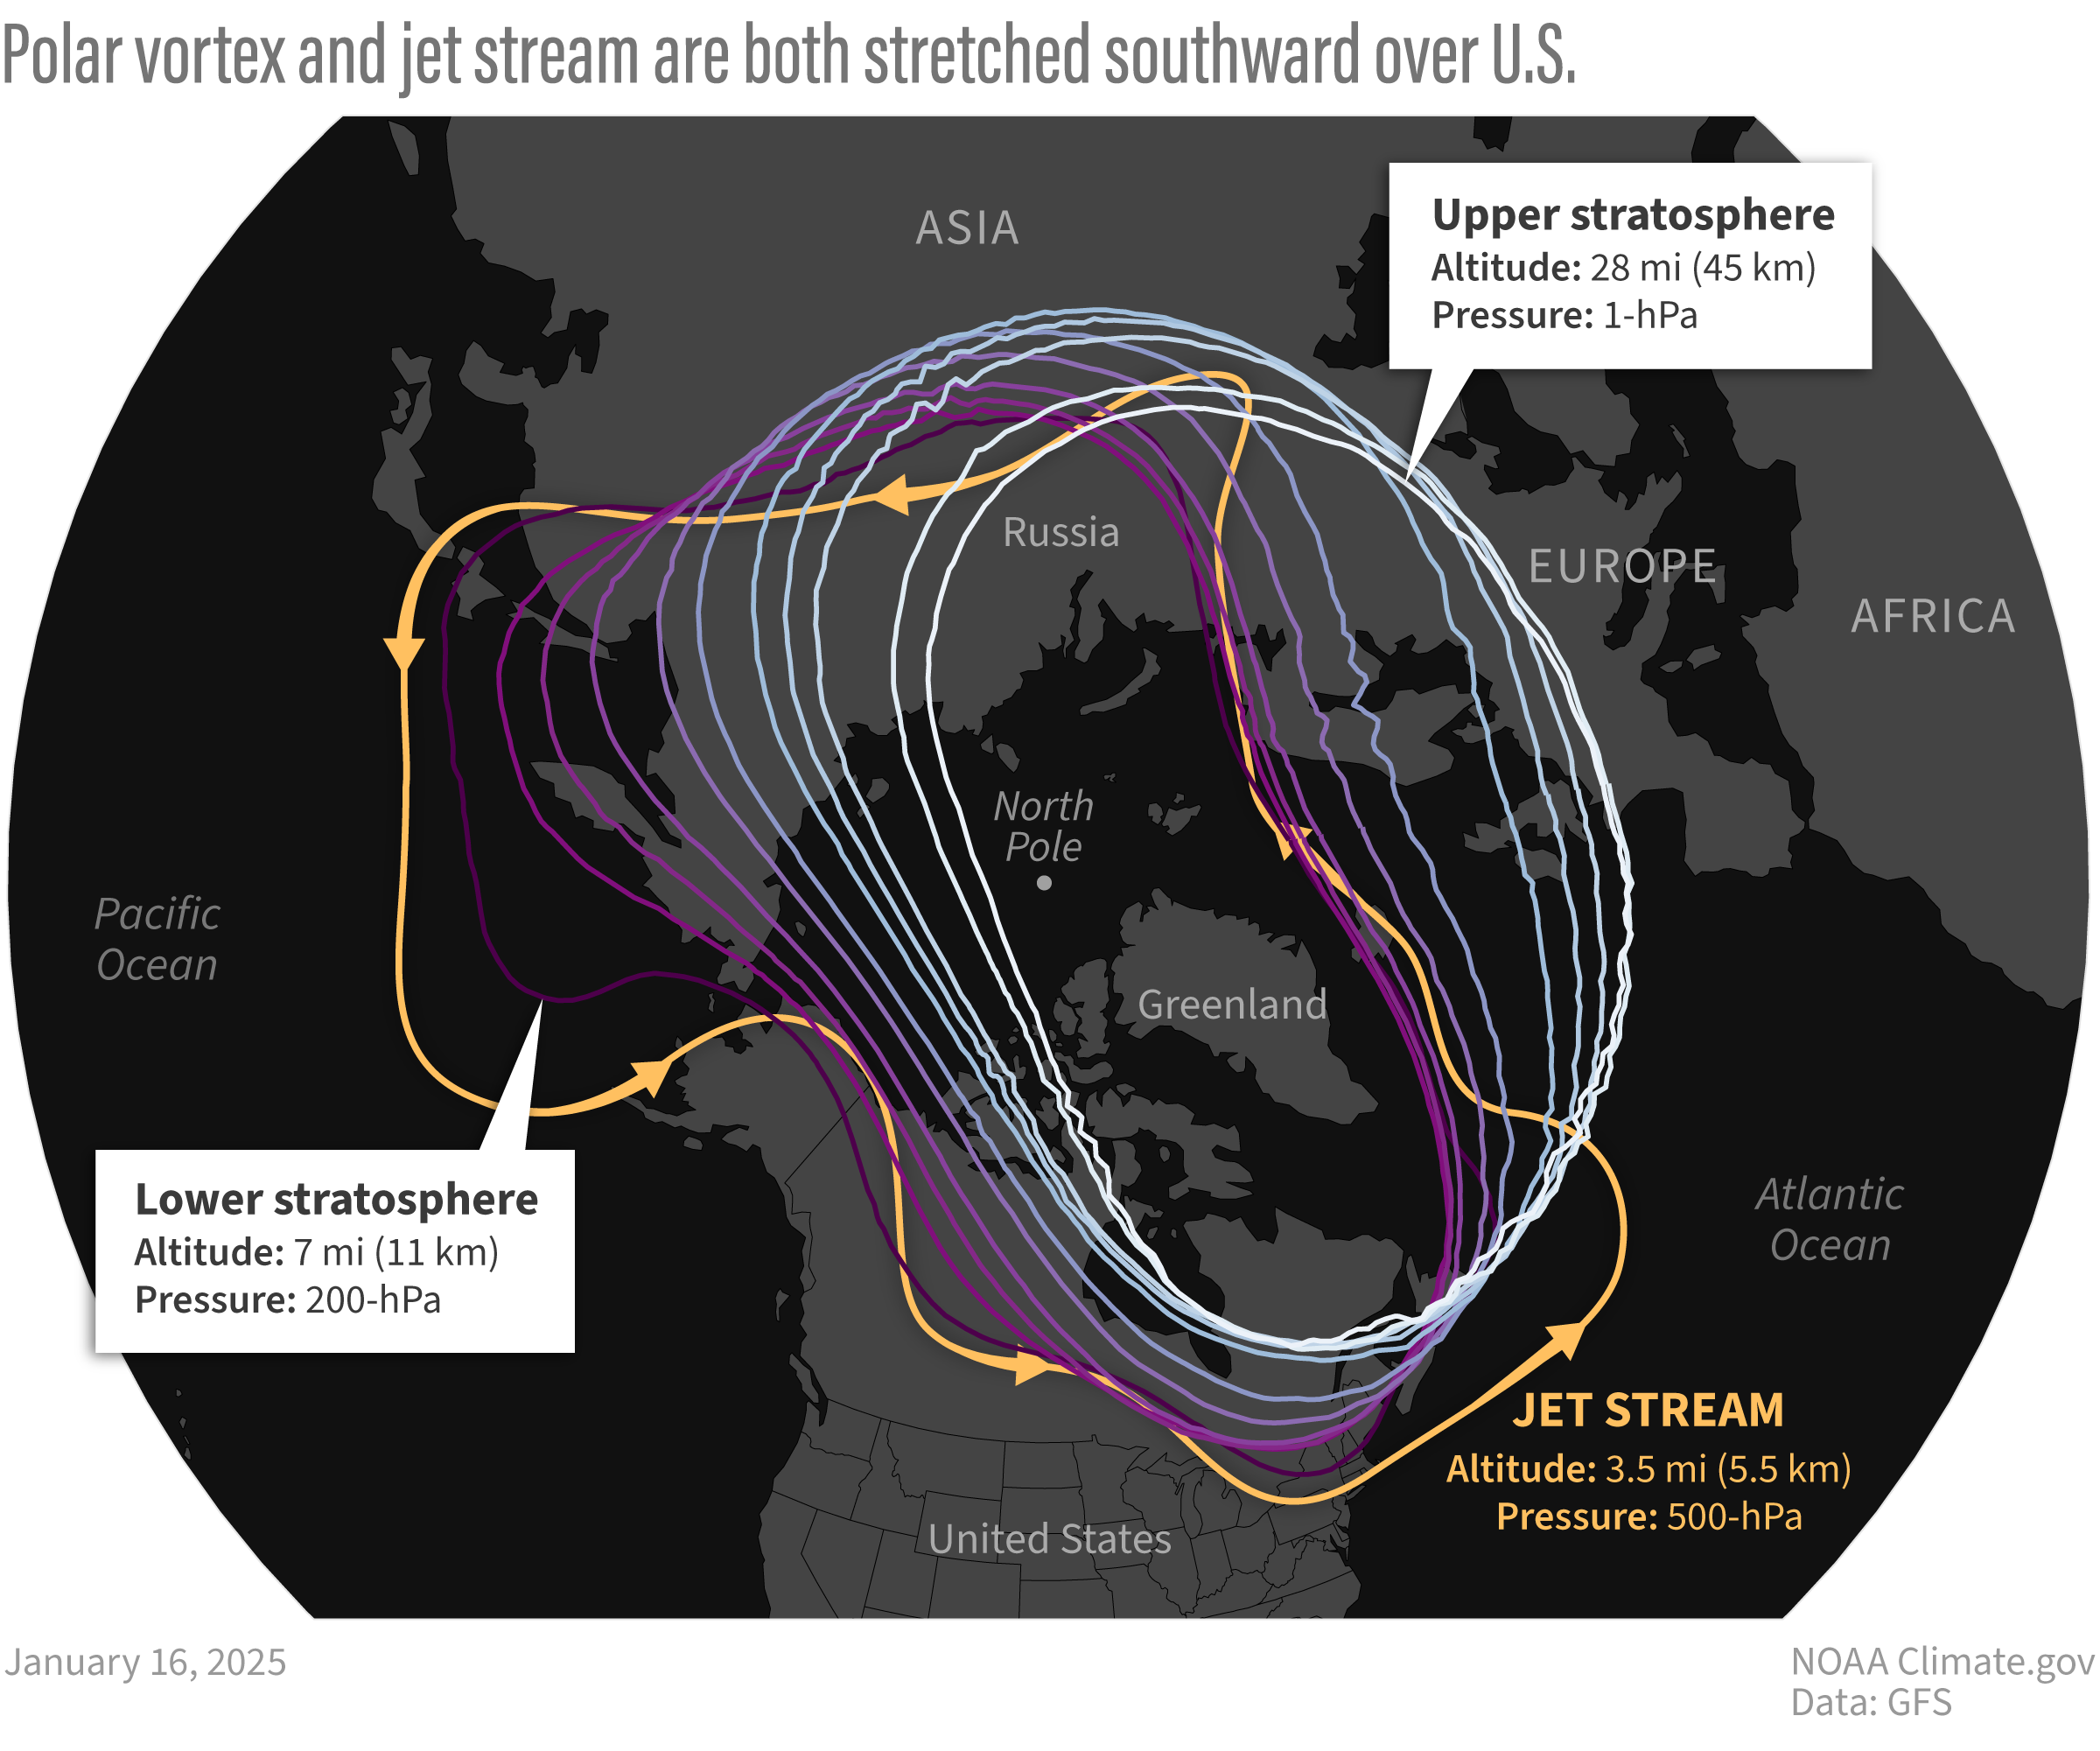
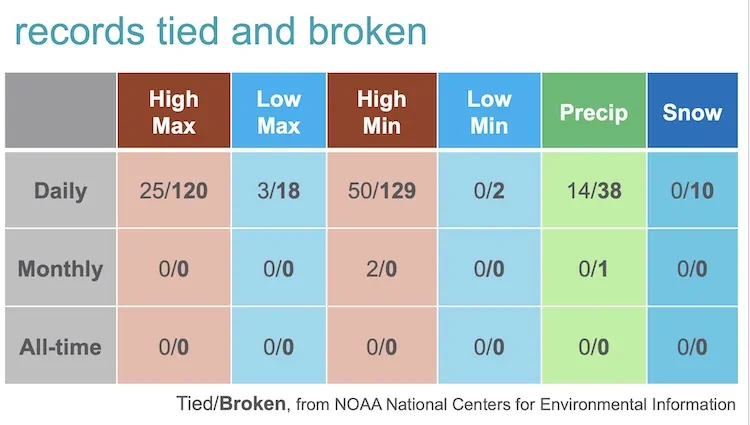


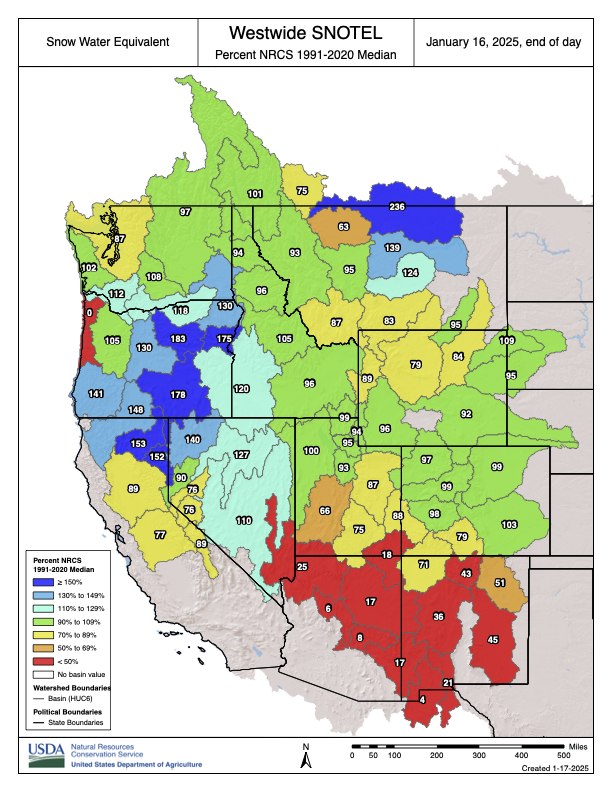

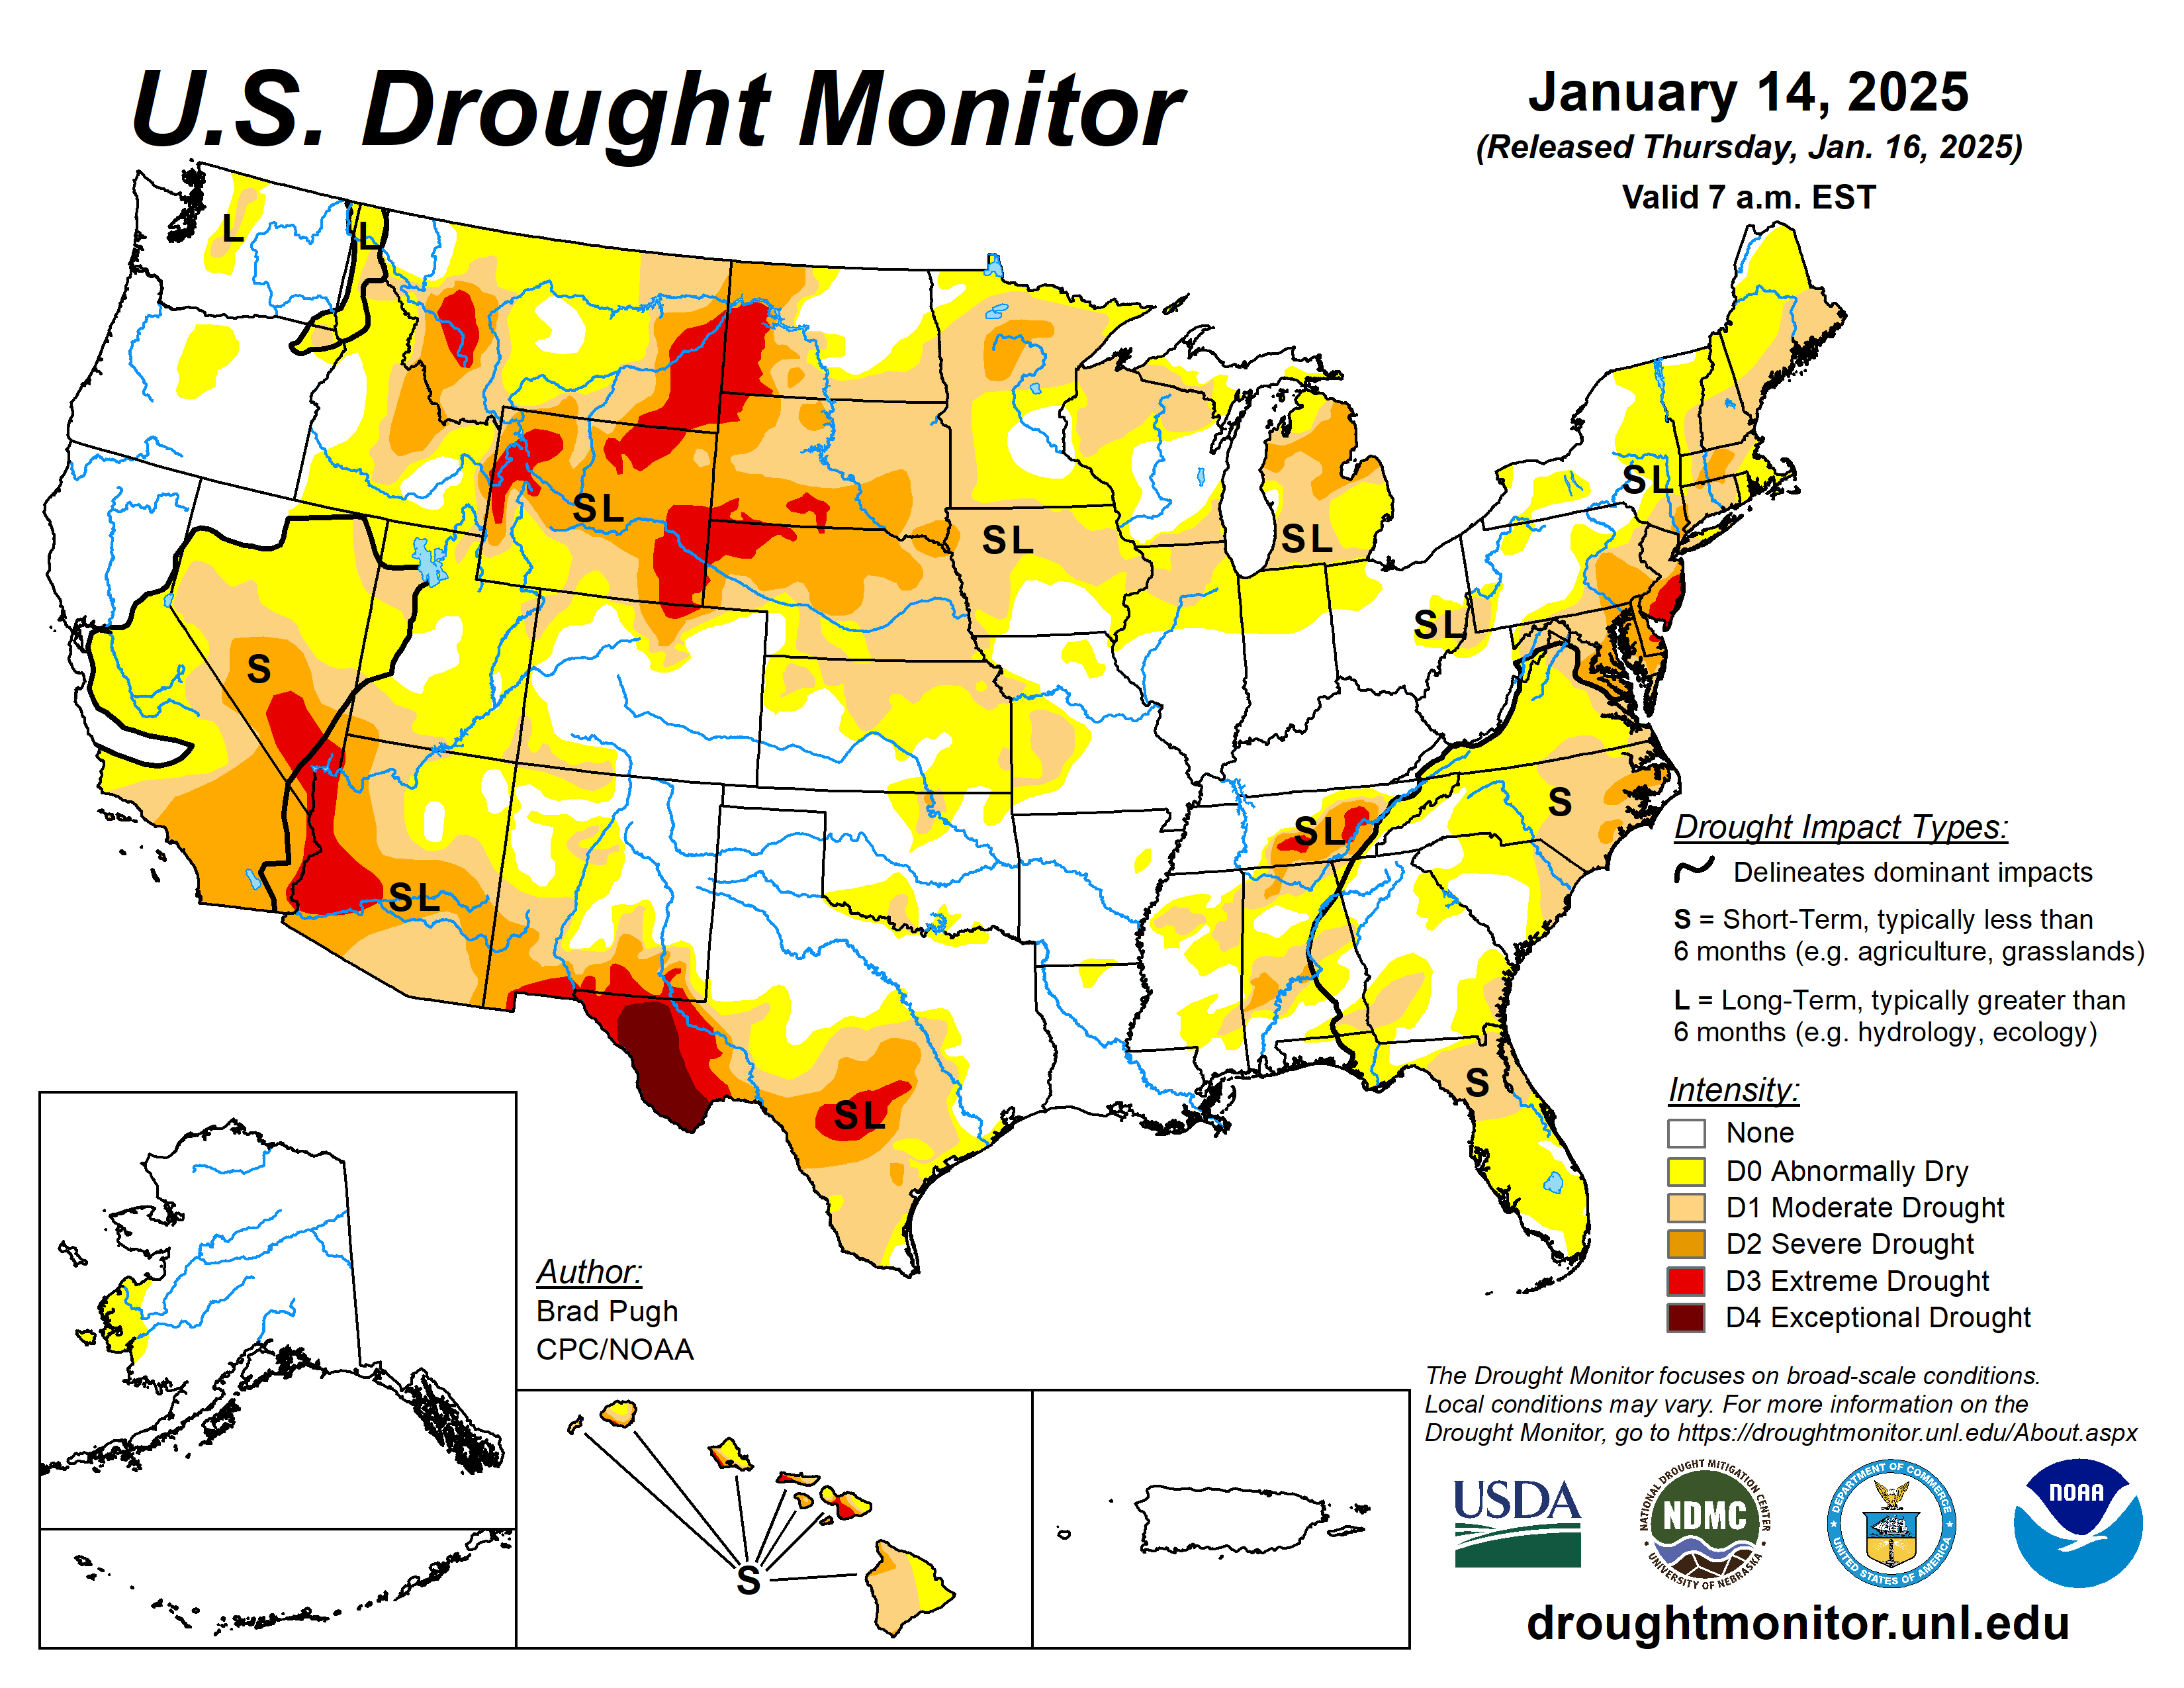

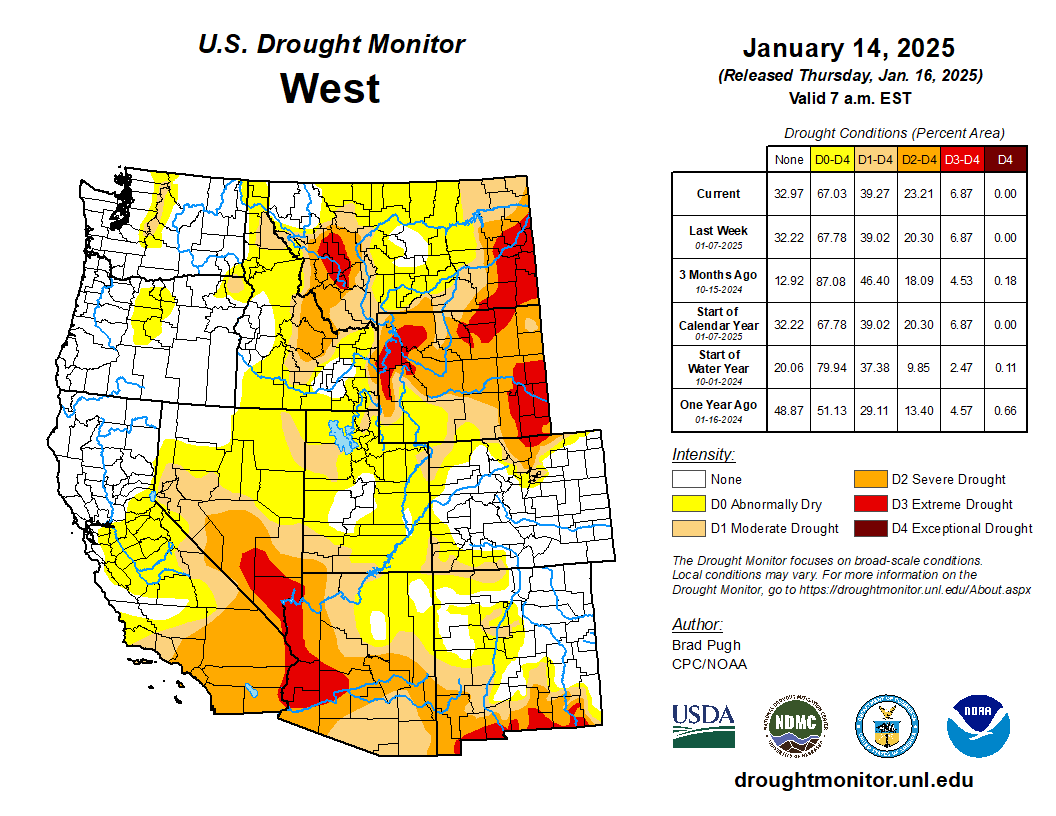
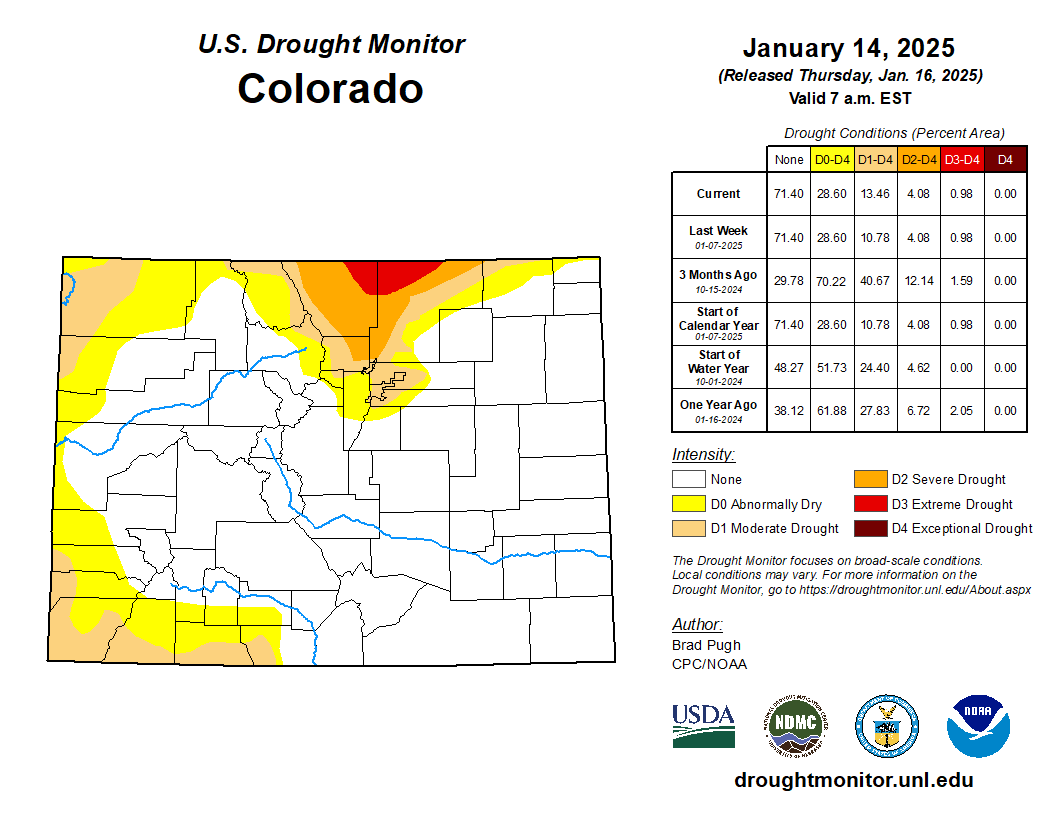
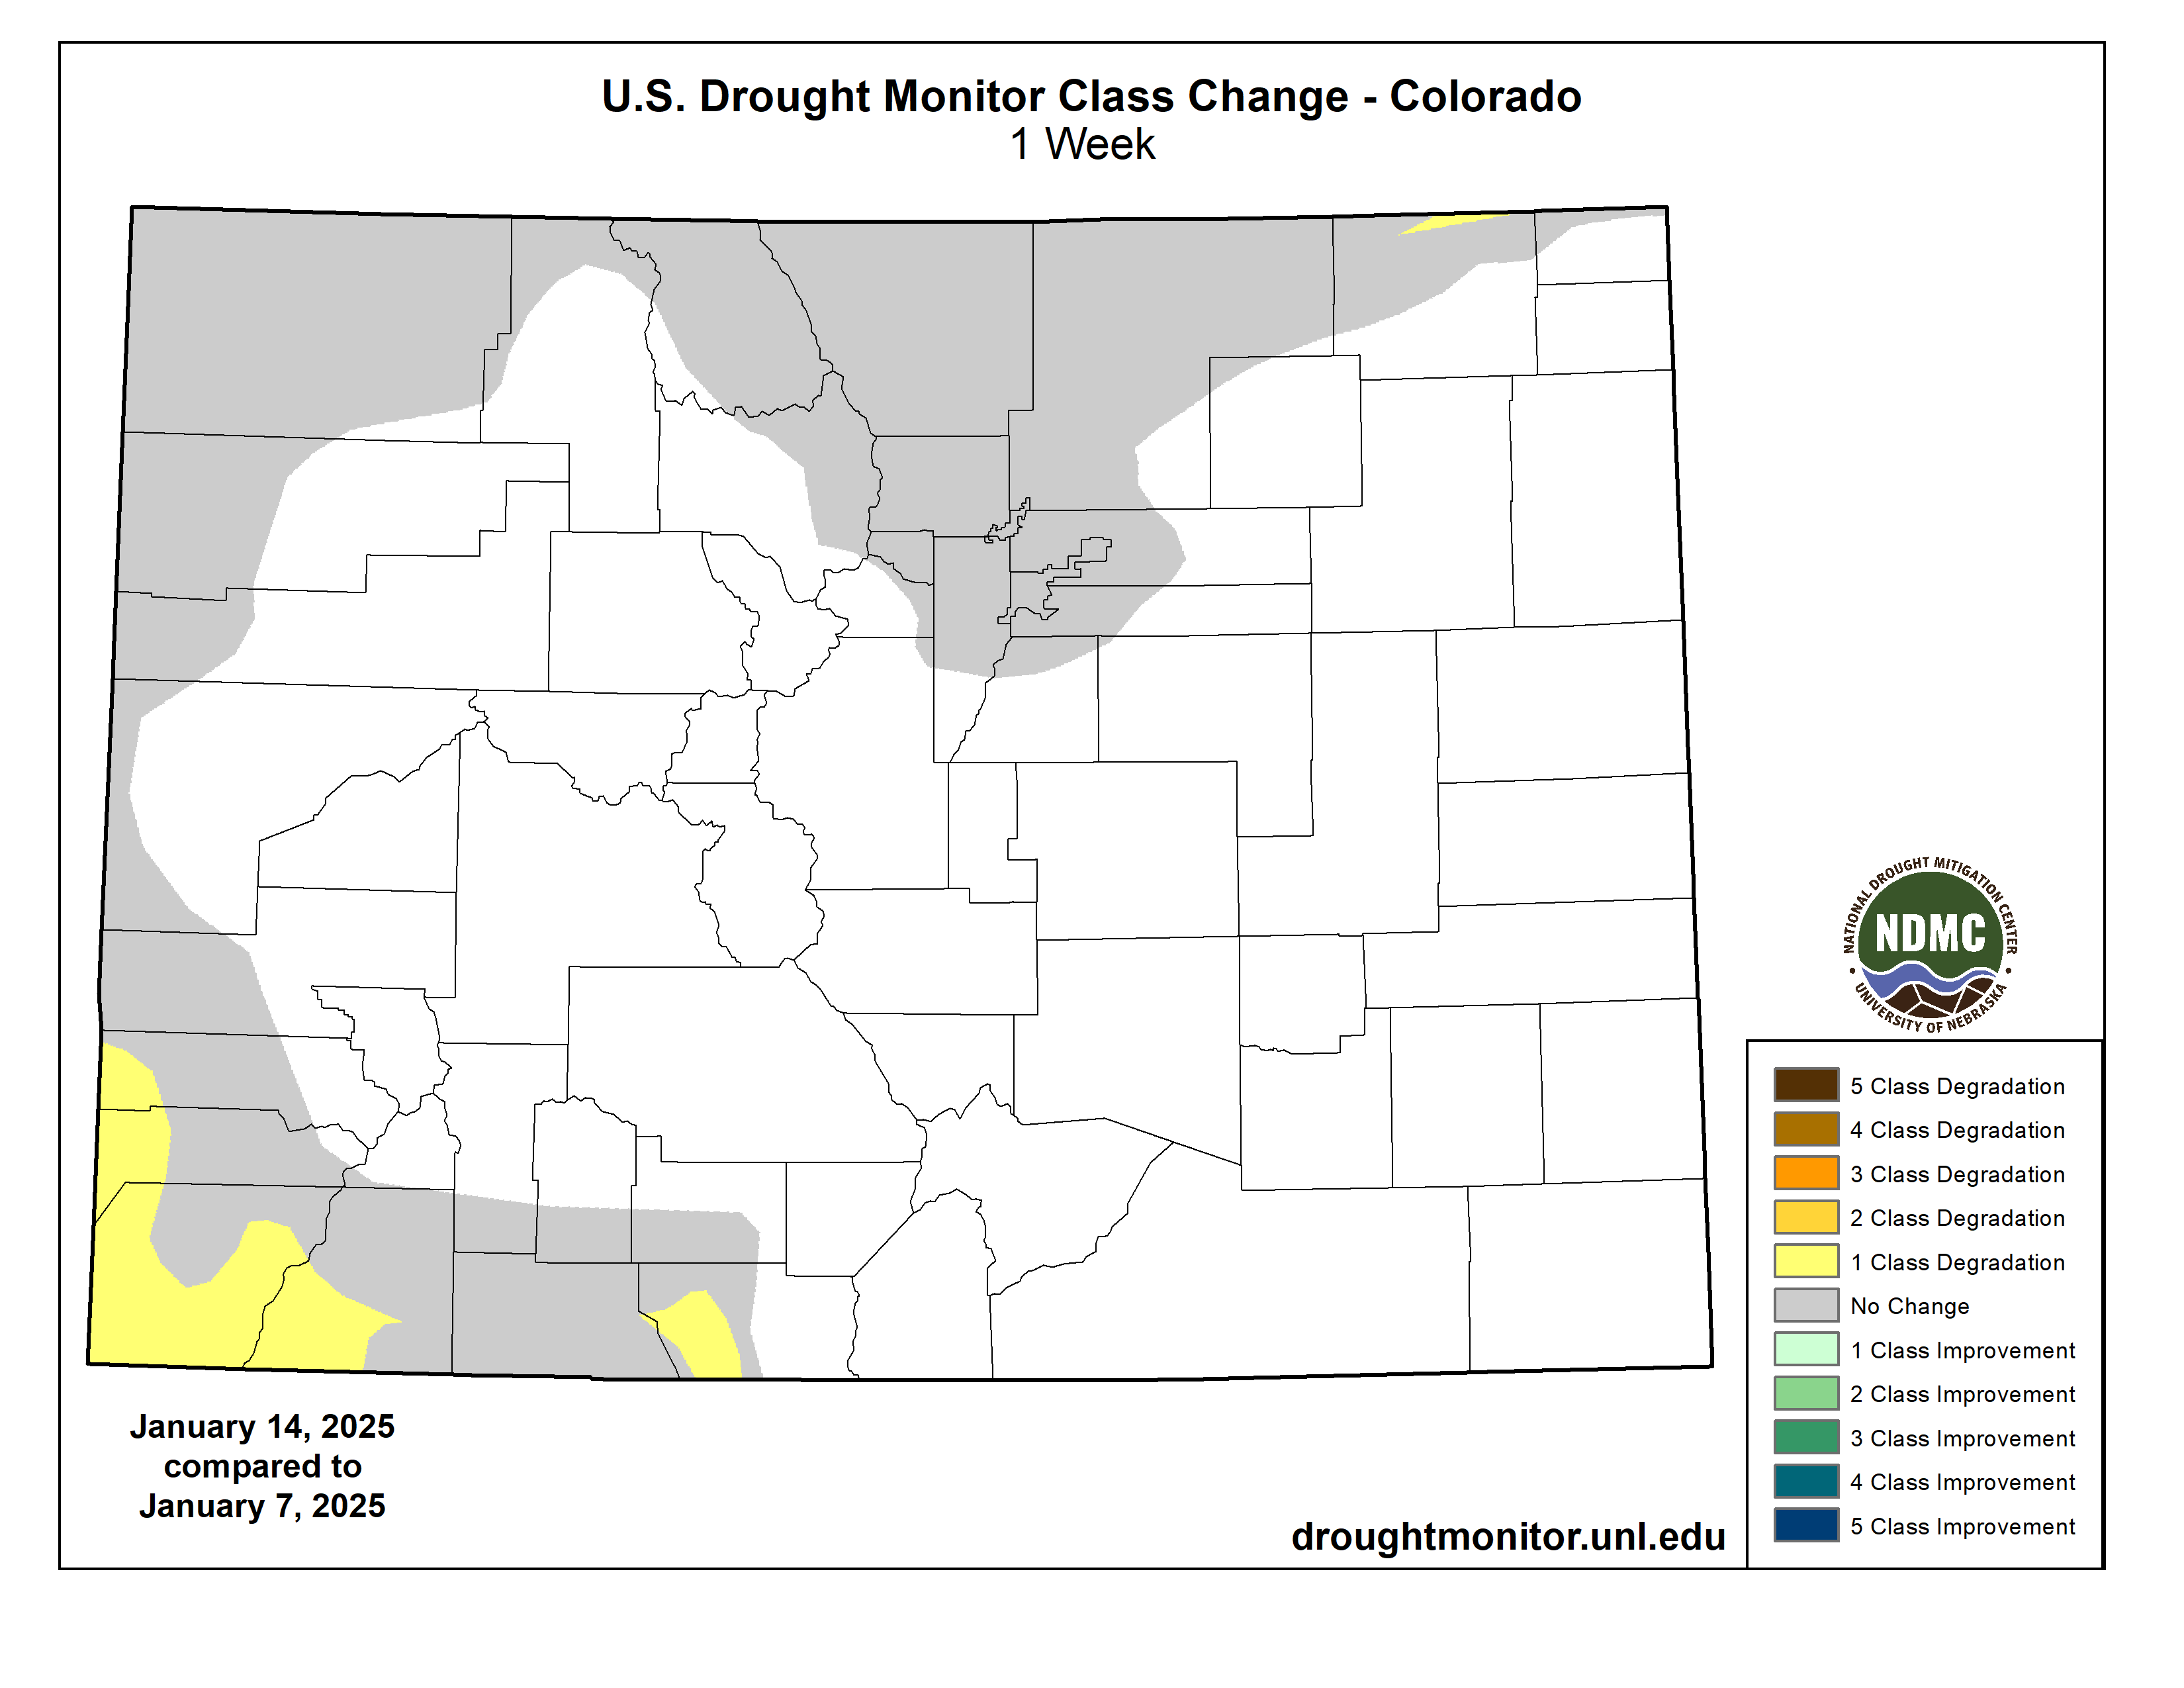
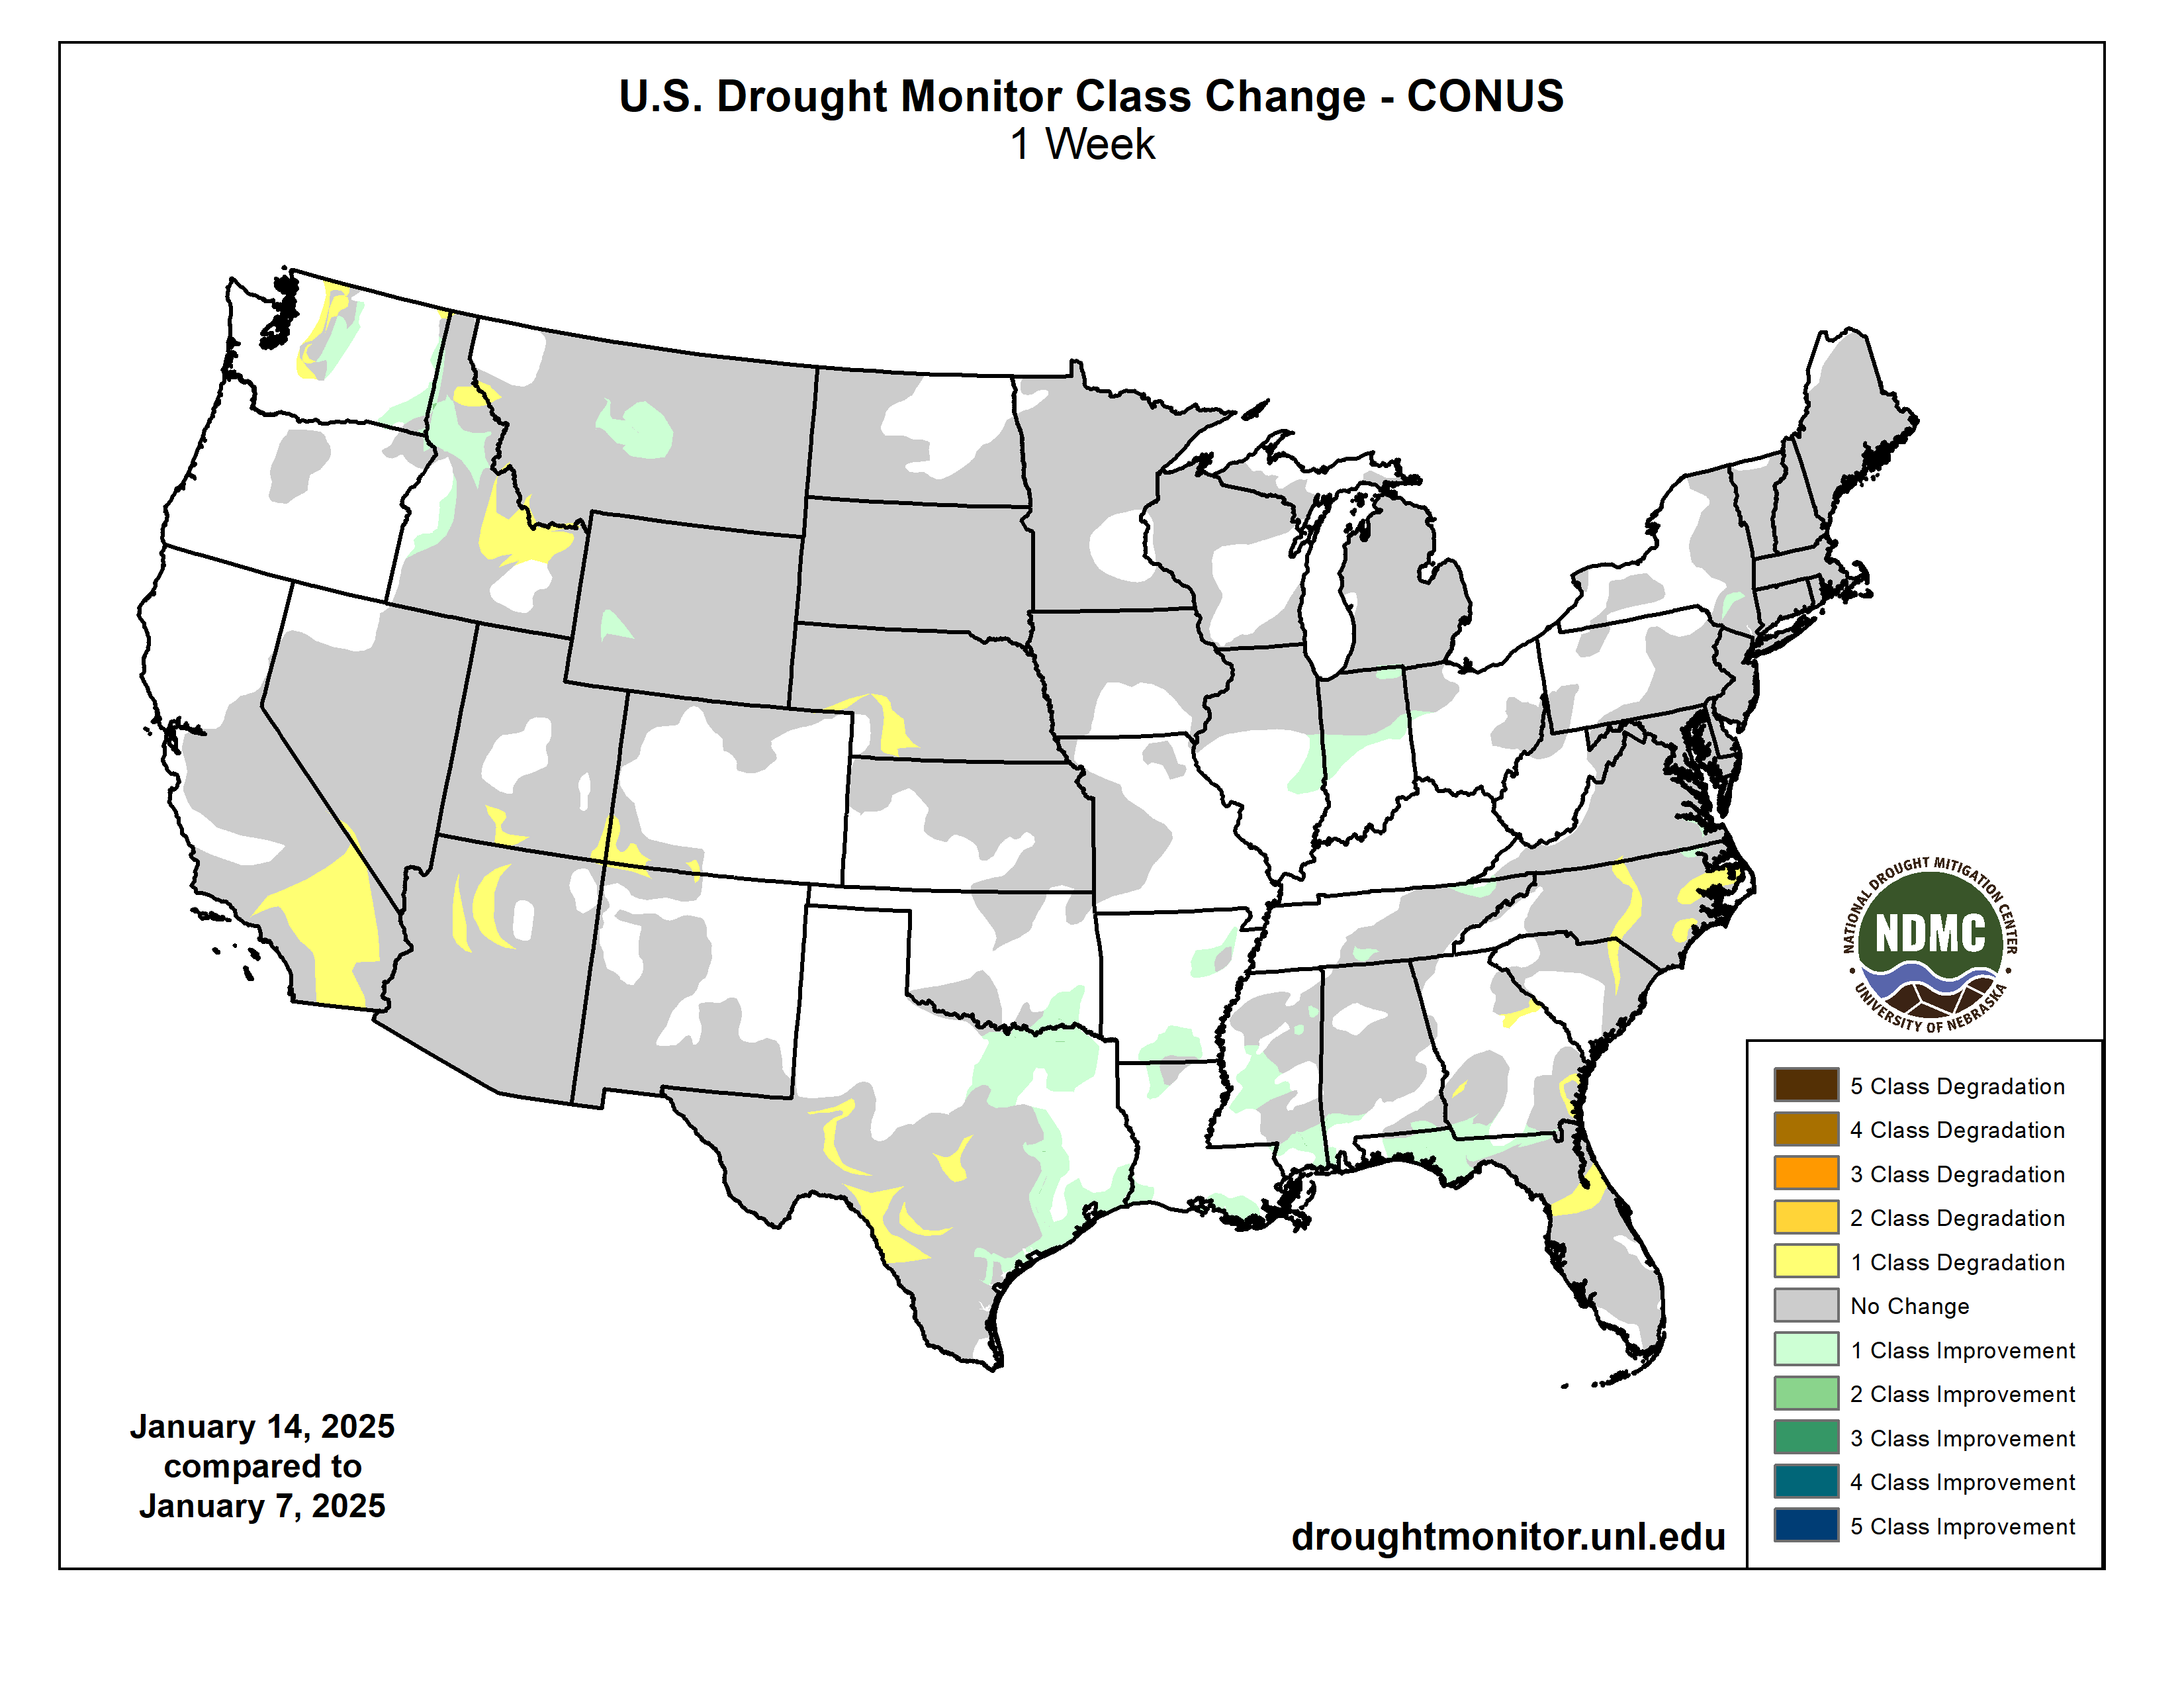

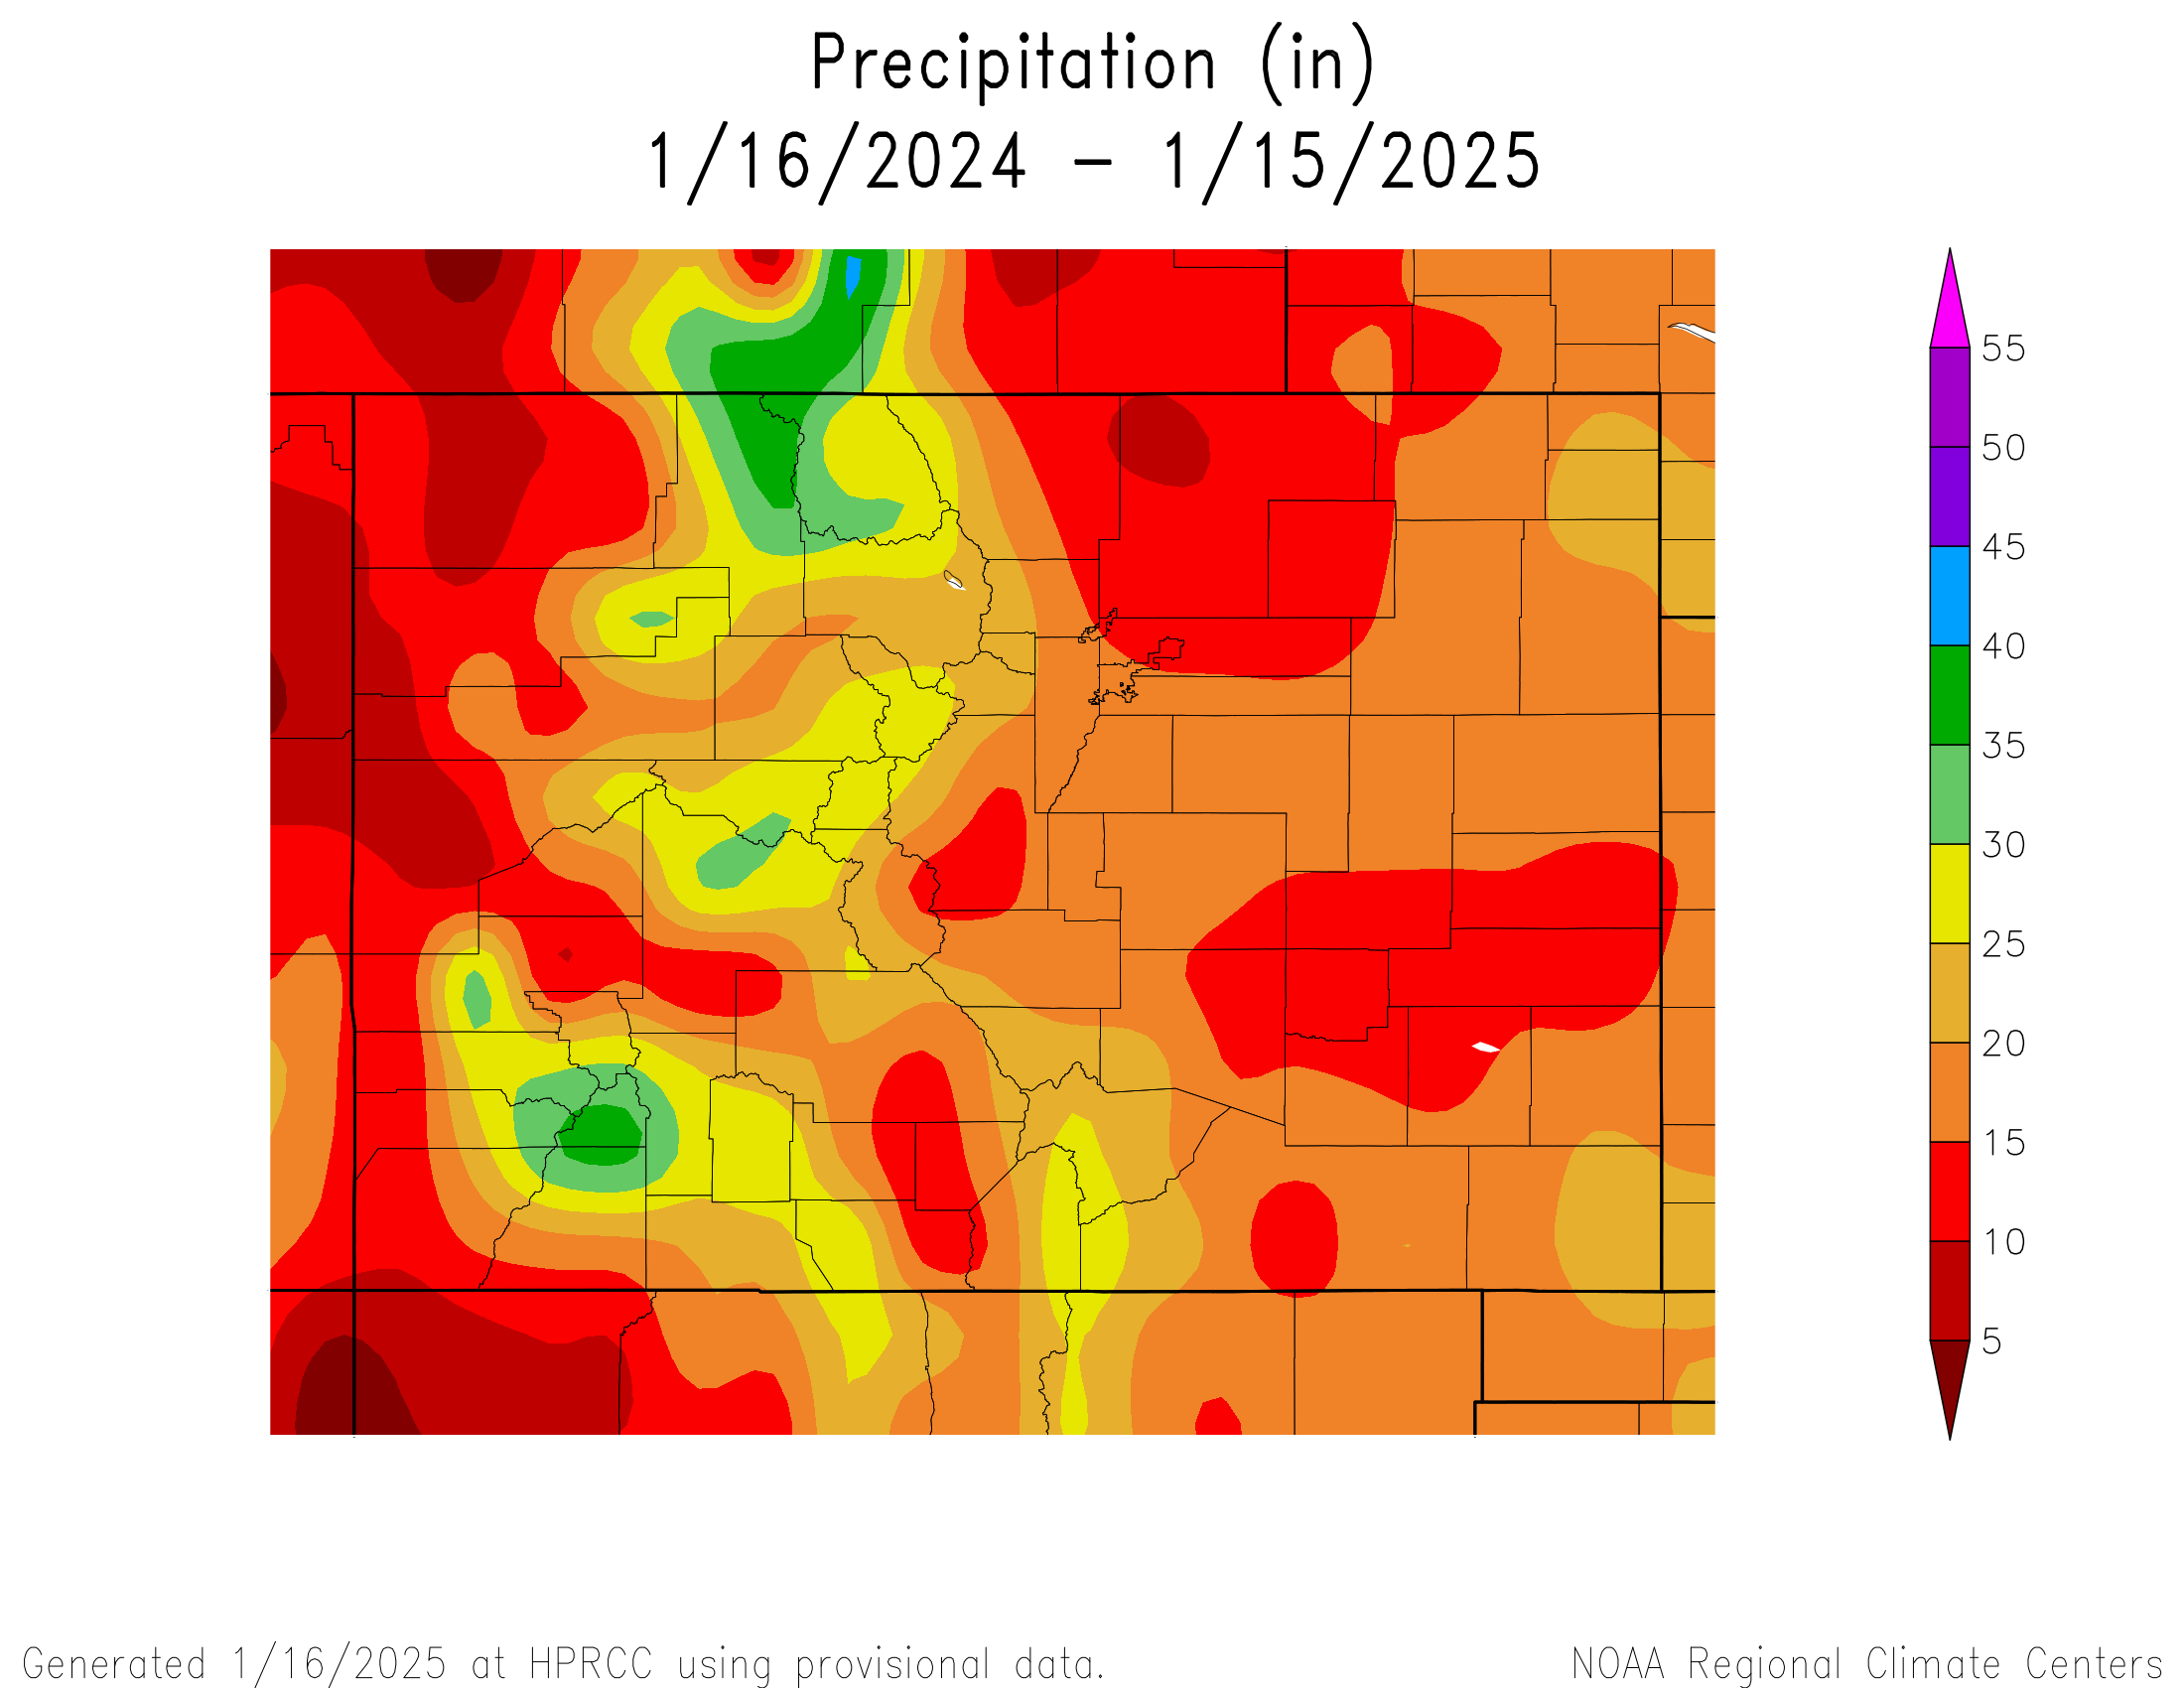
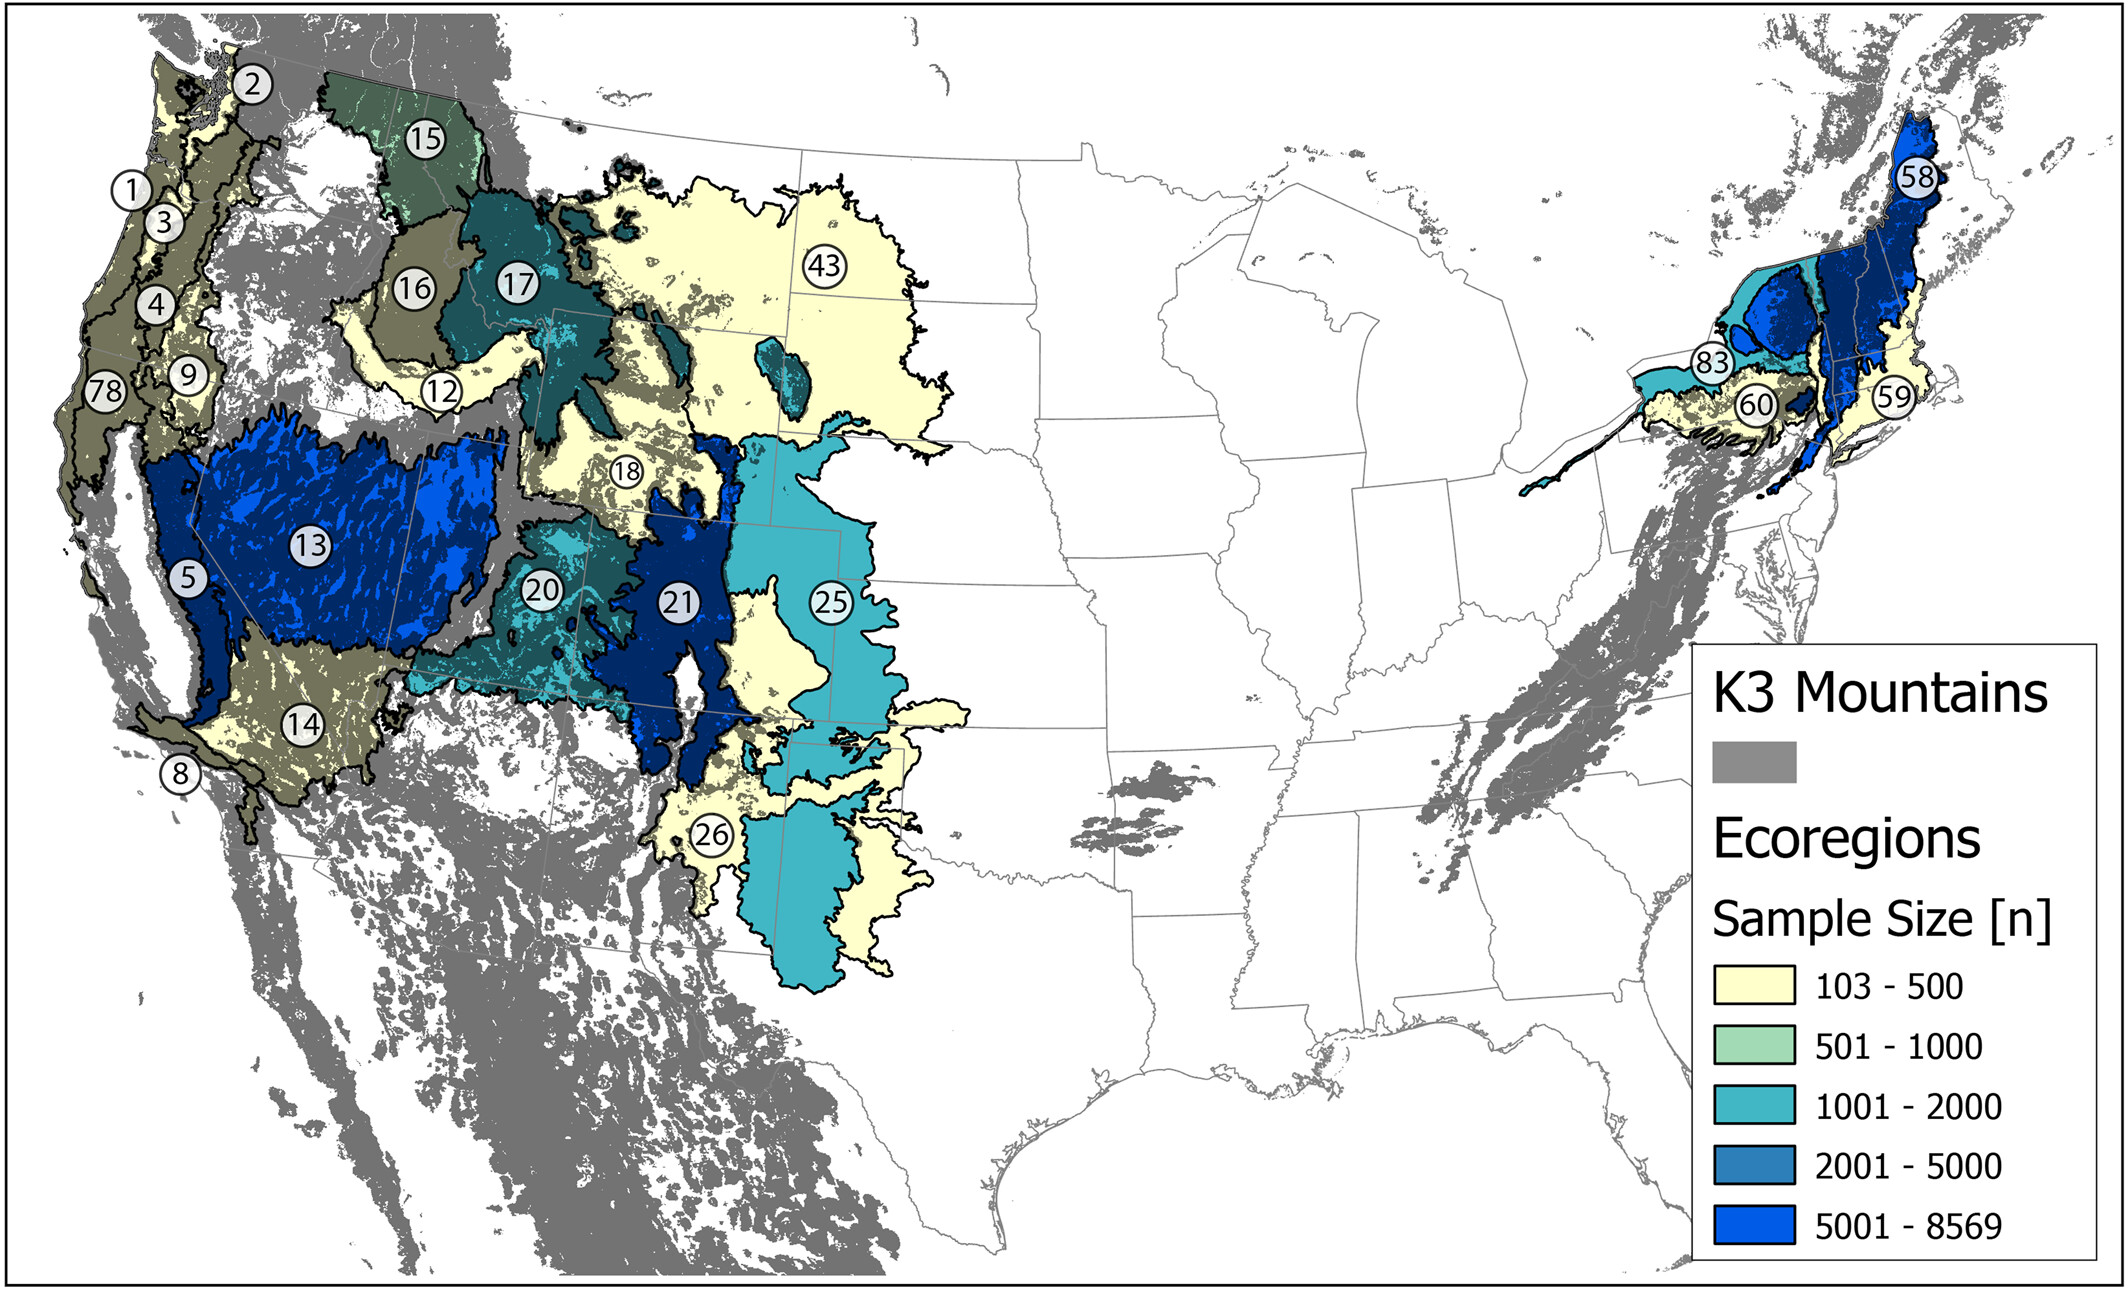

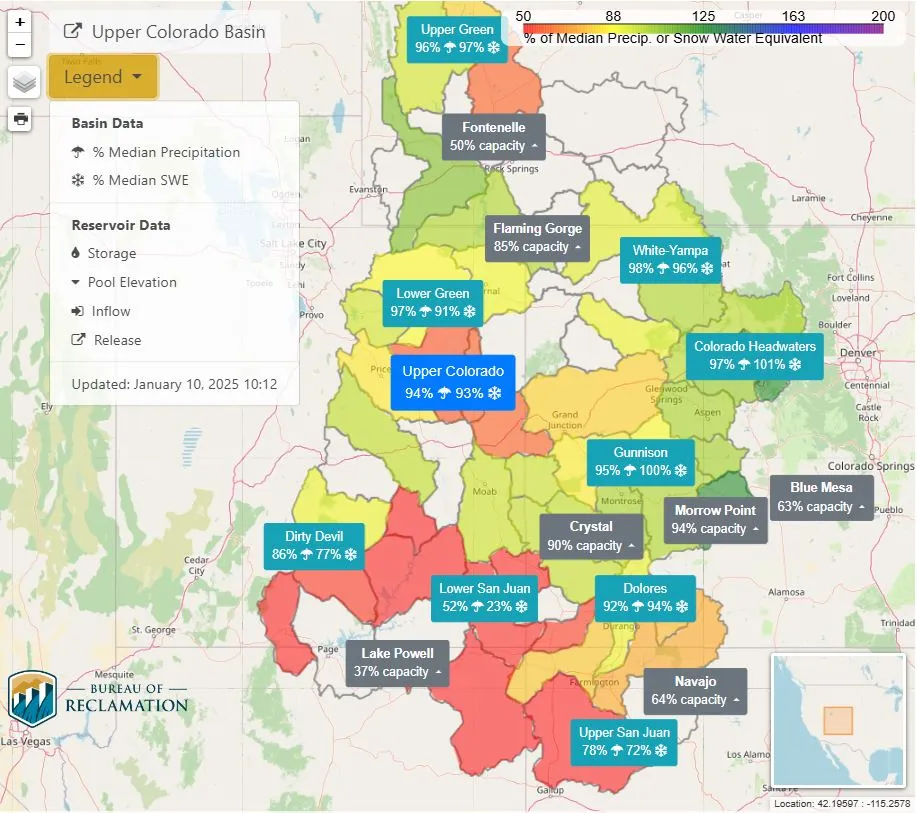


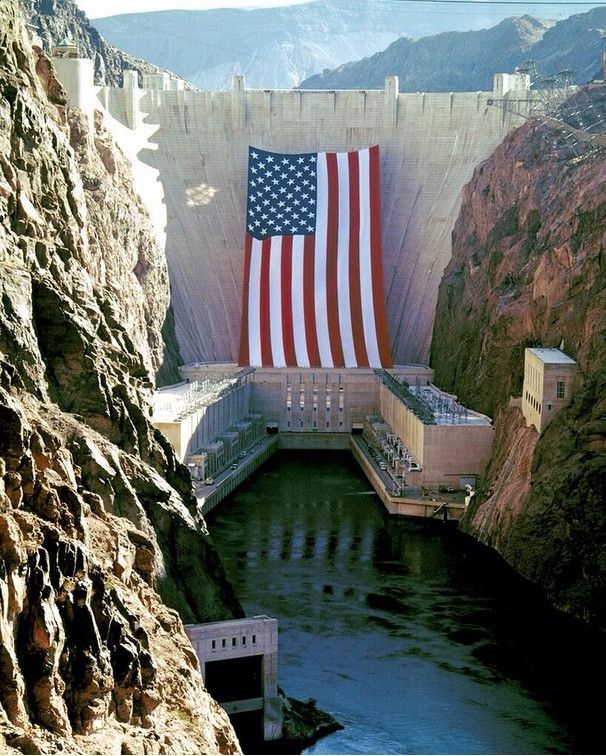
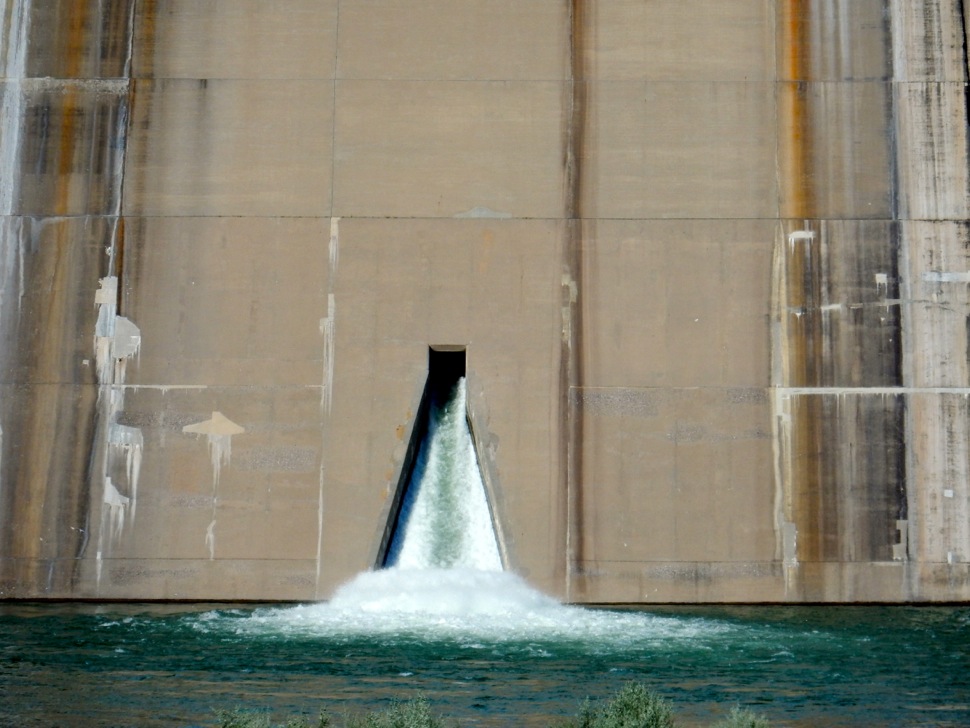
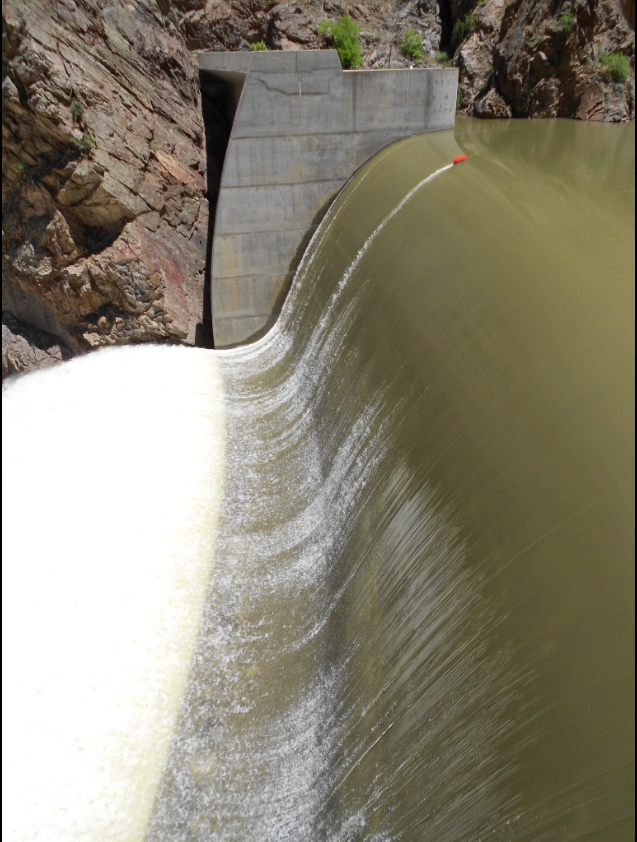


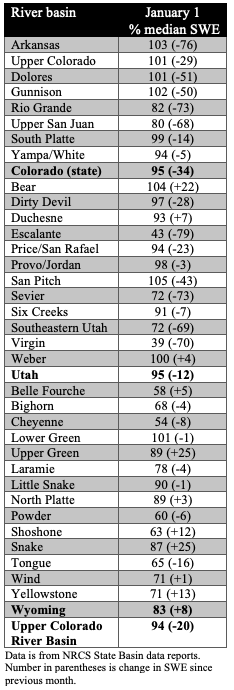


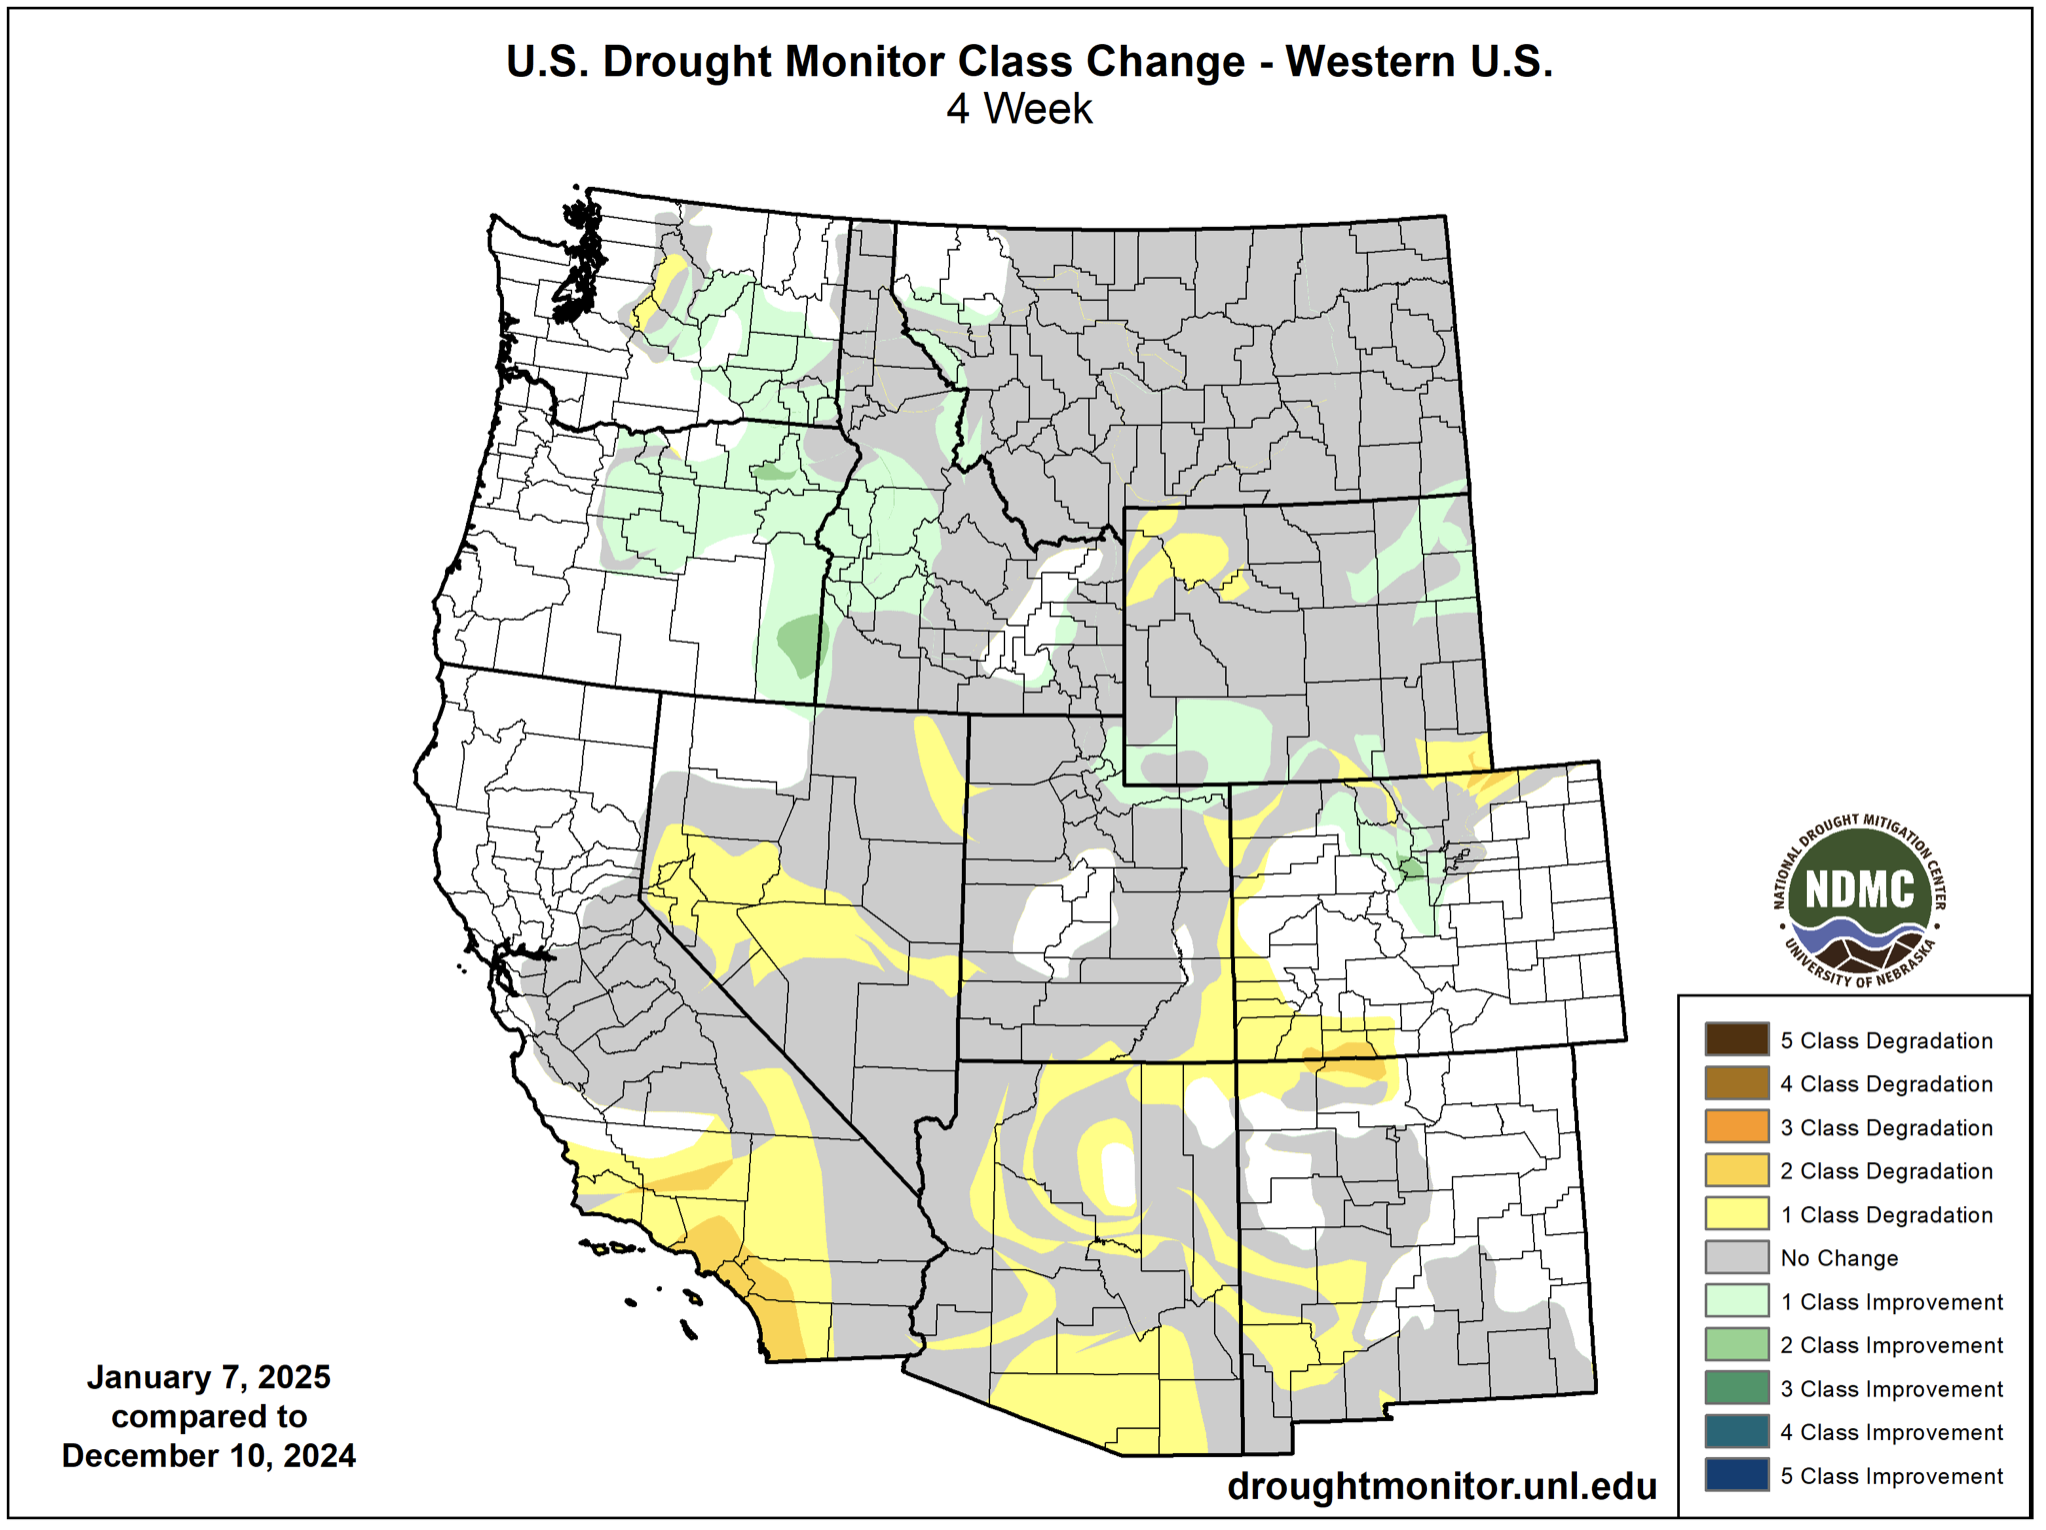

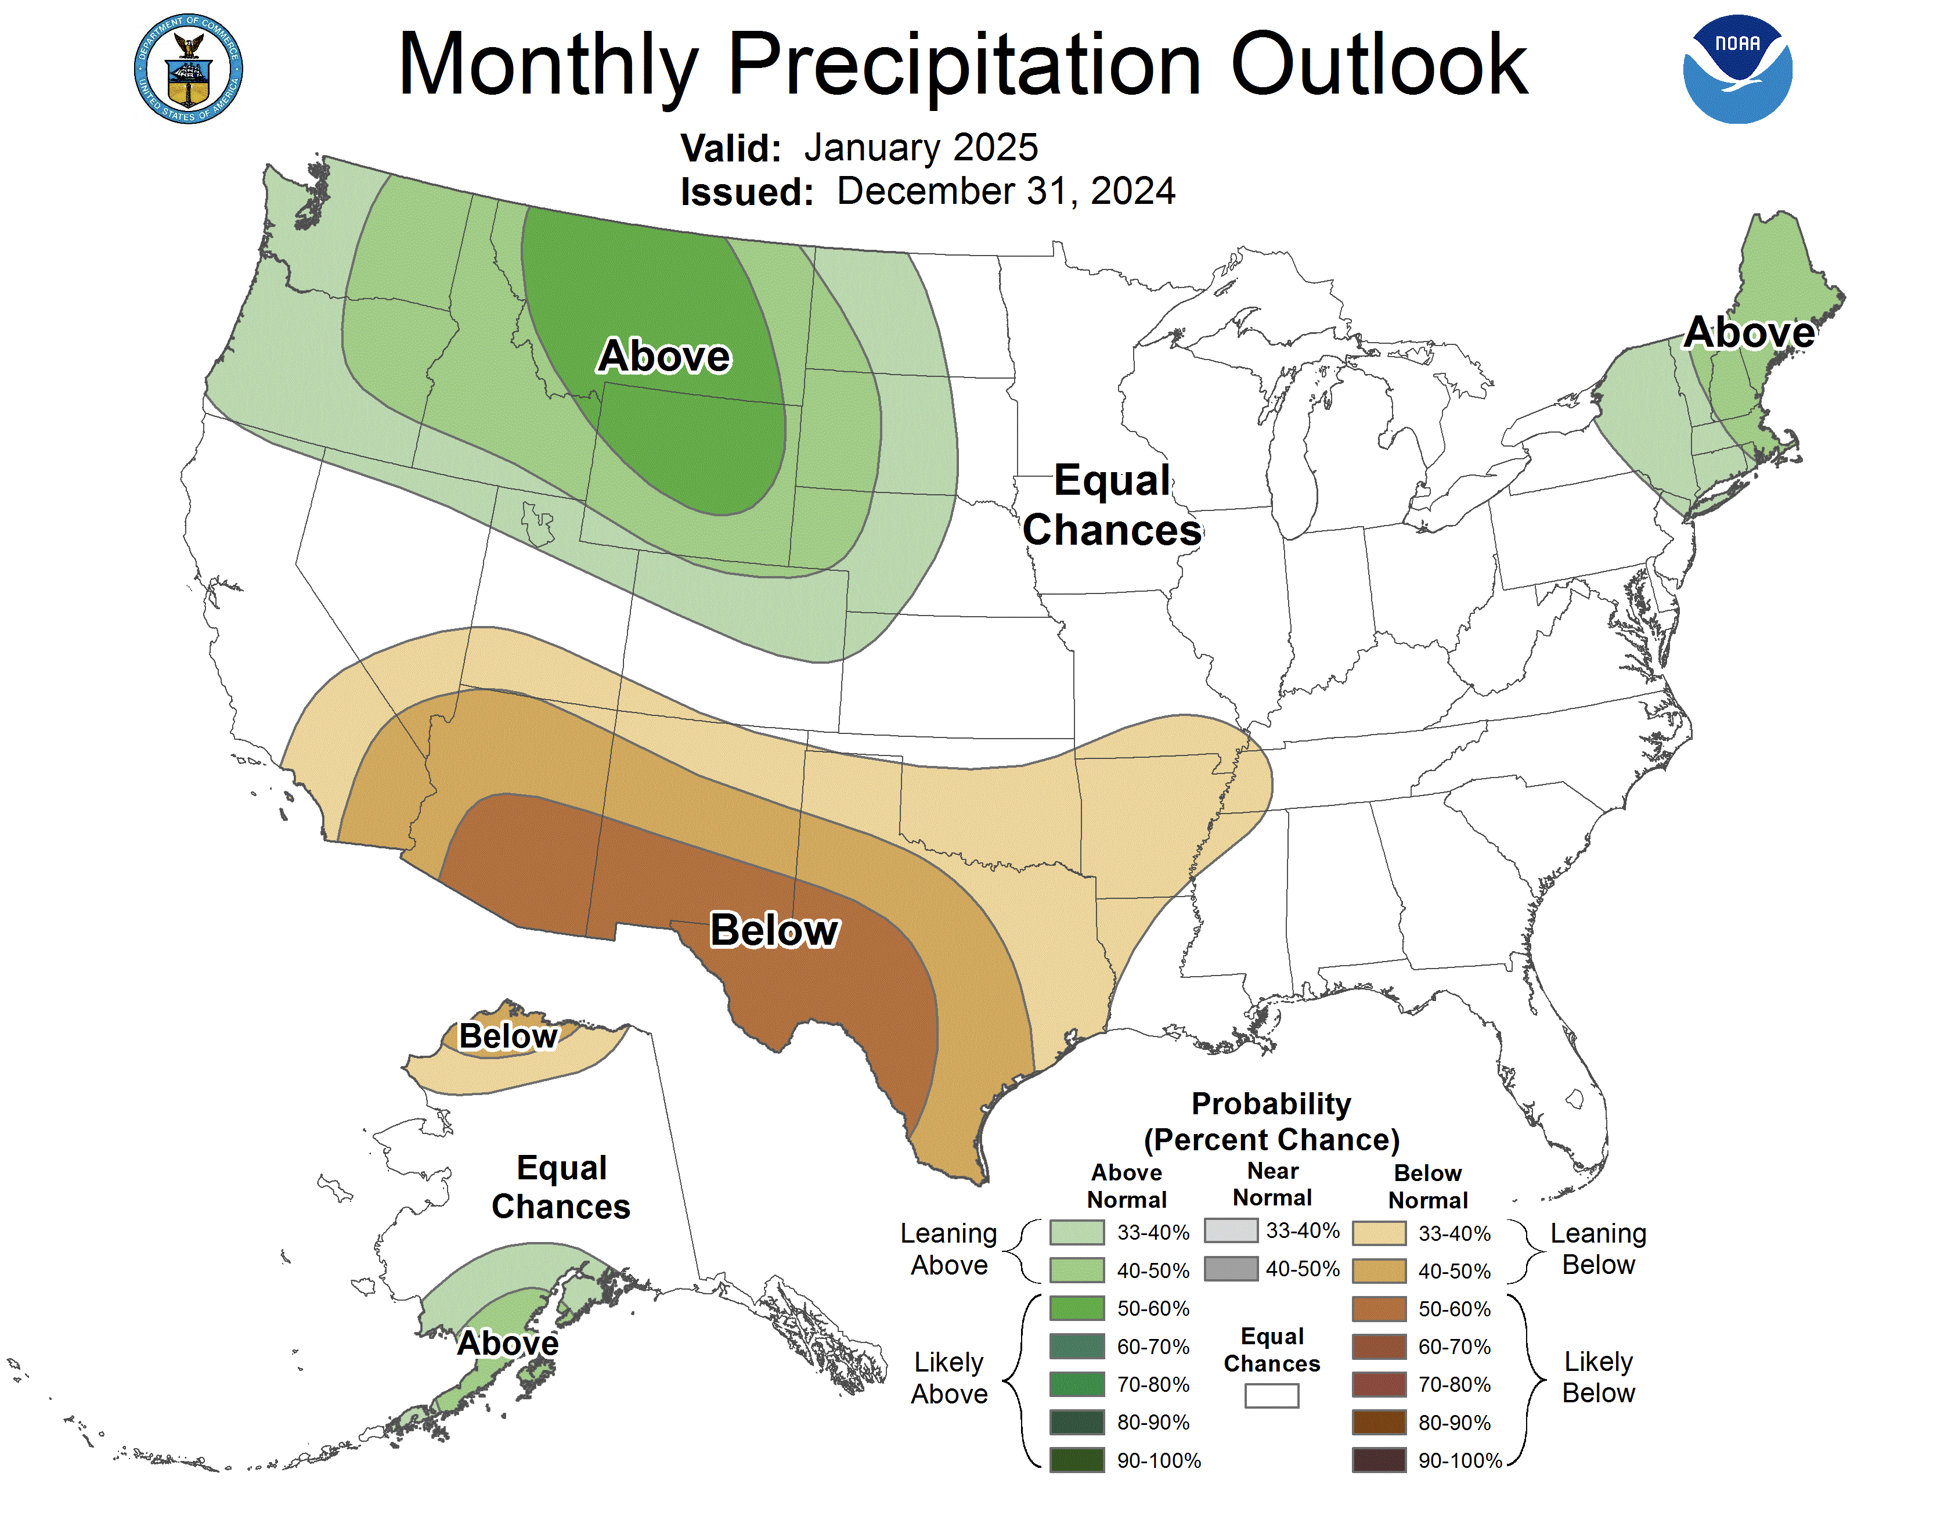
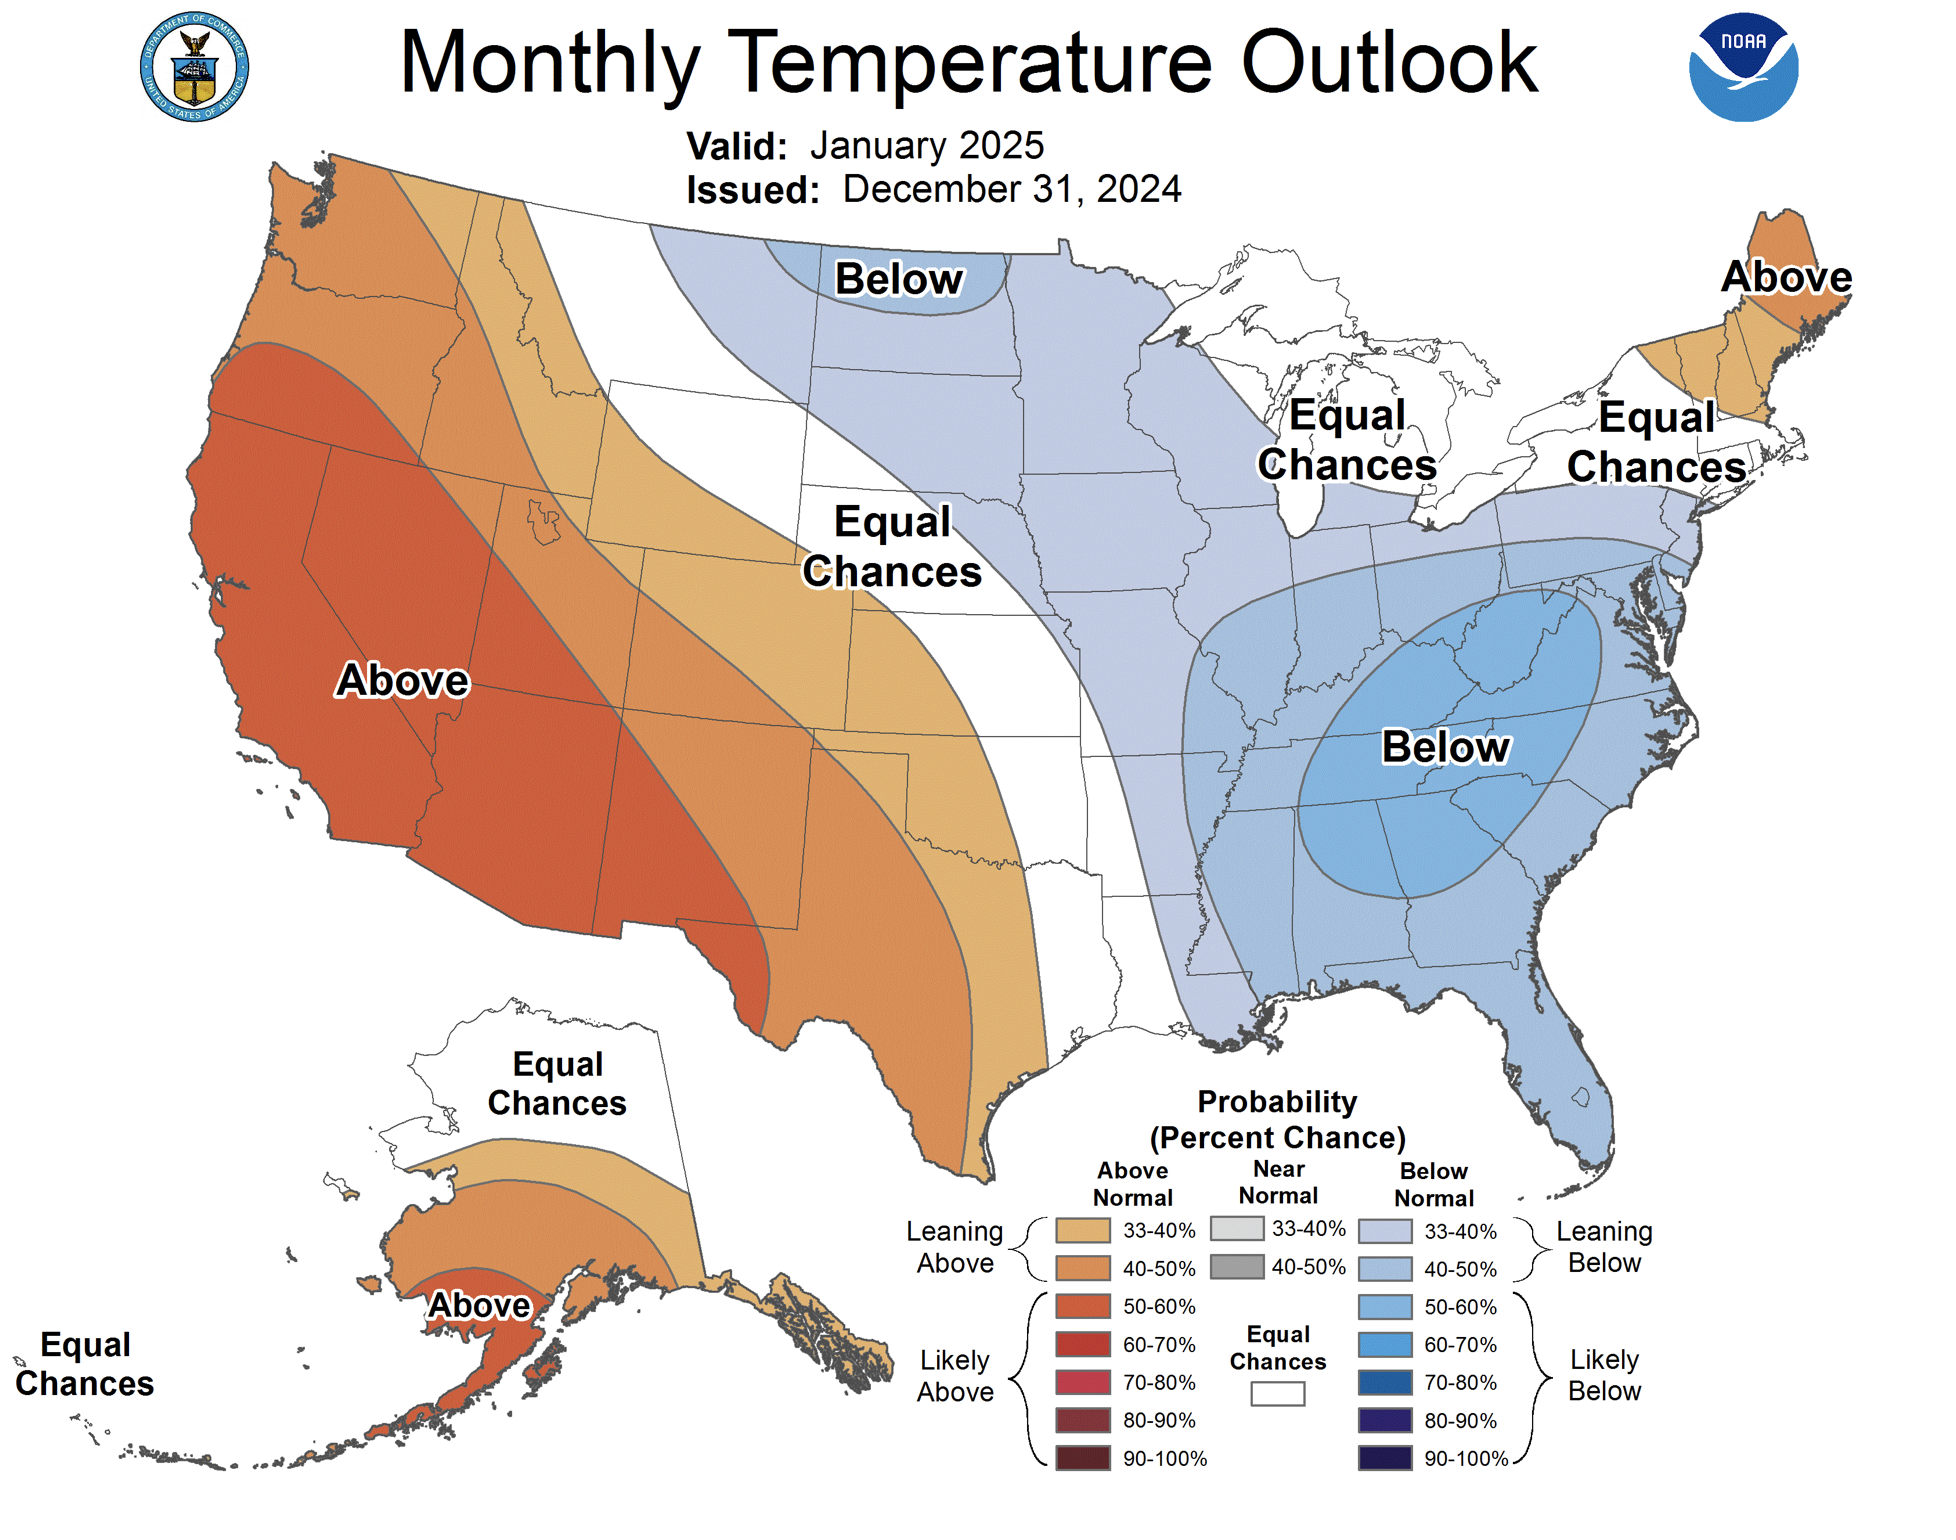
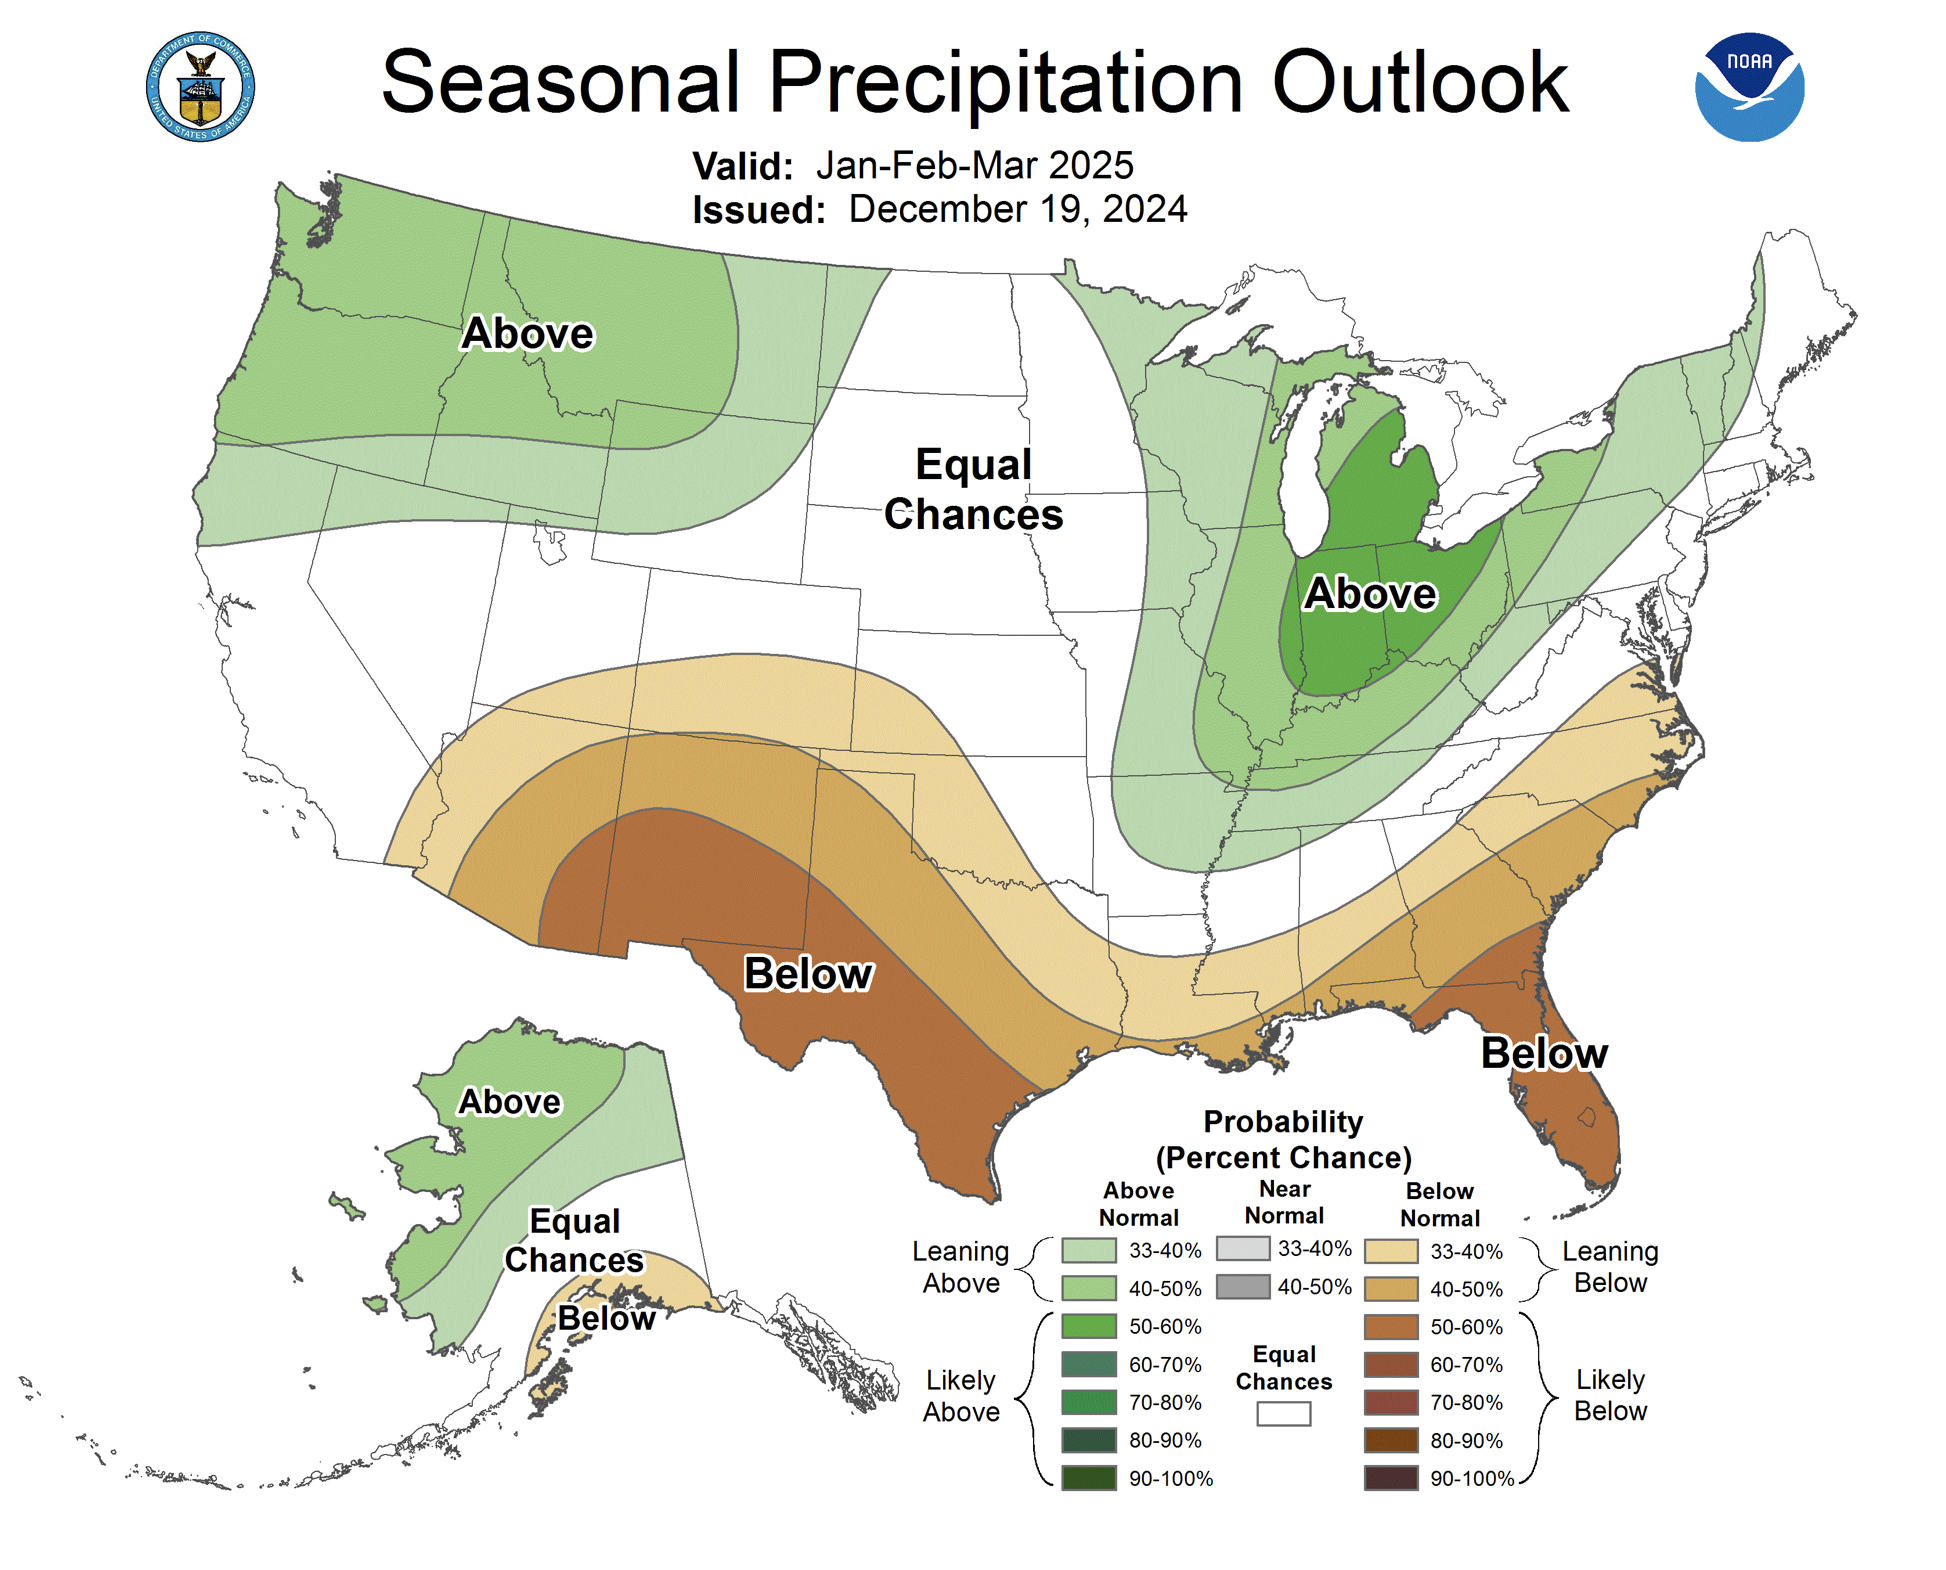

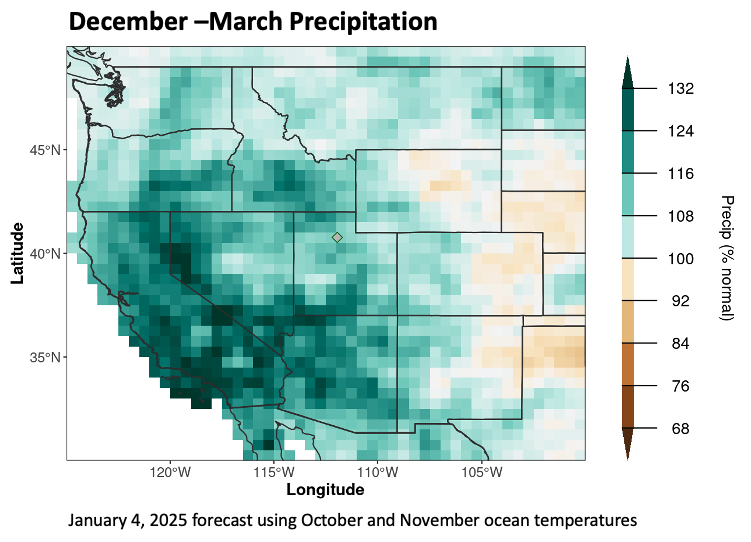
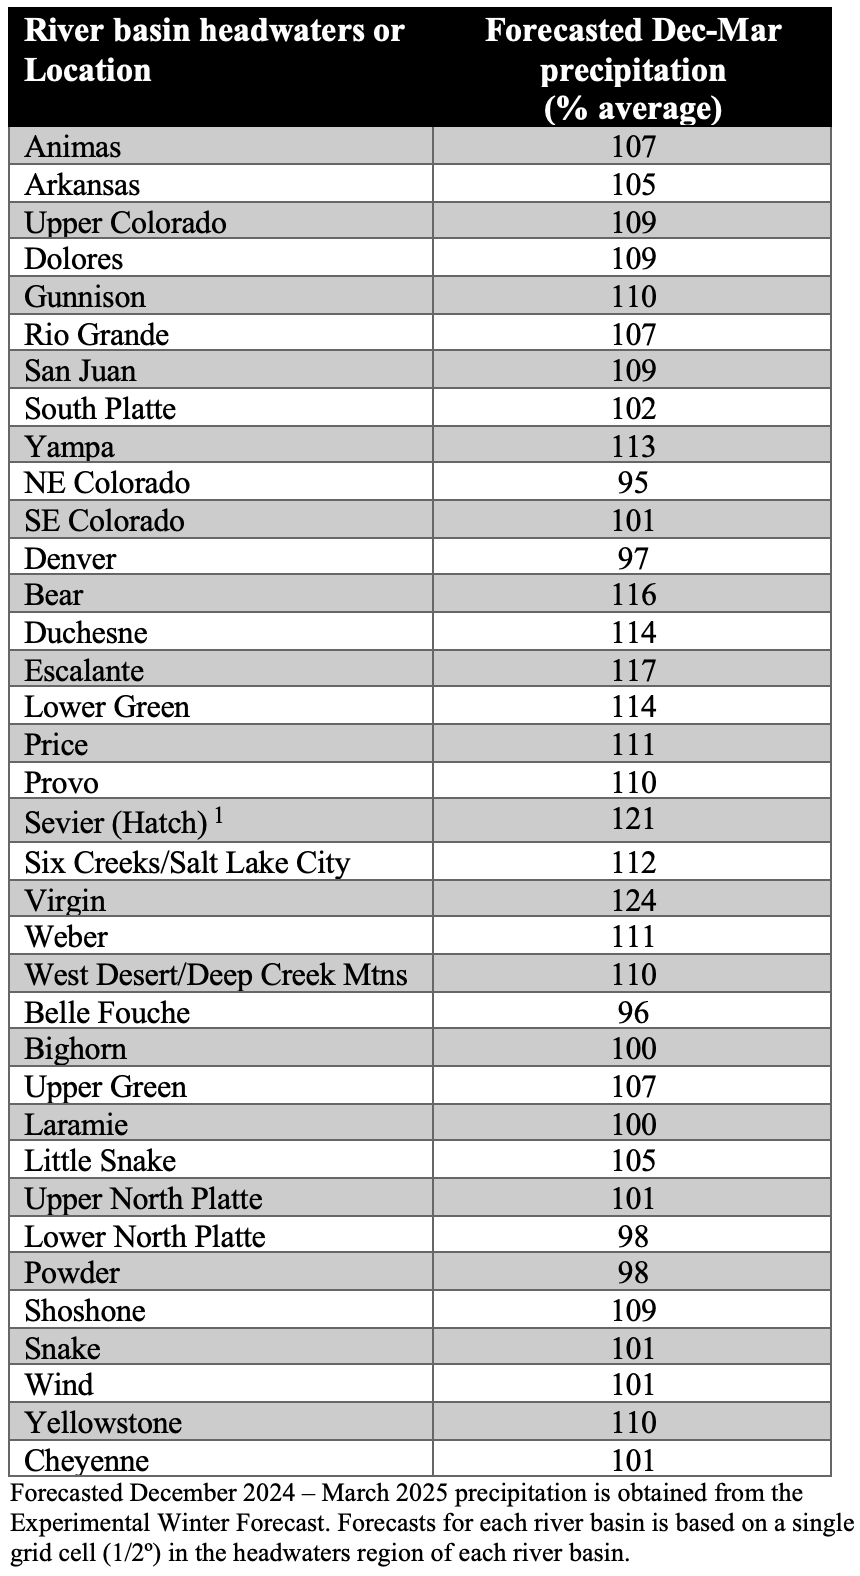


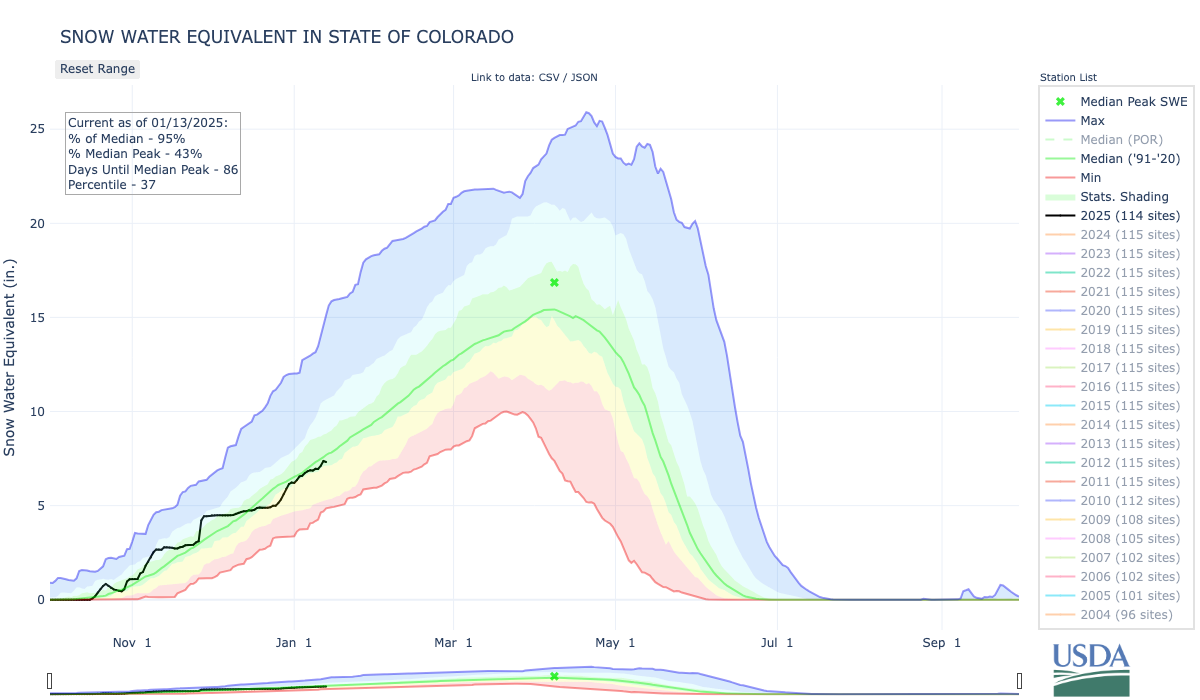
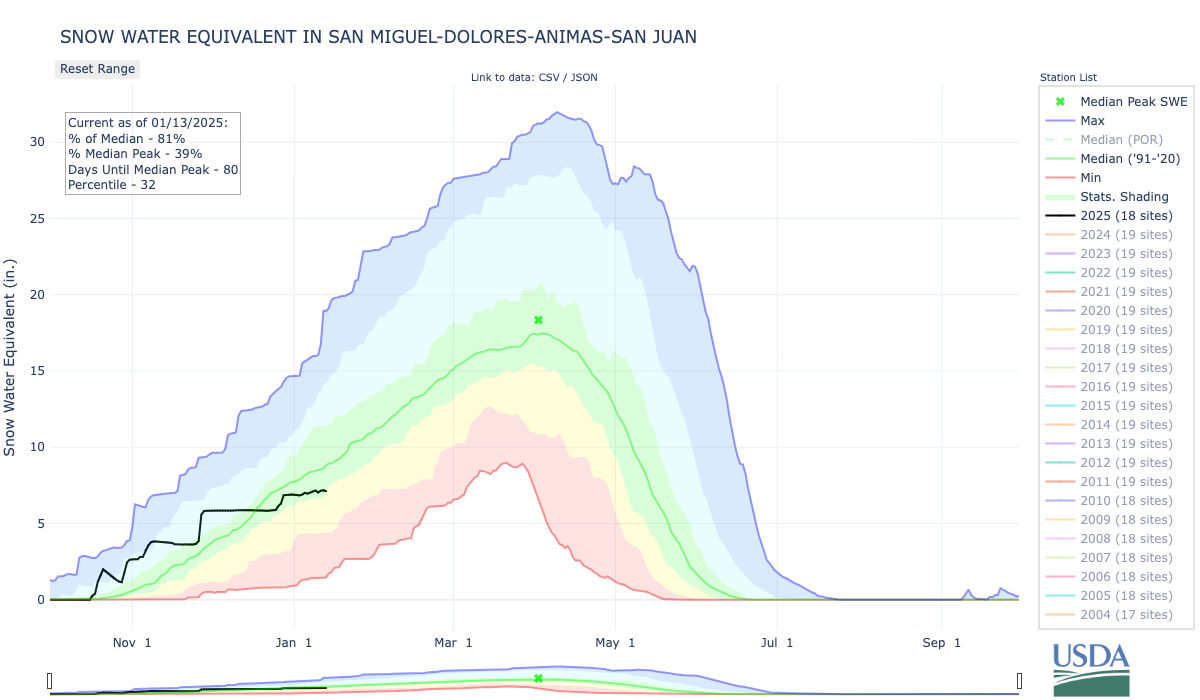


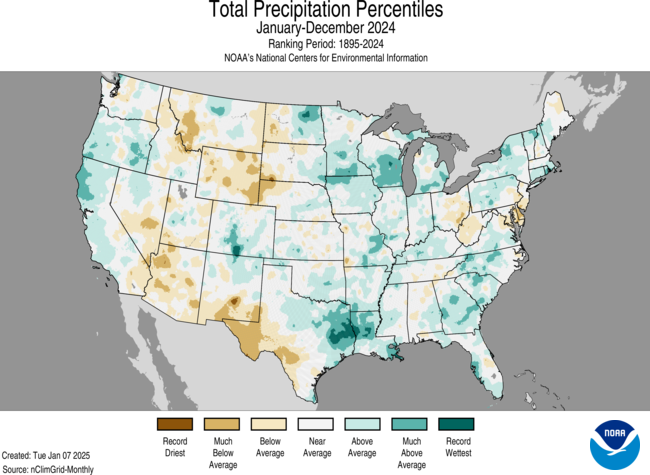


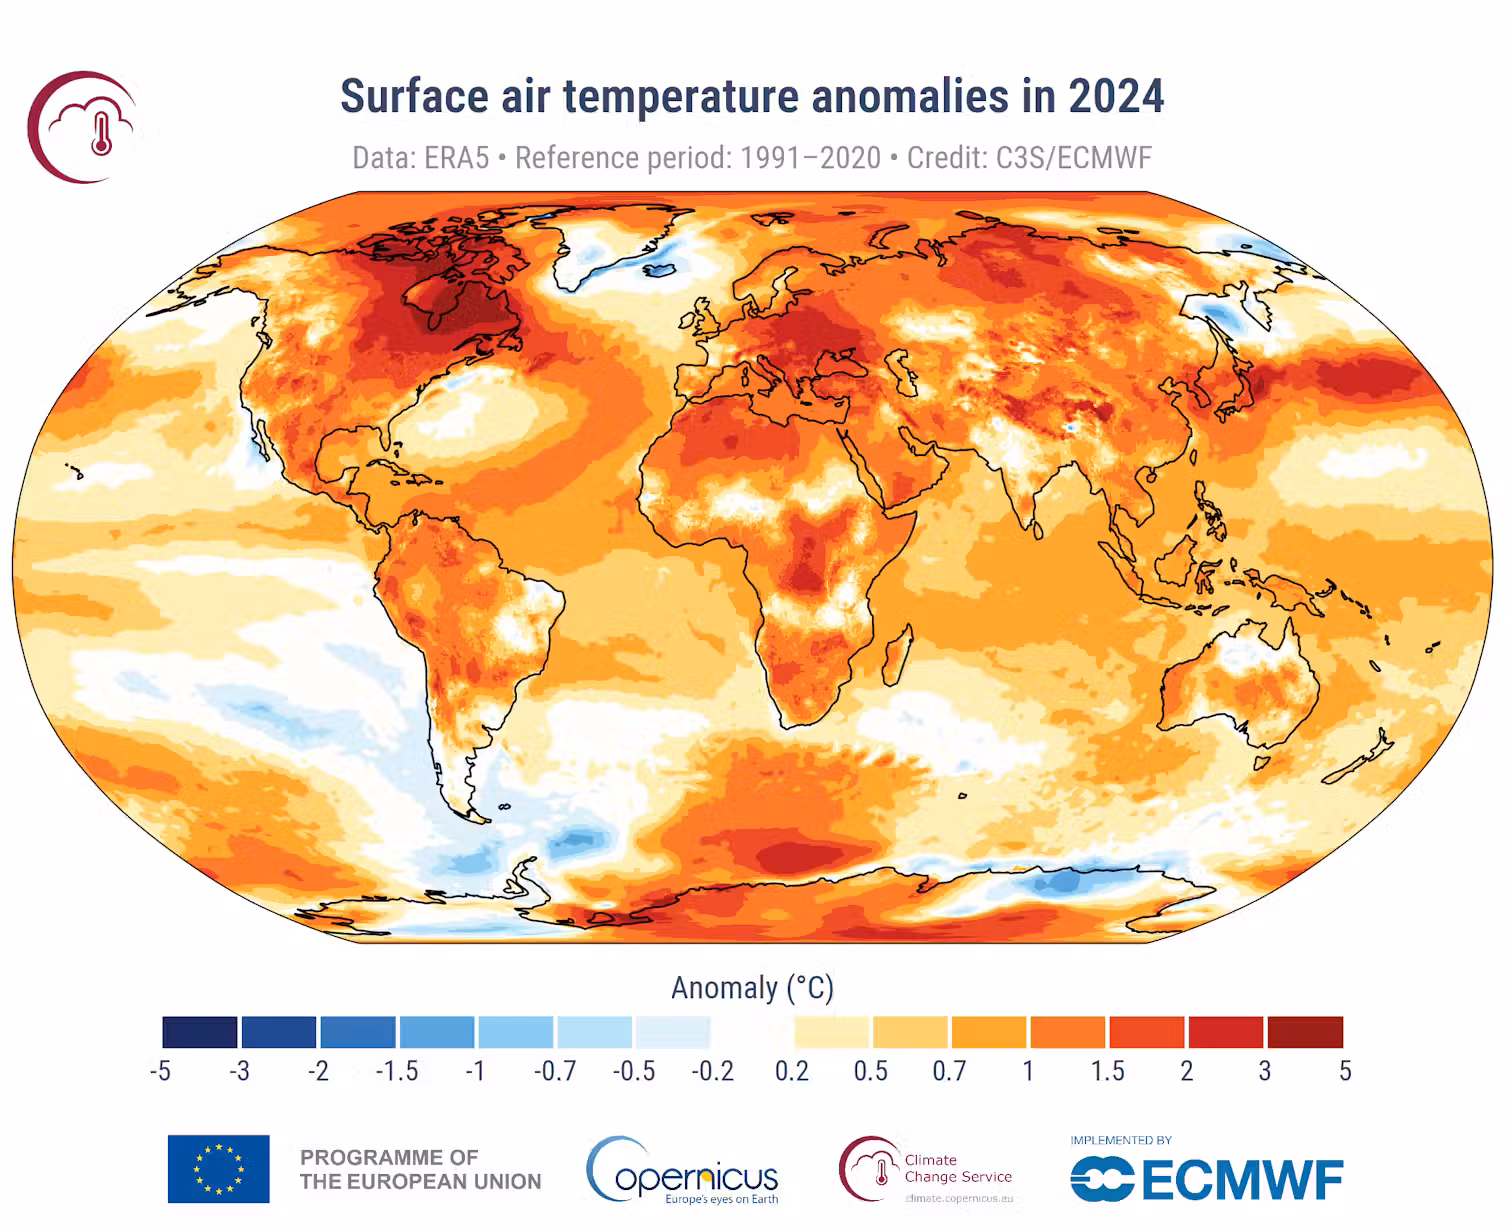
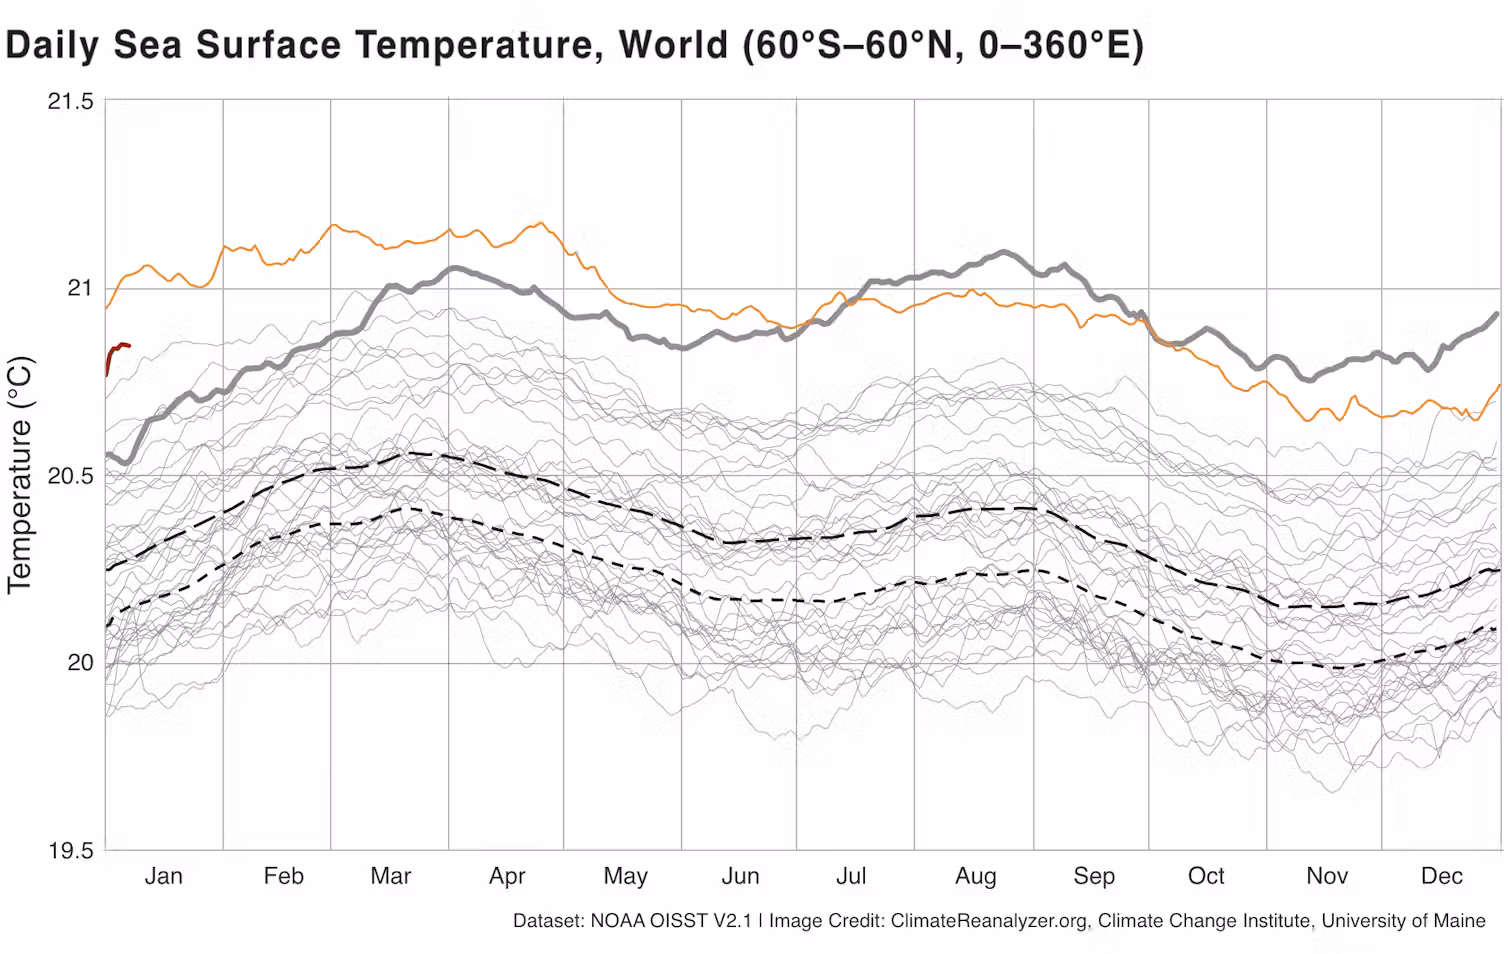
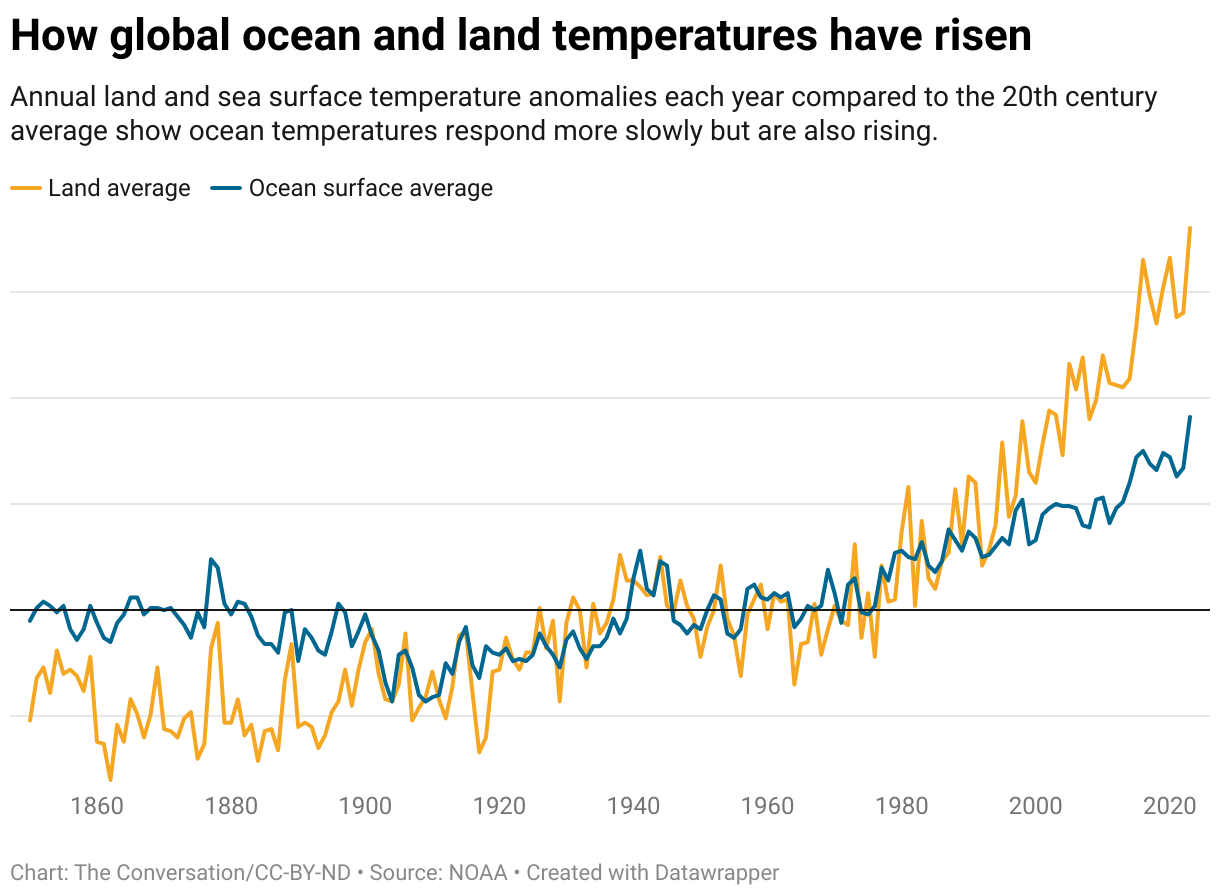
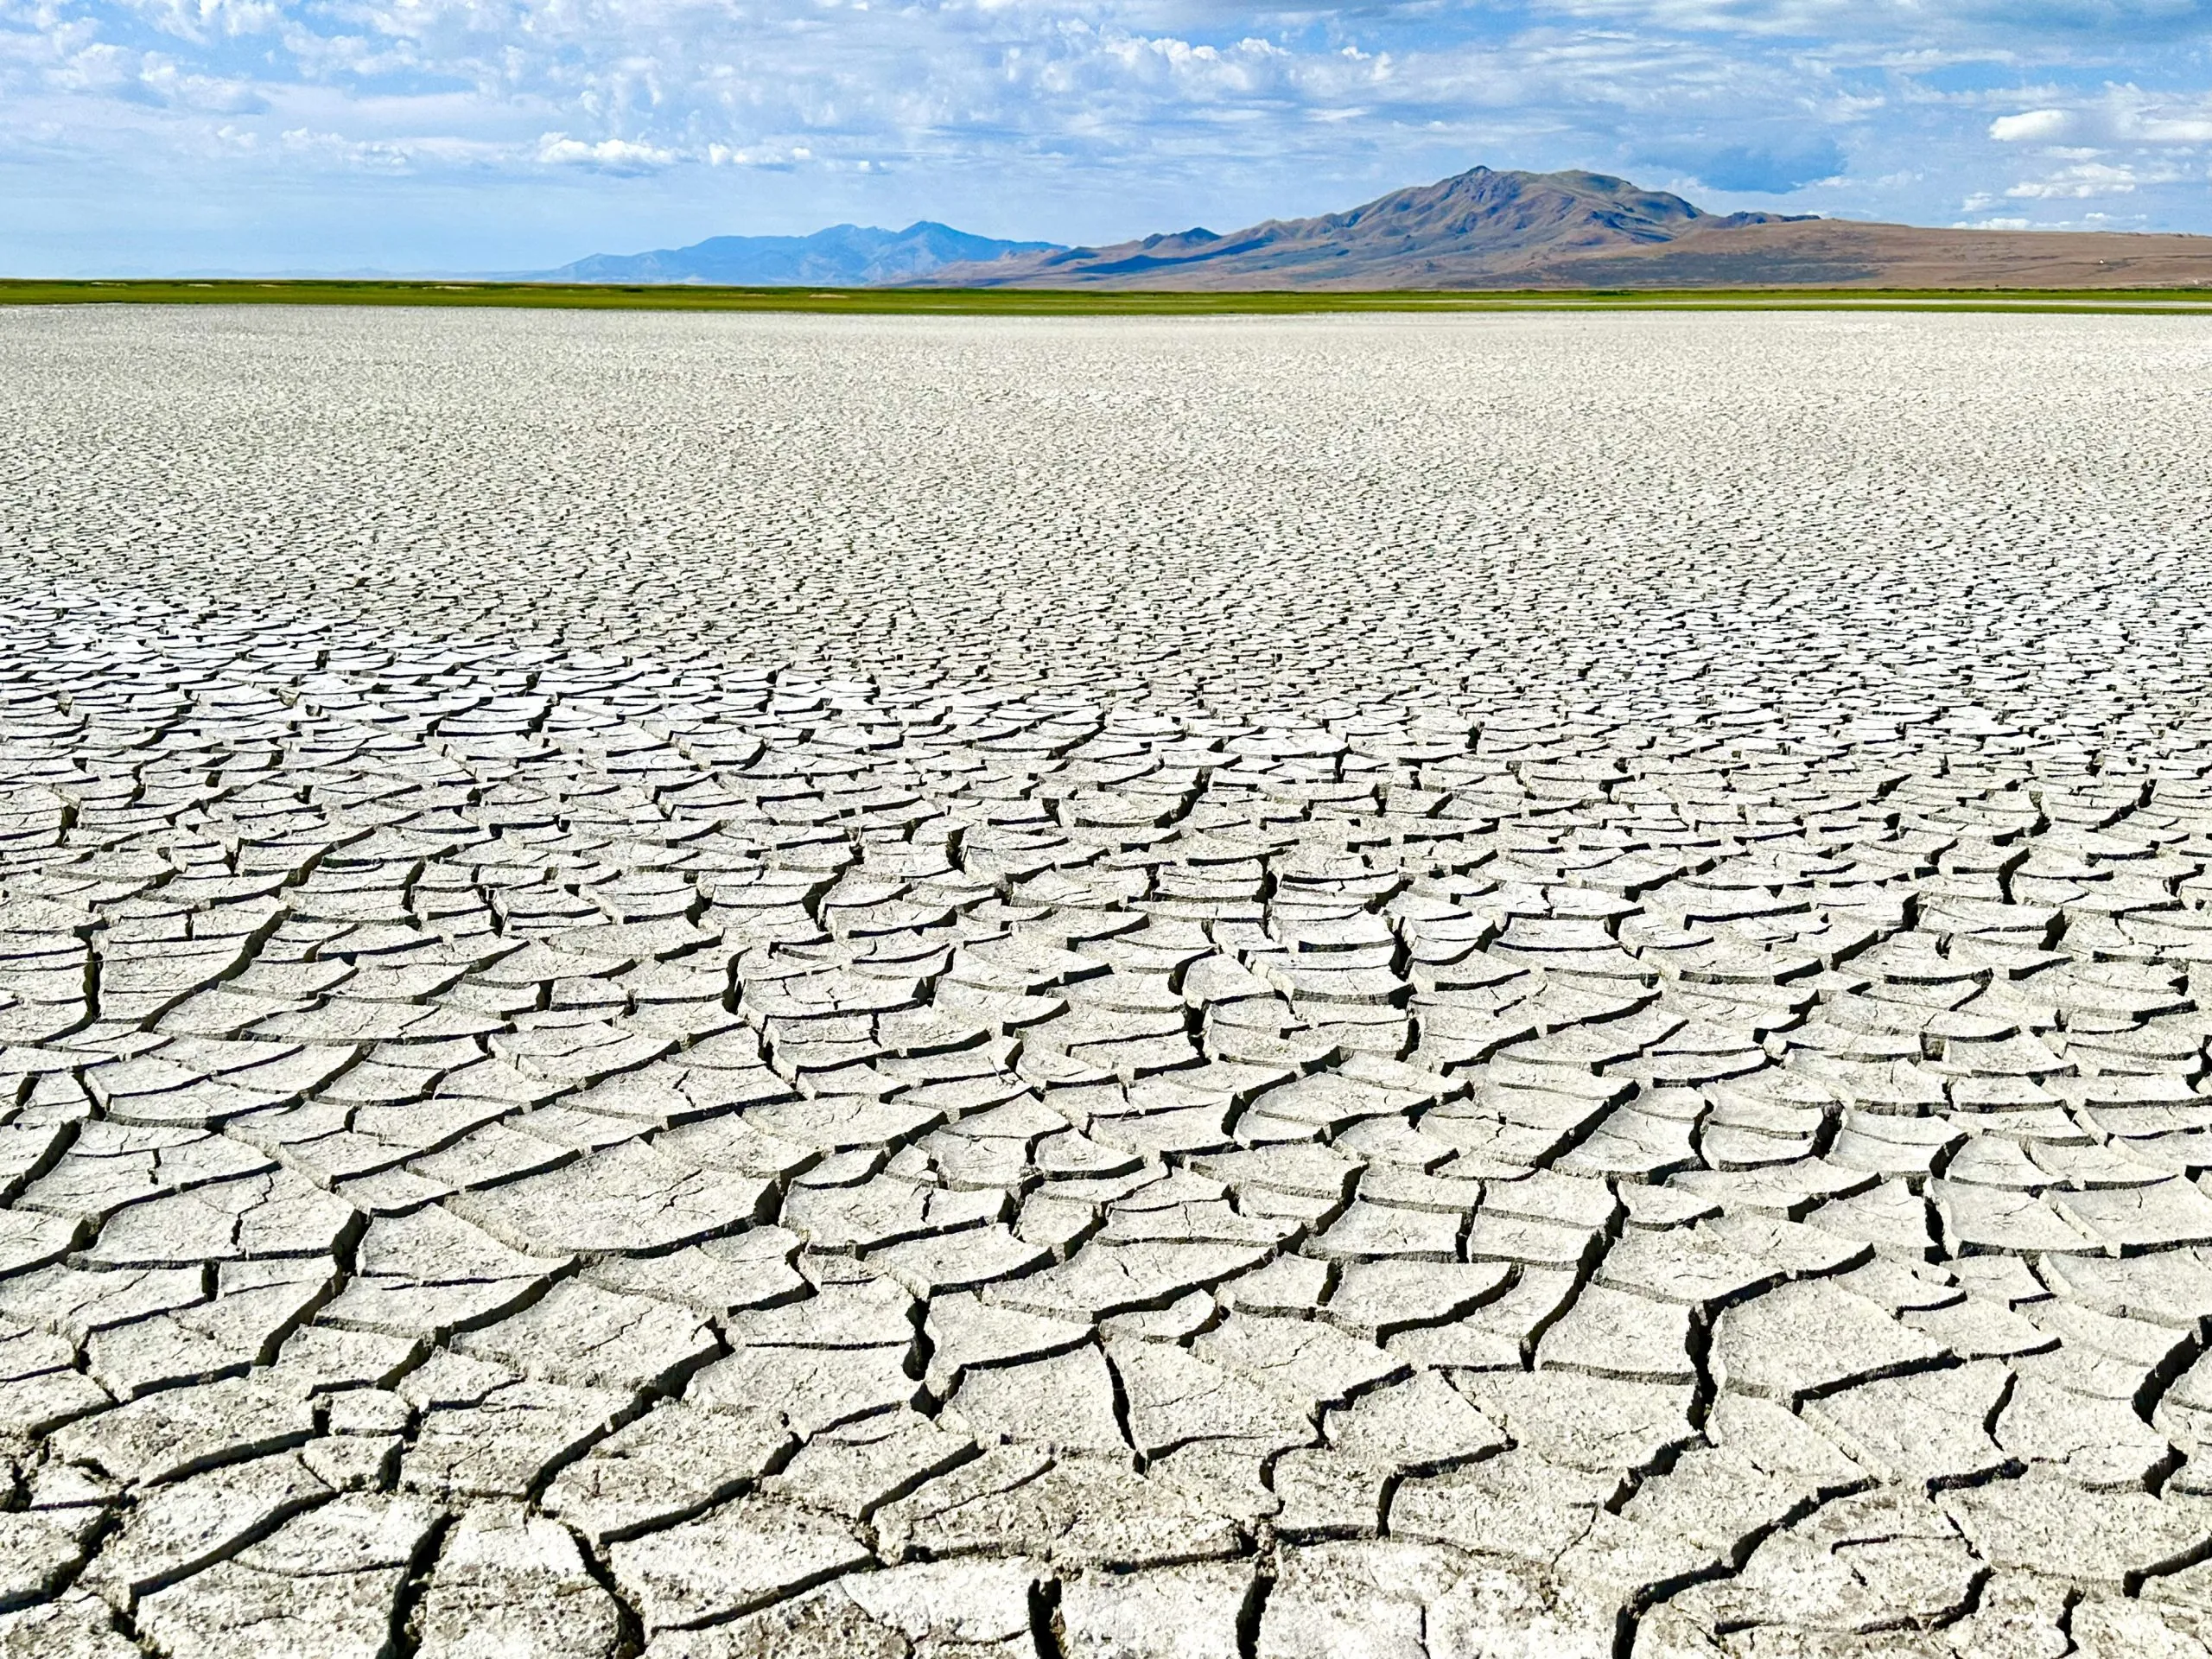

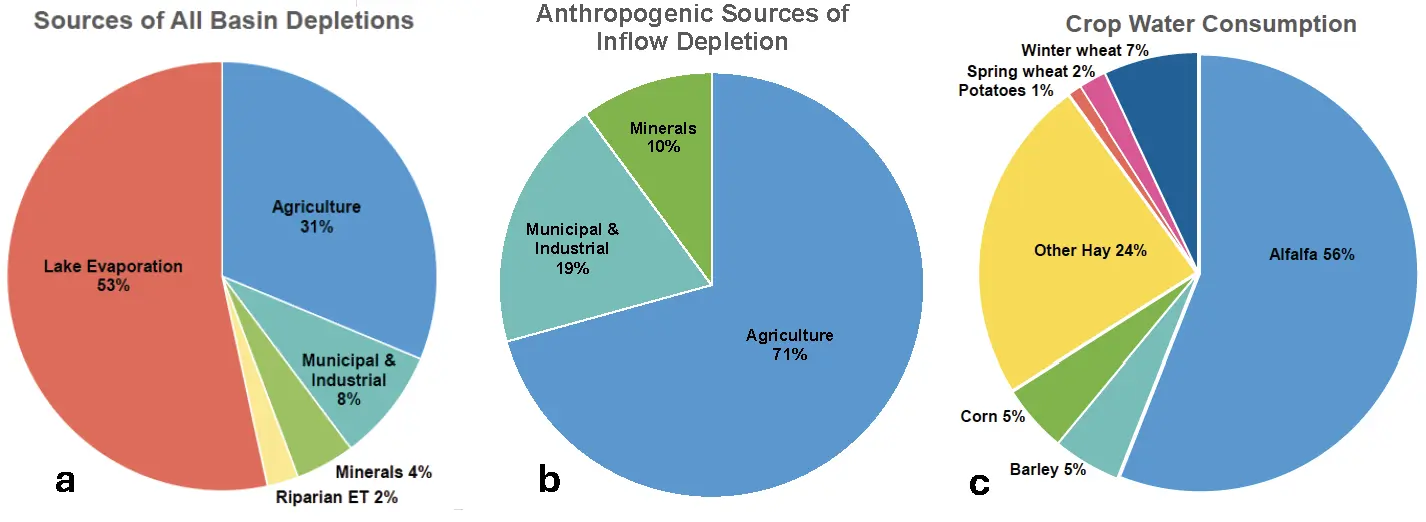


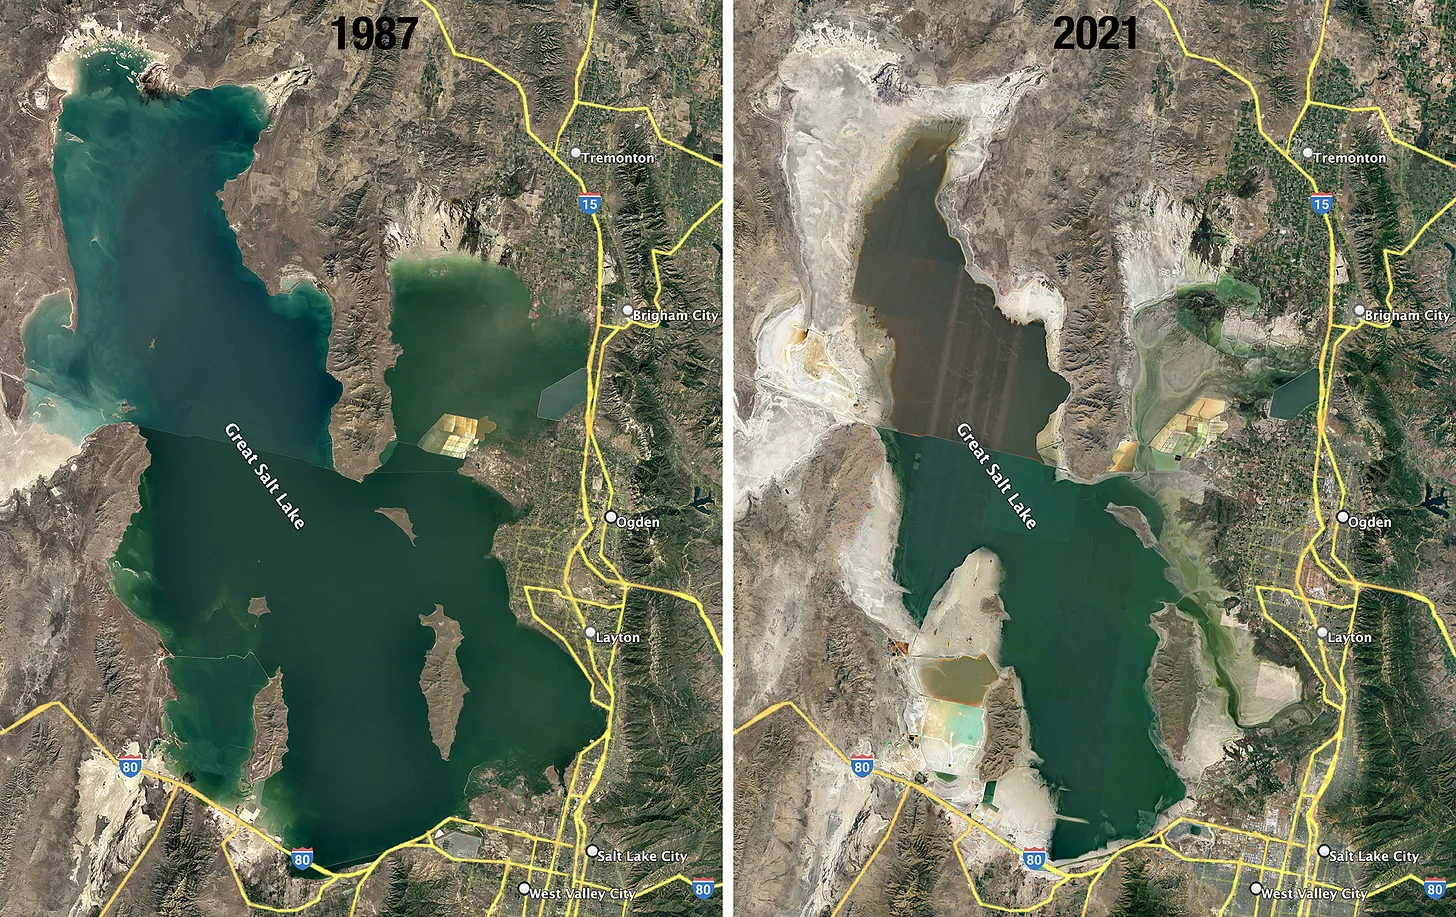


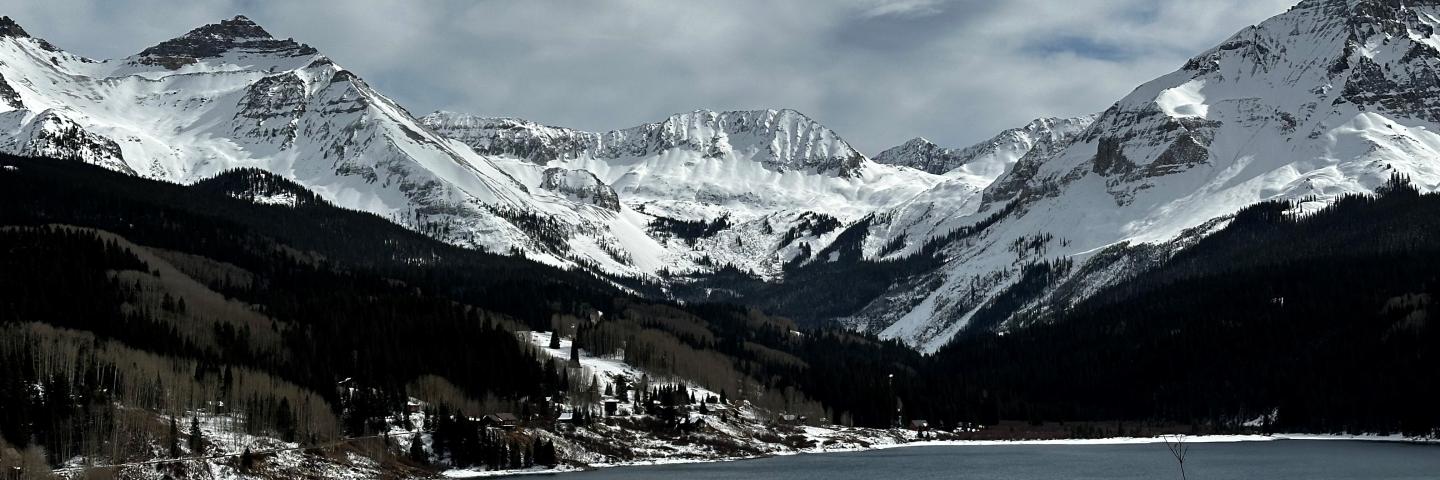

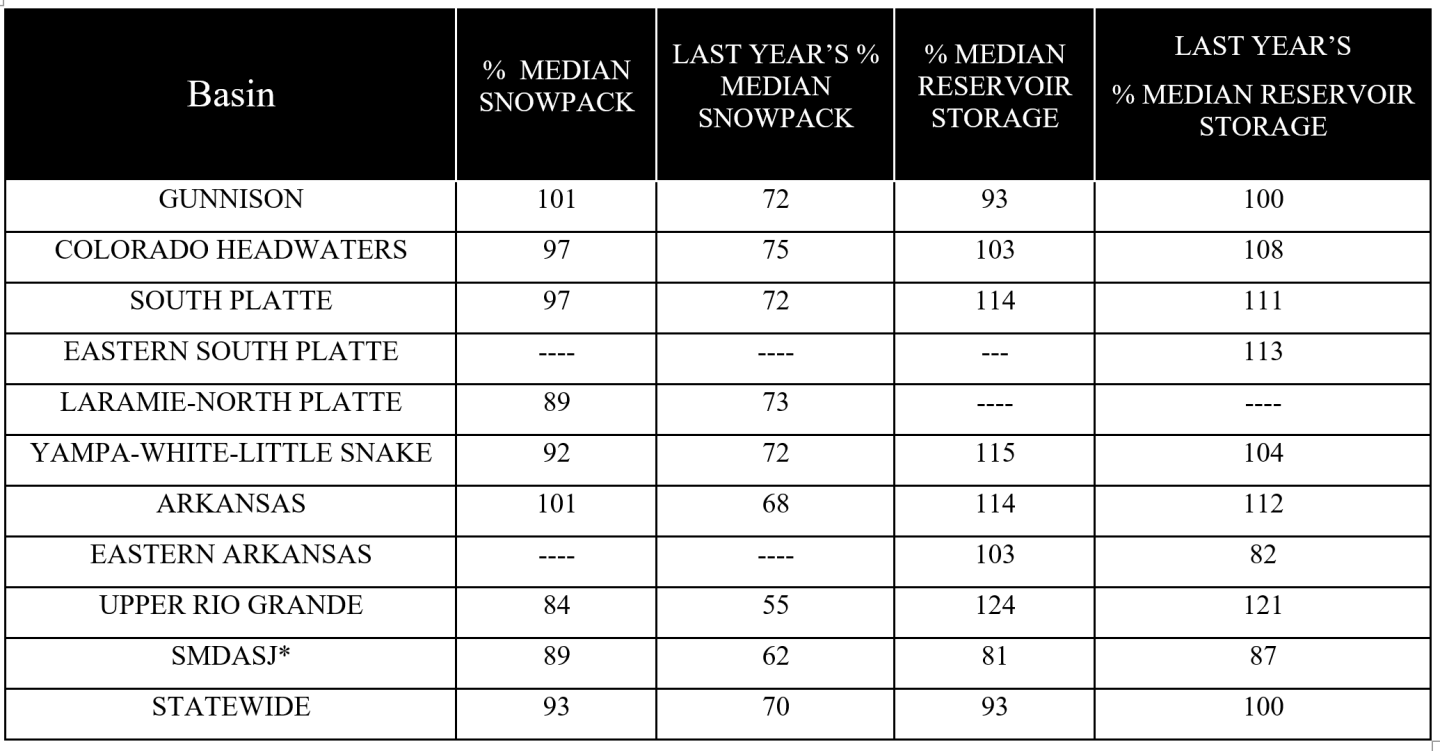
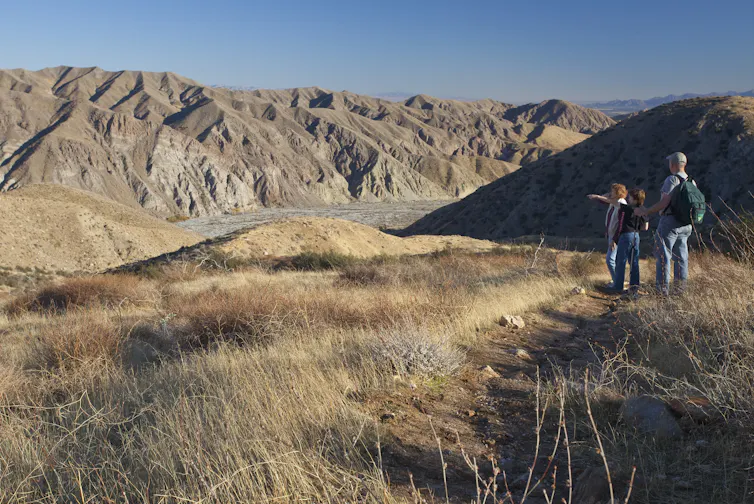

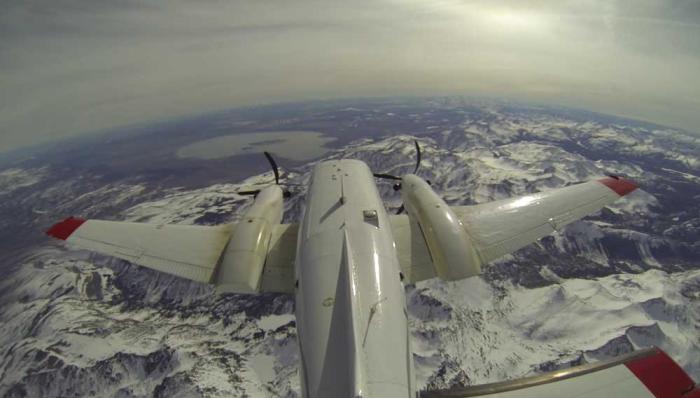

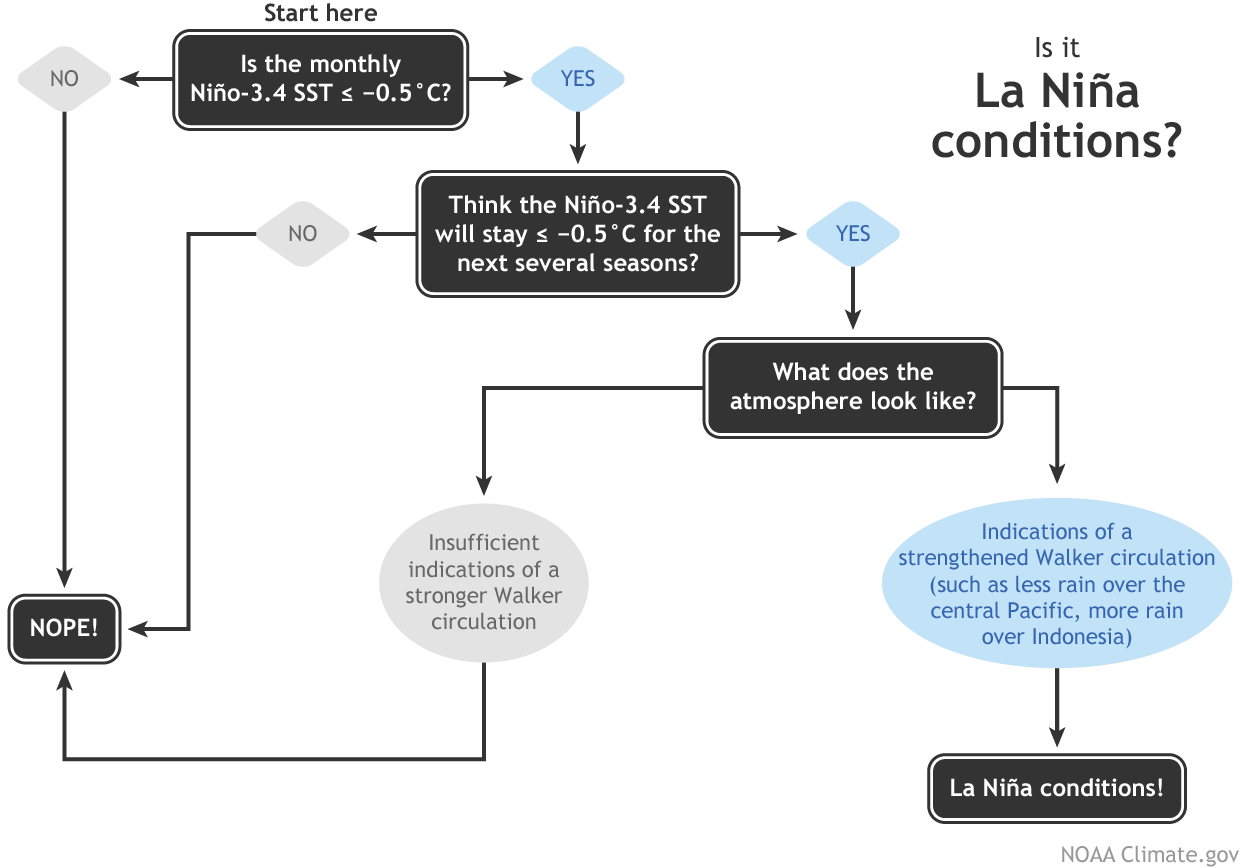
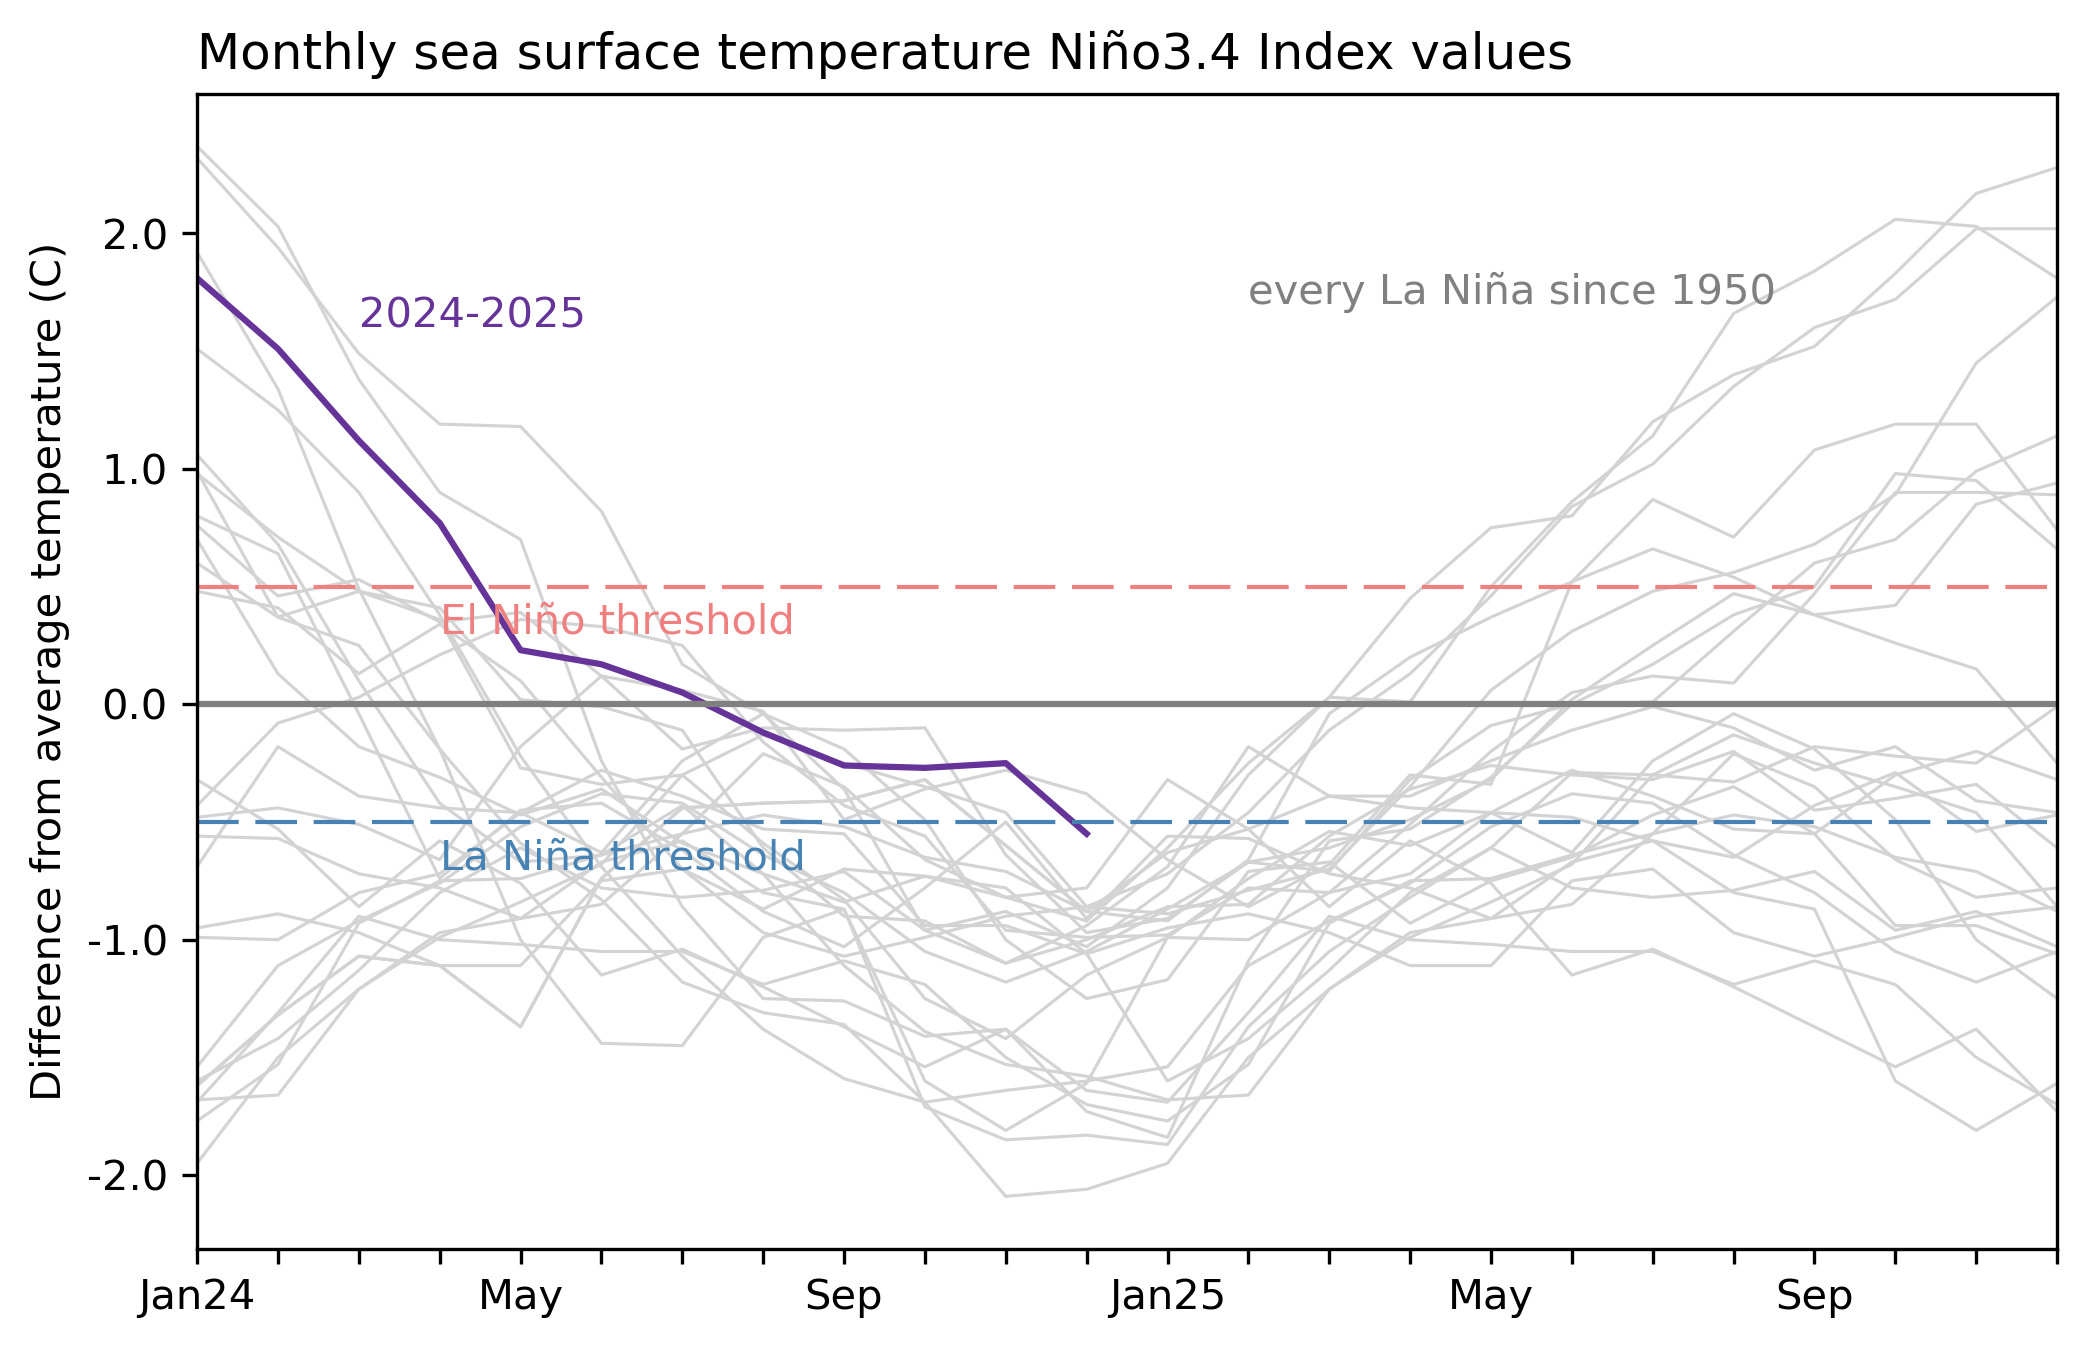
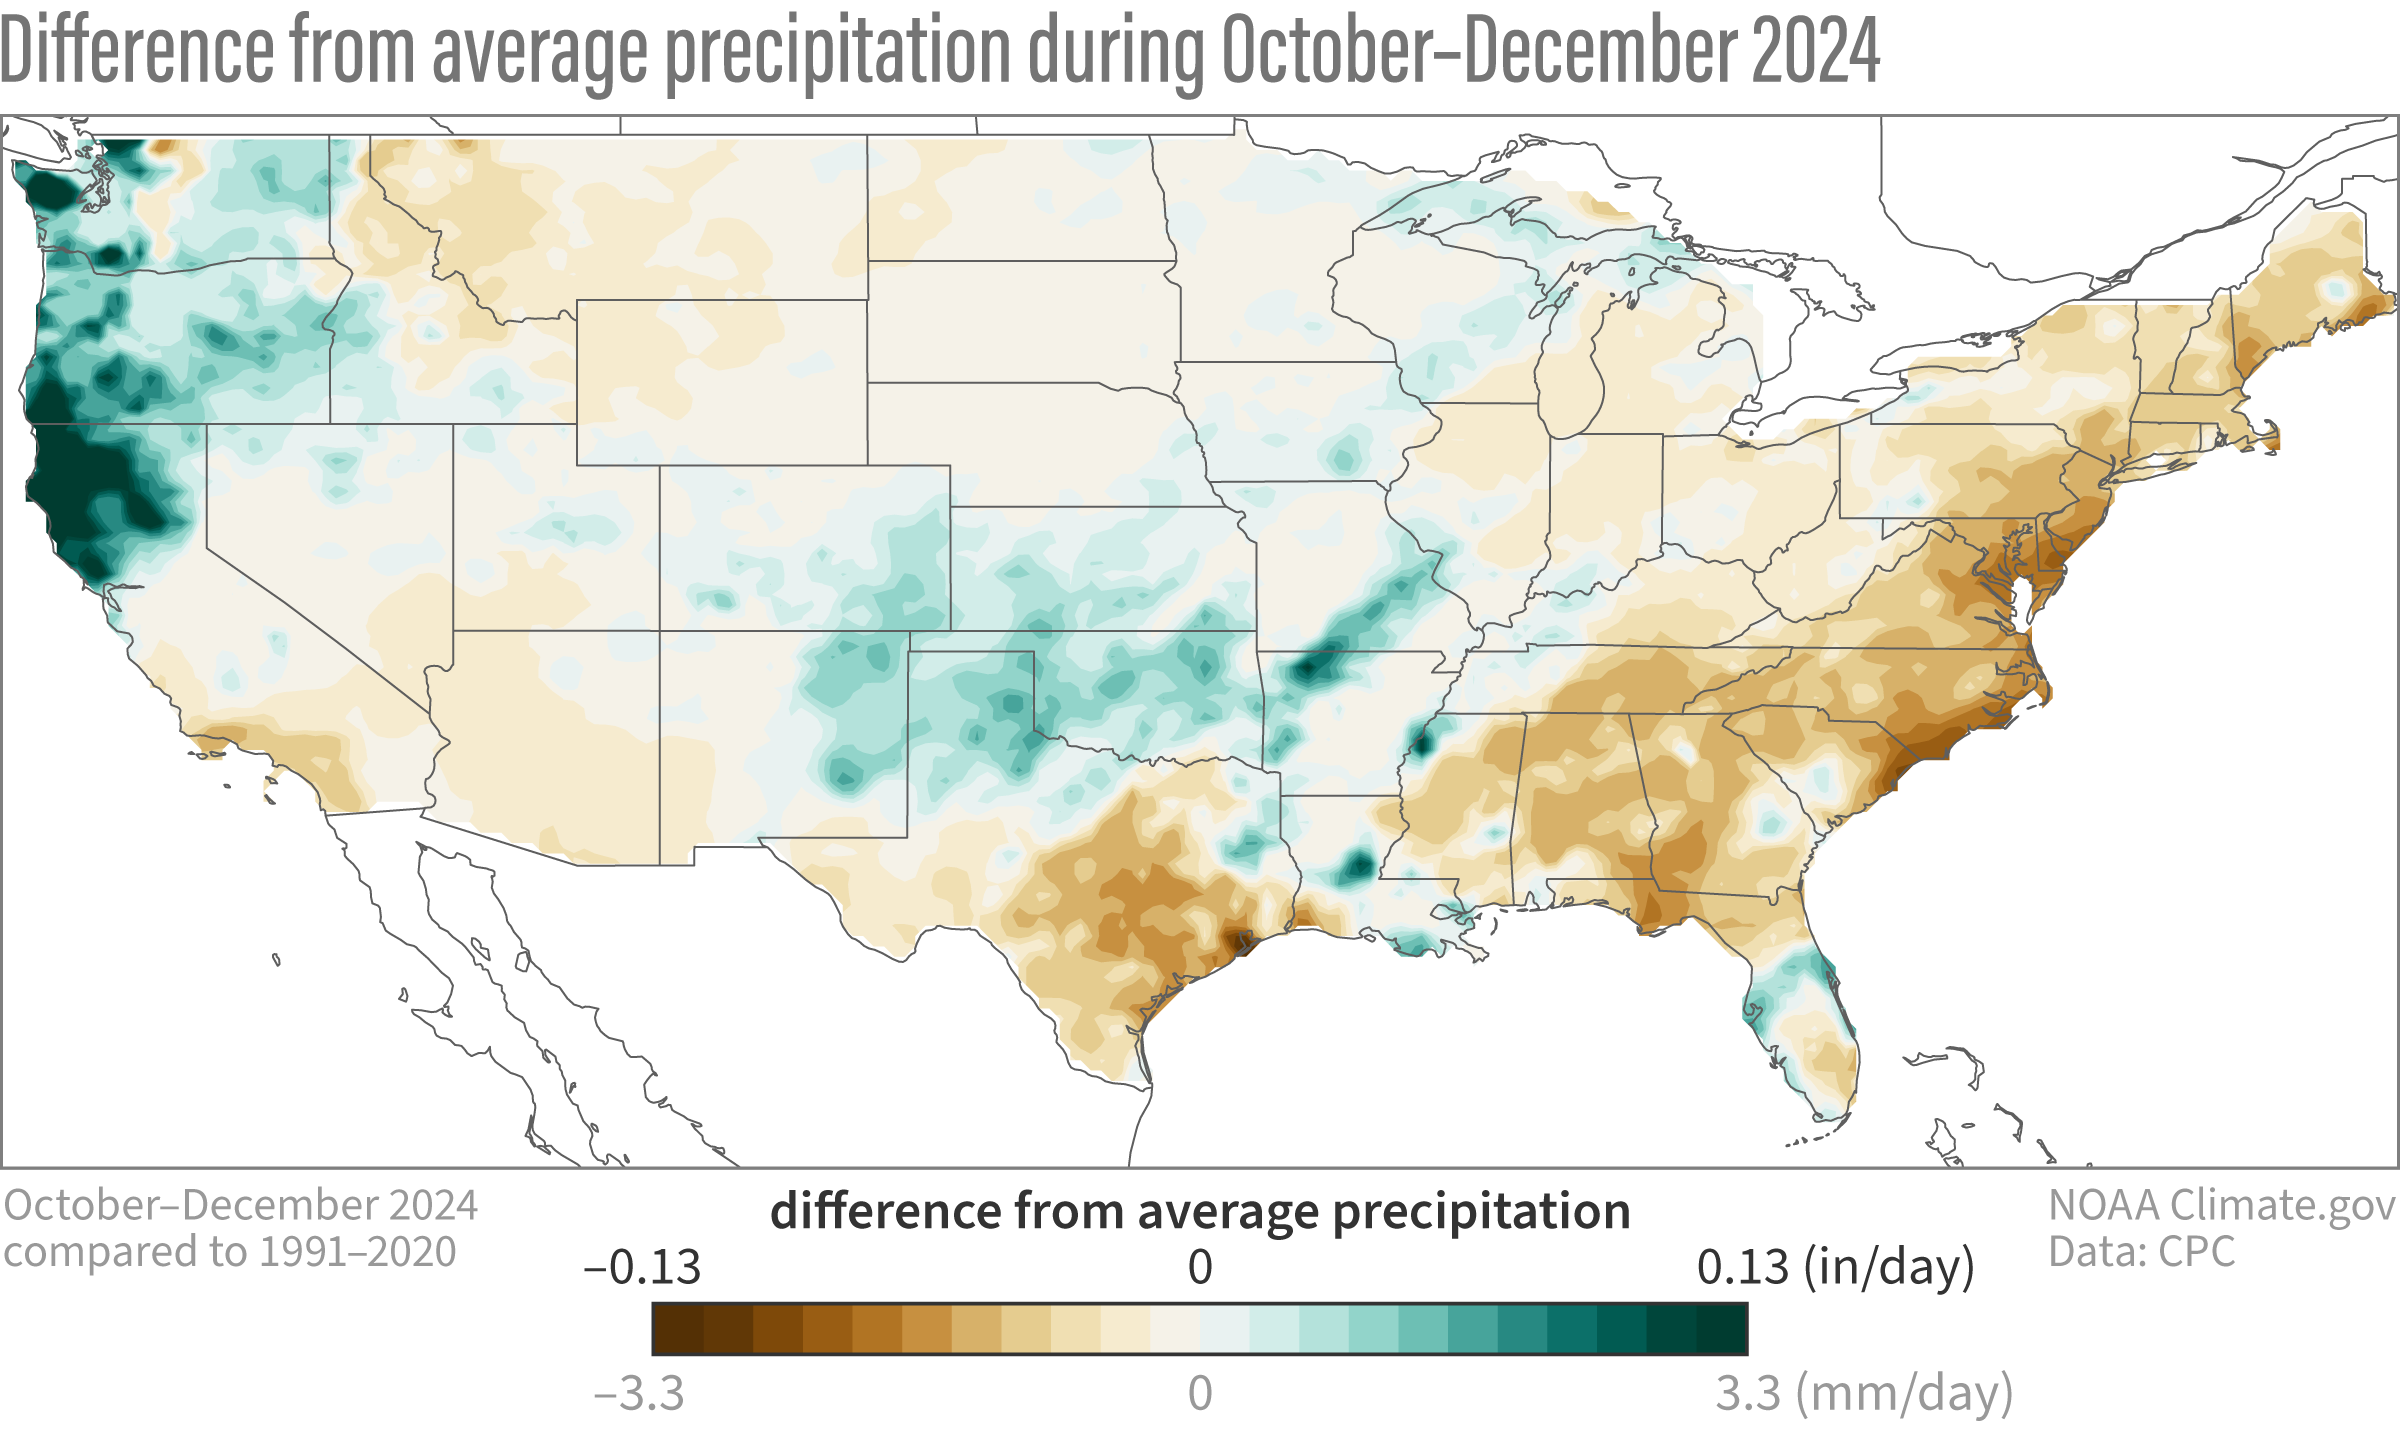


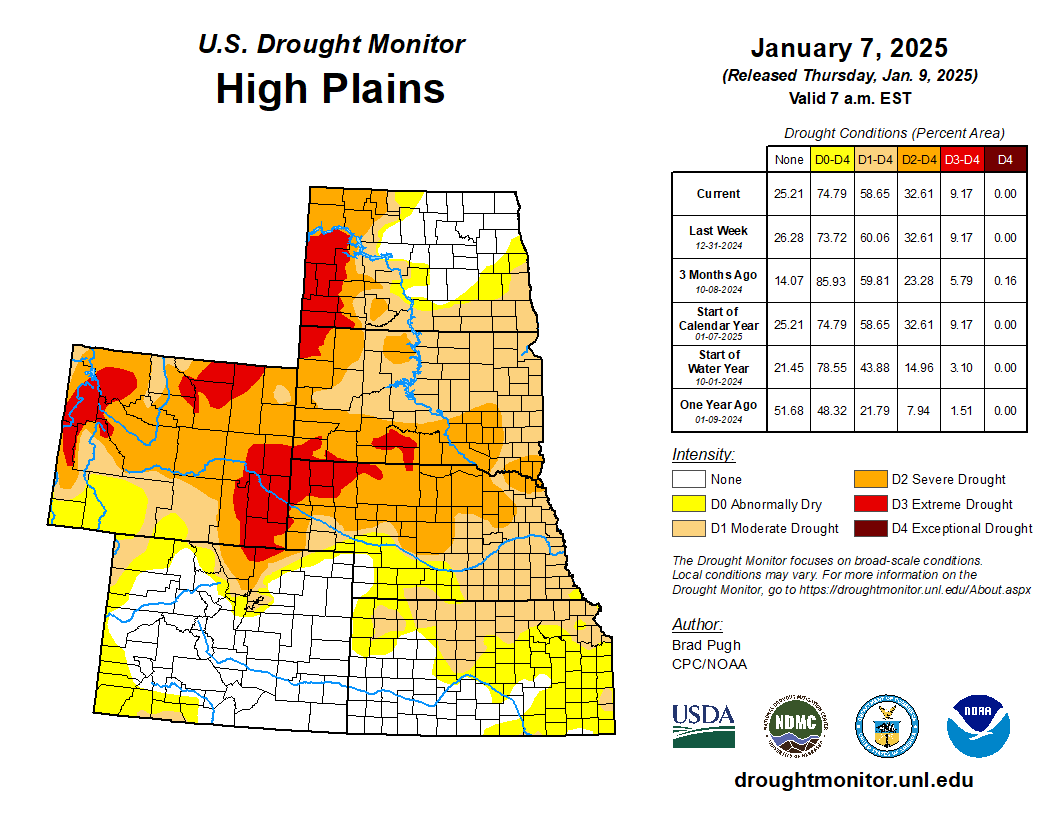
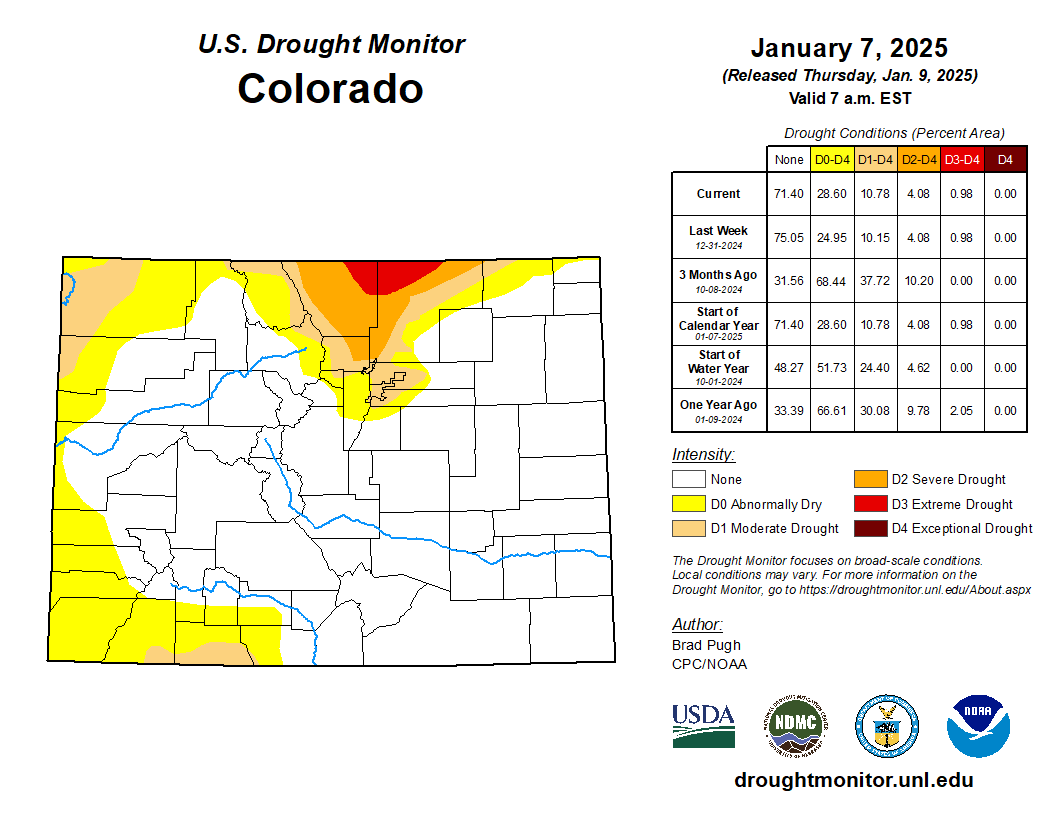


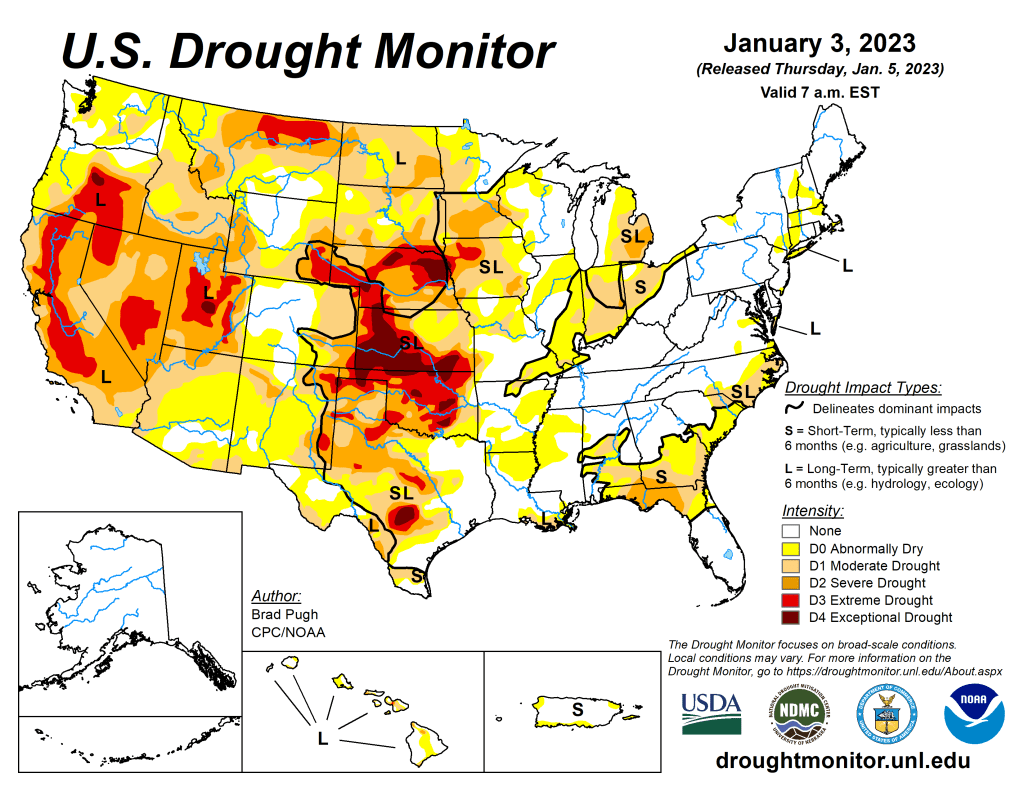


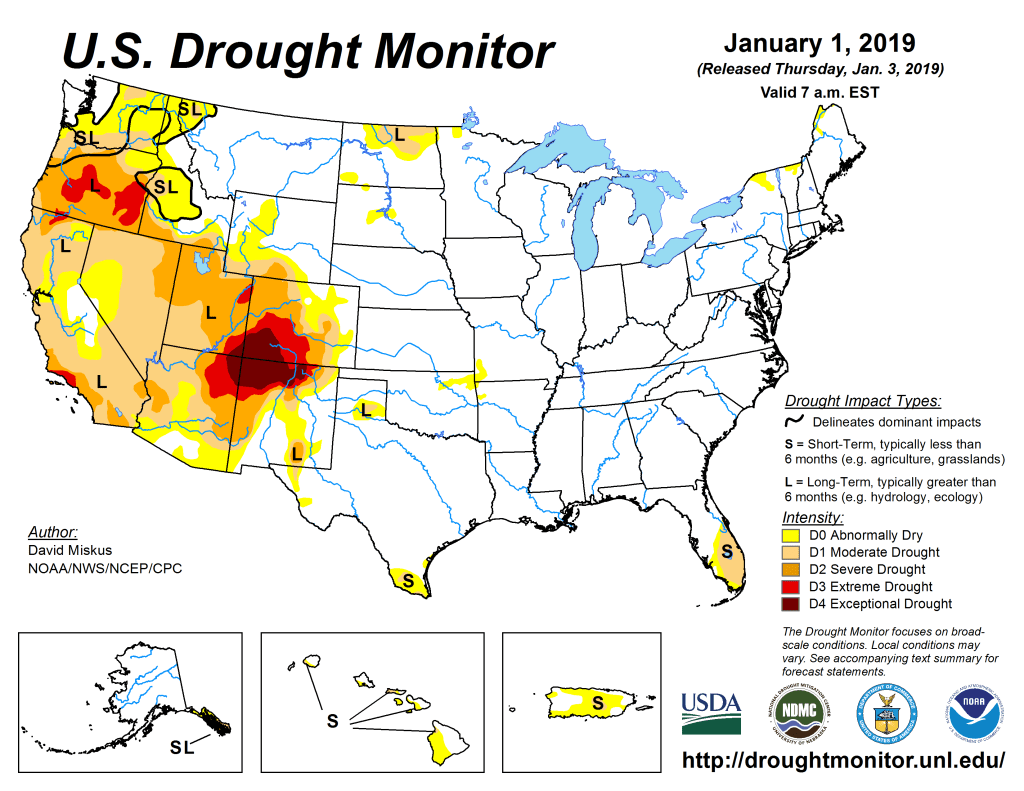
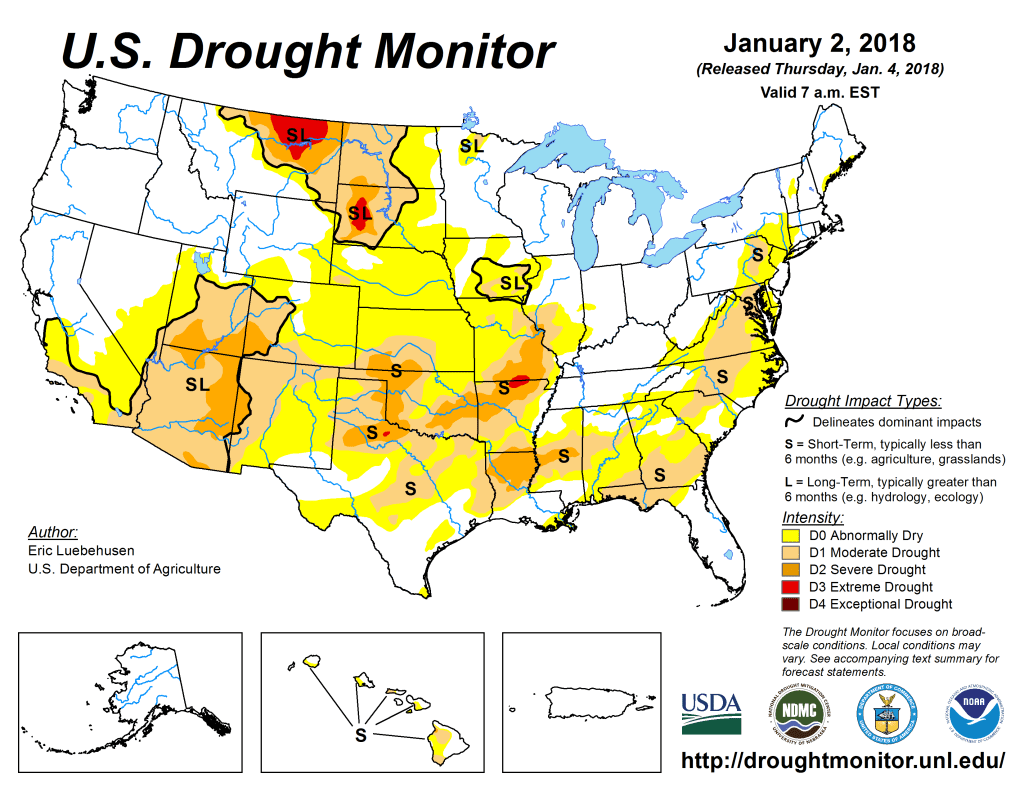
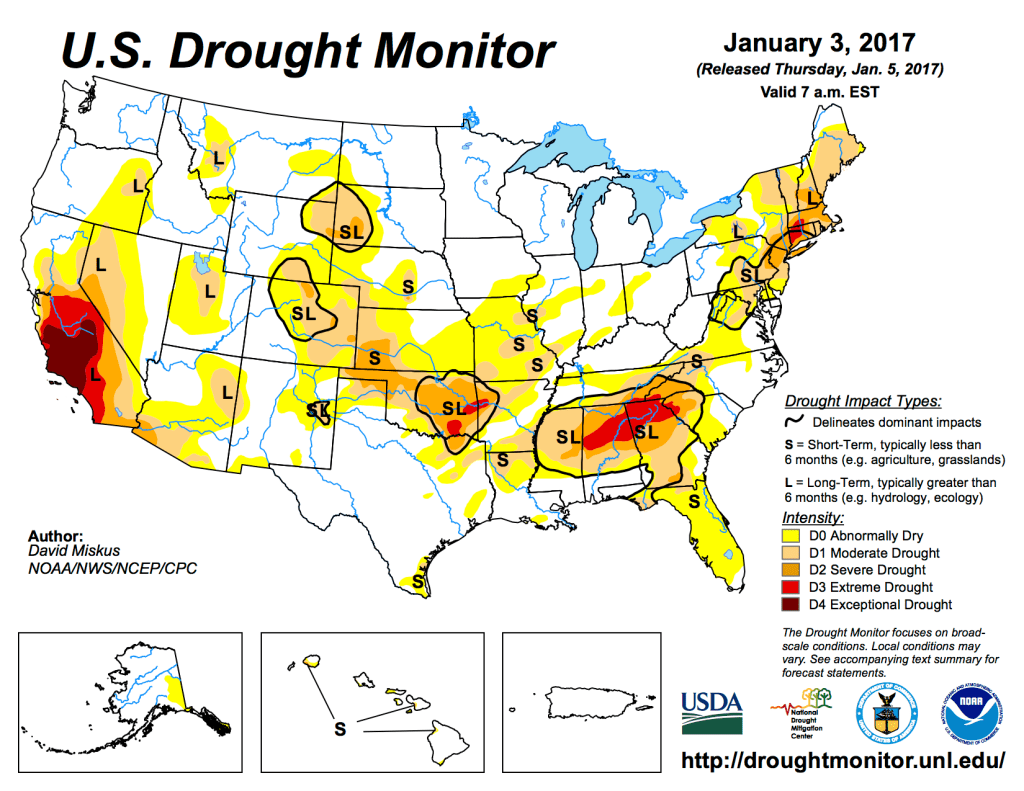

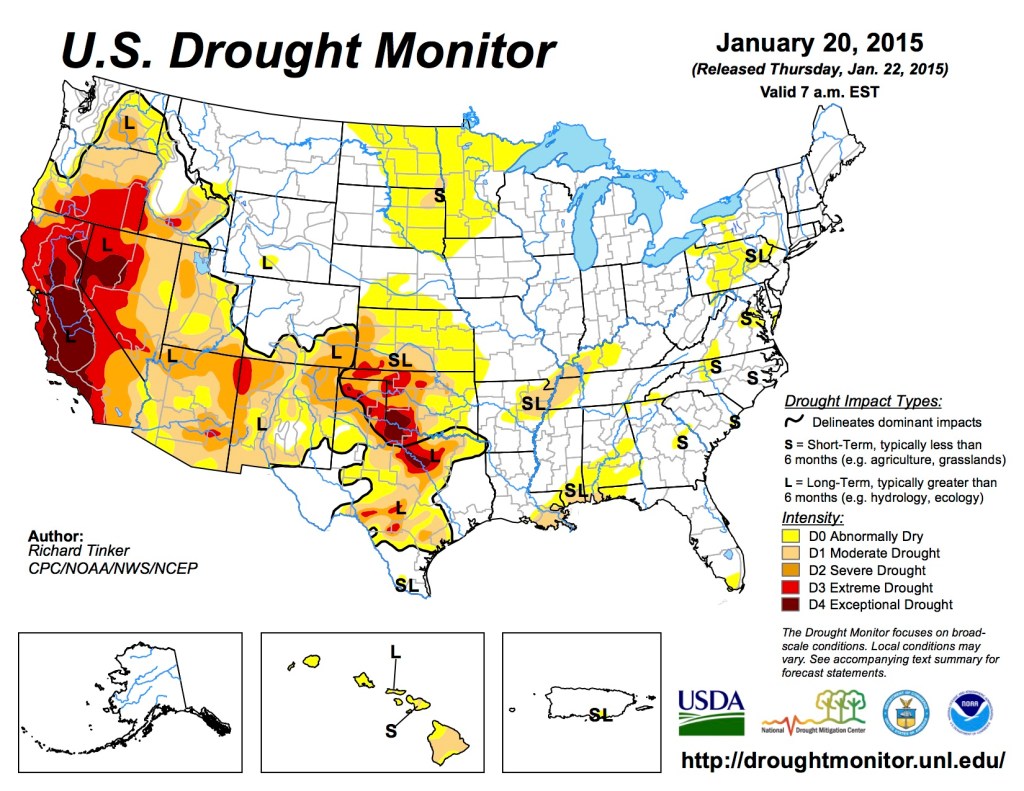

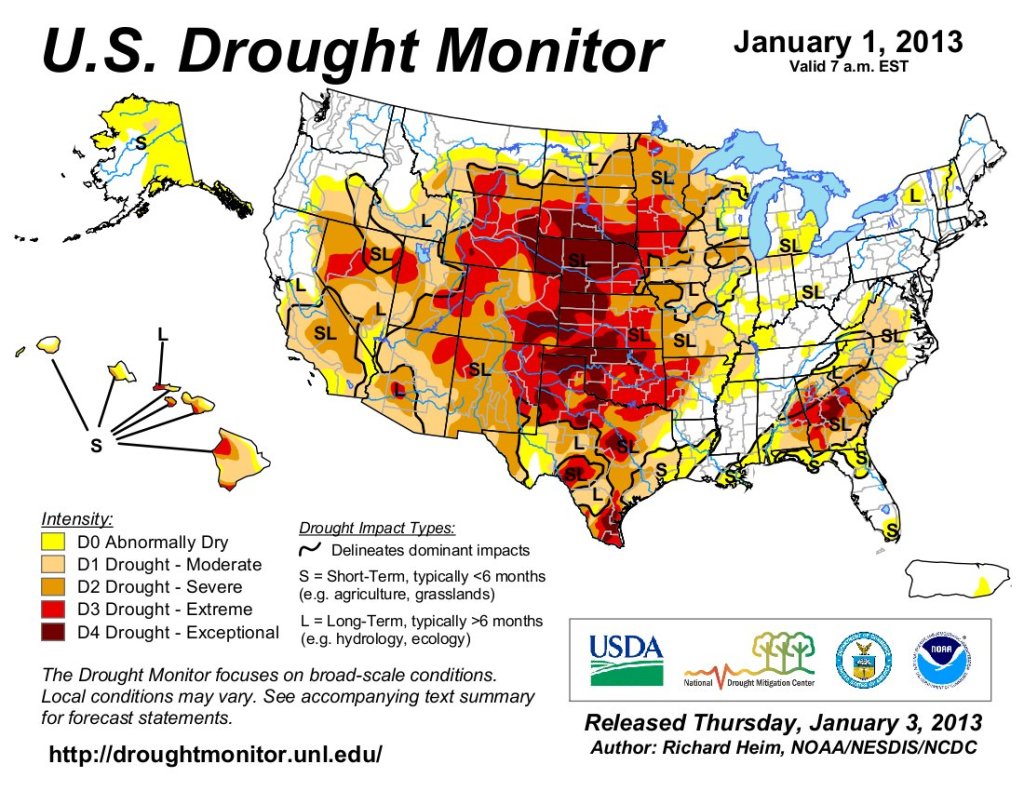
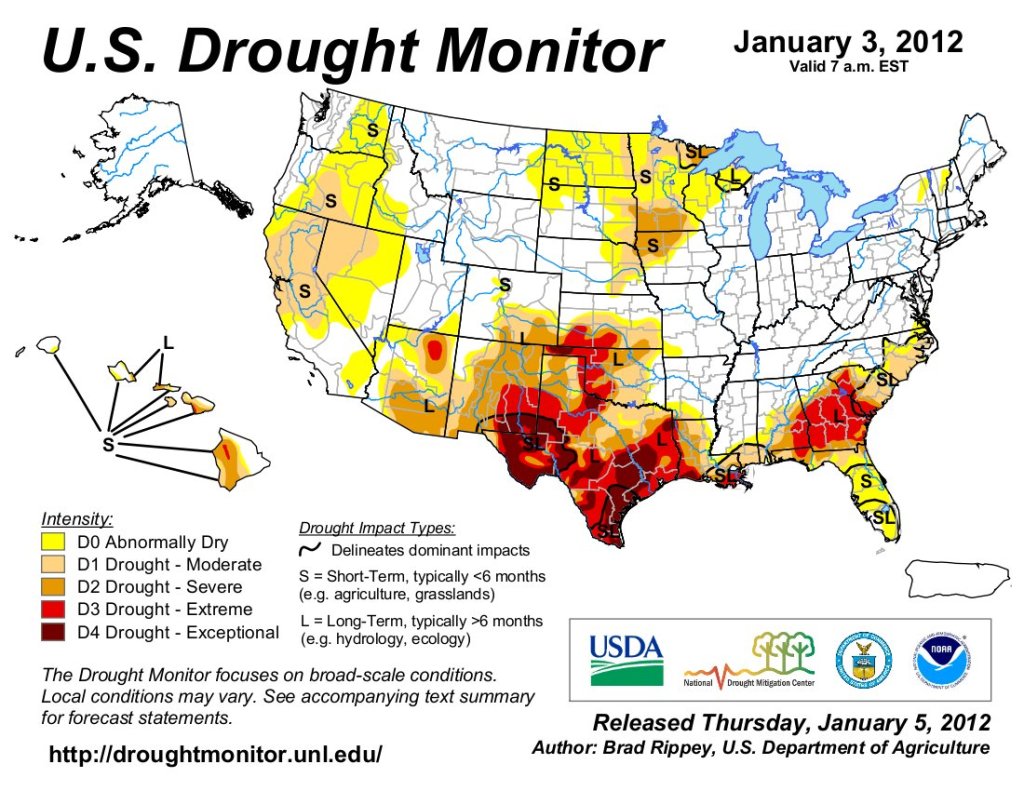
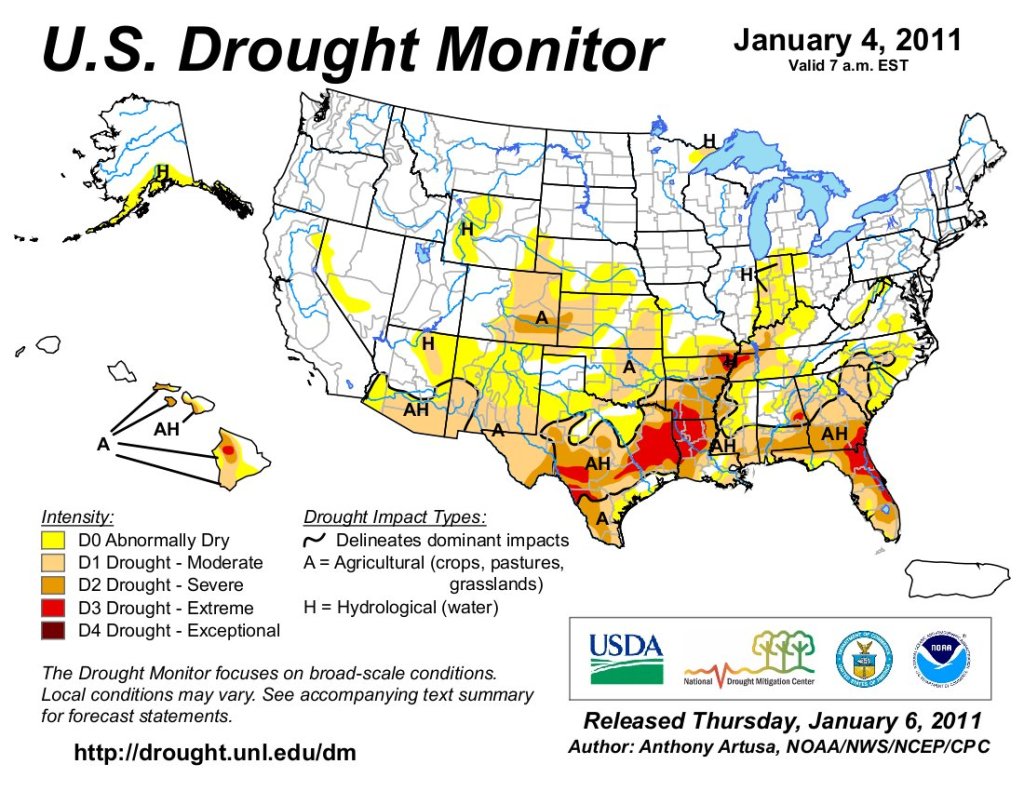

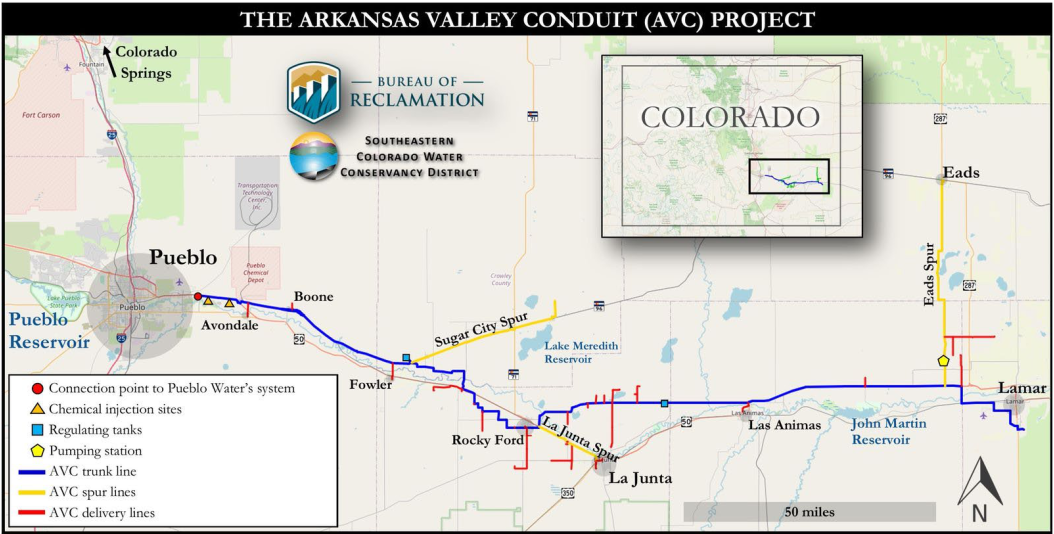


